
Morphology, Mineralogy, and Chemistry of Atmospheric Aerosols Nearby an Active Mining Area: Aljustrel Mine (SW Portugal)

 , , and
Abstract
:1. Introduction
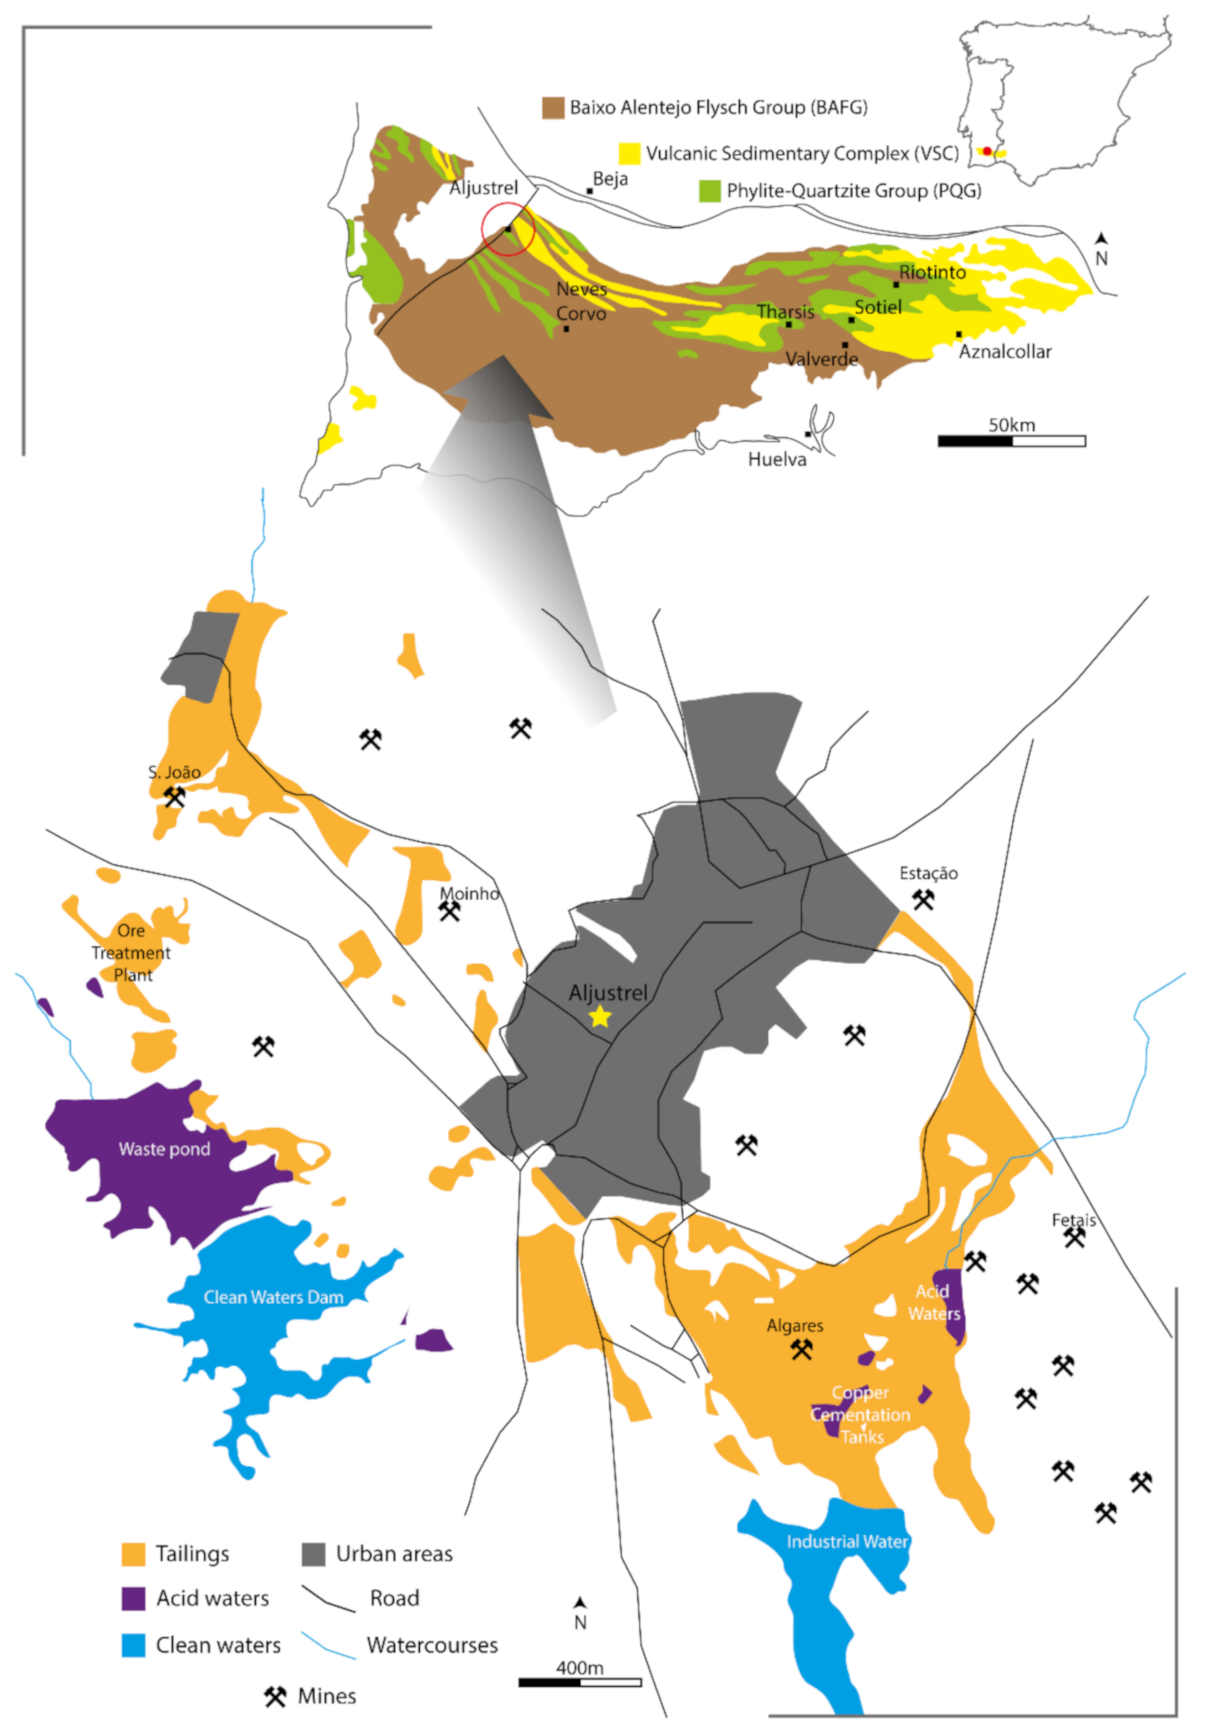
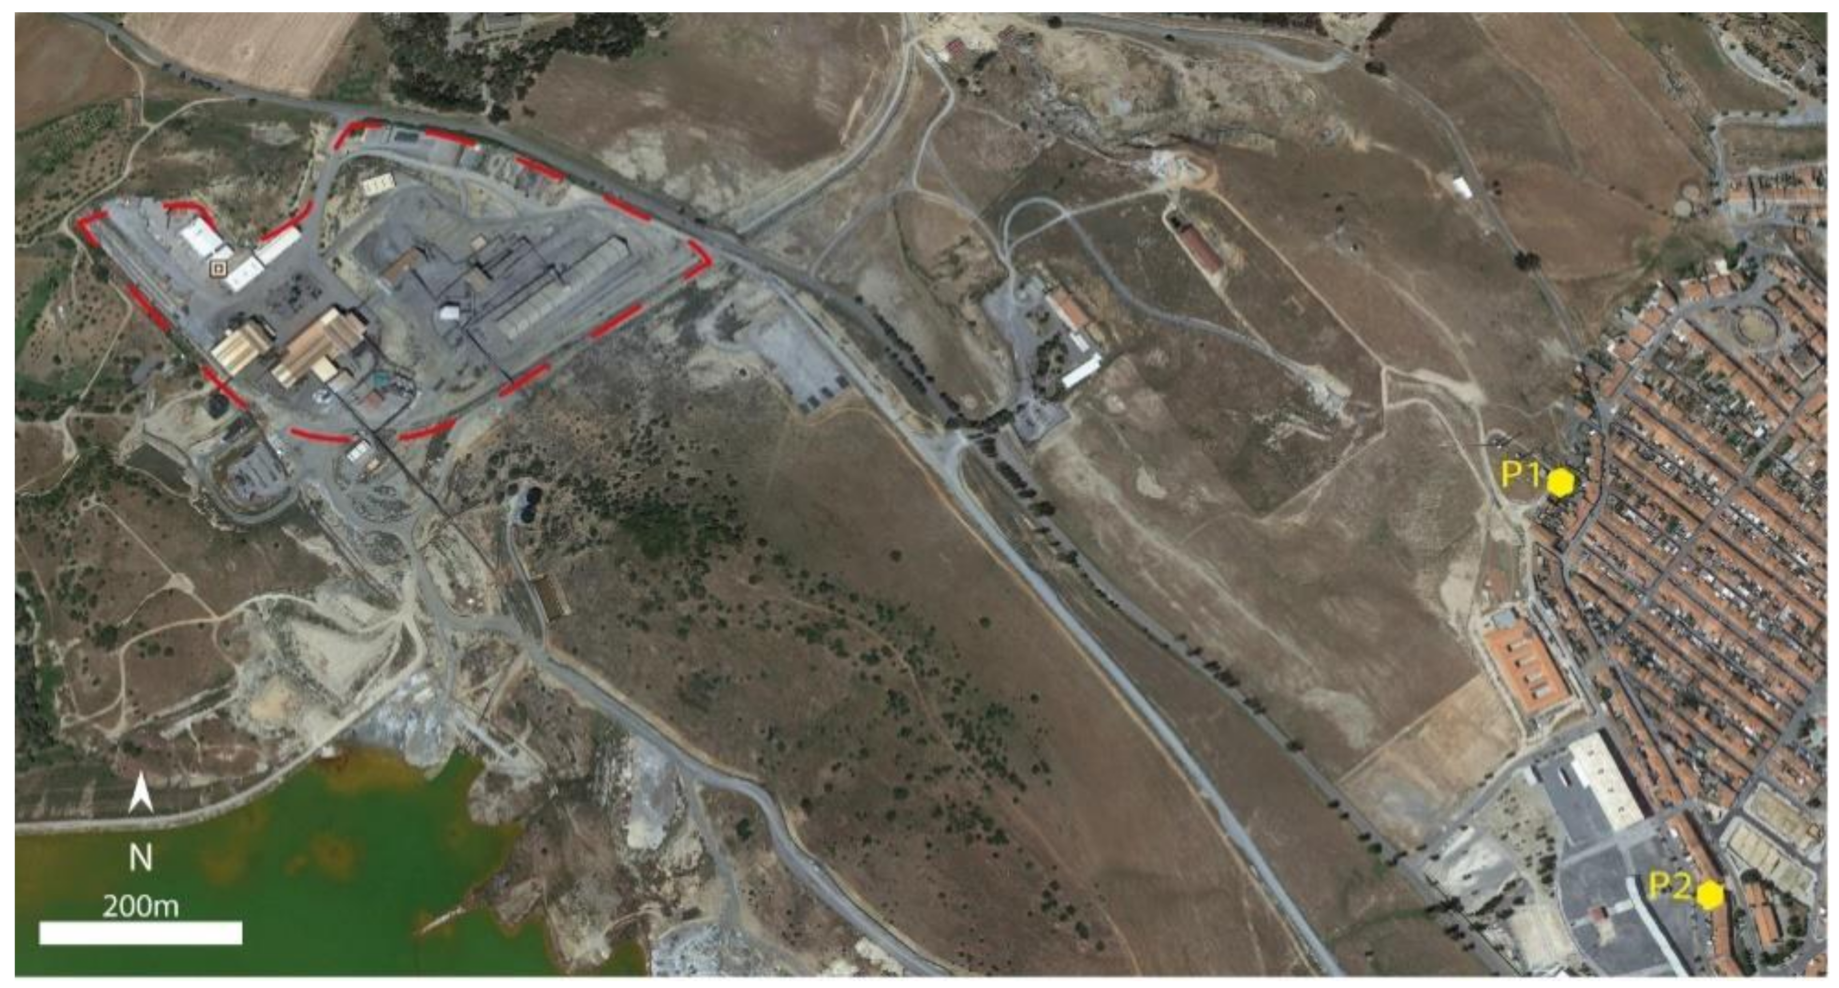
2. Study Area
3. Materials and Methods
3.1. Sampling Collection
3.2. Meteorological Data and Backward Trajectories Air Mass Analysis
3.3. SEM-EDX Analysis
3.4. ICP-MS Analysis
4. Results and Discussion
4.1. PM Mass Concentration
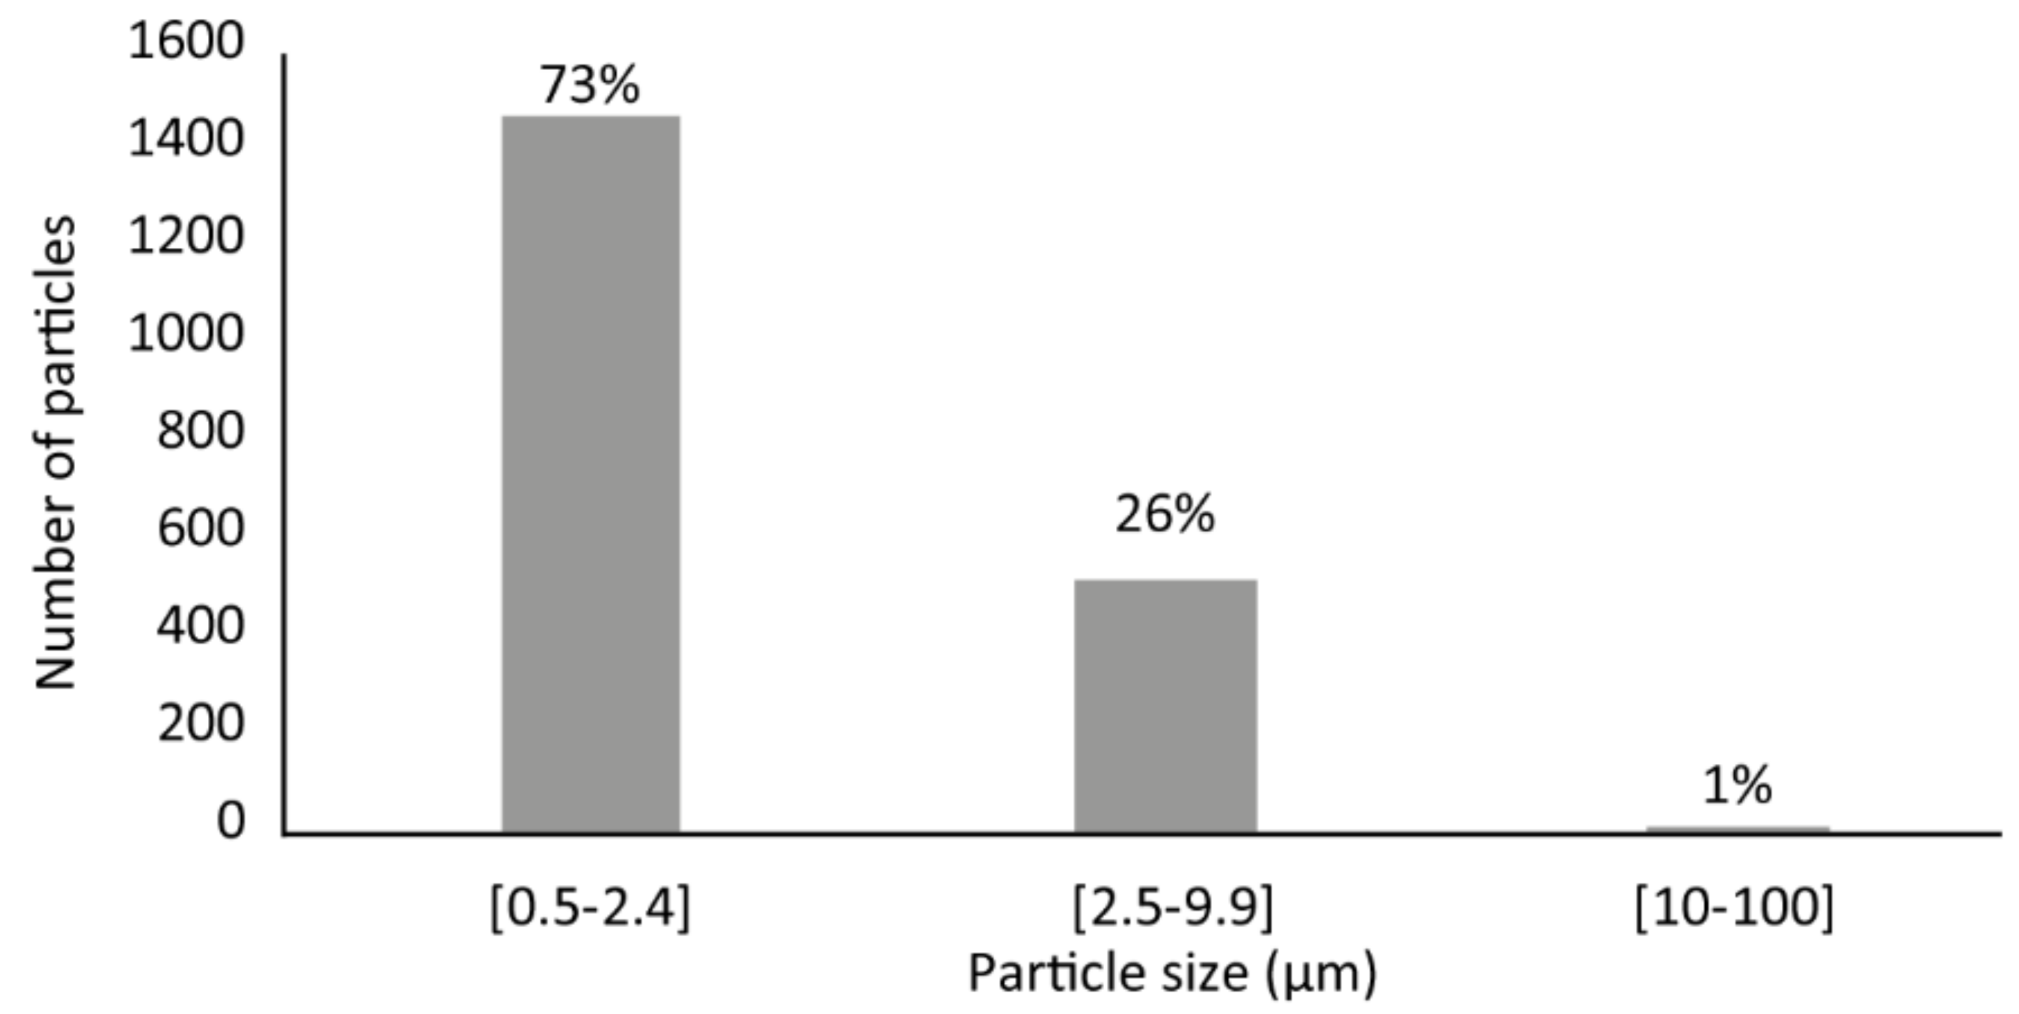
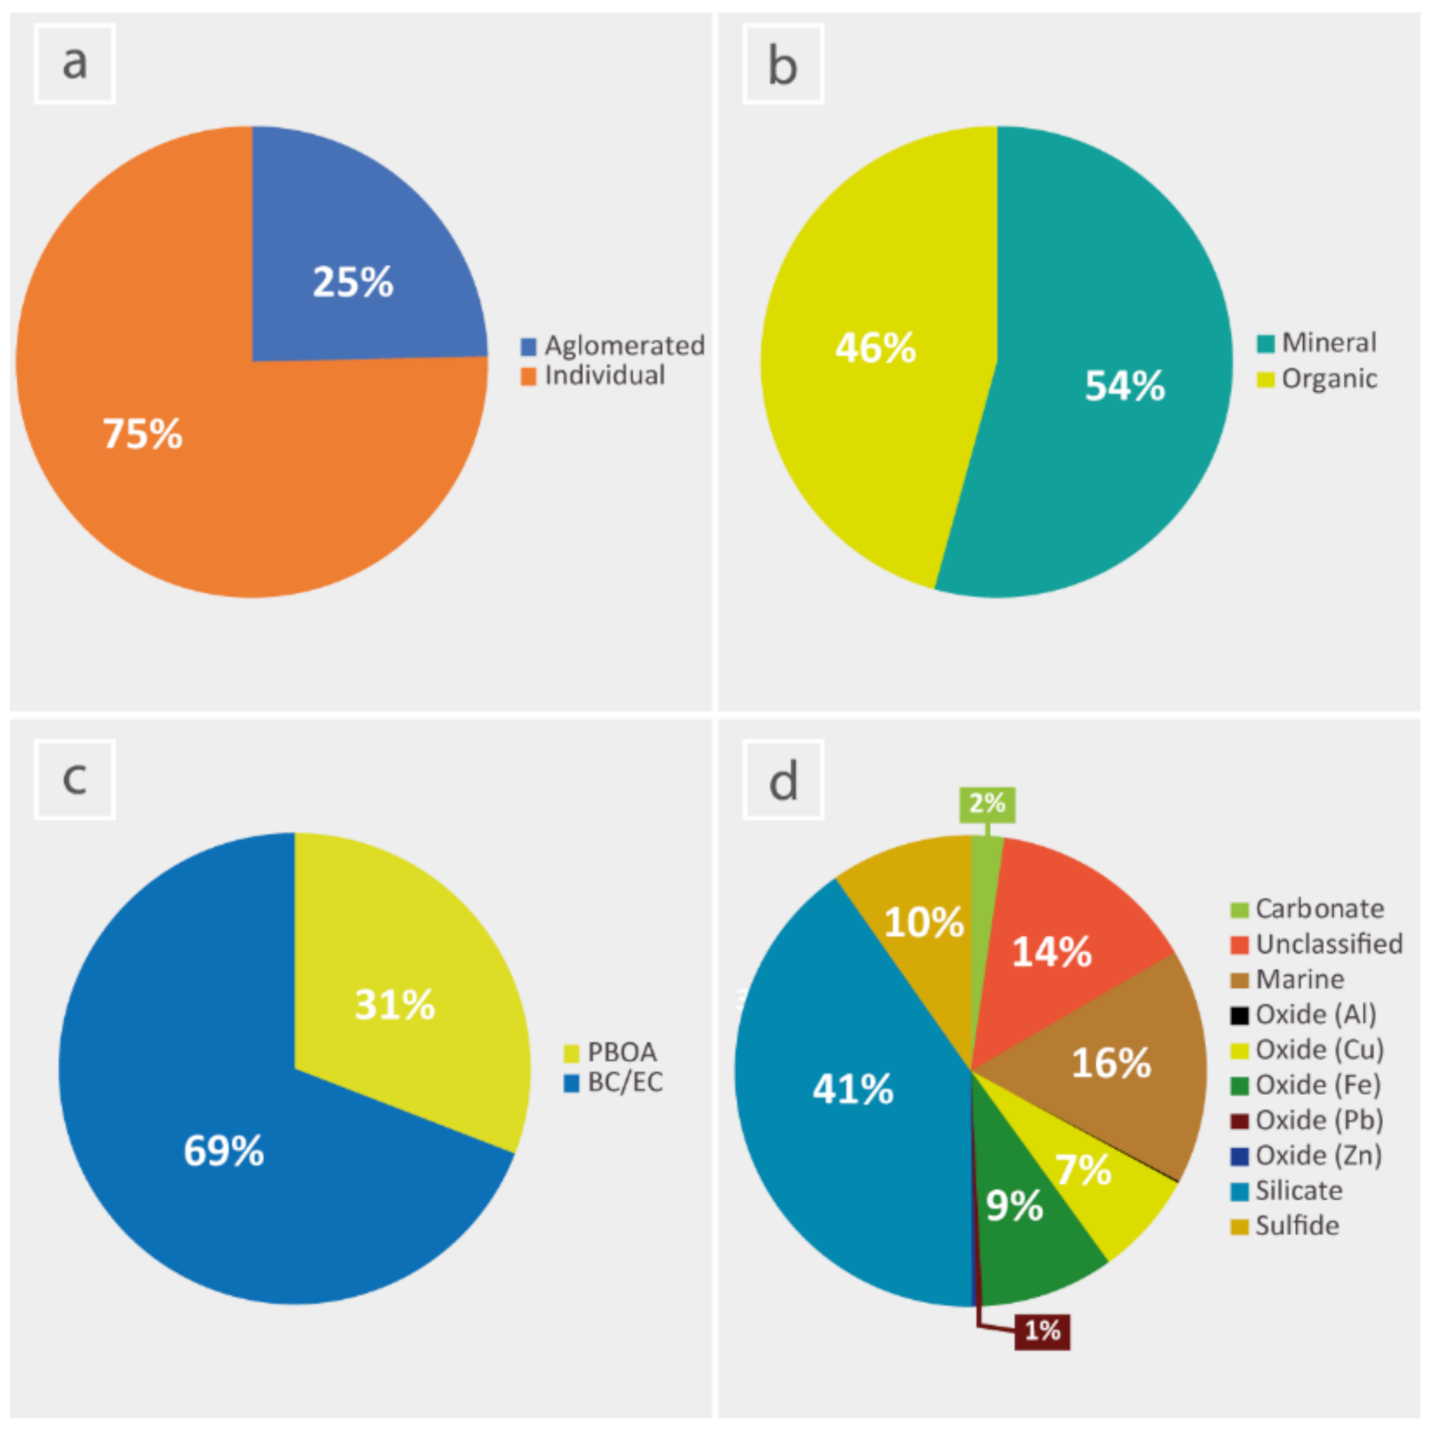
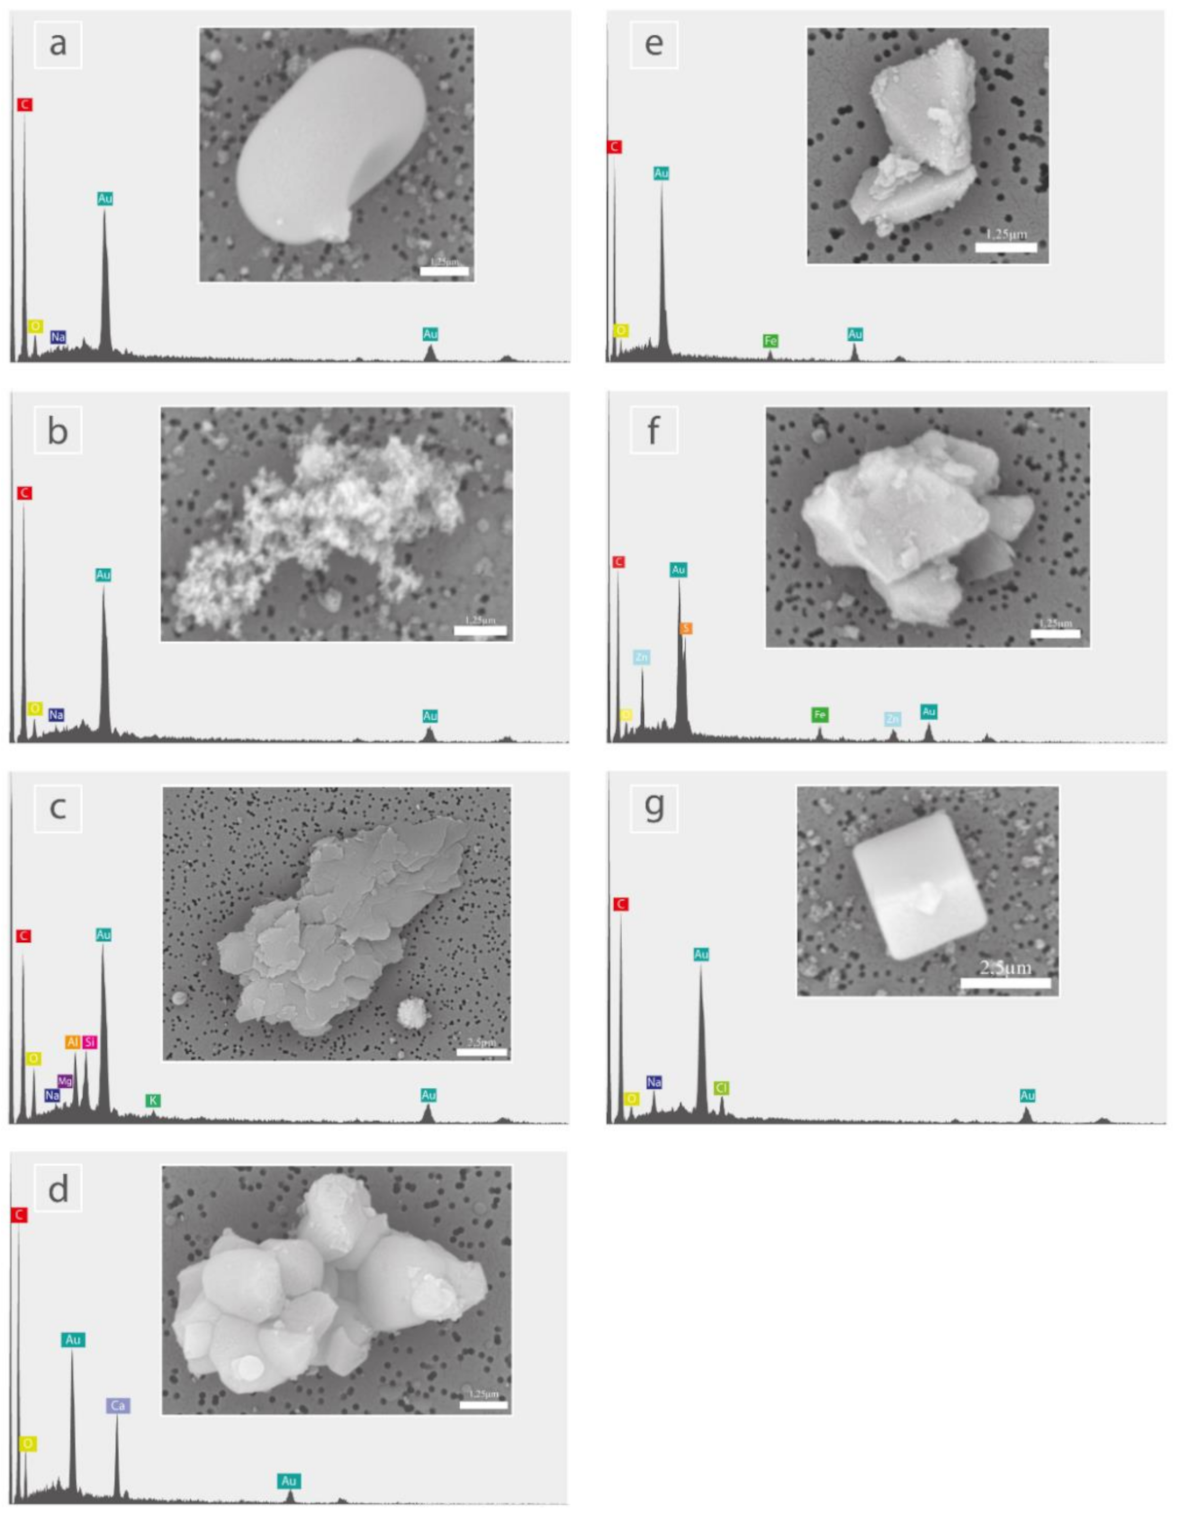
4.2. Individual Characterization of PM10
- Organic particles:
- Inorganic particles:
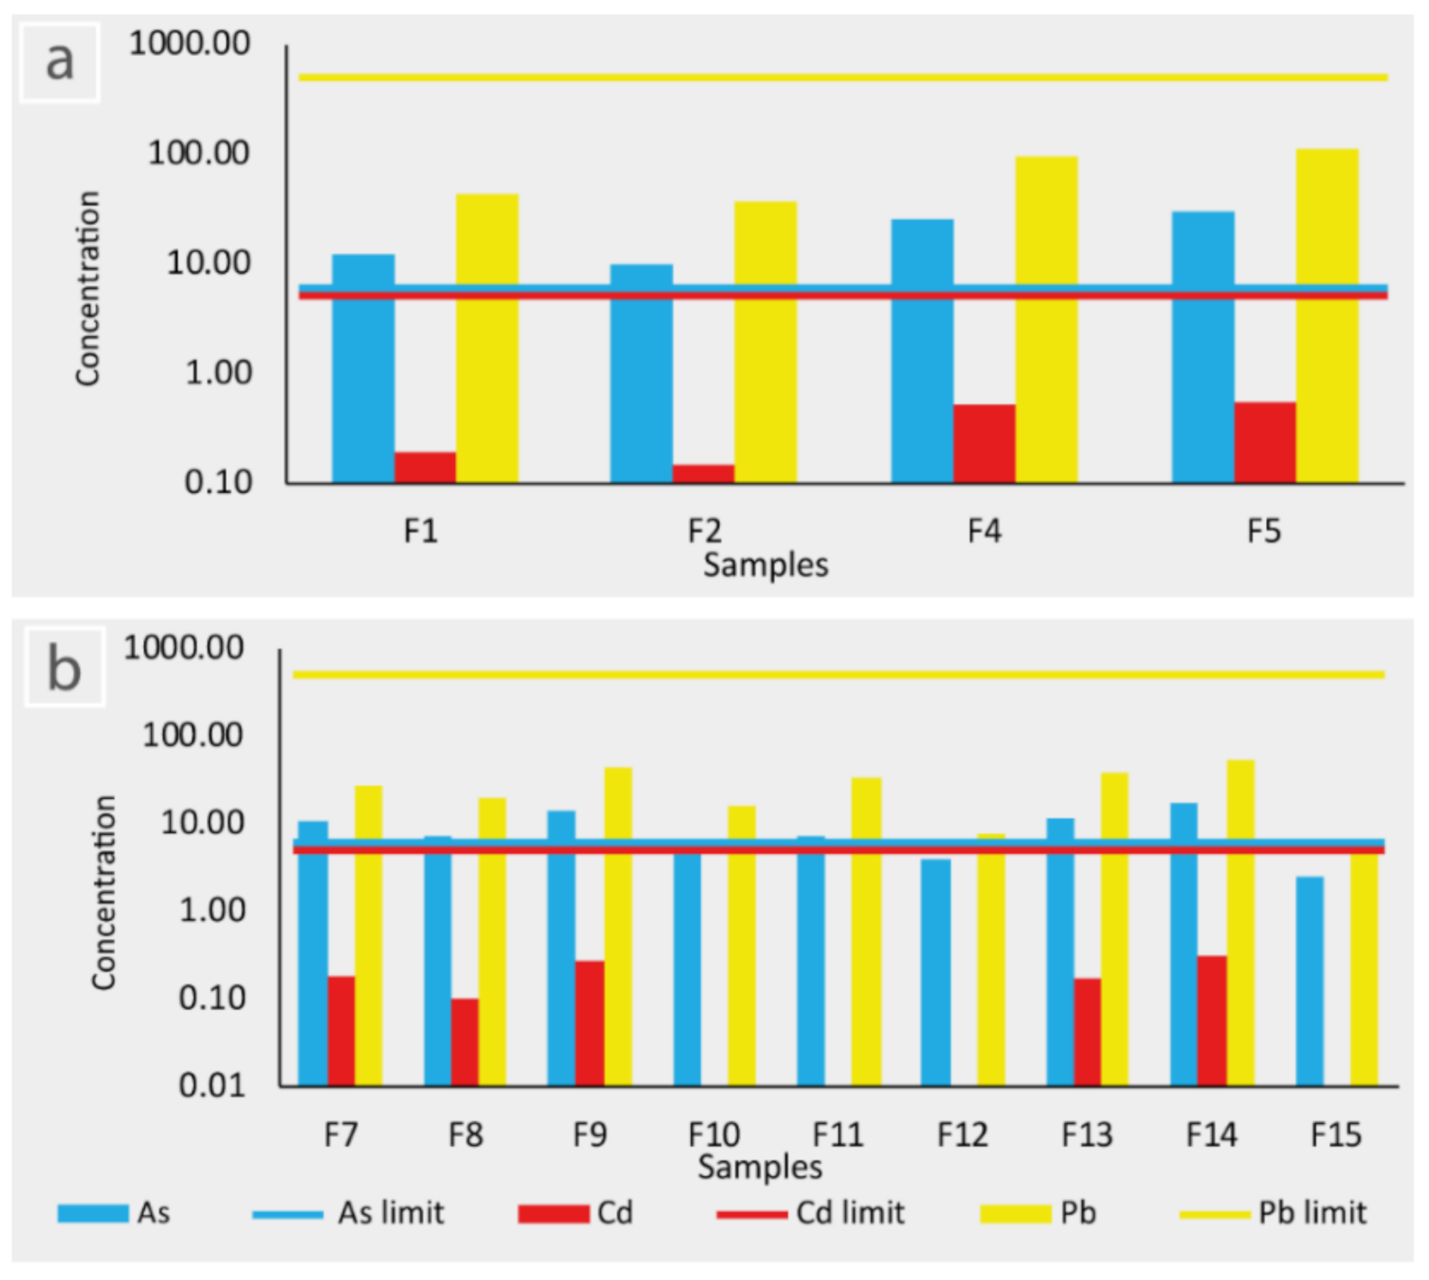
4.3. Concentration of PTE
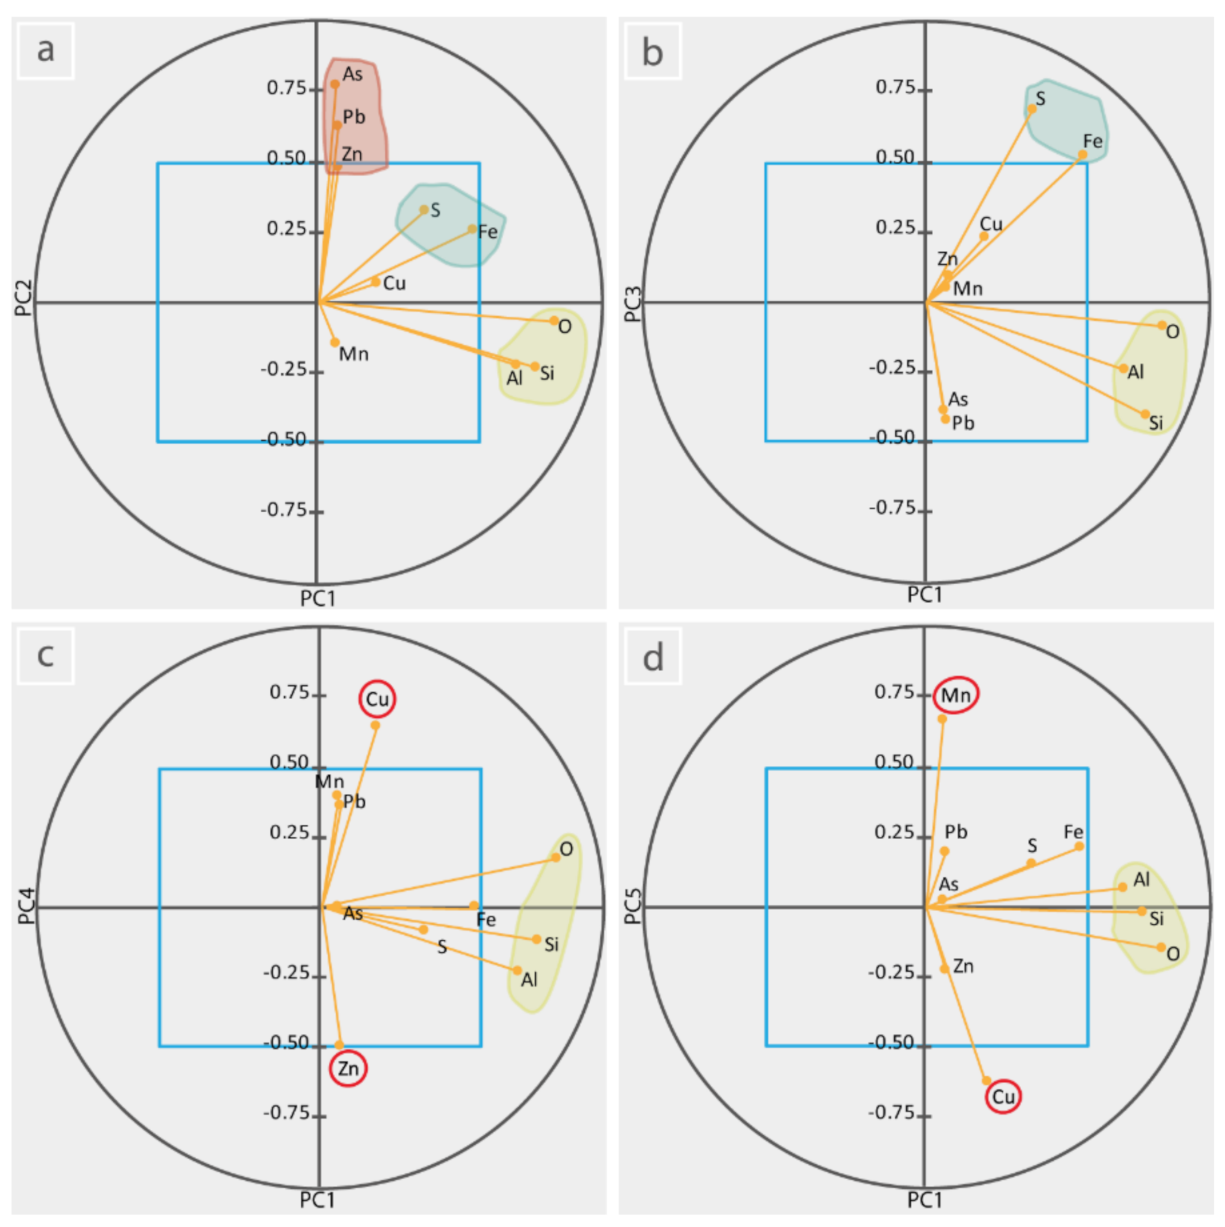
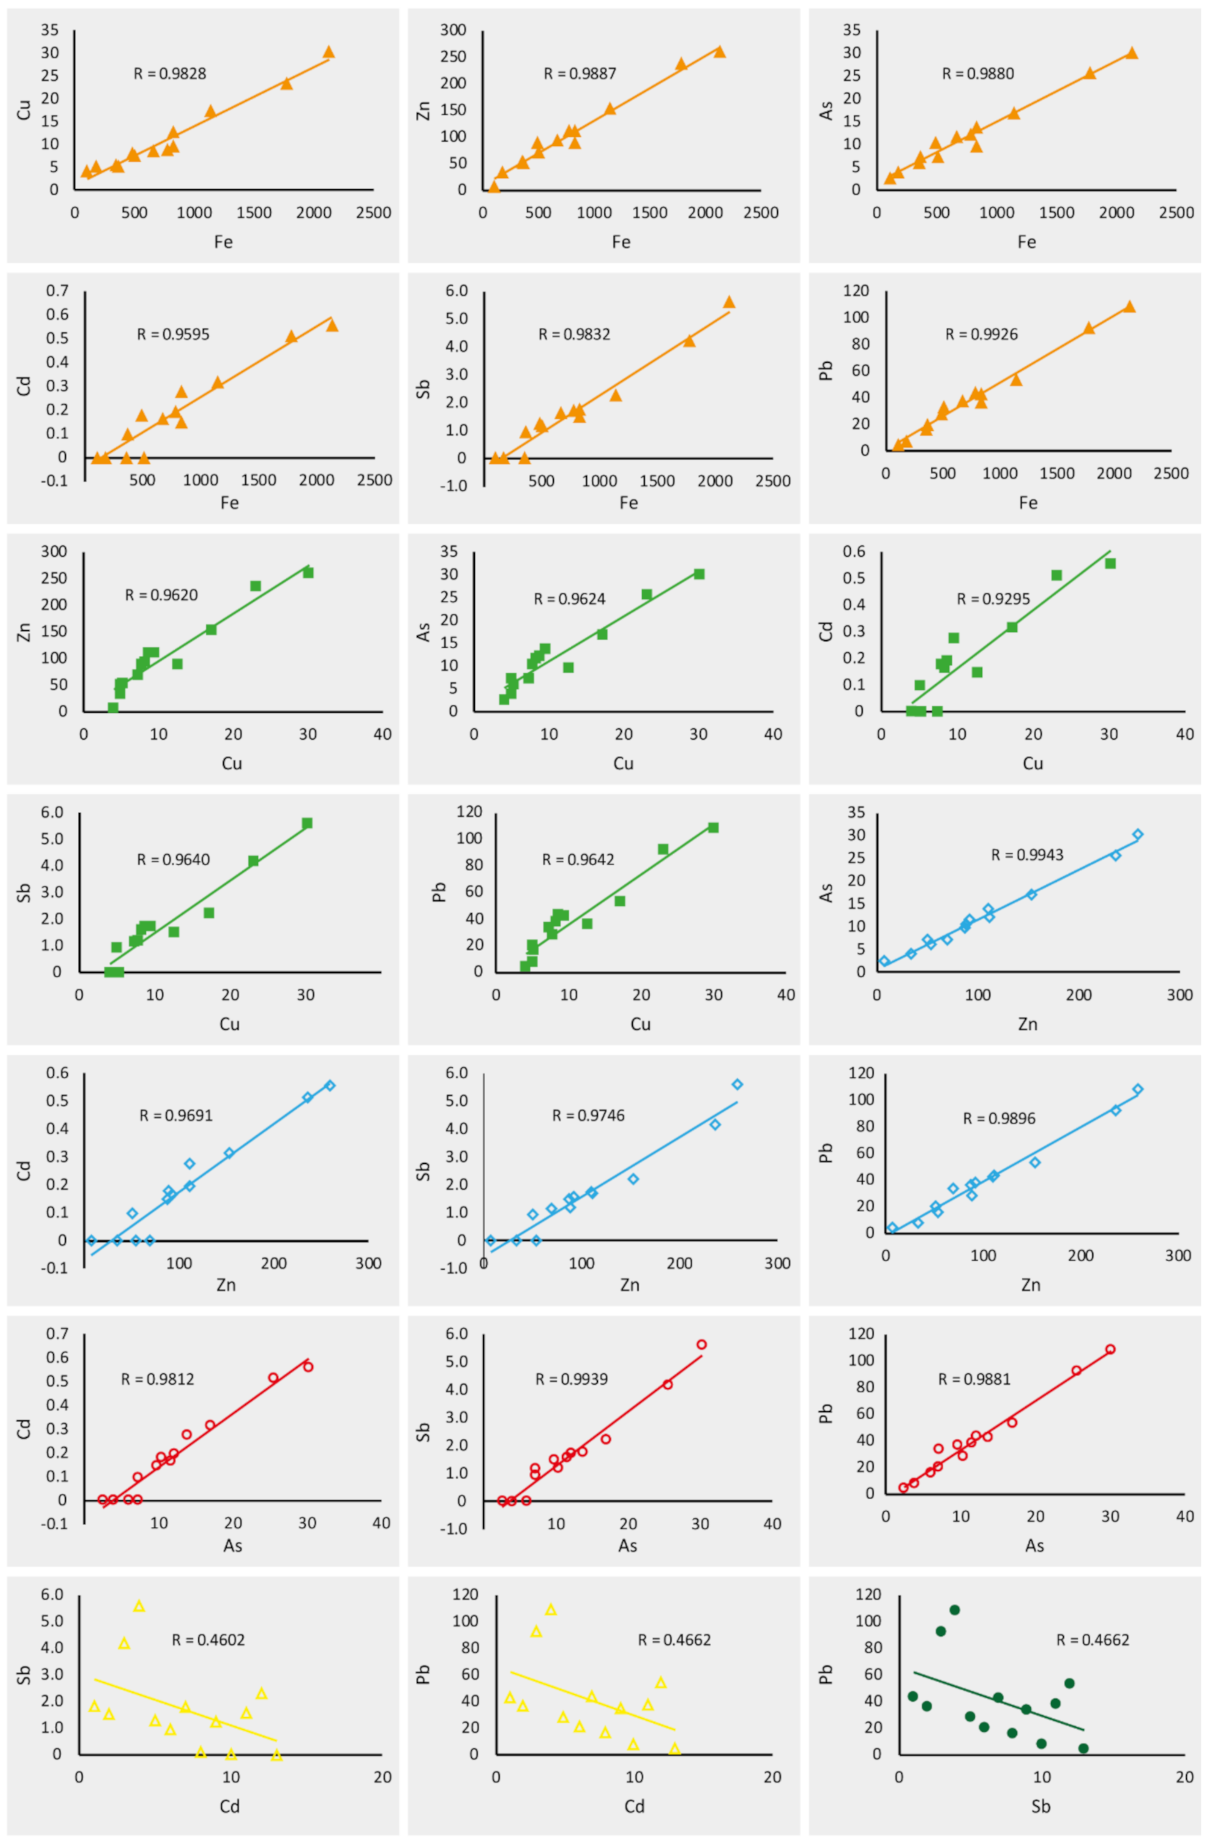
4.4. Source Apportionment
5. Conclusions
Supplementary Materials
Author Contributions
Funding
Institutional Review Board Statement
Informed Consent Statement
Data Availability Statement
Acknowledgments
Conflicts of Interest
References
- Csavina, J.; Field, J.; Taylor, M.P.; Gao, S.; Landázuri, A.; Betterton, E.A.; Sáez, A.E. A review on the importance of metals and metalloids in atmospheric dust and aerosol from mining operations. Sci. Total Environ. 2012, 433, 58–73. [Google Scholar] [CrossRef] [Green Version]
- Dudka, S.; Adriano, D.C. Environmental impacts of metal ore mining and processing: A review. J. Environ. Qual. 1997, 26, 590–602. [Google Scholar] [CrossRef]
- Petavratzi, E.; Kingman, S.; Lowndes, I. Particulates from mining operations: A review of sources, effects and regulations. Miner. Eng. 2005, 18, 1183–1199. [Google Scholar] [CrossRef]
- Pinto, M.M.S.C.; Silva, M.M.V.G.; Neiva, A.M.R. Pollution of water and stream sediments associated with the Vale De Abrutiga uranium mine, Central Portugal. Mine Water Environ. 2004, 23, 66–75. [Google Scholar] [CrossRef] [Green Version]
- Castillo, S.; de la Rosa, J.D.; Sánchez de la Campa, A.M.; González-Castanedo, Y.; Fernández-Caliani, J.C.; Gonzalez, I.; Romero, A. Contribution of mine wastes to atmospheric metal deposition in the surrounding area of an abandoned heavily polluted mining district (Rio Tinto mines, Spain). Sci. Total Environ. 2013, 449, 363–372. [Google Scholar] [CrossRef] [PubMed]
- Silva, M.M.V.G.; Lopes, S.P.; Gomes, E.C. Geochemistry and behavior of REE in stream sediments close to an old Sn-W mine, Ribeira, Northeast Portugal. Chem. Erde Geochem. 2014, 74, 545–555. [Google Scholar] [CrossRef]
- Carvalho, P.C.; Neiva, A.M.; Silva, M.M.; Santos, A.C. Human health risks in an old gold mining area with circum-neutral drainage, central Portugal. Environ. Geochem. Health 2017, 39, 43–62. [Google Scholar] [CrossRef]
- Sanchez-Bisquert, D.; Peñas-Castejón, J.M.; Garcia-Fernandez, G. The impact of atmospheric dust deposition and trace elements levels on the villages surrounding the former mining areas in a semi-arid environment (SE Spain). Atmos. Environ. 2017, 152, 256–269. [Google Scholar] [CrossRef]
- Iordanidis, A.; Buckman, J.; Triantafyllou, A.G.; Asvesta, A. ESEM-EDX characterisation of airborne particles from an industrialised area of northern Greece. Environ. Geochem. Health 2008, 30, 391–405. [Google Scholar] [CrossRef] [PubMed]
- Matos, J.; Martins, L.P. Reabilitação ambiental de áreas mineiras do sector português da Faixa Piritosa Ibérica: Estado da arte e perspectivas futuras. Boletín Geol. Min. 2006, 117, 289–304. [Google Scholar]
- Luís, A.T.; Teixeira, P.; Almeida, S.F.P.; Ector, L.; Matos, J.X.; Ferreira da Silva, E.A. Impact of Acid Mine Drainage (AMD) on Water Quality, Stream Sediments and Periphytic Diatom Communities in the Surrounding Streams of Aljustrel Mining Area (Portugal). Water Air Soil Pollut. 2009, 200, 147–167. [Google Scholar] [CrossRef]
- Candeias, C.; Ferreira da Silva, E.; Salgueiro, A.R.; Pereira, H.G.; Reis, A.P.; Patinha, C.; Matos, J.X.; Ávila, P.H. Assessment of the soil contamination by potentially toxic elements in Aljustrel mining area in order to implement soil reclamation strategies. Land Degrad. Dev. 2011, 22, 565–585. [Google Scholar] [CrossRef] [Green Version]
- Candeias, C.; Ferreira da Silva, E.; Salgueiro, A.R.; Pereira, H.G.; Reis, A.P.; Patinha, C.; Matos, J.X.; Ávila, P.H. The use of multivariate statistical analysis of geochemical data for assessing the spatial distribution of soil contamination by potentially toxic elements in the Aljustrel mining area (Iberian Pyrite Belt, Portugal). Environ. Earth Sci. 2011, 62, 1461–1479. [Google Scholar] [CrossRef]
- Luís, A.T.; Grande, J.A.; Durães, N.; Dávila, J.M.; Santisteban, M.; Almeida, S.F.P.; Sarmiento, A.M.; Torre, M.L.; Fortes, J.C.; Silva, E.-F. Biogeochemical characterization of surface waters in the Aljustrel mining area (South Portugal). Environ. Geochem. Health 2019, 41, 1909–1921. [Google Scholar] [CrossRef]
- Barriga, F.; Fyfe, W. Multi-phase water-rhyolite interaction and ore fluid generation at Aljustrel, Portugal. Mineral. Deposita 1997, 33, 188–207. [Google Scholar] [CrossRef]
- Inverno, C.; Diez-Montes, A.; Rosa, C.; García-Crespo, J.; Matos, J.; García-Lobón, J.L.; Carvalho, J.; Bellido, F.; Castello-Branco, J.M.; Ayala, C.; et al. Introduction and geological setting of the Iberian Pyrite Belt. In 3D, 4D and Predictive Modelling of Major Mineral Belts in Europe. Mineral Resource Reviews; Weihed, P., Ed.; Springer: Cham, Switzerland; Berlin, Germany, 2015; pp. 191–208. [Google Scholar] [CrossRef]
- Bharti, S.K.; Kumar, D.; Anand, S.; Poonam; Barman, S.C.; Kumar, N. Characterization and morphological analysis of individual aerosol of PM10 in urban area of Lucknow, India. Micron 2017, 103, 90–98. [Google Scholar] [CrossRef]
- NASA-EOSDIS Worldview. Available online: https://worldview.earthdata.nasa.gov/ (accessed on 28 January 2021).
- Stein, A.F.; Draxler, R.R.; Rolph, G.D.; Stunder, B.J.B.; Cohen, M.D.; Ngan, F. NOAA’s HYSPLIT atmospheric transport and dispersion modeling system. Bull. Am. Meteor. Soc. 2015, 96, 2059–2077. [Google Scholar] [CrossRef]
- Rolph, G.; Stein, A.; Stunder, B. Real-time Environmental Applications and Display sYstem: READY. Environ. Model. Softw. 2017, 95, 210–228. [Google Scholar] [CrossRef]
- Willis, R.; Blanchard, F.; Conner, T. Guidelines for the Application of SEM/EDX Analytical Techniques to Particulate Matter Samples; Environmental Protection Agency: Washington, DC, USA, 2002; (/EPA/600/R-02/070). [Google Scholar]
- Directive 2008/50/EC of the European Parliament and of the Council of 21 May 2008 on Ambient Air Quality and Cleaner Air for Europe. JO L 152 de 11.6.2008. pp. 1–44. Available online: http://data.europa.eu/eli/dir/2008/50/oj (accessed on 28 January 2021).
- Portal Regante. Available online: https://regante.edia.pt/suporteaatividade/meteorologia/SitePages/Home.aspx (accessed on 16 July 2018).
- IPMA. Available online: https://www.ipma.pt/pt/otempo/obs.superficie/# (accessed on 10 November 2018).
- Coz, E.; Artinano, B.; Clark, L.M.; Hernandez, M.; Robinson, A.L.; Casuccio, G.S.; Lersch, T.L.; Pandis, S. Characterization of fine primary biogenic organic aerosol in an urban area in the northeastern United States. Atmos. Environ. 2010, 44, 3952–3962. [Google Scholar] [CrossRef]
- Pachauri, T.; Singla, V.; Satsangi, A.; Lakhani, A.; Kumari, K.M. SEM-EDX Characterization of Individual Coarse Particles in Agra, India. Aerosol Air Qual. Res. 2013, 13, 523–536. [Google Scholar] [CrossRef]
- Cong, Z.; Kang, S.; Dong, S.; Liu, X.; Qin, D. Elemental and individual particle analysis of atmospheric aerosols from high Himalayas. Environ. Monit. Assess. 2010, 160, 323. [Google Scholar] [CrossRef] [PubMed]
- Li, W.; Shao, L.; Zhang, D.; Ro, C.-U.; Hu, M.; Bi, X.; Geng, H.; Matsuki, A.; Niu, H.; Chen, J. A review of single aerosol particle studies in the atmosphere of East Asia: Morphology, mixing state, source, and heterogeneous reactions. J. Clean. Prod. 2016, 112, 1330–1349. [Google Scholar] [CrossRef]
- Tomasi, C.; Fuzzi, S.; Kokhanovsky, A. Atmospheric Aerosols: Life Cycles and Effects on Air Quality and Climate; John Wiley & Sons: Hoboken, NJ, USA, 2017. [Google Scholar]
- Decree-Law 47/2017, 10 May 2017. Republic Diary No. 90/2017, Series I of 2017-05-10. Available online: https://data.dre.pt/eli/dec-lei/47/2017/05/10/p/dre/pt/html (accessed on 28 January 2021).
- Sánchez de la Campa, A.M.; de la Rosa, J.D.; Fernández-Caliani, J.C.; González-Castanedo, Y. Impact of abandoned mine waste on atmospheric respirable particulate matter in the historic mining district of Rio Tinto (Iberian Pyrite Belt). Environ. Res. 2011, 111, 1018–1023. [Google Scholar] [CrossRef]
- Sánchez de la Campa, A.M.; Sanchez-Rodas, D.; Marquez, G.; Romero, E.; Jesús, D. 2009–2017 trends of PM10 in the legendary Riotinto mining district of SW Spain. Atmos. Res. 2020, 238, 104878. [Google Scholar] [CrossRef]
- Sánchez de la Campa, A.M.; Sánchez-Rodas, D.; Castanedo, Y.G.; Jesús, D. Geochemical anomalies of toxic elements and arsenic speciation in airborne particles from Cu mining and smelting activities: Influence on air quality. J. Hazard. Mater. 2015, 291, 18–27. [Google Scholar] [CrossRef] [PubMed]
- Lu, X.; Wang, L.; Li, L.Y.; Lei, K.; Huang, L.; Kang, D. Multivariate statistical analysis of heavy metals in street dust of Baoji, NW China. J. Hazard. Mater. 2010, 173, 744–749. [Google Scholar] [CrossRef] [PubMed]
- Doabi, S.A.; Afyuni, M.; Karami, M. Multivariate statistical analysis of heavy metals contamination in atmospheric dust of Kermanshah province, Western Iran, during the spring and summer 2013. J. Geochem. Explor. 2017, 180, 61–70. [Google Scholar] [CrossRef]
- Pereira, H.G.; Sousa, A.J. Análise de dados para tratamento de quadros multidimencionais; Centro de Geo-Sistemas, 1988; (Support texts of the Intensive Data Analysis course: 1988–2002). [Google Scholar]
- Toledano, C.; Cachorro, V.E.; De Frutos, A.M.; Torres, B.; Berjón, A.; Sorribas, M.; Stone, R.S. Airmass Classification and Analysis of Aerosol Types at El Arenosillo (Spain). J. Appl. Meteorol. Climatol. 2009, 48, 962–981. [Google Scholar] [CrossRef]
- HISPLIT-Hybrid Single–Particle Lagrangian Integrated Trajectory Model. Available online: http://ready.arl.noaa.gov/HYSPLIT.php (accessed on 30 November 2018).


| Date | Temperature (°C) | Precipitation (mm) | Wind (Km h−1) | Humidity (%) | ||||||||
|---|---|---|---|---|---|---|---|---|---|---|---|---|
| Mean | Max | Min | Mean | Mean | Max | Mean | Max | Min | ||||
| Speed | Direction | Speed | Direction | |||||||||
| 1st Campaign [23] | 10 July 2018 | --- | 29.1 | 17.4 | 0 | 2.9 | --- | --- | --- | --- | --- | --- |
| 11 July 2018 | --- | 28.1 | 17.8 | 0 | 2.9 | --- | --- | --- | --- | --- | --- | |
| 12 July 2018 | --- | 25.9 | 15.7 | 0 | 1.9 | --- | --- | --- | --- | --- | --- | |
| 13 July 2018 | --- | 27.5 | 13.7 | 0 | 2.2 | --- | --- | --- | --- | --- | --- | |
| 14 July 2018 | --- | 26.8 | 15.4 | 0 | 2.2 | --- | --- | --- | --- | --- | --- | |
| 15 July 2018 | --- | 24.9 | 15 | 0 | 3.1 | --- | --- | --- | --- | --- | --- | |
| 16 July 2018 | 29.7 | 13.1 | 0.1 | 2.3 | --- | --- | --- | --- | --- | --- | ||
| 2nd Campaign [24] | 1 November 2018 | 13.1 | 18.8 | 9.1 | 0.0 | 6.8 | N | 27.4 | 86 | 100 | 54 | |
| 2 November 2018 | 16.0 | 19.2 | 11.3 | 0.4 | 7.9 | NW | 25.9 | E | 87 | 100 | 74 | |
| 3 November 2018 | 14.8 | 19 | 10.6 | 0.0 | 5.8 | N | 22.7 | E | 86 | 100 | 69 | |
| 4 November 2018 | 14.6 | 17.5 | 12.7 | 4.1 | 7.9 | SW | 41.8 | SE | 83 | 99 | 63 | |
| 5 November 2018 | 12.0 | 16.4 | 7.8 | 0.0 | 10.8 | W | 42.1 | E | 81 | 98 | 50 | |
| 6 November 2018 | 12.1 | 18.2 | 6.3 | 0.0 | 7.9 | S | 32.4 | SE | 87 | 100 | 54 | |
| 7 November 2018 | 14.4 | 19.1 | 8.9 | 3.4 | 6.8 | W | 31.7 | S | 83 | 100 | 50 | |
| 8 November 2018 | 12.5 | 19.6 | 7.5 | 1.2 | 7.9 | SW | 47.5 | E | 89 | 100 | 57 | |
| 9 November 2018 | 12.1 | 18.6 | 5.9 | 0.0 | 6.5 | S | 28.1 | SE | 85 | 100 | 57 | |
| 10 November 2018 | 16.5 | 20.1 | 10.1 | 0.9 | 11.5 | SW | 46.4 | S | 89 | 100 | 68 | |
| Concentration | Na | Ca | Mn | Fe | Cu | Zn | As | Mo | Cd | Sb | Pb | Volume | ||||||||||||
|---|---|---|---|---|---|---|---|---|---|---|---|---|---|---|---|---|---|---|---|---|---|---|---|---|
| (µg filter−1) | (ng m−3) | (µg filter−1) | (ng m−3) | (µg filter−1) | (ng m−3) | (µg filter−1) | (ng m−3) | (µg filter−1) | (ng m−3) | (µg filter−1) | (ng m−3) | (µg filter−1) | (ng m−3) | (µg filter−1) | (ng m−3) | (µg filter−1) | (ng m−3) | (µg filter−1) | (ng m−3) | (µg filter−1) | (ng m−3) | (m−3) | ||
| Detection limit (l.d.) (µg L−1) | 0.8 | 0.8 | 0.002 | 0.2 | 0.03 | 0.03 | 0.03 | 0.03 | 0.004 | 0.008 | 0.008 | |||||||||||||
| July Campaign | F1 | 10.8 | 260.942 | 7 | 169.129 | 0.33 | 7.973 | 32.2 | 777.993 | 0.36 | 8.698 | 4.6 | 111.142 | 0.5 | 12.081 | 0.03 | 0.725 | 0.008 | 0.193 | 0.071 | 1.715 | 1.792 | 43.297 | 41.39 |
| F2 | 15.8 | 383.728 | 32 | 777.171 | 0.54 | 13.115 | 34.2 | 830.601 | 0.52 | 12.629 | 3.6 | 87.432 | 0.4 | 9.715 | <l.d. | <l.d. | 0.006 | 0.146 | 0.062 | 1.506 | 1.492 | 36.236 | 41.18 | |
| F4 | 19.8 | 481.799 | 60 | 1459.996 | 0.81 | 19.71 | 73.2 | 1781.195 | 0.95 | 23.117 | 9.7 | 236.033 | 1.05 | 25.55 | 0.03 | 0.73 | 0.021 | 0.511 | 0.172 | 4.185 | 3.792 | 92.272 | 41.1 | |
| F5 | 11.8 | 285.103 | 15 | 362.419 | 0.59 | 14.255 | 88.2 | 2131.024 | 1.25 | 30.202 | 10.7 | 258.526 | 1.25 | 30.202 | 0.03 | 0.725 | 0.023 | 0.556 | 0.232 | 5.605 | 4.492 | 108.532 | 41.39 | |
| November Campaign | F7 | 21.8 | 553.019 | 14 | 355.15 | 0.58 | 14.713 | 19.2 | 487.062 | 0.31 | 7.864 | 3.5 | 88.787 | 0.41 | 10.401 | 0.08 | 2.029 | 0.007 | 0.178 | 0.048 | 1.218 | 1.092 | 27.702 | 39.42 |
| F8 | 7.8 | 187.505 | <l.d. | <l.d. | 0.19 | 4.567 | 15.2 | 365.393 | 0.21 | 5.048 | 2.1 | 50.482 | 0.3 | 7.212 | <l.d. | <l.d. | 0.004 | 0.096 | 0.039 | 0.938 | 0.832 | 20 | 41.6 | |
| F9 | 3.6 | 90.309 | <l.d. | <l.d. | 0.31 | 7.777 | 33.2 | 832.853 | 0.38 | 9.533 | 4.4 | 110.378 | 0.55 | 13.797 | 0.03 | 0.753 | 0.011 | 0.276 | 0.07 | 1.756 | 1.692 | 42.445 | 39.86 | |
| F10 | 2.7 | 180.048 | 4 | 266.738 | 0.18 | 12.003 | 5.3 | 353.428 | 0.08 | 5.335 | 0.8 | 53.348 | 0.09 | 6.002 | 0.07 | 4.668 | 0 | 0 | <l.d. | <l.d. | 0.242 | 16.138 | 15 | |
| F11 | 18.8 | 449.47 | <l.d. | <l.d. | 0.19 | 4.543 | 21.2 | 506.85 | 0.31 | 7.411 | 2.9 | 69.333 | 0.3 | 7.172 | 0 | 0 | <l.d. | <l.d. | 0.048 | 1.148 | 1.392 | 33.28 | 41.83 | |
| F12 | 7.8 | 437.539 | 7 | 392.663 | 0.12 | 6.731 | 3.2 | 179.503 | 0.09 | 5.049 | 0.6 | 33.657 | 0.07 | 3.927 | 0.08 | 4.488 | 0 | 0 | <l.d. | <l.d. | 0.132 | 7.404 | 17.83 | |
| F13 | 23.8 | 562.595 | 0 | 0 | 0.22 | 5.2 | 28.2 | 666.604 | 0.35 | 8.273 | 3.9 | 92.19 | 0.49 | 11.583 | <l.d. | <l.d. | 0.007 | 0.165 | 0.068 | 1.607 | 1.592 | 37.632 | 42.3 | |
| F14 | 82.8 | 2008.198 | 15 | 363.804 | 1.03 | 24.981 | 47.2 | 1144.77 | 0.71 | 17.22 | 6.3 | 152.798 | 0.7 | 16.978 | <l.d. | <l.d. | 0.013 | 0.315 | 0.092 | 2.231 | 2.192 | 53.164 | 41.23 | |
| F15 | 18.8 | 427.448 | 0 | 0 | 0.1 | 2.274 | 4.7 | 106.862 | 0.18 | 4.093 | 0.3 | 6.821 | 0.11 | 2.501 | 0 | 0 | 0 | 0 | <l.d. | <l.d. | 0.192 | 4.365 | 43.98 | |
| Min | --- | 90 | --- | 0 | --- | 2 | --- | 107 | --- | 4 | --- | 7 | --- | 3 | --- | 0 | --- | 0 | --- | 0 | --- | 4 | --- | |
| Máx | --- | 2008 | --- | 1460 | --- | 25 | --- | 2131 | --- | 30 | --- | 259 | --- | 30 | --- | 5 | --- | 1 | --- | 6 | --- | 109 | --- | |
| Local | Zn | Cu | Mn | Fe | Cd | As | Pb |
|---|---|---|---|---|---|---|---|
| Aljustrel | 103.92 | 11.11 | 10.60 | 781.86 | 0.20 | 12.09 | 40.19 |
| Rio Tinto | 28.20 | 6.30 | 8.58 | 370.00 | 0.13 | 1.26 | 5.18 |
| Variables | PC1 | PC2 | PC3 | PC4 | PC5 |
|---|---|---|---|---|---|
| O | 0.833 | −0.066 | −0.087 | 0.174 | −0.151 |
| Al | 0.695 | −0.222 | −0.240 | −0.229 | 0.070 |
| Si | 0.767 | −0.233 | −0.401 | −0.122 | −0.022 |
| S | 0.373 | 0.327 | 0.685 | −0.088 | 0.154 |
| Mn | 0.064 | −0.148 | 0.048 | 0.394 | 0.670 |
| Fe | 0.546 | 0.257 | 0.526 | −0.003 | 0.217 |
| Cu | 0.201 | 0.064 | 0.234 | 0.641 | −0.613 |
| Zn | 0.071 | 0.482 | 0.092 | −0.502 | −0.224 |
| As | 0.060 | 0.770 | −0.388 | −0.005 | 0.022 |
| Pb | 0.067 | 0.625 | −0.424 | 0.359 | 0.198 |
| Eigenvalue | 2.26 | 1.52 | 1.37 | 1.05 | 1.01 |
| Total variance (%) | 22.60 | 15.22 | 13.69 | 10.52 | 10.14 |
| Cumulative Variance (%) | 22.60 | 37.82 | 51.51 | 62.03 | 72.17 |
| Na | Ca | Mn | Fe | Cu | Zn | As | Mo | Cd | Sb | Pb | |
|---|---|---|---|---|---|---|---|---|---|---|---|
| Na | 1.000 | ||||||||||
| Ca | 0.119 | 1.000 | |||||||||
| Mn | 0.644 | 0.657 | 1.000 | ||||||||
| Fe | 0.162 | 0.558 | 0.632 | 1.000 | |||||||
| Cu | 0.229 | 0.571 | 0.663 | 0.983 | 1.000 | ||||||
| Zn | 0.188 | 0.569 | 0.668 | 0.989 | 0.962 | 1.000 | |||||
| As | 0.163 | 0.515 | 0.629 | 0.988 | 0.962 | 0.994 | 1.000 | ||||
| Mo | −0.221 | 0.082 | 0.021 | −0.299 | −0.263 | −0.248 | −0.275 | 1.000 | |||
| Cd | 0.182 | 0.535 | 0.644 | 0.959 | 0.930 | 0.969 | 0.981 | −0.314 | 1.000 | ||
| Sb | 0.098 | 0.479 | 0.531 | 0.983 | 0.964 | 0.975 | 0.984 | −0.361 | 0.955 | 1.000 | |
| Pb | 0.119 | 0.524 | 0.578 | 0.993 | 0.964 | 0.990 | 0.988 | −0.319 | 0.952 | 0.991 | 1.000 |
Publisher’s Note: MDPI stays neutral with regard to jurisdictional claims in published maps and institutional affiliations. |
© 2021 by the authors. Licensee MDPI, Basel, Switzerland. This article is an open access article distributed under the terms and conditions of the Creative Commons Attribution (CC BY) license (http://creativecommons.org/licenses/by/4.0/).
Share and Cite
Barroso, A.; Mogo, S.; Silva, M.M.V.G.; Cachorro, V.; de Frutos, Á. Morphology, Mineralogy, and Chemistry of Atmospheric Aerosols Nearby an Active Mining Area: Aljustrel Mine (SW Portugal). Atmosphere 2021, 12, 333. https://0-doi-org.brum.beds.ac.uk/10.3390/atmos12030333
Barroso A, Mogo S, Silva MMVG, Cachorro V, de Frutos Á. Morphology, Mineralogy, and Chemistry of Atmospheric Aerosols Nearby an Active Mining Area: Aljustrel Mine (SW Portugal). Atmosphere. 2021; 12(3):333. https://0-doi-org.brum.beds.ac.uk/10.3390/atmos12030333
Chicago/Turabian StyleBarroso, Ana, Sandra Mogo, M. Manuela V. G. Silva, Victoria Cachorro, and Ángel de Frutos. 2021. "Morphology, Mineralogy, and Chemistry of Atmospheric Aerosols Nearby an Active Mining Area: Aljustrel Mine (SW Portugal)" Atmosphere 12, no. 3: 333. https://0-doi-org.brum.beds.ac.uk/10.3390/atmos12030333