
The Indirect Impact of Surface Vegetation Improvement on the Climate Response of Sand-Dust Events in Northern China


Abstract
:1. Introduction
2. Experiments
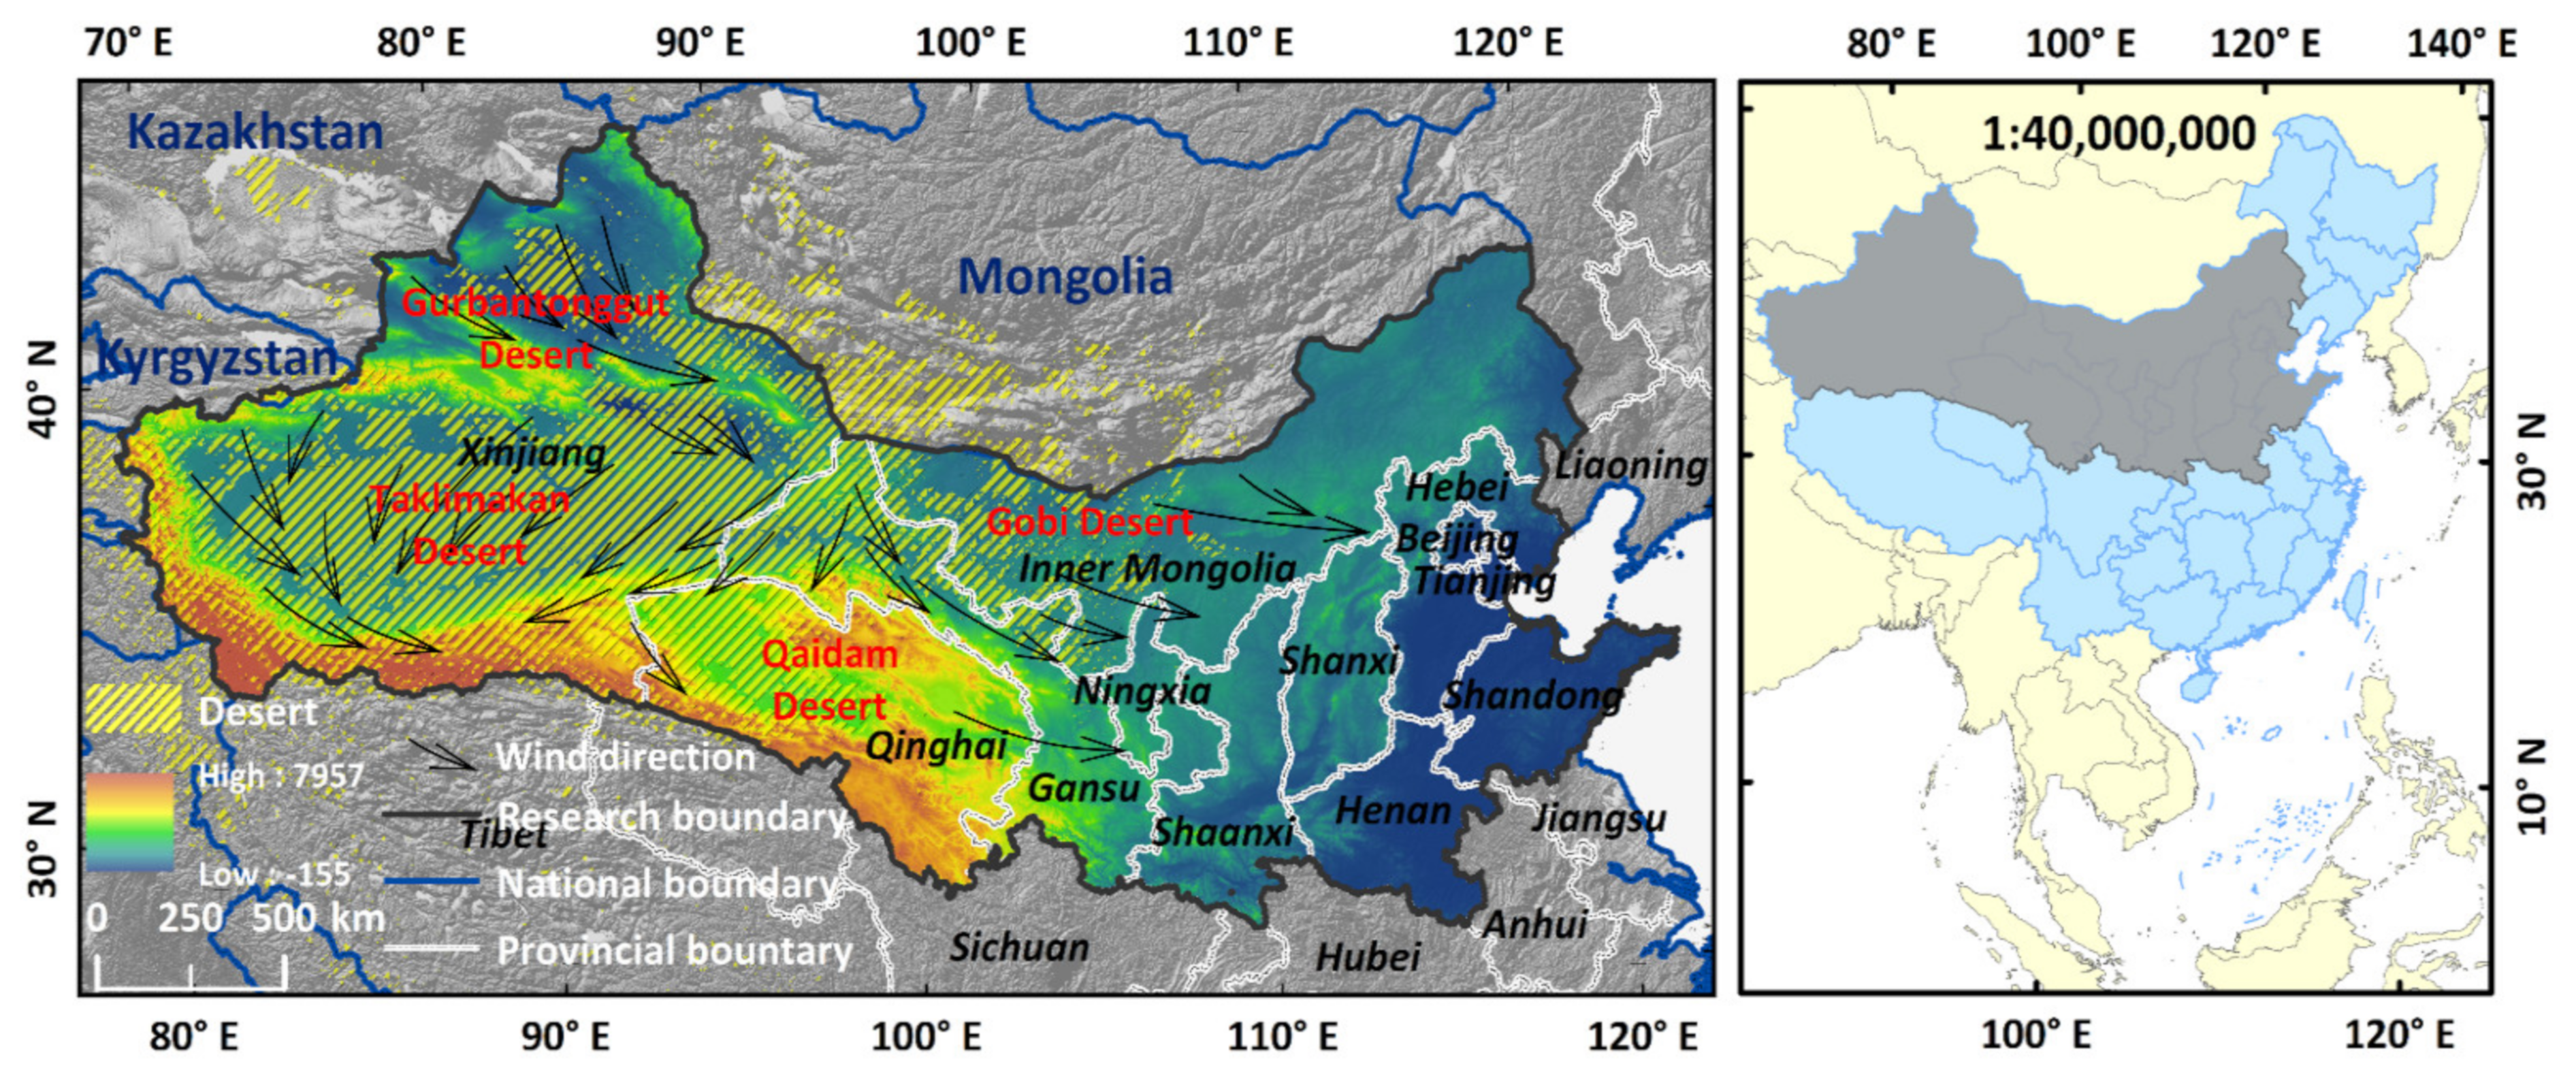
2.1. Study Area
2.2. Analysis Framework
2.3. RegCM Simulation
2.4. Scenario Setting
3. Results
3.1. Effects of Ecological Restoration Projects on Sand-Dust Events in Northern China
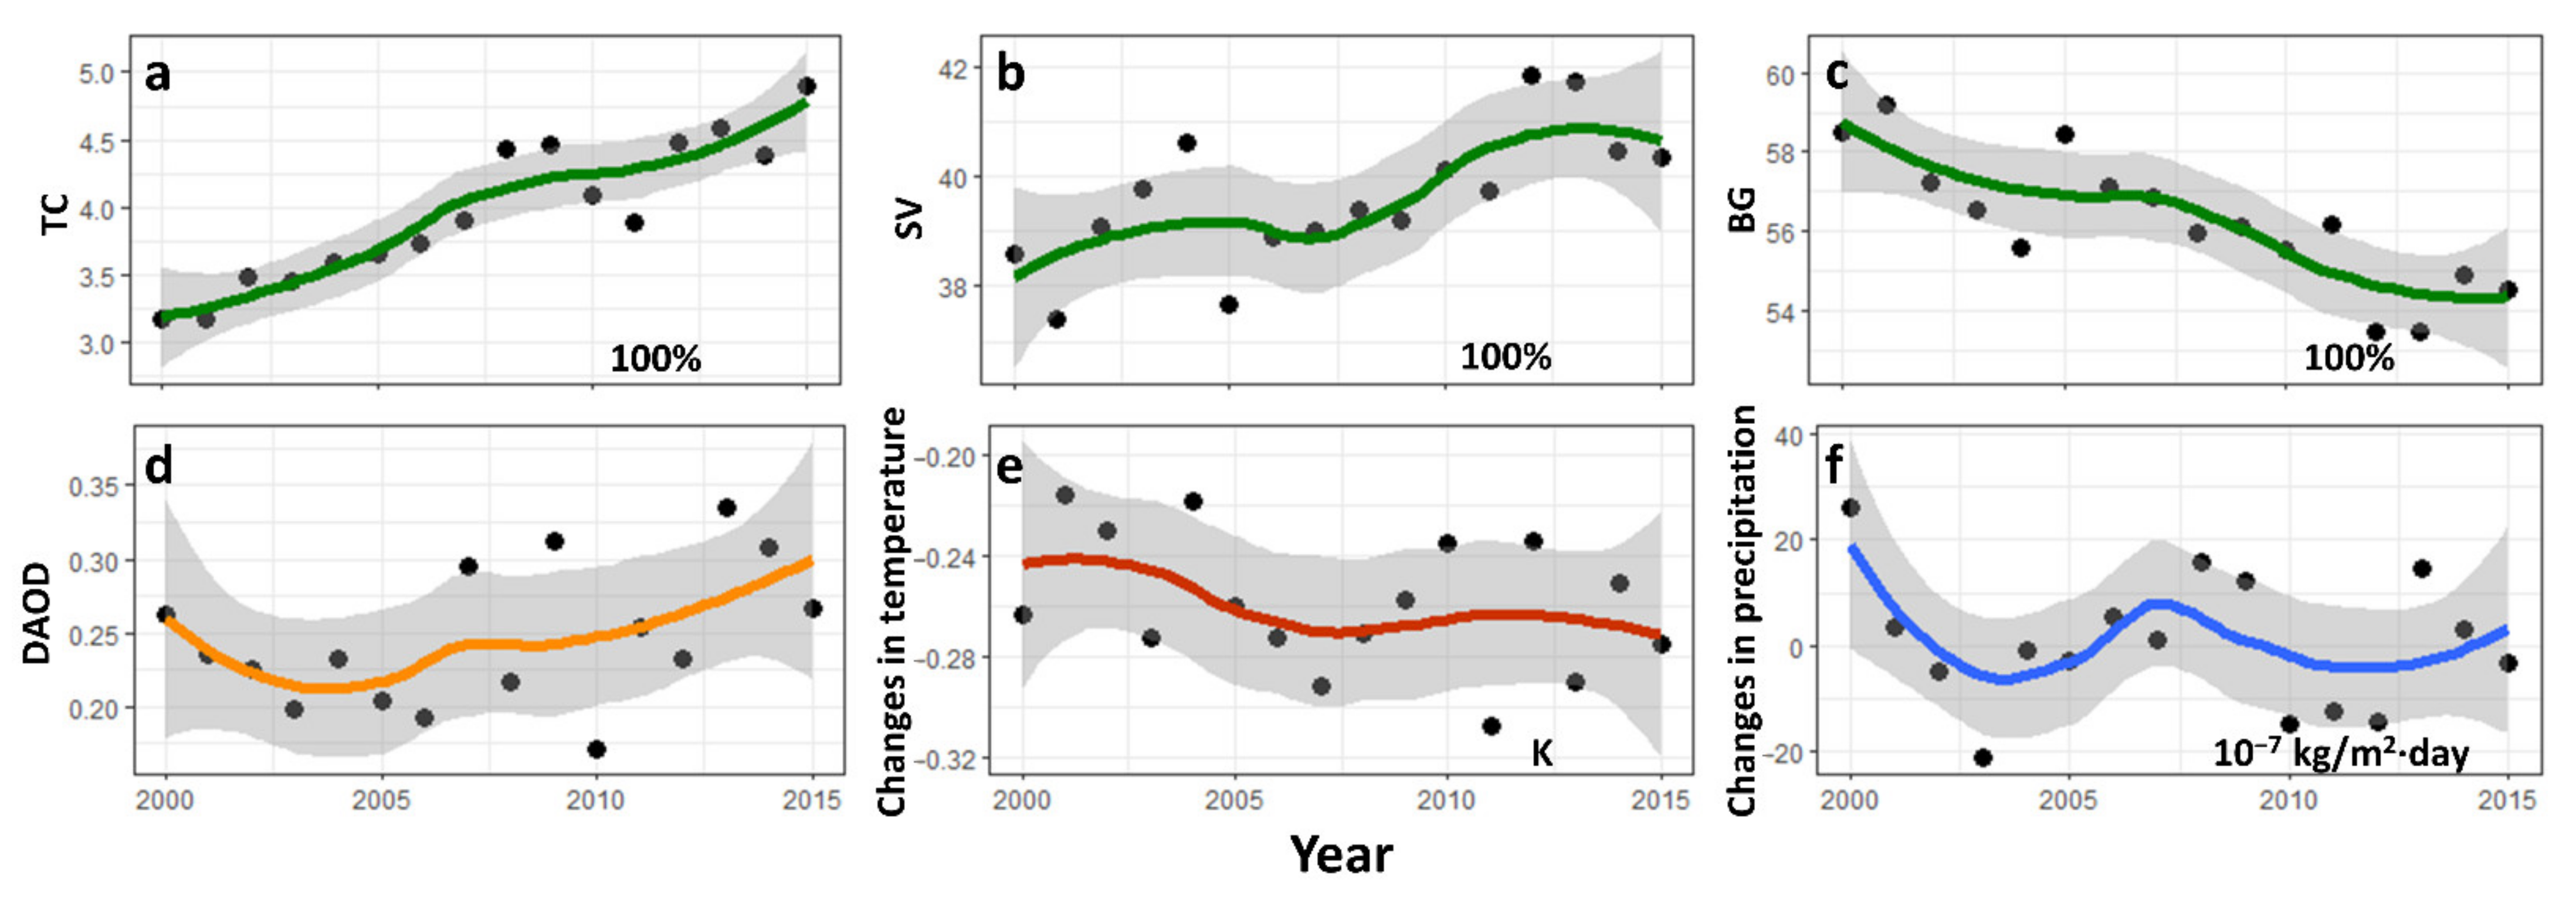
3.2. Feedback of Dust Climate Effects on Temperature and Precipitation
4. Discussion and Conclusions
Author Contributions
Funding
Institutional Review Board Statement
Informed Consent Statement
Data Availability Statement
Conflicts of Interest
Appendix A
Appendix A.1. Data Sources
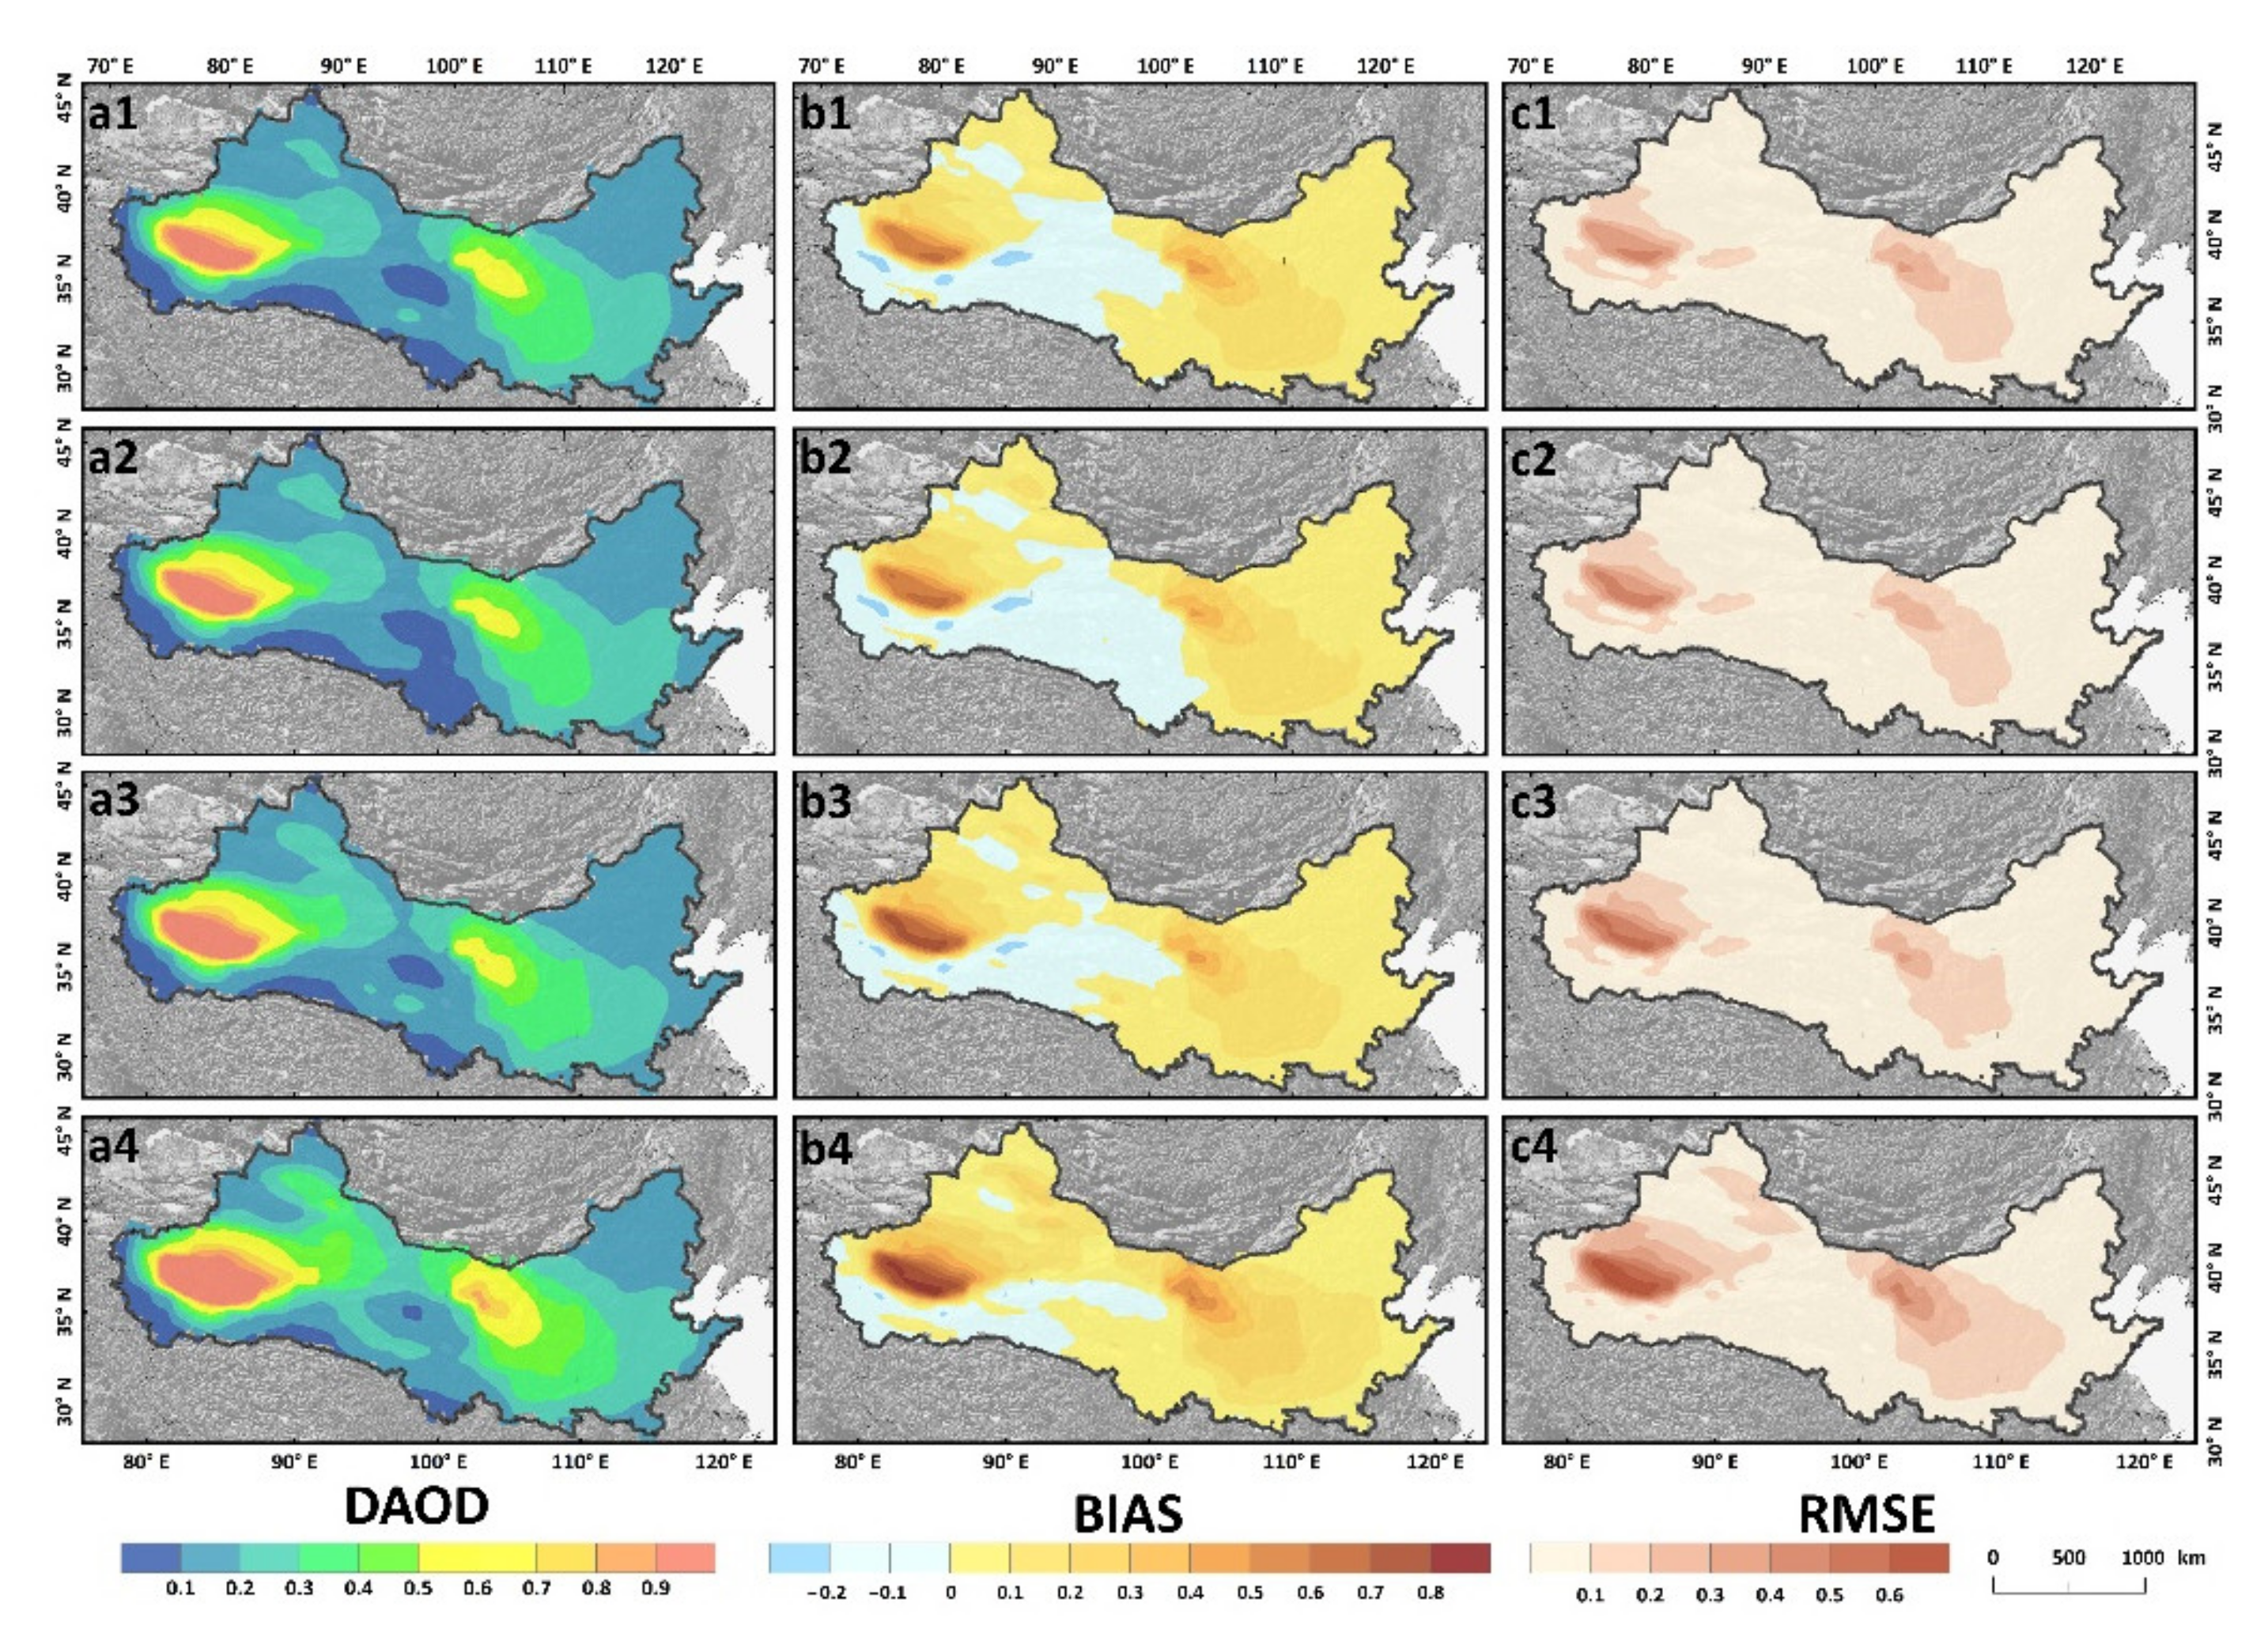
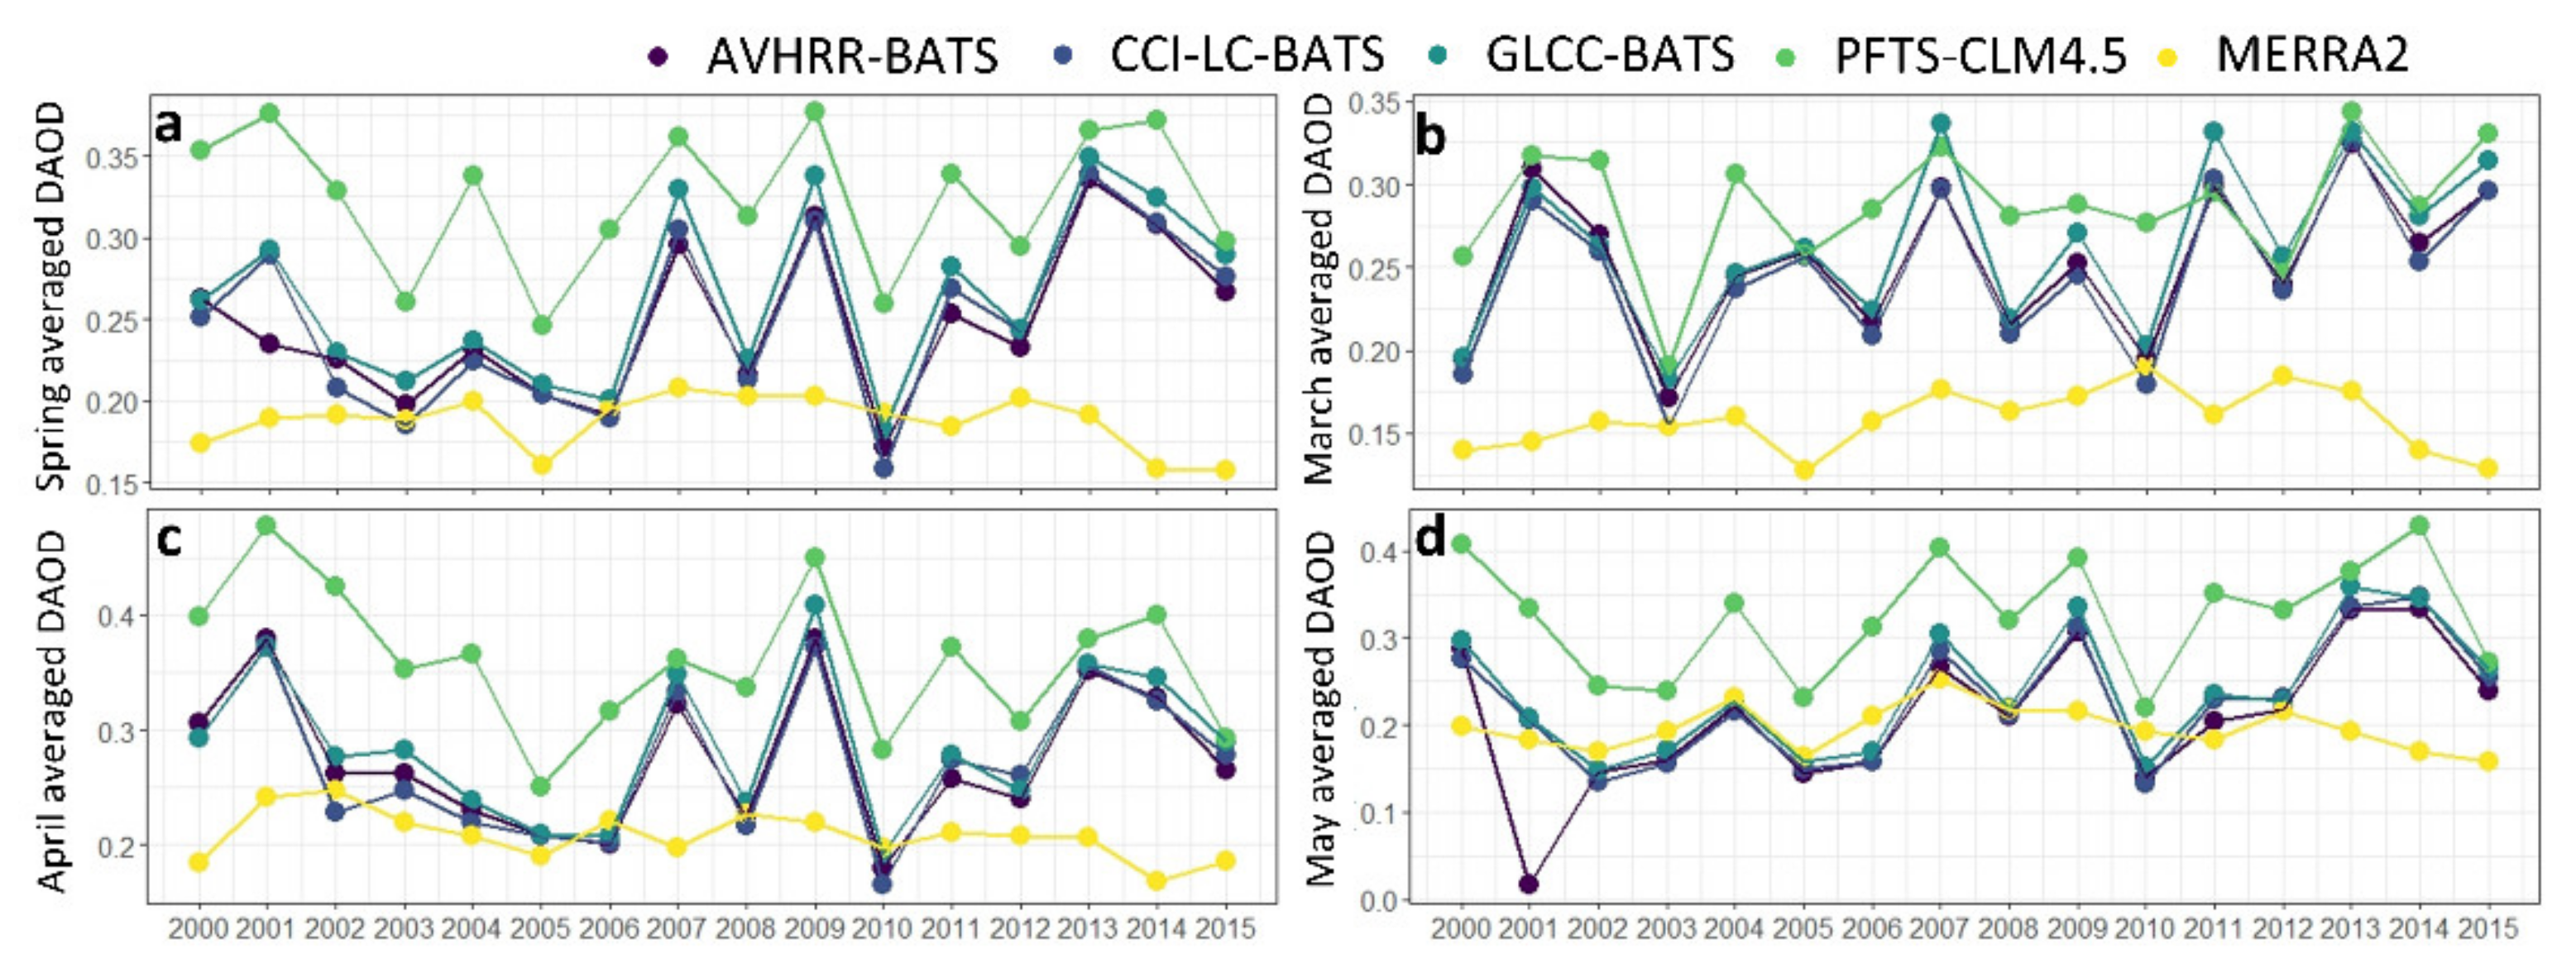
Appendix A.2. The Usability Analysis for Simulating Sand-Dust Events in Northern China with RegCM


| Shortwave Radiative Forcing (W/m2·a) | Longwave Radiative Forcing (W/m2·a) | Net Radiative Forcing (W/m2·a) | |
|---|---|---|---|
| Atmospheric top | 0.974 | 1.069 | 2.043 |
| Atmospheric | 18.742 | −6.334 | 12.408 |
| Surface | −17.768 | 7.403 | −10.365 |

References
- Shinn, E.A.; Smith, G.W.; Prospero, J.M.; Betzer, P.; Hayes, M.L.; Garrison, V.; Barber, R.T. African dust and the demise of Caribbean coral reefs. Geophys. Res. Lett. 2000, 27, 3029–3032. [Google Scholar] [CrossRef] [Green Version]
- Goudie, A.S.; Middleton, N.J. Desert Dust in the Global System; Springer Science & Business Media: Berlin/Heidelberg, Germany, 2006. [Google Scholar]
- Yu, H.; Chin, M.; Yuan, T.; Bian, H.; Remer, L.A.; Prospero, J.M.; Omar, A.; Winker, D.; Yang, Y.; Zhang, Y. The fertilizing role of African dust in the Amazon rainforest: A first multiyear assessment based on data from Cloud-Aerosol Lidar and Infrared Pathfinder Satellite Observations. Geophys. Res. Lett. 2015, 42, 1984–1991. [Google Scholar] [CrossRef]
- Twohy, C.H.; Kreidenweis, S.M.; Eidhammer, T.; Browell, E.V.; Heymsfield, A.J.; Bansemer, A.R.; Anderson, B.E.; Chen, G.; Ismail, S.; DeMott, P.J. Saharan dust particles nucleate droplets in eastern Atlantic clouds. Geophys. Res. Lett. 2009, 36. [Google Scholar] [CrossRef] [Green Version]
- Harrison, S.P.; Kohfeld, K.E.; Roelandt, C.; Claquin, T. The role of dust in climate changes today, at the last glacial maximum and in the future. Earth-Sci. Rev. 2001, 54, 43–80. [Google Scholar] [CrossRef]
- Evan, A.T.; Dunion, J.; Foley, J.A.; Heidinger, A.K.; Velden, C.S. New evidence for a relationship between Atlantic tropical cyclone activity and African dust outbreaks. Geophys. Res. Lett. 2006, 33. [Google Scholar] [CrossRef] [Green Version]
- Choobari, O.A.; Zawar-Reza, P.; Sturman, A. The global distribution of mineral dust and its impacts on the climate system: A review. Atmos. Res. 2014, 138, 152–165. [Google Scholar] [CrossRef]
- Bryant, R.G.; Bigg, G.R.; Mahowald, N.M.; Eckardt, F.D.; Ross, S.G. Dust emission response to climate in southern Africa. J. Geophys. Res. Atmos. 2007, 112. [Google Scholar] [CrossRef] [Green Version]
- Kok, J.F.; Ward, D.S.; Mahowald, N.M.; Evan, A.T. Global and regional importance of the direct dust-climate feedback. Nat. Commun. 2018, 9, 1–11. [Google Scholar] [CrossRef] [PubMed]
- Solomon, S.; Qin, D.; Manning, M.; Chen, Z.; Marquis, M.; Averyt, K.; Tignor, M.; Miller, H. Climate Change 2007: The Physical Science Basis; Intergovernmental Panel on Climate Change (IPCC), Cambridge University Press: Cambridge, UK, 2007. [Google Scholar]
- Stocker, T.; Qin, D.; Plattner, G.; Tignor, M.; Allen, S.; Boschung, J.; Nauels, A.; Xia, Y.; Bex, V.; Midgley, P. IPCC, 2013: Summary for Policymakers in Climate Change 2013: The Physical Science Basis, Contribution of Working Group I to the Fifth Assessment Report of the Intergovernmental Panel on Climate Change; Cambridge University Press: Cambridge, UK; New York, NY, USA, 2013. [Google Scholar]
- Shepherd, G.; Terradellas, E.; Baklanov, A.; Kang, U.; Sprigg, W.; Nickovic, S.; Boloorani, A.D.; Al-Dousari, A.; Basart, S.; Benedetti, A. Global Assessment of Sand and Dust Storms; The United Nations Environment Programme (UNEP): Nairobi, Kenya, 2016. [Google Scholar]
- Evan, A.T.; Flamant, C.; Gaetani, M.; Guichard, F. The past, present and future of African dust. Nature 2016, 531, 493–495. [Google Scholar] [CrossRef] [PubMed]
- Zinta, Z.; George, C.V.; Dale, S.R.; Walter, R.; Trilok, S.P.; Diego, M.; Clever, M.; Marc, A.L.; Marcel, T.K.; Peter, N.K. Blobal Environment Outlook Geo 4 Environment for Development; United Nations Environment Programme (UNEP): Nairobi, Kenya, 2007. [Google Scholar]
- Zhang, X.; Zhao, L.; Tong, D.Q.; Wu, G.; Dan, M.; Teng, B. A systematic review of global desert dust and associated human health effects. Atmosphere 2016, 7, 158. [Google Scholar] [CrossRef] [Green Version]
- Stein, S. Coping with the ‘World’s Biggest Dust Bowl’. Towards a History of China’s Forest Shelterbelts, 1950s-Present. Glob. Environ. 2015, 8, 320–348. [Google Scholar] [CrossRef]
- Zutz, A. Fear of the ‘Steppes’: Soil Protection and Landscape Planning in Germany 1930–1960 between Politics and Science. Glob. Environ. 2015, 8, 380–409. [Google Scholar] [CrossRef]
- Sauter, S. Lessons from the US: Australia’s Response to Wind Erosion (1935–1945). Glob. Environ. 2015, 8, 293–319. [Google Scholar] [CrossRef]
- Elie, M. The Soviet Dust Bowl and the Canadian Erosion Experience in the New Lands of Kazakhstan, 1950s–1960s. Glob. Environ. 2015, 8, 259–292. [Google Scholar] [CrossRef]
- Liu, J.; Li, S.; Ouyang, Z.; Tam, C.; Chen, X. Ecological and socioeconomic effects of China’s policies for ecosystem services. Proc. Natl. Acad. Sci. USA 2008, 105, 9477–9482. [Google Scholar] [CrossRef] [PubMed] [Green Version]
- Zhang, Y.; Peng, C.; Li, W.; Tian, L.; Zhu, Q.; Chen, H.; Fang, X.; Zhang, G.; Liu, G.; Mu, X. Multiple afforestation programs accelerate the greenness in the ‘Three North’region of China from 1982 to 2013. Ecol. Indic. 2016, 61, 404–412. [Google Scholar] [CrossRef]
- Chen, C.; Park, T.; Wang, X.; Piao, S.; Xu, B.; Chaturvedi, R.K.; Fuchs, R.; Brovkin, V.; Ciais, P.; Fensholt, R. China and India lead in greening of the world through land-use management. Nat. Sustain. 2019, 2, 122–129. [Google Scholar] [CrossRef]
- Zhou, C.; Fu, B.; Wang, X.; Yin, L.; Feng, X. The Regional Impact of Ecological Restoration in the Arid Steppe on Dust Reduction over the Metropolitan Area in Northeastern China. Environ. Sci. Technol. 2020, 54, 7775–7786. [Google Scholar] [CrossRef] [PubMed]
- Peng, S.-S.; Piao, S.; Zeng, Z.; Ciais, P.; Zhou, L.; Li, L.Z.; Myneni, R.B.; Yin, Y.; Zeng, H. Afforestation in China cools local land surface temperature. Proc. Natl. Acad. Sci. USA 2014, 111, 2915–2919. [Google Scholar] [CrossRef] [PubMed] [Green Version]
- Shen, M.; Piao, S.; Jeong, S.-J.; Zhou, L.; Zeng, Z.; Ciais, P.; Chen, D.; Huang, M.; Jin, C.-S.; Li, L.Z. Evaporative cooling over the Tibetan Plateau induced by vegetation growth. Proc. Natl. Acad. Sci. USA 2015, 112, 9299–9304. [Google Scholar] [CrossRef] [PubMed] [Green Version]
- Swann, A.L.; Fung, I.Y.; Chiang, J.C. Mid-latitude afforestation shifts general circulation and tropical precipitation. Proc. Natl. Acad. Sci. USA 2012, 109, 712–716. [Google Scholar] [CrossRef] [PubMed] [Green Version]
- Yosef, G.; Walko, R.; Avisar, R.; Tatarinov, F.; Rotenberg, E.; Yakir, D. Large-scale semi-arid afforestation can enhance precipitation and carbon sequestration potential. Sci. Rep. 2018, 8, 1–10. [Google Scholar] [CrossRef] [Green Version]
- Laguë, M.M.; Swann, A.L. Progressive midlatitude afforestation: Impacts on clouds, global energy transport, and precipitation. J. Clim. 2016, 29, 5561–5573. [Google Scholar] [CrossRef]
- Zeng, Z.; Piao, S.; Li, L.Z.; Wang, T.; Ciais, P.; Lian, X.; Yang, Y.; Mao, J.; Shi, X.; Myneni, R.B. Impact of Earth greening on the terrestrial water cycle. J. Clim. 2018, 31, 2633–2650. [Google Scholar] [CrossRef]
- Guan, Q.; Sun, X.; Yang, J.; Pan, B.; Zhao, S.; Wang, L. Dust storms in northern China: Long-term spatiotemporal characteristics and climate controls. J. Clim. 2017, 30, 6683–6700. [Google Scholar] [CrossRef]
- Zhao, Y.; Xin, Z.; Ding, G. Spatiotemporal variation in the occurrence of sand-dust events and its influencing factors in the Beijing-Tianjin Sand Source Region, China, 1982–2013. Reg. Environ. Chang. 2018, 18, 2433–2444. [Google Scholar] [CrossRef]
- Jiang, B.; Liang, S.; Yuan, W. Observational evidence for impacts of vegetation change on local surface climate over northern China using the Granger causality test. J. Geophys. Res. Biogeosci. 2015, 120, 1–12. [Google Scholar] [CrossRef]
- Song, H.; Zhang, K.; Piao, S.; Wan, S. Spatial and temporal variations of spring dust emissions in northern China over the last 30 years. Atmos. Environ. 2016, 126, 117–127. [Google Scholar] [CrossRef]
- Tan, M.; Li, X. Does the Green Great Wall effectively decrease dust storm intensity in China? A study based on NOAA NDVI and weather station data. Land Use Policy 2015, 43, 42–47. [Google Scholar] [CrossRef]
- Zhao, W.; Hu, G.; Zhang, Z.; He, Z. Shielding effect of oasis-protection systems composed of various forms of wind break on sand fixation in an arid region: A case study in the Hexi Corridor, northwest China. Ecol. Eng. 2008, 33, 119–125. [Google Scholar] [CrossRef]
- Li, F.-R.; Zhang, H.; Zhao, L.-Y.; Shirato, Y.; Wang, X.-Z. Pedoecological effects of a sand-fixing poplar (Populus simonii Carr.) forest in a desertified sandy land of Inner Mongolia, China. Plant Soil 2003, 256, 431–442. [Google Scholar] [CrossRef]
- Zhan, K.; Liu, S.; Yang, Z.; Fang, E.; Zhou, L.; Huang, N. Effects of sand-fixing and windbreak forests on wind flow: A synthesis of results from field experiments and numerical simulations. J. Arid Land 2017, 9, 1–12. [Google Scholar] [CrossRef] [Green Version]
- Skidmore, E. Wind erosion control. Clim. Chang. 1986, 9, 209–218. [Google Scholar] [CrossRef]
- Wu, Z.; Wu, J.; He, B.; Liu, J.; Wang, Q.; Zhang, H.; Liu, Y. Drought offset ecological restoration program-induced increase in vegetation activity in the Beijing-Tianjin Sand Source Region, China. Environ. Sci. Technol. 2014, 48, 12108–12117. [Google Scholar] [CrossRef] [PubMed]
- Fan, B.; Guo, L.; Li, N.; Chen, J.; Lin, H.; Zhang, X.; Shen, M.; Rao, Y.; Wang, C.; Ma, L. Earlier vegetation green-up has reduced spring dust storms. Sci. Rep. 2014, 4, 6749. [Google Scholar] [CrossRef]
- Zhang, X.Y.; Arimoto, R.; An, Z.S. Dust emission from Chinese desert sources linked to variations in atmospheric circulation. J. Geophys. Res. Atmos. 1997, 102, 28041–28047. [Google Scholar] [CrossRef]
- Zhang, X.-Y.; Gong, S.; Zhao, T.; Arimoto, R.; Wang, Y.; Zhou, Z. Sources of Asian dust and role of climate change versus desertification in Asian dust emission. Geophys. Res. Lett. 2003, 30. [Google Scholar] [CrossRef] [Green Version]
- Kok, J.F.; Adebiyi, A.A.; Albani, S.; Balkanski, Y.; Checa-Garcia, R.; Chin, M.; Colarco, P.R.; Hamilton, D.S.; Huang, Y.; Ito, A. Contribution of the world’s main dust source regions to the global cycle of desert dust. Atmos. Chem. Phys. Discuss. 2021, 1–34. [Google Scholar] [CrossRef]
- Wang, X.; Cheng, H.; Che, H.; Sun, J.; Lu, H.; Qiang, M.; Hua, T.; Zhu, B.; Li, H.; Ma, W. Modern dust aerosol availability in northwestern China. Sci. Rep. 2017, 7, 8741. [Google Scholar] [CrossRef] [PubMed] [Green Version]
- Chen, S.; Huang, J.; Li, J.; Jia, R.; Jiang, N.; Kang, L.; Ma, X.; Xie, T. Comparison of dust emissions, transport, and deposition between the Taklimakan Desert and Gobi Desert from 2007 to 2011. Sci. China Earth Sci. 2017, 60, 1338–1355. [Google Scholar] [CrossRef]
- Qian, Y.; Giorgi, F.; Huang, Y.; Chameides, W.; Luo, C. Regional simulation of anthropogenic sulfur over East Asia and its sensitivity to model parameters. Tellus B Chem. Phys. Meteorol. 2001, 53, 171–191. [Google Scholar] [CrossRef]
- Sun, H.; Pan, Z.; Liu, X. Numerical simulation of spatial-temporal distribution of dust aerosol and its direct radiative effects on East Asian climate. J. Geophys. Res. Atmos. 2012, 117. [Google Scholar] [CrossRef]
- Gao, X.; Giorgi, F. Use of the RegCM system over East Asia: Review and perspectives. Engineering 2017, 3, 766–772. [Google Scholar] [CrossRef]
- Grell, G.A.; Dudhia, J.; Stauffer, D.R. A Description of the Fifth-Generation Penn State/NCAR Mesoscale Model (MM5); (No. NCAR/TN-398+STR); University Corporation for Atmospheric Research: Boulder, CO, USA, 1994. [Google Scholar] [CrossRef]
- Hirakuchi, H.; Giorgi, F. Multiyear present-day and 2× CO2 simulations of monsoon climate over eastern Asia and Japan with a regional climate model nested in a general circulation model. J. Geophys. Res. Atmos. 1995, 100, 21105–21125. [Google Scholar] [CrossRef]
- Liu, Y.; Giorgi, F.; Washington, W.M. Simulation of summer monsoon climate over East Asia with an NCAR regional climate model. Mon. Weather Rev. 1994, 122, 2331–2348. [Google Scholar] [CrossRef] [Green Version]
- Solmon, F.; Giorgi, F.; Liousse, C. Aerosol modelling for regional climate studies: Application to anthropogenic particles and evaluation over a European/African domain. Tellus B Chem. Phys. Meteorol. 2006, 58, 51–72. [Google Scholar] [CrossRef]
- Zakey, A.; Solmon, F.; Giorgi, F. Implementation and testing of a desert dust module in a regional climate model. Atmos. Chem. Phys. 2006, 6, 4687–4704. [Google Scholar] [CrossRef] [Green Version]
- Marticorena, B.; Bergametti, G. Modeling the atmospheric dust cycle: 1. Design of a soil-derived dust emission scheme. J. Geophys. Res. Atmos. 1995, 100, 16415–16430. [Google Scholar] [CrossRef] [Green Version]
- Alfaro, S.C.; Gomes, L. Modeling mineral aerosol production by wind erosion: Emission intensities and aerosol size distributions in source areas. J. Geophys. Res. Atmos. 2001, 106, 18075–18084. [Google Scholar] [CrossRef]
- Zhang, D.; Zakey, A.; Gao, X.; Giorgi, F.; Solmon, F. Simulation of dust aerosol and its regional feedbacks over East Asia using a regional climate model. Atmos. Chem. Phys. 2009, 9, 1095–1110. [Google Scholar] [CrossRef] [Green Version]
- Giorgi, F.; Chameides, W.L. Rainout lifetimes of highly soluble aerosols and gases as inferred from simulations with a general circulation model. J. Geophys. Res. Atmos. 1986, 91, 14367–14376. [Google Scholar] [CrossRef]
- Giorgi, F. Two-dimensional simulations of possible mesoscale effects of nuclear war fires: 1. Model description. J. Geophys. Res. Atmos. 1989, 94, 1127–1144. [Google Scholar] [CrossRef]
- Berrisford, P.; Dee, D.; Poli, P.; Brugge, R.; Fielding, K.; Fuentes, M.; Kallberg, P.; Kobayashi, S.; Uppala, S.; Simmons, A. The ERA-Interim Archive, Version 2.0; ECMWF: Reading, UK, 2011. [Google Scholar]
- Balsamo, G.; Albergel, C.; Beljaars, A.; Boussetta, S.; Brun, E.; Cloke, H.; Dee, D.; Dutra, E.; Muñoz-Sabater, J.; Pappenberger, F. ERA-Interim/Land: A global land surface reanalysis data set. Hydrol. Earth Syst. Sci. 2015, 19, 389–407. [Google Scholar] [CrossRef] [Green Version]
- Dee, D.P.; Uppala, S.M.; Simmons, A.; Berrisford, P.; Poli, P.; Kobayashi, S.; Andrae, U.; Balmaseda, M.; Balsamo, G.; Bauer, D.P. The ERA-Interim reanalysis: Configuration and performance of the data assimilation system. Q. J. R. Meteorol. Soc. 2011, 137, 553–597. [Google Scholar] [CrossRef]
- Uppala, S.; Dee, D.; Kobayashi, S.; Berrisford, P.; Simmons, A. Towards a climate data assimilation system: Status update of ERA-Interim. ECMWF Newsl. 2008, 115, 12–18. [Google Scholar]
- Su, X.-T.; Wang, H.-J.; Xu, L.-R.; Zhang, Z.-B.; Sun, H.-Y. Impact of desert dust on the East Asian summer monsoon. J. Trop. Meteorol. 2016, 22, 252. [Google Scholar]
- Zhang, J.; Zhao, T.; Jiang, C.; Cao, S. Opportunity cost of water allocation to afforestation rather than conservation of natural vegetation in China. Land Use Policy 2016, 50, 67–73. [Google Scholar] [CrossRef]
- Zhou, Y.; Chang, X.; Ye, S.; Zheng, Z.; Lv, S. Analysis on regional vegetation changes in dust and sandstorms source area: A case study of Naiman Banner in the Horqin sandy region of Northern China. Environ. Earth Sci. 2015, 73, 2013–2025. [Google Scholar] [CrossRef]
- Long, X.; Tie, X.; Li, G.; Cao, J.; Feng, T.; Zhao, S.; Xing, L.; An, Z. Effect of ecological restoration programs on dust concentrations in the North China Plain: A case study. Atmos. Chem. Phys. 2018, 18, 6353–6366. [Google Scholar] [CrossRef] [Green Version]
- Wei, W.; Wang, B.; Niu, X. Soil Erosion Reduction by Grain for Green Project in Desertification Areas of Northern China. Forests 2020, 11, 473. [Google Scholar] [CrossRef]
- Miller, R.L.; Knippertz, P.; García-Pando, C.P.; Perlwitz, J.P.; Tegen, I. Impact of Dust Radiative Forcing upon Climate. In Mineral Dust; Springer: Berlin/Heidelberg, Germany, 2014; pp. 327–357. [Google Scholar]
- Woodward, S.; Roberts, D.; Betts, R. A simulation of the effect of climate change–induced desertification on mineral dust aerosol. Geophys. Res. Lett. 2005, 32. [Google Scholar] [CrossRef]
- Mahowald, N.M. Anthropocene changes in desert area: Sensitivity to climate model predictions. Geophys. Res. Lett. 2007, 34. [Google Scholar] [CrossRef] [Green Version]
- Tegen, I.; Werner, M.; Harrison, S.; Kohfeld, K. Relative importance of climate and land use in determining present and future global soil dust emission. Geophys. Res. Lett. 2004, 31. [Google Scholar] [CrossRef] [Green Version]
- Yao, T.; Masson-Delmotte, V.; Gao, J.; Yu, W.; Yang, X.; Risi, C.; Sturm, C.; Werner, M.; Zhao, H.; He, Y. A review of climatic controls on δ18O in precipitation over the Tibetan Plateau: Observations and simulations. Rev. Geophys. 2013, 51, 525–548. [Google Scholar] [CrossRef]
- DeMott, P.J.; Prenni, A.J.; Liu, X.; Kreidenweis, S.M.; Petters, M.D.; Twohy, C.H.; Richardson, M.; Eidhammer, T.; Rogers, D. Predicting global atmospheric ice nuclei distributions and their impacts on climate. Proc. Natl. Acad. Sci. USA 2010, 107, 11217–11222. [Google Scholar] [CrossRef] [PubMed] [Green Version]
- Sagoo, N.; Storelvmo, T. Testing the sensitivity of past climates to the indirect effects of dust. Geophys. Res. Lett. 2017, 44, 5807–5817. [Google Scholar] [CrossRef] [Green Version]
- Bullard, J.E.; Baddock, M.; Bradwell, T.; Crusius, J.; Darlington, E.; Gaiero, D.; Gasso, S.; Gisladottir, G.; Hodgkins, R.; McCulloch, R. High-latitude dust in the Earth system. Rev. Geophys. 2016, 54, 447–485. [Google Scholar] [CrossRef] [Green Version]
- Feng, X.; Fu, B.; Piao, S.; Wang, S.; Ciais, P.; Zeng, Z.; Lü, Y.; Zeng, Y.; Li, Y.; Jiang, X. Revegetation in China’s Loess Plateau is approaching sustainable water resource limits. Nat. Clim. Chang. 2016, 6, 1019–1022. [Google Scholar] [CrossRef]
- Brandt, M.; Rasmussen, K.; Hiernaux, P.; Herrmann, S.; Tucker, C.J.; Tong, X.; Tian, F.; Mertz, O.; Kergoat, L.; Mbow, C. Reduction of tree cover in West African woodlands and promotion in semi-arid farmlands. Nat. Geosci. 2018, 11, 328–333. [Google Scholar] [CrossRef]
- Song, X.-P.; Hansen, M.C.; Stehman, S.V.; Potapov, P.V.; Tyukavina, A.; Vermote, E.F.; Townshend, J.R. Global land change from 1982 to 2016. Nature 2018, 560, 639–643. [Google Scholar] [CrossRef] [PubMed]
- Ginoux, P.; Chin, M.; Tegen, I.; Prospero, J.M.; Holben, B.; Dubovik, O.; Lin, S.J. Sources and distributions of dust aerosols simulated with the GOCART model. J. Geophys. Res. Atmos. 2001, 106, 20255–20273. [Google Scholar] [CrossRef]
- Song, Z.; Fu, D.; Zhang, X.; Wu, Y.; Xia, X.; He, J.; Han, X.; Zhang, R.; Che, H. Diurnal and seasonal variability of PM2. 5 and AOD in North China plain: Comparison of MERRA-2 products and ground measurements. Atmos. Environ. 2018, 191, 70–78. [Google Scholar] [CrossRef]


| Centre | 41° N, 99° E |
|---|---|
| Horizontal resolution | 60 km |
| Simulation area | 80 × 36 cells |
| Vertical sigma layers | 18 |
| Pressure at the top level | 60 hPa |
| Timestep | 120 s |
| Timestep for the land surface | 12 h |
| Timestep for the radiation | 30 min |
| Timestep for the chemical models | 600 s |
| Lateral Boundary conditions scheme Boundary layer scheme | Relaxation, exponential technique scheme UW PBL scheme |
| Cumulus cloud parameterization scheme | Hybrid convection scheme (the Grell scheme was used over land and the Emanuel scheme was used over the ocean) |
| Moisture scheme | Explicit moisture scheme |
| Ocean Flux scheme | Zeng scheme |
| Pressure gradient force scheme | Full fields scheme |
| Scenario | Scenario Context (Independent Variable) | Dependent Variable |
|---|---|---|
| A (2000 and 2015) | A1: Vegetation improvement and climate change A2: Vegetation improvement | Dust emission flux, DAOD, and burden |
| A3: Climate change | ||
| B (2000–2015) | B1: Dust aerosols | Temperature and vegetation |
| B2: Non-dust aerosols |
Publisher’s Note: MDPI stays neutral with regard to jurisdictional claims in published maps and institutional affiliations. |
© 2021 by the authors. Licensee MDPI, Basel, Switzerland. This article is an open access article distributed under the terms and conditions of the Creative Commons Attribution (CC BY) license (http://creativecommons.org/licenses/by/4.0/).
Share and Cite
Zhou, C.; Feng, X.; Huang, Y.; Wang, X.; Zhang, X. The Indirect Impact of Surface Vegetation Improvement on the Climate Response of Sand-Dust Events in Northern China. Atmosphere 2021, 12, 339. https://0-doi-org.brum.beds.ac.uk/10.3390/atmos12030339
Zhou C, Feng X, Huang Y, Wang X, Zhang X. The Indirect Impact of Surface Vegetation Improvement on the Climate Response of Sand-Dust Events in Northern China. Atmosphere. 2021; 12(3):339. https://0-doi-org.brum.beds.ac.uk/10.3390/atmos12030339
Chicago/Turabian StyleZhou, Chaowei, Xiaoming Feng, Yichu Huang, Xiaofeng Wang, and Xinrong Zhang. 2021. "The Indirect Impact of Surface Vegetation Improvement on the Climate Response of Sand-Dust Events in Northern China" Atmosphere 12, no. 3: 339. https://0-doi-org.brum.beds.ac.uk/10.3390/atmos12030339