Article

Severity-Mapped Vibrotactile Cues to Support Interruption Management with Weather Messaging in the General Aviation Cockpit

by
Carolina Rodriguez-Paras
*,
Johnathan T. McKenzie
,
Pasakorn Choterungruengkorn
and
Thomas K. Ferris
Department of Industrial and Systems Engineering, Texas A&M University, College Station, TX 77845, USA
*
Author to whom correspondence should be addressed.
Submission received: 8 February 2021 / Revised: 23 February 2021 / Accepted: 26 February 2021 / Published: 6 March 2021
(This article belongs to the Special Issue Weather and Aviation Safety)

Abstract

:
Despite the increasing availability of technologies that provide access to aviation weather information in the cockpit, weather remains a prominent contributor to general aviation (GA) accidents. Pilots fail to detect the presence of new weather information, misinterpret it, or otherwise fail to act appropriately on it. When cognitive demands imposed by concurrent flight tasks are high, the risks increase for each of these failure modes. Previous research shows how introducing vibrotactile cues can help ease or redistribute some of these demands, but there is untapped potential in exploring how vibratory cues can facilitate “interruption management”, i.e., fitting the processing of available weather information into flight task workflow. In the current study, GA pilots flew a mountainous terrain scenario in a flight training device while receiving, processing, and acting on various weather information messages that were displayed visually, in graphical and text formats, on an experimental weather display. Half of the participants additionally received vibrotactile cues via a connected smartwatch with patterns that conveyed the “severity” of the message, allowing pilots to make informed decisions about when to fully attend to and process the message. Results indicate that weather messages were acknowledged more often and faster when accompanied by the vibrotactile cues, but the time after acknowledgment to fully process the messages was not significantly affected by vibrotactile cuing, nor was overall situation awareness. These findings illustrate that severity-encoded vibrotactile cues can support pilot awareness of updated weather as well as task management in processing weather messages while managing concurrent flight demands.

1. Introduction

Despite the increasing availability and affordability of technologies that enable general aviation (GA) pilots to receive weather information in the cockpit [1,2], weather remains a primary factor contributing to many fatal GA accidents in the US and abroad [3]. Weather conditions can change unexpectedly, and most GA weather-related accidents occur when pilots inadvertently transition from visual flight rules (VFR) into instrument meteorological conditions (IMC) [3], which can result in spatial disorientation and increased risk of losing aircraft control [4]. There are a number of potential reasons why increased access to weather information fails to improve weather-related flight decision-making.
One potential reason for the continued problems in processing weather may be that these technologies introduce too much information, or at least too much in a particular format [2]. “Data overload” problems such as these are often the target of human factors research [5,6], describing when the cognitive resources have been exceeded by the information processing demands. Additionally, pilots may not be aware of the availability of new weather information, having failed to be alerted via the technologies; they could receive but misinterpret the information, or they could process the information fully yet not apply the information appropriately to decisions regarding the flight plan [1,3,7]. Whether the systems fail because there is “too much information” displayed and the most immediately relevant information is hidden amongst less-relevant clutter [2] because of human attentional limitations, or because of factors more relevant to human decision making, there is a need to understand how pilots currently use these technologies as well as other weather information sources in the cockpit. Thus, there is a need to understand how pilots integrate weather information seeking and decision making into their workflow under various flight contexts.
Per regulations, GA pilots should obtain and process weather information during preflight planning before take-off [8]. However, because of the proliferation of in-cockpit technologies that can provide weather information in-flight, some pilots may instead wait until after taking off to thoroughly assess weather conditions and, if necessary, adapt their flight plan accordingly [9].
While historically, official weather reports have been communicated auditorily over radio (broadcast from a particular radio channel or relayed via air traffic control (ATC) communication), the ability to display this information in a graphical interface offers new advantages. Regions of relevance can be more easily identified when linked to a dynamic map, and the weather messages can also be relayed in a persistent text format which allows them to be read (and reviewed) whenever it is convenient for the pilot’s workflow.
Current weather technologies include integrated cockpit systems and, increasingly, portable devices that can be carried into the cockpit. Common equipment such as Automatic Dependent Surveillance-Broadcast (ADS-B) receivers, GPS systems, and commercial smartphone or tablet apps such as Foreflight or Garmin Pilot are capable of receiving and displaying weather-related information to pilots in-flight [10]. These devices compile official aviation weather service reports from the National Weather Service (NWS), Federal Aviation Administration (FAA), and the Department of Defense (DoD) [11]—see examples of these reports in Table 1—and some can also integrate other less formal sources of weather information (such as Doppler Weather Radar).
Given that current cockpit technologies support communicating weather messages in multiple media formats (e.g., visual and/or auditory), there is an opportunity to further support pilots’ interruption management by spreading some aspects of the messaging to information processing channels that are more “available” for the pilot, given the demands of concurrent flight tasks [12], such as tactile. For example, pilots can listen to auditory representations of the messages when visual demands of flight tasks are high, and/or can display a message as visual text, which can often be faster to process and allows the message to be persistent (rather than the transient nature of the auditory communication). Persistent visual displays can be sampled as part of pilots’ scan patterns, reducing the demand on working memory resources by providing an easy means of referencing specific details in the message.
While in flight, pilots can be challenged at times to fit the tasks of monitoring routine weather reports (e.g., Aerodrome Routine Meteorological Reports (METARs)) as well as processing any unscheduled weather messages (e.g., Significant Meteorological Information (SIGMET)) into their workflow while concurrently performing other flight-related tasks. Under normal flight conditions, there is flexibility in when and how pilots attend to these incoming messages. For example, pilots can choose to listen to continuously looped recordings of routine reports by tuning to a particular radio channel and can call ATC to read out or clarify any unscheduled messages. This flexibility supports some degree of pilot “interruption management”, an important concept to consider in aviation human factors [7,13,14] and a topic of research in a variety of work domains that require humans to divide attention and information-processing resources among multiple tasks that overlap in time [15,16,17,18].
Especially when adverse weather develops, a pilot’s cognitive resources will be in high demand for other flight tasks (e.g., aviating, navigating, and communicating). Therefore, it is critical that weather messages be announced with salient cues that reliably capture attention even when visual and auditory resources are engaged in other flight tasks [19]. However, capturing attention does not always support effective interruption management, as it can result in an automatic reorientation of pilots’ cognitive resources when reorientation may not be warranted. This can be detrimental to overall flight safety if other, more safety-critical ongoing tasks are interrupted. In this way, having a bright and colorful (thus highly salient) graphical display of weather information in a prominent cockpit location can inappropriately draw attention and even lead to attentional tunneling, in which pilots attend increasingly to the graphical representation at the cost of normal instrument scanning and outside-the-cockpit visual references, leading to a reduction in flight situational awareness [20]. Under the higher levels of cognitive workload that pilots can experience in adverse weather, scan patterns are often more rapid and irregular [21,22], which increases the chances for pilot error [23]. Thus, it is important to consider non-visual means of announcing the availability of new weather information so that pilots are aware of the message and can process it fully when flight-related workload and workflow allow.
Aviation, much like a number of visually, auditorily, and cognitively demanding domains, can benefit from offloading some of the more heavily demanded resources by redistributing messages so they can be processed by relatively available perceptual and cognitive channels [12,24]. The sense of touch represents an underutilized display channel in the cockpit, and according to human information processing theory [12], engaging this channel can improve multitasking performance when visual and/or auditory resources are in high demand for concurrent tasks [5,24]. Previous research has investigated how these so-called “tactile” displays might be introduced into the cockpit to improve spatial awareness [25,26], improve awareness of cockpit automation behavior [27], and to guide attention to visual cockpit displays [28]. An example of a haptic display integrated into the cockpit is the “stick shaker” that warns pilots of impending stall conditions. Tippey et al. [29] were the first to evaluate how vibratory cues presented via smartwatches could be used to improve GA pilots’ reception of new weather messages, showing better detection and faster responses to these messages on a visual display when they were announced by a vibratory cue.
One key limitation of the Tippey et al. [29] study was that the vibratory cues were salient—thus effectively capturing attention—but the vibration patterns that mapped to the different types of weather messages were not easily distinguishable due, in part, to the hardware limitations of the smartwatch chosen for that study. An interesting finding was that the vibration patterns were less distinguishable when pilots experienced higher cognitive workload related to flight tasks [29]. This led to pilots reliably receiving weather messages, but because interruption management was not well supported (pilots were not able make informed decisions about whether and when to shift attention to the incoming message), concurrent task processing could be disrupted and overall flight safety may be impacted negatively [29].
To improve upon the Tippey et al. [29] study, efforts were made in the current study to meaningfully encode the “severity” of an incoming weather message—partial information that can be used to inform whether and when to reorient attention to process the full message—into dimensions of a vibrotactile cue that is highly distinguishable and intuitively interpretable. Previous research has shown how vibrotactile displays can support interruption management by conveying task-relevant information via vibrotactile patterns that require minimal cognitive engagement to interpret [5,16].
Following the design requirements of creating a set of vibratory signals that are maximally distinguishable and identifiable under varied workload, Roady [30] conducted a series of studies with vibratory cues which were varied according to signal intensity (low, medium, and high gain), frequency, rhythmicity (straight cadence vs. syncopation), and dynamism (“melodic” vibration patterns that changed constantly with time vs. those with relatively static levels in vibratory display dimensions). A very large set of generated patterns was evaluated in a controlled experiment that manipulated the imposed workload in an aviation-like task environment (NASA’s Multi-Attribute Task Battery; [31]), ultimately resulting in the final selection of three patterns that maximized “perceptual distance” and were identifiable as low, moderate, or high severity with high accuracy [30].
The current study applied the vibratory patterns designed in Roady [30] to a considerably more complex flight environment, testing the effectiveness of cues presented via a smartwatch for supporting pilot interruption management in the reception and processing of weather messages. The evaluation context was a flight scenario that imposed a range of workloads from very low to very high as weather and visibility degraded over the course of the flight. Pilots that received the vibratory cues paired with incoming weather messages had the opportunity to infer the severity of the message by the encoded vibratory pattern and to use that information in their decision making about whether and when to reorient attention and information processing resources to process the full message. It was expected that the pilots who received these vibratory cues would be more likely to receive and faster to acknowledge the arrival of the message, but that the time to process the full message would depend on the scenario-imposed task load relative to the interpreted severity. For example, a message that is announced with a vibratory cue conveying “moderate” severity may be processed immediately (or faster) when other flight-related demands are low, but may appropriately show longer response times when flight task demands are high.
The findings of this study provide further evidence of the benefits of integrating vibrotactile cues to support multitasking performance and safety in visually and/or auditorily demanding work contexts. Aviation is a domain that has historically welcomed haptic and tactile displays (the “stick shaker” stall warning is a great example), and the introduction of vibrotactile cues that can be reliably interpreted and differentiated can lead to further improvements in flight safety by better supporting flight management when encountering adverse weather.

2. Experiment

Thirty-six general aviation pilots participated in the study (TAMU IRB approval # 2014-0154D), which took place in a flight training device at the Federal Aviation Administration (FAA) William J. Hughes Technical Center (WJHTC) in Atlantic City, NJ. Participants were at least 18 years old, held an active Private Pilot License (PPL), and had flown in the previous 6 months. The reported mean age for 32 of the participants (4 participants’ biographical data were missing) was 54.2 years old (min = 19 years, max = 80 years, standard deviation = 16.9 years). The pilots had varying levels of flight experience, with a mean of 1102.56 flight hours (min = 100, max = 5500, median = 600, standard deviation = 1253.68 h). They also had a mean of 87.7 instrument flight hours (min = 0, max = 500, median = 20, standard deviation = 136.6 h).
This research investigated the effectiveness of severity-mapped vibratory cues delivered via a smartwatch to improve pilots’ acknowledgement and response to weather messages in a simulated flight scenario. Additionally, situation awareness was assessed via periodic question probes to determine the extent to which cues may have distracted or disrupted concurrent flight-related activities.

2.1. Experimental Variables

The primary independent variable investigated was whether or not vibratory cues accompanied the incoming weather messages. This variable was handled as a between-subjects factor, with participants divided into “Vibration” (which received coded vibratory cues with each weather message (WM) arrival—see Section 2.3) and “No Vibration” groups, each with 18 participants.
In this study, pilots’ performance data were collected with regard to reception of weather messages, decision making, and situation awareness. Dependent measures were associated with the presentation of coded weather messages (WMs) (see Section 2.3 for more information on these messages) and Situation Awareness Probes (SAPs).
The variable Acknowledgment Rate (AR) represented the proportion of presented cues that participants “acknowledged”, which was evidenced either by verbal response (e.g., “I see that I have a new weather message”) or by another observed action that followed directly from that message (such as pressing a button to read the message text or calling air traffic control for clarification). The AR variable was calculated separately for WMs and SAPs, coded as Weather Message Acknowledgment Rate (WM.AR) and Situation Awareness Probe Acknowledgment Rate (SAP.AR), respectively. In the small number of cases in which flight-related decisions led to the scenarios ending early (e.g., calling air traffic control (ATC) and requesting changes to the flight plan, such as turning around or diverting to another destination), some late-scenario WMs and SAPs were never issued to the pilots and thus not considered in the AR calculations.
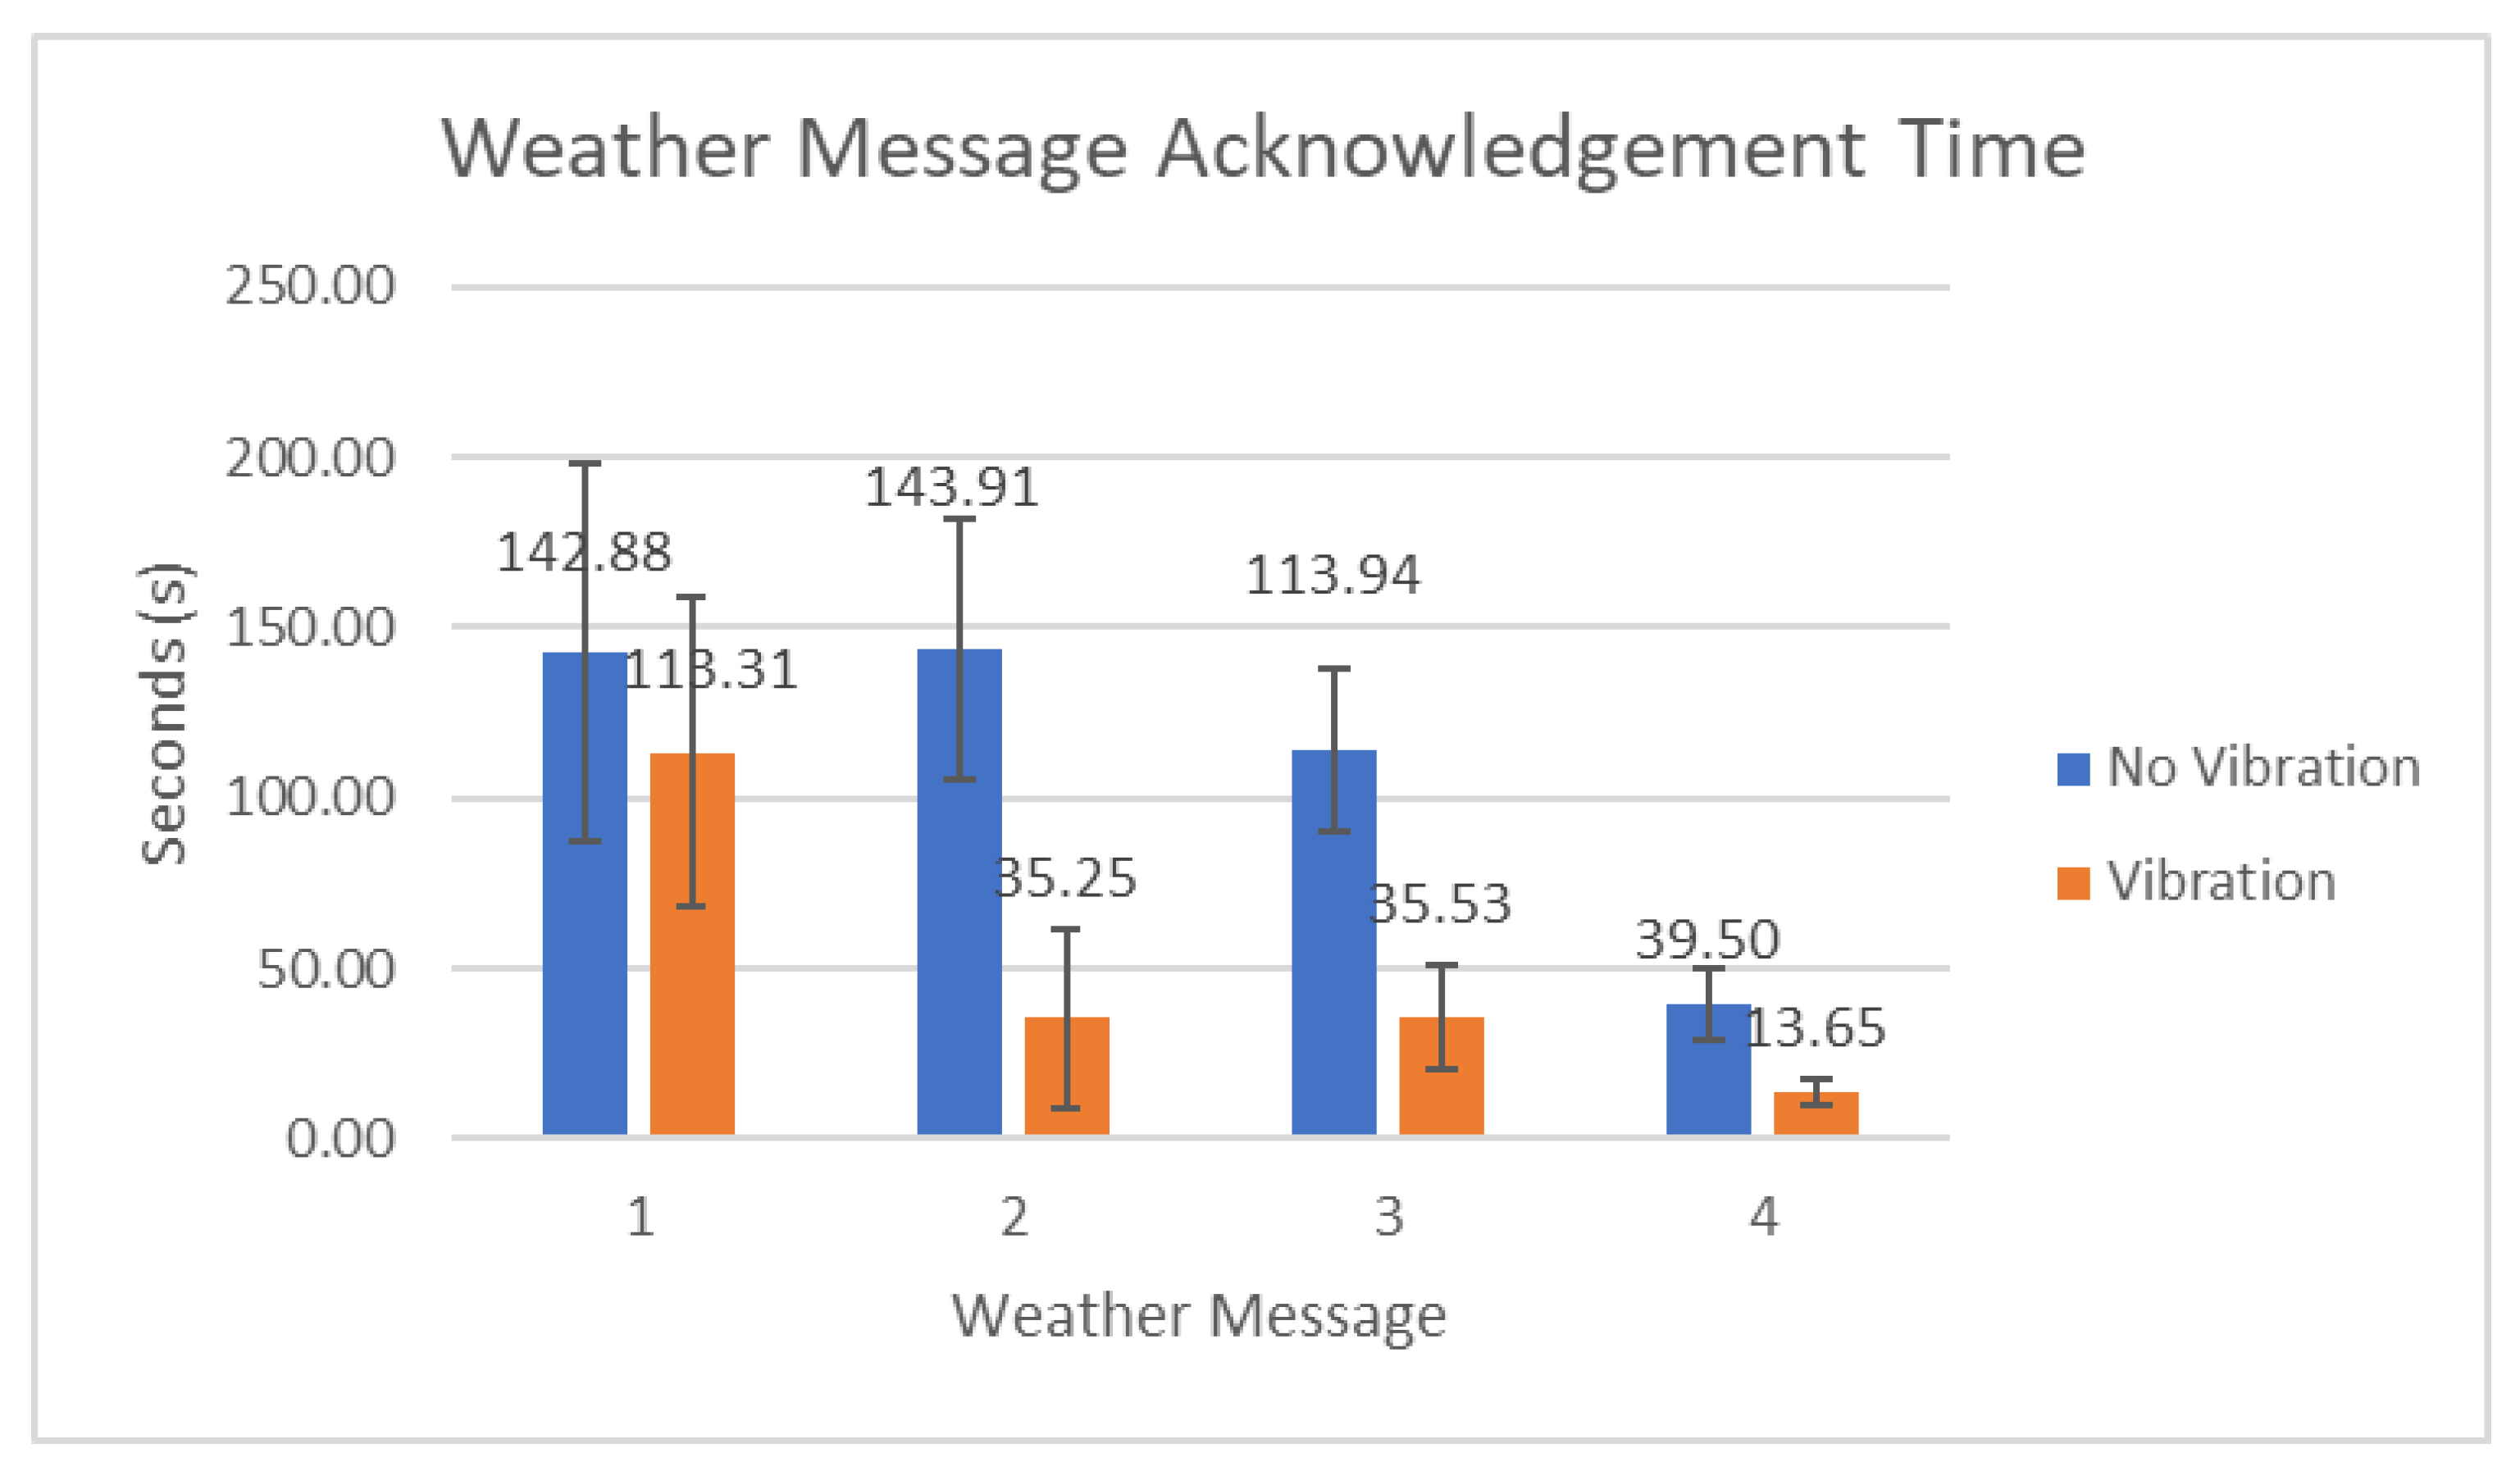
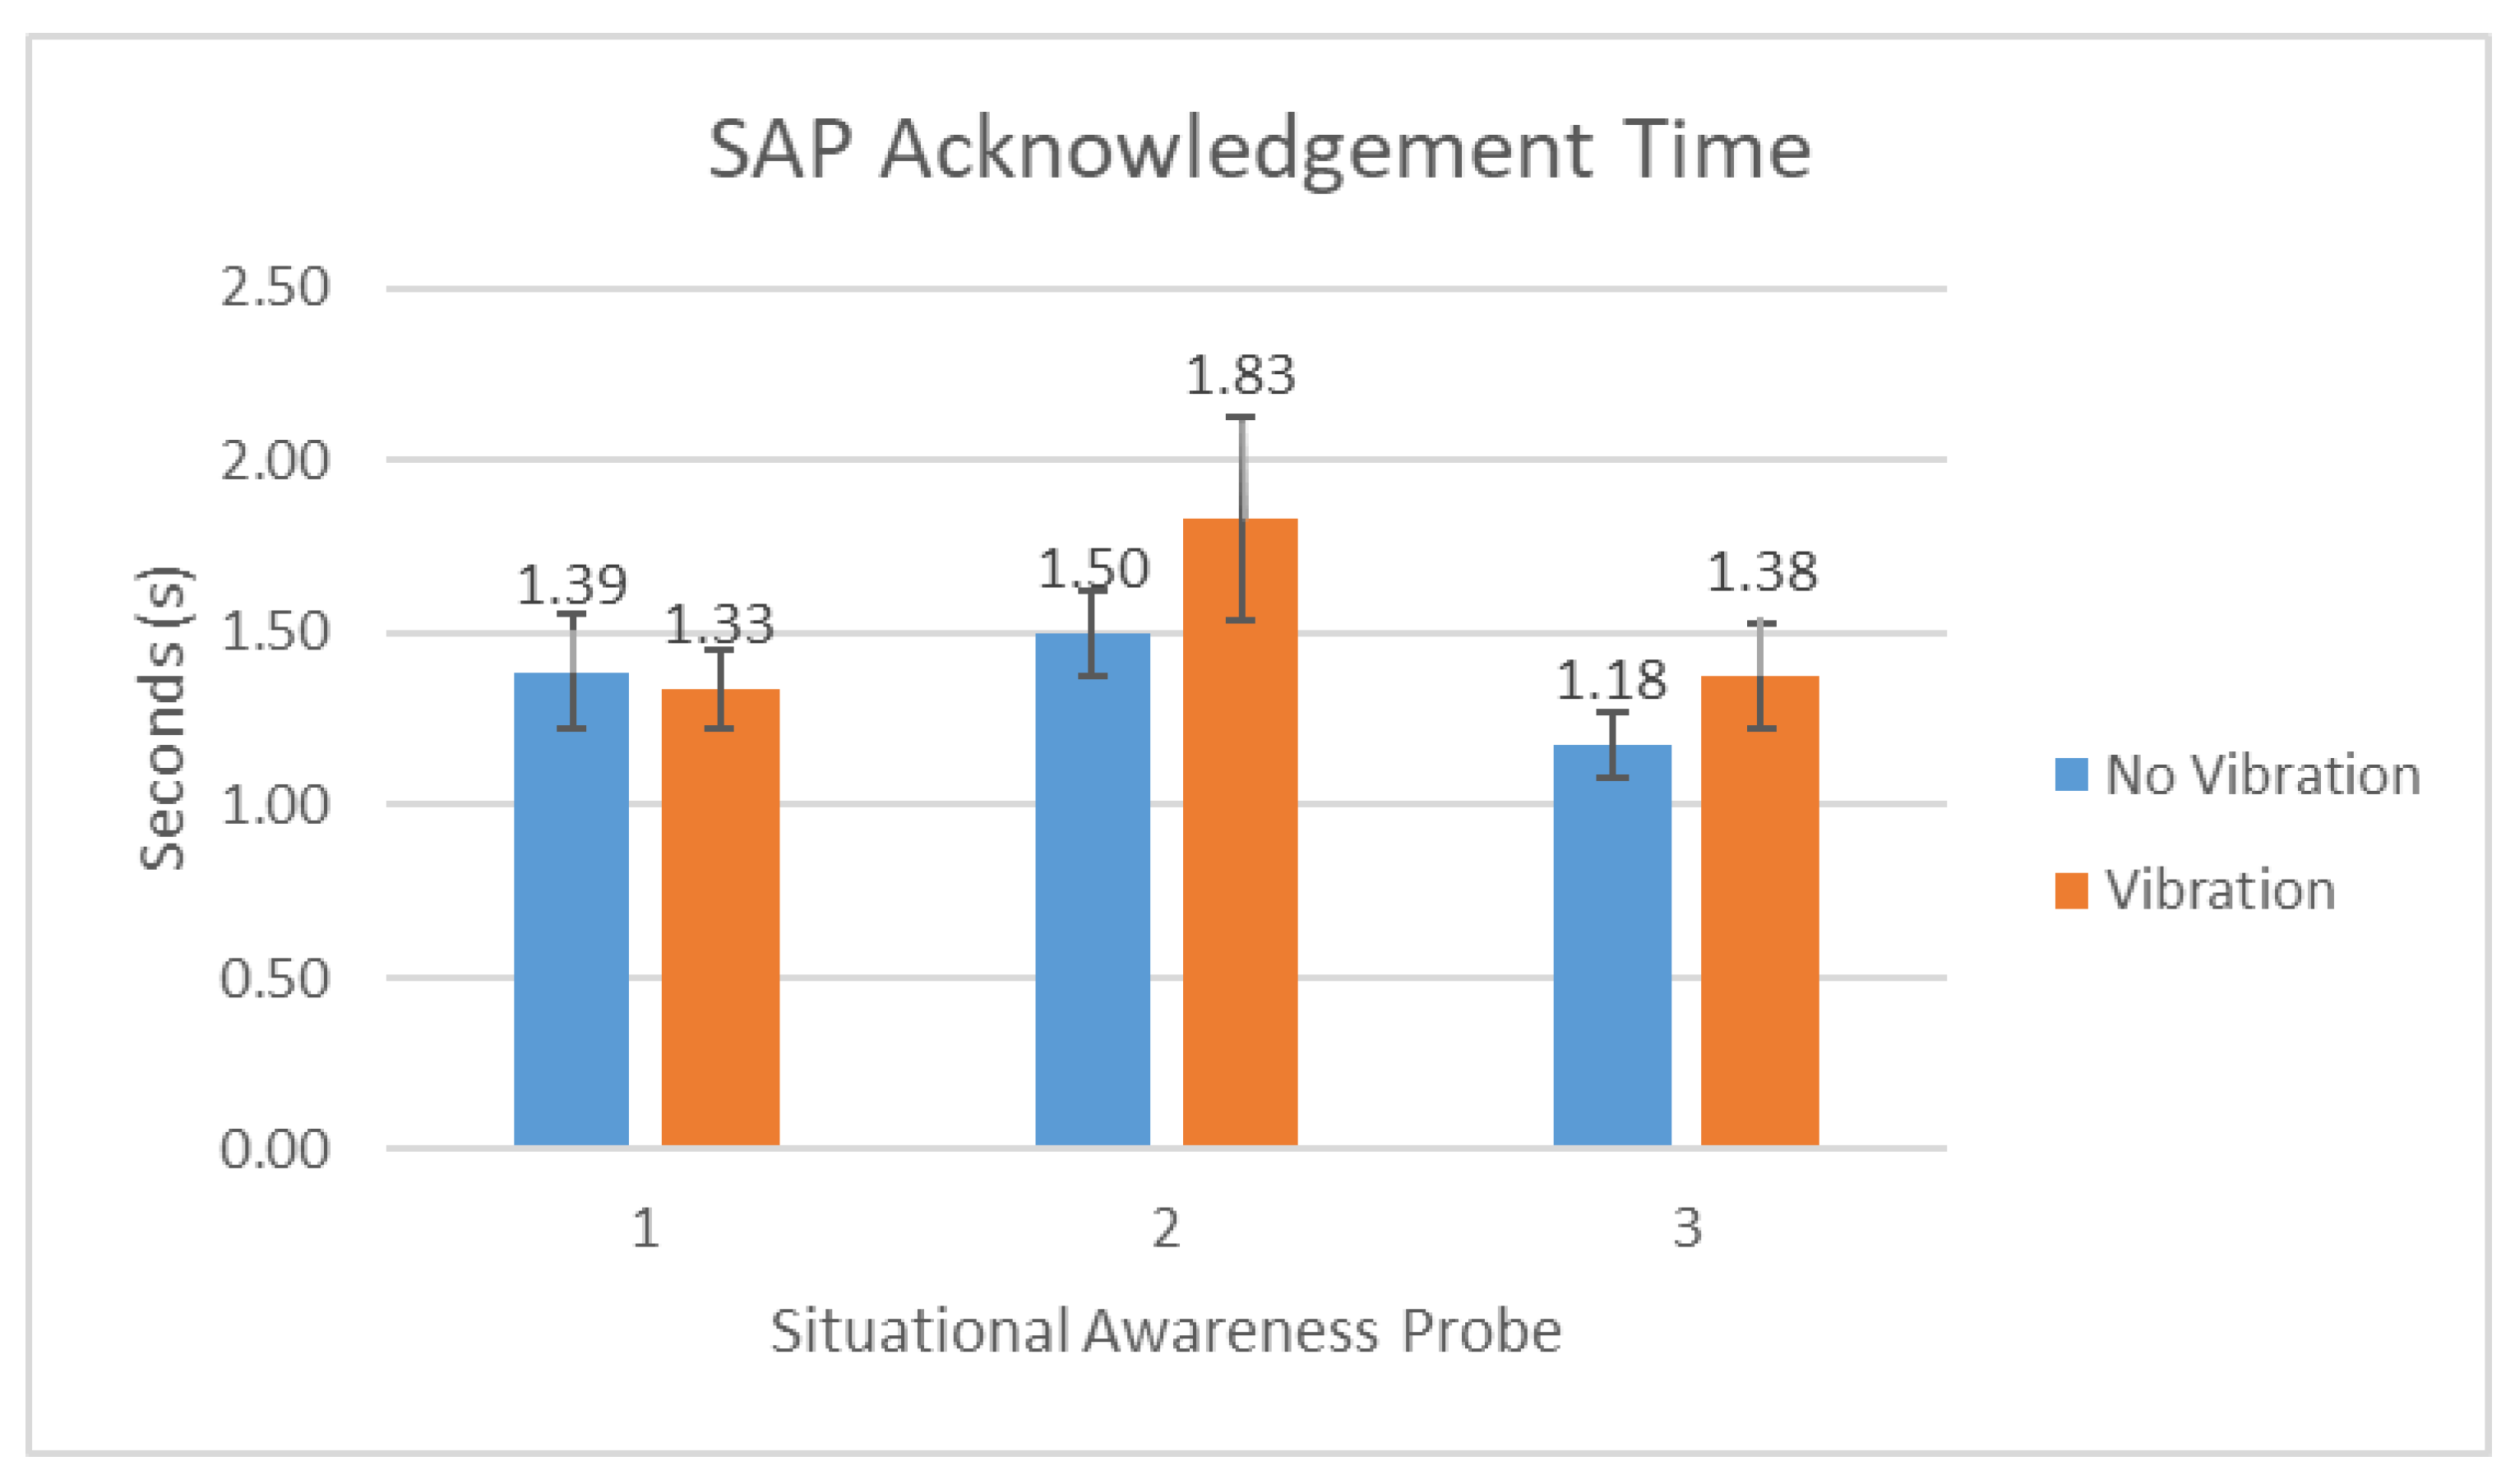
Acknowledgment Times (ATs) were also collected for both WMs and SAPs, coded as Weather Message Acknowledgement Time (WM.AT) and Situation Awareness Probe Acknowledgment Time (SAP.AT), respectively. WM.AT was measured as the time between the arrival of the message (whether cued or not) and the first verbal or physical indication that showed the pilot’s awareness of the message. SAP.AT was measured as the time between the complete delivery of an SAP query (e.g., the final utterance in the request from ATC that represented the probe) until the first verbal or physical indication of the pilot’s acknowledgement of that SAP query. The AT measure is indicative of pilots’ attentional state and the salience and informativeness of the visual and vibratory cues associated with WMs, as well as the auditory (radio-based) cues associated with SAPs.
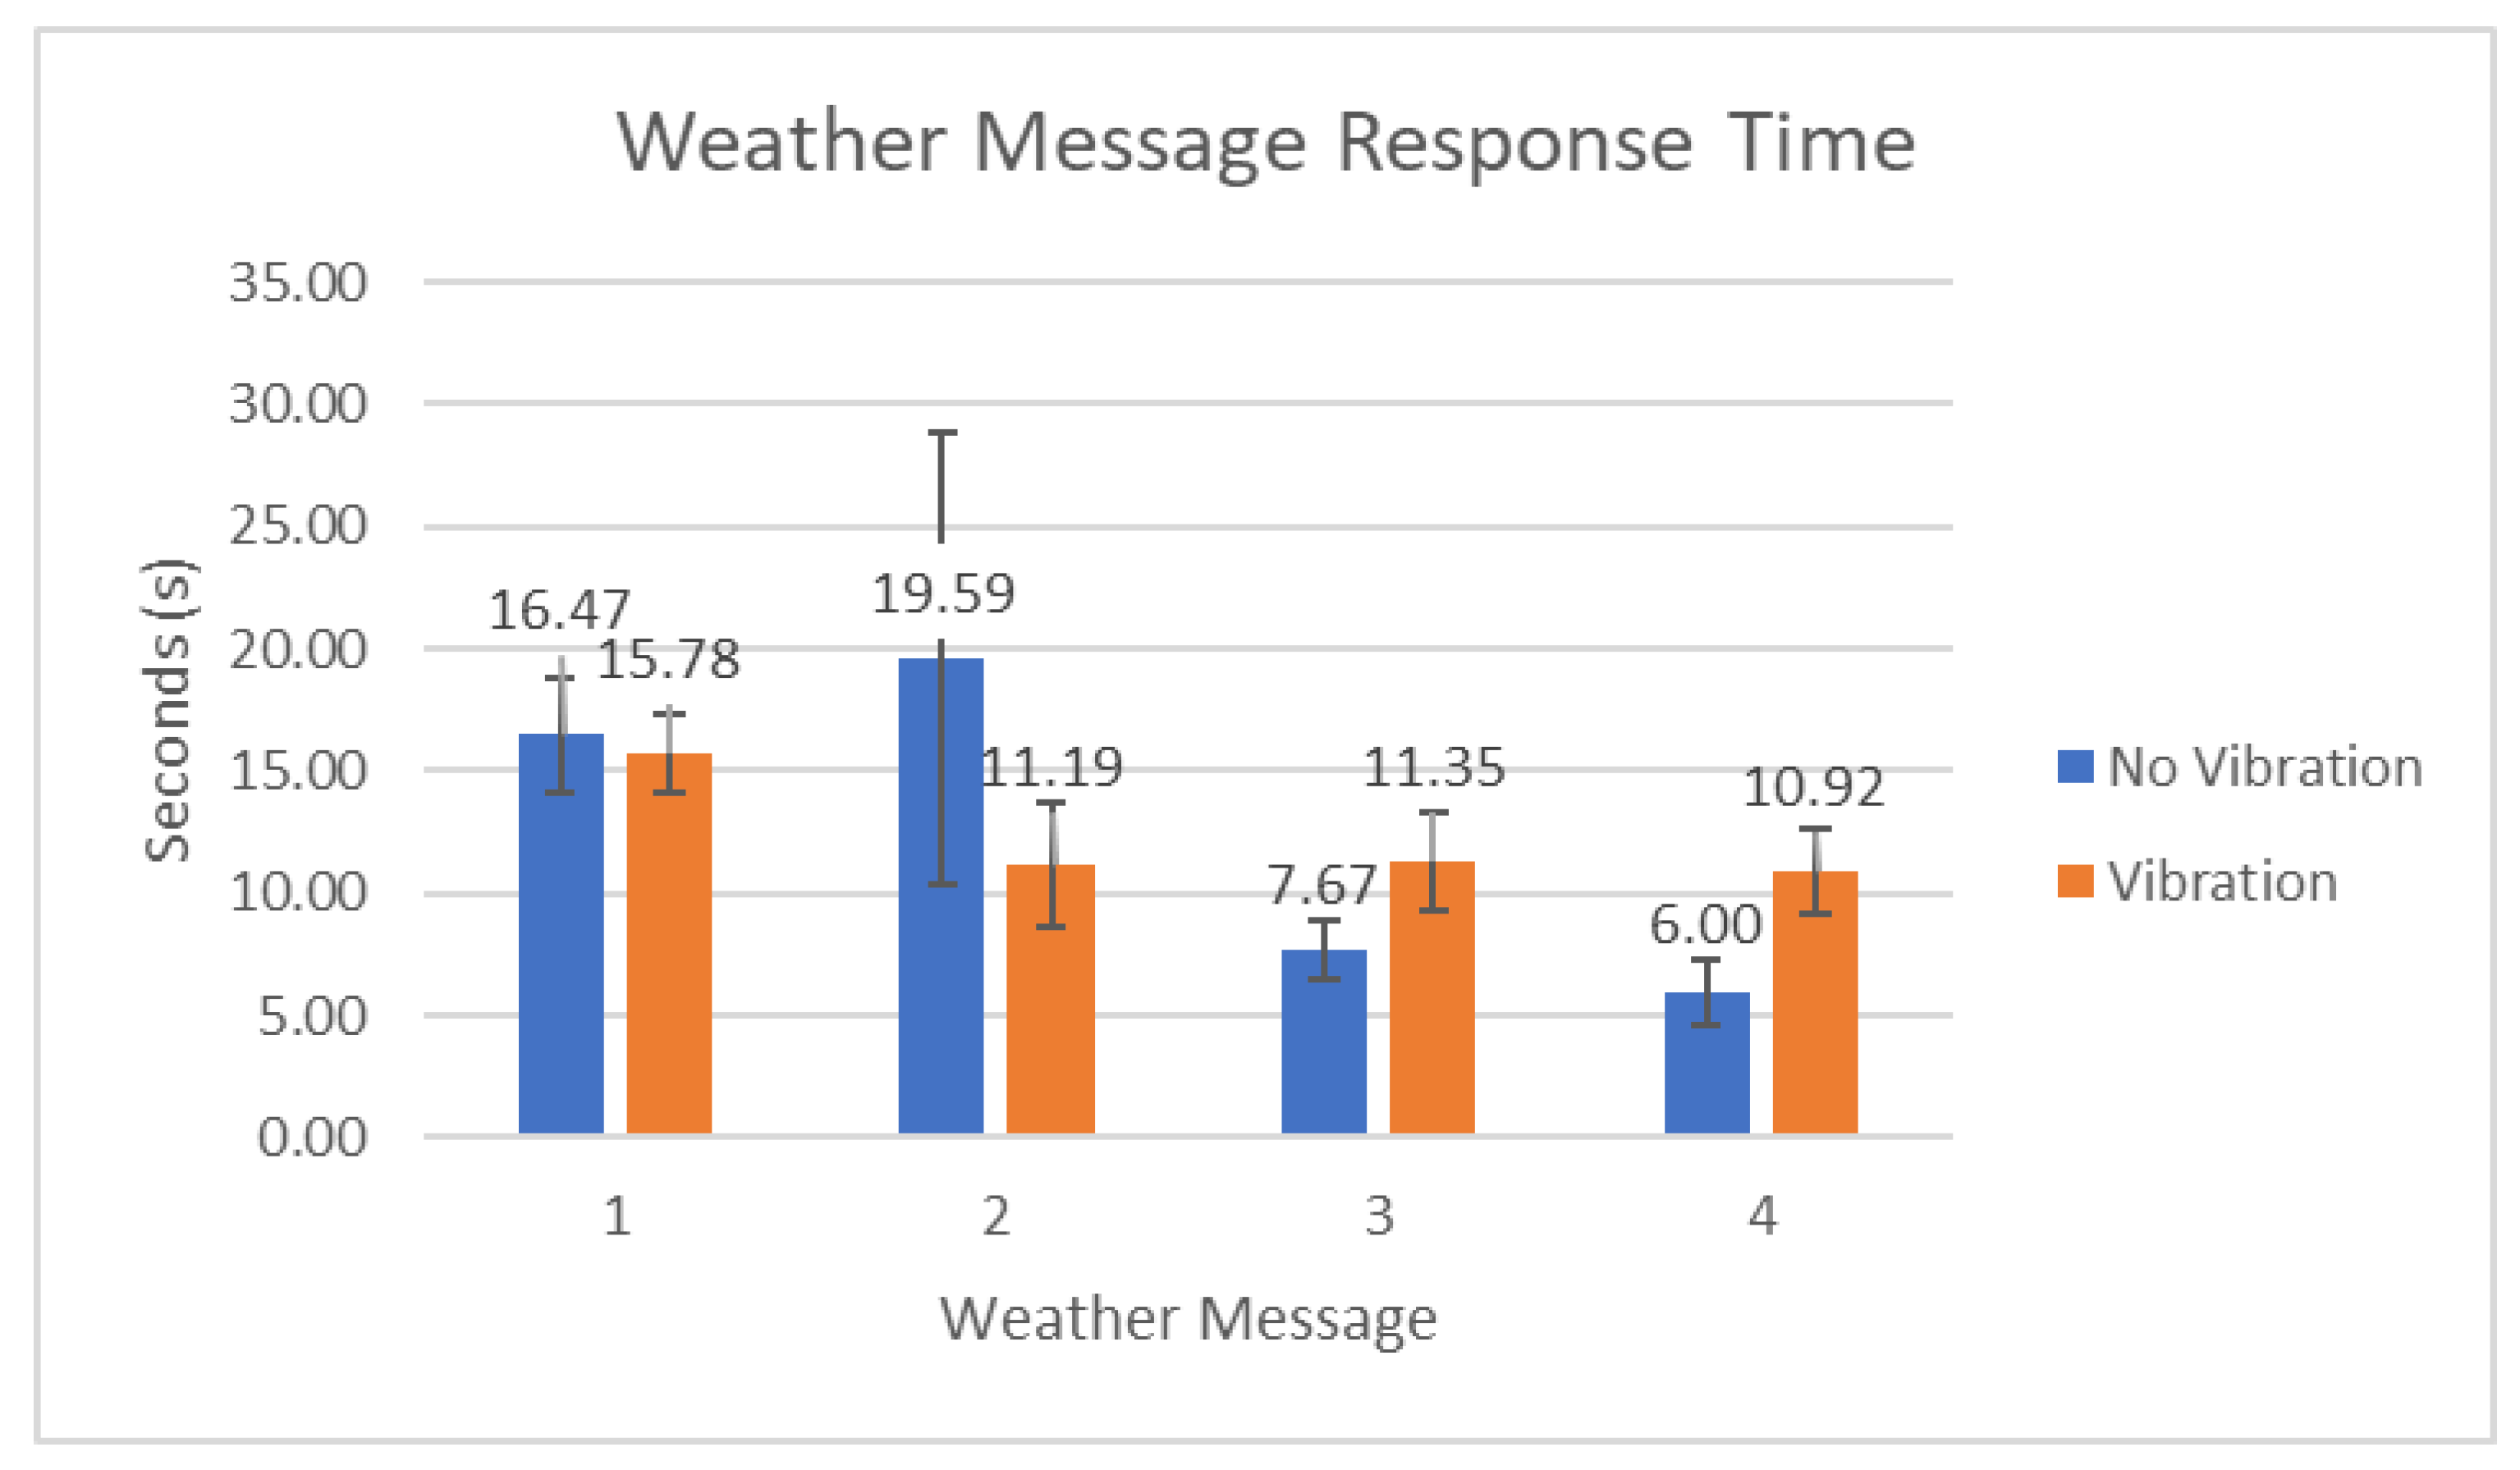
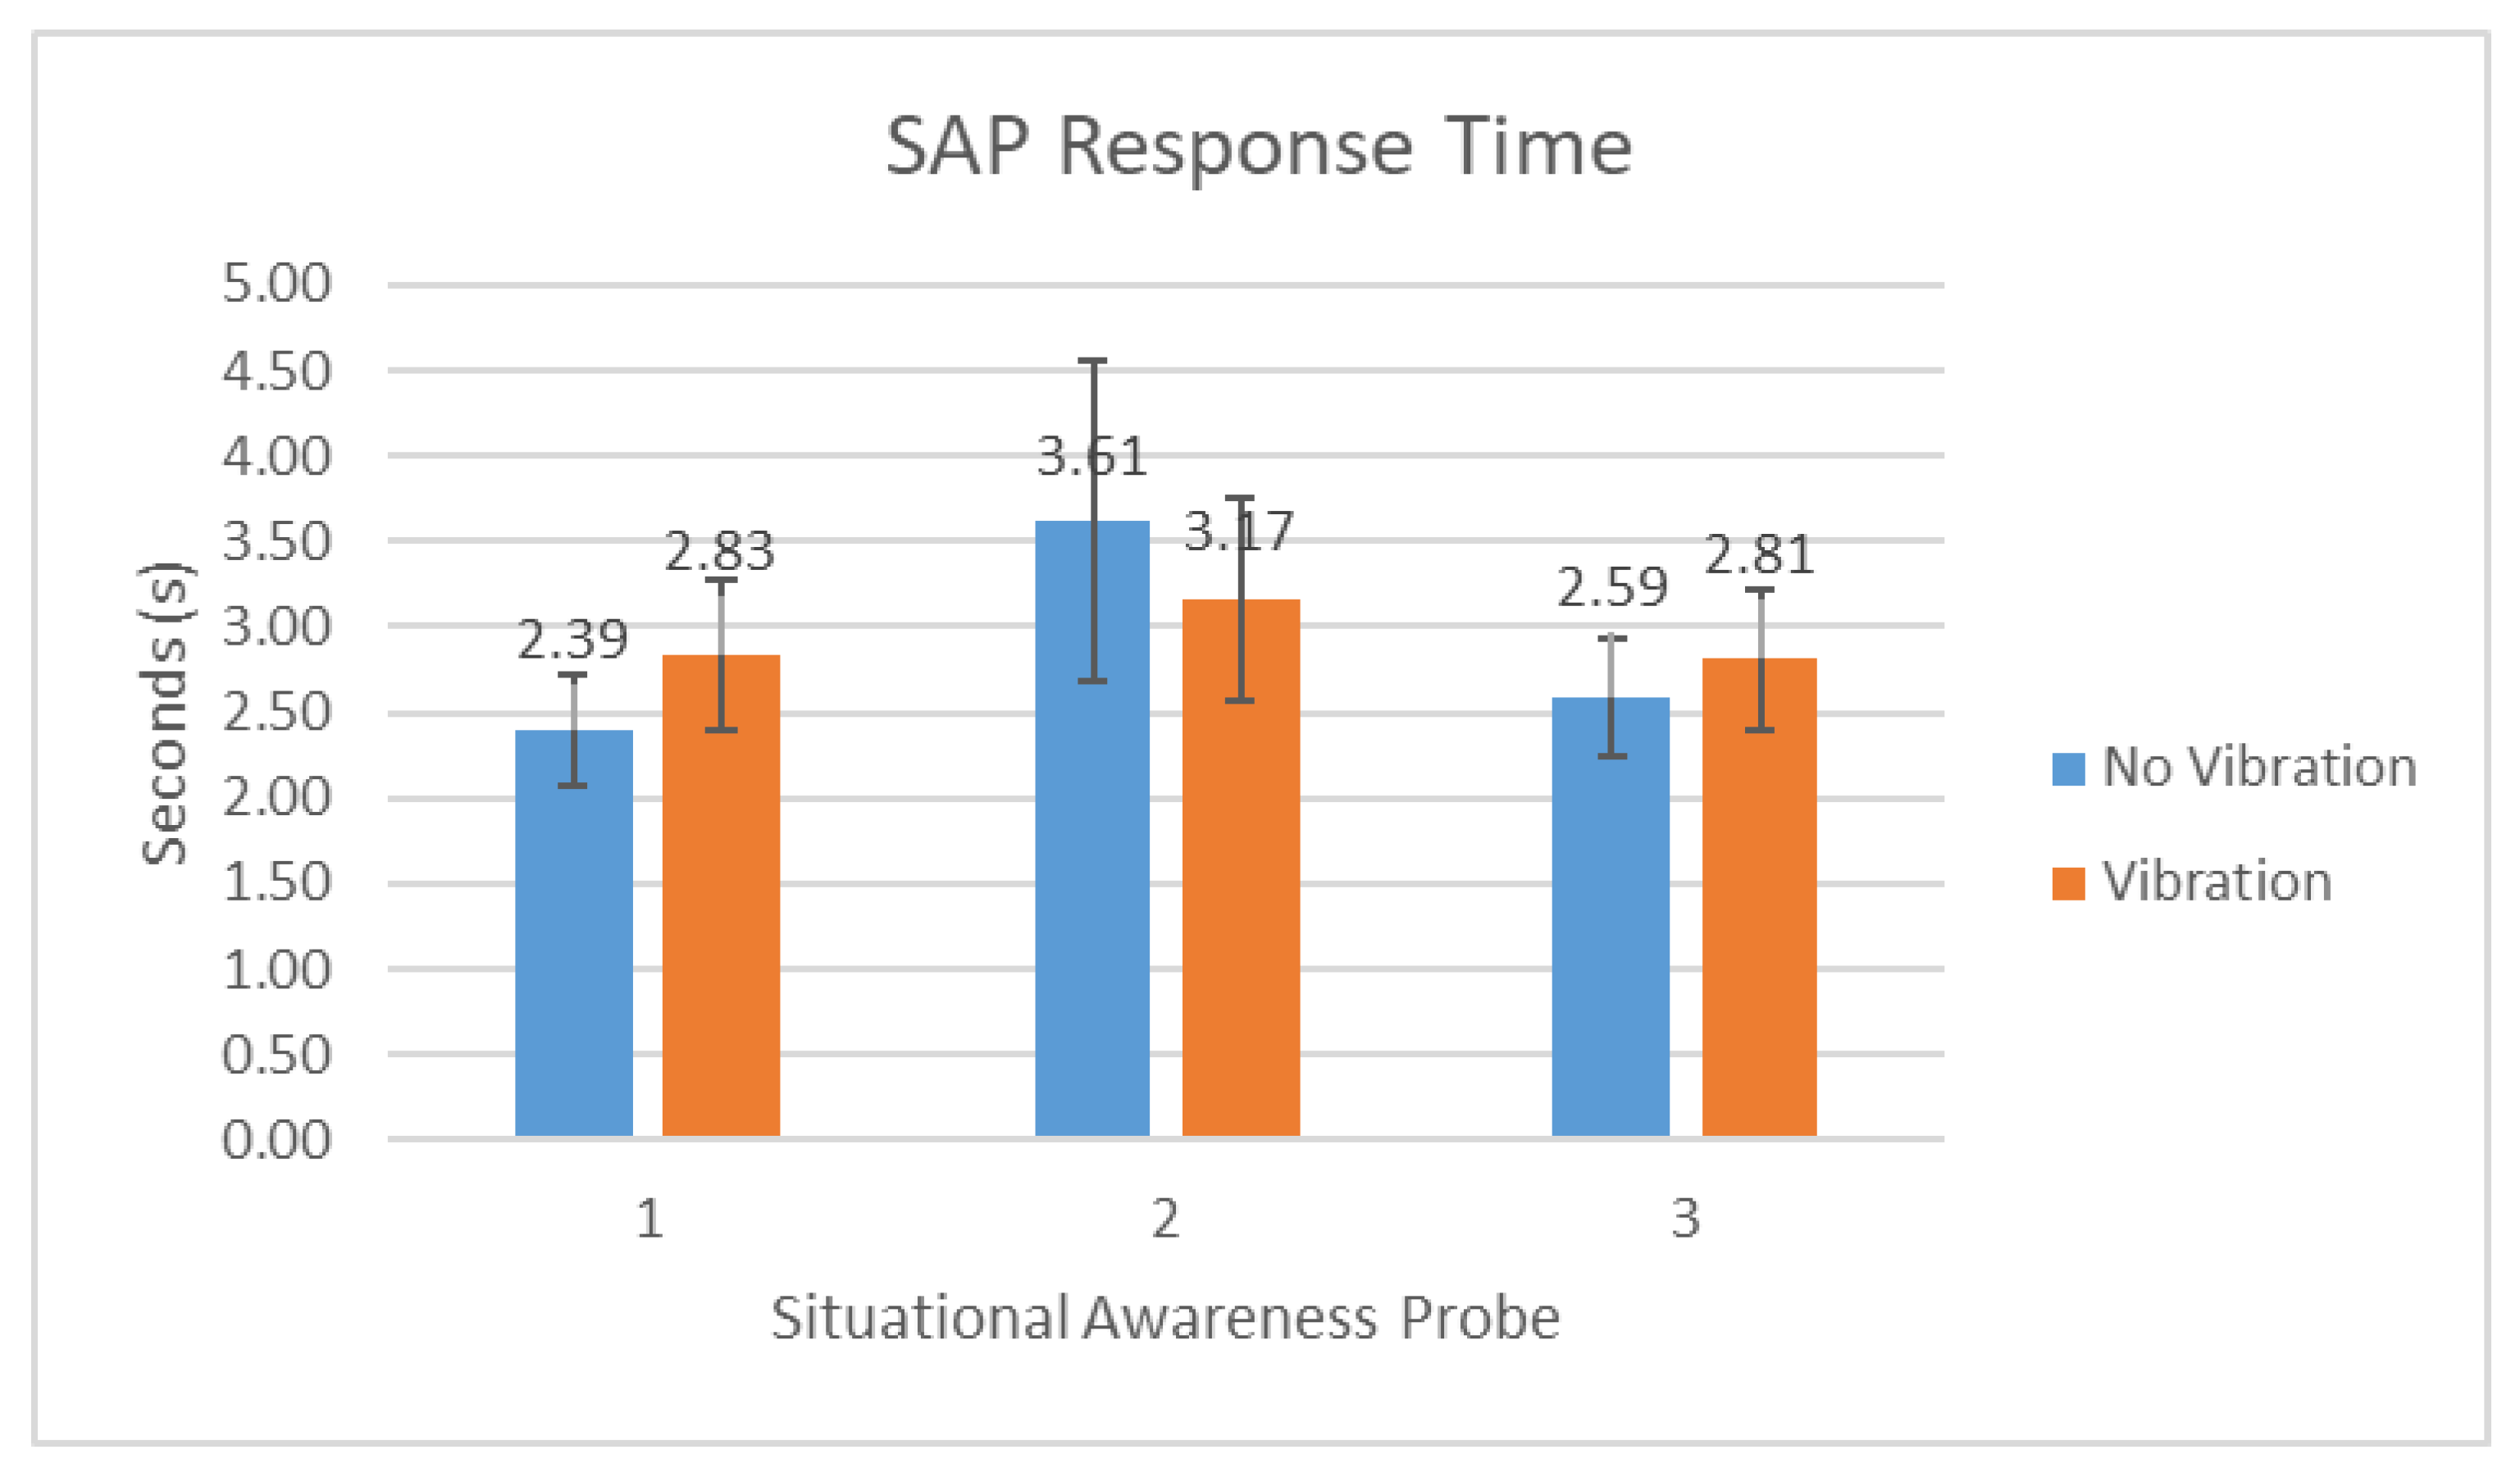
Response Times (RTs) for both WMs and SAPs, coded as Weather Message Response Time (WM.RT) and Situation Awareness Probe Response Time (SAP.RT), respectively, were measured as the time between the point of acknowledgement until the pilot’s full response had been delivered. The point of “full response” was determined via consensus coding by multiple experimenters and represented when pilots had verbally (via think-aloud protocol; see Section 2.4) or demonstrably (through aircraft interaction) responded to the message. This measure is indicative of pilots’ abilities in interruption management, balancing the task load between activities for maintaining safe flight and dedicating resources to processing WMs and SAP queries.
In some cases, the pilots never acknowledged one or more weather messages that were presented to them, as is indicated in the WM.AR measure. As a result, these in-stances were treated as missing data points and did not factor into the mean calculations of WM.AT and WM.RT. The impact that the WM.AR has on the mean WM.AT and mean WM.RT should be kept in mind when interpreting these latter measures.

2.2. Flight Environment and Scenario

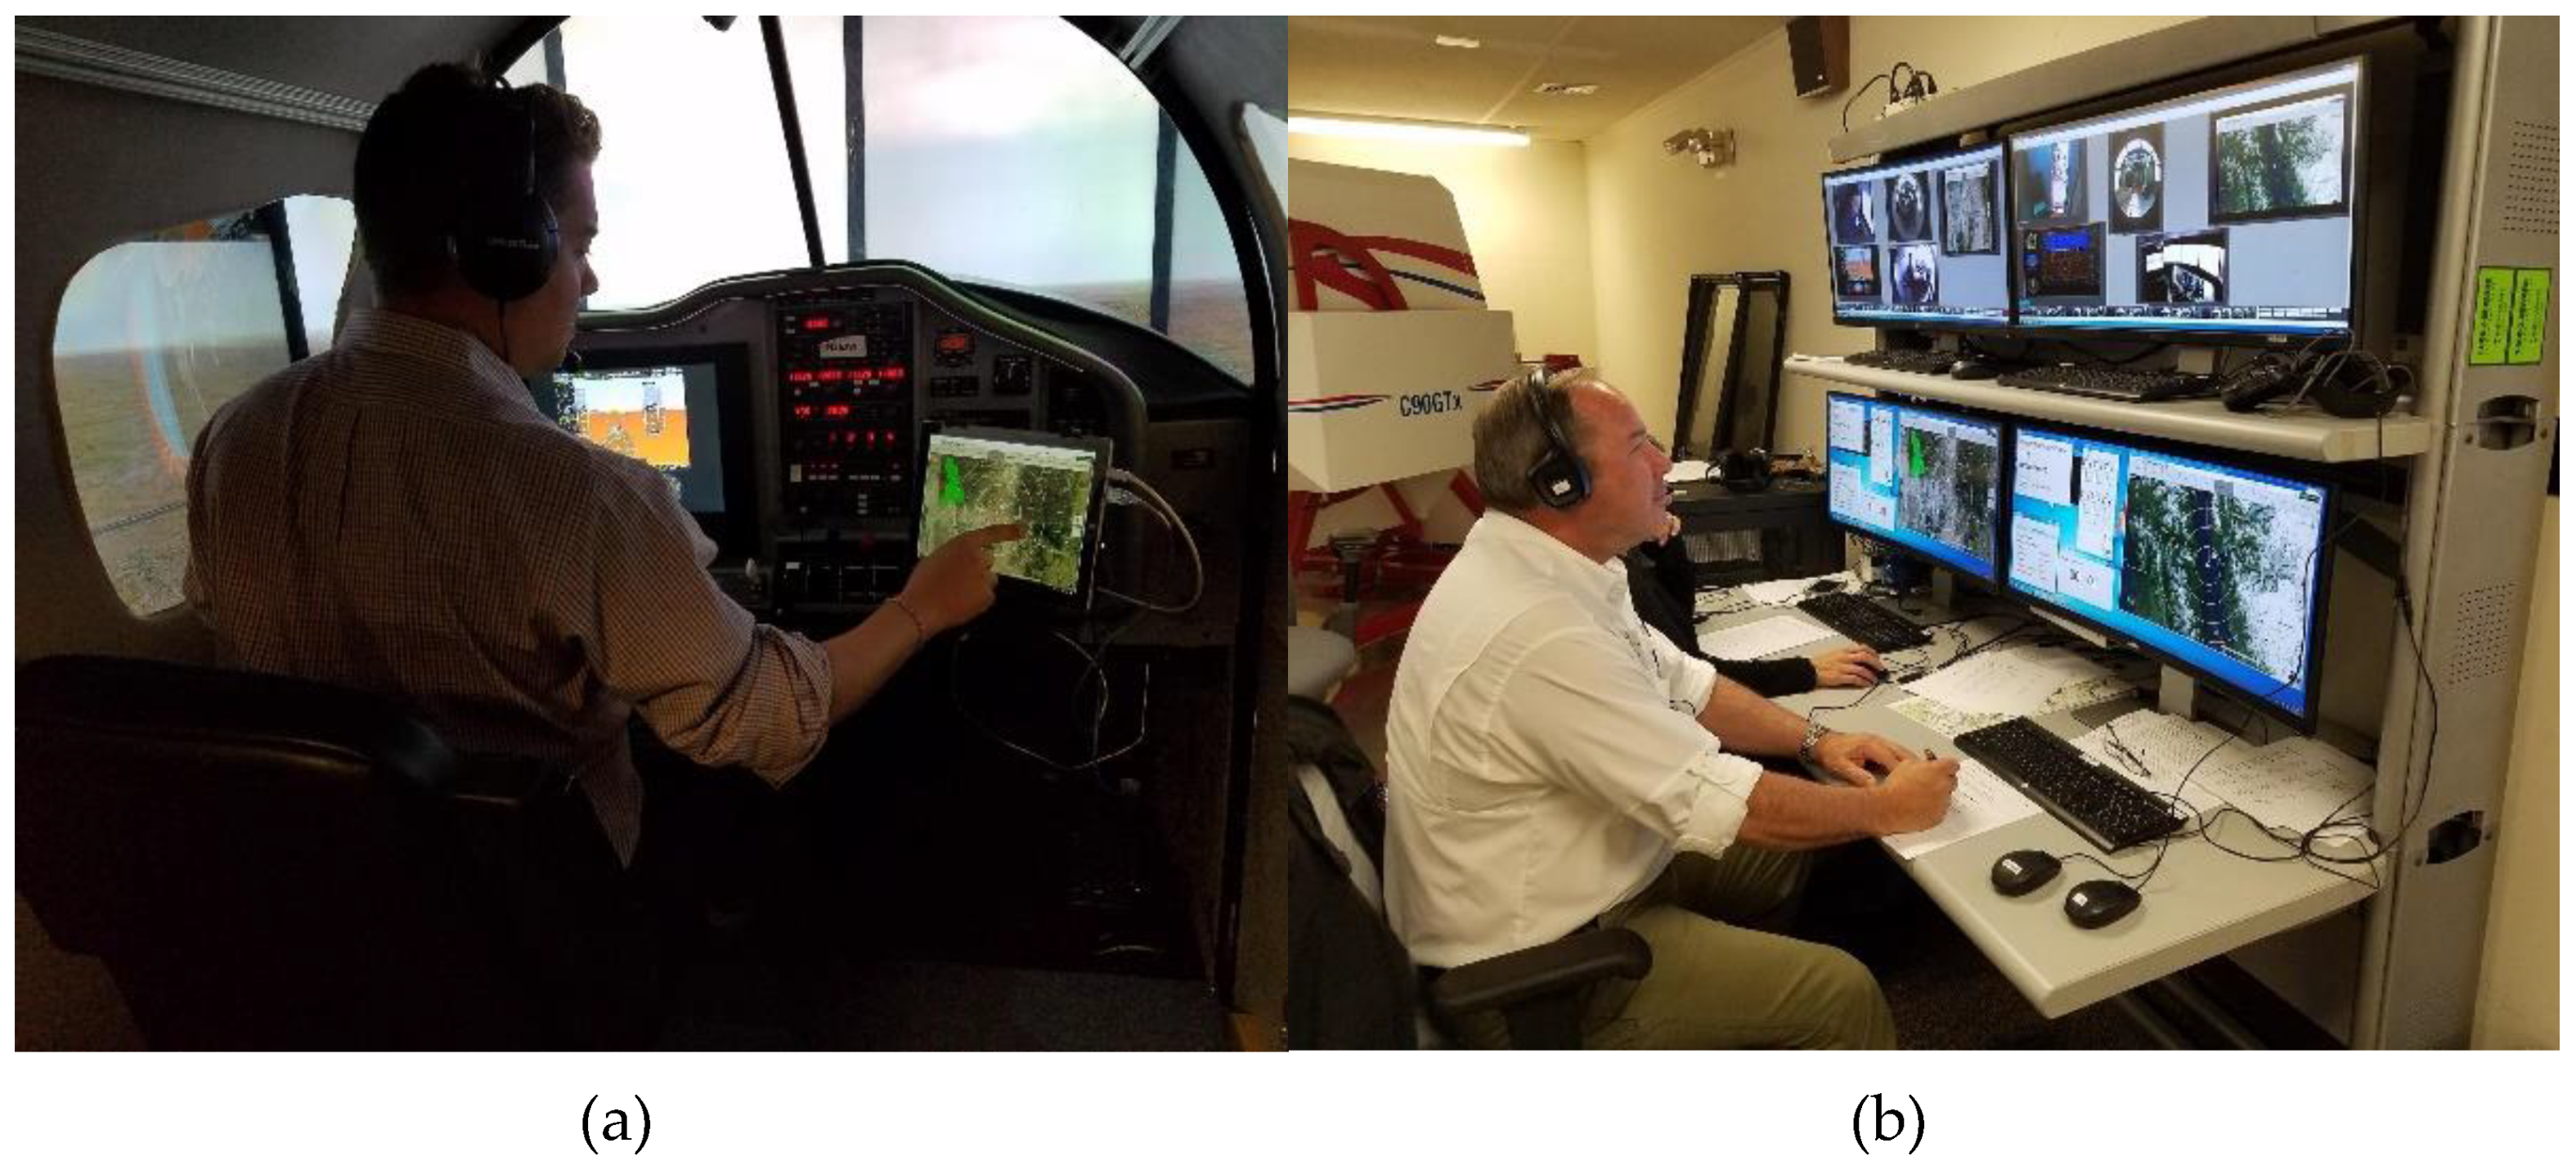
An FAA WJHTC Flight Training Device (FTD) (see Figure 1a) was configured to perform similarly to a Mooney aircraft, having out-the-window visuals generated using Active Sky Next [32] for PREPAR3D [33]. The simulated scenario was a flight from Santa Fe, New Mexico (KSAF), to Albuquerque, New Mexico (KABQ), developed based on historical National Transportation Safety Board (NTSB) reports of weather-related accidents. The scenario involved mountainous terrain and weather patterns (mountain turbulence and convective activity) that progressively worsened as the pilots approached Albuquerque. Members of the experimental team who were Certified Flight Instructors (CFIs) role-played as ATC (see Figure 1b) and followed a script which precisely timed some communications (such as SAPs) but allowed for improvised responses to any queries from the pilots.
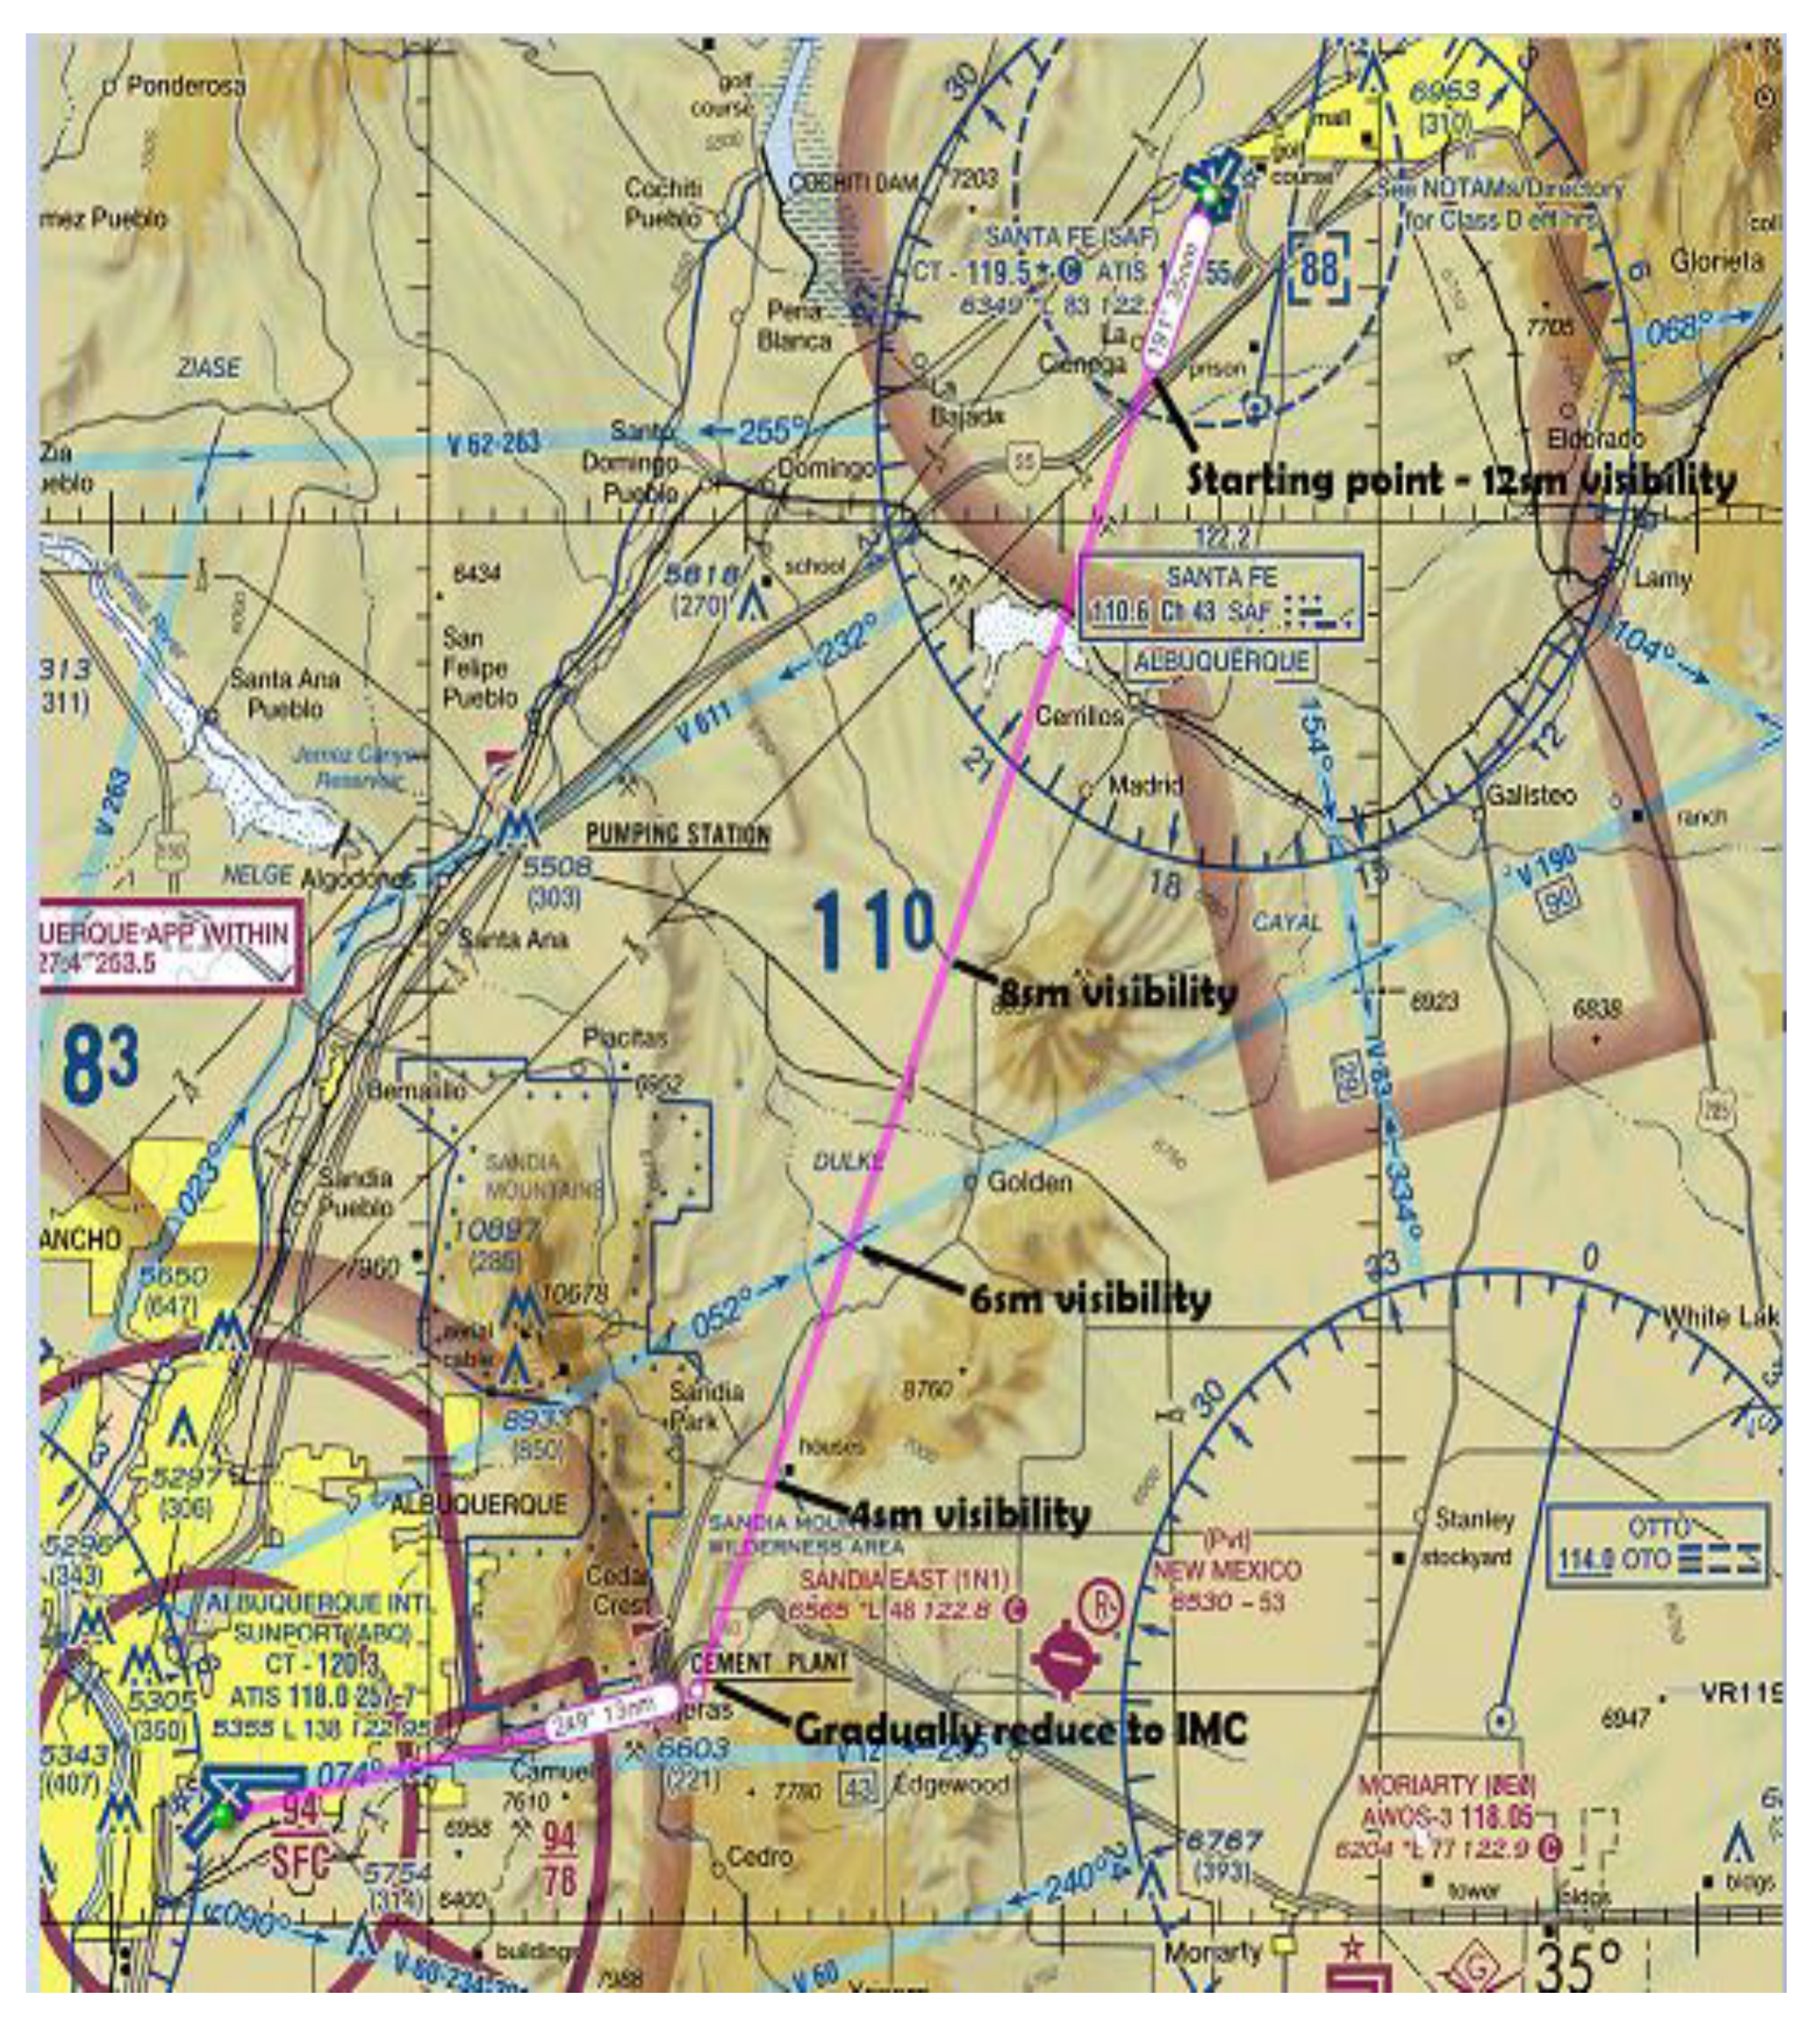
Figure 2 illustrates the intended route as well as terrain and other aeronautical information, and Table 2 summarizes the key scenario events. The weather conditions and visibility progressively worsened during the flight, which was cleared for take-off from KSAF under Visual Flight Rules (VFR) with 12 statute miles of visibility. As the aircraft progressed south, the visibility gradually worsened and Instrument Meteorological Conditions (IMC) were realized shortly after making a turn westward for the approach to KABQ. This final turn (into IMC conditions) also crossed over the Sandia mountain range, which introduced rising terrain and mountain obscuration that made it extremely challenging to safely navigate, while also making it virtually impossible to turn the aircraft around in order to escape the hazardous flight environment.
Participants did not have any prior experience with this particular scenario, but they were adequately trained for familiarity with the flight environment and displays with a training scenario set in the eastern United States.
During the flight, pilots received four scripted weather messages (WMs) which varied in severity at key points in the scenario, which imposed different levels of workload on the pilots (see Table 2). For example, WM1 was delivered at a point with good visibility, relatively little weather development, and with autopilot engaged. WM2, WM3, and WM4 were delivered in increasingly higher-workload contexts, with additional workload imposed by autopilot failure, degrading weather and visibility, increased frequency of ATC communications, and the addition of turbulence. Pilots were told that their response to these messages—including their time to acknowledge, fully process, and act on the messages—would be measures of interest in this study, but that they should keep flight safety as their top priority.
To assess whether the additional weather messages may positively or negatively impact overall flight situation awareness, three SAPs were distributed to occur in low-, moderate-, and high-workload contexts of the flight. These probes inquired about the pilot’s flight plans and intentions, as well as weather, altitude, and position information. Following the Situation Present Assessment Method (SPAM) [34], these probes were relevant to and embedded in the task itself, so that both the accuracy and the timing of the response provide insight into the pilot’s situational awareness at that point.

2.3. Weather Message Displays

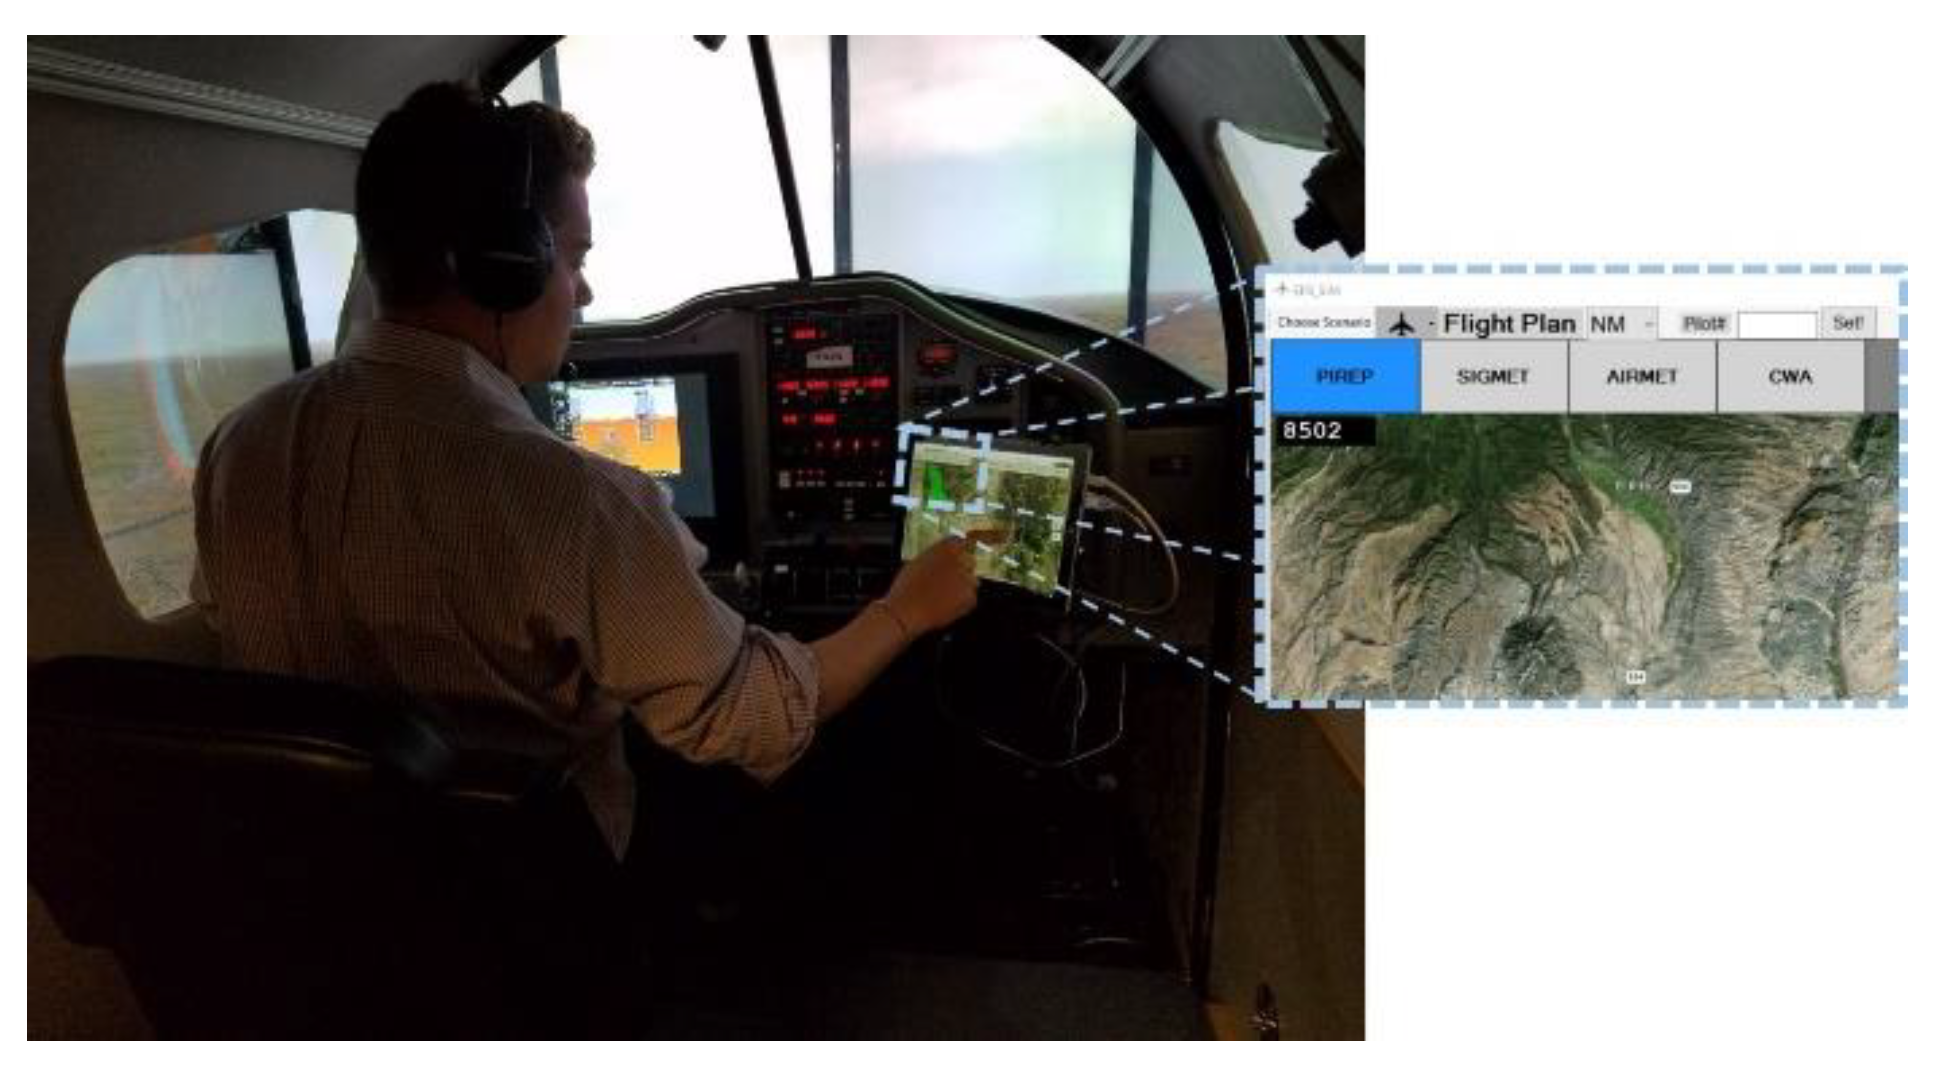
Inside the cockpit, terrain and weather information was available on a tablet computer with a proprietary experimental interface developed by AeroTech Research (ATR; [35]) to look and function similarly to existing commercial applications, such as Foreflight [36]. This display included an active graphical map with “layers’’ of information that could be toggled to be displayed or hidden using touchscreen soft buttons in the menu bar at the top of the map (see Figure 3). The map also supported functionality to zoom in and out, with concentric lines indicating the map scale and the aircraft proximity to various scenario areas of interest.
The tablet display was the primary means by which new weather messages were delivered to the pilots in-flight. Incoming weather messages included those listed in Table 1 but also other communications that may be relevant to weather-related decisions, such as pilot reports (PIREPs). The arrival of a new message was announced by a color change in the associated soft button on the menu bar (see Figure 3b, highlighting an incoming PIREP). The full text of each incoming message (either or both of encoded and verbose text formats) was then accessed by pressing the associated button. This opened a pop-up text overlay on top of (and obscuring most of) the map. The message text could be toggled to be hidden or brought back into focus as often as pilots desired for the remainder of the scenario.
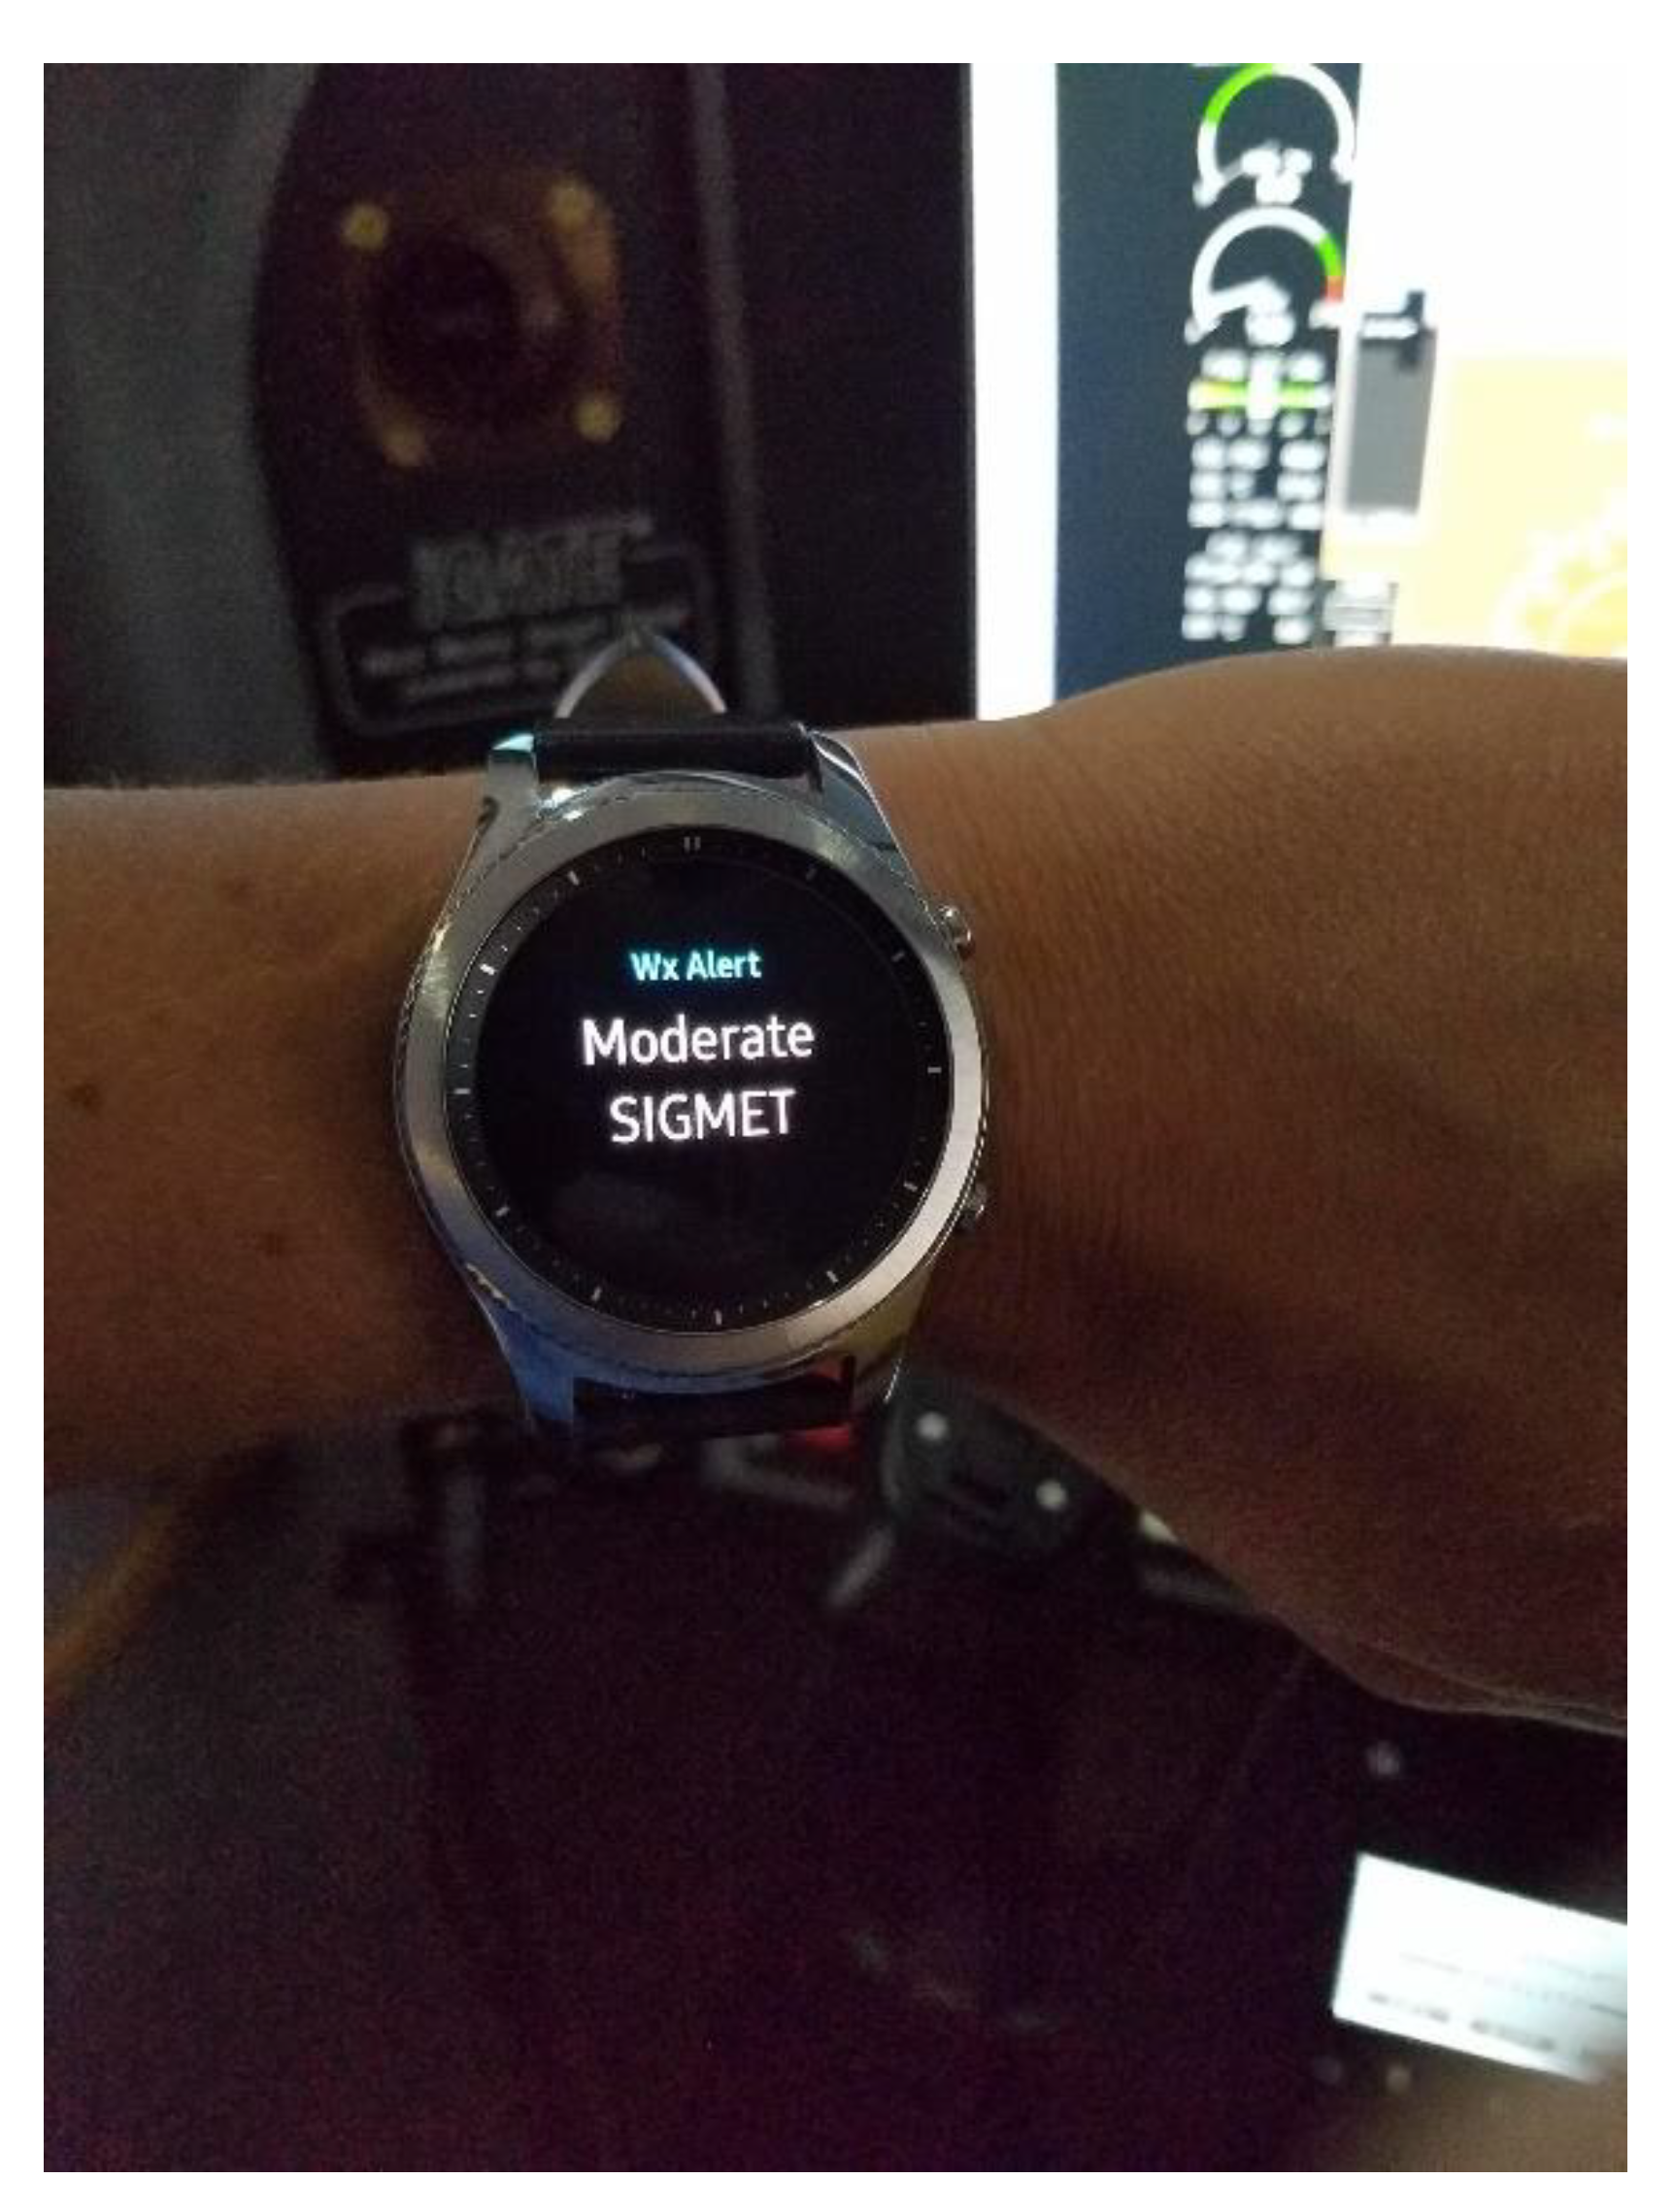
Each incoming weather message was characterized with “summary” information that was intended to convey the severity of the weather developments or, alternatively, the severity with which pilots should process the full message (by accessing and reading the displayed message text). The summary statement was modeled after those which were found to be beneficial for supporting pilot workload and task management in previous weather technology interaction research [1,9]. These statements typically included the type of weather message, and a severity reference (“low”, “moderate”, or “severe”), which pilots can take into account when deciding whether and when to devote attentional resources to access and read the full message while concurrently maintaining safe flight parameters. In addition to the highlighting of the soft buttons on the tablet display, the summary messages were displayed visually on a Samsung Gear S3 smartwatch, which all participants wore on their left wrist (see Figure 4).
For the Vibration (V) participant group, vibratory cues from the smartwatch were also presented to coincide with the arrival of the WM and the summary statement (the NV participant group had all other display aspects except vibratory cues). The vibratory patterns persisted for 1 s in duration and were encoded to communicate the severity of the WM (“low”, “moderate”, or “severe”) through properties of syncopation, intensity, and duration that were found to be maximally distinguishable and intuitively identifiable under varied workload conditions [30].

2.4. Procedure

After reviewing and signing the consent form, participants completed a demographics questionnaire based on flight qualifications and experience with mobile and wearable technologies and were given a formal flight briefing by CFIs from the experimental team. The briefing included a modified version of the aeronautical map illustrated in Figure 2 as well as current visibility and weather conditions (which were supportive of flying under VFR). Participants were then trained in the FTD in a 10-min simplified training scenario set in the eastern United States, which allowed them to practice manually controlling the aircraft, interacting over the radio with ATC, and accessing route and weather information via the tablet display. Participants in the “Vibration” group were also given several example presentations which were repeated until participants demonstrated an ability to determine the severity of incoming messages by correctly interpreting the vibratory cue pattern. Participants demonstrated their understanding and ability to perform the tasks to experimenters prior to the completion of the FTD training session.
Participants were also trained to provide think-aloud verbal protocol data and practiced this during the training session while piloting the aircraft. This technique provides insight into the decision-making thought process of the pilots, as has been used in previous aviation studies [9,37,38,39]. The think-aloud protocol provided the experimenters with insight into when pilots noticed weather message cues and how they used the summary information to determine when to access the full message while concurrently managing other flight demands.
In all cases, participants were instructed to interact in the FTD and make flight-related decisions as if they were in an actual aircraft in a real flight context. In this sense, the pilots’ primary task was always to safely fly the aircraft. Participants were told that performing the think-aloud protocol as well as attending to scenario events such communicating with ATC and receiving and reviewing weather messages were all secondary to flight safety and should only be performed when safety was minimally compromised.
After the training session, participants completed the experimental flight from KSAF to KABQ. The flight scenario lasted about 20–25 min and ended when one of the following conditions was met: (a) pilots requested an alternative flight plan from ATC; (b) via think-aloud protocol, pilots expressed their clear intent to change the flight plan; (c) pilots flew into the IMC conditions and attempted to land at KABQ; (d) the pilots crashed the aircraft.

3. Results

The following analyses were performed using R Version 4.0.3. For reporting purposes, Group labels of “No Vibration” and “Vibration” were simplified to “NV” and “V” respectively.

3.1. Weather Messages

3.1.1. Acknowledgement Rate

Table 3 summarizes the mean WM.AR across the two groups, “NV” and “V”, and across the four weather messages within each group.
WM.AR data from both groups (“NV” and “V”) violated the assumption of normality as demonstrated by the Shapiro–Wilk test. To account for the violated normality assumption, Welch’s t-test [40] was used to compare the two equal-sized groups in terms of WM.AR. The mean WM.AR for participants in the “V” group (M = 0.92, SD = 0.15) was significantly higher—t(28.30) = −2.08, p = 0.046—than for participants in the “NV” group (M = 0.78, SD = 0.24). This represented a medium-sized effect, r = 0.36.
As shown in Table 3, the WM.AR was fairly consistent for both groups across WMs 1–3 but was much lower for WM4, especially for the “NV” group. Based on experiment notes, for several pilots, WM4 came in while they were talking on the radio (higher workload). In addition, for several pilots, the scenario ended shortly (~1.5 min) after WM4 came in, therefore not giving them much time to acknowledge it.
It is important to keep in mind the WM.ARs when considering later measures. For example, as will be shown, pilots in both groups had a quicker response time to WM4 than WM1, but this only includes the pilots who actually acknowledged the message, a number which was much lower than for WM1.

3.1.2. Acknowledgement Time

Table 4 and Figure 5 illustrate the mean WM.AT to the four WMs for each participant Group. Since some participants did not acknowledge all the WMs, there were several missing data points, which were excluded from the time-based analysis. Note that WM1 was considered “low” severity, WM2 and WM3 “moderate” severity, and WM4 “high” severity, and flight-related workload generally increased throughout the scenario (refer to Table 2).
A two-way mixed ANOVA was performed, which found neither Group, F(1, 16) = 1.20, p = 0.29, nor Message Number, F(1.5, 24.07) = 2.33, p = 0.13, nor the interaction of Group and Message Number, F(1.5, 24.07) = 0.81, p = 0.42, to have a significant effect on WM.AT. However, not all ANOVA assumptions were met. Fourteen data points were identified as outliers but were determined to be due to natural variation rather than data entry or measurement errors and were therefore kept. The Shapiro–Wilk test and Q–Q plots indicated a deviation from normality in the data. Levene’s test indicated a difference in variance across the between-subjects variable, Group (“NV” vs. “V”). Box’s M-test indicated equal covariances. Mauchly’s test of sphericity indicated that the variances of group differences are not equal.
Given the violated normality assumption, a robust mixed ANOVA [41], which makes use of trimmed means, was also performed on the data, which found Group, F(1, 25.65) = 12.50, p < 0.01, to have a significant effect on WM.AT. Neither Message Number, F(3, 22.14) = 1.85, p = 0.17, nor the interaction of Group and Message Number, F(3, 22.07) = 2.52, p = 0.08, reached significance.
Again, WM.AT was calculated only for the pilots who actually acknowledged the messages, so while the WM.AT for WM4 was lower, it also had a much lower WM.AR, particularly for group “NV”.

3.1.3. Response Time

Table 5 and Figure 6 show the mean WM.RT to the four WMs, divided by Group. Since some participants did not respond to all the WMs, there are some missing data points.
A two-way mixed ANOVA was performed, which found Message Number, F(3, 42) = 5.89, p < 0.01, to have a significant effect on WM.RT, while neither the effect of Group, F(1, 14) = 0.44, p = 0.52, nor the interaction of Group and Message Number, F(3, 42) = 2.43, p = 0.08, were significant. However, not all ANOVA assumptions were met. Eleven data points were statistically identified as outliers but were determined to be legitimate and therefore kept. The Shapiro–Wilk test and Q–Q plots indicated a deviation from normality in the data. Levene’s test indicated homogeneity of variances, while Box’s M-test could not be computed due to the large number of missing values for Message 4. Mauchly’s test showed the assumption of sphericity to be met.
Given the violated normality assumption, a robust mixed ANOVA was also performed [41], which found Message Number, F(3, 22.55) = 10.18, p < 0.001, to have a significant effect on WM.RT. Neither Group, F(1, 24.10) = 0.45, p = 0.51, nor the interaction of Group and Message Number, F(3, 22.32) = 0.83, p = 0.49, were significant.
The robust ANOVA post-hoc comparison method [41] does not appear to be able to handle missing values, which our data contain. Therefore, in order to compare response time across the different message numbers, we made use of the non-robust post-hoc method. This post-hoc test showed WM.RT for WM1 to be significantly higher than for both WM3 (p < 0.001) and WM4 (p = 0.01). There were no other significant differences among the message responses.
Again, it should be noted that WM.RT was calculated only for the pilots who actually acknowledged the messages, so while the WM.RT for WM4 was lower, it also had a much lower WM.AR, particularly for group “NV”.

3.2. Situation Awareness Probes

It is important to clarify that situation awareness probes (SAPs) were never associated with vibratory cues, and therefore, SAP presentations did not differ in any way between groups. However, Group was analyzed as the primary factor in the SAP response analysis to determine if the presence of (and, potentially, reliance on) vibratory cuing of WMs also impacted pilots’ situation awareness and, therefore, response to SAPs.

3.2.1. Acknowledgement Rate

Three participants were not presented with the third SAP due to the scenario being terminated early (for example, after pilots called ATC to request a deviation, the scenario was stopped by experimenters). Besides these occurrences, 100% of SAPs were acknowledged; therefore, it was not deemed necessary or appropriate to perform a statistical comparison of acknowledgment rates between groups, and instead, time-based measures were more meaningful for assessing situation awareness.

3.2.2. Acknowledgement Time

Table 6 and Figure 7 show the mean SAP.AT for each of the three SAPs, divided by Group. Due to the fact that some participants did not receive the third SAP, three of the (36 × 3) = 108 possible data points were missing and, thus, excluded from the time-based analysis.
A two-way mixed ANOVA was performed, which found neither Group, F(1, 31) = 0.79, p = 0.38, nor SAP Number, F(2, 62) = 3.06, p = 0.054, nor the interaction of Group and SAP Number, F(2, 62) = 0.51, p = 0.60, to have a significant effect on SAP.AT. Again, some of the ANOVA assumptions were violated. Of the 105 data points, six were identified as outliers but were determined to be due to natural variation rather than data entry or measurement errors and were therefore included in the analysis. The Shapiro–Wilk test for each combination of factor levels showed several p-values less than 0.05, indicating a deviation from normality in the data. Q–Q plots showed some points falling outside of the reference lines, which, again, indicated non-normality. There was homogeneity of variances, as assessed by Levene’s test (p > 0.05). Box’s M-test for homogeneity of covariances was not statistically significant (p > 0.001), indicating equal covariances. Mauchly’s test showed the assumption of sphericity to be met.
Given the violated normality assumption, a robust mixed ANOVA [41] was also performed, which found neither Group, F(1, 29.93) = 1.49, p = 0.23, nor SAP Number, F(2, 21.69) = 1.93, p = 0.17, nor the interaction of Group and SAP Number, F(2, 21.60) = 0.87, p = 0.44, to have a significant effect on SAP.AT.

3.2.3. Response Time

Table 7 and Figure 8 show the mean SAP.RT for each of the three SAPs, divided by Group. Due to the fact that three participants did not receive the third SAP, three of the (36 × 3) = 108 possible data points were missing and, thus, excluded.
A two-way mixed ANOVA was performed, which found neither Group, F(1, 31) = 0.12, p = 0.73, nor SAP Number, F(1.47, 45.45) = 0.94, p = 0.37, nor the interaction of Group and SAP Number, F(1.47, 45.45) = 0.40, p = 0.61, to have a significant effect on SAP.RT. Again, however, not all ANOVA assumptions were met. Ten data points, while being statistical outliers, were deemed legitimate and therefore kept. The Shapiro–Wilk test and Q–Q plots both indicated non-normality. Levene’s test showed homogeneity of variances, while Box’s M-test indicated equal covariances. Mauchly’s test of sphericity indicated that the variances of group differences were not equal.
Given the violated normality assumption, a robust mixed ANOVA [41] was also performed, which found neither Group, F(1, 32.94) = 0.12, p = 0.73, nor SAP Number, F(2, 21.98) = 0.25, p = 0.78, nor the interaction of Group and SAP Number, F(2, 21.99) = 0.06, p = 0.94, to have a significant effect on SAP.RT.

4. Discussion

This study builds on previous works that used vibratory notifications to support pilot situation awareness and performance by effectively guiding attention in the cockpit [13,27,29]. The current study investigated the extent to which pilots’ awareness of weather dynamics and management of concurrent flight tasks could be supported when the availability of new weather information is announced via vibratory cues. Furthermore, as a follow-up to Tippey et al. [29], the current study took special steps to design vibrotactile cues that featured patterns which could reliably be distinguished and intuitively associated with the concept of “severity” [30]. Thirty-six general aviation pilots completed the study in a flight training device. The experimental scenario gradually added workload by having an autopilot failure, decreasing visibility until reaching IMC conditions, turbulence, rising terrain, and increasing proximity to weather cells, as listed in Table 2. Weather messages were delivered to the participants at specific points in time, and half of the participants also received a severity-coded vibratory alert.
The results indicate that the participant group receiving the severity-mapped vibrations through a smartwatch showed significantly higher likelihood of acknowledging the arrival of weather messages compared to the group that did not receive the vibratory cues. Particularly for WM4, which represents the highest flight-related workload context, the highly salient “high severity” vibratory cue led to a much higher reception of the message as compared to the No Vibration group. Furthermore, those in the Vibration group acknowledged the messages sooner than those in the No Vibration group, indicating that attention is effectively drawn when there is new information worth processing. After this acknowledgment, both groups took similar amounts of time to fully respond to the messages, indicating that there were not unforeseen adverse effects of display configurations (i.e., including vibratory cues or not) on the ability to visually process and act on the full message.
There was no statistical difference between the Vibration and No Vibration groups in terms of acknowledging and responding to SAPs. While the probes used in this study were quite simple and all of them were correctly responded to, the lack of impact on the timing of responses shows that SA was relatively consistent between these groups [34]. The inclusion of situation awareness probes in this study was not the primary measure of interest, and for future work, it is recommended that probes include queries for more complex responses as well as to evaluate pilots’ awareness of critical flight variables over longer timescales (i.e., asking about current, trending, and predicted near-future levels of various safety-critical types of flight data).
As with any research involving the complexities of aviation, there are a number of limitations in interpreting the results of this study and scaling its findings to practice. First, the study was conducted in a flight training device with a controlled and scripted scenario, and while efforts were made to add realism to the experiment, the artificiality of this context likely led pilots to make decisions under considerably different stress and time pressure than those imposed by an aircraft in real flight during adverse weather. Additionally, the lack of key environmental stimuli such as motion cues (the FTD did not include a motion base) means that some aspects of pilot workload (such as physical reaction to the forces from aerodynamic maneuvering and the cognitive load involved in processing information in a moving frame) were not well represented. Finally, a key factor in the FTD-based study was the absence of substantial vibratory “noise” that originates from engine operation as well as turbulence and other external sources in real flight. This vibratory noise propagates through the airframe to the pilot and shows potential to mask encoded vibratory signals presented to the wrist [42,43], thus suggesting that the smartwatch-based vibrotactile cues may be less effective in real flight.
To investigate the concerns of vibrotactile masking in an aircraft, the experimenters conducted in-flight evaluations of the perceptibility and identifiability of vibratory signals [44]. While wearing a smartwatch on each surface (palmar and dorsal sides) of each wrist, assuming several common postures (e.g., resting the hand/wrist/arm on the flight yoke, seat armrest, and airframe itself) in several aircrafts of varied engine numbers and sizes (from 150 HP single-engine to 600 HP dual-engine) and during several phases of flight, it was found that signals with maximum intensity, higher dynamism, and moderate or high syncopation best supported perception and identifiability of the signals [44]. The characteristics of intensity, dynamism, and syncopation that were most effective in real flight also adequately describe the vibratory cues used in the current FTD study.

5. Conclusions

While general aviation pilots should check weather conditions before take-off, new and affordable portable devices are increasingly available to provide weather messages in the cockpit while mid-flight. However, more information availability does not translate to information received, as pilots can miss or misinterpret the weather messages. In each case, awareness of weather dynamics can be improved when the arrival of weather information is announced with a salient cue, such as a vibrotactile cue, that also provides sufficient partial information to support interruption management. In other words, pilots need to be aware of the presence of new weather information and should be able to make informed decisions about when it is appropriate to reallocate cognitive resources to process the message given concurrent flight demands. This study investigated the effectiveness of severity-encoded vibratory cues used to announce the availability of new weather messages, as well as the relative urgency in attending to them. The results indicate a higher acknowledgement rate and a shorter time to acknowledge the weather messages when accompanied with the vibrotactile cues. The acknowledgement rate for both groups was lower for the last message, but much more so for the non-vibration group. These lower acknowledgement rates should be kept in mind when interpreting the time-based measures. It appears that response time to the messages was affected by the encoded severity, as pilots completed responses faster to more severe messages. Pilots that did not have the benefit of the vibrotactile cues responded faster to the later messages than they did to the earlier ones, while those with the cues responded at a relatively consistent pace, which may reflect how overall workflow can be better managed in processing the full messages when pilots are aware of the messages earlier and can make informed decisions to switch their attention to the message when the workflow supports the switch (rather than becoming aware of the message later and having less information about the nature of the message, thus often leading to immediate transitions that could unnecessarily disrupt ongoing tasks). Finally, the lack of significant differences in situation awareness measures suggests that there are not obvious adverse consequences to the introduction of vibratory display functionality with regard to flight-relevant awareness and performance. As a topic of future study, more in-depth flight performance and safety metrics should be consulted to gain further understanding of the interaction among concurrent flight tasks with weather information-seeking and reasoning tasks so that the interruption management potential of vibratory cues can be better understood and applied more broadly in weather technologies. By including interruption management as a design goal, weather technologies can be made more effective, keeping pilots more informed of weather dynamics while minimally impacting performance on other flight-related tasks, therefore reducing the risk of GA accidents when adverse weather occurs.

Author Contributions

Data curation, C.R.-P., J.T.M., and P.C.; formal analysis, J.T.M.; investigation, T.K.F.; visualization, C.R.-P., J.T.M.; writing—original draft, C.R.-P., J.T.M., and T.K.F.; writing—review & editing, C.R.-P., J.T.M., P.C., and T.K.F., C.R.-P., J.T.M., P.C., and T.K.F. contributed substantially to the paper. All authors have read and agreed to the published version of the manuscript.

Funding

This research was funded by the Federal Aviation Administration (FAA) Partnership to Enhance General Aviation Safety, Accessibility, and Sustainability (PEGASAS) Weather Technology in the Cockpit (WTIC) Project (12-C-GA-TEES, Project 4).

Institutional Review Board Statement

Not applicable.

Informed Consent Statement

Not applicable.

Data Availability Statement

No new data was created in this study.

Acknowledgments

The authors would like to thank Ulf Ahlstrom and the research support staff at the William J. Hughes Technical Center in Atlantic City, NJ. Additionally, they would like to thank collaborators William Rantz, Geoff Whitehurst, and Lori Brown for their contributions to experimental design and conduction.

Conflicts of Interest

The authors declare no conflict of interest. Other than providing general advice for experimental design, the funders had no role in the design of the study; in the collection, analyses, or interpretation of data; in the writing of the manuscript, or in the decision to publish the results.

References

  1. Ferris, T.; Brown, L.; Rantz, W.; Nicolai, D.; McFall, D.; Tippey, K.; Rodriguez Paras, C.; Edery, J.; Mack, S.; Denton, J.; et al. Weather Technology in the Cockpit (WTIC) Project 4; Team C: General Aviation Weather Alerting; Phase II Final Report; United States Federal Aviation Administration: Washington, DC, USA, January 2016.
  2. Schvaneveldt, R.W.; Branaghan, R.J.; Lamonica, J.; Beringer, D.B. Weather in the Cockpit: Priorities, Sources, Delivery, and Needs in the Next Generation Air Transportation System; Arizona State University: East Mesa, AZ, USA, 2012. [Google Scholar]
  3. Aircraft Owners & Pilots Association (AOPA). Joseph T. Nall 30th Report Figure View. 2020. Available online: https://www.aopa.org/training-and-safety/air-safety-institute/accident-analysis/joseph-t-nall-report/nall-report-figure-view (accessed on 4 March 2021).
  4. Wilson, D.R.; Sloan, T.A. VFR flight into IMC: Reducing the hazard. J. Aviat. Aerosp. Educ. Res. 2003, 13, 9. [Google Scholar] [CrossRef] [Green Version]
  5. Ferris, T.K.; Sarter, N. Continuously informing vibrotactile displays in support of attention management and multitasking in anesthesiology. Hum. Factors 2011, 53, 600–611. [Google Scholar] [CrossRef] [PubMed]
  6. Sarter, N.B.; Woods, D.D. How in the world did we ever get into that mode? Mode error and awareness in supervisory control. Hum. Factors 1995, 37, 5–19. [Google Scholar] [CrossRef]
  7. Latorella, K.A. Effects of modality on interrupted flight deck performance: Implications for data link. In Proceedings of the Human Factors and Ergonomics Society Annual Meeting, Chicago, IL, USA, 5–9 October 1998; Sage Publications: Los Angeles, CA, USA, 1998. [Google Scholar]
  8. Parson, S.; Beringer, D.; Knecht, W.; Crognale, M.A.; Wiegmann, D.; Beard, B.L. General Aviation Pilot’s Guide to Preflight Weather Planning, Weather Self-Briefings, and Weather Decision Making; Federal Aviation Administration: Washington, DC, USA, 2005.
  9. Valasek, J.; Ferris, T.; Brown, L.; Rantz, B.; Whitehurst, G. Weather Technology in the Cockpit (WTIC); Project C: General Aviation Weather Alerting Phase 1 Final Report; United States Federal Aviation Administration: Washington, DC, USA, April 2015.
  10. Aircraft Owners & Pilots Association (AOPA). Gear. 2020. Available online: https://www.aopa.org/news-and-media/news-by-topic/gear (accessed on 4 March 2021).
  11. U.S. Federal Aviation Administratio. Department of Transportation. Pilot’s Handbook of Aeronautical Knowledge; Federal Aviation Administration: Washington, DC, USA, 2016.
  12. Wickens, C.D. Multiple resources and mental workload. Hum. Factors 2008, 50, 449–455. [Google Scholar] [CrossRef] [PubMed] [Green Version]
  13. Ho, C.Y.; Nikolic, M.I.; Waters, M.J.; Sarter, N.B. Not now! Supporting interruption management by indicating the modality and urgency of pending tasks. Hum. Factors 2004, 46, 399–409. [Google Scholar] [CrossRef] [PubMed]
  14. Latorella, K.A. Investigating interruptions: An example from the flightdeck. In Proceedings of the Human Factors and Ergonomics Society Annual Meeting, Philadelphia, PA, USA, 2–6 September 1996; Sage Publications: Los Angeles, CA, USA, 1996; Volume 40, pp. 249–253. [Google Scholar]
  15. Grundgeiger, T.; Sanderson, P.; MacDougall, H.G.; Venkatesh, B. Interruption management in the intensive care unit: Predicting resumption times and assessing distributed support. J. Exp. Psychol. Appl. 2010, 16, 317. [Google Scholar] [CrossRef] [PubMed] [Green Version]
  16. Hameed, S.; Ferris, T.; Jayaraman, S.; Sarter, N. Using informative peripheral visual and tactile cues to support task and interruption management. Hum. Factors 2010, 51, 126–135. [Google Scholar] [CrossRef] [PubMed] [Green Version]
  17. Lu, S.A.; Wickens, C.D.; Prinet, J.C.; Hutchins, S.D.; Sarter, N.; Sebok, A. Supporting interruption management and multimodal interface design: Three meta-analyses of task performance as a function of interrupting task modality. Hum. Factors 2013, 55, 697–724. [Google Scholar] [CrossRef] [PubMed]
  18. Sasangohar, F.; Donmez, B.; Easty, A.C.; Trbovich, P.L. Effects of nested interruptions on task resumption: A laboratory study with intensive care nurses. Hum. Factors 2017, 59, 628–639. [Google Scholar] [CrossRef] [PubMed]
  19. Helleberg, J.; Wickens, C.D. Effects of data link modality on pilot attention and communication effectiveness. In Proceedings of the 11th International Symposium on Aviation Psychology, Columbus, OH, USA, 5–8 March 2001; p. 6. [Google Scholar]
  20. Johnson, N.; Wiegmann, D.; Wickens, C. Effects of advanced cockpit displays on general aviation pilots’ decisions to continue visual flight rules flight into instrument meteorological conditions. In Proceedings of the Human Factors and Ergonomics Society Annual Meeting, San Francisco, CA, USA, 16–20 October 2006; Sage Publications: Los Angeles, CA, USA, 2006; Volume 50, pp. 30–34. [Google Scholar]
  21. Di Nocera, F.; Camilli, M.; Terenzi, M. A random glance at the flight deck: Pilots’ scanning strategies and the real-time assessment of mental workload. J. Cogn. Eng. Decis. Mak. 2007, 1, 271–285. [Google Scholar] [CrossRef]
  22. Di Nocera, F.; Terenzi, M.; Camilli, M. Another look at scanpath: Distance to nearest neighbour as a measure of mental workload. In Developments in Human Factors in Transportation, Design, and Evaluation; Shaker Publishing: Düren, Germany, 2007; pp. 295–303. [Google Scholar]
  23. Latorella, K.A.; Chamberlain, J.P. Graphical Weather Information System Evaluation: Usability, Perceived Utility, and Preferences from General Aviation Pilots; SAE Technical Paper; NASA: Washington, DC, USA, 2002. [Google Scholar]
  24. Sarter, N.B. Multimodal information presentation: Design guidance and research challenges. Int. J. Ind. Ergon. 2006, 36, 439–445. [Google Scholar] [CrossRef]
  25. Raj, A.K.; Kass, S.J.; Perry, J.F. Vibrotactile displays for improving spatial awareness. In Proceedings of the Human Factors and Ergonomics Society Annual Meeting, San Diego, CA, USA, 30 July–4 August 2000; Sage Publications: Los Angeles, CA, USA, 2000; Volume 44, pp. 181–184. [Google Scholar]
  26. Van Erp, J.B.; Veltman, A.; van Veen, H.A. A tactile cockpit instrument to support altitude control. In Proceedings of the Human Factors and Ergonomics Society Annual Meeting, Denver, CO, USA, 13–17 October 2003; Sage Publications: Los Angeles, CA, USA, 2003; Volume 47, pp. 114–118. [Google Scholar]
  27. Sklar, A.E.; Sarter, N.B. Good vibrations: Tactile feedback in support of attention allocation and human-automation coordination in event-driven domains. Hum. Factors 2009, 41, 543–552. [Google Scholar] [CrossRef] [PubMed]
  28. Salzer, Y.; Oron-Gilad, T. A comparison of “on-thigh” vibrotactile, combined visual-vibrotactile, and visual-only alerting systems for the cockpit under visually demanding conditions. In Proceedings of the Human Factors and Ergonomics Society Annual Meeting, Boston, MA, USA, 22–26 October 2012; Sage Publications: Los Angeles, CA, USA, 2012; Volume 56, pp. 1644–1648. [Google Scholar]
  29. Tippey, K.G.; Roady, T.; Rodriguez-Paras, C.; Brown, L.J.; Rantz, W.G.; Ferris, T.K. General aviation weather alerting: The effectiveness of different visual and tactile display characteristics in supporting weather-related decision making. Int. J. Aerosp. Psychol. 2017, 27, 121–136. [Google Scholar] [CrossRef]
  30. Roady, W.A., III. Design and Validation of Vibrotactile Communications for Dynamic Environments. Ph.D. Thesis, Texas A & M University, College Station, TX, USA, 2018. Available online: http://hdl.handle.net/1969.1/173282 (accessed on 4 March 2021).
  31. Santiago-Espada, Y.; Myer, R.R.; Latorella, K.A.; Comstock, J.R., Jr. The Multi-Attribute Task Battery II (MATB-II) Software for Human Performance and Workload Research: A User’s Guide; NASA: Washnigton, DC, USA, 2011. [Google Scholar]
  32. HiFi Simulation Technologies. ActiveSky. 2020. Available online: https://hifisimtech.com/ (accessed on 4 March 2021).
  33. Lockheed Martin Corporation. Prepar3D. 2021. Available online: https://www.prepar3d.com/ (accessed on 4 March 2021).
  34. Durso, F.T.; Dattel, A.R.; Banbury, S.; Tremblay, S. SPAM: The real-time assessment of SA. In A Cognitive Approach to Situation Awareness: Theory and Application; Ashgate: Aldershot, UK, 2007; Volume 1, pp. 137–154. [Google Scholar]
  35. AeroTech Research (U.S.A.), Inc. AeroTech Research (U.S.A.). 2 Inc. 2020. Available online: http://www.atr-usa.com/ (accessed on 4 March 2021).
  36. ForeFlight LLC. ForeFlight Mobile EFB (Version 13.0.1) [Mobile Application Software]. 2021. Available online: https://apps.apple.com/us/app/foreflight-mobile-3/id333252638 (accessed on 4 March 2021).
  37. Fischer, U.M. Operational Factors in Pilots’ Decision Making; Georgia Institute of Technology: Atlanta, GA, USA, 2008. [Google Scholar]
  38. Orasanu, J.; Davison, J. The role of risk in aviation decision making: How pilots perceive and manage flight risks. In Proceedings of the Human Factors and Ergonomics Society Annual Meeting, Minneapolis, MI, USA, 8–12 October 2001; Sage Publications: Los Angeles, CA, USA, 2001; Volume 45, pp. 58–62. [Google Scholar]
  39. Orasanu, J.; Fischer, U.; Davison, J. Risk perception: A critical element of aviation safety. In Proceedings of the 15th Triennial World Congress, Barcelona, Spain, 21–26 July 2002. IFAC Proceedings Volumes. [Google Scholar]
  40. Delacre, M.; Lakens, D.; Leys, C. Why psychologists should by default use Welch’s t-test instead of Student’s t-test. Int. Rev. Social Psychol. 2017, 30, 92–101. [Google Scholar] [CrossRef] [Green Version]
  41. Mair, P.; Wilcox, R. Robust statistical methods in R using the WRS2 package. Behav. Res. Methods 2019, 52, 464–488. [Google Scholar] [CrossRef] [PubMed]
  42. Craig, J.C. Vibrotactile masking: A comparison of energy and pattern maskers. Percept. Psychophys. 1982, 31, 523–529. [Google Scholar] [CrossRef] [PubMed] [Green Version]
  43. Gilson, R.D. Vibrotactile masking: Some spatial and temporal aspects. Percept. Psychophys. 1969, 5, 176–180. [Google Scholar] [CrossRef] [Green Version]
  44. Caldwell, B.; Whitehurst, G.; Brown, L.; Rantz, B.; Risukhin, V.; Johnson, M.; Pitts, B.; Ferris, T.; Young, S.; Pruchnicki, S.; et al. PEGASAS Project 4, in Support of the Weather Technology in the Cockpit (WTIC) Program: General Aviation MET Information Optimization; Project 4 Final Report Phase 3; Federal Aviation Administration: Washington, DC, USA, January 2008.
Figure 1. (a) The Flight Training Device (FTD) cockpit, configured as a Mooney aircraft; (b) air traffic control (ATC) station, with an experimenter playing the role of ATC.
Atmosphere 12 00341 g001
Figure 2. Aeronautical map of the Santa Fe, New Mexico (KSAF), to Albuquerque, New Mexico (KABQ), flight plan.
Atmosphere 12 00341 g002
Figure 3. Weather and map display tablet in the cockpit. The arrival of a new weather message is indicated by the associated soft button highlighting in blue. Touching the soft button would open/close a pop-up text window that included the full text of the message.
Atmosphere 12 00341 g003
Figure 4. Summary statement for incoming weather message, displayed on a connected smartwatch.
Atmosphere 12 00341 g004
Figure 5. Weather message acknowledgement time (WM.AT) to the four weather messages (WMs) for each participant group, “No Vibration” (NV) and “Vibration” (V). Bars provide mean values with error bars representing standard error of the mean.
Atmosphere 12 00341 g005
Figure 6. Weather message response time (WM.RT) to the four weather messages (WMs) for each participant group, “No Vibration” (NV) and “Vibration” (V). Bars provide mean values with error bars representing standard error of the mean.
Atmosphere 12 00341 g006
Figure 7. Situation awareness probe acknowledgement time (SAP.AT) to the three situation awareness probes (SAPs) for each participant group, “No Vibration” (NV) and “Vibration” (V). Bars provide mean values with error bars representing standard error of the mean.
Atmosphere 12 00341 g007
Figure 8. Situation awareness probe response time (SAP.RT) to the three situation awareness probes (SAPs) for each participant group, “No Vibration” (NV) and “Vibration” (V). Bars provide mean values with error bars representing standard error of the mean.
Atmosphere 12 00341 g008
Table 1. Example weather messages received in the cockpit [11].
MessageAcronymExplanation
Terminal Aerodrome ForecastTAFForecasted weather information (wind, visibility, and expected weather changes) for a particular area and time
Aerodrome Routine Meteorological ReportMETARRoutinely reported current weather information (e.g., wind, visibility, and pressure) over a particular area
Significant Meteorological InformationSIGMETInformation on severe weather developments, including extreme turbulence, dust or sandstorms that affect visibility, and icing conditions
Center Weather AdvisoryCWAUnscheduled advisory for conditions meeting or approaching national in-flight advisory
Significant weather chartSIGWXGraphical representation of current weather conditions in a map format
Table 2. Timeline of flight scenario events.
Elapsed TimeScenario EventElapsed TimeScenario Event
00:00Scenario Start13:30Weather—yellow storm cell forms Northwest of flight path
02:00SAP 1 (Situation Awareness Probe)
ATC: “State altitude and flight conditions”
14:00WM 3:AIRMET (Moderate)
03:00WM 1 (Weather Message):
PIREP (Low severity)
15:00Weather—Northwest yellow storm cell dissipates, disappears
06:00Autopilot (AP) Failure—AP no longer functions, manual flight only16:00ATC: “Report Waypoint 2; Traffic leaving ABQ heading East”
07:00Weather—yellow storm cell forms to the South of flight path~18:00Participant reports over Waypoint 2
08:00WM 2:
SIGMET (Moderate severity)
18:00Weather—yellow storm cell appears over KABQ, grows in severity
09:00SAP 2
ATC: “State altitude and flight conditions and report over Waypoint 1”
18:30SAP 3
ATC: “State altitude and flight conditions… State intentions”
~11:00Participant reports over Waypoint 119:00WM 4:
CWA (Severe)
Situation awareness probes (SAPs) are highlighted in orange, and the weather messages (WMs) are in blue. PIREP—pilot report.
Table 3. Mean weather message acknowledgement rate (WM.AR), divided by group and message number.
GroupNo Vibration (NV)Vibration (V)
Weather Message12341234
Mean WM.AR0.940.940.890.331.001.000.940.72
0.780.92
SE of the Mean0.060.04
Table 4. Weather message acknowledgement time (WM.AT) (in seconds), divided by group and message number.
GroupNVV
Weather Message12341234
Mean WM.AT142.88143.91113.9439.50113.3135.2535.5313.65
SE of the Mean55.2137.9923.7410.6645.5626.0215.293.76
Table 5. Weather message response time (in seconds), divided by group and message number.
GroupNVV
Weather Message12341234
Mean WM.RT16.4719.597.676.0015.7811.1911.3510.92
SE of the Mean2.319.261.201.321.592.521.991.75
Table 6. Situation awareness probe (SAP) acknowledgment time (in seconds), divided by group and SAP number.
GroupNVV
SAP123123
Mean SAP.AT1.391.501.181.331.831.38
SE of the Mean0.160.120.100.110.290.15
Table 7. SAP response time (in seconds), divided by group and SAP number.
GroupNVV
SAP123123
Mean SAP.RT2.393.612.592.833.172.81
SE of the Mean0.320.940.340.440.590.41
Publisher’s Note: MDPI stays neutral with regard to jurisdictional claims in published maps and institutional affiliations.

