Article

The Effect of Non-Compliance of Diesel Vehicle Emissions with Euro Limits on Mortality in the City of Milan

1
International Society of Doctors for the Environment, Italy and Institute of Occupational Medicine, University of Pavia, 27100 Pavia, Italy
2
ARIANET, 20128 Milano, Italy
3
Legambiente, Responsabile Mobilità, 00199 Roma, Italy
4
Istituto di Scienze dell’Atmosfera e del Clima del Consiglio Nazionale delle Ricerche, ISAC-CNR, str. Pr.le Lecce-Monteroni km 1.2, 73100 Lecce, Italy
*
Author to whom correspondence should be addressed.
Submission received: 19 January 2021 / Revised: 23 February 2021 / Accepted: 3 March 2021 / Published: 6 March 2021
(This article belongs to the Special Issue Contributions of Aerosol Sources to Health Impacts)

Abstract

:
Diesel exhaust is hazardous to human health. In time, this has led the EU to impose on manufacturers lower and lower emission standards. These limits are very challenging in particular for nitrogen oxides (NOx) emitted by diesel-fueled vehicles. For the town of Milan (Italy), we used a complex modeling system that takes into account the NOx emissions from vehicular traffic and other urban sources, as well as their dispersion and chemical transformations in the atmosphere related to meteorological parameters. The traffic emissions in the Milan urban area were estimated using the geometric and structural characteristics of the road network, whereas the traffic flows were provided by the Environment and Territory Mobility Agency. Car emissions were estimated by the official European method COPERT 5. The nitrogen dioxide (NO2) concentrations were estimated under two scenarios: the actual scenario with real emissions and the Diesel Emission Standards Compliance (DESC) scenario. Using a recent meta-analysis, limited to European studies, we evaluated the relationship between NO2 concentrations and natural mortality. For the actual scenario, the NO2 annual concentration mean was 44.3 µg/m3, whereas under the DESC hypothetical scenario, this would have been of 37.7 µg/m3. This “extra” exposure of 6.6 µg/m3 of NO2 leads to a yearly excess of 574 “natural” deaths. Diesel emissions are very difficult to limit and are harmful for exposed people. This suggests that specific policies, including traffic limitations, need to be developed and enforced in urban environments.

Graphical Abstract

1. Introduction

Diesel exhaust is hazardous to human health. It is carcinogenic [1] and the main source of urban nitrogen oxides and urban particulate matter, both associated with many cardiorespiratory adverse effects, respiratory disease, and lung cancer [2], including mortality [3,4]. Since 1992, the European emission standards (EURO) define the acceptable limits for exhaust emissions of new vehicles, according to specific European Union directives, staging the progressive introduction of increasingly stringent standards. For each vehicle type (category and fuel), different standards apply, and they refer to emissions of nitrogen oxides (NOX), total hydrocarbon (THC), non-methane hydrocarbons (NMHC), carbon monoxide (CO), and particulate matter (PM). Those limits are reported for each Euro category in a specialized website [5]. Road traffic is one of the major sources of atmospheric particles, CO2 [6,7], and NOx in urban areas. NOx pollution contributes to the atmospheric levels of NO2, fine particle emissions, and ground-level ozone. Further, NO2 causes financial damage, including the damaging costs associated with health, material, and biodiversity [8].
The European Commission has been pushing road vehicle manufacturers for years towards increasingly ambitious technological challenges, by imposing lower and lower emission standards (Euro standards, EURO), which must be verified on “in the catalog” vehicles at the time of registration and subsequent placing on the market. These limits are very challenging in particular for NOx emitted by diesel-fueled vehicles, so much so that some car manufacturers in the recent past have succumbed to the temptation to manipulate the verification tests of these emission standards. The so-called “Dieselgate” scandal has raised questions about the trustworthiness of car manufactures but also the accuracy of emission measurements on which the regulation is based.
Diesel engines tend to emit a higher percentage of NOx [9] and it is expected that the NOx emission levels increase with the number of diesel vehicles in the fleet but also for more NOx emissions than under type-approval conditions.
As Milan is located in the Po Valley (Italy), one of the most polluted regions in Europe, often suffering from very poor air quality, it is an interesting location to study, as the air quality data have been shown to exceed the NO2 limits (both the annual mean and hour threshold exceedances [10]).
As a business city, Milan is also besieged by commuter and commercial road traffic to the point that ZTL (limited traffic areas—“Area C” and “Area B”) have recently been introduced where circulation is limited, especially of the most polluting vehicles. In the Municipality of Milan, the “Road transport” sector represents about 75% of nitrogen oxides emissions (NOx = NO + NO2), and diesel-powered vehicles contribute approximately 93% to these emissions [11].
Given these data and thanks to a previous study, supported by the Italian association “Cittadini per l’Aria” [12], the European Public Health Alliance (EPHA) has funded further research to estimate the impact on air quality and citizens’ health of the “extra” emissions that diesel vehicles show in real situations, with respect to the emission standard in force when they were sold on the market.
The aim of this work is to estimate traffic emissions in the Milan urban area, in particular the NO2 concentrations under two scenarios: the actual scenario with real emissions and the Diesel Emission Standards Compliance (DESC) scenario, i.e., the emissions that would occur if the vehicles had the maximum allowed emissions according to the EURO limits in force at their homologation time.
Diesel emissions are very difficult to limit and are harmful for exposed people. Furthermore, NO2 emissions are more difficult to be analyzed due to the high correlations between NO2 concentrations and other pollutants so that the NO2 emissions may represent a mix of traffic-related air pollutants. Given the small number of studies available on the effects on mortality exposure to NO2, the present study investigates the relationship between NO2 concentrations and natural mortality using a recent meta-analysis, limited to European studies. The overall goal is to update the impact and attributable mortality in the city of Milan.

2. Materials and Methods

With the aim of keeping the focus of this paper primarily on health effect calculations, we refer to the report available on the EPHA website [13] for a detailed description of the air quality simulations.
We considered a calculation domain that includes the Municipality of Milan and covers an area of 35 × 35 km2. The calculation grid used for the meteorological and dispersion simulations had a 500 m resolution. The choice of this large domain responds to the need to consider the emissions produced both by the city of Milan and the surrounding urban areas that influence the NO2 levels detected in Milan following transport and atmospheric dispersion processes.
The meteorology was reconstructed by the Advance Research Weather Research and Forecasting (WRF-ARW) version 3.8.1, a fully-compressible non-hydrostatic Numerical Weather Prediction model widely used for both research and meteorological predictions all over the world [14,15].
WRF simulations were driven by the NOAA/NCEP GFS global-scale meteorological forecast, downloaded with 0.5 deg. grid spacing every 6 h [16]. A 24-h spin-off time was used on the basis of the experience of previous applications over the same geographic area.
WRF was configured with 35 vertical levels, from 25 m above ground level to 50 hPa, and with three nested domains from the continental scale down to the local target area. The outermost domain used a horizontal grid resolution of 27 km × 27 km resolution covering the region roughly included in the geographic coordinates range 31–59° latitude and 14–35° longitude, with 112 × 112 grid points. The intermediate domain covers the whole Po Valley and the Alpine mountain chain with a 9 km × 9 km resolution using 100 × 61 grid points. The target domain covers the Lombardy Region with a 3 km × 3 km resolution using 97 × 94 grid points. The land cover description has been improved with respect to the standard datasets available with WRF distribution by the introduction of the European Coordination of Information on the Environment (CORINE) land cover at a 250-m resolution (http://land.copernicus.eu, accessed on 5 March 2021).
The physics schemes used by the WRF-ARW forecast are summarized in Table 1. Cumulus convection parameterization has been activated for the outer and intermediate domains only.
The WRF simulation results have been saved with an hourly time resolution for the offline coupling with the chemical transport model.
The distribution of circulating vehicles by EURO class in the considered domain was provided by ACI (Automobile Club of Italy) and the Italian Environment Ministry. The vehicular traffic emissions in this domain were estimated using road data, i.e., the geometric and structural characteristics of the road network and traffic flows, as provided by the Environment and Territory Mobility Agency (AMAT in Italian) of the Municipality of Milan. A complete characterization of the road network traffic flows and speeds and the circulating vehicle fleet is reported on the EPHA website [13]. Diesel-fueled cars account for 32% of total circulating vehicles in the urban area; 34% are petrol-fueled cars; 11% are light commercial vehicles (LCVs—mostly diesel-fueled); 3% are heavy commercial vehicles (HCVs); 2% are busses (both mostly diesel-fueled); and 12% are L-category vehicles (two wheelers, microcars, and so on).
Emissions for each vehicle and the traveled route were estimated using the official European method COPERT 5 (COmputer Program to calculate Emissions from Road Traffic). COPERT 5 is the most updated version of the traffic emissions calculation program developed by the EEA [17] as part of the Air Pollutant Emission Inventory Guidebook compilation. Air pollution estimation due to traffic was carried out by applying TREFIC, developed by ARIANET [18] in accordance with the official European COPERT 5 methodology. The emissions on the road network, aggregated by section, were calculated by characterizing the streets by length, the traffic situation, the average travel speed, and the vehicle flows, distinguished by macro-categories. In the calculation, we considered both hot- and cold-start emissions; these were last computed, considering an annual average temperature of 13 °C, a mean urban trip of 5 km, and the β fraction of mileage driven in “cold” conditions calculated according to the COPERT algorithm. Moreover, correction factors were applied to the baseline emission factors for petrol cars and LCVs to account for different vehicle ages.
The traffic road network provided by AMAT is oriented (the two ways of each street are treated separately) and includes calculations, by a traffic assignment model and for the two peak hours of the working day (8–9 and 18–19), of both traffic flows and speeds. Thus, emissions reflected the real hourly averaged traffic dynamics. When speeds fall below the COPERT curve’s speed range of 15 km/h (for example, at crowded traffic lights intersections), TREFIC applies to the EFs the correction factor of the travel time.
NO2 atmospheric levels were estimated both considering the COPERT explicit emission factors for NO and NO2 and taking into account the photochemical transformation occurring in the atmosphere.
The COPERT database includes emission factors estimated after tests conducted with vehicles that perform realistic driving cycles on a laboratory dynamometer chassis or on the road, equipped with PEMS (Portable Emission Measurement Systems). Most of the emission factors in the COPERT database were shown to exceed the declared EU emission standards. This is not surprising, as the real or realistic driving situations may differ from the ideal ones that prototypes had to follow when standard compliance was checked, at the time of homologation. This has appeared, at least till Euro 6C standard, a weakness of the European rules, as elsewhere (for example, in the US) the emission standard must be respected by all vehicles on the market in realistic driving situations. Since the Euro 6C standard, and even more so since Euro 6D, stringent rules have been introduced, also in Europe, to adopt more realistic driving situations and tests when checking the standard compliances at the homologation time.
The contribution assessment of diesel-fueled vehicles to NO2 concentrations in the Milan urban area, otherwise known as “Source Apportionment Analysis”, was carried out using a Chemical Transport Model (CTM) with “zero-out” modeling technique. This approach is based on the analysis of the effect of changes in emissions on the air quality levels of a given pollutant. For this purpose, we used the Flexible Air Quality Regional Model FARM [19,20,21,22,23]. FARM includes the SAPRC99 [24] gas-phase chemical mechanism, commonly used to simulate photochemical processes, leading to the formation of ozone and secondary organic aerosols in the lower troposphere. The gas-phase chemical mechanism is coupled with the aero3 aerosol module, implemented in CMAQ [23], which treats particles as dynamic in their interaction with the gas-phase species.
Initial and boundary conditions were supplied to the model by the QualeAria system [25], which provides air quality forecasts over the Italian peninsula, downscaling synoptic scale weather and chemical forecasts from US National Center for Environmental Prediction (NCEP) [26] and Copernicus Atmosphere Monitoring Service (CAMS) [27]. No intermediate nested domains were needed. The time resolution was of 1 h.
FARM needs a complete emission inventory to calculate correctly the chemical reactions that take place in the atmosphere once pollutants are emitted, including all the emission sectors and the pollutants treated by the chemical scheme. Apart from the road transport emissions that were calculated road by road, as described, we used the official regional inventory INEMAR [11]. In the supporting material are listed all the details and comparisons.
Two emission scenarios were considered:
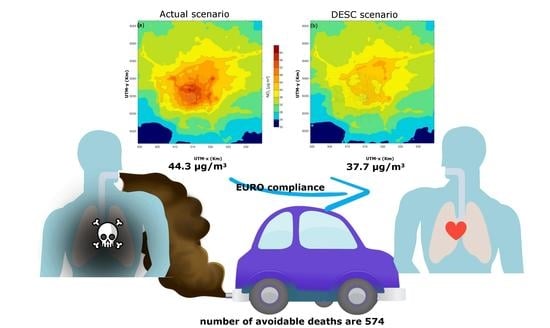
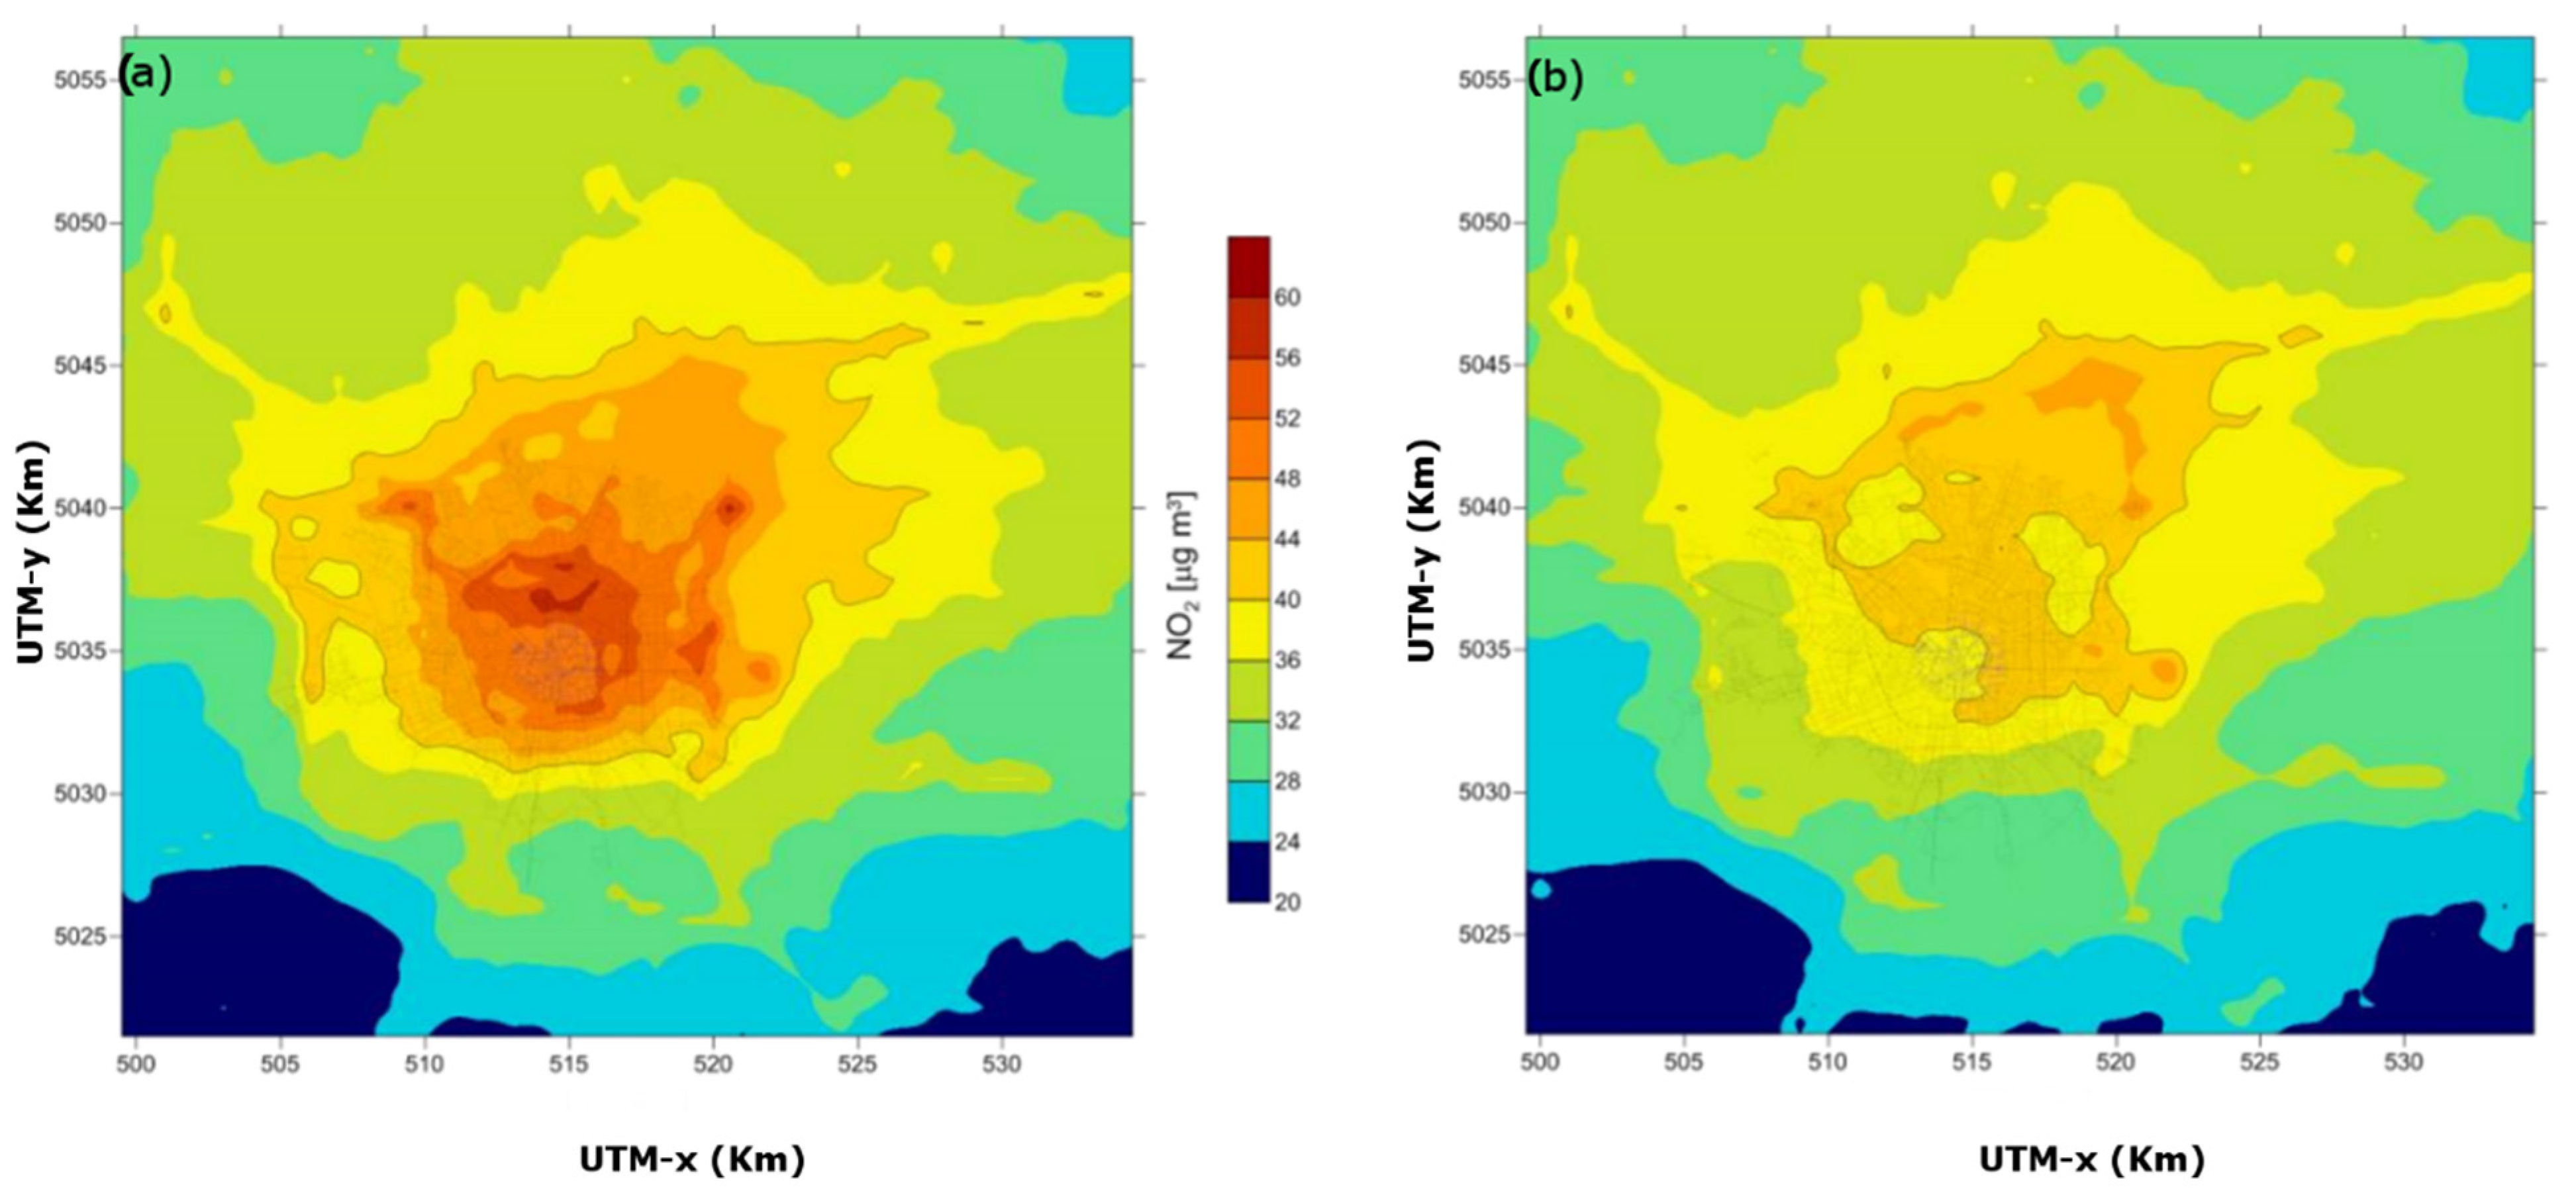
  • Actual: corresponding to the diesel emissions generated by the transport sector, evaluated using COPERT, the official European methodology, estimates. In this real-driving scenario, speed-depending emission factors were considered.
  • Diesel Emission Standards Compliance (DESC): a hypothetical scenario in which all diesel vehicles were supposed to comply with the NOX emission standards in force at their homologation time. In this scenario, vehicles’ diesel NOX emissions were computed as the maximum allowed emissions for each EURO category; the other pollutant emissions remain those calculated for the actual scenario.
The reference year of this study is 2018, the same as the circulating fleet composition on which the road traffic emission calculation is based. The simulation covered the period from 11 February to 11 March. Then annual NO2 concentration averages were extrapolated following the same average behavior of measurements at the monitoring network.
To estimate the mortality attributable to non-compliance of diesel cars with EURO directives, we used the difference in the yearly average of NO2 concentrations between the two scenarios. This parameter is suitable both for the estimation of long-term burden of chronic diseases and for short-term effects of air pollution [28].
The relationship between exposure to NO2 and “natural” mortality, i.e., all-causes mortality excluding accidents, was derived by the paper of Faustini et al. [29]. Estimates of Relative Risk (RR) for an increase of 10 µg/m3 in the annual atmospheric NO2 concentration are heterogeneous between continents, this being probably due to the differences in sources and the different backgrounds of the other pollutants. Therefore, we decided to use only European estimates, using the same weights used by Faustini et al. (2014) [29] in the pooled analysis.
The number of “natural” deaths among residents in Milan was extracted from the Local Health Unit website [30] by subtracting deaths due to accidents and trauma from the total number of deaths.
The RR between the actual and DESC scenarios was evaluated by considering the difference in yearly average exposure to NO2. First, the extra risk was evaluated by multiplying the extra risk for 10 µg/m3 of NO2 derived from Faustini by the exposure difference. The RR for extra exposure was then obtained by adding 1 to this extra risk [31].
The fraction of deaths attributable to the extra exposure (Attributable Risk, RA) was computed using the following the formula [32].
RA = (RR − 1)/RR

3. Results

Table 2 shows the circulating car fleet composition, by fuel and the Euro standard, used to estimate the air pollutant emissions (Province of Milan, year 2018, total annual driven kilometers) and the calculated contributions by the Euro standard to car NOX emissions (kg/h). According to our calculations, diesel cars contribute 50% to the total car urban mileage and 86% to total car NOX emissions. The diesel car categories Euro 4, Euro 5, and Euro 6 represent, respectively, 17%, 16%, and 9% of all circulating cars and 14%, 31%, and 12% of NOX emissions from all cars. Despite their relatively poor presence in the fleet composition (7%), diesel Euro 3 cars still account for 20% of NOX emissions from all cars.
The comparison of diesel emissions and the contribution of other sources under the actual and DESC scenarios to NO2 atmospheric levels is shown in Table 3.
The contribution of other sources has been estimated running the FARM model and using the emission inventory of the Lombardy region [11].
Table 3 includes the calculated absolute contributions of all diesel Euro categories and groups of them on the yearly average of NO2 concentrations.
The total value of 44.3 µg/m3, calculated as the spatial average of the annual average of NO2 concentrations inside the borders of Milan city, is estimated as the sum of the background contribution from other sources and the boundary conditions, using inventory emissions [11] and the actual scenario emissions. Under the DESC scenario, a total figure of 37.7 µg/m3 NO2 annual average is estimated (Figure 1).
The highest estimated absolute contribution in the DESC scenario is from diesel Euro 3 cars (2.79 µg/m3) while the highest absolute contribution in the actual scenario is from diesel Euro 5 cars (5.36 µg/m3). The negative difference between the actual and DESC absolute contributions for diesel Euro 2 cars means that, at least according to the COPERT methodology, this class of cars emits on average in real driving conditions (slightly) less than their emission standard.
The estimated annual mean NO2 in the actual scenario is 44.3 µg/m3 and under the DESC scenario is 37.7 µg/m3. The extra exposure to NO2 of the residents in the town of Milan due to non-compliance of diesel exhaust with the corresponding EURO limits was 6.6 µg/m.
A more detailed description of the FARM model is available as Appendix A1 in the EPHA downloadable report [13].
Table 4 from Faustini et al. [29] reports the evaluation of the RR for a 10 µg/m3 increment in NO2 exposure. A weighted RR of 1.068983 is estimated.
Given an extra exposure of 6.6 µg/m3, an excess risk of RR of 0.045529 = 0.068983 × 6.6/10, and an RR of 1.045529 is obtained. This corresponds to the attributable fraction of 0.043546, i.e., 4.4% of all "natural" deaths. The number of "natural" deaths among the residents in Milan was 13,050 in 2018; therefore, the estimate of the number of attributable deaths to non-compliance of diesel cars and LCVs with EURO standards is 574.

4. Discussion

A performance evaluation of the air quality model with respect to measurements is shown in Table 5. Due to the milder-than-average conditions during the first half of the simulation period, and a consequently limited heating usage, the lower the direct influence of road traffic the higher the model overestimation.
In the actual scenario, the annual mean of NO2 level in Milan was estimated as 44.3 µg/m3 for 2018. Measures carried out by the local environmental agency [10] in the same year showed a 47.4 µg/m3 value, with a standard deviation of 6.83 µg/m3 based on five stations. The value estimated by emissions in the actual scenario is somewhat lower but comparable with that measured in the same year. A more detailed evaluation of this discrepancy is reported as Appendix A2 in the EPHA downloadable report [13].
The WHO [3] proposed an RR for “natural” mortality of 1.055, for levels of NO2 above 20 μg/m3. This estimate is based on the meta-analysis of Hoeck [39], reporting an RR of 1.047. These meta-analyses, however, also include American and Asian studies that report RRs considerably lower than those reported in European studies, which are more applicable to our study case. It seemed more appropriate to limit the parameter estimation for this case to European studies.
The EPA [9] classified the exposure to nitrogen oxides as “Suggestive of, but not sufficient to infer, a causal relationship”. This is largely due to the negative results of the large cohort of the American Cancer Society [40]. That paper is focused on the effects of fine particulate matter and only a univariate result in nitrogen oxides is presented. Due to the high correlation between fine particles and nitrogen oxides, the negative results on NO2 warrant further explanation.
In a recent document [41], a value of 1.076 has been proposed, close to our estimate of 1.069.
In evaluating the RR, we took the reasonable assumption that the link between exposure to NO2 and “natural” mortality is linear. The range we studied is narrow and the exposure values are far from the extreme values for human exposure. Moreover, a threshold value for the NO2 effects was not detected in the WHO evaluation [3].
In epidemiological studies, both spatial and temporal variations in nitrogen dioxide (NO2) are a robust predictor of health risks. Compared to particulate matter, the experimental evidence for harmful effects at typical ambient concentrations is less extensive and not as clear for NO2. However, the nitrogen oxide exposure levels can be confidently used for health damage estimation [42]. Nitrogen oxides are toxic per se and “a marker for the concentrations and risks of the complex combustion-generated pollution mixtures” [43], and road traffic is an important source for these substances [44].

5. Conclusions

An analysis of atmospheric nitrogen oxides emissions from vehicular traffic in the city of Milan was performed using two scenarios: an actual scenario and a Diesel Emission Standards Compliance scenario for diesel cars and light duty vehicles. Then we evaluated the relative risk of mortality considering the difference in yearly average exposure to NO2 in both scenarios.
We estimated 574 extra deaths in 2018 among residents in Milan due to extra exposure to NO2 from non-compliance of diesel cars emissions with their specific EURO standards. In particular, EURO 5 diesel cars and light duty vehicles contribute mostly to this extra exposure.
Non-compliance to EURO guidelines of the actual diesel car fleet is an important determinant of air pollution damage to human health. Diesel emissions are very difficult to limit and are harmful for exposed people; this suggests that diesel vehicles should be strongly limited in urban environments and its selling should be discouraged.

Author Contributions

Conceptualization, P.C., A.P. and M.C.; methodology, P.C.; data acquisition and modelling A.N., N.P., C.P. and C.S.; validation, M.C.; writing—original draft preparation, P.C.; writing—review and editing, M.C. All authors have read and agreed to the published version of the manuscript.

Funding

The estimation of NO2 levels was carried by Arianet and was supported by European Public Health Alliance (EPHA) a.i.s.b.l. 49-51 rue de Trèves–Box 6 1040 Brussels, Belgium. The funder has no role in writing, editing or licensing the report by Arianet.

Institutional Review Board Statement

Not applicable.

Informed Consent Statement

Not applicable.

Data Availability Statement

The data presented in this study are available on request from the corresponding author.

Conflicts of Interest

The authors declare no conflict of interest.

References

  1. IARC. Diesel and Gasoline Engine Exhausts and Some Nitroarenes. IARC Monographs on the Evaluation of Carcinogenic Risks to Humans; IARC: Lyon, France, 2014; Volume 105. [Google Scholar]
  2. USEPA (U.S. Environmental Protection Agency). Health Effects Support Document for Perfluorooctanoic Acid (PFOA); EPA 822R16003; U.S. Environmental Protection Agency: Washington, DC, USA. Available online: https://www.epa.gov/safewater (accessed on 5 May 2016).
  3. WHO. Health Risk of Air Pollution in Europe—HRAPIE Project; WHO: Geneva, Switzerland, 2013. [Google Scholar]
  4. Cohen, A.J.; Brauer, M.; Burnett, R.; Anderson, H.R.; Frostad, J.; Estep, K.; Balakrishnan, K.; Brunekreef, B.; Dandona, L.; Dandona, R.; et al. Estimates and 25-year trends of the global burden of disease attributable to ambient air pollution: An analysis of data from the global burden of diseases study 2015. Lancet 2017, 389, 1907–1918. [Google Scholar] [CrossRef] [Green Version]
  5. Dieselnet. Available online: https://dieselnet.com/standards/eu/ld.php (accessed on 26 October 2020).
  6. Conte, M.; Donateo, A.; Contini, D. Characterisation of particle size distributions and corresponding size-segregated turbulent fluxes simultaneously with CO2 exchange in an urban area. Sci. Total Environ. 2018, 622, 1067–1078. [Google Scholar] [CrossRef] [PubMed]
  7. Conte, M.; Contini, D. Size-resolved particle emission factors of vehicular traffic derived from urban eddy covariance measurements. Environ. Pollut. 2019, 251, 830–838. [Google Scholar] [CrossRef] [PubMed]
  8. Korzhenevych, A.; Dehnen, N.; Bröcker, J.; Holtkamp, M.; Meier, H.; Gibson, G.; Varma, A.; Cox, V. Update of the Handbook on External Costs of Transport. Report. 2014. Available online: https://ec.europa.eu/transport/sites/transport/files/handbook_on_external_costs_of_transport_2014_0.pdf (accessed on 11 January 2021).
  9. U.S. EPA. Integrated Science Assessment (ISA) for Oxides of Nitrogen—Health Criteria; EPA/600/R-15/068; Final Report; U.S. Environmental Protection Agency: Washington, DC, USA, 2016.
  10. ARPA Lombardia. Rapporto Annuale Sulla Qualità Dell’aria. 2019. Available online: https://www.arpalombardia.it/qariafiles/RelazioniAnnuali/RQA_MI_2018.pdf (accessed on 2 October 2020).
  11. ARPA Lombardia. INEMAR Inventario Emissioni Aria Regione Lombardia. 2017. Available online: https://www.inemar.eu/xwiki/bin/view/InemarDatiWeb/Aggiornamenti+dell%27inventario+2014 (accessed on 2 October 2020).
  12. Silibello, C.; Nanni, A.; Pepe, N.; Calori, G.; Brusasca, G. Milano senza diesel: Quanto migliorerebbe la qualità dell’aria? Ing. dell’Ambiente 2020, 2. [Google Scholar] [CrossRef]
  13. EPHA. 2020. Available online: https://epha.org/dieselgate-5-years-later-experts-estimate-over-500-premature-deaths-in-milan (accessed on 11 February 2020).
  14. NCAR. WRF—Weather Research & Forecasting Model. 2021. Available online: https://www.mmm.ucar.edu/weather-research-and-forecasting-model (accessed on 19 February 2021).
  15. Skamarock, W.C.; Klemp, J.B.; Dudhia, J.; Gill, D.O.; Barker, D.M.; Duda, M.G.; Huang, X.Y.; Wang, W.; Powers, J.G. A Description of the Advanced Research WRF Version 3; NCAR Tech. Note NCAR/TN-4751STR; National Center for Atmospheric Research: Boulder, CO, USA, 2008; 113p. [Google Scholar] [CrossRef]
  16. US National Centers for Environmental Information (NOAA)—Global Forecast System (GFS). Available online: https://www.ncdc.noaa.gov/data-access/model-data/model-datasets/global-forcast-system-gfs (accessed on 23 February 2021).
  17. EMEP/EEA. Atmospheric Emissions Inventory Guidebook. 2019. Available online: https://www.eea.europa.eu/publications/emep-eea-guidebook-2019/part-b-sectoral-guidance-chapters/1-energy/1-a-combustion/1-a-3-b-i/view (accessed on 2 October 2020).
  18. ARIANET. TREFIC—Traffic Emission Factors Improved Calculator. 2014. Available online: http://www.aria-net.it/front/ENG/codes/files/7.pdf (accessed on 5 March 2021).
  19. Gariazzo, C.; Silibello, C.; Finardi, S.; Radice, P.; Piersanti, A.; Calori, G.; Cecinato, A.; Perrino, C.; Nussio, F.; Cagnoli, M.; et al. A gas/aerosol air pollutants study over the urban area of Rome using a comprehensivechemical transport model. Atmos. Environ. 2007, 41, 7286–7303. [Google Scholar] [CrossRef]
  20. Silibello, C.; Calori, G.; Brusasca, G.; Giudici, A.; Angelino, E.; Fossati, G.; Peroni, E.; Buganza, E. Modelling of PM10 Concentrations Over Milano Urban Area Using Two Aerosol Modules. Environ. Model. Softw. 2008, 23, 333–343. [Google Scholar] [CrossRef]
  21. Bessagnet, B.; Pirovano, G.; Mircea, M.; Cuvelier, C.; Aulinger, A.; Calori, G.; Ciarelli, G.; Manders, A.; Stern, R.; Tsyro, S.; et al. Presentation of the EURODELTA III intercomparison exercise—Evaluation of the chemistry transport models’ performance on criteria pollutants and joint analysis with meteorology. Atmos. Chem. Phys. 2016, 16, 12667–12701. [Google Scholar] [CrossRef] [Green Version]
  22. Mircea, M.; Bessagnet, B.; D’Isidoro, M.; Pirovano, G.; Aksoyoglu, S.; Ciarelli, G.; Tsyro, S.; Manders, A.; Bieser, J.; Stern, R.; et al. EURODELTA III exercise: An evaluation of air quality models’ capacity to reproduce the carbonaceous aerosol. Atmos. Environ. X 2019, 2, 100018. [Google Scholar] [CrossRef]
  23. Binkowski, F.S. The Aerosol Portion of Models-3 CMAQ. In Science Algorithms of the EPA Models-3 Community Multiscale Air Quality (CMAQ) Modeling System; Part II: Chapters 9–18; EPA-600/R-99/030; Byun, D.W., Ching, J.K.S., Eds.; National Exposure Research Laboratory, U.S. Environmental Protection Agency: Research Triangle Park, NC, USA, 1999; pp. 10-1–10-16. [Google Scholar]
  24. Carter, W.P.L. Implementation of the SAPRC-99 Chemical Mechanism into the Models-3 Framework. Report to the United States Environmental Protection Agency. 2000. Available online: http://www.cert.ucr.edu/carter/absts.htm#s99mod3S (accessed on 5 March 2021).
  25. ARIANET. QualeAria Forecast System for the Air Quality in Italy and Europe. Available online: https://www.qualearia.it (accessed on 22 February 2021).
  26. US National Center for Environmental Prediction (NCEP). Available online: https://www.ncep.noaa.gov/ (accessed on 22 February 2021).
  27. Copernicus Atmosphere Monitoring Service (CAMS). Available online: https://atmosphere.copernicus.eu/ (accessed on 22 February 2021).
  28. Ostro, B.; Chestnut, L. Assessing the health benefits of reducing particulate matter air pollution in United States. Environ. Res. 1998, A76, 94–106. [Google Scholar] [CrossRef] [PubMed]
  29. Faustini, A.; Rapp, R.; Forastiere, F. Nitrogen dioxide and mortality: Review and meta-analysis of long-term studies. Eur. Respir. J. 2014, 44, 744–753. [Google Scholar] [CrossRef] [PubMed] [Green Version]
  30. ATS Milano. Selected “Milano”. Available online: https://portale.ats-milano.it/salute/stato_salute.php?stato_salute (accessed on 16 May 2020).
  31. Crosignani, P.; Borgini, A.; Cadum, E.; Mirabelli, D.; Porro, E. New directions: Air pollution—How many victims? Atmos. Environ. 2002, 36, 4705–4706. [Google Scholar] [CrossRef]
  32. Rothman, K.J.; Greenland, S.; Lash, T.L. Modern Epidemiology, 3rd ed.; Lippincott Williams & Wilkins: Philadelphia, PA, USA, 2008. [Google Scholar]
  33. Cesaroni, G.; Badaloni, C.; Gariazzo, C.; Stafoggia, M.; Sozzi, R.; Davoli, M.; Forastiere, F. Long-term exposure to urban air pollution and mortality in a cohort of more than a million adults in Rome. Environ. Health Perspect. 2013, 121, 324–331. [Google Scholar] [CrossRef] [Green Version]
  34. Heinrich, J.; Thiering, E.; Rzehak, P.; Krämer, U.; Hochadel, M.; Rauchfuss, K.M.; Gehring, U.; Wichmann, H.-E. Long-term exposure to NO2 and PM10 and all-cause and cause-specific mortality in a prospective cohort of females. Occup. Environ. Med. 2013, 70, 179–186. [Google Scholar] [CrossRef] [Green Version]
  35. Maheswaran, R.; Pearson, T.; Smeeton, N.C.; Beevers, S.; Campbell, M.J.; Wolfe, C.D. Impact of outdoor air pollution on survival after stroke: Population based cohort study. Stroke 2010, 41, 869–877. [Google Scholar] [CrossRef] [PubMed] [Green Version]
  36. Beelen, R.; Hoek, G.; van den Brandt, P.A.; Goldbohm, R.A.; Fischer, P.; Schouten, L.J.; Jerrett, M.; Hughes, E.; Armstron, B.; Brunekreef, B. Long-term effects of traffic-related air pollution on mortality in a Dutch cohort (NLCS-AIR Study). Environ. Health Perspect. 2008, 116, 196–202. [Google Scholar] [CrossRef] [PubMed]
  37. Gehring, U.; Heinrich, J.; Krämer, U.; Grote, V.; Hochadel, M.; Sugiri, D.; Kraft, M.; Rauchfuss, K.; Eberwein, H.G.; Wichmann, H.-E. Long-term exposure to ambient air pollution and cardiopulmonary mortality in females. Epidemiology 2006, 17, 545–551. [Google Scholar] [CrossRef] [PubMed]
  38. Filleul, L.; Rondeau, V.; Vandentorren, S.; Le Moual, N.; Cantagrel, A.; Annesi-Maesano, I.; Charpin, D.; Declercq, C.; Neukirch, F.; Paris, C.; et al. Twenty five year mortality and air pollution: Results from the French PAARC survey. Occup. Environ. Med. 2005, 62, 453–460. [Google Scholar] [CrossRef] [PubMed] [Green Version]
  39. Hoek, G.; Krishnan, R.M.; Beelen, R.; Peters, A.; Ostro, B.; Brunekreef, B.; Kaufman, J.D. Long-term air pollution exposure and cardio- respiratory mortality: A review. Environ. Health 2013, 12, 43. [Google Scholar] [CrossRef] [PubMed] [Green Version]
  40. Pope, A., III; Burnet, R.T.; Thun, M.J.; Calle, E.E.; Krewski, D.; Ito, K.; Thurston, G.D. Lung cancer, Cardiopulmonary mortality and long-term exposure to fine particulate air pollution. JAMA 2002, 287, 1132–1141. [Google Scholar] [CrossRef] [PubMed] [Green Version]
  41. CE Delft. Further Explanation of Methods Used for Monetizing Impacts from Air Pollution. 2020. Available online: https://www.cedelft.eu/assets/upload/file/Rapporten/2020/CE_Delft_180005_Further_explanation_of_methods_used_for_monetizing_impacts_from_air_pollution_def.pdf (accessed on 6 November 2020).
  42. Moshammer, H.; Poteser, M.; Kundi, M.; Lemmerer, K.; Weitensfelder, L.; Wallner, P.; Hutter, H.P. Nitrogen-Dioxide Remains a Valid Air Quality Indicator. Int. J. Environ. Res. Public Health 2020, 17, 3733. [Google Scholar] [CrossRef] [PubMed]
  43. Forastiere, F.; Peters, A.; Kelly, F.J.; Holgate, S.T. Nitrogen Dioxide. In Air Quality Guidelines Global Update 2005; WHO Europe: Copenhagen, Denmark, 2006; Available online: https://www.euro.who.int/__data/assets/pdf_file/0005/78638/E90038.pdf (accessed on 11 November 2020).
  44. HEI. HEI Panel on the Health Effects of Traffic-Related Air Pollution. In Traffic-Related Air Pollution: A Critical Review of the Literature on Emissions, Exposure, and Health Effects; HEI Special Report 17; Health Effects Institute: Boston, MA, USA, 2010. [Google Scholar]
Figure 1. The estimated annual mean NO2 under the actual scenario (a) and DESC scenario (b). Concentration levels: red for high values and blue for low values.
Atmosphere 12 00342 g001
Table 1. Advance Research Weather Research and Forecasting (WRF-ARW), the Physics options.
WRF Physics SchemeDescription
MicrophysicsSingle-Moment 6-class scheme (ice, snow and graupel processes)
Longwave Radiation RRTM (Rapid Radiative Transfer Model)
Shortwave RadiationRRTM (Rapid Radiative Transfer Model)
Cumulus Parameterization Kain–Fritsch scheme (deep and shallow convection)
Land Surface Noah-MP (multi-physics) Land Surface Model
Surface LayerMYNN (Nakanishi and Niino PBL’s surface layer scheme).
Planetary Boundary layerMYNN2 (Mellor–Yamada Nakanishi and Niino Level 2.5 PBL)
Table 2. Province of Milan (2018): Circulating car fleet composition by fuel and the Euro standard (total annual driven kilometers), and the contributions by Euro standard to NOX car emissions (t/y).
FuelEuro StandardAnnual km × VehiclesNOX Emissions (t/y)
PetrolEuro 05,846,5680.1%674.213.9%
Euro 134,597,6970.7%
Euro 2197,116,7384.2%
Euro 3205,461,7594.4%
Euro 4566,541,25612.0%
Euro 5458,313,3899.7%
Euro 6378,787,9338.0%
DieselEuro 012,681,6100.3%92.91.9%
Euro 14,026,8080.1%54.71.1%
Euro 240,356,3200.9%262.75.4%
Euro 3313,638,0056.6%963.119.9%
Euro 4822,463,44817.4%697.414.4%
Euro 5751,938,66715.9%1510.531.2%
Euro 6416,170,0638.8%582.712.0%
HybridEuro 05,846,5680.1%0.60.01%
Euro 13,283,5580.1%
Euro 213,158,8650.3%
Euro 318,487,0340.4%
Euro 4238,687,2855.1%
Euro 5198,080,7704.2%
Euro 633,316,3940.7%
Table 3. Contribution of diesel vehicles to yearly NO2 concentration (µg/m3) under the actual and DESC scenarios.
Diesel CategoryActualDESCActual—DESC
Euro 00.330.330.00
Euro 10.190.23−0.04
Euro 20.941.16−0.22
Euro 33.432.790.64
Euro 42.491.221.27
Euro 55.361.733.63
Euro 6B1.350.430.92
Euro 6C1.070.650.42
TOTAL diesel15.168.54
Other sources29.1029.10
Total NO244.2637.64
Table 4. Relative risks of natural mortality with increasing chronic exposure to NO2 by 10 µg/m3. Meta-analysis of European studies (from Faustini et al. (2014) [29]).
StudyWeightRR
Cesaroni et al. [33]13.051.03
Heinrich et al. [34]3.521.13
Maheswaran et al. [35]2.01.28
Beelen et al. [36]11.311.03
Gehring et al. [37]6.221.08
Filleul et al. [38]3.441.14
Sum of weights39.54
RR weighted1.068983
Table 5. Yearly NO2 concentrations (µg/m3) calculated by the model compared with measurements at urban and suburban air quality stations. Actual scenario.
Marche
(Traffic)
Liguria
(Traffic)
Senato
(Traffic)
Zavattari
(Traffic)
Verziere
(Traffic)
Pascal
(Background)
Abbiategrasso
(Background)
Parco Lambro
(Suburban Background)
Measured (M)64.455.954.150.548.144.535.035.1
Computed (C)66.468.466.874.266.455.254.463.0
C/M1.031.221.241.471.381.241.551.79
Publisher’s Note: MDPI stays neutral with regard to jurisdictional claims in published maps and institutional affiliations.

