Article

Potential Source Contribution Function Analysis of High Latitude Dust Sources over the Arctic: Preliminary Results and Prospects

by
Stefano Crocchianti
1,
Beatrice Moroni
1,*,
Pavla Dagsson Waldhauserová
2,3,
Silvia Becagli
4,
Mirko Severi
4,
Rita Traversi
4 and
David Cappelletti
1
1
Department of Chemistry, Biology and Biotechnology, University of Perugia, 06123 Perugia, Italy
2
Faculty of Environmental and Forest Sciences, Agricultural University of Iceland, 311 Hvanneyri, Iceland
3
Faculty of Environmental Sciences, Czech University of Life Sciences Prague, 165 00 Prague, Czech Republic
4
Department of Chemistry, University of Florence, 50019 Sesto Fiorentino, Italy
*
Author to whom correspondence should be addressed.
Atmosphere 2021, 12(3), 347; https://doi.org/10.3390/atmos12030347
Submission received: 5 February 2021 / Revised: 27 February 2021 / Accepted: 2 March 2021 / Published: 7 March 2021
(This article belongs to the Special Issue Long-Range Transport of Dust over the High-Latitude Regions)

Abstract

:
The results of a preliminary investigation of the dust sources in the Arctic based on their geochemical properties by potential source contribution function (PSCF) analysis are presented in this paper. For this purpose, we considered one year of aerosol geochemical data from Ny-Ålesund, Svalbard, and a short list of chemical elements (i.e., Al, Fe, Mn, Ti, Cr, V, Ni, Cu, and Zn) variably related to the dust fraction. Based on PSCF analysis: (i) four different dust source areas (i.e., Eurasia, Greenland, Arctic-Alaska, and Iceland) were characterized by distinguishing geochemical ranges and seasonal occurrence; and (ii) a series of typical dust days from the distinct source areas were identified based on the corresponding back trajectory patterns. Icelandic dust samples revealed peculiar but very variable characteristics in relation to their geographical source regions marked by air mass back trajectories. The comparison between pure and mixed Icelandic dust samples (i.e., aerosols containing Icelandic dust along with natural and/or anthropogenic components) revealed the occurrence of different mixing situations. Comparison with Icelandic soils proved the existence of dilution effects related to the emission and the transport processes.

1. Introduction

The Arctic is known to be warming faster than the rest of the world in response to changes in greenhouse gases, aerosols, and other climate drivers, a process called Arctic amplification [1]. It has been suggested that mineral dust contributes to Arctic amplification [2,3,4]. In particular light-absorbing particulate deposited on snow can reduce surface albedo and enhance the melting of snow and ice. Mineral dust can also affect the radiative forcing in the Arctic through direct and indirect effects [3,5,6].
Studies on global and regional air mass atmospheric circulation reveal a significant contribution of dust from high latitude (>60° N) sources in the air masses reaching the Arctic [7,8,9]. The amount of this contribution is expected to increase in the future in response to global warming which exposes more ice-free areas to dust emissions. High latitude dust (HLD) sources have been found to contribute ~52% and ~39% of the annual instantaneous radiative forcing (IRF) in the Arctic in the bottom of the atmosphere (BOA) and the top of the atmosphere (TOA), respectively, while mineral dust deposited on snow accounts for nearly all (∼99%) of the BOA IRF [5]. A different impact of dust on IRF can be postulated due to the nature and abundance of the constituent particles, mainly iron oxides [10].
Iceland is the most important and the best-known HLD source in the Northern hemisphere [11]. There, intense eruptive activity occurs generating fresh basaltic materials that are subjected to strong aeolian and glacial processes in extensive desert areas [12,13]. Recent studies (e.g., [5,14]) have revealed significant ice nucleating and remarkable radiative forcing properties of Icelandic dust. These latter properties are, in turn, strictly related to the geological nature and the climatic condition of the sourcing area. In particular, the general lack of quartz and clay minerals and the variable amount of basaltic glass are clear markers of a volcanic source of tholeiitic-transitional alkaline composition exposed to the main action of fluvial and glacial erosion in a humid cold climate [12,15]. This distinguishes Icelandic dust from dust of different HLD sources.
The source areas of dust reaching Ny-Ålesund, Svalbard, were investigated by combining mineralogical and geochemical data of the aerosols at the receptor site with the back trajectory (BT) calculation [16]. This combined approach revealed the metal oxide glass particles as the most representative and distinguishing mineralogical/phase markers of Icelandic dust among the aerosols reaching the Arctic from different HLD sources. However, and apart from Iceland, the applied approach gives no possibility to discriminate the source areas of dust just looking to the phase composition if no additional constrain related to the air mass long-range transport routes is provided.
A more robust approach of dust sourcing is made available by potential source contribution function (PSCF) analysis. This method associates the BTs to the chemical data at a receptor site on a statistical basis in order to identify the sources of the phases of interest [17]. This method was applied to the aerosols collected at two different sites in the Mediterranean area to distinguish the source areas of each contribution (e.g., mineral dust, anthropogenic, marine, biomass burning) to the aerosol at each site [18,19]. Compared to the other methods of source apportionment applied (e.g., PMF, CF; [18]), PSCF recognized and discriminated well both distinct aerosol sources, as well as dust sources [19].
The main objective of this study was to apply the PSCF analysis of high latitude dust sources in the Arctic to distinguish them from each other and, more importantly, from Iceland based on their respective geochemical patterns. Additional objectives were to: (i) find out the distinctive features of Icelandic dust in respect to the other high latitude dust sources; (ii) evaluate the influence of mixed (e.g., natural and anthropogenic) sources in the characteristics of Icelandic dust; and (iii) provide evidence of dilution and sorting effects during long-range transport of Icelandic dust from its original uplift to its final settling in the Arctic.

2. Materials and Methods

2.1. Aerosol Samples

Aerosol samples were collected at the Gruvebadet site, an Italian research facility located about 700 m SW from the Ny-Ålesund village. The station has been active since 2009 and is devoted to the study of the physical, optical and chemical properties of the Arctic aerosol at ground level [20,21,22]. The site is equipped with a set of measurement and sampling devices, the latter operating with different filter media. In this paper we consider the daily PM10 samples collected on PTFE filters (Pall Corporation, MI, USA; 47 mm diameter, 2.0 μm nominal porosity, capture efficiency of 99.6% for 0.3 μm particles) using an automatic low-volume sampler (TECORA Skypost PM) operating at a flow of 38.33 L min−1.
PM10 mass was determined by weighing the filter before and after the sampling by means of a 5-digit microbalance (Sartorius ME235P). The filters were conditioned for 48 h (25 °C and 50% relative humidity) before weighing.
A total number of 196 PM10 aerosol samples were collected from 27 February to 21 October 2015, which is the annual opening period of the station that year. The time series of PM10 concentration is reported in Figure 1. PM10 values show a rather regular trend during the year characterized by a number of narrow concentration peaks on a slightly wavy background. Three main peak events were registered in spring (15 March: 16.2 μg/m3), summer (10–11 July: 14.6 and 12.3 μg/m3) and fall (8 October: 8.46 μg/m3), with baseline values fixed at 1.5 μg/m3 in winter to early summer to 0.5 μg/m3 in the following period. The average of PM10 values in the whole period of sample collection is 2.60 μg/m3 (Table 1).

2.2. Chemical Analyses

Daily PM10 samples are typically subjected to chemical analyses using different analytical methods based on ion chromatography and the inductively coupled plasma mass spectrometer (ICP-MS) in order to achieve the broadest possible chemical characterization [22]. Regarding this work, the total concentration of the investigated metals was determined by ICP–MS spectroscopy after acid digestion of the samples in an HNO3:H2O2 mixture assisted by a microwave oven (MARS Xpress, CEM). In particular, the analytical measurements were carried out by an ELEMENT2 (Thermo Fisher Scientific, Massachusetts, USA) ICP-MS instrument, a double focusing magnetic sector field ICP-SF-MS coupled with a desolvation system provided with a microflow nebulizer. Although the instrument can operate in the 5–260 amu mass range, up to 10,000 resolution level, high resolution was not used here due to the need of enhancing sensitivity because of very low concentration values of trace metals (especially V and Ni).
Since one of the major hinderances in accurate determination of ICP-SF-MS measurements is the formation of oxides in the plasma, due to the presence of water in the sample solutions, an APEX HF desolvating system (ESI, NE, USA) was used. All the operative settings of the instrument were checked and optimized daily.
As concerning operational protocol, particular attention was devoted to minimize contamination in every step of sample treatment and analysis. To this purpose, all the used solutions had a high level of certified purity. Acidic solutions used for dilution and cleaning were prepared from concentrated sub-boiled (s.b.) HNO3, obtained by DST-1000 (Savillex, MN, USA) acid purification system, from 65% reagent grade nitric (Carlo Erba Milano, Italy). Suprapur® grade 30% H2O2 (Merck KGaA Darmstadt, Germany) was used to complete the digestion. The preparation of the diluted 1% HNO3 and all the cleaning procedures, were carried out using Milli-Q ultrapure water (18 MΩ·cm), obtained by MilliporeSigma (Burlington, MA, USA) purification system.
Every filter was cut into two halves (by a stainless steel blade, inside a Class 10,000 clean laboratory), allowing the determination of other chemical markers on the same sample [22]. Each portion of the filter was then treated by a microwave digestion system (Mars Xpress, CEM SRL Bergamo, Italy), according to UNI EN 14902:2005 standard method for Pb, Cd, As and Ni analysis. Thus, each filter was added to 2 mL of concentrated s.b. HNO3 and 0.5 mL of H2O2, in clean Teflon-PFA vessels. Further details of the analytical procedures can be found in [23].

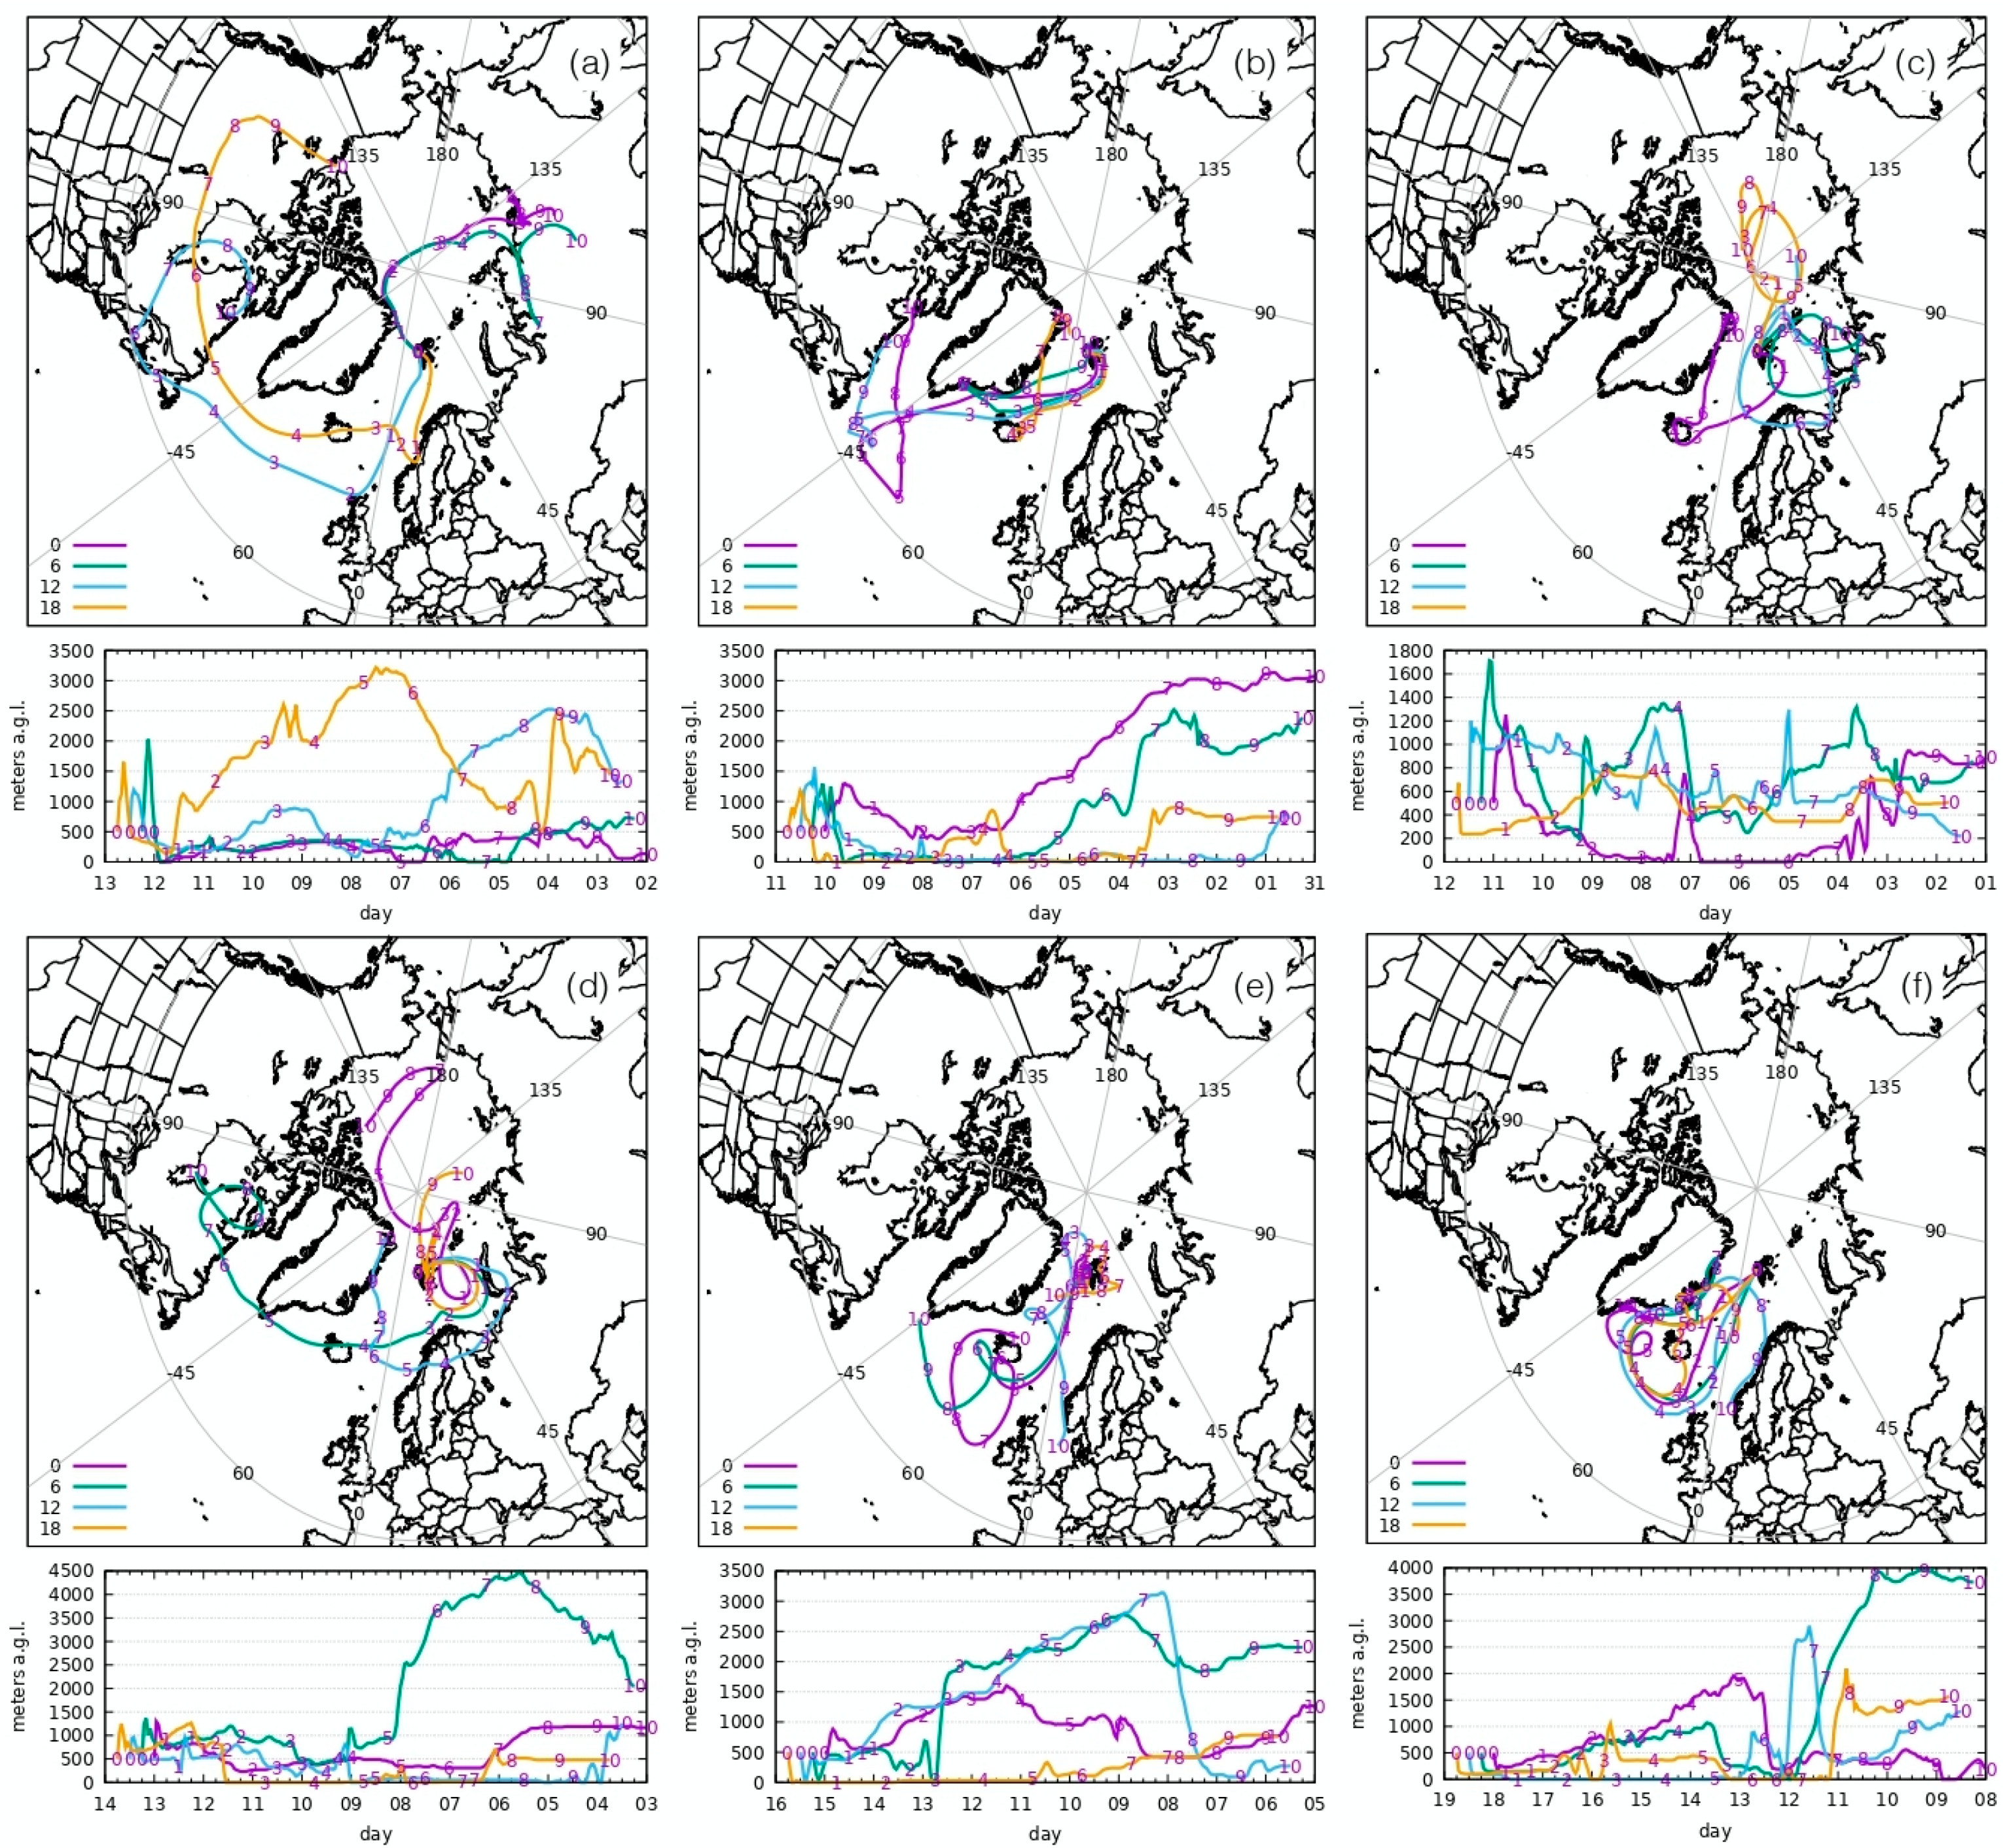
2.3. Air Mass Back Trajectories

Air mass back-trajectories (BTs) were calculated using the NOAA ARL HYSPLIT 4 rev. 513 transport model [24] installed on a 1 + 4 × 4 Intel Xeon E4572@3GHz cores cluster with 16 GB of main memory. GDAS meteorological input fields with 0.5° × 0.5° resolution and a propagation time of 240 h were employed. The trajectories were calculated for the whole year of 2015 every six hours for an endpoint of 500 m a.g.l. above Ny-Ålesund. These parameters were chosen according to the procedure detailed in [18]. This fairly high resolution was employed due to the considerably long propagation time, while the height of the trajectories endpoint was selected to reduce the impact of numerical artifacts.

2.4. Potential Source Contribution Function Analysis

A potential source contribution function (PSCF) analysis was applied to the BTs of air masses arriving at Ny-Ålesund in the period of interest. Details of the PSCF methodology employed here are described in [18]. This method calculates the probability distribution of the location of a source by superimposing a grid on the territory and estimating the fraction of time that a trajectory spent on each cell before inducing a concentration greater than a reference value at the receptor site. In this work the same FORTRAN code, using the 90th percentile as the concentration threshold, and the same weight parametrization were also employed. The analysis considered the set of metals determined in the PM10 samples used as dust chemical markers.

3. Results and Discussion

3.1. Dust Sources and Dust Events

The following chemical elements were considered in the PSCF analysis: Al, Fe, Mn, Ti, Cr, V, Ni, Cu, and Zn. The first four elements are known to be directly related to the composition of dust as they are the main constituents of different silicates and ore minerals [25]. Al and Ti, in particular, are commonly used as tracers of mineral dust in aerosol samples [26] due to their main origin from continental crust and to their relatively high abundance in crustal material (e.g., [27]). Cr, V, and Ni, in turn, are present in rocks and soils as vicariant ions of iron in ferromagnesian minerals and related phases [28]. They can, thus, be connected to the dust sources as well (e.g., [29]). Cu and Zn are naturally present and ubiquitous in soils, where they mostly derive from metal ore and carbonate bearing minerals, although human activities may contribute to the input of these metals to soils by urban/industrial activities or agriculture [30].
The mean (Avg.) and the relative standard deviation (RSD) of the metal concentrations in the entire sampling period are reported in Table 1. Fe and Al are by far the most abundant chemical elements in the aerosols, followed by Ti (~20 times less abundant), Cr and Mn (~60 times less abundant), Ni, Cu, and V (130 to 600 times less abundant). RSD values range from 120% (for Al) to 270% (for Ti). Zn average concentration is 4.17 ng/m3 with comparable RSD values, but often below the detection limit.
The PSCF probability plots for the dust chemical markers at Ny-Ålesund are reported in Figure 2. In the plots the correlation between different elements in different geographic source regions emerge: (i) Al, Fe, Mn, Ti, Cr, and V distributions identify a wide source region in Eurasia, including Scandinavia (Al, Mn, Ti, V), the Kola peninsula (Al, Fe, Mn, Ti, V), and small areas located in the Siberian plane and the Kazakistan plateau (Al, Fe, Mn, Ti, Cr, V); (ii) Fe, Cr, and V show a common source area in E-Iceland; (iii) Fe, Cr, and Ti correlate in the Western coast of Greenland; and (iv) Mn and V show a common sharp distribution over Alaska. Ni, Cu, and Zn do not show any significant cross-correlation over continental areas, and therefore their relevance as soil markers can be neglected.
The daily chemical data contributing to the probability plots were extrapolated in order to distinguish the main dust events over Ny-Ålesund based on their sources. The dates and corresponding chemical markers of the dust events are reported in Table 2, while the raw data at daily resolution affecting the PSCF plots, distinguished by identified source area, are reported in Table 1. A different seasonal occurrence of the dust events from different sources is evidenced, namely early spring for Eurasia, late spring to late summer for Iceland, spring and autumn for Greenland and summer for Alaska. These observations are in good accordance with long-term observations at Ny-Ålesund and, after all, with the general model of atmospheric circulation in the high latitude regions (e.g., [31,32]). Most of the events are characterized by aerosol mass concentrations not exceeding 4 μg/m3, with only one main exception being represented by the peak event registered on 10–14 July. This latter coincided with an extreme wildfire biomass burning advection event from the Yukon-Koyukuk taiga region that affected the Svalbard archipelago in mid-July 2015, with some aerosol persisting in the stratosphere for at least one month after the advection [33,34].

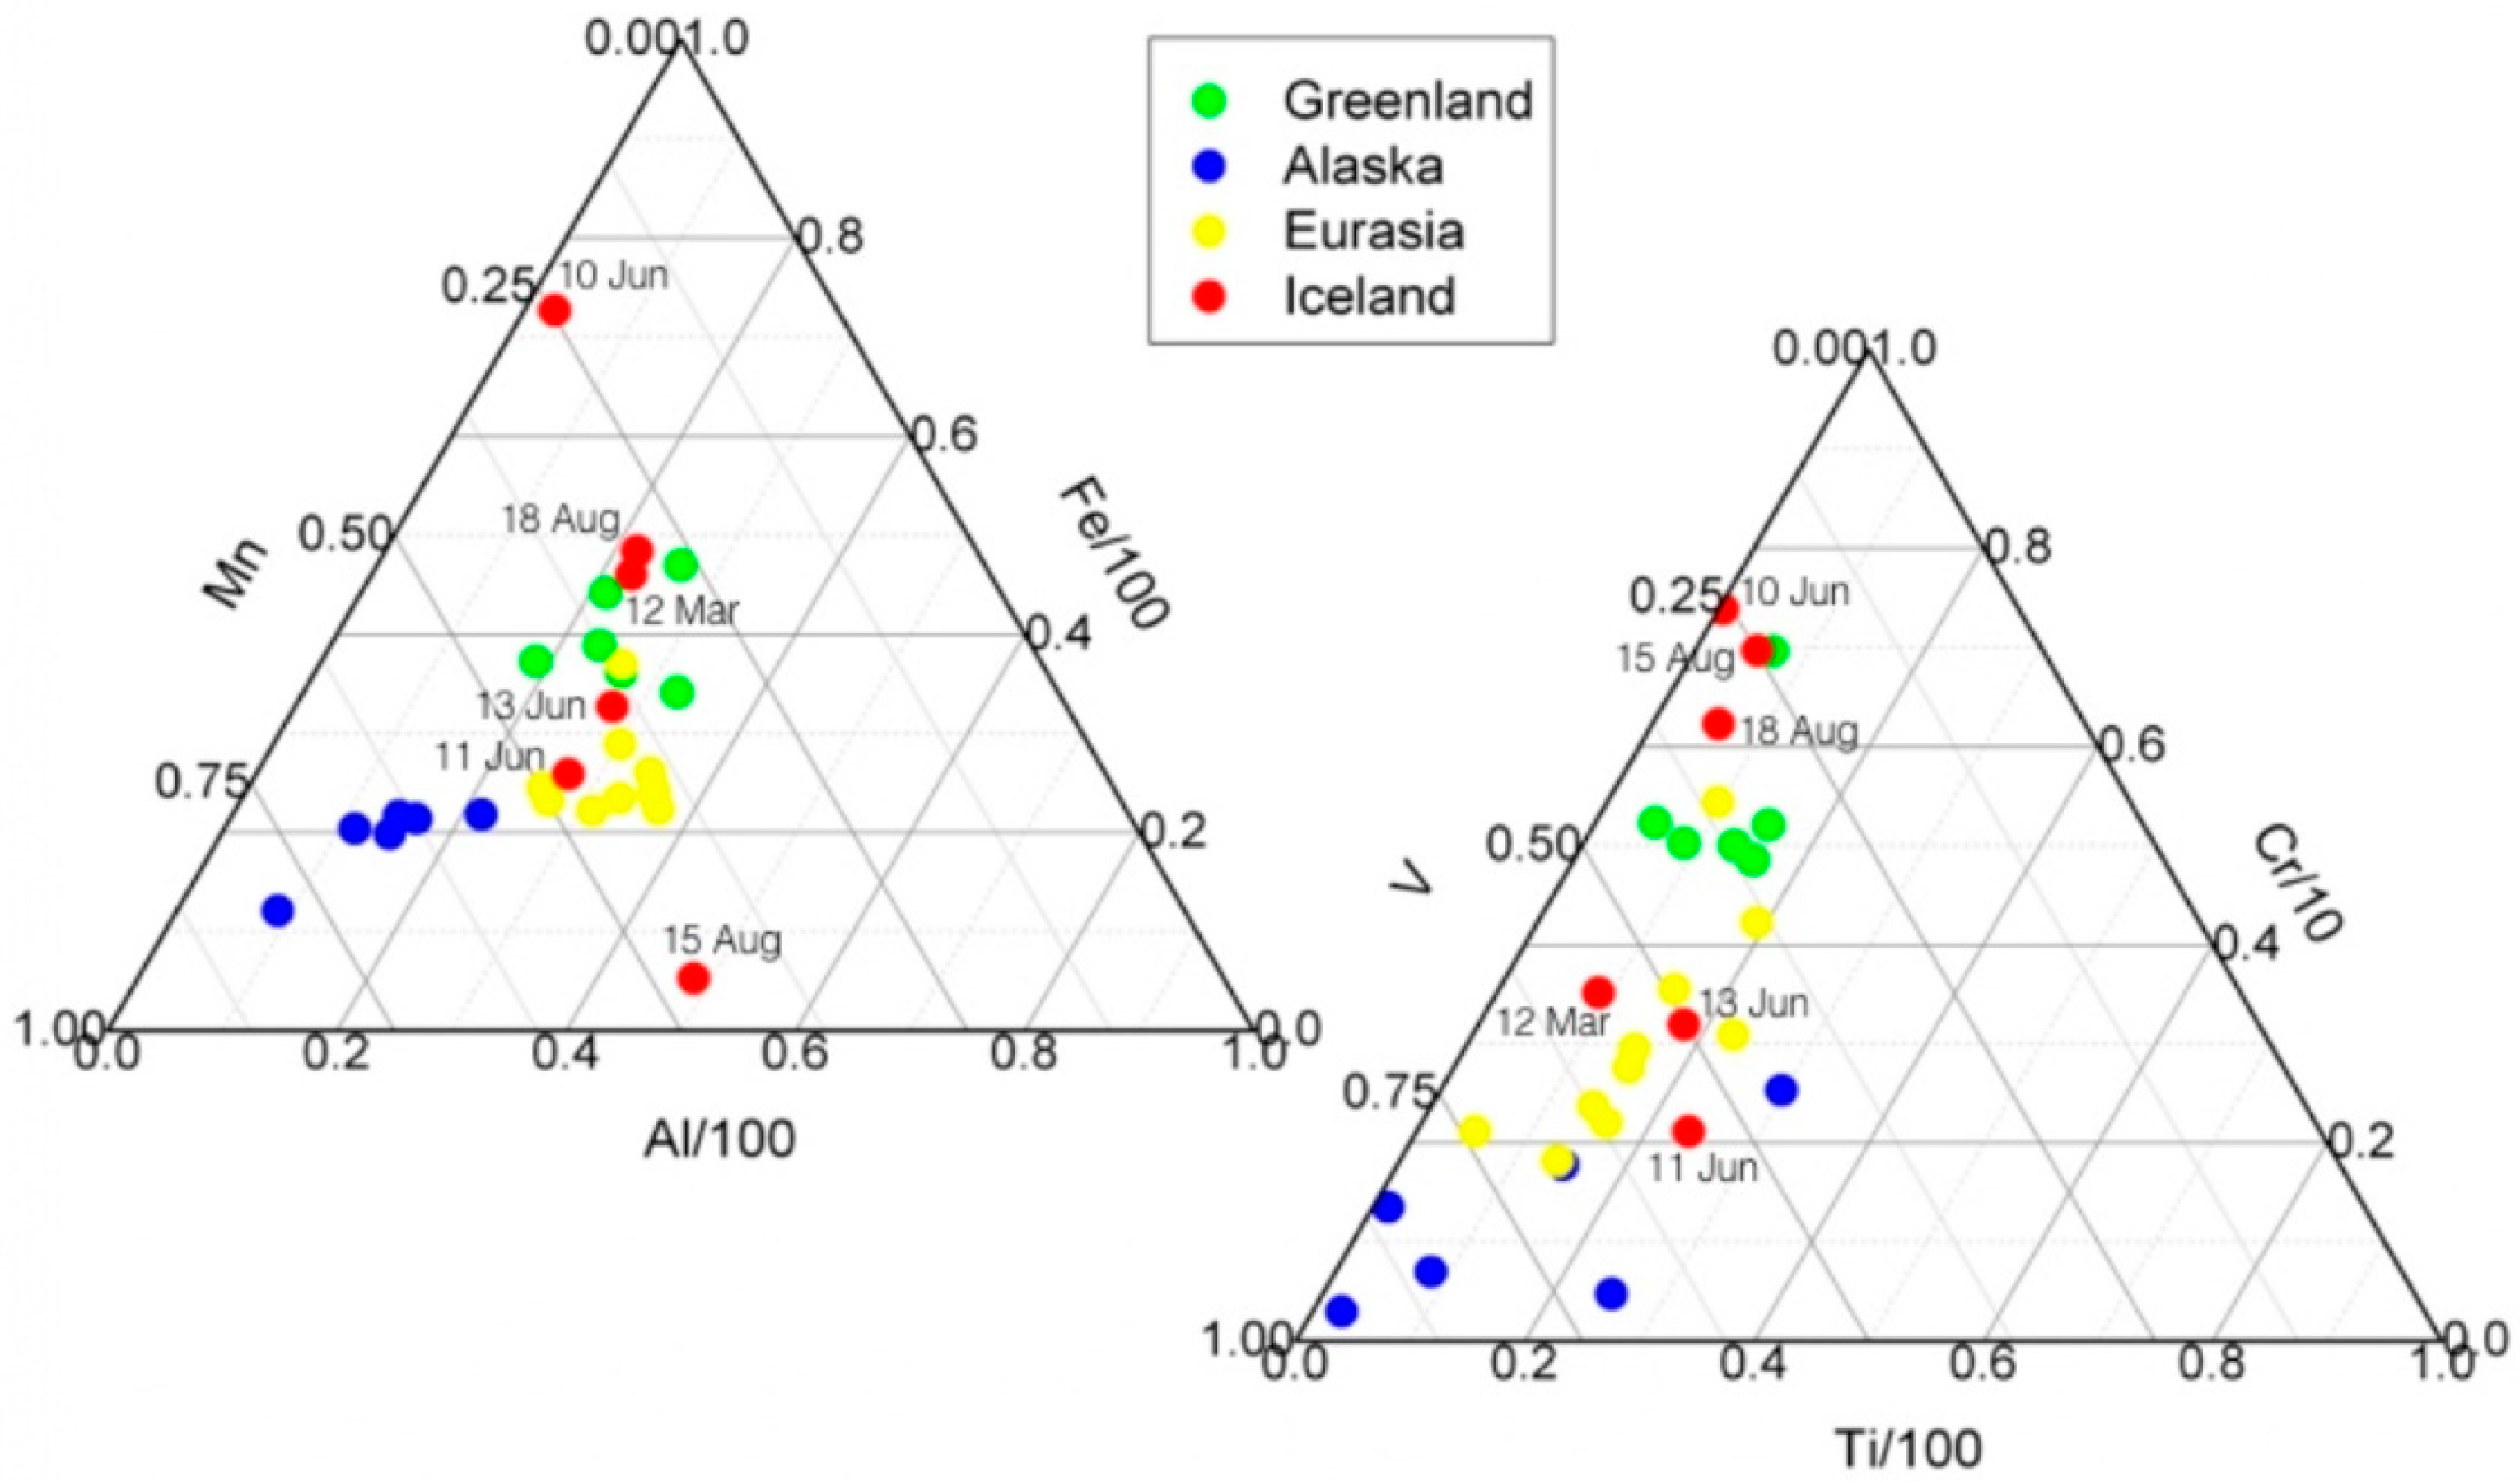
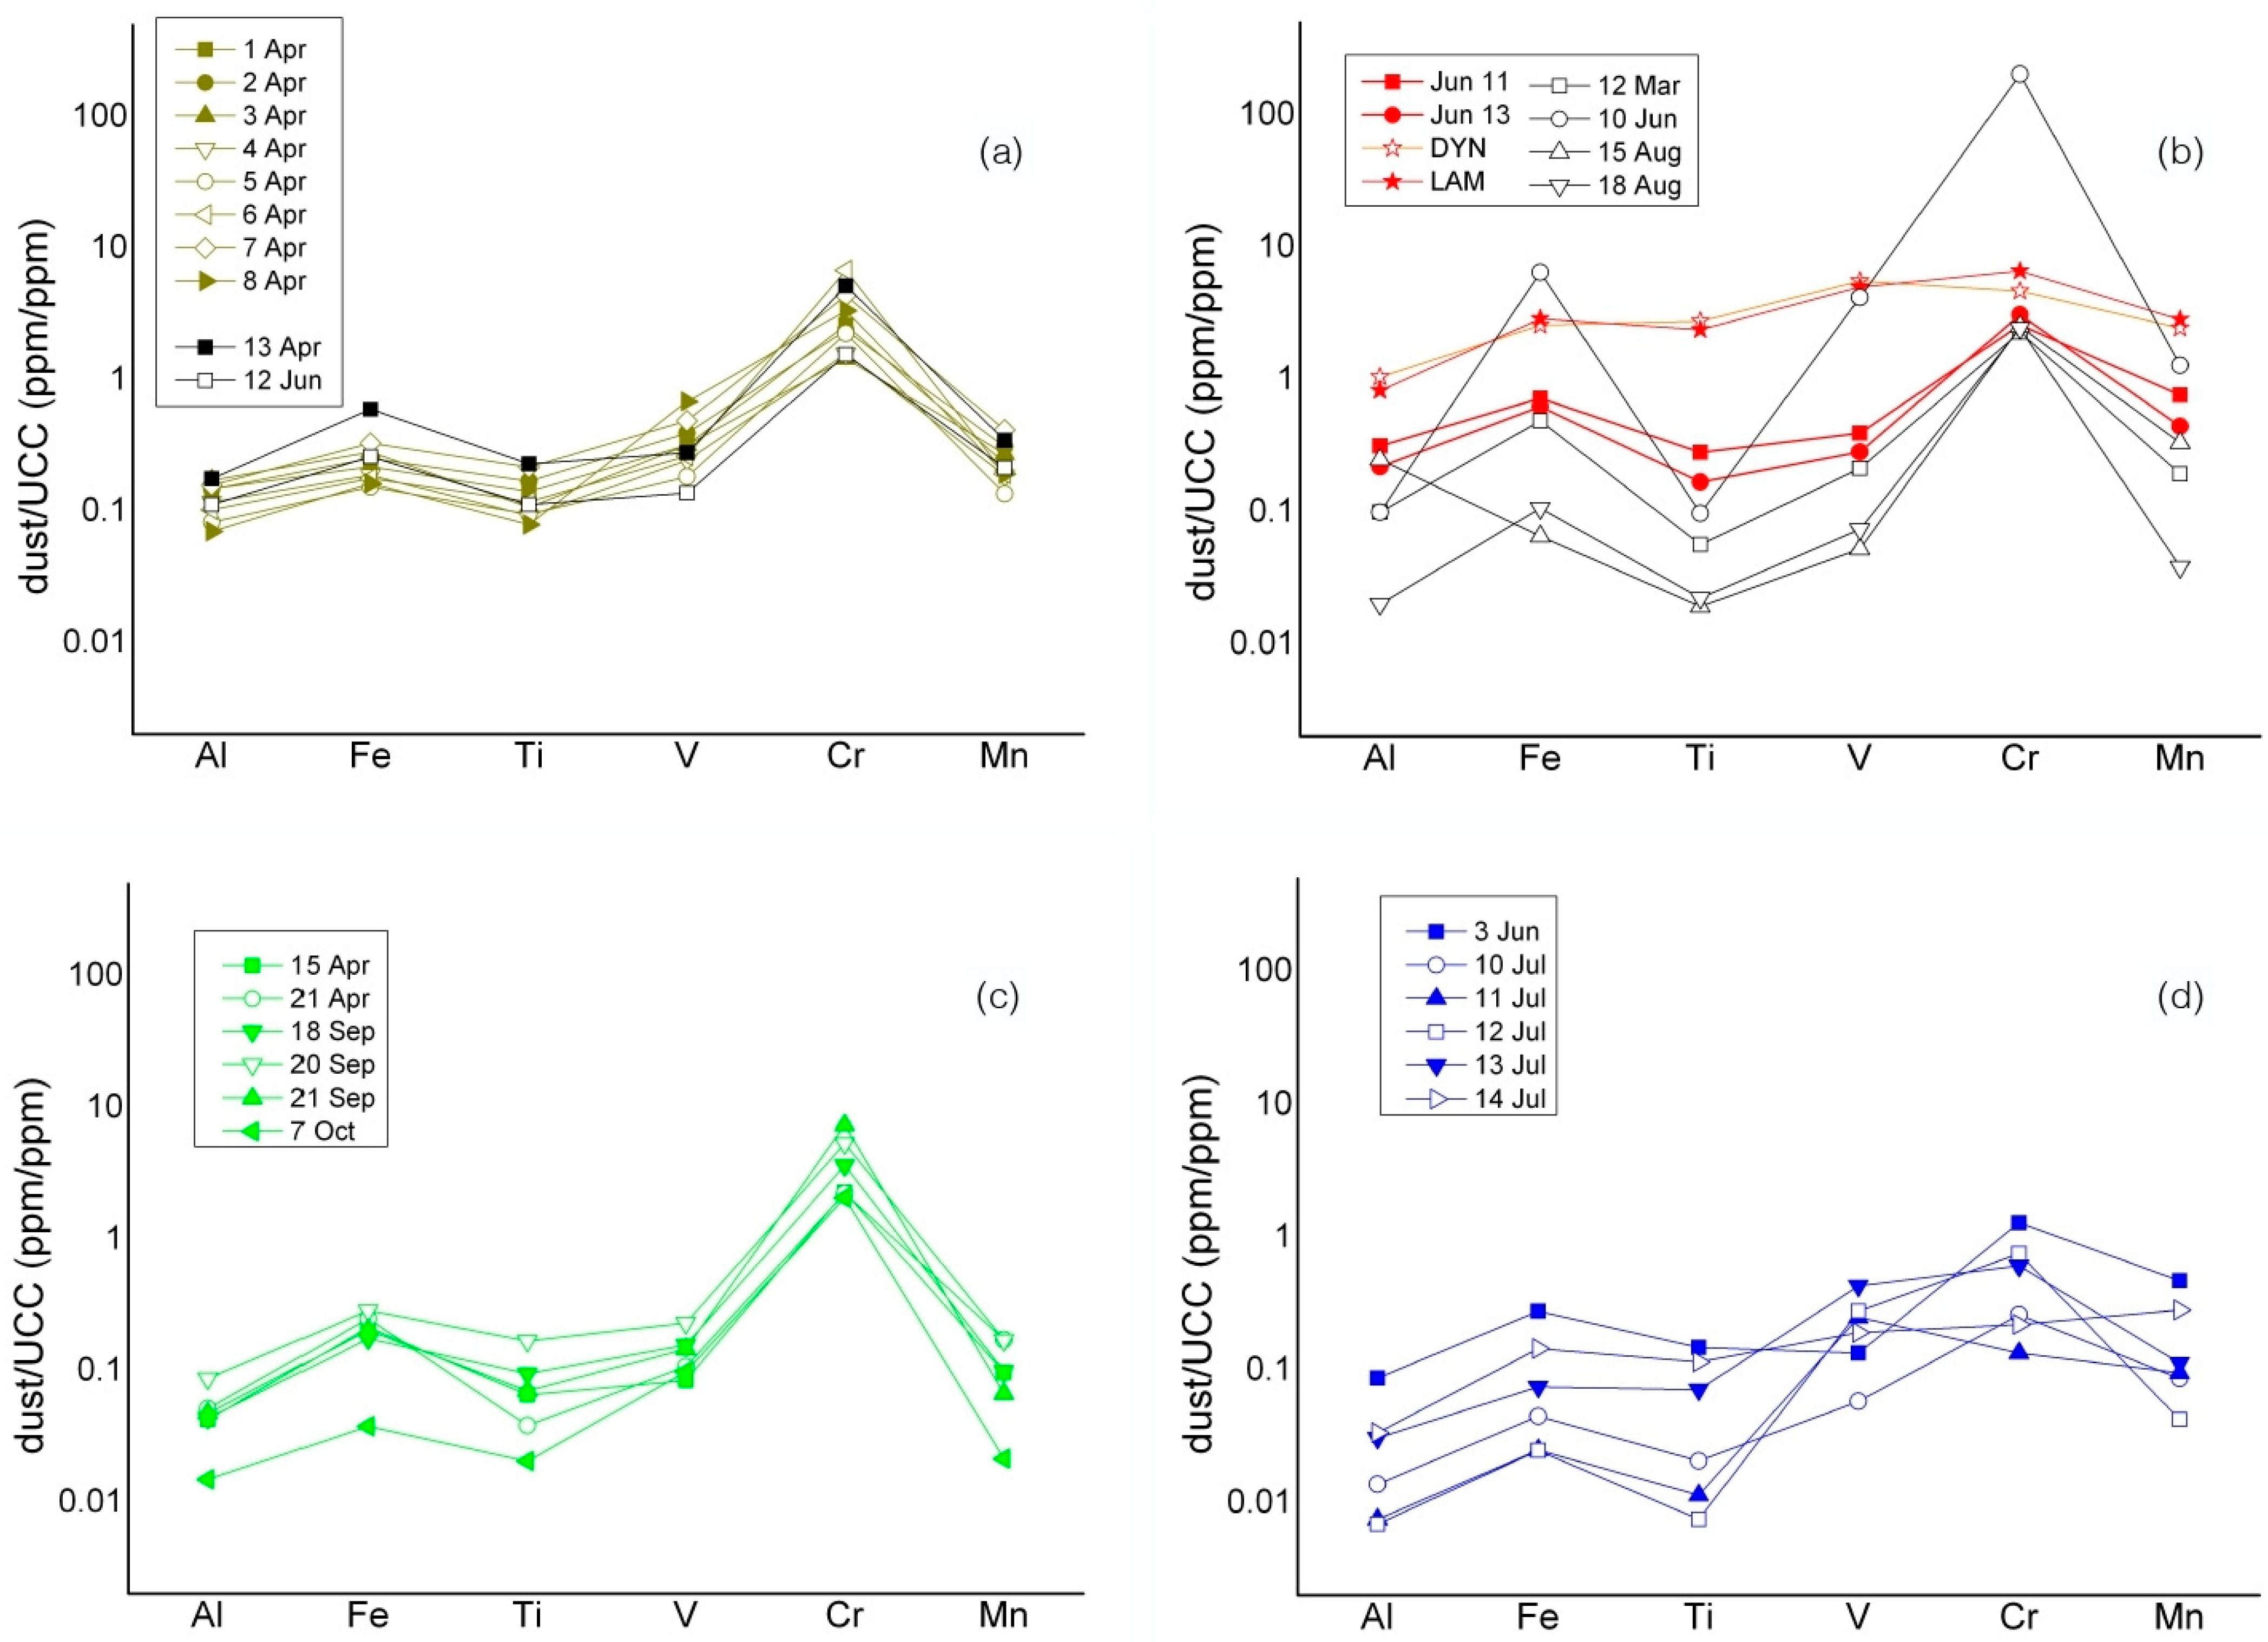
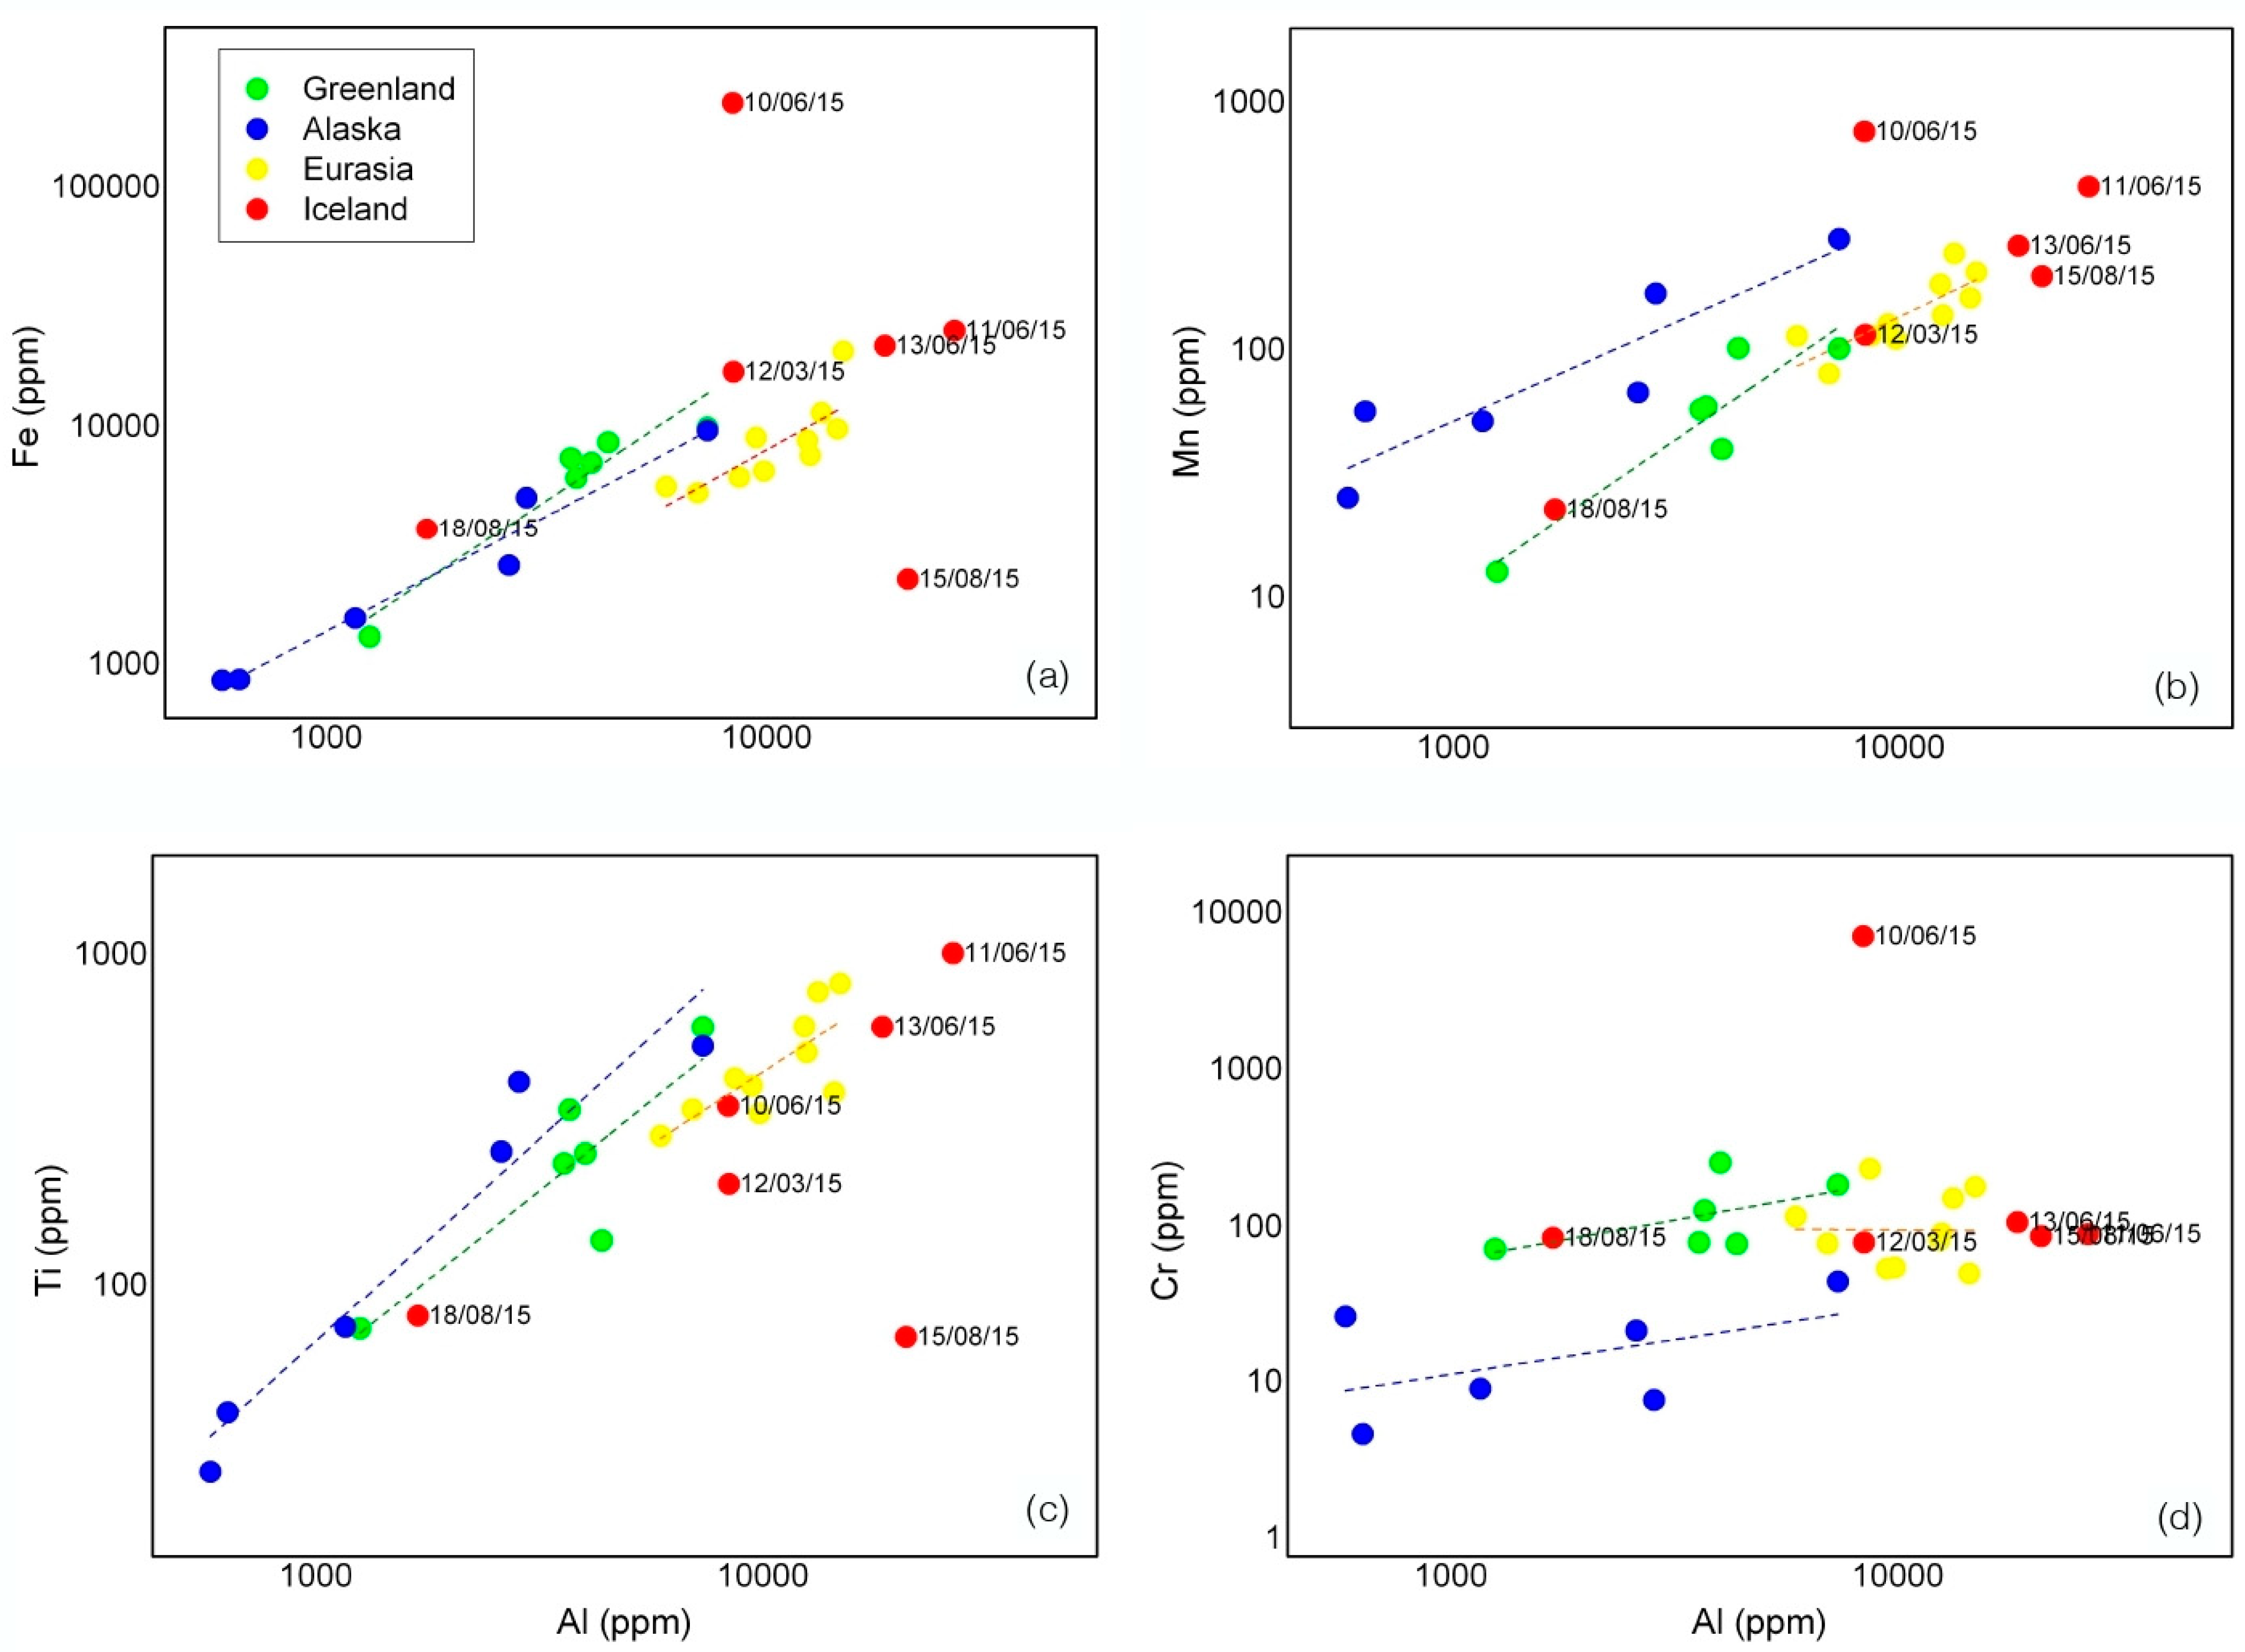
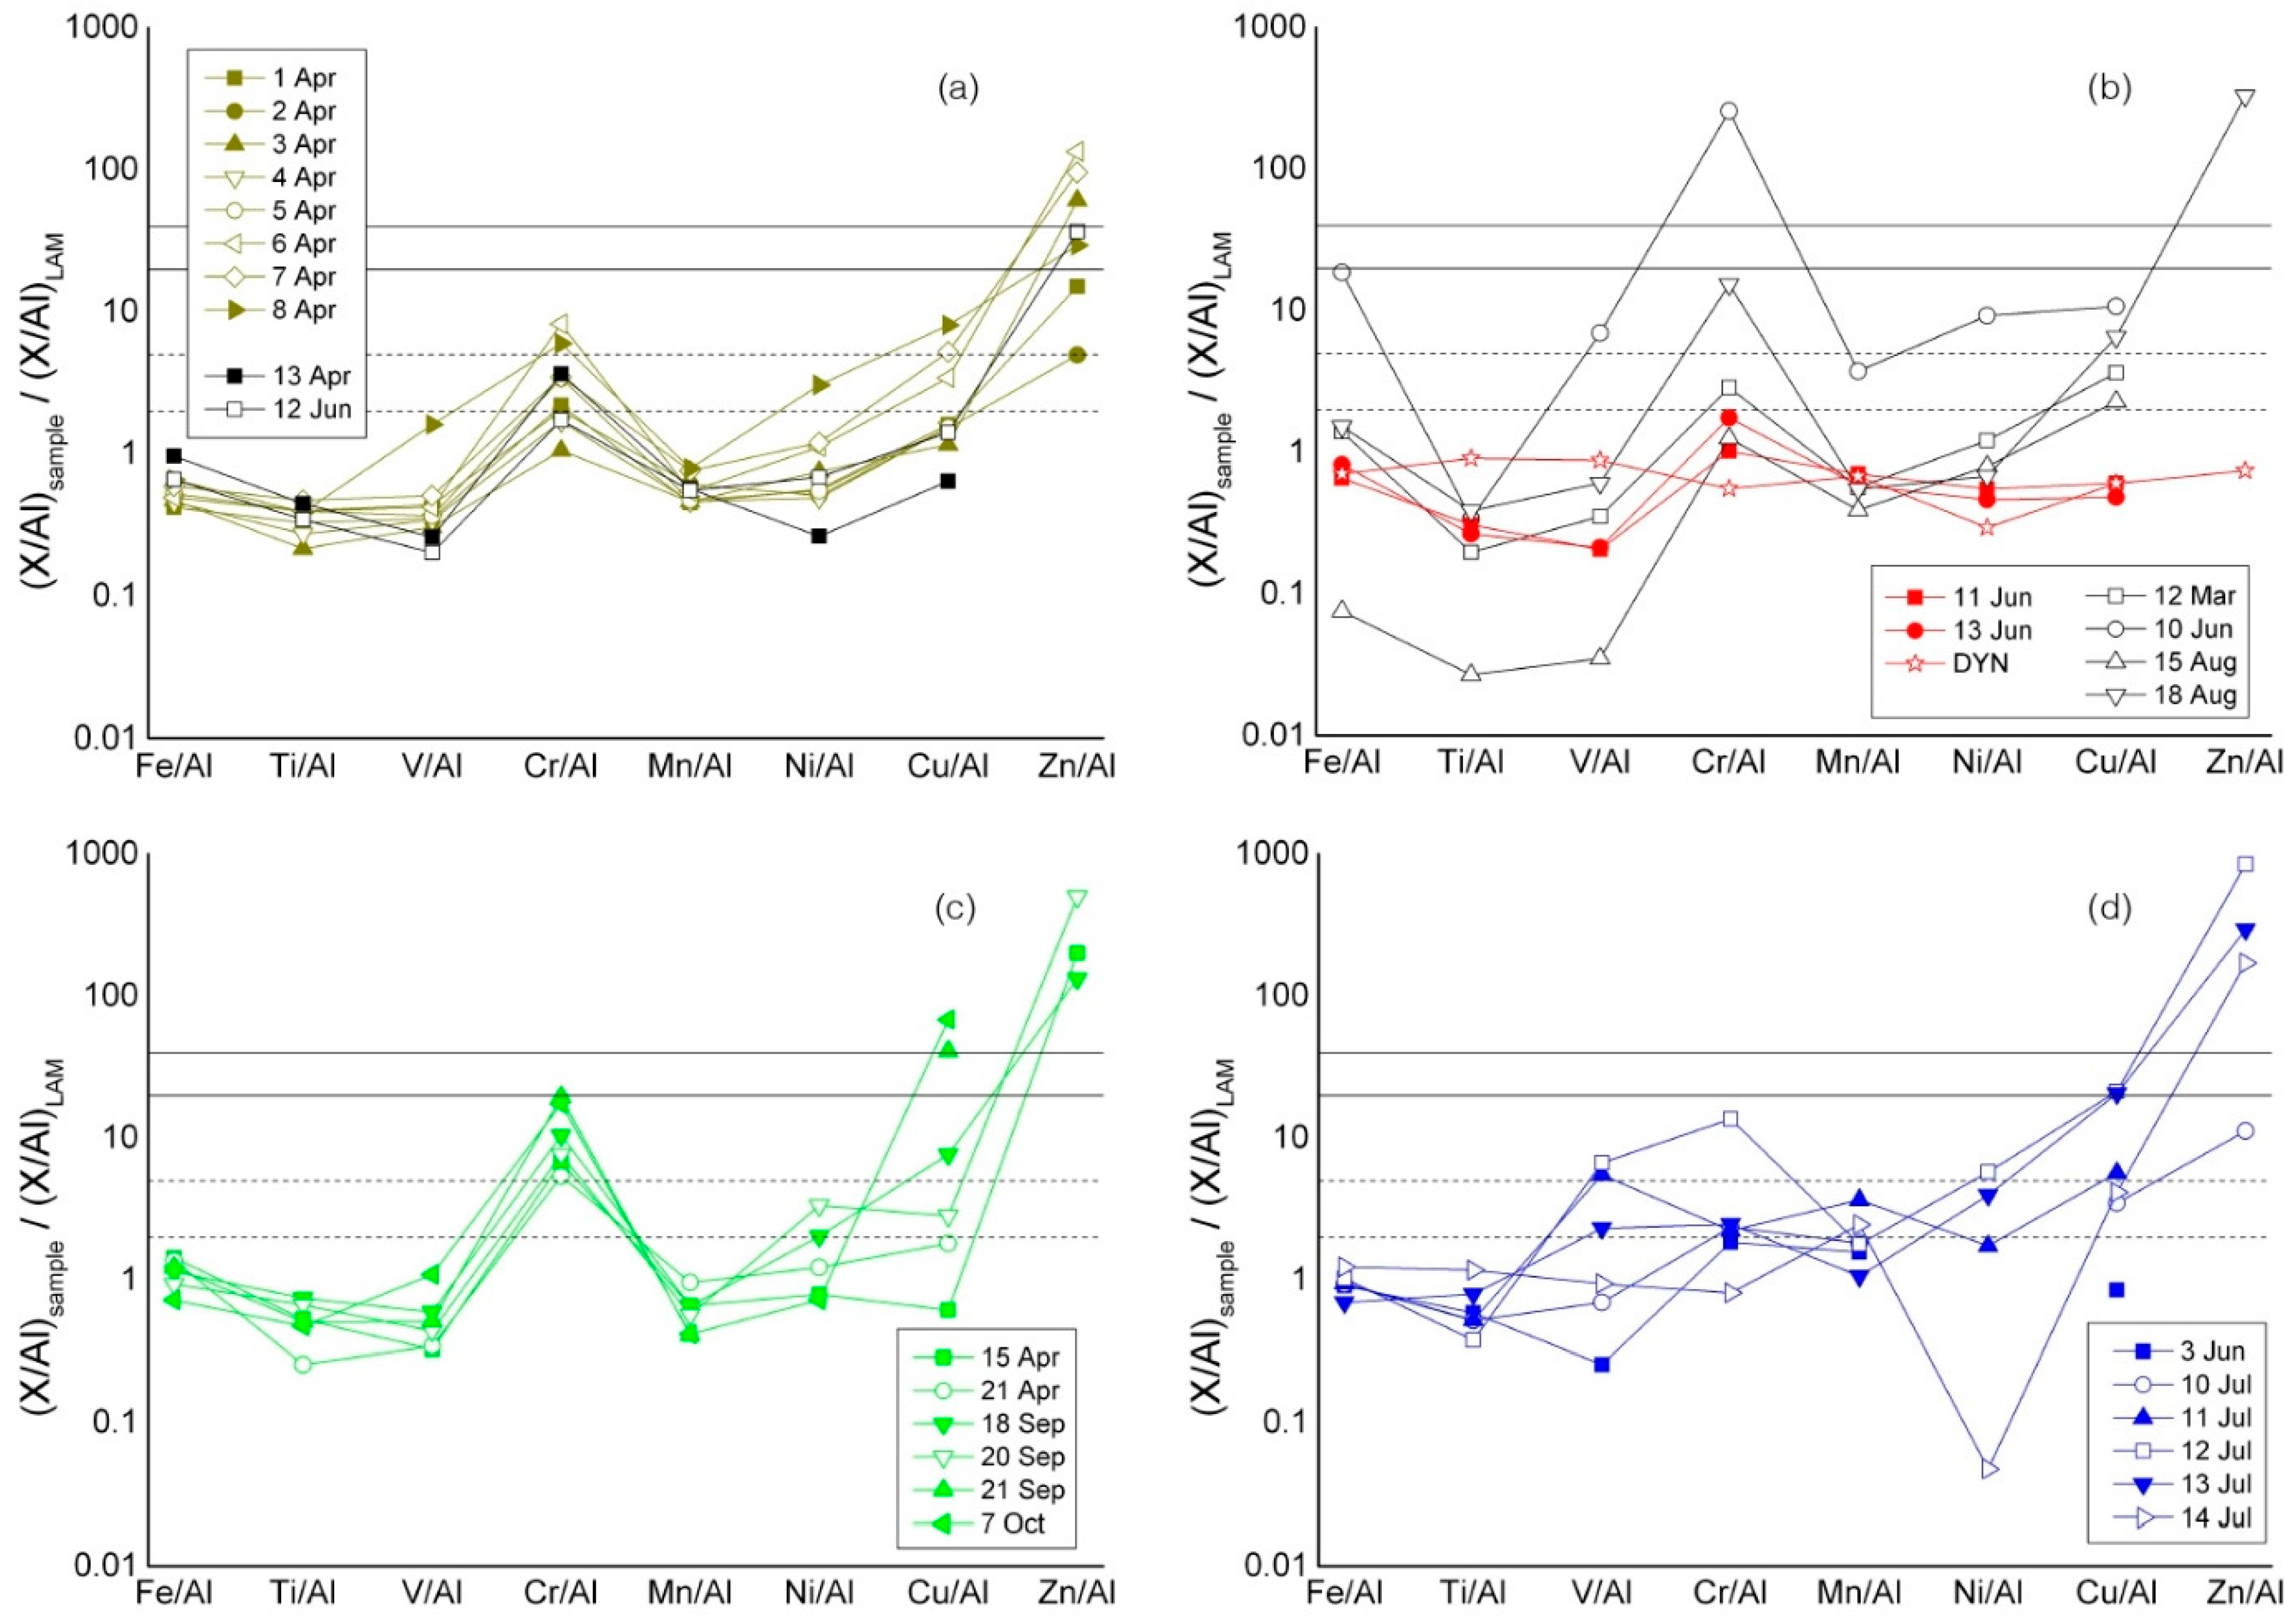
3.2. Geochemical Pattern of the Source Regions

Based on the PSCF analysis, four different high- to mid-latitude dust source regions located in Eurasia, Iceland, Greenland, and Alaska were identified. The patterns of the geochemical markers for Eurasia, Greenland, and Alaska are quite distinguishable from each other while the samples from Iceland are dispersed over a wide range of values which includes those of Eurasia and Greenland (Figure 3). From the spider diagrams of Figure 4 it also appears that aerosols from Greenland and, secondarily, from Eurasia have much similar patterns and are significantly enriched in Cr in respect to those from Iceland and Alaska, consistently with their much regular BT patterns (Figure 2). A significant enrichment in V in respect to Ti is also observed in a couple of samples from Alaska, well in accordance with a derivation from magnetite-bearing ores outcropping in this region (https://thediggings.com/commodities/vanadium/usa/alaska, accessed on 8 January 2021). The patterns of Iceland are more variable. Assuming the patterns of 11 June and 13 June as the main trend (see Section 3.3.1), we see a strong enrichment of Fe, V and Cr in the sample of June 10, a general depletion of all elements but Al and/or Cr in the samples of 15 and 18 August, and a small Ti depletion in the sample of 12 March. Compared to volcanic sands of Iceland [12], our 11 and 13 June samples are significantly depleted in Ti and V, and slightly enriched in Cr, as well as being diluted of all the elements.
In the Greenland, Alaska, and Eurasia dust sources Fe, Mn, and Ti all show a fairly good correlation with Al while Cr (and V) are only little or partly correlated (Figure 5). The different slopes of the regression lines reflect the presence of a main fraction consisting of aluminium silicate minerals and phases in all the samples, with variable amounts of different iron bearing minerals and metal ores. The samples from Alaska, in particular, are significantly enriched in Mn and depleted in Cr in respect to the rest of the samples suggesting a provenance from carbonate rather than ultramafic rock terranes [36,37]. Samples related to Icelandic sources are generally much more dispersed though having relatively higher Al contents. This fact points to a more complex composition in respect to the rest of the samples, and it will be focused on in the following sections.

3.3. Properties and Long-Range Transport of Icelandic Dust

Icelandic dust samples revealed peculiar but very variable characteristics compared to the dust from other sources. In order to investigate their properties more thoroughly, we compared our aerosol samples with each other and in relation to their geographical source regions marked by air mass back trajectories. Once the most representative samples of Icelandic dust had been selected, we compared them with Icelandic materials in order to investigate the selection mechanisms operating during the emission and the transport of dust. It is estimated that about 7% of Icelandic dust emitted is deposited in the high Arctic (>80 N, [7]).

3.3.1. Mixing Processes

The BT trend in the six days of interest (Figure 6) reveals that in all cases the air masses affected both Iceland and other geographical areas before reaching Ny-Ålesund. In aerosols, the dust component may have mixed with others, sometimes of anthropogenic origin, coming from the same or from several different areas, depending on the mode of air mass circulation and the duration of transport before deposition on the receptor site, delivering aerosols with different chemical characteristics. To highlight and evaluate the presence and extent of mixing processes in our Icelandic samples, we examined the aerosol samples from Icelandic sources one by one after PSCF analysis. In particular we took under consideration the pattern and trend of the air mass circulation in relation to the recorded dust events in Iceland in the period of interest, and the pattern of the enrichment factors in the samples.
The BTs of the air masses that reached Ny-Ålesund on March 12 (Figure 6a) show a component over Iceland three to four days before arriving at the receptor site. At that moment, exactly between 8 and 9 March, massive dust events were recorded in W Iceland leading to PM10 concentrations exceeding 140 μg/m3 [38]. It is possible that some part of the dust intercepted the air masses at about 2000 m altitude and was transported to Ny-Ålesund. However, on 12 March, air masses from North America and Siberia also persisted over Ny-Ålesund, the latter passing at a much lower height and for a longer time than those coming from Iceland. This has likely generated a mix of aerosols from different regions, including Iceland. Looking at the general geochemical pattern (Figure 4), the low enrichment factor for most elements (Figure 7), and the positive value of the dust load (Table 1), we can expect a dust intake from these regions over Svalbard on that day.
The situation of the air masses arriving on Ny-Ålesund on June 10 was also favorable to the possibility of a contribution from Iceland. In this case, however, the air masses moved very slowly during their passage and only lapped the eastern and northern coasts of Iceland (Figure 6b). For this reason, and despite the occurrence of great dust storms in Iceland in those days [40,41], the air masses do not seem to have collected dust as they passed, as evidenced by the negative dust load of that day. On the other hand, the presence of contributions from different, likely anthropogenic, sources cannot be ruled out considering the significant to very high values of the enrichment factor of the metals, especially Cr (Figure 7), in this sample.
The pattern of BTs for 11 June (Figure 6c) shows a main circulation at ground level, which came down slowly from the E-coast of Greenland and progressively accelerated up to Iceland where it reached a rapid counter clockwise movement between 6 and 9 June. In those days Iceland was affected by intense sandstorms both in the SW and the NE part of the island (SYNOP codes reports). This explains the general pattern similarity of this sample compared to the Iceland soils (Figure 4b), although the relatively lower amounts of Ti and V, and the higher amounts of Cr may support some contribution from Greenland and/or Eurasia (Figure 4a,c). The low value of the enrichment factor for all metals (Figure 7) suggests the main presence of dust due to significant dust load in Ny-Ålesund on that day (Table 1), and excludes other possible source areas resulting from the BT pattern (e.g., the Kola peninsula), which are characterized by significantly higher values of V, Ni, and, above all, Cu and Zn (Figure 7). It is thus likely that the significantly higher altitude of the air mass circulation over the northern Eurasian coasts prevented the uptake of aerosols coming from these areas. A similar BT pattern from Iceland was observed on 13 June (Figure 6d). Air mass circulation over Iceland occurred at altitudes higher than those over Greenland and the far North of Eurasia. However, this different set-up does not seem to have significantly influenced either the dust load in Svalbard (which is even higher than that of 11 June), nor the composition of the aerosol which showed remarkable similarities with that of the previous day.
Regarding the sample of 15 August, we know of the occurrence of local dust events in NE-Iceland on 13 August and in W Iceland on 7–8 August prone of being intercepted by the air masses reaching Ny-Ålesund (Figure 6e). However, the pattern of BTs for 15 August also reveals the presence of a regional circulation around the Svalbard Islands much more significant than that on Iceland since it occurred at ground level and developed in the period of maximum annual snow melting and soil drying. Significant enrichment of Al and Cr compared to the other samples is not compatible with any of the dust sources examined in this study (Figure 4). Nor is it possible to invoke an origin of the metals from anthropogenic sources considering the particularly low values of the enrichment factors of this sample (Figure 7). These observations, supported by the positive amount of the dust load for August 15, suggest a local origin from soils in Svalbard of at least some part of the dust collected on that day.
Further considerations derive from the analysis of the sample from August 18. Although there was a dust storm in the NE of Iceland on August 13 to justify the significant value of the dust load recorded on that day and the similar metal contents with the sample of 15 August (Figure 4), the enrichment factors of Cr, Cu, and, above all, Zn are remarkably high in this case (Figure 7). All these observations suggest the presence of different natural and anthropogenic contributions around Iceland. Looking at the pattern of BTs (Figure 6f) we can, thus, assume that a regional scale atmospheric circulation would have mixed together the contributions from different sources and diluted them with a significant marine contribution. This latter clearly results from the remarkably high Na and Cl air mass concentrations (540 and 750 ng/m3; data not shown) compared to those of 15 August (56 and 49 ng/m3; data not shown). In any case, the low values of the Cl/Na ratios of the sample of 15 August (0.87) and 18 August (1.38), in respect to sea water (1.81), reveal significant aging effects. It is thus possible that in those days the development of a slowly rotating cyclonic cell over the Atlantic Ocean all around Iceland collected and mixed the air masses with their natural/anthropogenic inputs and slowly conveyed them to Svalbard. The samples of 15 and 18 August would, thus, better represent a regional contribution to the aerosols in Svalbard in the period of interest.

3.3.2. Emission and Transport Processes

The Icelandic contribution to dust in Ny-Ålesund in 2015 was likely combined with contributions from different origins and/or provenance. However, the composition of the samples of 11 and 13 June best resembled the composition of the Icelandic surface materials taken as a reference. Therefore, detailed analysis and comparison of these samples is the key point to establish their mutual genetic relationships. We have found that the samples of 11 and 13 June are distinct from the Icelandic soils, as: (i) they show significantly lower concentrations of all metals; (ii) they are relatively depleted in Ti and V; and (iii) they are relatively enriched in Cr (Figure 8). The first characteristic may be interpreted as the result of the dilution deriving from the mixing between Icelandic dust and the other airborne components. Dilution would have caused a decrease in the concentration of all metals up to values 5–6 times lower than those in soils, leaving the general geochemical pattern almost unchanged. The characteristics (ii) and (iii) indicate selective lifting and transport of the particles. We know in fact that the surface sands consist of millimeter-sized grains [12], while the Icelandic aerosol particles reaching the receptor site rarely exceed a few microns in size [16]. We also know that the sands contain pyroxenes, olivine, and plagioclase, along with variable volcanic glass contents [12,13], and that in basaltic magmas Ti and V have the highest partition coefficients in clinopyroxene and magnetite [42]. Therefore the lower Ti and V, and the higher Cr amounts in the aerosols in respect to sediments can be explained assuming a lower presence of clinopyroxene and magnetite crystals, and a greater amount of glass fragments in the aerosol than in the sands. Indeed the irregular, often elongated, morphology and the lower specific weight of the hyaloclastites compared to the femic minerals favour their lifting and transport up to a great distance, as evidenced by single particle analyses of the Icelandic reference dust samples [16].
Such a phenomenology of emission and transport of dust seems quite common in Icelandic aerosols which, in fact, all showed a trend similar to that of 11 and 13 June (Figure 8). The fact that, compared to the aerosols of 2011, the latter are further depleted of Ti and V likely reflects a greater contribution of the hyaloclastic component in the dust. In accordance with the findings of [12], our results point to the the main role of fluvio-glacial activity river transport in preparing the sediment uplift from Iceland.

4. Conclusions

In this study we applied a PSCF analysis to the tracking of dust sources in the Arctic. For this purpose, we considered one year of aerosol geochemical data at Ny-Ålesund, Svalbard, and a short list of transition and post-transition metals variably related to the dust fraction. Based on PSCF analysis, four different source areas with corresponding geochemical patterns and seasonal occurrence were evidenced. A set of typical dust days from the distinct source areas were also identified based on the corresponding BT patterns. Given the availability of some aerosol and soil samples from Iceland as reference materials we were able to compare the geochemical patterns of Icelandic dust and soils with the patterns of different source areas.
Similarly to what was found in our previous studies on different geographic contexts [18,19], the method proved to be valid and promising in distinguishing different dust sources based on the correlation between the concentrations of chemical tracers and the trend of BTs. In particular, the method has proved to be sufficient to allow the identification of a geochemical fingerprint for each source, which is maintained in the aerosol even in the presence of other sources, whether natural or anthropogenic.
It is clear that the method needs a further fine-tuning to trace the fingerprints of the different dust sources. The acquisition and testing of aerosol data from clear and unambiguous source regions, as well as a comparison of reference soils, should be a priority. For this purpose, based on our previous studies on this topic [16,43], targeted sampling and geochemical analyses on Icelandic and Svalbard soils are being performed. The goal is to characterize these dust source areas very thoroughly, both to refine the emission and transport models, and to evaluate the impact of different dust sources on the aerosol properties at regional and local scale. Field campaigns are planned in the other source areas, starting from Greenland, focusing the geochemical characteristics of dust in comparison to Icelandic dust sources as well as their mutual interaction mediated by air mass transport and mixing [7].
Detailed analysis of the dust sources, the emission rates, the particle characteristics, the long-range transport routes, and the atmospheric processing of dust reaching the Arctic is the starting point to evaluate its current impact on this region and, possibly, to predict its future effects on the global scenario of climate change.

Author Contributions

Conceptualization, B.M.; Methodology, B.M.; Software, S.C.; Validation, S.C. and B.M.; Aerosol sampling, S.B., M.S. and R.T.; Chemical analysis, S.B., M.S. and R.T.; Investigation, S.C. and B.M.; Data curation, B.M. and S.C.; Writing—original draft preparation, B.M.; Writing—review and editing, B.M., S.C., P.D.W. and R.T.; Funding acquisition, D.C. All authors have read and agreed to the published version of the manuscript.

Funding

This research received no external funding.

Institutional Review Board Statement

Not applicable.

Informed Consent Statement

Not applicable.

Data Availability Statement

The data presented in this study are part of a continuously generated database [https://orfeo.chm.unipg.it/ect/pscf/ny/pscf_ny.html]. For this reason they are available on request from the corresponding author.

Acknowledgments

The authors would like to thank Olafur Arnalds for his valuable contribution to the discussion of dust sources. The work of P.D.W. was funded by the Icelandic Research Fund (Rannis) (grant no. 207057-051).

Conflicts of Interest

The authors declare no conflict of interest.

References

  1. Serreze, M.C.; Francis, J.A. The arctic amplification debate. Clim. Chang. 2006, 76, 241–264. [Google Scholar] [CrossRef] [Green Version]
  2. Lambert, F.; Kug, J.-S.; Park, R.J.; Mahowald, N.; Winckler, G.; Abe- Ouchi, A.; O’Ishi, R.; Takemura, T.; Lee, J.H. The role of mineral-dust aerosols in polar temperature amplification. Nat. Clim. Chang. 2013, 3, 487–491. [Google Scholar] [CrossRef]
  3. Boy, M.; Thomson, E.S.; Acosta Navarro, J.-C.; Arnalds, O.; Batchvarova, E.; Bäck, J.; Berninger, F.; Bilde, M.; Brasseur, Z.; Dagsson-Waldhauserova, P.; et al. Interactions between the atmosphere, cryosphere, and ecosystems at northern high latitudes. Atmos. Chem. Phys. 2019, 19, 2015–2061. [Google Scholar] [CrossRef] [Green Version]
  4. Dagsson-Waldhauserova, P.; Meinander, O. Editorial: Atmosphere—Cryosphere interaction in the Arctic, at High Latitudes and mountains with focus on transport, deposition, and effects of dust, black carbon, and other aerosols. Front. Earth Sci. 2019, 7, 337. [Google Scholar] [CrossRef] [Green Version]
  5. Kylling, A.; Groot Zwaaftink, C.D.; Stohl, A. Mineral dust instantaneous radiative forcing in the Arctic. Geophys. Res. Lett. 2018. [Google Scholar] [CrossRef] [Green Version]
  6. Saidou Chaibou, A.A.; Ma, X.; Sha, T. Dust radiative forcing and its impact on surface energy budget over West Africa. Sci. Rep. 2020, 10, 12236. [Google Scholar] [CrossRef] [PubMed]
  7. Groot Zwaaftink, C.D.; Arnalds, O.; Dagsson-Waldhauserova, P.; Eckhardt, S.; Prospero, J.M.; Stohl, A. Temporal and spatial variability of Icelandic dust emission and atmospheric transport. Atmos. Chem. Phys. 2017, 17, 10865–10878. [Google Scholar] [CrossRef] [Green Version]
  8. Groot Zwaaftink, C.D.; Grythe, H.; Skov, H.; Stohl, A. Substantial contribution of northern high-latitude sources to mineral dust in the Arctic. J. Geophys. Res. Atmos. 2016, 121, 13678–13697. [Google Scholar] [CrossRef]
  9. Baddock, M.C.; Mockford, T.; Bullard, J.E.; Thorsteinsson, T. Pathways of high-latitude dust in the North Atlantic. Earth Planet. Sc. Lett. 2017, 459, 170–182. [Google Scholar] [CrossRef] [Green Version]
  10. Zhang, X.L.; Wu, G.J.; Zhang, C.L.; Xu, T.L.; Zhou, Q.Q. What is the real role of iron oxides in the optical properties of dust aerosols? Atmos. Chem. Phys. 2015, 15, 12159–12177. [Google Scholar] [CrossRef] [Green Version]
  11. Bullard, J.E.; Baddock, M.; Bradwell, T.; Crusius, J.; Darlington, E.; Gaiero, D.; Gassó, S.; Gisladdottir, G.; Hodgkins, R.; McCulloch, R.; et al. High-latitude dust in the earth system. Rev. Geophys. 2016, 54, 447–485. [Google Scholar] [CrossRef] [Green Version]
  12. Baratoux, D.; Mangold, N.; Arnalds, O.; Bardintzeff, J.-M.; Platevoët, B.; Grégoire, M.; Pinet, P. Volcanic sands of Iceland–diverse origins of aeolian sand deposits revealed at Dyngjusandur and Lambahraun. Earth Surf. Proc. Land. 2011, 36, 1789–1808. [Google Scholar] [CrossRef]
  13. Arnalds, O.; Dagsson-Waldhauserova, P.; Olafsson, H. The Icelandic volcanic aeolian environment: Processes and impacts—A review. Aeolian Res. 2016, 20, 176–195. [Google Scholar] [CrossRef] [Green Version]
  14. Sanchez-Marroquin, A.; Arnalds, O.; Baustian-Dorsi, K.J.; Browse, J.; Dagsson-Waldhauserova, P.; Harrison, A.D.; Maters, E.C.; Pringle, K.J.; Vergara-Temprado, J.; Burke, I.T.; et al. Iceland is an episodic source of atmospheric ice-nucleating particles relevant for mixed-phase clouds. Sci. Adv. 2020, 6. [Google Scholar] [CrossRef] [PubMed]
  15. Baldo, C.; Formenti, P.; Nowak, S.; Chevaillier, S.; Cazaunau, M.; Pangui, E.; Di Biagio, C.; Doussin, J.-F.; Ignatyev, K.; Dagsson Waldhauserova, P.; et al. Distinct chemical and mineralogical composition of Icelandic dust compared to North African and Asian dust. Atmos. Chem. Phys. 2020, 20, 1–19. [Google Scholar] [CrossRef]
  16. Moroni, B.; Arnalds, O.; Dagsson-Waldhauserova, P.; Rocchianti, S.; Vivani, R.; Cappelletti, D. Mineralogical and chemical records of Icelandic dust sources upon Ny-Ålesund (Svalbard Islands). Front. Earth Sci. 2018. [Google Scholar] [CrossRef]
  17. Ashbaugh, L.; Malm, W.; Sadeh, W. A residence time probability analysis of sulfur concentrations at Grand Canyon National Park. Atmos. Environ. 1985, 19, 1263–1270. [Google Scholar] [CrossRef]
  18. Petroselli, C.; Crocchianti, S.; Moroni, B.; Castellini, S.; Selvaggi, R.; Nava, S.; Calzolai, G.; Lucarelli, F.; Cappelletti, D. Disentangling the major source areas for an intense aerosol advection in the Central Mediterranean on the basis of potential source contribution function modeling of chemical and size distribution measurements. Atmos. Res. 2018, 204, 67–77. [Google Scholar] [CrossRef]
  19. Moroni, B.; Crocchianti, S.; Petroselli, C.; Selvaggi, R.; Becagli, S.; Traversi, R.; Cappelletti, D. Potential source contribution function analysis of long-range transported aerosols in the Central Mediterranean: A comparative study of two background sites in Italy. Rend. Fis. Acc. Lincei 2019. [Google Scholar] [CrossRef]
  20. Cappelletti, D.; Azzolini, R.; Langone, L.; Ventura, S.; Viola, A.; Aliani, S.; Vitale, V.; Brugnoli, E. Environmental changes in the Arctic: An Italian perspective. Rend. Lincei 2016, 27, 1–6. [Google Scholar] [CrossRef]
  21. Giardi, F.; Traversi, R.; Becagli, S.; Severi, M.; Caiazzo, L.; Ancillotti, C.; Udisti, R. Inductively Coupled Plasma Mass Spectrometry with desolvation nebulizer inlet system. Sci. Total Environ. 2017, 613–614, 1284–1294. [Google Scholar]
  22. Udisti, R.; Bazzano, A.; Becagli, S.; Bolzacchini, E.; Caiazzo, L.; Cappelletti, D.; Ferrero, L.; Frosini, D.; Giardi, F.; Grotti, M.; et al. Sulfate source apportionment in the Ny-Ålesund (Svalbard Islands) Arctic aerosol. Rend. Lincei 2016, 27, 85–94. [Google Scholar] [CrossRef]
  23. Giardi, F.; Becagli, S.; Traversi, R.; Frosini, D.; Severi, M.; Caiazzo, L.; Ancillotti, C.; Cappelletti, D.; Moroni, B.; Grotti, M.; et al. Size distribution and ion composition of aerosol collected at Ny-Ålesund in the springesummer field campaign 2013. Rend. Lincei 2016, 27. [Google Scholar] [CrossRef] [Green Version]
  24. Draxler, R.R.; Rolph, G.D. HYSPLIT (Hybrid Single-Particle Lagrangian Integrated Trajectory) Model; NOAA Air Resources Laboratory: Silver Spring, MD, USA, 2003.
  25. Schuetz, L. Atmospheric Mineral Dust-Properties and Source Markers. In Paleoclimatology and Paleometeorology: Modern and Past Patterns of Global Atmospheric Transport. NATO ASI Series (Series C: Mathematical and Physical Sciences); Leinen, M., Sarnthein, M., Eds.; Springer: Dordrecht, The Netherlands, 1989; Volume 282. [Google Scholar] [CrossRef]
  26. Shelley, R.U.; Roca-Martí, M.; Castrillejo, M.; Masqué, P.; Landing, W.M.; Planquette, H.; Sarthou, G. Quantification of trace element atmospheric deposition fluxes tothe Atlantic Ocean (>40°N.; GEOVIDE, GEOTRACES GA01) during spring 2014. Deep-Sea Res. I Oceanogr. Res. Pap. 2017, 119, 34–49. [Google Scholar] [CrossRef] [Green Version]
  27. Taylor, S.R. Abundance of chemical elements in the continental crust: A new table. Geochim. Cosmochim. Acta 1964, 28, 1273–1285. [Google Scholar] [CrossRef]
  28. Brookshaw, D.R.; Coker, V.S.; Lloyd, J.R.; Vaughan, D.J.; Pattrick, R.A. Redox interactions between Cr(VI) and Fe(II) in bioreduced biotite and chlorite. Environ. Sci. Technol. 2014, 48, 11337–11342. [Google Scholar] [CrossRef]
  29. Gieseking, J.E. Soil Components: Volume 2: Inorganic Components; Springer: New York, NY, USA, 1975; 683p. [Google Scholar]
  30. Fekiacova, Z.; Cornu, S.; Pichat, S. Tracing contamination sources in soils with Cu and Zn isotopic ratios. Sci. Total Environ. 2015, 517, 96–105. [Google Scholar] [CrossRef] [Green Version]
  31. Eckhardt, S.; Stohl, A.; Beirle, S.; Spichtinger, N.; James, P.; Forster, C.; Junker, C.; Wagner, T.; Platt, U.; Jennings, S.G. The North Atlantic Oscillation controls air pollution transport to the Arctic. Atmos. Chem. Phys. Discuss. 2003, 3, 3222–3240. [Google Scholar]
  32. Stohl, A. Characteristics of atmospheric transport into the arctic troposphere. J. Geophy. Res. Atmos. 2006, 111, D11306. [Google Scholar] [CrossRef]
  33. Moroni, B.; Cappelletti, D.; Crocchianti, S.; Becagli, S.; Caiazzo, L.; Traversi, R.; Udisti, R.; Mazzola, M.; Markowicz, K.; Ritter, C.; et al. Morphochemical characteristics and mixing state of long range transported wildfire particles at Ny-Ålesund (Svalbard Islands). Atmos. Environ. 2017, 156, 135–145. [Google Scholar] [CrossRef]
  34. Moroni, B.; Ritter, C.; Crocchianti, S.; Markowicz, K.; Mazzola, M.; Becagli, S.; Traversi, R.; Krejci, R.; Tunved, P.; Cappelletti, D. Individual Particle characteristics, optical properties and evolution of an extreme long-range transported biomass burning event in the European Arctic (Ny-Ålesund, Svalbard Islands). J. Geophys. Res. Atmos. 2020, 125, e2019JD031535. [Google Scholar] [CrossRef]
  35. Taylor, S.R.; McLennan, S.M. The composition and evolution of the continental crust: Rare earth element evidence from sedimentary rocks. Philos. Trans. R. Soc. 1981, A301, 381–399. [Google Scholar]
  36. Gray, J.E.; Sanzolone, R.F. Environmental Studies of Mineral Deposits in Alaska. U.S.G.S. BULLETIN 2156; U.S. Government Printing Office: Washington, DC, USA, 1996.
  37. Peucker-Ehrenbrink, B.; Miller, M.W. Quantitative bedrock geology of Alaska and Canada. Geochem Geophys. 2003. [Google Scholar] [CrossRef]
  38. UST. Air quality in Iceland. Umhverfisstofnun [The Environment Agency of Iceland]. 2015. Available online: https://ust.is/loft/loftgaedi/ (accessed on 8 January 2021).
  39. Yongming, H.; Peixuan, D.; Junji, C.; Posmentier, E.S. Multivariate analysis of heavy metal contamination in urban dusts of Xi’an, Cent, China. Sci. Total Environ. 2006, 355, 176–186. [Google Scholar] [CrossRef]
  40. Dagsson-Waldhauserova, P.; Magnusdottir, A.Ö.; Olafsson, H.; Arnalds, O. The spatial variation of dust particulate matter concentrations during two Icelandic dust storms in 2015. Atmosphere 2016, 7, 77. [Google Scholar] [CrossRef] [Green Version]
  41. Mockford, T.; Bullard, J.E.; Thorsteinsson, T. The dynamic effects of sediment availability on the relationship between wind speed and dust concentration. Earth Surf. Process. Landf. 2018, 43, 2484–2492. [Google Scholar] [CrossRef]
  42. Rollinson, H. Using Geochemical Data: Evaluation, Presentation, Interpretation; Longman Scientific & Technical: New York, NY, USA, 1993. [Google Scholar]
  43. Moroni, B.; Becagli, S.; Bolzacchini, E.; Busetto, M.; Cappelletti, D.; Crocchianti, S.; Ferrero, L.; Frosini, D.; Lanconelli, C.; Lupi, A.; et al. Vertical profiles and chemical properties of aerosol particles upon Ny-Ålesund (Svalbard Islands). Adv. Meteorol. 2015, 2015, 292081. [Google Scholar] [CrossRef]
Figure 1. Time series of aerosol mass concentrations at Gruvebadet station, Ny-Ålesund, in 2015. The dotted lines at 0.5 and 1.5 μg/m3 provide estimates of background values before and after 10 June 2015.
Atmosphere 12 00347 g001
Figure 2. Ninetieth-percentile PSCF probability plots for Al (a), Fe (b), Mn (c), Ti (d), Cr (e), V (f), Cu (g), Zn (h), and Ni (i) in PM10, computed by our code using four trajectories per day.
Atmosphere 12 00347 g002
Figure 3. Patterns of the geochemical markers of the dust source regions.
Atmosphere 12 00347 g003
Figure 4. Metal concentrations in the daily aerosol samples from Eurasia (a), Iceland (b), Greenland (c), and Alaska (d). Data are normalized to average upper continental crust (UCC) composition (data from [35]).
Atmosphere 12 00347 g004
Figure 5. Correlation diagrams and regression lines of the metals in the daily aerosol samples sorted on the basis of detected source areas (Eurasia, Iceland, Greenland and Alaska).
Atmosphere 12 00347 g005
Figure 6. Plots of 240 h back trajectories of 12 March (a), 10 June (b), 11 June (c), 13 June (d), 15 August (e), and 18 August (f), 2015 ending at 0, 6, 12, and 18 UTC upon Ny-Ålesund. The position at 00:00 of each elapsed day is specified by the small number along the paths.
Atmosphere 12 00347 g006
Figure 7. Enrichment factors (EFs) of the metals in the daily aerosol samples. The average composition of Dyngjusandur Icelandic sand (after [12]) is also reported for comparison. Values are normalized to average Lambahraun Icelandic sand composition (after [12]). Lines of the EFs equal to 2, 5 (both dashed lines), 10, and 20 (both solid lines), corresponding to moderate to significant metal enrichment of soils (after [39]), are reported for comparison.
Atmosphere 12 00347 g007
Figure 8. Metal concentrations in the aerosol samples from Iceland (11 and 13 June), compared to Icelandic volcanic sands from Dynjusandur (DYN) and Lambahraun (LAM; after [12]), and to Icelandic aerosol samples collected in Ny-Ålesund in April 2011 [16]. The mean trend of DYN and LAM sands (red dashed line), the trend of 26 April 2011 (black dashed line), and the mean trend of 22 and 23 April 2011 (black sold line) have been shifted over the trend of 11 and 13 June in order to be compared.
Atmosphere 12 00347 g008
Table 1. Daily metal concentration (ng/m3), PM10 and dust load (DL, μg/m3) affecting the potential source contribution function (PSCF) probability plots; average (Avg., ng/m3), relative standard deviation (RSD, %) and number of valid data (VD #) of the overall (196 samples) dataset.
DateAlFeTiVCrMnNiCuZnPM10DL **
Eurasia01/04/1544.6427.051.810.070.330.490.070.111.033.562.06
02/04/1557.6840.992.830.110.390.860.080.130.444.663.16
03/04/1556.8038.611.510.070.200.640.120.105.293.932.43
04/04/1539.5626.331.330.060.220.450.060.09Bdl *4.022.52
05/04/1540.0830.491.960.060.450.460.060.09bdl5.754.25
06/04/1522.1715.821.080.040.610.290.070.114.532.561.56
07/04/1587.0875.115.060.191.001.620.300.6812.746.555.05
08/04/1528.1126.831.350.190.560.540.250.341.264.753.25
13/04/1542.1558.782.320.050.510.580.030.04bdl2.831.33
12/06/1539.7037.891.690.030.230.540.080.082.224.203.70
Iceland12/03/1524.5549.710.590.040.230.340.090.13bdl2.921.42
10/06/153.80102.450.160.113.240.350.100.06bdl0.45−0.05
11/06/1597.2392.323.690.090.331.670.150.09bdl3.653.15
13/06/1579.4893.652.590.070.461.130.110.06bdl4.293.79
15/08/1534.293.740.110.010.140.330.080.12bdl1.641.14
18/08/154.7710.500.230.010.240.060.010.052.392.822.32
Greenland15/04/1514.4229.840.940.020.320.230.030.014.424.022.52
21/04/1517.1334.000.540.030.310.400.060.05bdl3.932.43
18/09/1519.1231.671.760.050.660.310.110.223.875.184.68
20/09/1522.7030.731.870.040.580.320.220.0917.303.092.59
21/09/154.007.080.250.010.260.04bdl0.24bdl1.000.50
07/10/153.994.170.230.020.230.040.010.40bdl3.182.68
Alaska03/06/1520.7727.351.500.020.130.80bdl0.03bdl2.831.33
10/07/1517.0322.961.090.050.130.76bdl0.090.2914.6214.12
11/07/157.8310.710.500.180.060.700.040.07bdl12.3411.84
12/07/153.885.750.180.110.180.170.060.125.026.676.17
13/07/159.499.530.930.090.080.250.110.294.243.653.15
14/07/1511.4420.381.660.050.030.680.000.072.974.023.52
Avg.11.614.50.640.020.220.190.090.094.172.601.75
RSD (%)12018027013015014015020011081115
VD #18118318216818018018216586196196
* below detection limit. ** dust load estimates obtained by subtracting background values of 1.5 and 0.5 μg/m3 to the PM10 values as in Figure 1.
Table 2. Source regions, geochemical markers and daily occurrence of the dust events over Ny-Ålesund in the period 27 February–21 October 2015.
Source RegionElementsDaily Dust Events
EurasiaAl, Fe, Mn, Ti, Cr and V1–8 April; 13 April; 12 June
IcelandFe, Cr and V12 March; 10–11 June; 13 June; 15 August; 18 August
GreenlandFe, Cr and Ti15 April; 21 April; 18 September; 20–21 September; 7 October
AlaskaMn and V3 June; 10–14 July
Publisher’s Note: MDPI stays neutral with regard to jurisdictional claims in published maps and institutional affiliations.

