Review

Shipping and Air Quality in Italian Port Cities: State-of-the-Art Analysis of Available Results of Estimated Impacts

1
Institute of Atmospheric Sciences and Climate, National Research Council of Italy (CNR-ISAC), S.P. Lecce-Monteroni km 1.2, 73100 Lecce, Italy
2
Department of Environmental Sciences, Informatics and Statistics, Ca’ Foscari University of Venice, via Torino 155, 30172 Venice Mestre, Italy
3
Institute of Polar Sciences, National Research Council of Italy (ISP-CNR), via Torino 155, 30172 Venice Mestre, Italy
4
Italian Institute for Environmental Protection and Research (ISPRA), via Vitaliano Brancati 48, 00144 Roma, Italy
*
Author to whom correspondence should be addressed.
Submission received: 11 March 2021 / Revised: 9 April 2021 / Accepted: 19 April 2021 / Published: 22 April 2021

Abstract

:
Populated coastal areas are exposed to emissions from harbour-related activities (ship traffic, loading/unloading, and internal vehicular traffic), posing public health issues and environmental pressures on climate. Due to the strategic geographical position of Italy and the high number of ports along coastlines, an increasing concern about maritime emissions from Italian harbours has been made explicit in the EU and IMO (International Maritime Organization, London, UK) agenda, also supporting the inclusion in a potential Mediterranean emission control area (MedECA). This work reviews the main available outcomes concerning shipping (and harbours’) contributions to local air quality, particularly in terms of concentration of particulate matter (PM) and gaseous pollutants (mainly nitrogen and sulphur oxides), in the main Italian hubs. Maritime emissions from literature and disaggregated emission inventories are discussed. Furthermore, estimated impacts to air quality, obtained with dispersion and receptor modeling approaches, which are the most commonly applied methodologies, are discussed. Results show a certain variability that suggests the necessity of harmonization among methods and input data in order to compare results. The analysis gives a picture of the effects of this pollution source, which could be useful for implementing effective mitigation strategies at a national level.

1. Introduction

Emissions of atmospheric pollutants from harbours arise from different sources directly or indirectly related to port operations. The presence of several transport modalities, such as ships, cargo trucks, cranes, cargo handling equipment, and rail locomotives, contributes to maritime-related emissions of particulate matter (PM), nitrogen oxides (NOx), sulphur dioxide (SO2), carbon monoxide (CO), and VOCs (volatile organic compounds) [1,2,3,4,5,6,7], as well as other harmful pollutants, such as vanadium (V), nickel (Ni), BC (black carbon), and polycyclic aromatic hydrocarbon (PAHs). Primary particles emitted by ship-engine exhausts are predominantly in the sub-micron size fraction, thus contributing to fine and ultrafine particle concentrations [8,9,10,11].
Significant efforts to reduce air pollution from land-based sources have already been taking place worldwide, yet shipping is not regulated as strictly as most other sectors (i.e., road transport). In some Italian port cities, such as Civitavecchia or Venice, cruise ships emit more NOX, and especially sulphur oxides (SOX), than the total local passenger car fleet (Figure 1) and SOX will remain considerably large compared with road transport even after the introduction of the global 2020 marine sulphur cap [12]. Since road diesel will become cheaper gradually with the phase-out of diesel cars, switching from shipping to road transport, also using alternative fuels, is considered a possibility in the near future. At the present, the best marine sulphur standard (0.1%) remains 100 times worse than Europe’s sulphur standard for road diesel/petrol (0.001%), which has been in place for the past 15 years. At the European scale, maritime shipping generated over 90% of transport-related SO2 emissions, while associated PM2.5, PM10 (PM with aerodynamic diameter less than 2.5 and 10 µm, respectively), and NOx emissions represented 45%, 28%, and 35%, respectively [13], contributing at national level to total emissions up to 80%, 30%, and 5%, for SOX, NOX, and PM2.5, respectively [14].
Recently, average PM2.5 concentration measured in harbour areas ranged from 9.7 μg/m3 [15] to 19.5 μg/m3 [16] in Europe, relatively lower than some Asian port cities, where typical values were between 44 μg/m3 [17] and 62.6 μg/m3 [18]. Average absolute contributions from shipping to ambient PM2.5 were about 0.36 μg/m3 in January and 0.75 μg/m3 in June, across the Yangtze River delta in China [19], significantly differing from values found in other Chinese harbours such as Xiamen (51.9 μg/m3, [20]) and Shanghai (62.6 μg/m3, [18]). Comparable results were obtained in European port cities, with ship-related PM2.5 concentrations of 2.3 μg/m3 in Brindisi (Italy [21]) and Melilla (Spain [11]), 1.2 μg/m3 in Nicosia (Cyprus [22]), 1.0 μg/m3 in Barcelona (Spain, [23]) and Athens (Greece [24]), 0.8 μg/m3 in Msida (Malta [25]), 0.4 μg/m3 in Venice (Italy [26]), and 0.26 μg/m3 in Genoa (Italy [27]). In relative terms, impact estimate values for PM2.5 in USA coastal sites ranged from 3% to 9% and between 0.2% and 14% in some Mediterranean port cities, although a relative difference was evident with respect to Northern Europe, where Emission Control Areas (ECAs) exist. Significantly larger impacts were computed in proximity of some busy harbours in China (i.e., Shanghai, Hong Kong) reaching 25% [28,29]. Regarding gaseous pollutants released by ships, more limited studies are available [29,30,31,32,33]. Relative contributions to SO2 and NOx concentration were found to be higher than that of PM, ranging from 1% to 81% for SO2 and from 9% to 40% for NOX [32,33]. Contrarily, ships’ contribution to CO emissions was typically comparable with their contribution to PM [32].
Ultrafine particles from cruise ships and ferries (which represent the majority of ship traffic in some harbours) at berth can cause specific problems both to occupational health for harbour workers and for coastal residents. Worldwide, 14,500–37,500 premature deaths were attributed to PM2.5 related to shipping, with the highest values in areas recording both high PM concentration and coastal population density [34]. Projections indicate that the application of the new IMO 2020 policy will lead to a global decrease of morbidity and premature mortality due to shipping of about 54% and 34%, respectively [35]. However, 250,000 premature ship-related deaths and 6.4 million cases per year of childhood asthma have been estimated to occur after 2020, despite the reduction measures [35].
The use of low-sulphur fuels has been demonstrated to reduce shipping’s contribution to SO2 concentration and to secondary (via reduction of secondary sulphate) and primary PM in some port cities [36,37,38]. Consequently, as of 1 January 2020, global regulation of sulphur content in fuel of maximum 0.5% in weight, enforced outside SECAs (sulphur emission control areas), is expected to reduce global SOX and PM emissions by 75% [35]. However, a significant reduction in NOX emissions (outside nitrogen emission control areas, NECAs) is not expected and so far, there have been no EU-specific requirements for ships to reduce greenhouse gases (GHGs) emissions. In addition, the measure entitled “Regulations on Energy Efficiency for Ships” mandates the energy efficiency design index (EEDI) for new ships and the ship energy efficiency plan (SEEMP) for all ships as a global energy efficiency standard. It should be said that, in the short term, no further regulation of SO2 emissions from shipping (except for the implementation of new SECAs) is expected; however, enforcement inside and outside SECAs must be maximized to get the full benefits of the regulation. In the long-term period, further actions are needed to reduce sulphur emissions by using alternative fuels, retrofitting systems (i.e., scrubbers), and/or by switching to road diesel or rail transport. In Europe, some government and regulatory agencies and organizations, have introduced several initiatives to improve air quality in port areas in a “green port” perspective, thus minimizing human health and climate impacts, which may be considered as two faces of the same medal. In particular, the European Sea Ports Organisation (ESPO) proposed a gradual approach to reduce port emissions, starting from those at berths close to urban areas and then focusing on cruise ships’ and ferries’ exhausts. This is in accordance with the “European Green Deal”—Europe’s objective to become the world’s first net zero emission area by 2050 and to reduce emissions by 50% compared with 1990 levels by 2030.
Definitely, seaports and waterborne transport are seen as a priority in ensuring resilience and adaptation to climate change. Maritime transport was included in the EU’s emissions trading system, setting binding requirements for shipping companies to reduce their carbon dioxide (CO2) emissions by at least 40% by 2030. As with other decarbonization actions, the Directive 2014/94/EU on alternative fuels infrastructure (the AFID) promotes the use of alternative fuels in the transport sector by mandating Member States to ensure that there is an appropriate number of liquefied natural gas (LNG) re-fueling points (fixed or mobile) in Trans-European Transport Network (TEN-T) core ports by the end of 2025 [39].
In this picture, designation of the Mediterranean Sea as a SECA and/or NECA would socioeconomically benefit both the health and quality of life of the European citizens and the economy. A recent report [40] tried to assess the feasibility and the potential benefits of the implementation of a NECA or/and a SECA in the Mediterranean Sea (namely MedECA). Health benefits (as in avoided premature deaths) of such implementations were calculated as increasing by more than an additional third compared to the impact of the 2020 sulphur regulation (with Algeria, Egypt, Italy, and Turkey as the main beneficiaries), estimated at nearly 1730 avoided premature deaths per year.
This paper aims to review the current knowledge about the impact of Italian harbours on air pollution, due to both maritime traffic and related logistic activities in port areas. The focus is to summarize and discuss the main findings from available literature about relative shipping influence on atmospheric pollutants (gases and particulate matter), that could cause environmental and health issues. A deeper state-of-the-art analysis of air quality near to Italian harbour areas is provided, although different contribution estimation methodologies (i.e., source-oriented and receptor-based approaches) and associated uncertainties are present.
This work highlights the need of standardized and shared methods that could lead to more efficient management and development of seaports, also supporting future mitigation policies on harbour logistics and in-port ship movements and at berth. In this way, a “green” development of seaports can be achieved, combining economic, environmental, and health benefits in such polluted, industrialized, and populated coastal areas.

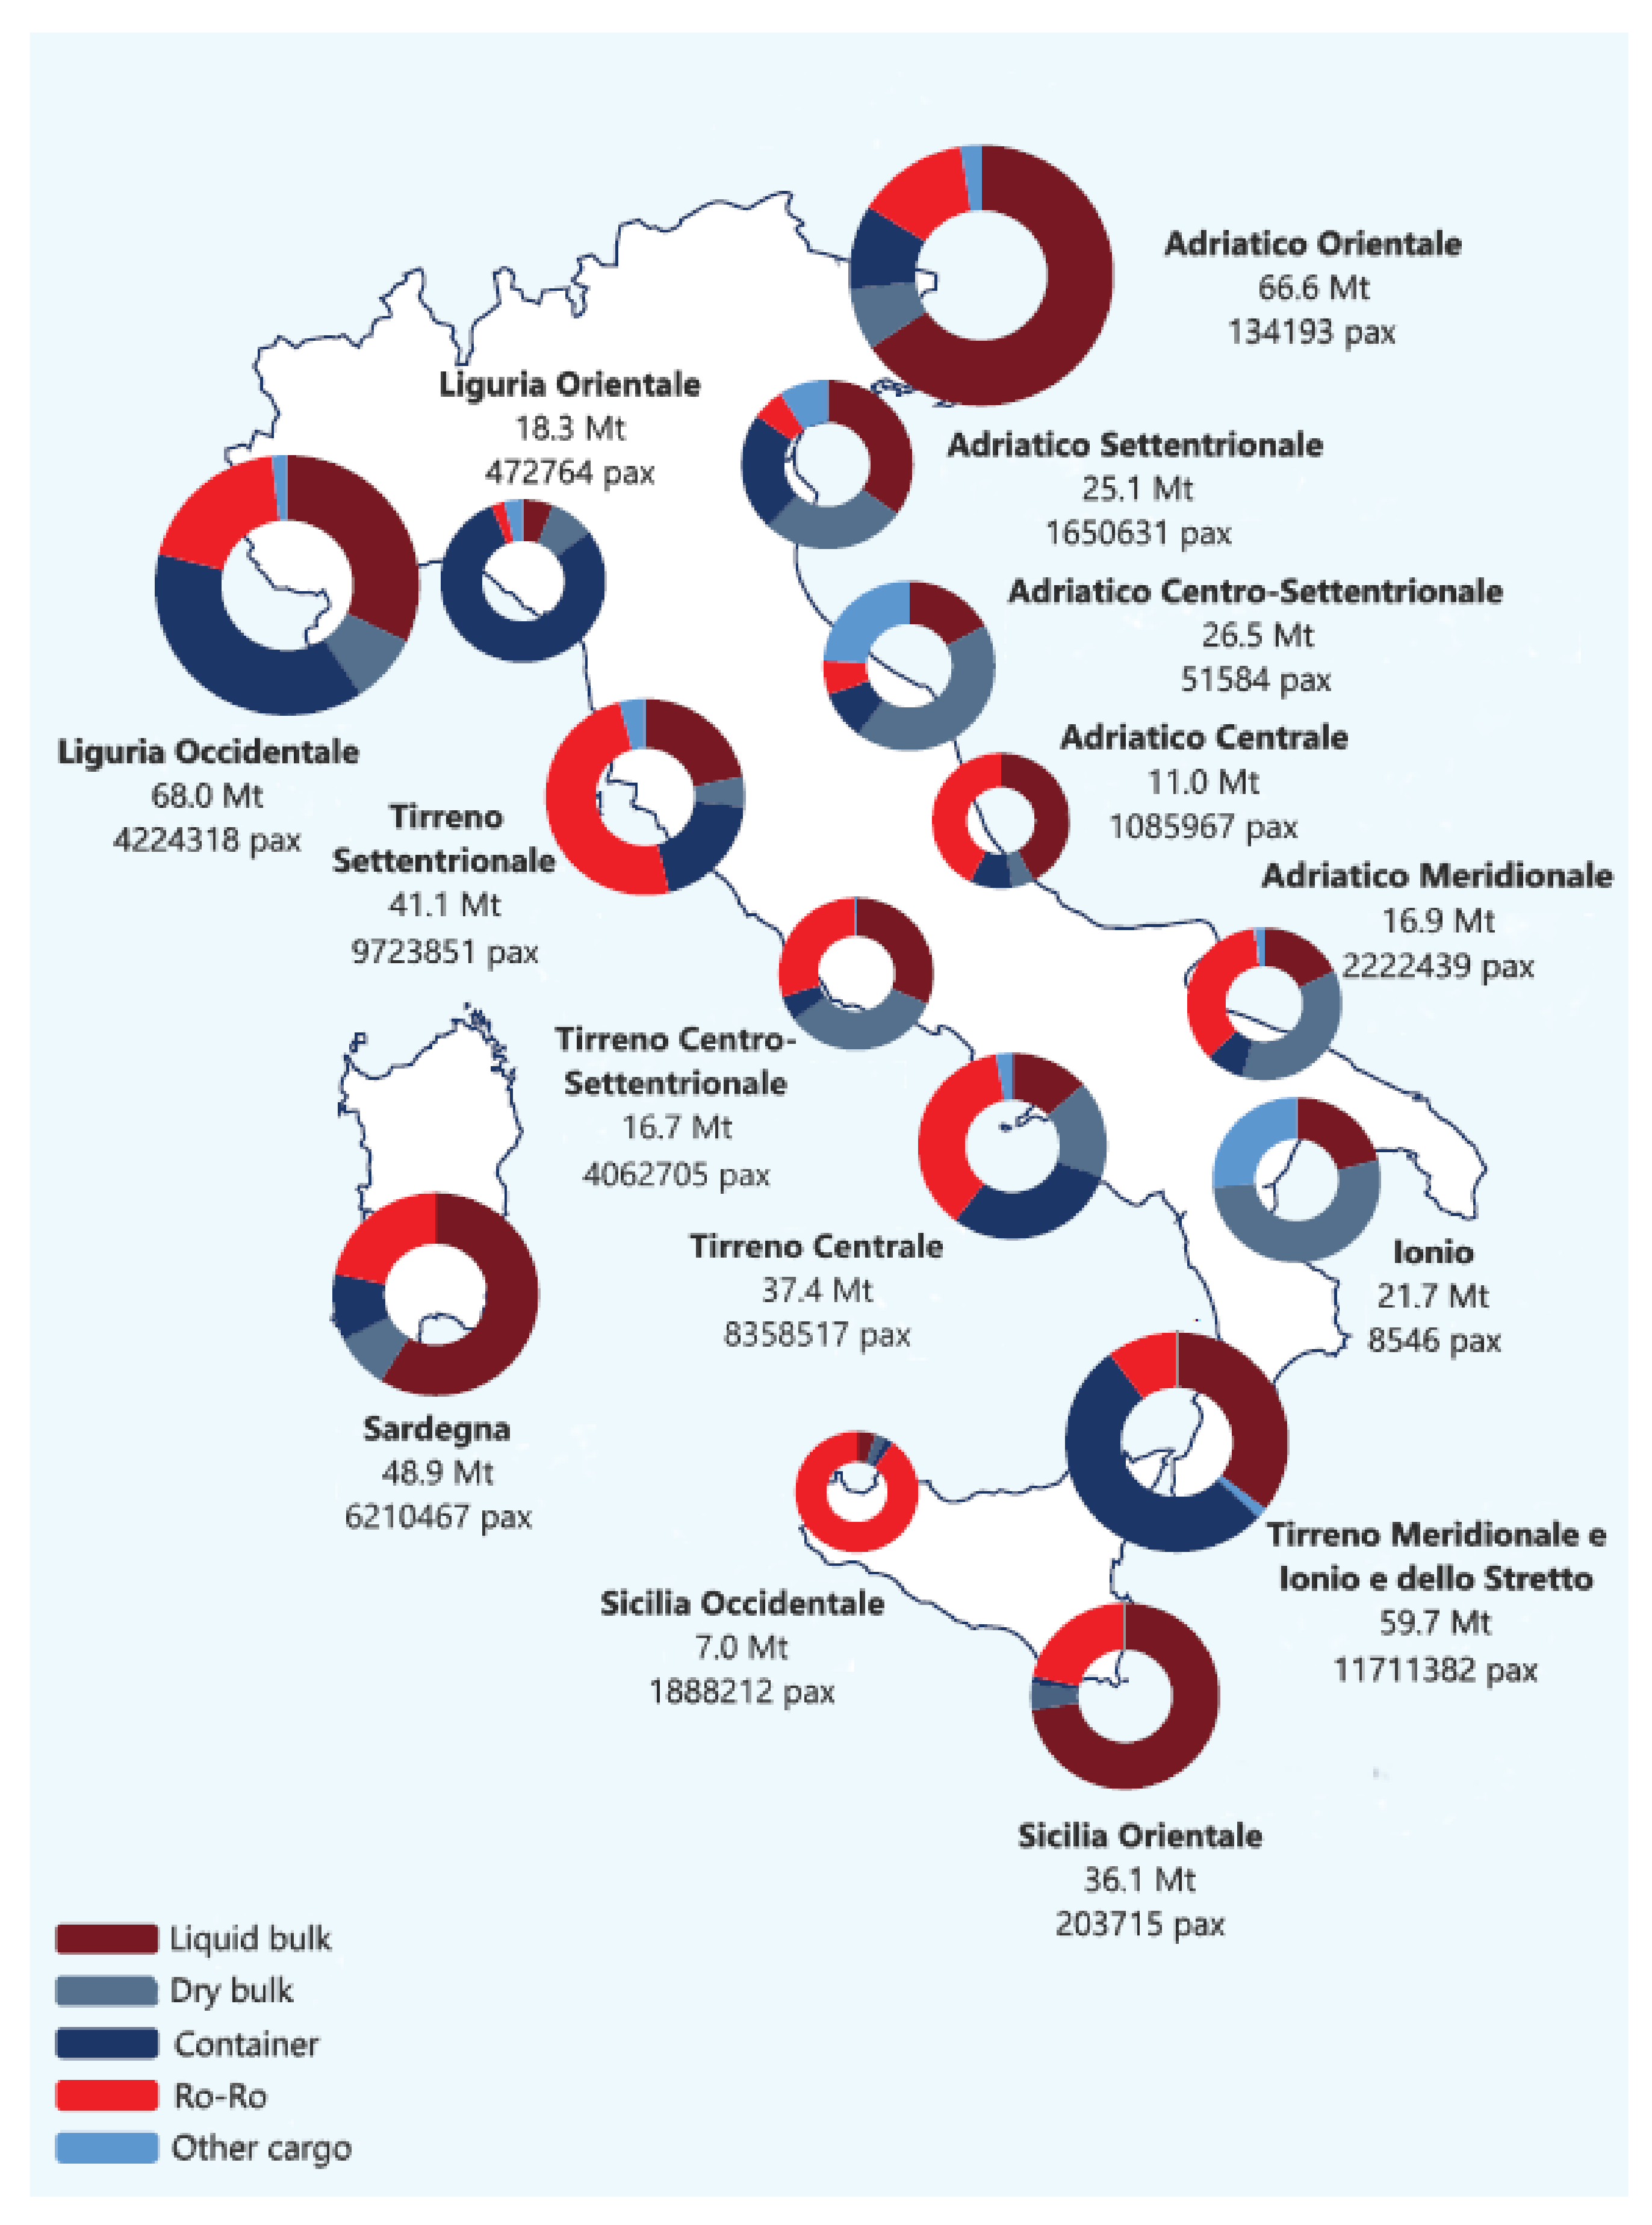
2. Organization of Harbours in Italy

Italian harbours play a logistic role as intercontinental interchange centers, being located within important commercial routes with Europe, North Africa, and Asia. At European scale, the country is very active, with the third-largest intake traffic in the EU and the fourth-highest one in terms of export tonnage, with five of the top-40 ranking ports for tons of freight loaded and unloaded in 2015, namely Trieste, Genova, Livorno, Gioia Tauro, and Ravenna [41]. At national level, import/export by sea represented 38% of the total commercial exchanges in 2017, with a growth of 12.4% compared to the previous period 2012–2016. The top three ports, in terms of movements of goods, in 2017 were Trieste (62 million tons), Genoa (54.2 million tons), and Cagliari (37.9 million tons), while the highest increase (>10%) was found for Messina, La Spezia, Salerno, and Catania. The most important Italian cruise harbours are Civitavecchia and Venice, with 1.4 and 2.2 million passengers in 2017, respectively, doubled and increased by 60% from 2006 to 2017. Italy is the worldwide leader for short sea shipping (SSS), in terms of gross tonnage, number of ro-ro cargo, and passenger cargo, with Trieste and Genoa in the EU top ten of commercial ports [42].
The National Strategic Plan for Ports and Logistics [43] highlighted the significance of environmental issues for the port industry. The Italian harbour system presents high heterogeneity as size and typology among infrastructures, and at the present, includes 33 harbours, organized in 15 port system authorities (Figure 2) according to the new law on port governance (D.L. 163/2016), each with a core network port. Taking into account that five million people live in the 33 port cities abovementioned, and that a third of Italy’s population is resident within 5 km of coasts [44], health and environmental issues in port cities should be unavoidably evaluated. Furthermore, some ancient port cities, such as Venice and Naples, received the most attention because of the potential damage caused by large cruise ships on historical, economic, and environmental heritage. Voluntary agreements (named “Blue Flag”) for Civitavecchia (since 2017), Venice (renewed yearly since 2007; present version since 2017), and Ancona (since 2018) have been signed among port authorities, cruise companies, municipalities, and stakeholders, anticipating the 2020 IMO regulation. All actors have committed to use lower-sulphur-level fuel (less than 0.1%, much lower than required by EU and Italian regulations) since entering into harbour and not only at berth.

3. Approaches for the Assessment of Shipping Impacts on Atmospheric Pollutants

The source apportionment of shipping’s atmospheric impact in cities with harbours is a complex task. It is not easy to discriminate and quantify the influence of ship traffic in such areas, because of the superimposition of adjacent land-based sources (i.e., industrial settlements, railway, urban agglomerates), other port activities, and/or local complicated dispersion conditions. Inside harbour areas, different emission sources act simultaneously, and are more or less relevant according to harbour function: maneuvering and hoteling phases, loading/unloading ship-related operations (i.e., cranes), vehicular traffic inside harbour. A large number of studies, including land-based, ship-based, and experimental measurements and model simulations (e.g., the weather research and forecasting (WRF)–Chem model, the WRF–community multiscale air quality (CMAQ) model, and the Goddard Earth observing system (GEOS)–Chem model), have been applied to investigate the impact of shipping emissions on air quality at different scales. Modeling has the advantage, compared to measurements, that it is possible to investigate spatial variability, long-term trends, and future scenarios. However, detailed and reliable emission estimates are needed [45].
Different receptor models’ approaches could be used to estimate the contributions of shipping by using statistical multivariate analysis on the chemical characterization data of PM: positive matrix factorization (PMF), principal component analysis (PCA), chemical mass balance (CMB), and multiple linear regression (MLR). In particular, chemical tracers of heavy oil combustion sources (including shipping) such as vanadium (V) and nickel (Ni) have been used to estimate primary contribution to PM2.5 [18,46]. This is especially because ratios of V/Ni values between 2.5 and 3.5–4.0 [11,47,48] are considered typical ship’s engine combustion markers, while ratios <2 are commonly associated with the presence of Ni-rich atmospheric pollution sources [49]. A few studies are devoted to the characterization of secondary aerosol contributions from ship emissions, even if they could be higher than the primary contributions [11,21,50]. Online high temporal resolution detection of pollutant concentration could be used to identify ship plumes [51,52]. Some studies were carried out in Mediterranean ports, by using high temporal resolution measurements of particles and gaseous pollutants, correlated with wind conditions and ship traffic [26,30,31,53]. An advantage of these experimental approaches is that no detailed information on sources is needed; however, results could be obtained for limited periods of time and in a limited number of sites.

3.1. Estimation of Shipping Emissions

Although in-port emissions represent only a small share of the global emissions of shipping [54], they could imply detrimental effects on life quality, in terms of human health, in local communities [55,56]. In order to regulate shipping emissions, their robust quantification and localization is necessary. Unfortunately, harbour emission inventories are usually less refined than those of other transport sectors, because of the absence of accurate information on the ship movements, operating times, and fuels used, and high uncertainty on emission factors (EFs) [57].
Generally, shipping emissions have been estimated in several studies with full top-down, full bottom-up, and bottom-up/top-down plus geographical characterization modeling approaches at local and regional/global scales. In the full top-down approach, total emissions are calculated at a large scale, (i.e., national), and then extrapolated at a smaller scale (regional or urban) using proxy variables. Contrarily, in the full bottom-up approach, pollutant emissions are estimated for each ship in its specific position and during a specific activity, and then aggregated over time and space. Being useful to obtain a preliminary estimation of local emissions, this methodology has been used in several works and by national environmental agencies [57,58,59,60,61]. Due to the increasing ship data availability through the automatic identification system (AIS), the bottom-up methodology is considered more accurate, although it requires several efforts for data collection and analysis.
The methodologies applied to compute emissions are based on different assumptions and information, and estimates are generally carried out at local or national level on annual basis.
The choice of the methodology for estimating shipping emissions is strictly related to the availability of detailed information on activity data (i.e., fuel, engine type, ship movements), aggregated at different levels and derived from different sources (i.e., national statistics, local port authorities). In particular, Tier 1 and 2 approaches use fuel consumption by fuel type, but require country-specific data on the proportion of fuel used and the engine type (slow, medium, or high-speed engines). Therefore, they are based on fuel consumption as activity indicator, assuming average ship-emission characteristics in the estimation procedure. Alternatively, if detailed ship movements as well as technical ship data (i.e., gross tonnage, engine size and type, power installed, fuel consumption, time spent in different phases) are available for individual ships, a Tier 3 approach is suitable, even if it is time-consuming compared to the previous ones. In all cases, emissions should be split in domestic and international emissions, according to criteria defined in the last European Monitoring and Evaluation Programme/European Environment Agency (EMEP/EEA) report [14]. Even if the distinction between emissions in harbours and during navigation is not required, such information can be relevant for local inventories and for air-quality modeling purposes. In this case, the Tier 3 approach is recommended, in which several phases in shipping are distinguished. Definitively, a combination of different data sources could be a good choice to get more comprehensive and accurate outcomes [61].
Several uncertainties are related to parameter data input such as load factors, fuel type, and consumption rate, generally known only as average values depending on the vessel classes [62,63]. The main uncertainties of in-port ship emissions are due to their inhomogeneity in different aspects: availability of data for each vessel category (data on commercial ships are uncommon than those of cruise ships); attribution of emissions to in-port activities (maneuvering, hoteling, navigation); degree in detail of data for each vessel type (i.e., calls, TEU for commercial ships, total passengers for cruise ships). Most of the methodologies and emission factors (EFs) applied derive from literature [10,59,62,64,65,66,67,68,69,70,71,72,73,74,75,76]. However, EFs used for different pollutants (NOX, CO, PM, SO2, CO2) can markedly differ among studies, by using the ENTEC reference [77] or the modified version for main and auxiliary engines [57,59] and for different loads [60,78,79]. ENTEC (2002) provides uncertainties for EFs, indicating that the highest values are estimated for PM and non-methane volatile organic compounds (NMVOCs) (between 25% and 40%); however, uncertainties range from ±50% to ±5% if incomplete or complete activity data are available, respectively. Finally, since the errors are random and some underestimations could be balanced by overestimations, a reasonable value of 30% may be assumed as average emissions uncertainty [31,80].
In conclusion, a comparative analysis of current methods for energy consumption estimation and emissions in open sea was reported by Moreno Gutierrez et al. [80], while pollutant emissions rates for different in-port phases (mooring, maneuvering) of cruise ships in some harbours in Greece were determined by Papaefthimoiu et al. [69].
Apart from these different approaches in calculating emissions, correlation with traffic data should be assessed in order to estimate the real impact of shipping to local air quality. A regression analysis between emission indicators (NOX, SOX, CO, and PM) and independent variables, such as port time, passenger capacity, and vessel gross tonnage (GT), was performed in some European and non-EU harbours, evaluating load factor, engine working time, fuel type, and hoteling electric power [81,82]. Generally, the influence of ship emissions on pollutant concentrations has been demonstrated to be significant only during ship-plume-influenced periods (i.e., sampling sites downwind). Nunes et al. [83] demonstrated that the hoteling phase was the most critical one and container ships were, in general, the major causes of emissions, together with cruise ships (in summer).

3.2. Receptor and Dispersion Modeling Approaches

The two different source apportionment (SA) approaches have peculiar potentialities to be exploited: by one side receptor models, more suitable to identify emission sources associated to specific markers, and, on the other side, simulation models (i.e., chemical transport models, CTMs), which can be useful to investigate the formation of secondary aerosols, also apportioning gas precursor emissions. As a consequence, results from receptor models are only referred to the monitoring site, while numerical models provide outcomes on the whole studied territory with a certain resolution. In order to create concentration/contribution maps, dispersion and photochemical models are usually applied.
Different modeling approaches have been adapted from global/continental/national scale [35,84] to local level [32,85,86] with both advantages and drawbacks for each methodology. The uncertainties of the alternative approaches (i.e., dispersion models) are described in the literature [87,88,89].
The Gaussian dispersion models such as the California puff model (CALPUFF), and the atmospheric dispersion modeling system (ADMS), can simulate the effects of temporally and spatially variable meteorological conditions from point, line, area, or volume sources at local scale (i.e., urban). In order to assess the contribution of ship emissions to air quality, concentration values at specific grid cells (corresponding to receptor points) are compared with those measured at fixed monitoring stations.
Other Eulerian CTMs, such as the comprehensive air quality model with extensions (CAMx), CAMX-PSAT (particulate matter source apportionment technology), SPRAY, or the flexible air quality regional model (FARM) are regional photochemical dispersion models, which simulate the emission, dispersion, chemical reaction, and removal of pollutants by solving the pollutant continuity equation forward in time for each chemical species on a system of three-dimensional grid(s). These models simulate primary and secondary pollutant transport and concentrations at different scales. The spatial resolution is defined separately for the horizontal grid and the vertical layers, and the model can be adapted to different meteorological models (i.e., WRF). Specific techniques such as PSAT could be implemented in CAMx to provide source apportionment for primary and secondary particulate matter species. In this case, in order to estimate shipping contribution, an approach called the “zero-out method”, using WRF-CAMX or FARM, computes the relative difference in concentration of investigated pollutants between two scenarios. In the first run, all natural and anthropogenic emission sources are included, while in the second one shipping pollutant emissions are excluded. Then, extrapolation of concentration values of specific grid cells indicates the shipping/harbour impact.
Receptor models (PCA, PMF, CMB) aim to reconstruct the contribution of different sources of atmospheric pollutants, based on ambient data (i.e., PM elemental and chemical composition) at monitoring sites. The main advantage of receptor models is that they could be applied with limited knowledge regarding emission sources acting on a specific site. On the other hand, one limitation is the limited spatial resolution and the difficulty of distinguishing shipping emissions from those of other sources such as “heavy oil combustion”, characterized by the same chemical species in PM [21]. According to chemical characterization of PM, a qualitative indication is obtained by investigating the V/Ni ratio. A V/Ni ratio between 2.5 and 3.5–4.0 is considered typical for ships emissions [11,47,48], whilst ratios <2 are commonly associated with the presence of Ni-rich atmospheric pollution source [49].
In PMF analysis, a factor/source characterized by V and Ni typically identifies and quantifies heavy oil combustion, including shipping [11,27]. However, it could effectively represent a mixed factor with industrial emissions that are present in the study area. Therefore, shipping’s contribution to primary PM2.5 can be extracted considering the V as a marker for the combustion in ships’ engines [18], by using the formula suggested in previous studies [46].
In other studies, a statistical analysis of high temporal resolution data is applied in some Adriatic harbours [26,31,55,90]. In this case, the approach used is based on the integration and synchronization of data of wind direction, pollutant concentrations, and ship traffic (departures/arrivals and maneuvering). The impact on the concentration is estimated by comparing the average concentration in cases influenced by ships to that in cases not influenced, when the measurement station was downwind of potential emissions.

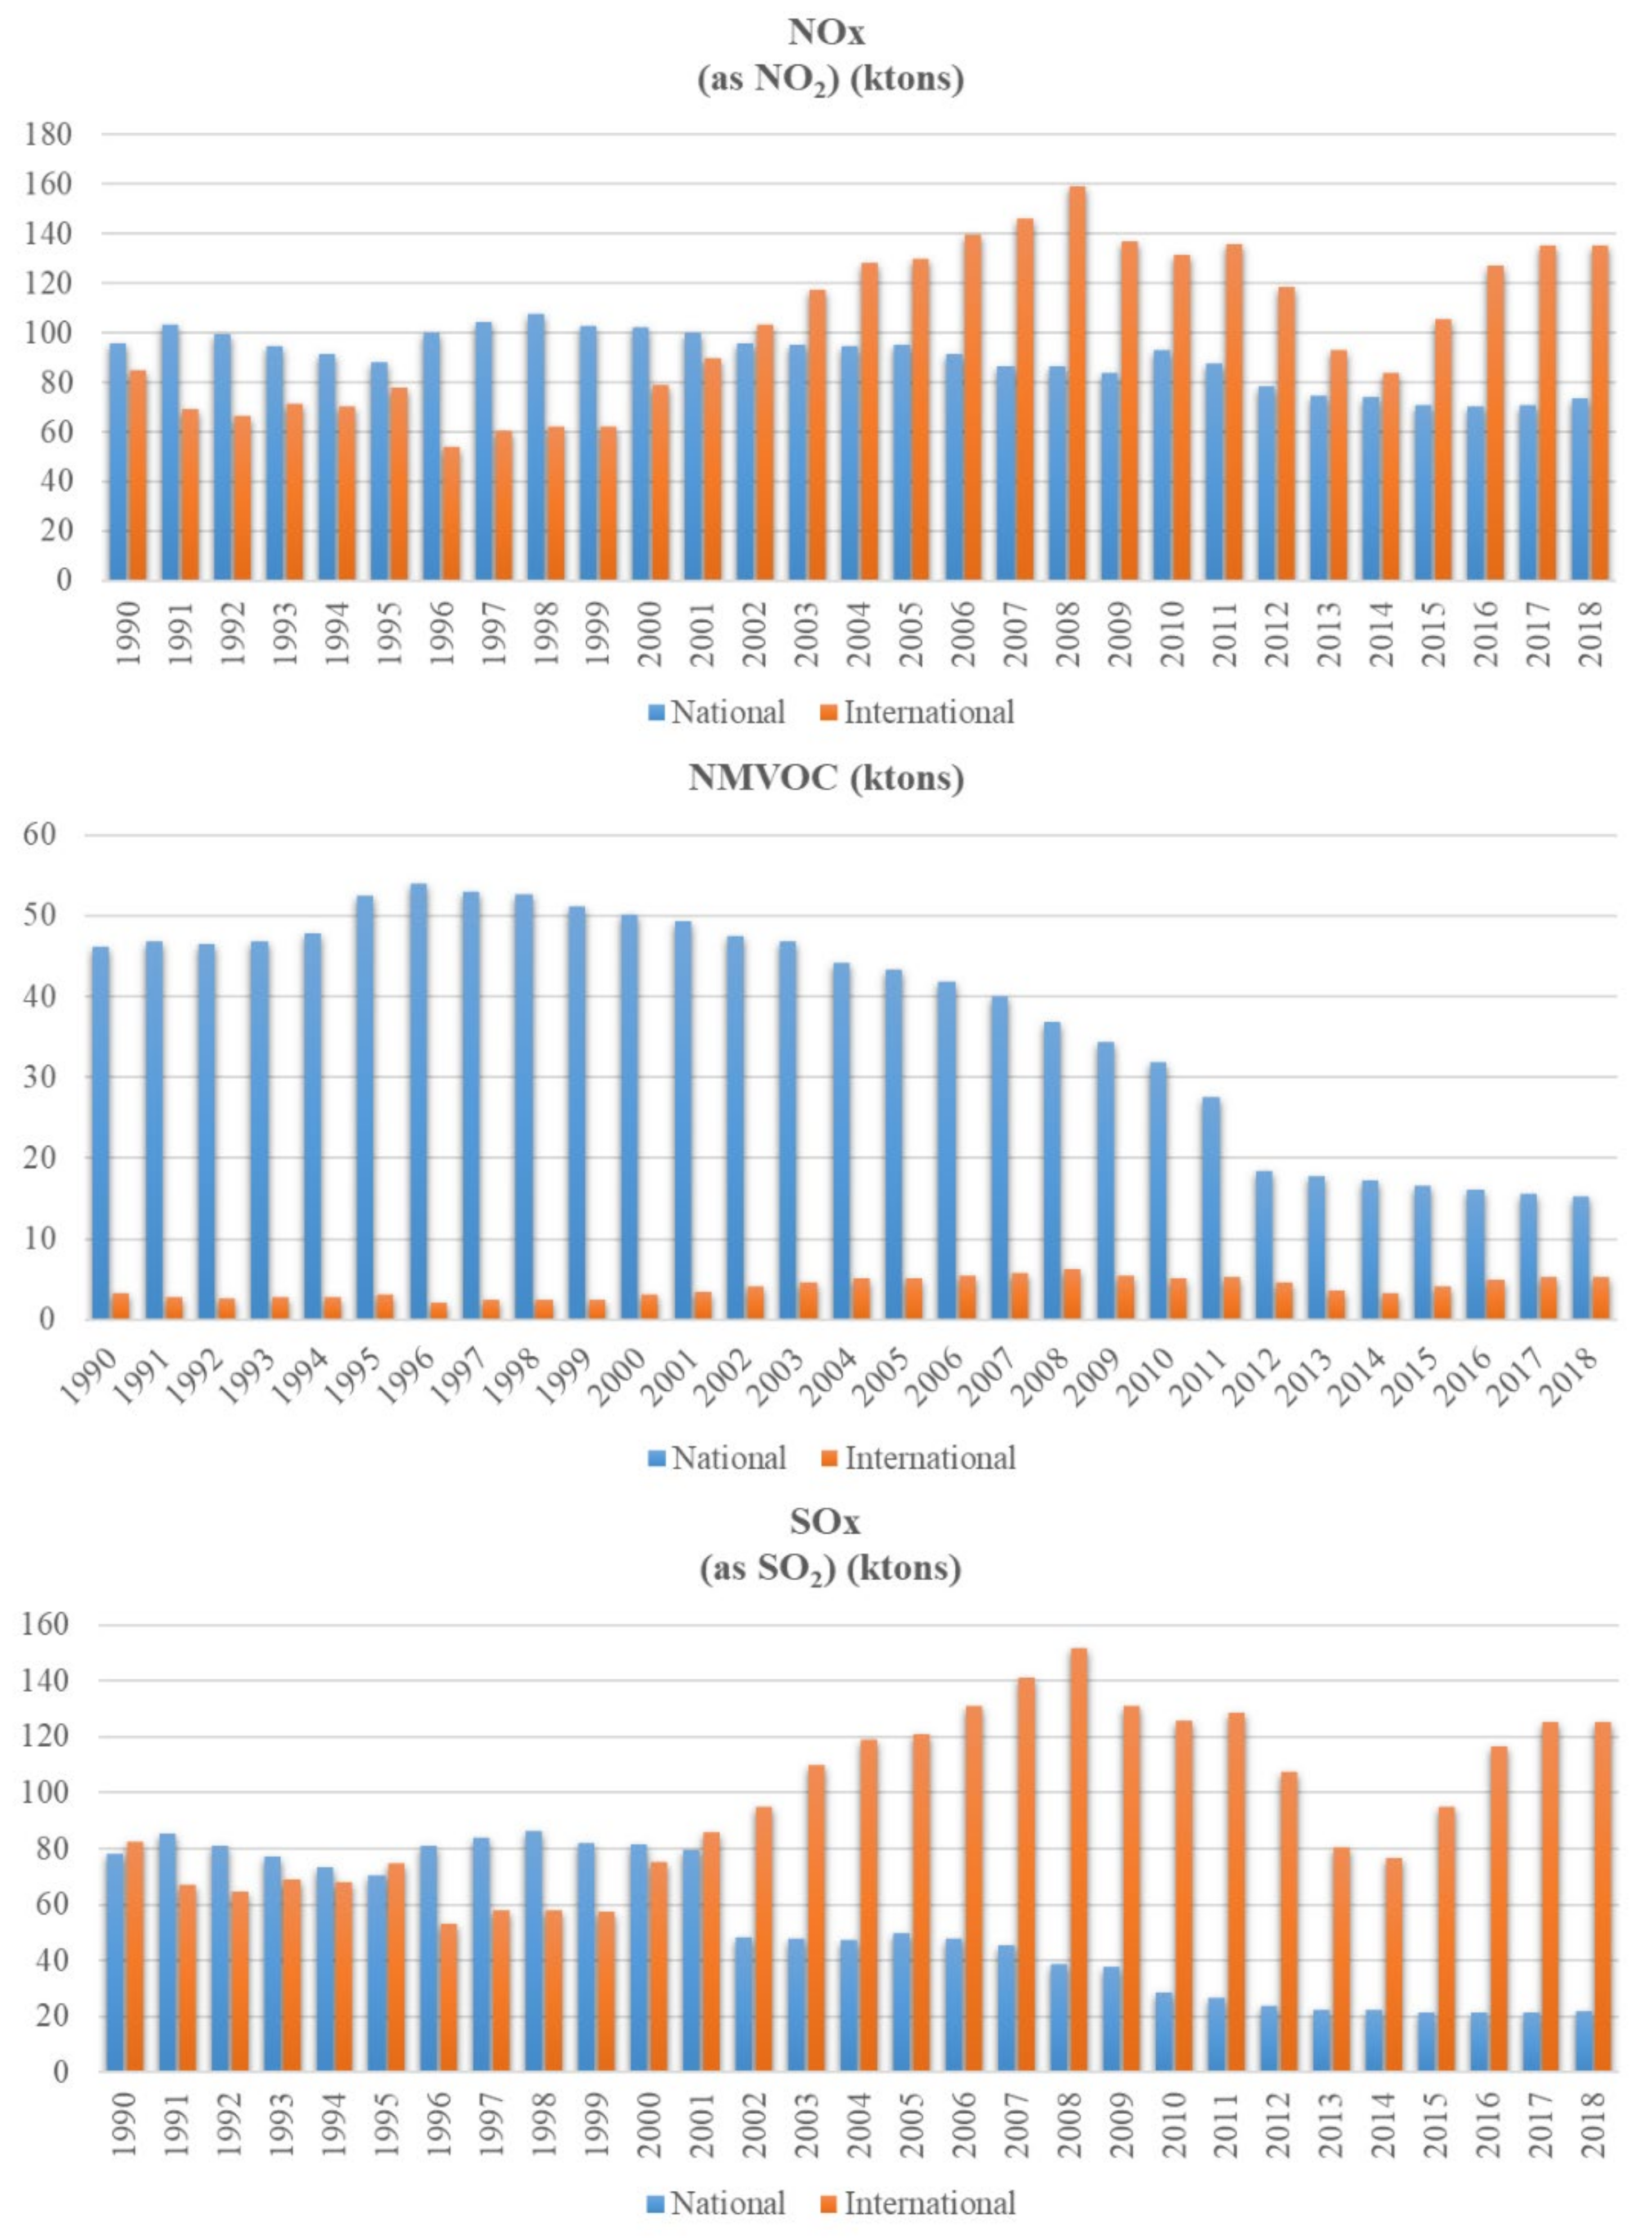
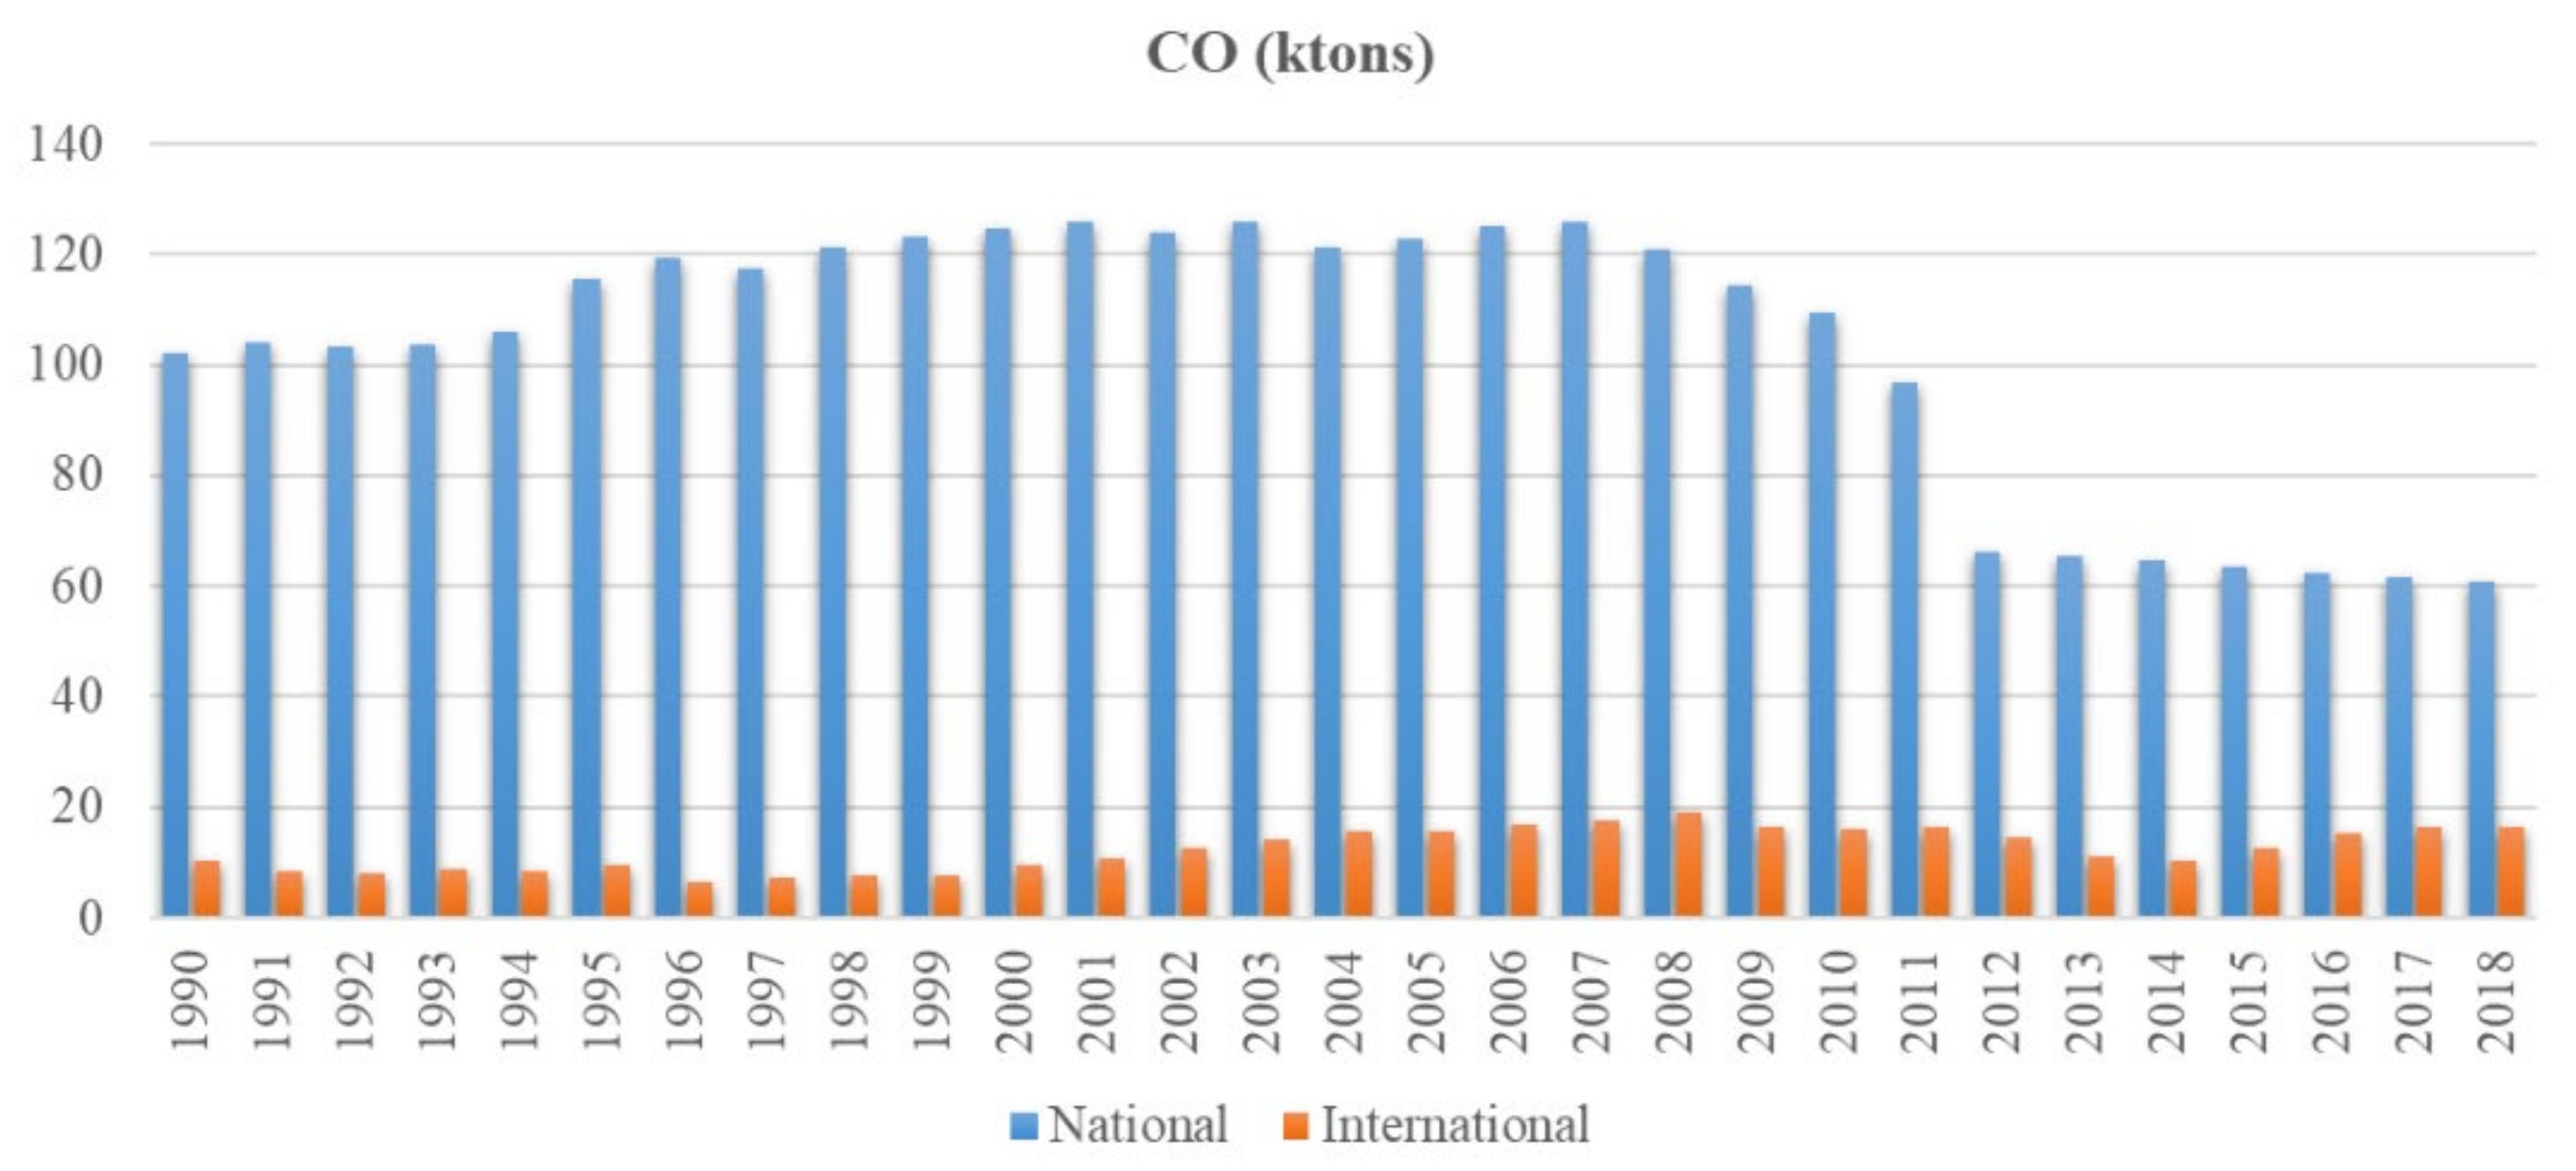
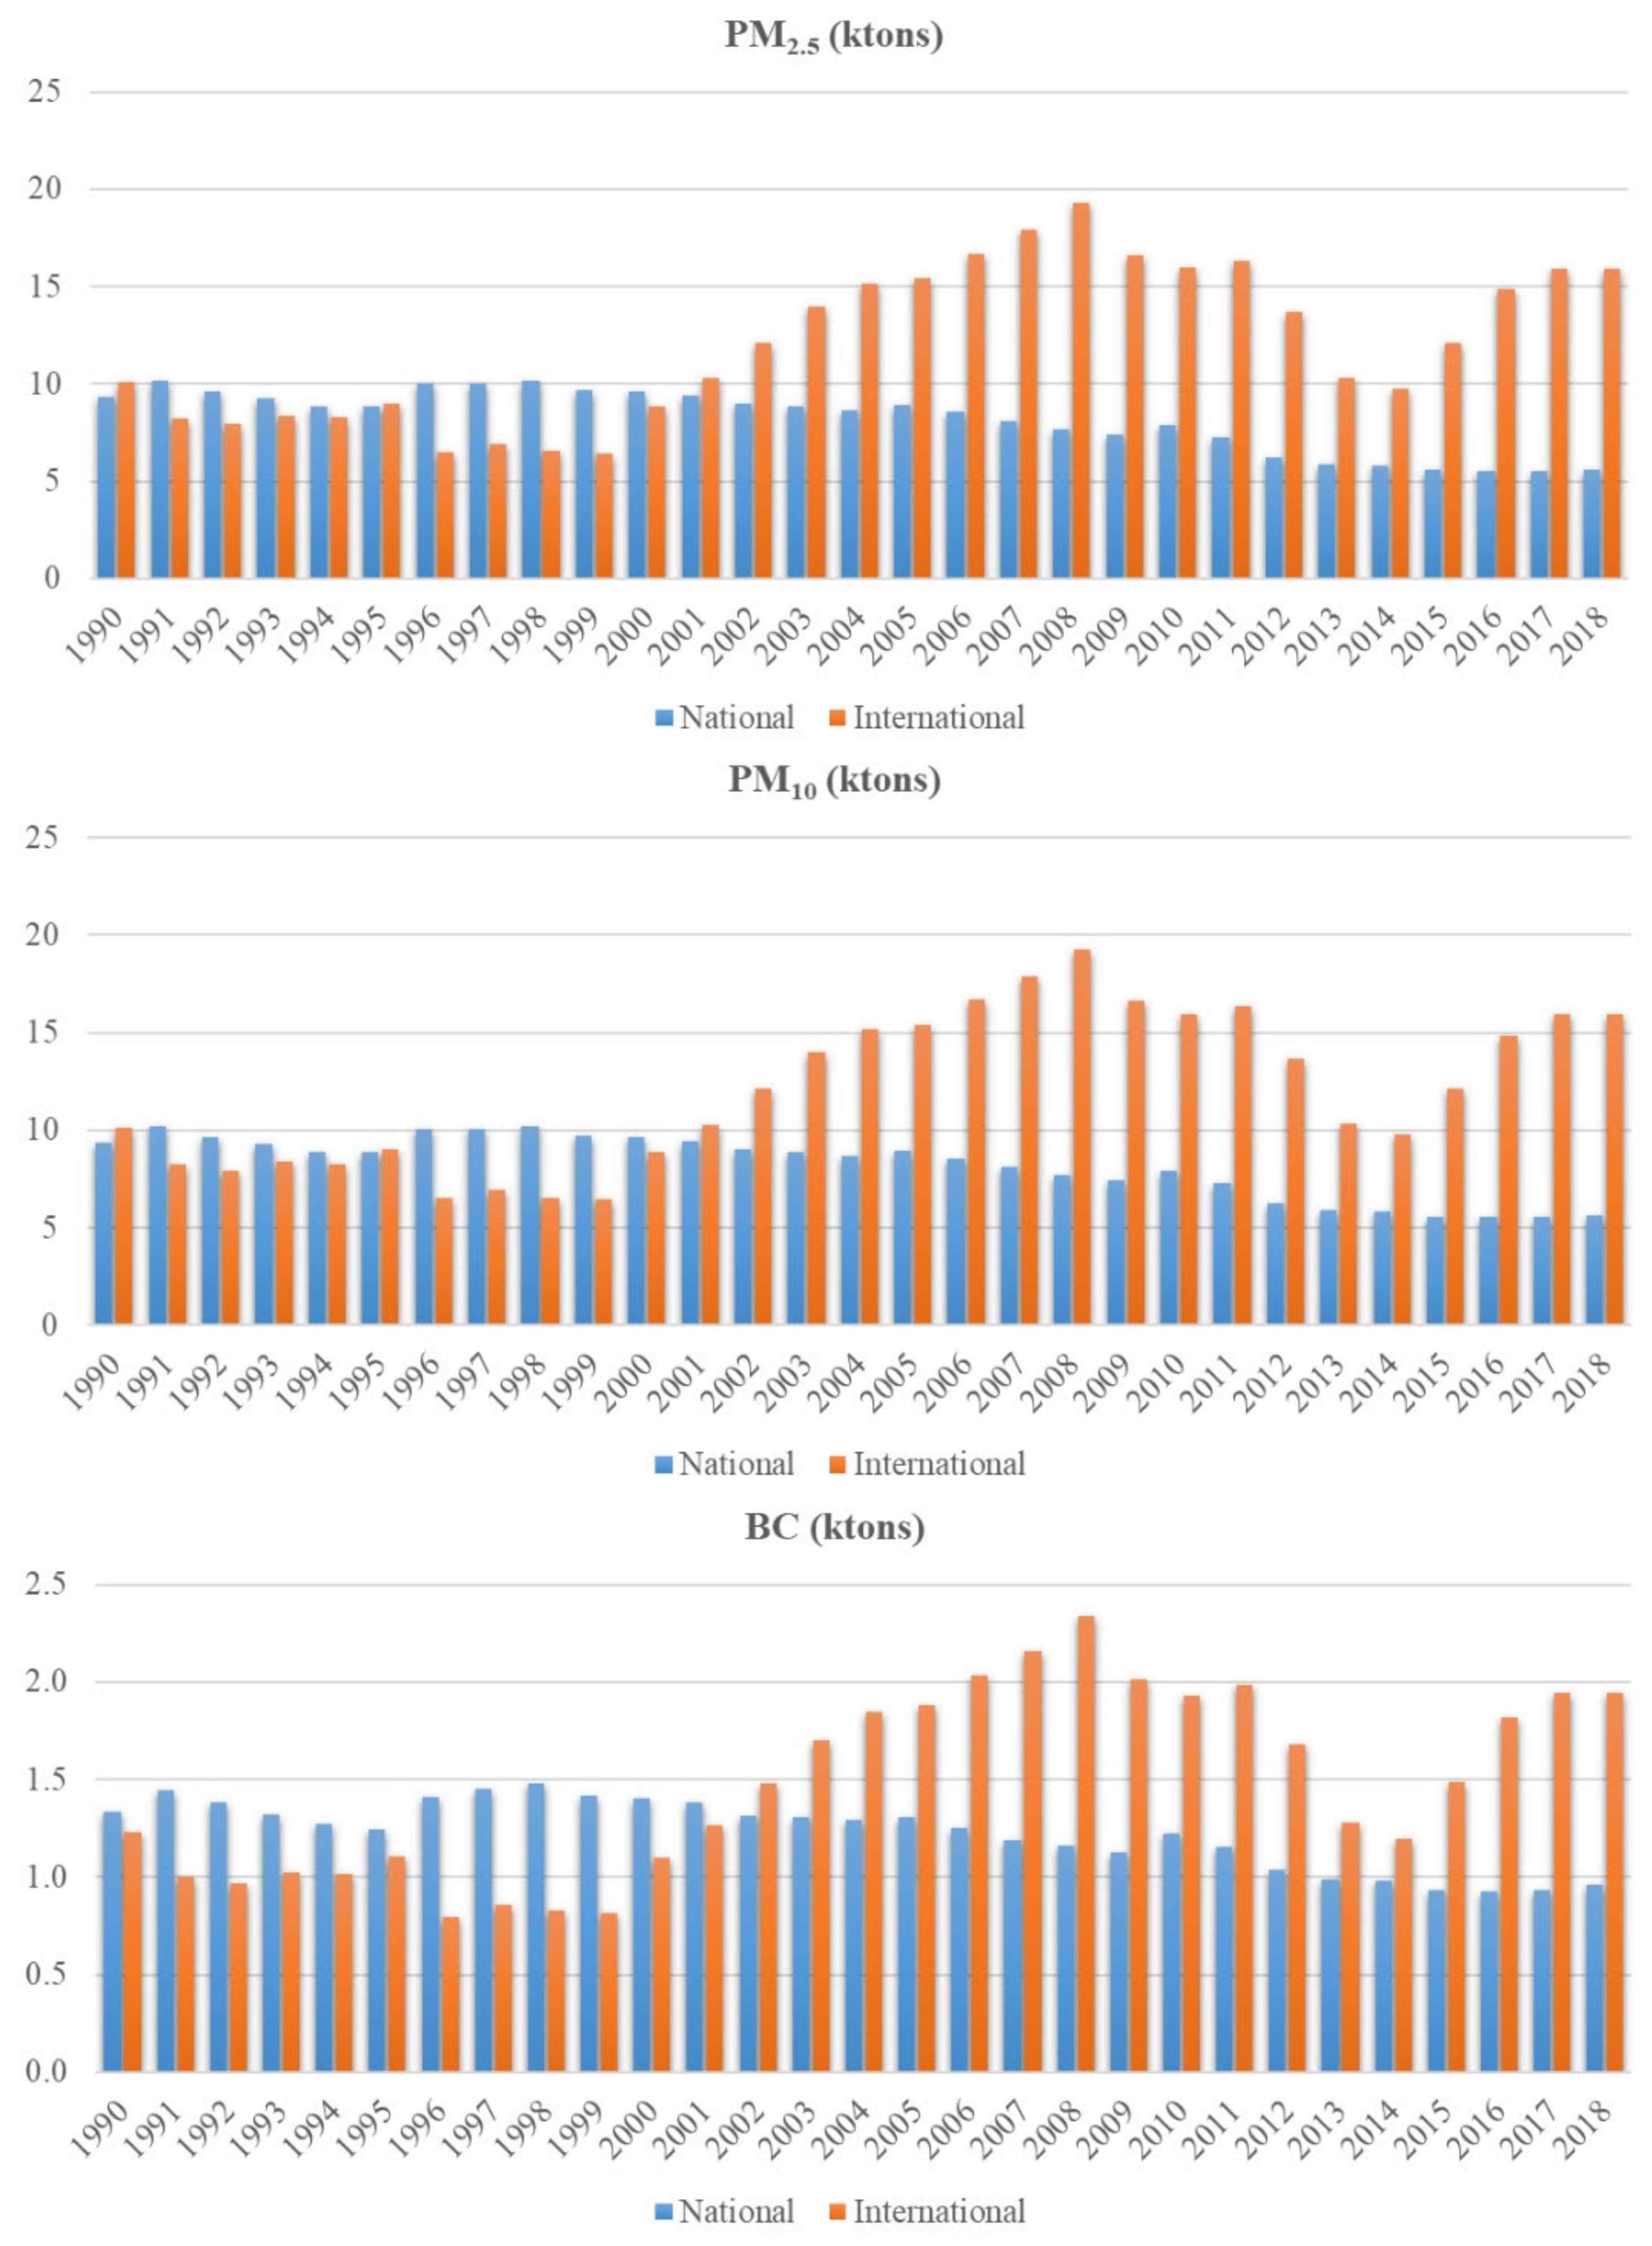
4. Emissions of Italian Harbours

Estimates of emissions from the navigation sector were carried out in the last Italian inventory [91], according to the Intergovernmental Panel on Climate Change (IPCC) guidelines and good practice guidance [92,93] and the EMEP/EEA guidebook [14]. Here, navigation was recognized as a key source category with respect to emissions of NOX, SOX, CO, PM10, PM2.5, and BC. National average emissions and consumption factors were estimated for harbour and cruise activities both for domestic and international shipping from 1990 to 1999; estimates were updated since 2000, in order to consider the most recent trends both in terms of modeling between domestic and international consumptions and improvements of operational activities in harbours [94]. Emissions from international navigation are also estimated and included as memorandum items but not included in national totals [14]. In addition, the composition of the national fleet of gasoline-fueled recreational crafts changed from 90% of two-stroke-engine-equipped vessels to 53% of four-stroke-engine ones, since 2000, thus influencing emissions of CO, NMVOC, and PM.
Results reported in Figure 3 and Figure 4 for the main pollutants must be interpreted taking into account the effects of the EU legislation combined with national law for maritime fuels. From 2002, the introduction of a limit of sulphur content in maritime gasoil equal to 0.2% and 0.1% was set. A maximum sulphur content in fuels was established at 1.5% in harbour from 2008, and, from 2010 equal to 2% in domestic waters and 1% in harbour. Overall, in the period from 1990 to 2018, two different phases could be observed for all pollutants analyzed.
In particular, CO and NMVOC emission trends seem to be superimposable with a very significant decrease since 2012 for national shipping. Instead, the rest of the pollutants (NOX, SOX, CO, PM10, PM2.5, and BC) reflect comparable emissions for international and domestic navigation until 2001–2002, and then increasing for international shipping that exceeds national emissions. Differently, being directly related to legislation limits, SOX national emissions recorded the most pronounced decrease (at least about 50%) since 2002, likely due to the shift of the sulphur content gasoil limit from 2% to 0.2%.
Within ship traffic, cruise tourism significantly increased during the last several years, therefore many port cities are progressively expanding their harbour areas and logistic infrastructures. The European market has grown by 162% over the ten years from 2002 to 2012 [95]. This implies coastal residents’ exposure to pollutant emissions from shipping, in some cases considerably even larger than from road transport. Predictions on cruise ship emissions, even after the 2020 legislation, indicated SOX emissions up to 18, 10, and 41 times higher than all of the passenger vehicles respectively in Spain, Italy, and Greece (Barcelona, Palma Mallorca, and Venice are among the top Mediterranean cruise destinations), with no change on emissions in ports and in SECAs [12].
In Italy, cruise ship traffic is notably a significant sector, and the country has four of the top ten Mediterranean harbours in terms of number of passengers and port calls in 2019 [95]. Civitavecchia is the second harbour in Italy, after Genoa, while Naples recorded the largest increases (33.5% and 20.3%) for passengers and port calls from 2018 to 2019, respectively [12]. Finally, the harbours of Ravenna and Trieste are considered to have the highest potential along the Adriatic coasts, due to their strategic positions within commercial corridors and innovation skills [95]. In a recent report [12], cruise ship emissions were estimated at port and country-level for 2017 and results only for Italian harbours are summarized in Figure 5. The highest emissions were observed for Venice, Civitavecchia, and Livorno, followed by Naples and Genoa. This is reasonable considering the highest numbers of ships and gross tonnage (not reported). Genoa had more relevant emissions with respect to other sites with comparable traffic (Cagliari, Messina, and Palermo). Venice and La Spezia showed different ratios between pollutants, with the overall lowest values of SOX emissions, also representing the minor pollutants emitted compared to PM and NOX. In Venice, this finding could be explained as an effect of the voluntary agreement named “Venice Blue Flag”, between stakeholders and ship companies, that reduced significantly not only SOX emissions but also PM primary and secondary emissions [36].
Concerning other ship categories, some commercial harbours could represent the majority in terms of gross tonnage and number of ships (i.e., ferries, cargoes). Italy has four leading hubs: Gioia Tauro, Genoa, La Spezia, and Trieste, in three different important areas and commercial networks. Emissions of different vessel categories and for each operation phase were computed in several studies in Italian harbours with activity-based methodologies, then represented as input for model simulations. Total emissions of NOX, PM10, SO2, CO and NMVOCs were calculated in some Italian harbours in different studies and ad-hoc projects by applying EMEP/EEA methodology (Figure 6).
Venice is the most trafficked harbour, with important emissions of all pollutants, and a marked decreasing trend in SO2 emissions from 2007 to 2017. Comparable values of NOX emission are reported for Genoa. Other pollutants represented a small share, except for NOX emissions, which were the largest in all ports. Although there are comparable ship traffic volumes, in terms of number of ships, in Bari, Ravenna and Civitavecchia, emissions differed for PM10, SO2, CO, and NMVOCs, with comparable values only for NOX.

5. Shipping Contribution to Concentration of Atmospheric Pollutants

Relative impact of shipping and in-port activities have been estimated by calculating shares of measured pollutant concentrations associated with harbour area, evaluating spatial (simulation models) or temporal (high temporal resolution sampling in ambient air) variation in concentration values, or investigating specific chemical tracers (i.e., V). Available studies regarding gaseous pollutants emitted by ships using receptor-oriented approaches are more limited yet and generally focused on NOX and SO2.
By applying the ADMS model in Bari, estimated impacts, considering both ship traffic and internal logistics activities (road vehicles and cranes), to specific receptor sites at different distances from the harbour, were highest for NOX (up to 40%) and PM2.5 (up to 12%), compared to negligible contributions for CO and SO2 (solely due to ships and markedly decreasing just outside the port area). Vertical profiles of SO2 for some categories of vessels (cruise, ferries, and fast vessels) in Naples [99] revealed that, although cruise ships had the maximum absolute emissions, contributions at different heights of fast vessels were the highest. This study indicated that the best position of receptor points should not be at ground level inside the harbour area but between 20 and 50 m, corresponding to the maximum emissions for fast vessels and large ferries, respectively. By applying CALPUFF in the same harbour [33], the contribution of cruise ship emissions, estimated on a yearly basis (2016) and at 2 km from the relative terminal, was found equal to 2.47% for NO2, reaching a maximum in summer (3.58%), while higher contributions were estimated inside the port area, at the terminal (6.10%). This confirms the fact that impact of shipping emissions rapidly decreases outside the harbour area, as found in other studies [32]. If short time averages are considered, 1-h peak concentrations (values > 99° percentile) could lead to an impact of 86.2% for NO2, while contribution to SO2 was still low (≈1%) due to the use of low-sulphur content fuel (0.1% w/w). Gariazzo et al. [100] applied the 3D Lagrangian model SPRAY in Taranto, concluding that harbour activities did not contribute significantly to urban air quality, with respect to emissions from industrial areas; however, emissions of NOX and SO2 from ships accounted for 9% at selected urban monitoring stations.
Considering ship plume behavior, with relatively short and intense concentration peaks, modulated by the activities within the harbour (arrival, departure, and hoteling of ships) and by the local meteorology, impacts from experimental high temporal resolution measurements could be computed. A statistical approach was performed in Brindisi [31], synchronizing ship traffic movements (arrival/departure) with concentration data when the harbour was downwind. In this case, results were comparable with those found by two different simulation models in the same area [90] and in the range estimated for Bari [32] and Trieste [101]. The cells of the simulation domain of the WRF-CAMx model that better represented the measurement sites in Brindisi and Venice port cities were extracted, obtaining numerical modelled contributions for PM2.5 and PM10 in reasonable agreement with the calculations obtained from measured data [90].
Comparing results listed in Table 1, the relative contributions to SO2 and NOx emissions were higher compared to those to PM2.5 and/or PM10 emissions (Table 2). This is an important finding since the exceedances of NOx regulatory limits could be a notable issue to be dealt with in mitigation actions. It must be said that the values listed in Table 1 and Table 2 depend on the distance of the measurement site from the harbour location. In addition, the studies could include periods that had different legislation regarding sulphur content in fuels. As expected, SO2 was the relative largest gaseous contributor from shipping, being a source-specific pollutant, not related to other sources (apart from some industrial activities). The values obtained with different models reflected a wide variability, ranging from 1% to 81%. However, it must be said that such contribution of SO2 was found to be lower than those of NO and NO2, if in-harbour phases (i.e., berthing and hoteling) were evaluated, because of the required use of low-sulphur fuels [31]. The concentration of SO2 during a cruise campaign approaching some Mediterranean harbours (including Civitavecchia and Savona) was found to decrease from 2009 to 2010, as a consequence of the application of the European Directive from January 1, 2010 [102]. In addition, projected emissions of SOX for 2020 (after entry into force the new sulphur limit from 1.5% to 0.5% for cruise ships sailing in EU ports and SECAs) indicated a reduction of 66% at national level [12]. Moreover, it has been demonstrated that the use of cleaner fuels within harbour areas could lead to a reduction of secondary and primary PM [73,83,84], but not significantly of metals in PM10 (excluding V) and PAHs [16,53].
Regarding NOX, estimated contributions from the bottom-up (ADMS) and up–down (from experimental data) methodologies in Bari and Brindisi were in good accordance. Likewise, comparable values for NOX (8.9–9%) and NO2 (5–9.1%) were estimated in Venice, Taranto, and Naples. Finally, regarding ozone contribution (not reported), some studies [31,103] put in evidence two local concurrent effects: the local O3 titration at the sites most NO-polluted, and increased ozone (O3) level at larger scale due to NO2 presence in ship emissions, especially in the summer season in the Mediterranean Sea [104].
Widely different SA techniques addressed the contribution of shipping activities to PM values in Italian port cities (Table 2). However, beyond the impact of such criteria on pollutants (i.e., PM2.5 or PM10), other metrics such as particle number concentration (PNC) or size-segregated particle concentration (i.e., in nanometric range, diameter < 0.1 µm) are scarcely studied [30,36,53,90,97]. This is a knowledge gap, since the size and chemical characterization of ship-emitted particles should be considered for health and environmental implications [56].
Relative shipping contributions of ultrafine particles (diameter < 0.3 µm) could be up to 3–4 times larger than those in mass concentrations (either PM2.5 or PM10) [31,55,105], suggesting PNC as a good parameter to add to regulated indicators of shipping impact. Available outcomes (26% and 23% in 2012 and 2014, respectively) in Brindisi were four times higher than those in Venice (6% and 7.4% in 2012 and 2018, respectively), revealing the relevant impact of logistics activities in Brindisi (i.e., vehicular traffic) and the indirect mitigation effect on PNC by the Venice Blue Flag. Furthermore, comparison of results obtained in two harbour cities (Venice, Brindisi), showed remarkable similarities in the general shape of relative contributions of shipping to atmospheric particle concentrations as function of size [55]. In detail, relative contributions recorded a maximum for nanoparticles and another secondary one in the fine range with an intermediate quick decrease at both sites. The secondary maximum was present in Brindisi between 0.3 and 0.45 µm and in Venice in the range 0.4–0.7 µm, 2–3 times lower than the absolute maximum. Apart from a minimum reached in the range 1–1.5 µm, larger particles (in the coarse size range) increasingly contributed at all sites (likely because of harbour activities).
Looking at Table 2, a first aspect to be considered is that the contribution to PM10 was generally lower compared to those to PM2.5, despite the different methodologies used. This is due to the fine and ultrafine particles that dominate (in number) ship exhaust emissions, as a product of incomplete combustion process [105,106,107]. It should be noted that in some cases (Brindisi and Genoa), receptor models could lead to an overestimation because they are not able to discriminate between shipping and other heavy oil combustion sources with similar chemical profiles.
In Venice and Brindisi, comparable contributions were found by applying various receptor-modeling approaches. Furthermore, the application of the same methodology (indicated with HRM: high-resolution measurement) in Venice allowed to prove the effectiveness of voluntary agreements implemented in Venice since 2007. In fact, a decreasing trend of contribution to PM2.5 was confirmed by high-resolution measurements, the vanadium approach [18,46], and numerical simulations, ranging between 1% and 8%. Modeling contribution results were comparable in most of the investigated sites, varying from 2.3% to 6.7% for PM10 and between 2.6% and 11.8% for PM2.5.
The most commonly used receptor model was PMF, with a limited variability in results, from 10% in Genoa to 23% in Venice for PM2.5 and around 12% for PM10. Only Venice reported the lowest contributions both to PM2.5 (2.5%) and PM10 (3.3%). The general situation reflects a similar European picture, where shipping contributions to PM2.5 or PM10 emissions ranged between 0.2% and 14%; larger in the Mediterranean area compared to northern Europe [108]. In particular, in some harbour areas, namely Thessaloniki, Patras, Genoa, Barcelona, Gibraltar, and Tarragona, shipping impacts on PM2.5 using PMF indicated a contribution from 10% up to 14% [28].

6. Conclusions

The air quality of port cities could be negatively influenced by cruise/passenger or commercial ships traffic, especially during in-port operations (i.e., maneuvering, hoteling). The main emissions consist in gaseous pollutants and PM. Both source-oriented and receptor-based approaches have been applied to estimate shipping contributions to local air quality in coastal towns. This work revises current knowledge to provide an updated picture of the Italian harbours, exploring the scientific results about methodologies and estimates of shipping impact on local air quality in port cities.
Firstly, shipping emissions were reported from literature and national emission inventories. It should be said that, while yearly emissions from national navigation are computed and included in the Italian inventory for the main pollutants, international shipping emissions are estimated but not counted. The national inventory estimates showed comparable emissions of international and domestic navigation for NOX, SOX, CO, PM10, PM2.5, and BC, in the period 1900–2002, with a following increase for international shipping that exceeded national emissions. Contrarily, SOX national emissions significantly decreased (at least about 50%) since 2002, being directly subject to legislation limits regarding sulphur content in marine fuels.
Looking at cruise-ship traffic, the highest emissions in Italy were estimated in Venice, Civitavecchia, and Livorno, followed by Naples and Genoa. This was due to the highest traffic volume, except for SOx emissions, which had the overall lowest values in Venice. Considering all typology of ships, Venice is the most trafficked harbour, with important emissions of all pollutants, and a marked decreasing trend in SO2 emissions from 2007 to 2017. Comparable values of NOX emission are reported for Genoa. Other pollutants represented a small share, except for NOX emissions, which were the largest ones of all ports. Although there were comparable ship traffic volumes, in terms of number of ships, in Bari, Ravenna and Civitavecchia, emissions differed for PM10, SO2, CO, and NMVOCs, with comparable values only for NOX.
In general terms, contributions to gaseous pollutants from ships was significantly larger than contributions to PM pollutants. For this reason, shipping could play an important role in exceedances of NO2/NOx legislation thresholds. Estimated contributions to NOX by model simulations and methodologies based on observations in Bari and Brindisi were in good accordance, as well as comparable values for NOX (8.9–9%) and NO2 (5–9.1%) were estimated in Venice, Taranto, and Naples. SO2 contributions estimated with different models reflected a wide variability, ranging from 1% to 81%. However, its impact was significantly lower than those of NO and NO2 contributions, if in-harbour phases (i.e., berthing and hoteling) were evaluated, because of the required use of low-sulphur fuels.
The source apportionment results for PM ranged, for the different harbour sites, 10–23% for PM2.5 and around 12% for PM10, revealing the significant impact of logistics activities in some cases (i.e., Brindisi) and the indirect reduction effect on PNC by local mitigation initiatives (i.e., the Venice Blue Flag) in others. The Italian picture reflects the European one, where shipping contributions to PM2.5 or PM10 emissions ranged between 0.2% and 14% in the Mediterranean area. Shipping’s contribution to PNC was found to be 3–4 times larger than its contribution to mass concentrations (especially PM2.5), but lower than those to NOx, SO2, and CO emissions. This suggests that future policies should take into account also non-criteria pollutants to maximize the positive effect on air quality.
Current mitigation strategies (low-sulphur fuels, ECA) in Europe (and, consequently in Italy) have proved their efficiency, with decreases of SO2, PM primary emissions, and secondary sulfate. However, negligible effects on reduction of NOx, total metals in PM (except V), and PAHs were observed. We believe that further mitigation strategies should target both human health and climate in order to maximize benefits. Moving towards a “green” development of seaports, further benefits, at local scale, could be achieved, for example optimizing harbour-related activities at loading/unloading of ships or by cold ironing with electrical power from renewable sources.

Author Contributions

Conceptualization, D.C. (Daniele Contini), E.M., and A.G.; investigation and data curation, E.M., E.G., and M.C.; writing—original draft preparation, E.M.; writing—review and editing, E.M., D.C. (Daniela Cesari), and M.C. All authors have read and agreed to the published version of the manuscript.

Funding

This research received no external funding.

Conflicts of Interest

The authors declare no conflict of interest.

References

  1. Corbett, J.J.; Winebrake, J.J.; Green, E.H.; Kasibhatla, P.; Eyring, V.; Lauer, A. Mortality from ship emissions: A global assessment. Environ. Sci. Technol. 2007, 41, 8512–8518. [Google Scholar] [CrossRef]
  2. Eyring, V.; Stevenson, D.S.; Lauer, A.; Dentener, F.J.; Butler, T.; Collins, W.J.; Ellingsen, K.; Gauss, M.; Hauglustaine, D.A.; Isaksen, I.S.A.; et al. Multi-model simulations of the impact of international shipping on Atmospheric Chemistry and Climate in 2000 and 2030. Atmos. Chem. Phys. 2007, 7, 757–780. [Google Scholar] [CrossRef] [Green Version]
  3. Fridell, E. Emissions and fuel use in the shipping sector. In Green Ports; Bergqvist, R., Monios, J., Eds.; Elsevier: Amsterdam, The Netherlands, 2019; pp. 19–33, Chapter 2. [Google Scholar]
  4. Fridell, E.; Steen, E.; Peterson, K. Primary particles in ship emissions. Atmos. Environ. 2008, 42, 1160–1168. [Google Scholar] [CrossRef]
  5. Johansson, L.; Jalkanen, J.-P.; Kukkonen, J. Global assessment of shipping emissions in 2015 on a high spatial and temporal resolution. Atmos. Environ. 2017, 167, 403–415. [Google Scholar] [CrossRef]
  6. Lack, D.A.; Corbett, J.J. Black carbon from ships: A review of the effects of ship speed, fuel quality and exhaust gas scrubbing. Atmos. Chem. Phys. 2012, 12, 3985–4000. [Google Scholar] [CrossRef] [Green Version]
  7. Moldanová, J.; Fridell, E.; Winnes, H.; Holmin-Fridell, S.; Boman, J.; Jedynska, A.; Tishkova, V.; Demirdjian, B.; Joulie, S.; Bladt, H.; et al. Physical and chemical characterisation of PM emissions from two ships operating in European Emission Control Areas. Atmos. Meas. Tech. 2013, 6, 3577–3596. [Google Scholar] [CrossRef] [Green Version]
  8. Healy, R.M.; O’Connor, I.P.; Hellebust, S.; Allanic, A.; Sodeau, J.R.; Wenger, J.C. Characterisation of single particles from in-port ship emissions. Atmos. Environ. 2009, 43, 6408–6414. [Google Scholar] [CrossRef]
  9. Reche, C.; Viana, M.; Moreno, T.; Querol, X.; Alastuey, A.; Pey, J.; Pandolfi, M.; Prévôt, A.; Mohr, C.; Richard, A.; et al. Peculiarities in atmospheric particle number and size-resolved speciation in an urban area in the western Mediterranean: Results from the DAURE campaign. Atmos. Environ. 2011, 45, 5282–5293. [Google Scholar] [CrossRef]
  10. Saxe, H.; Larsen, T. Air pollution from ships in three Danish ports. Atmos. Environ. 2004, 38, 4057–4067. [Google Scholar] [CrossRef]
  11. Viana, M.; Amato, F.; Alastuey, A.; Querol, X.; Moreno, T.; Dos Santos, S.G.; Herc, M.D.; Fernández-Patier, R. Chemical tracers of particulate emissions from commercial shipping. Environ. Sci. Technol. 2009, 43, 7472–7477. [Google Scholar] [CrossRef]
  12. Transport & Environment, 2019. One Corporation to Pollute Them All: Luxury Cruise Emissions in Europe. Available online: https://www.transportenvironment.org/sites/te/files/publications/One%20Corporation%20to%20Pollute%20Them%20All_English.pdf (accessed on 15 January 2021).
  13. EEA, European Environment Agency, 2017. Emissions of Air Pollutants from Transport. Available online: https://www.eea.europa.eu/data-and-maps/indicators/transport-emissions-of-air-pollutants-8/transport-emissions-of-air-pollutants-8 (accessed on 14 February 2021).
  14. EMEP/EEA. Air Pollutant Emission Inventory Guidebook; Technical report No 13/2019; EEA: København, Denmark, 2019. [Google Scholar]
  15. Healy, R.M.; Hellebust, S.; Kourtchev, I.; Allanic, A.; O’Connor, I.P.; Bell, J.M.; Healy, D.A.; Sodeau, J.R.; Wenger, J.C. Source apportionment of PM2.5 in Cork Harbour, Ireland using a combination of single particle mass spectrometry and quantitative semi-continuous measurements. Atmos. Chem. Phys. 2010, 10, 9593–9613. [Google Scholar] [CrossRef] [Green Version]
  16. Gregoris, E.; Barbaro, E.; Morabito, E.; Toscano, G.; Donateo, A.; Cesari, D.; Contini, D.; Gambaro, A. Impact of maritime traffic on polycyclic aromatic hydrocarbons, metals and particulate matter in Venice air. Environ. Sci. Pollut. Res. 2016, 23, 6951–6959. [Google Scholar] [CrossRef] [Green Version]
  17. Mamoudou, I.; Zhang, F.; Chen, Q.; Wang, P.; Chen, Y. Characteristics of PM2.5 from ship emissions and their impacts on the ambient air: A case study in Yangshan Harbor, Shanghai. Sci. Total Environ. 2018, 640–641, 207–216. [Google Scholar] [CrossRef] [PubMed]
  18. Zhao, M.; Zhang, Y.; Ma, W.; Fu, Q.; Yang, X.; Li, C.; Zhou, B.; Yu, Q.; Chen, L. Characteristics and ship traffic source identification of air pollutants in China’s largest port. Atmos. Environ. 2013, 64, 277–286. [Google Scholar] [CrossRef]
  19. Feng, J.; Zhang, Y.; Li, S.; Mao, J.; Patton, A.P.; Zhou, Y.; Ma, W.; Liu, C.; Kan, H.; Huang, C.; et al. The influence of spatiality on shipping emissions, air quality and potential human exposure in the Yangtze River Delta/Shanghai, China. Atmos. Chem. Phys. 2019, 19, 6167–6183. [Google Scholar] [CrossRef] [Green Version]
  20. Xu, L.; Jiao, L.; Hong, Z.; Zhang, Y.; Du, W.; Wu, X.; Chen, Y.; Deng, J.; Hong, Y.; Chen, J. Source identification of PM2.5 at a port and an adjacent urban site in a coastal city of China: Impact of ship emissions and port activities. Sci. Total Environ. 2018, 634, 1205–1213. [Google Scholar] [CrossRef]
  21. Cesari, D.; Genga, A.; Ielpo, P.; Siciliano, M.; Mascolo, G.; Grasso, F.M.; Contini, D. Source apportionment of PM2.5 in the harbour - industrial area of Brindisi (Italy): Identification and estimation of the contribution of in-port ship emissions. Sci. Total Environ. 2014, 497–498, 392–400. [Google Scholar] [CrossRef]
  22. Koçak, M.; Theodosi, C.; Zarmpas, P.; Im, U.; Bougiatioti, A.; Yenigun, O.; Mihalopoulos, N. Particulate matter (PM10) in Istanbul: Origin, source areas and potential impact on surrounding regions. Atmos. Environ. 2011, 45, 6891–6900. [Google Scholar] [CrossRef]
  23. Pérez, N.; Pey, J.; Reche, C.; Cortés, J.; Alastuey, A.; Querol, X. Impact of harbour emissions on ambient PM10 and PM2.5 in Barcelona (Spain): Evidences of secondary aerosol formation within the urban area. Sci. Total Environ. 2016, 571, 237–250. [Google Scholar] [CrossRef] [PubMed]
  24. Diapouli, E.; Manousakas, M.; Vratolis, S.; Vasilatou, V.; Maggos, T.; Saraga, D.; Grigoratos, T.; Argyropoulos, G.; Voutsa, D.; Samara, C.; et al. Evolution of air pollution source contributions over one decade, derived by PM10 and PM2.5 source apportionment in two metropolitan urban areas in Greece. Atmos. Environ. 2017, 164, 416–430. [Google Scholar] [CrossRef]
  25. Scerri, M.M.; Kandler, K.; Weinbruch, S.; Yubero, E.; Galindo, N.; Prati, P.; Caponi, L.; Massabò, D. Estimation of the contributions of the sources driving PM2.5 levels in a Central Mediterranean coastal town. Chemosphere 2018, 211, 465–481. [Google Scholar] [CrossRef] [PubMed]
  26. Contini, D.; Gambaro, A.; Belosi, F.; De Pieri, S.; Cairns, W.R.L.; Donateo, A.; Zanotto, E.; Citron, M. The direct influence of ship traffic on atmospheric PM2.5, PM10 and PAH in Venice. J. Environ. Manag. 2011, 92, 2119–2129. [Google Scholar] [CrossRef]
  27. Bove, M.C.; Brotto, P.; Cassola, F.; Cuccia, E.; Massabò, D.; Mazzino, A.; Piazzalunga, A.; Prati, P. An integrated PM2.5 source apportionment study: Positive matrix factorization vs. the chemical transport model CAMx. Atmos. Environ. 2014, 94, 274–286. [Google Scholar] [CrossRef]
  28. Sorte, S.; Rodrigues, V.; Borrego, C.; Monteiro, A. Impact of harbour activities on local air quality: A review. Environ. Pollut. 2020, 257, 113542. [Google Scholar] [CrossRef]
  29. Viana, M.; Hammingh, P.; Colette, A.; Querol, X.; Degraeuwe, B.; de Vliegerd, I.; van Aardenne, J. Impact of maritime transport emissions on coastal air quality in Europe. Atmos. Environ. 2014, 90, 96–105. [Google Scholar] [CrossRef]
  30. Ledoux, F.; Roche, C.; Cazier, F.; Beaugard, C.; Courcot, D. Influence of ship emissions on NOx, SO2, O3 and PM concentrations in a North-Sea harbour in France. J. Environ. Sci. 2018, 71, 56–66. [Google Scholar] [CrossRef]
  31. Merico, E.; Donateo, A.; Gambaro, A.; Cesari, D.; Gregoris, E.; Barbaro, E.; Dinoi, A.; Giovanelli, G.; Masieri, S.; Contini, D. Influence of in-port ships emissions to gaseous atmospheric pollutants and to particulate matter of different sizes in a Mediterranean harbour in Italy. Atmos. Environ. 2016, 139, 1–10. [Google Scholar] [CrossRef]
  32. Merico, E.; Dinoi, A.; Contini, D. Development of an integrated modelling-measurement system for near-real-time estimates of harbour activity impact to atmospheric pollution in coastal cities. Transp. Res. Part D 2019, 73, 108–119. [Google Scholar] [CrossRef]
  33. Murena, F.; Mocerino, L.; Quaranta, F.; Toscano, D. Impact on air quality of cruise ship emissions in Naples, Italy. Atmos. Environ. 2018, 187, 70–83. [Google Scholar] [CrossRef]
  34. Liu, H.; Fu, M.; Jin, X.; Shang, Y.; Shindell, D.; He, K. Health and climate impacts of ocean-going vessels in East Asia. Nat. Clim. Chang. 2016, 6, 1037–1041. [Google Scholar] [CrossRef]
  35. Sofiev, M.; Winebrake, J.J.; Johansson, L.; Carr, E.W.; Prank, M.; Soares, J.; Vira, J.; Kouznetsov, R.; Jalkanen, J.-P.; Corbett, J.J. Cleaner fuels for ships provide public health benefits with climate tradeoffs. Nat. Commun. 2018, 9, 406. [Google Scholar] [CrossRef] [Green Version]
  36. Contini, D.; Gambaro, A.; Donateo, A.; Cescon, P.; Cesari, D.; Merico, E.; Belosi, F.; Citron, M. Inter annual trend of the primary contribution of ship emissions to PM2.5 concentrations in Venice (Italy): Efficiency of emissions mitigation strategies. Atmos. Environ. 2015, 102, 183–190. [Google Scholar] [CrossRef]
  37. Liu, H.; Jin, X.; Wu, L.; Wang, X.; Fu, M.; Lv, Z.; Morawska, L.; Huang, F.; He, K. The impact of marine shipping and its DECA control on air quality in the Pearl River Delta, China. Sci. Total Environ. 2018, 625, 1476–1485. [Google Scholar] [CrossRef] [PubMed]
  38. Tao, L.; Fairley, D.; Kleeman, M.J.; Harley, R.A. Effects of switching to lower sulphur marine fuel oil on air quality in the San Francisco Bay area. Environ. Sci. Technol. 2013, 47, 10171–10178. [Google Scholar] [CrossRef] [PubMed]
  39. ESPO, European Sea Ports Organisation. ESPO’s Roadmap to implement the European Green Deal objectives in ports. Position paper, February 2020. Available online: https://www.espo.be/media/ESPO%20Green%20Deal%20position%20paper%20Green%20Deal-FINAL_1.pdf (accessed on 31 January 2021).
  40. Rouïl, L.; Ratsivalaka, C.; André, J.-M.; Allemand, N. ECAMED: A Technical Feasibility Study for the Implementation of an Emission Control Area (ECA) in the Mediterranean Sea. In Synthesis Report; Ineris, French National Institute for Industrial Environment and Risks, with Contributions from Cerema, Citepa and Plan Bleu: Paris, France, 2019. [Google Scholar]
  41. Transport & Environment. 2019. Emission Reduction Strategies for the Transport Sector in Italy. Available online: https://www.transportenvironment.org/publications/emissions-reduction-strategiestransport-sector-italy (accessed on 29 January 2021).
  42. SRM & Assoporti. Port Indicators 2018. Available online: https://www.srm-maritimeconomy.com/wp-content/uploads/2018/06/port-indicators-12018-web.pdf (accessed on 24 January 2021).
  43. National Strategic Plan for Ports and Logistics (PSNPL). Italian Ministry of Infrastructures and Transport: Roma, Italy, Approved on 6th August 2015, in accordance with Law No. 164/2014 “Sblocca Italia”. Available online: http://www.ramspa.it/en/national-strategic-plan-ports-and-logistics (accessed on 22 April 2021).
  44. Eurostat. Coastal Regions, by Sea Basins and NUT3 Regions. Available online: https://ec.europa.eu/eurostat/statistics-explained/index.php/Archive:Coastal_region_statistics#EU_coastal_regions_and_their_maritime_basinsEUROSTAT (accessed on 15 February 2021).
  45. Sorte, S.; Rodrigues, V.; Lourenco, R.; Borrego, C.; Monteiro, A. Emission inventory for harbour-related activities: Comparison of two distinct bottom-up methodologies. Air Qual Atmos. Health 2021. [Google Scholar] [CrossRef]
  46. Agrawal, H.; Eden, R.; Zhang, X.; Fine, P.M.; Katzenstein, A.; Miller, J.W.; Ospital, J.; Teffera, S.; Cocker, D.R. Primary particulate matter from ocean-going engine in the southern California air basin. Environ. Sci. Technol. 2009, 43, 5398–5402. [Google Scholar] [CrossRef]
  47. Mazzei, F.; D’Alessandro, A.; Lucarelli, F.; Nava, S.; Prati, P.; Valli, G.; Vecchi, R. Characterization of particulate matter sources in an urban environment. Sci. Total Environ. 2008, 401, 81–90. [Google Scholar] [CrossRef] [PubMed]
  48. Pandolfi, M.; Gonzalez-Castanedo, Y.; Alastuey, A.; de la Rosa, J.D.; Mantilla, E.; de la Campa, S.; Querol, X.; Pey, J.; Amato, F.; Moreno, T. Source apportionment of PM10 and PM2.5 at multiple sites in the strait of Gibraltar by PMF: Impact of shipping emissions. Environ. Sci. Pollut. Res. Int. 2011, 18, 260–269. [Google Scholar] [CrossRef] [PubMed]
  49. Moreno, T.; Pèrez, N.; Querol, X.; Amato, F.; Alastuey, A.; Bhatia, R.; Spiro, B.; Hanvey, M.; Gibbons, W. Physicochemical variations in atmospheric aerosols recorded at sea on board the Atlantic Mediterranean 2008 scholarship cruise (Part II): Natural versus anthropogenic influences revealed by PM10 trace element geochemistry. Atmos. Environ. 2010, 44, 2563–2576. [Google Scholar] [CrossRef]
  50. Becagli, S.; Sferlazzo, D.M.; Pace, G.; Sarra, A.d.; Bommarito, C.; Calzolai, G.; Ghedini, C.; Lucarelli, F.; Meloni, D.; Monteleone, F.; et al. Evidence for ships emissions in the Central Mediterranean Sea from aerosol chemical analyses at the island of Lampedusa. Atmos. Chem. Phys. Discuss. 2012, 11, 29915–29947. [Google Scholar]
  51. Liu, Z.; Lu, X.; Feng, J.; Fan, Q.; Zhang, Y.; Yang, X. Influence of ship emissions on urban air quality: A comprehensive study using highly time-resolved online measurements and numerical simulation in Shanghai. Environ. Sci. Technol. 2016, 51, 202–211. [Google Scholar] [CrossRef]
  52. Zhang, X.; Zhang, Y.; Liu, Y.; Zhao, J.; Zhou, Y.; Wang, X.; Yang, X.; Zou, Z.; Zhang, C.; Fu, Q.; et al. Changes in the SO2 Level and PM2.5 Components in Shanghai Driven by Implementing the Ship Emission Control Policy. Environ. Sci. Technol. 2019, 53, 11580–11587. [Google Scholar] [CrossRef]
  53. Donateo, A.; Gregoris, E.; Gambaro, A.; Merico, E.; Giua, R.; Nocioni, A.; Contini, D. Contribution of harbour activities and ship traffic to PM2.5, particle number concentrations and PAHs in a port city of the Mediterranean Sea (Italy). Environ. Sci. Pollut. Res. 2014, 21, 9415–9429. [Google Scholar] [CrossRef] [PubMed]
  54. Sorte, S.; Arunachalam, S.; Naess, B.; Seppanen, C.; Rodrigues, V.; Valencia, A.; Borrego, C.; Monteiro, A. Assessment of source contribution to air quality in an urban area close to a harbor: Case-study in Porto, Portugal. Sci. Total Environ. 2019, 662, 347–360. [Google Scholar] [CrossRef] [PubMed]
  55. Merico, E.; Conte, M.; Grasso, F.M.; Cesari, D.; Gambaro, A.; Morabito, E.; Gregoris, E.; Orlando, S.; Alebić-Juretić, A.; Zubak, V.; et al. Comparison of the impact of ships to size-segregated particle concentrations in two harbour cities of northern Adriatic Sea. Environ. Poll. 2020, 266, 115175. [Google Scholar] [CrossRef] [PubMed]
  56. Viana, M.; Rizza, V.; Tobías, A.; Carr, E.; Corbett, J.; Sofiev, M.; Karanasiou, A.; Buonanno, G.; Fann, N. Estimated health impacts from maritime transport in the Mediterranean region and benefits from the use of cleaner fuels. Environ. Int. 2020, 138, 105670. [Google Scholar] [CrossRef] [PubMed]
  57. Tzannatos, E. Ship emissions and their externalities for the port of Piraeus e Greece. Atmos. Environ. 2010, 44, 400–407. [Google Scholar] [CrossRef]
  58. ISPRA, Istituto Superiore per la Protezione e la Ricerca Ambientale. Italian Emission Inventory 1990–2016; Informative Inventory Report 284/2018; ISPRA: Rome, Italy, 2018; ISBN 978-88-448-0891-4. [Google Scholar]
  59. Ng, S.K.W.; Loh, C.; Lin, C.; Booth, V.; Chan, J.W.M.; Yip, A.C.K.; Li, Y.; Lau, A.K.H. Policy change driven by an AIS-assisted marine emission inventory in Hong Kong and the Pearl River Delta. Atmos. Environ. 2013, 76, 102–112. [Google Scholar] [CrossRef]
  60. Jalkanen, J.-P.; Johansson, L.; Kukkonen, J.; Brink, A.; Kalli, J.; Stipa, T. Extension of an assessment model of ship traffic exhaust emissions for particulate matter and carbon monoxide. Atmos. Chem. Phys. 2012, 12, 2641–2659. [Google Scholar] [CrossRef] [Green Version]
  61. Miola, A.; Co, B. Estimating air emissions from ships: Meta-analysis of modelling approaches and available data sources. Atmos. Environ. 2011, 45, 2242–2251. [Google Scholar] [CrossRef]
  62. Maragkogianni, A.; Papaefthimiou, S.; Zopounidis, C. Mitigating Shipping Emissions in European Ports; Springer: Cham, Switzerland, 2016; pp. 1–9. [Google Scholar] [CrossRef]
  63. Eyring, V.; Isaksen, I.; Berntsen, T.; Collins, W.; Corbett, J.J.; Endresen, O.; Graingerg, R.G.; Moldanova, J.; Schlager, H.; Stevenson, D.S. Transport impacts on atmosphere and climate: Shipping. Atmos. Environ. 2009, 44, 4735–4771. [Google Scholar] [CrossRef]
  64. Alver, F.; Saraç, B.A.; Sahin, Ü.A. Estimating of shipping emissions in the Samsun port from 2010 to 2015. Atmos. Pollut. Res. 2018, 9, 822–828. [Google Scholar] [CrossRef]
  65. Chen, D.; Wang, X.; Nelson, P.; Li, Y.; Zhao, N.; Zhao, Y.; Lang, J.; Zhou, J.; Guo, X. Ship emission inventory and its impact on the PM2.5 air pollution in Qingdao Port, North China. Atmos. Environ. 2017, 166, 351–361. [Google Scholar] [CrossRef]
  66. Nunes, R.A.O.; Alvim-Ferraz, M.C.M.; Martins, F.G.; Sousa, S.I.V. The activity based methodology to assess ship emissions e a review. Environ. Pollut. 2017, 231, 87–103. [Google Scholar] [CrossRef]
  67. Tichavska, M.; Tovar, B.; Gritsenko, D.; Johansson, L.; Jalkanen, J.-P. Air emissions from ships in port: Does regulation make a difference? Transp. Policy 2019, 75, 128–140. [Google Scholar] [CrossRef]
  68. Chen, D.; Zhao, Y.H.; Nelson, P.; Li, Y.; Wang, X.T.; Zhou, Y.; Lang, J.; Guo, X. Estimating ship emissions based on AIS data for port of Tianjin, China. Atmos. Environ. 2016, 145, 10–18. [Google Scholar] [CrossRef]
  69. Papaefthimiou, S.; Maragkogianni, A.; Andriosopoulos, K. Evaluation of cruise ships emissions in the Mediterranean basin: The case of Greek ports. Int. J. Sustain. Transp. 2016, 10, 8318. [Google Scholar] [CrossRef]
  70. CAIMANs project. Cruise and Passenger Ship Air Quality Impact Mitigation Actions. Final report, June 2015. Available online: http://www.medmaritimeprojects.eu/section/caimans (accessed on 20 December 2020).
  71. Tichavska, M.; Tovar, B. Port-city exhaust emission model: An application to cruise and ferry operations in Las Palmas port. Transp. Res. A Policy Pract. 2015, 78, 347–360. [Google Scholar] [CrossRef]
  72. Song, S. Ship emissions inventory, social cost and eco-efficiency in Shanghai Yangshan port. Atmos. Environ. 2014, 82, 288–297. [Google Scholar] [CrossRef]
  73. APICE project. Common Mediterranean Strategy and Local Practical Actions for the Mitigation of Port, Industries and Cities Emissions. Final Report 2013. Available online: http://www.apice-project.eu (accessed on 15 January 2021).
  74. Yau, P.S.; Lee, S.C.; Corbett, J.J.; Wang, C.; Cheng, Y.; Ho, K.F. Estimation of exhaust emission from ocean-going vessels in Hong Kong. Sci. Total Environ. 2012, 431, 299–306. [Google Scholar] [CrossRef]
  75. Kilic, A.; Deniz, C. Inventory of shipping emissions in Izmit Gulf, Turkey. Environ. Prog. Sustain. Energy 2010, 29, 221–232. [Google Scholar] [CrossRef]
  76. Deniz, C.; Kılıç, A. Estimation and assessment of shipping emissions in the region of Ambarli port. Environ. Prog. Sustain. Energy 2009, 29, 107–115. [Google Scholar] [CrossRef]
  77. ENTEC. Quantification of Emissions from Ships Associated with Ship Movements between Ports in the European Community; Final report for the European Commission; Entec UK Limited: Northwich, UK, 2002. [Google Scholar]
  78. Jalkanen, J.-P.; Brink, A.; Kalli, J.; Pettersson, H.; Kukkonen, J.; Stipa, T. A modelling system for the exhaust emissions of marine traffic and its application in the Baltic Sea area. Atmos. Chem. Phys. Discuss. 2009, 9, 15339–15373. [Google Scholar]
  79. Jalkanen, J.P.; Johansson, L.; Kukkonen, J. A comprehensive inventory of the ship traffic exhaust emissions in the Baltic Sea from 2006 to 2009. Ambio 2014, 43, 311–324. [Google Scholar] [CrossRef] [Green Version]
  80. Moreno-Gutierrez, J.; Calderay, F.; Saborido, N.; Boile, M.; Valero, R.R.; Durán-Grados, V. Methodologies for estimating shipping emissions and energy consumption: A comparative analysis of current methods. Energy 2015, 86, 603–616. [Google Scholar] [CrossRef]
  81. Toscano, D. and Murena, F. Atmospheric ship emissions in ports: A review. Correlation with data of ship traffic. Atmos. Environ. 2019, 4, 100050. [Google Scholar]
  82. De Melo Rodríguez, G.; Martin-Alcalde, E.; Murcia-Gonzalez, J.C.; Saurí, S. Evaluating air emission inventories and indicators from cruise vessels at ports. WMU. J. Marit. Aff. 2017, 16, 405–420. [Google Scholar] [CrossRef] [Green Version]
  83. Nunes, R.A.O.; Alvim-Ferraz, M.C.M.; Martins, F.G.; Sousa, S.I.V. Assessment of shipping emissions on four ports of Portugal. Environ. Pollut. 2017, 231, 1370–1379. [Google Scholar] [CrossRef]
  84. Monteiro, A.; Russo, M.; Gama, C.; Borrego, C. How important are maritime emissions for the air quality: At European and national scale. Environ. Pollut. 2018, 242, 565–575. [Google Scholar] [CrossRef] [PubMed]
  85. Fileni, L.; Mancinelli, E.; Morichetti, M.; Passerini, G.; Rizza, U.; Virgili, S. Air pollution in Ancona harbour, Italy. WIT Trans. Built Environ. 2019, 187, 199–208. [Google Scholar]
  86. Iodice, P.; Langella, G.; Amoresano, A. A numerical approach to assess air pollution by ship engines in manoeuvring mode and fuel switch conditions. Energy Environ. 2017, 28, 827–845. [Google Scholar] [CrossRef]
  87. Karl, M.; Jonson, J.E.; Uppstu, A.; Aulinger, A.; Prank, M.; Sofiev, M.; Jalkanen, J.-P.; Johansson, L.; Quante, M.; Matthias, V. Effects of ship emissions on air quality in the Baltic Sea region simulated with three different chemistry transport models. Atmos. Chem. Phys. 2019, 19, 7019–7053. [Google Scholar] [CrossRef] [Green Version]
  88. Gong, W.; Beagley, S.R.; Cousineau, S.; Sassi, M.; Munoz-Alpizar, R.; Ménard, S.; Racine, J.; Zhang, J.; Chen, J.; Morrison, H.; et al. Assessing the impact of shipping emissions on air pollution in the Canadian Arctic and northern regions: Current and future modelled scenarios. Atmos. Chem. Phys. 2018, 18, 16653–16687. [Google Scholar] [CrossRef] [Green Version]
  89. EEA, European Environmental Agency. The Impact of International Shipping on European Air Quality and Climate Forcing; EEA Technical Report 04/2013; Publications Office of the European Union: Luxembourg, 2013; ISBN 978-92-9213-357-3. [Google Scholar]
  90. Merico, E.; Gambaro, A.; Argiriou, A.; Alebic-Juretic, A.; Barbaro, E.; Cesari, D.; Chasapidis, L.; Dimopoulos, S.; Dinoi, A.; Donateo, A.; et al. Atmospheric impact of ship traffic in four Adriatic-Ionian port-cities: Comparison and harmonization of different approaches. Transp. Res. Part D Transp. Environ. 2017, 50, 431–445. [Google Scholar] [CrossRef]
  91. ISPRA, Istituto Superiore per la Protezione e la Ricerca Ambientale. Serie storiche delle emissioni nazionali di inquinanti atmosferici, Rete del Sistema Informativo Nazionale Ambientale-SINANET. Available online: http://www.sinanet.isprambiente.it/it/sinanet/serie_storiche_emissioni (accessed on 1 February 2021).
  92. IPCC, Intergovernmental Panel on Climate Change. Good Practice Guidance and Uncertainty Management in National Greenhouse Gas Inventories; IPCC National Greenhouse Gas Inventories Programme, Technical Support Unit: Hayama, Kanagawa, Japan, 2000. [Google Scholar]
  93. IPCC, Intergovernmental Panel on Climate Change. Revised 1996 IPCC Guidelines for National Greenhouse Gas Emission Inventories. Three volumes: Reference Manual, Reporting Manual, Reporting Guidelines and Workbook; IPCC/OECD/IEA. IPCC WG1 Technical Support Unit, Hadley Centre, Meteorological Centre, Meteorological Office: Bracknell, UK, 1997. [Google Scholar]
  94. TECHNE. Stima delle Emissioni in Atmosfera nel Settore del Trasporto Aereo e Marittimo; Final report; TECHNE Consulting: Rome, Italy, 2009. [Google Scholar]
  95. ECC, European Cruise Council. Making a Real Social and Economic Contribution to Europe’s Economy; 2011/2012 Report; Ashcroft & Associates Ltd: PO Box 57940, London, UK.
  96. ARPAV, Agenzia Regionale per la Prevenzione e la Protezione Ambientale della Regione Veneto. Emissioni da Attività Portuali; Relazione tecnica ARPAV Febbraio; Dipartimento Provinciale di Venezia: Venezia, Mestre, Italy, 2007. [Google Scholar]
  97. Carletti, S.; Latini, G.; Passerini, G. Air pollution and port operations: A case study and strategies to clean up. WIT Trans. Ecol. Environ. 2012, 155, 391–403. [Google Scholar]
  98. Gobbi, G.P.; Di Liberto, L.; Barnaba, F. Impact of port emissions on EU-regulated and non-regulated air quality indicators: The case of Civitavecchia (Italy). Sci. Tot. Environ. 2020, 719, 134984. [Google Scholar] [CrossRef]
  99. Mocerino, L.; Murena, F.; Quaranta, F.; Toscano, D. A methodology for the design of an effective air quality monitoring network in port areas. Sci. Rep. 2020, 10, 300. [Google Scholar] [CrossRef] [PubMed] [Green Version]
  100. Gariazzo, C.; Papaleo, V.; Pelliccioni, A.; Calori, G.; Radice, P.; Tinarelli, G. Application of a Lagrangian particle model to assess the impact of harbour, industrial and urban activities on air quality in the Taranto area, Italy. Atmos. Environ. 2007, 41, 6432–6444. [Google Scholar] [CrossRef]
  101. ISPRA, Istituto Superiore per la Protezione e la Ricerca Ambientale. Focus su porti, aeroporti e interporti. Qualità dell’ambiente urbano; VIII Rapporto 34/2012; ISPRA: Rome, Italy, 2012; ISBN 978-88-448-0562-3. [Google Scholar]
  102. Schembari, C.; Cavalli, F.; Cuccia, E.; Hjorth, J.; Calzolai, G.; Pérez, N.; Pey, J.; Prati, P.; Raes, F. Impact of a European directive on ship emissions on air quality in Mediterranean harbours. Atmos. Environ. 2012, 61, 661–669. [Google Scholar] [CrossRef]
  103. Romagnoli, P.; Vichi, F.; Balducci, C.; Imperiali, A.; Perilli, M.; Paciucci, L.; Petracchini, F.; Cecinato, A. Air quality study in the coastal city of Crotone (Southern Italy) hosting a small-size harbor. Environ. Sci. Pollut. Res. 2017, 24, 25260–25275. [Google Scholar] [CrossRef]
  104. Aksoyoglu, S.; Prévôt, A.S.H.; Baltensperger, U. Contribution of ship emissions to the concentration and deposition of air pollutants in Europe. Atmos. Chem. Phys. 2016, 156, 1895–1906. [Google Scholar] [CrossRef] [Green Version]
  105. Gregoris, E.; Morabito, E.; Barbaro, E.; Feltracco, M.; Toscano, G.; Merico, E.; Grasso, F.M.; Cesari, D.; Conte, M.; Contini, D.; et al. Chemical characterization and source apportionment of size-segregated aerosol in the port-city of Venice (Italy). Atmos. Poll. Res. 2021, 12, 261–271. [Google Scholar] [CrossRef]
  106. Bove, M.C.; Brotto, P.; Calzolai, G.; Cassola, F.; Cavalli, F.; Fermo, P.; Hjorth, J.; Massabò, D.; Nava, S.; Piazzalunga, A.; et al. PM10 source apportionment applying PMF and chemical tracer analysis to ship-borne measurements in the Western Mediterranean. Atmos. Environ. 2016, 125, 140–151. [Google Scholar] [CrossRef]
  107. Diesch, J.M.; Drewnick, F.; Klimach, T.; Borrmann, S. Investigation of gaseous and particular emissions from various marine vessel types measured on the banks of the Elbe in Northern Germany. Atmos. Chem. Phys. 2013, 13, 3603–3618. [Google Scholar] [CrossRef] [Green Version]
  108. Contini, D.; Merico, E. Recent advances in studying air quality and health effects of shipping emissions. Atmosphere 2021, 12, 92. [Google Scholar] [CrossRef]
  109. Ariola, V.; Bernardoni, V.; Calzolai, G.; Chiari, M.; Cuccia, E.; Lucarelli, F.; Mazzei, F.; Nava, S.; Prati, P.; Valli, G.; et al. Nuclear techniques and the particulate matter pollution in big harbours. Il Nuovo Cimento C 2008, 31, 527–536. [Google Scholar]
Figure 1. Yearly SOX emissions from cruise ships and cars in some harbour cities in Europe in 2017. Adapted data from [12].
Atmosphere 12 00536 g001
Figure 2. Merchant and passenger traffic volumes for the 15 Italian port authorities.
Atmosphere 12 00536 g002
Figure 3. Gaseous emissions of national and international shipping, reported in the Italian emission inventory in the 28-year period 1990–2018. Data from ISPRA elaborations [91].
Atmosphere 12 00536 g003aAtmosphere 12 00536 g003b
Figure 4. PM and BC emissions of national and international shipping, reported in the Italian emission inventory in the 28-year period 1990–2018. Data from ISPRA elaborations [91].
Atmosphere 12 00536 g004
Figure 5. Cruise emissions in the main harbours in Italy. Number of ships is also reported for each site. Adapted data from [12].
Atmosphere 12 00536 g005
Figure 6. Total annual emissions in some Italian harbours. Number of ships (if available) and base year of emissions are also reported for each site [32,73,85,90,96,97,98].
Atmosphere 12 00536 g006
Table 1. Shipping contributions to the main gaseous pollutants in some Italian harbours, estimated by different receptor-modeling different approaches.
Harbour SiteGasContribution (%)ModelelYearearReference
BrindisiNO220HRM2014[31]
NO35
SO247
NO232.5WRF-CAMX2012[90]
NO23.1
NOX31.7
SO246.3
NaplesNO25CALPUFF2016[33]
SO21
TarantoNOX9SPRAY2004[100]
SO29
VeniceNO29.1WRF-CAMX2012[90]
NO5.0
NOX8.9
SO216.5
BariSO221–81ADMS2018[32]
NOX16–40
CO1–4
TriesteNOX20FARM2005[101]
Table 2. Shipping primary contributions to PM and PNC, estimated by different receptor-modeling methodologies in some Italian harbours. V: vanadium approach; HRM: high-resolution measurements.
Harbour SitePM/PNCContribution (%)ModelYearReference
BrindisiPM2.515.3 ± 1.3 aPMF2012[21]
PM2.57.4 ± 0.5HRM2012[90]
PNC26 ± 1
PM105.8 ± 0.4HRM *
PM2.54.7WRF-CAMX
PM103.7
PM2.57.8 ± 0.2HRM2014[31]
PNC23 ± 1
GenoaPM2.511 ± 2 aPMF2011[27]
PM2.54 fw-15 s (2 sites)CAMX-PSAT2011[73]
PM2.510–15 sPMF
PM1012PMF2002–2008[109]
PM2.525
West Mediterranean (cruise campaigns)PM1012 ± 4PMF2011[106]
LampedusaPM103.9V2004–2008[50]
PM2.58
VenicePM10, PM2.51–8 ± 1HRM2007[26]
PM102.5PMF2007–2013[16]
PM2.53.3
PM2.53.0 ± 1.0V *2012[90]
PM102.3 ± 0.9V2012
PM2.53.5 ± 1.0HRM2012
PM102.7 ± 0.8HRM *2012
PNC6 ± 1HRM2012
PM2.52.6WRF-CAMX2012
PM102.3
PM2.51.8 ± 0.7HRM2018[55]
PNC7.4 ± 0.3
PM2.54.5 fw-10 s (2 sites)CAMX-PSAT2011[73]
PM1013 fw-23 sPMF
TriestePM1025 bFARM2005[101]
BariPM103.5–6.7ADMS2018[32]
PM2.55.1–11.8
a heavy oil combustion; b secondary PM (nitrates and sulphates); fw fall–winter period; s summer period; included; * indirect calculation obtained considering the same absolute contribution of shipping to PM2.5 and PM10 and a ratio PM2.5/PM10 concentrations equal to 0.78.
Publisher’s Note: MDPI stays neutral with regard to jurisdictional claims in published maps and institutional affiliations.

