
Seasonal Variability of Trends in Regional Hot and Warm Temperature Extremes in Europe


1
Department of Ecology, Climatology and Air Protection, University of Agriculture in Kraków, Al. Mickiewicza 24/28, 30-059 Kraków, Poland
2
Department of Climatology, Jagiellonian University, 7 Gronostajowa St, 30-387 Kraków, Poland
3
Institute of Meteorology and Water Management, National Research Institute, 61 Podleśna St, 01-673 Warszawa, Poland
*
Author to whom correspondence should be addressed.
Atmosphere 2021, 12(5), 612; https://0-doi-org.brum.beds.ac.uk/10.3390/atmos12050612
Submission received: 18 April 2021
/
Revised: 1 May 2021
/
Accepted: 5 May 2021
/
Published: 8 May 2021
(This article belongs to the Special Issue Temperature Extremes and Atmospheric Circulation)
Abstract
:Extremely hot or warm weather over the course of the year may have significant impacts on many aspects of human life, the economy, and the natural environment. Until now a thorough assessment of changes of extreme heat or warm events in Europe was hindered by the number of metrics employed, time periods examined, and most studies being conducted in the summer season only. Here, we employ the Extremity Index (EI) to investigate long-term trends in extremely hot or warm days in Europe over the course of the year, with a special focus on their frequency, spatial extent, and intensity. An extreme temperature event (ETE) is defined as a day with an unusually high temperature for a given location and season, even if such a temperature would not be considered extremely high in an absolute sense. The research is conducted in five spatial domains that together cover a large portion of Europe. The period of the most recent 70 years is considered. In all examined regions, mainly significant increasing trends since 1950 are evident for seasonal EI; therefore, also for ETE frequency, intensity, and spatial range. Yet, every region is characterized by its own event pattern, and trends across the continent strongly vary geographically and seasonally. Our study highlights that examined trends of temperature extremes are accelerating and in the last 40 years the rate of change has been even more than three times greater than in the entire study period. The greatest changes were noted for the summer season in Central Europe and Eastern Europe for the most recent 40-year period.
1. Introduction
The global increase in near-surface air temperatures noted since the late 19th century translates into increases in the frequency, intensity, and duration of extreme hot and warm events [1,2,3]. Of these the best analyzed are summertime hot days and heatwaves that have been explored in a number of studies done at a variety of spatial scales from global to regional, domestic, and local [4]. This strong interest is the outcome of harsh heatwaves occurring across the world in the last 20 to 30 years and accompanied by a high rise in morbidity and mortality [5]. Indeed, heat events currently represent some of the most dangerous weather phenomena in the world and threaten not only human health [6,7], but also agriculture [8,9], public infrastructure [10,11], supply of electricity [12], and workplace productivity [13]. The increase in the number of hot days and heatwaves leads to ecological impacts in the form of exacerbated droughts and wildfires [14] as well as increased wildlife mortality [15] that reduce the general level of security in the world and induce economic losses.
Major heat events can be dangerous; however, warm weather in general has the potential to produce significant impacts on many aspects of human life, the economy, and the natural environment regardless of the season in which it occurs. Some of these impacts are time-lagged and some represent the effects of multiple environmental linkages, and may become dangerous when combined with the presence of a water deficit in a given geographic area.
In winter the most apparent effect of warm spells in temperate climates is the reduction in the snowpack leading to the exposure of the soil to more frequent freezing events, changes in water runoff patterns, and reduced water storage that may then lead to a spring drought [16,17,18]. The shortening of the snow season leads to shorter ski seasons in many parts of the world [19]. Warm weather in spring may disrupt the water balance in summer. According to Bastos et al. [20] unusually warm spring weather in Europe in 2018 triggered an increase in vegetation growth which contributed to faster soil moisture depletion and in consequence a stronger summer drought. Westerling [21] also observed a relationship between spring warming and earlier snowmelt and increased wildfire activity in the western USA.
Late winter and early spring warm spells accelerate plant growth and consequently affect the timing of the onset of phenological seasons [22,23,24,25,26]. On the other hand, premature vegetation growth increases the vulnerability of plants to late spring frost spells [23,27,28]. Interestingly, research by Siegmund et al. [25] shows that phenological processes in spring are also affected by warm extremes in the preceding autumn. On the other hand, autumn phenology, including leaf senescence and fall that impact a number of ecosystem processes, is affected by heat and warm extremes occurring throughout the entire vegetation season [29]. The influence of year-round temperature extremes is also observed on the development, survival rate, population dynamics, and migration timing of animals, although these relationships are not yet well-understood due to their complexity [30,31,32,33,34]. This group includes insects, pests, and pathogens for whom warm autumns and winters help facilitate their survival and enable the colonization of new geographic areas, which may in turn negatively affect crop production and food security [35,36,37]. However, it is important to note that all of the above effects largely depend on the plant or animal species, phenological phase, and timing of extreme events [22,31,32].
Human health is also affected. One of the effects of a warmer spring and summer is the earlier arrival of severe heatwaves such as those in 2017 and 2019 in Europe [38,39]. Founda et al. [40] notes that the hot extremes season in the Eastern Mediterranean region is becoming longer by 3 to 10 days per decade since the mid-1970 s and is usually characterized by an earlier onset. There are suggestions that early-season heat events are in fact more hazardous to human health than those occurring later in the season due to lack of acclimatization [6,41]. Warm spells in the autumn and winter also contribute to extended activity of ticks and mosquitoes that represent potential vectors of a number of diseases including Lyme borreliosis disease [32,42].
In line with global mean temperature patterns, Europe is warming, although the direction and strength of this trend strongly vary geographically and over the course of the year [43]. European research on air temperature extremes follows a pattern of focusing largely on summertime events. Lorenz et al. [44] studied occurrence patterns for extremely hot days at about 1000 sites across Europe, and found that the number of such days at least tripled over the period 1950–2018. They found this trend to be particularly strong in the last 20 years. Hot days became even hotter, especially in Central Europe. Negative temperature trends were noted at only 6% of the study sites, and these were located mostly in Northern Europe [44]. Morabito et al. [45] identified similar spatial and temporal patterns examining summertime heatwave hazards in 28 European capitals for the period 1980–2015. Their results were consistent with local and regional results obtained by other authors. Increases in the frequency, intensity, and duration of summertime heat extremes are well-documented—especially for Central Europe [46,47,48,49,50] and Southeastern Europe [51,52,53,54,55,56,57]. Positive trends were also detected in the United Kingdom [58,59], in the Mediterranean region and in Southern Europe [60,61]. On the other hand, small increases, and even decreases, in summer heat indices were noted for Northern Europe [62,63].
Warm extremes in the winter are less often examined in the literature than hot extremes in the summer, while warm extremes in both spring and autumn have not been analyzed to any meaningful extent. Sui et al. [64] found statistically significant increases for extremely warm days in wintertime in Northern Europe for the period 1979–2016. Kivinen et al. [63] obtained similar results for the Northern Fennoscandia for the period 1914–2013, and determined the occurrence of a much higher number of extremely warm days in April and October over the last 20 years of the study period. Chapman et al. [65] examined the Central England Temperature Record and found a two- to threefold increase in the frequency and duration of winter warm spells since the late 1800 s. Significant increasing trends in the number of warm winter days were also noted for Central Europe [66] as well as for high mountain sites in the Swiss Alps [67]. Research results for Southeastern Europe vary. In Romania as well as Bosnia and Herzegovina significant increases were detected for all seasons of the year, except for autumn [56,57], but a decreasing number of winter warm days was identified for Greece [60].
As noted above, research studies on trends of extreme heat and warm events in Europe focus mostly on individual regions or countries, and analyze time periods of different length. Yet the key issue is that they use different methodologies and tend to examine extreme temperature events for merely a single season of the year—in most cases the summer. The lack of opportunity to compare data from different studies and the low number of studies focused on transitional seasons of the year produce an incomplete picture of variances in extreme temperature trends in Europe. The present study is designed to help fill this void. The purpose of the study was to examine long-term trends in the number of extremely hot or warm days in Europe over the course of the entire year in the period from spring 1950 to winter 2019/2020, with a special focus on their spatial extent and intensity as well as the use of a single research method in order to enable the comparability of results.
2. Materials and Methods
2.1. Data and Study Area
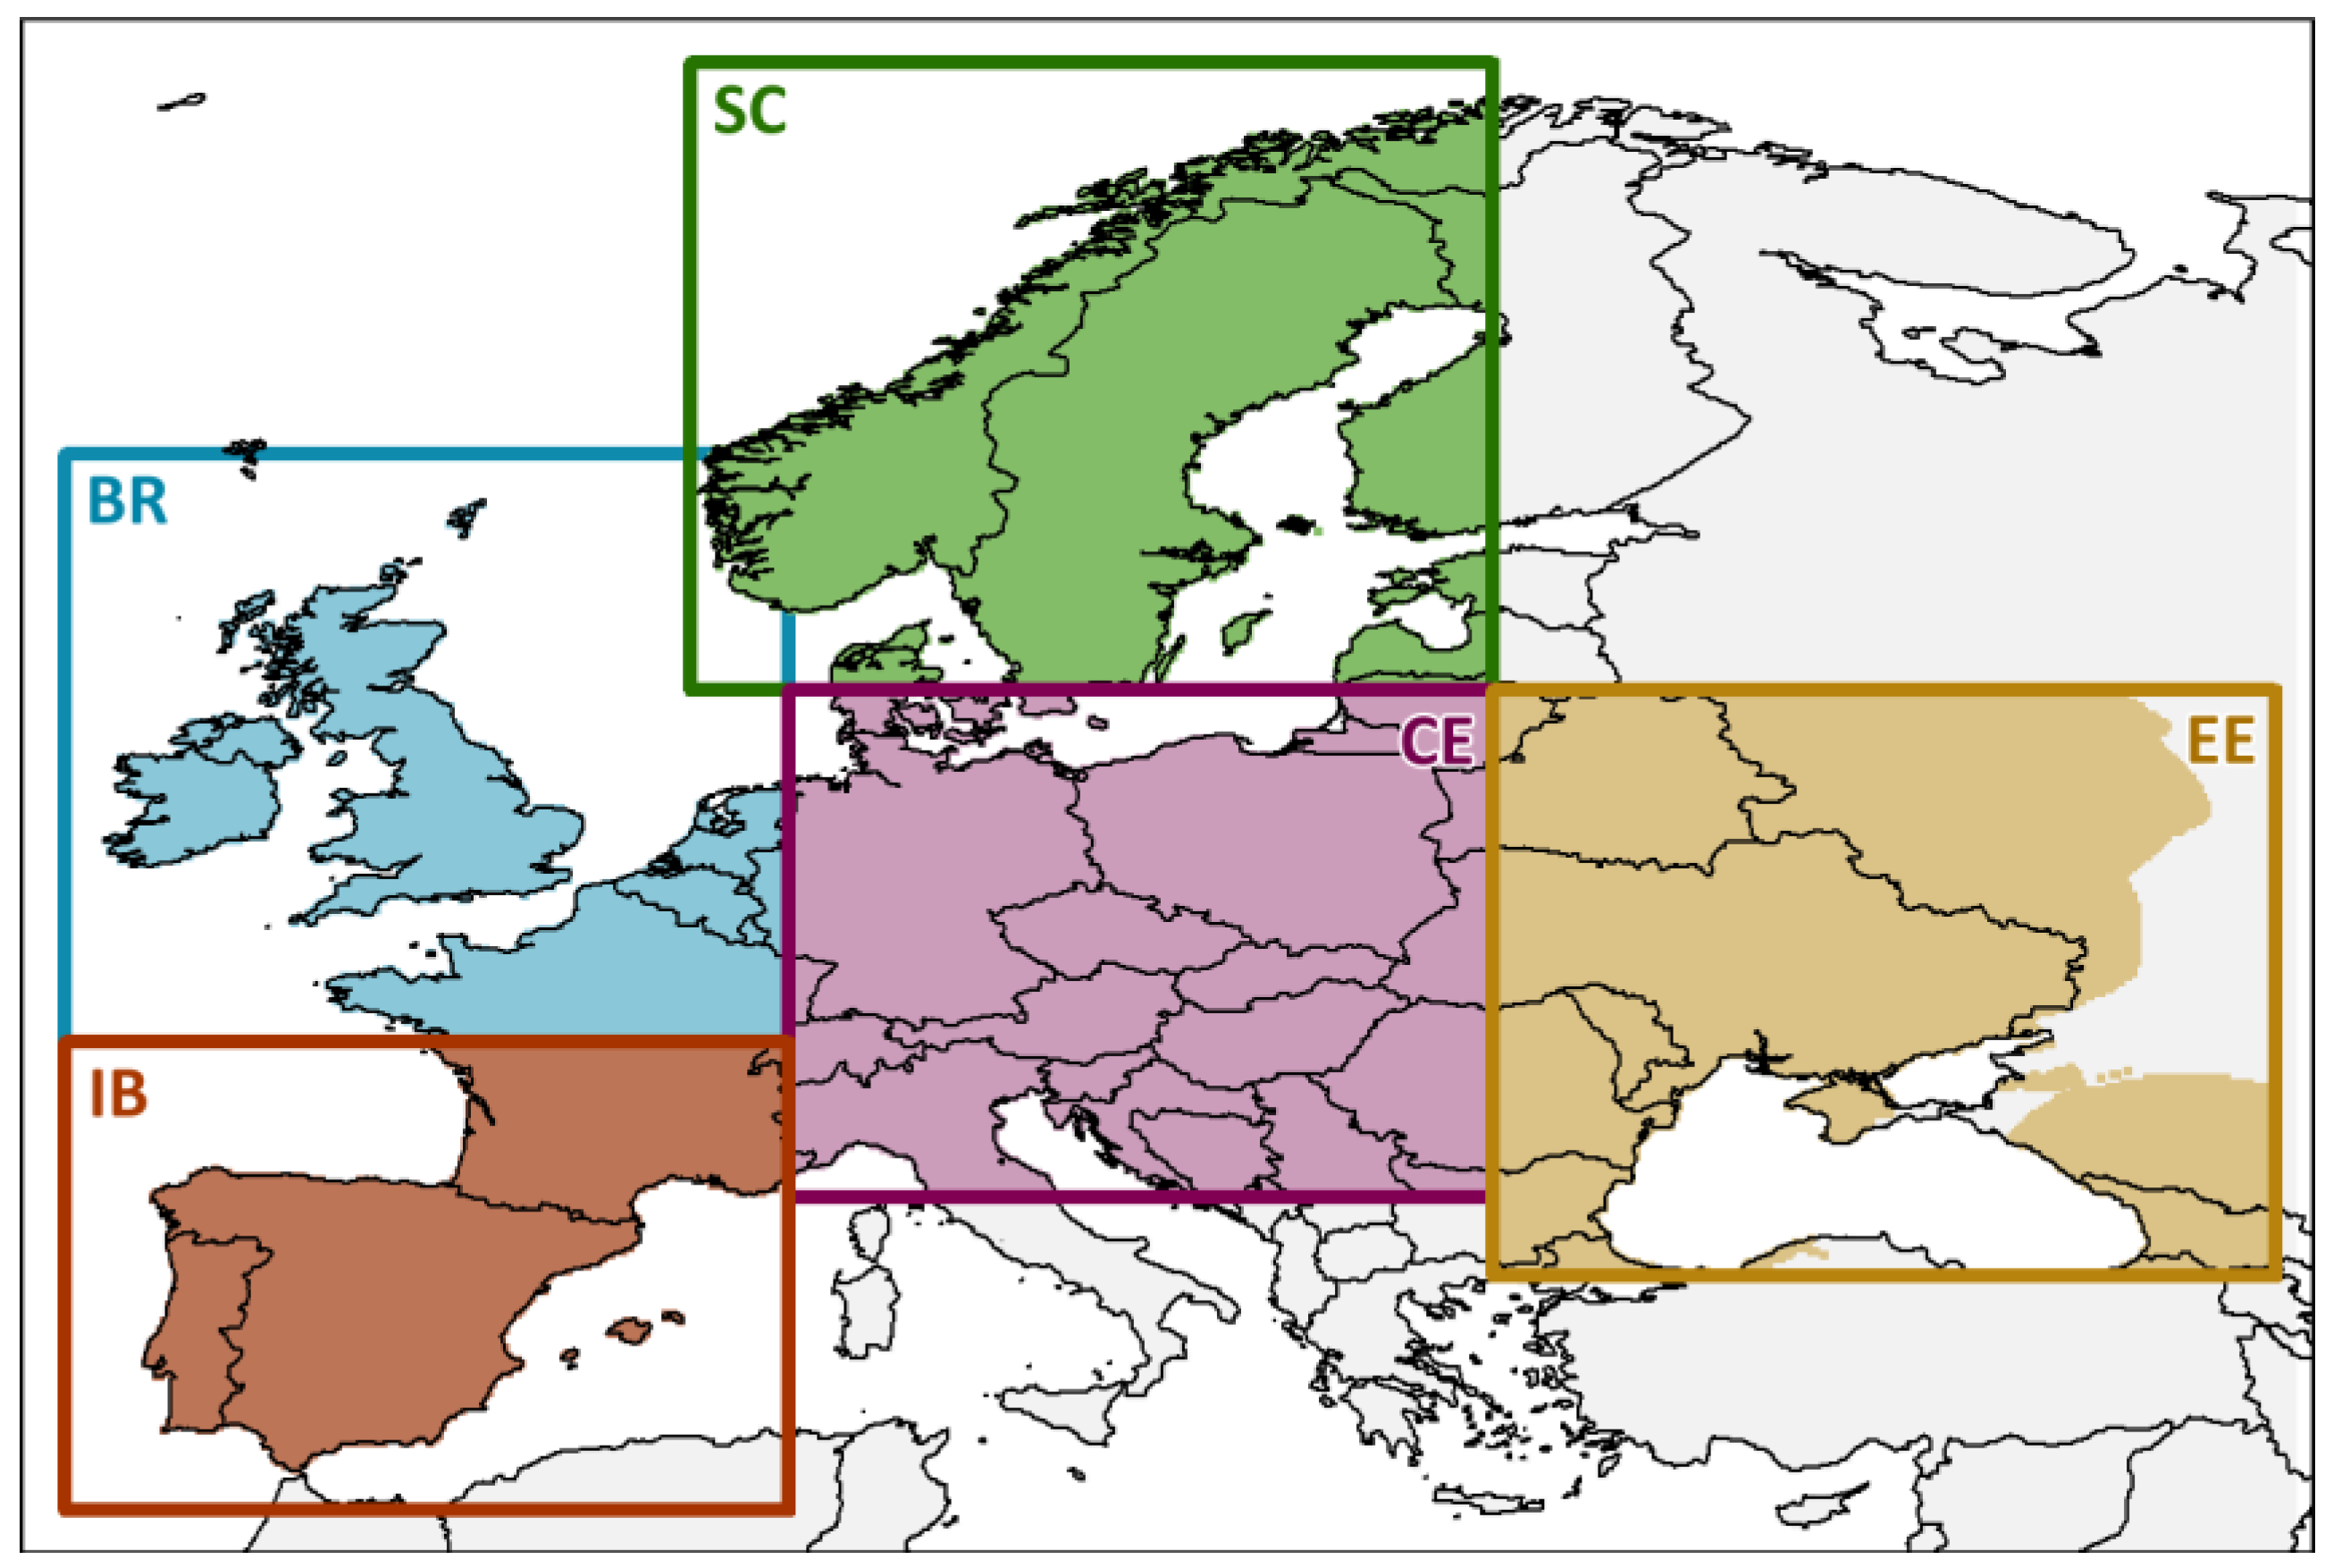
The study relied on daily maximum air temperature data (TX) for Europe collected in the period from March 1950 to February 2020. The data were obtained from an E-OBS gridded dataset (v.21.0 e), where the data are presented in the form of a regular, latitude-longitude grid with a spatial resolution of 0.1° × 0.1°. The E-OBS is Europe-wide, land-only observational dataset based on the European Climate Assessment and Dataset (ECA&D) daily station data [68]. The analysis in the paper employed grid points with no missing data. Analyses were conducted for five spatial domains representing various geographic regions of Europe. These consisted of Western Scandinavia (SC), the British Isles, Northern France and Benelux (BR), Central Europe (CE), Eastern Europe (EE), as well as Iberia and the Western Mediterranean (IB) (Figure 1). The study areas were chosen based on the spatial dimensions of domains used in an international project called: “COST733 Action: Harmonization and Applications of Weather Type Classifications for European Regions” [69,70]. In light of the research goal defined in the study the original boundaries of these domains were modified to create independent, non-overlapping fields. The size of each study area is defined as the total surface area of all the grid boxes found within the given domain. Only land areas were considered (in line with Figure 1). Each domain was analyzed separately.
The study was performed for climatological seasons: winter (DJF), spring (MAM), summer (JJA), autumn (SON). The analysis in the paper covered 70 years—winters from the period 1950/1951 to 2019/2020 as well as the remaining seasons of the year from the period 1950 to 2019. The recurring date of February 29th was not included in the calculations in this study.
2.2. Definition of Extreme Heat Events and Warm Events
The research literature provides a large number of different methods that may be employed to examine extreme heat events and warm events. Most papers define such events in the form of days, where the daily maximum air temperature exceeds a threshold value identified using high percentiles (e.g., 90th, 95th, 99th) [4]. While the framework used to identify these thresholds is uniform, there are still many variants to be considered [71]. The most often examined characteristics of temperature extremes include their frequency, intensity, and duration. The latter is considered in the case of prolonged events, i.e., heatwaves and warms spells [4]. Few existing studies examine the spatial range of temperature extremes, which does strongly affect the severity and outcome of such events [72,73].
In this study, extreme heat and warm events, hereinafter referred to as extreme temperature events (ETEs) are defined as days when the daily TX exceeds the local 95th percentile of the 1961–1990 period across at least 10% of the surface area of the given domain. The 10% threshold was introduced in order to exclude local events from the analysis. A percentile was identified for each studied grid point and each studied calendar day using a 15-day-centered window [71]. The percentile-based thresholds identified in this manner are valid for a given part of the year, which makes it possible to perform ETE analyses for all seasons of the year [4]. Hence, in this study an extreme temperature event is defined as a day with an unusually high temperature for a given location and season, even if such a temperature would not be considered extremely high in an absolute sense. The study uses the standard reference period of 1961–1990, which is recommended by the World Meteorological Organization for long-term climate change assessments [74]. Two basic ETE characteristics are examined in detail—spatial range and intensity.
The spatial range of an ETE (denoted by “a”, as the area, in the formulas below) is characterized by the area affected by extreme temperature in a given domain. The spatial connectedness of grid boxes with extreme temperatures is not considered. This is not a major problem, as the studied spatial domains are not larger than the average size of meteorological phenomena at the synoptic scale. This is why it is highly unlikely that two separate ETEs featuring different synoptic patterns would occur on one day in one domain. The analysis in the paper only excludes single, isolated grid boxes affected by extreme temperatures. All spatial analyses were conducted using “raster” package (v3.3-13) [75] in the “R” environment [76].
The intensity of an ETE is the cumulative temperature excess above the 95th percentile across an area affected by extreme temperature (denoted by “e”, as the excess, in the formulas below). As mentioned earlier, the size of the area of individual grid boxes varies with latitude (see Section 2.1 of this paper), which had to be taken into account in the calculations of the intensity of ETEs. From a technical perspective, the TX excess above the given percentile-based threshold for all affected grid boxes was multiplied by their respective surface areas, and then added together. The cumulative temperature excess above the threshold is widely considered to be a reliable measure of heat event intensity making it possible to calculate the size of the additional heat load that appears in the environment due to the occurrence of a temperature extreme [3,77,78]. This additional heat energy is one of the primary factors responsible for the effects of ETEs on human health, natural ecosystems, and the economy.
In order to characterize individual ETEs in terms of their spatial range and intensity, a slightly modified version of the Sulikowska and Wypych [39] Extremity Index (EI) was used in this study:
EI = TA ∙ TI
The total area (TA) of an ETE was computed as the ratio of the spatial range of an ETE (a; km2) and the surface area of the entire domain in question (A; km2):
The total intensity (TI) of an ETE is calculated as the ratio of the intensity of an ETE (e; °C ∙ km2) and the surface area affected by the given ETE (a; km2):
In their basic forms, TA, TI, and EI serve to characterize individual ETEs—they are daily indices. TA and TI may be analyzed independently. TA or the areal proportion of the domain affected by extreme temperatures may have a maximum value of 1.0, whereby the entire domain is affected. TI, which is the average percentile-based threshold exceedance value for an ETE in an area affected by extreme temperatures does not have an upper limit. Its value usually equals several degrees Celsius. In this study the definition of TI was modified with respect to the original definition [39] for the purpose of analysis of long time series and the evaluation of long-term ETE trends. EI produces a neat way to combine spatial range and intensity information. EI makes it possible to evaluate and compare ETEs within a single domain, and between domains, as well as for different seasons of the year thanks to the use of a calendar-day percentile. EI is expressed in °C and is interpreted as the average temperature excess over the percentile-based threshold during an extreme temperature event in relation to the surface area of the given spatial domain.
2.3. Research Outline
Analyses were performed independently for each domain and season of the year. The first step consisted of an assessment of trends in the average maximum air temperature and temperature on the warmest day of the season (TXx). TXx is the only absolute measure of extreme air temperature used in this study. Buckley et al. [33] asserts that both absolute and relative measures are biologically relevant, although the basis for their use depends on the temperature tolerance of a species and its degree of adaptation to its local temperature environment. In this study we wanted to check whether absolute metrics (TXx) and relative metrics (EI and its components) produce geographically consistent results. The analysis covers average TXx trends for each studied domain as well as trends for each given grid point, and the results are shown on appropriate maps.
The second stage of analysis sought to determine the general characteristics of ETEs occurring in each studied domain in every season of the year by examining the distributional characteristics of the daily values of EI, TA, and TI. The study focused on a comparison of average values of EI, TA, and TI for different domains and different seasons of the year as well as on an assessment of the range of daily values of these three indices. The results of this analysis are presented in the form of boxplots.
Seasonal EI totals that combine frequency, spatial range, and intensity information for ETEs that occur in a given season were used in order to assess individual seasons in terms of extreme temperature conditions. The third stage of the study consisted of an analysis of seasonal and regional variability in EI totals and in their trends. In addition, the following trends were investigated: (1) frequency of ETEs, defined as the sum of all ETEs in a season; (2) mean spatial range of ETEs, defined as the average TA across all ETEs in a season; and (3) mean intensity of ETEs, defined as the average TI across all ETEs in a season. Analyses of trends were performed using the nonparametric Mann–Kendall test and Sen’s slope estimator [79]. The statistical significance of trends was assessed at the level α = 0.05. The calculations were performed employing the “trend” and “spatialEco” packages (versions 1.1.4 and 1.3–2, respectively) [80,81] in the “R” environment.
In the last step of the study the frequency of occurrence of the most severe ETEs—hereinafter referred to as very severe ETEs—was assessed over the long term for each domain and every season of the year. The second stage of analysis consisting of an examination of variances in daily EI, TA, and TI values for ETEs enabled the determination of thresholds for each of the three indices. This then made it possible to find very severe events in each studied domain and for each season of the year. Thus, very severe ETEs included days on which extremely high temperatures affected at least 50% of the given domain surface (TA ≥ 0.5), while the average excess above the percentile-based threshold for the affected area equaled at least 2.0 °C (TI ≥ 2.0 °C). Given the low overall frequency of ETEs that could fulfill all the aforementioned conditions, it was not possible to conduct a reliable analysis of their trends. Thus, sums of very severe ETEs over decades were used for the purpose of assessing their variability for each studied domain and season of the year. Very severe ETEs were grouped according to decade of occurrence: 1950–1959, 1960–1969, etc. (1950/51–1959–60, 1960/61–1969/70, etc. for winters).
3. Results
The average areal, maximum air temperature (TX) increased in every spatial domain and every season of the year—and this increase was statistically significant (Table 1). Considering all of the studied domains together, the strongest average trend was observed in the spring when it ranged for the set of studied domains from 0.3 to 0.5 °C per 10 years. It was weakest in the autumn when it equals 0.2 °C per 10 years for all the domains except for Iberia (IB). Among the studied domains, Eastern Europe (EE) and Iberia are characterized by the greatest warming—on the annual scale. On the other hand, in the domain encompassing British Isles, Northern France, and Benelux countries (BR), variances in trends between the seasons of the year are the smallest (Table 1).
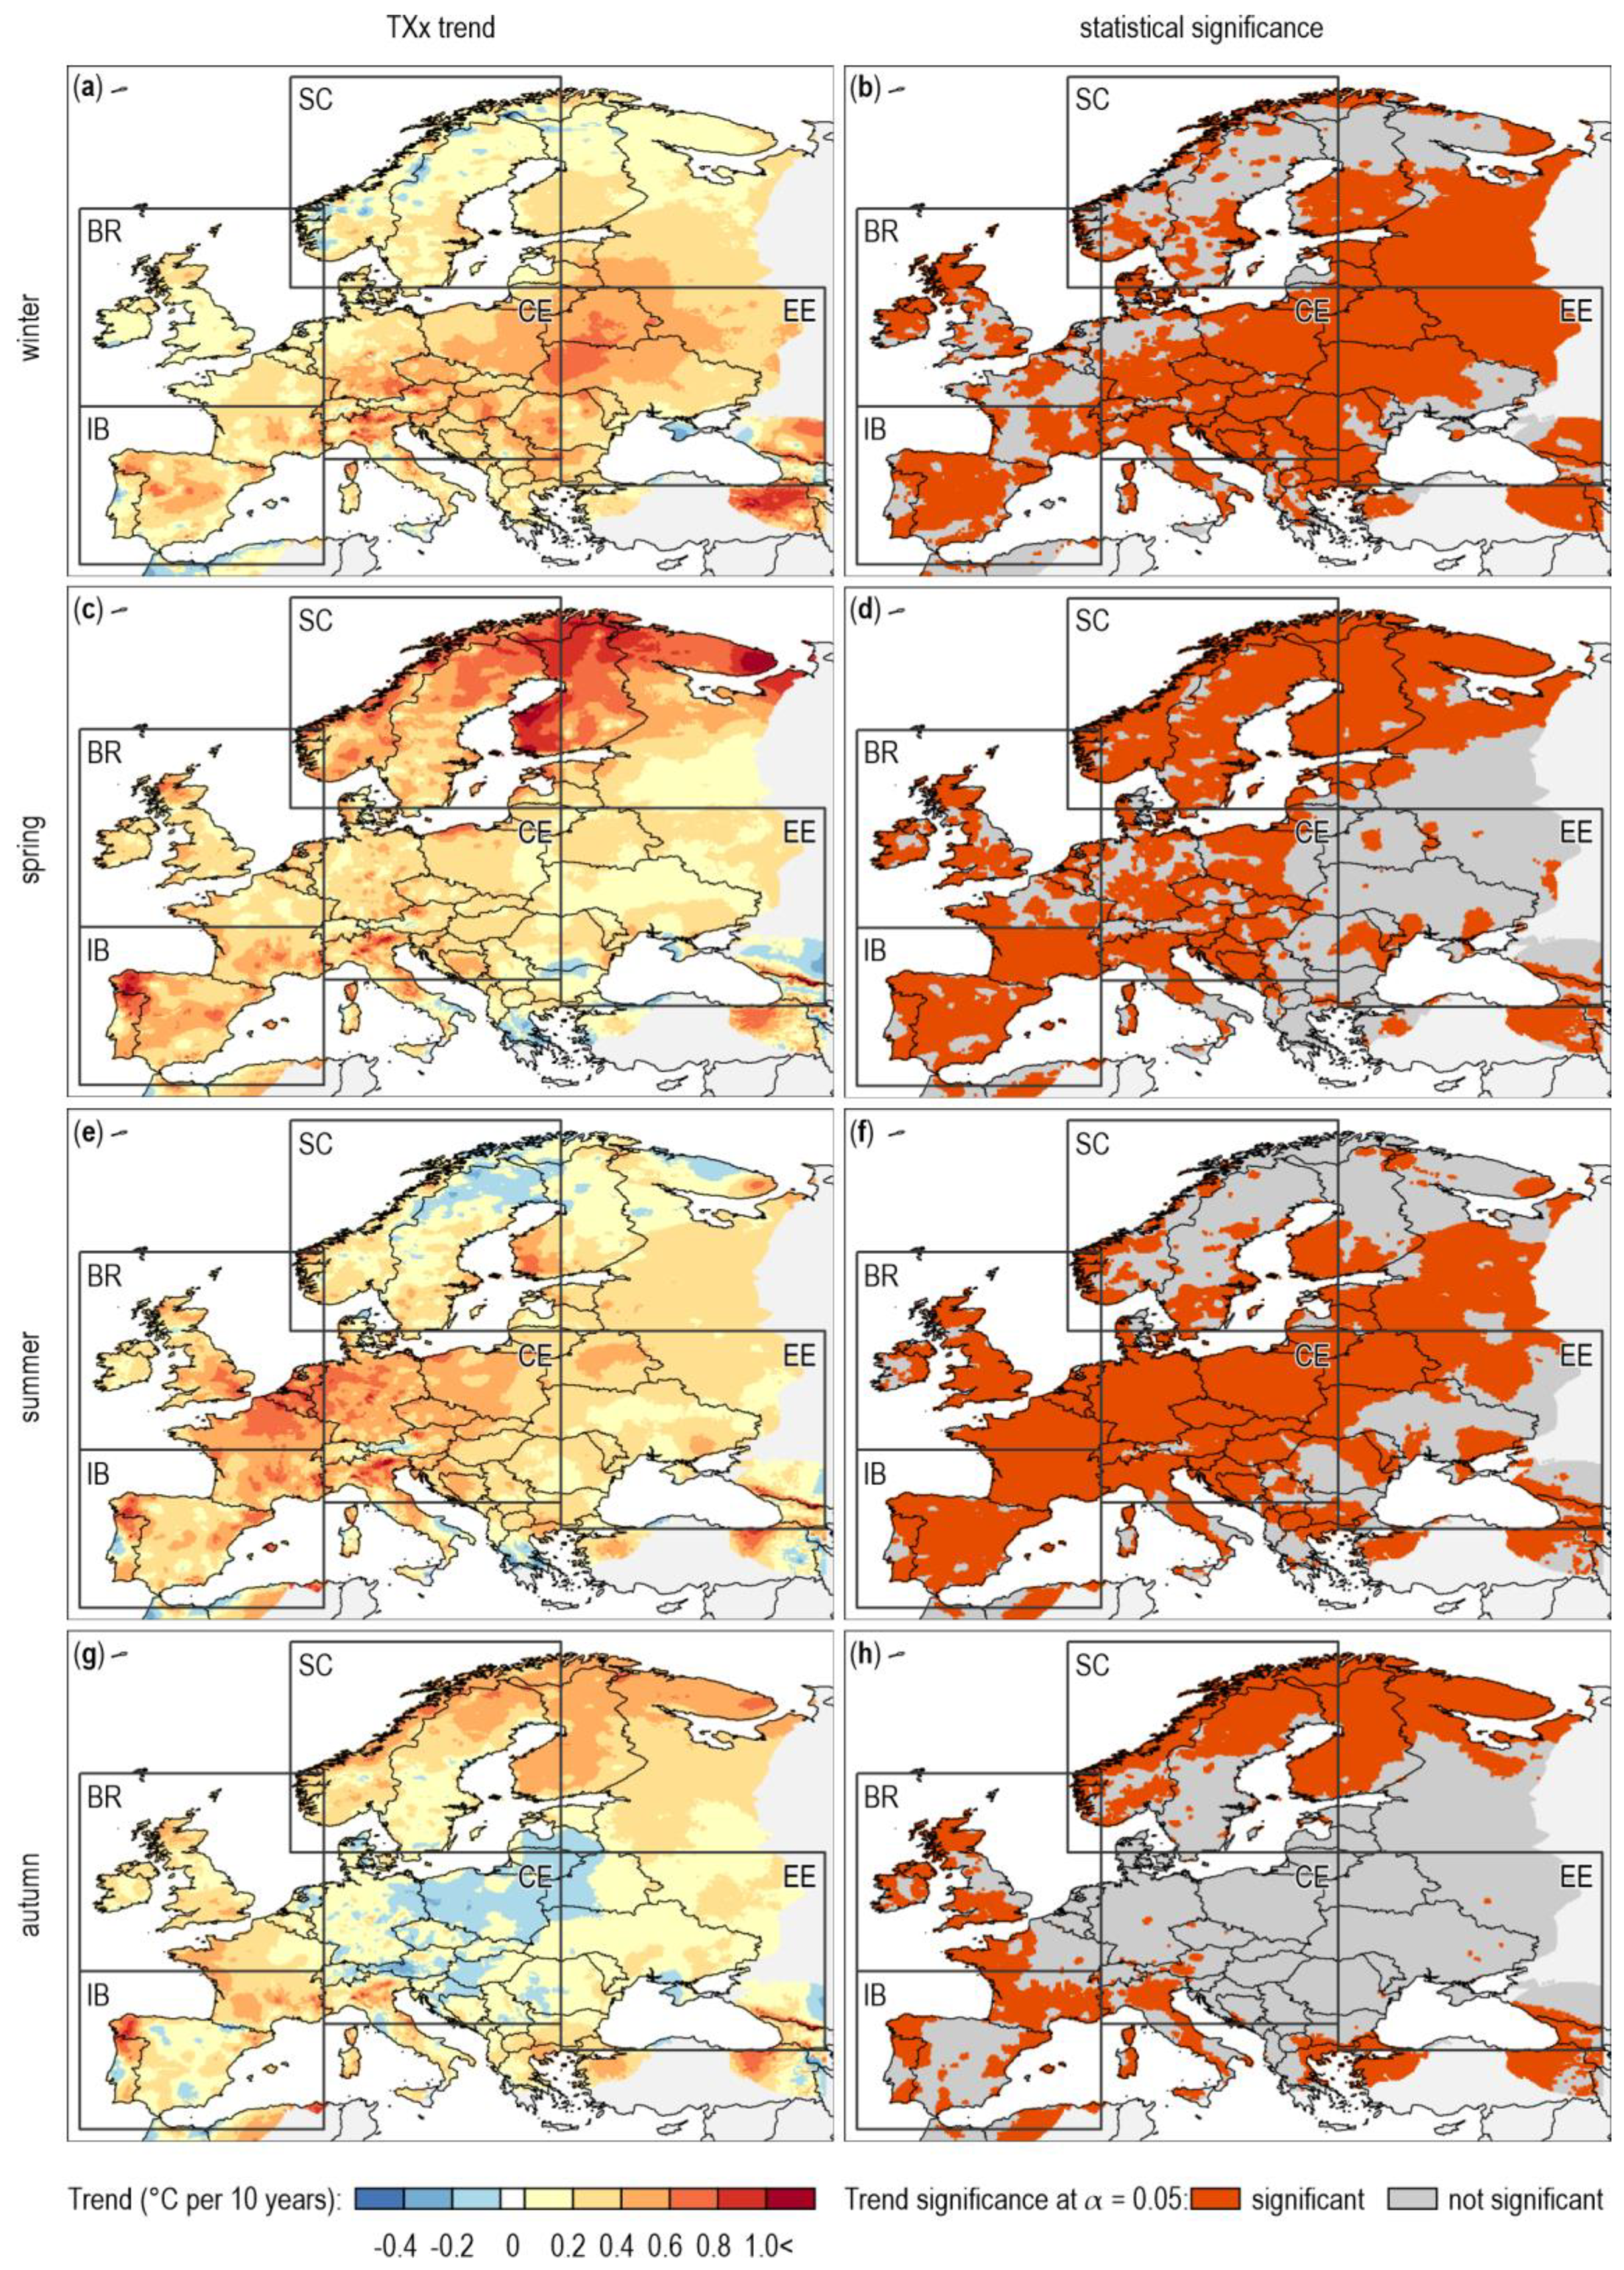
Some of these patterns were discernible in temperature trends for the warmest day of the season (TXx); however, a large (small) increase in the seasonal TX average did not always correspond to large (small) increases in TXx, and variances between seasons of the year were greater (Table 1). In this set of data one could observe a large increase in TXx in the spring in Western Scandinavia (SC) and in the summer in the “British” domain, (0.5 °C per 10 years); in both cases, the trend was statistically significant across about 83% of the domain surface area (Table 1, Figure 2a–h). Given the large increase in the seasonal average TX, the relatively small average increase in TXx in spring in Eastern Europe was rather surprising. The same may be said of the small percentage of statistically significant trends (13% of domain surface area, Figure 2c,d). Unsurprisingly, relatively weak trends were noted in the autumn (Table 1). As it turned out, small average increases in TXx in the autumn or even the absence of a trend, as in the case of Central Europe (CE), are associated with TXx decreases in many regions of Europe (Table 1, Figure 2g). This was especially true in autumn in Central and Eastern Europe—but also in summer, and to a lesser degree in winter, in Western Scandinavia (Figure 2a,e,g). While the vast majority of TXx declines were not statistically significant, they affected a substantial part of the studied domains in both autumn and summer. It is noteworthy that statistically significant increases in TXx covered only about 6% of the area of Central Europe and Eastern Europe in autumn and about 34% of the area of Western Scandinavia in summer and winter (Figure 2b,f,h).
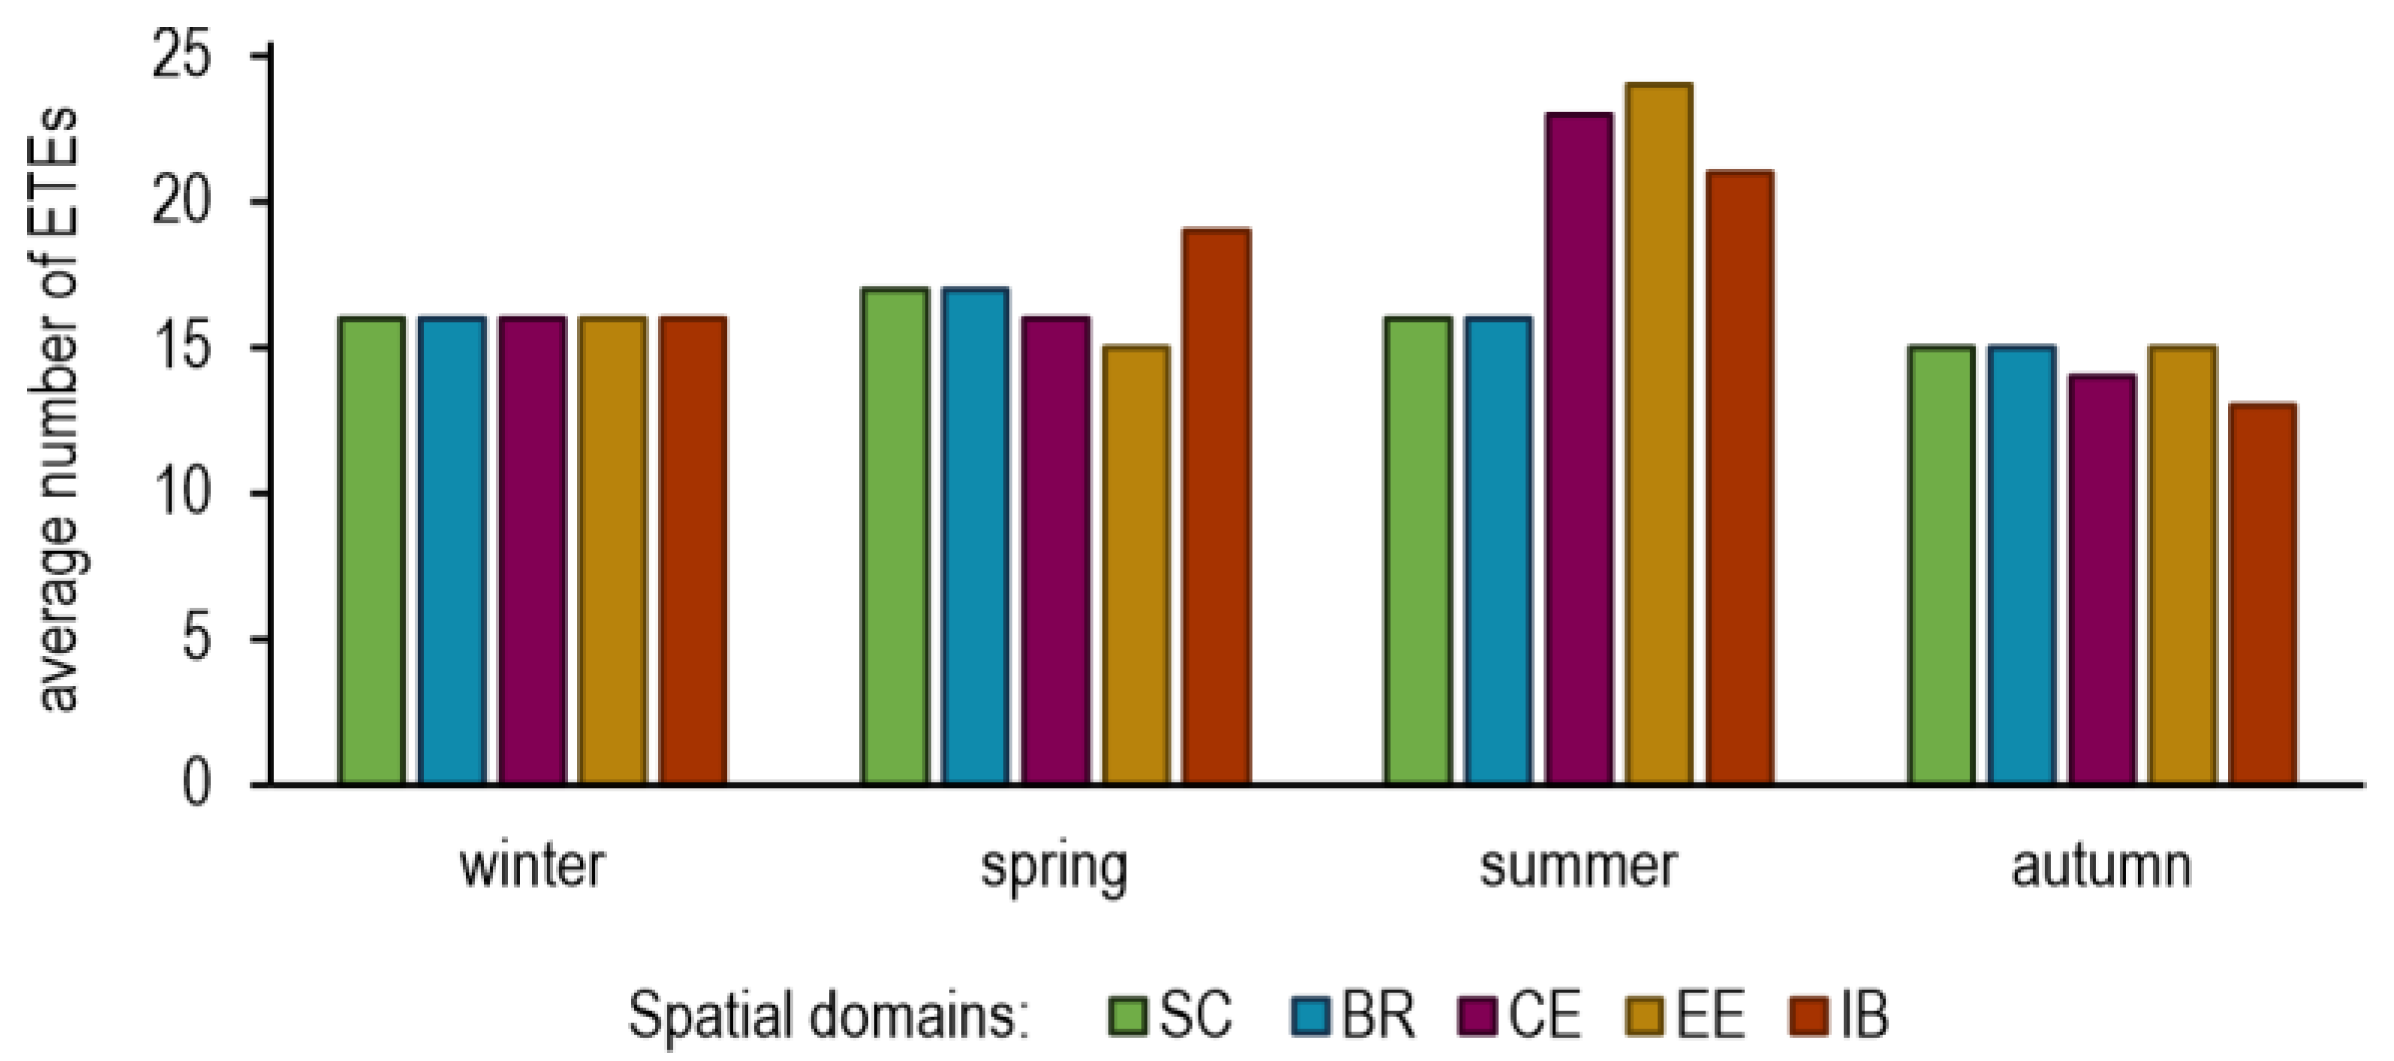
Due to the research method used, the seasonal average number of ETEs was similar for each of the studied domains in each season of the year and equals about 17. In spite of this certain geographic and seasonal patterns could be observed (Figure 3). These patterns may be explained by (1) variations of air temperature during the baseline period and beyond it, which affected the number of percentile-based threshold exceedances in the study period (this problem is widely discussed in [71]), and by (2) the need to fulfill certain spatial criteria in order to classify a given day as an ETE (10% of domain surface area needs to be affected by extremely high TX). Thus, on average, fewer ETEs occurred in Western Scandinavia and the domain that included the British Isles, Northern France, and Benelux countries, and seasonal variances were smaller relative to Central Europe and Eastern Europe as well as Iberia (Figure 3). Noteworthy was the large average number of ETEs in the last three aforementioned domains in the summer: 23, 24, 21, respectively. In comparison with other domains, the number of ETEs in Iberia was also larger in spring (19). In the winter the number of ETEs became similar between all of the studied domains at 16. The average number of ETEs in all the investigated domains was lowest in autumn. The one exception was Eastern Europe, where few ETEs were also noted in the spring (Figure 3).
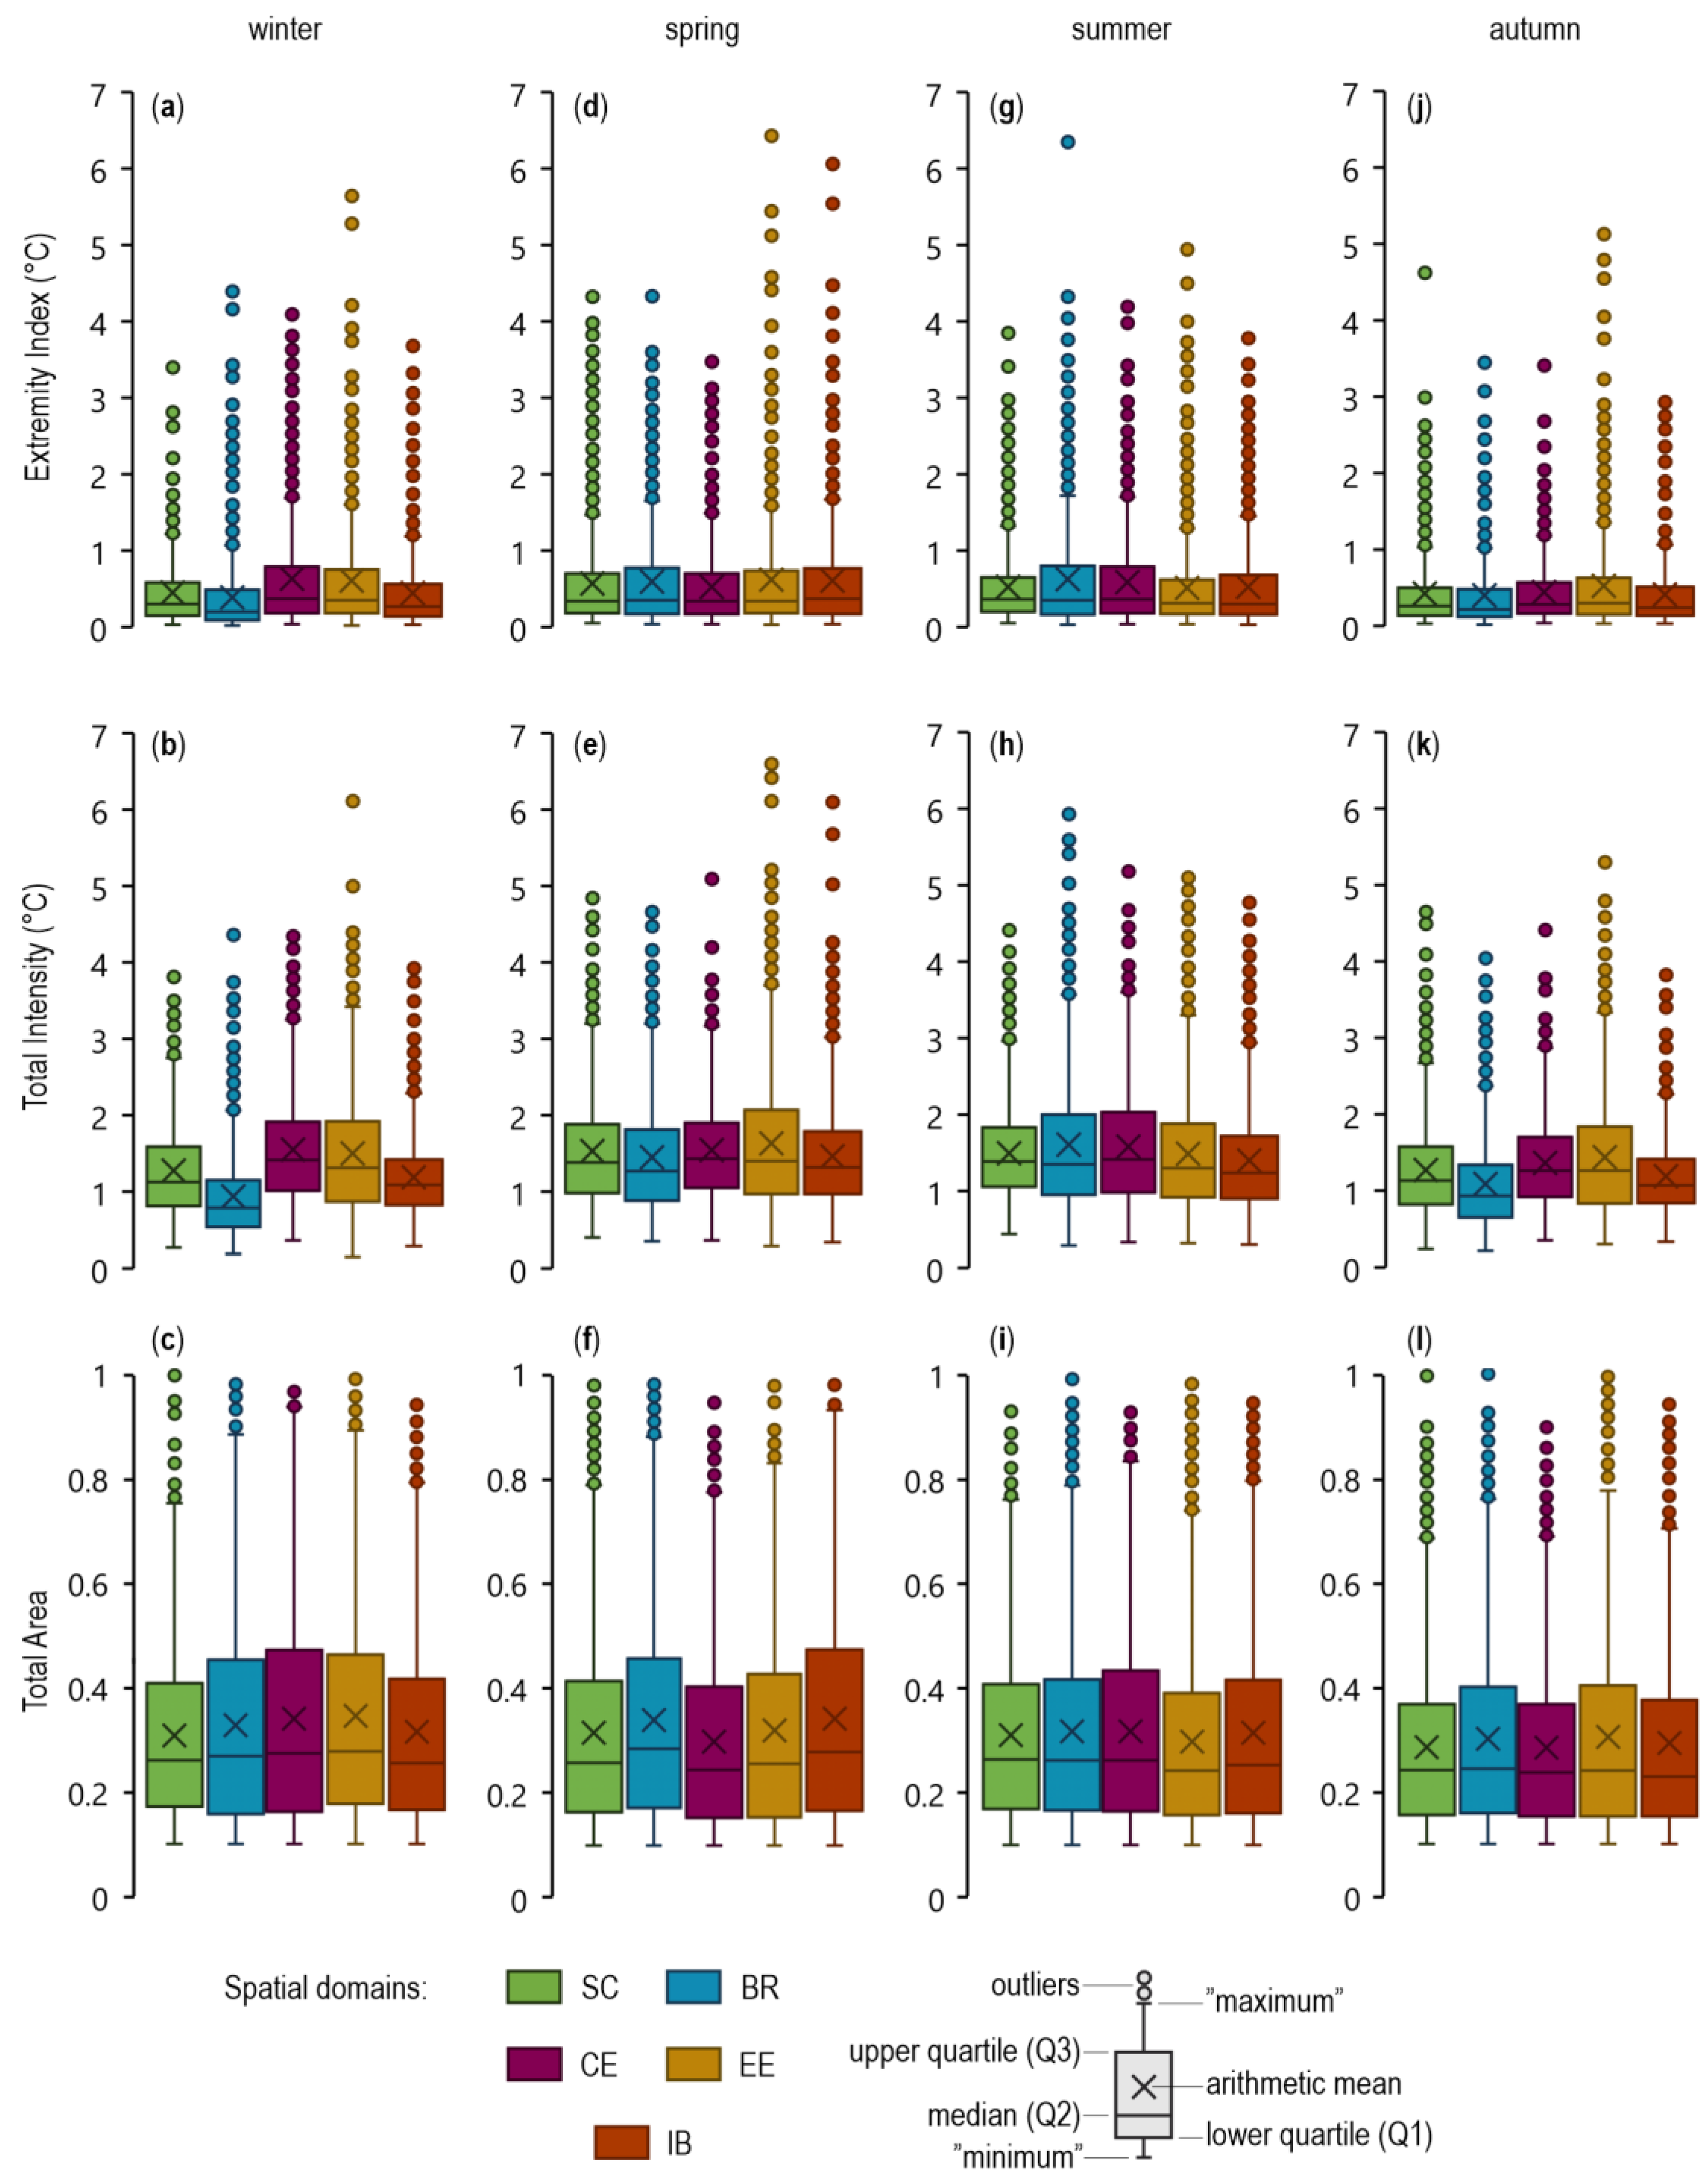
Not only the average number of ETEs, but also their severity, defined as the product of intensity and spatial extent of the given event, and expressed by the magnitude of the Extremity Index (EI), varied spatially and seasonally. The average value of EI for all the analyzed domains and seasons ranged from 0.4 to 0.6 °C, although the EI distribution was always asymmetric to the right—therefore, the majority of ETEs had an EI value below the average (Figure 4, upper row). The most severe ETEs had an EI value ranging from about 2.0 °C to a little more than 6.0 °C. These were the most extreme of events characterized by high intensity and/or large spatial range, which are marked on diagrams as outliers (Figure 4, upper row). The average total intensity (TI) ranged from 0.9 to 1.6 °C, with the highest values for individual ETEs ranging from about 3.0 °C to almost 7.0 °C (Figure 4, middle row). On average, ETEs affected about 30% of the area of the studied domains (TA ≈ 0.3), although the most expansive events covered virtually all of the domain area (Figure 4, lower row). As in the case of EI values, the probability distribution for TI and TA was always asymmetric to the right, thus most ETEs were characterized by TI and TA values lower than the average.
In the wintertime ETEs were most severe in Central and Eastern Europe due to a relatively high average intensity and large average spatial range. On the other hand, winter ETEs in Western Scandinavia, the “British” domain, and Iberia were characterized by a lower average severity. In the case of the “British” domain this was due to a much lower average TI (Figure 4b). The situation was different in Western Scandinavia and Iberia, where ETEs tended to cover smaller areas of the studied domain (Figure 4b,c). Average spring EI values and variances therein were comparable for all the studied domains. In Eastern Europe spring ETEs were, on average, somewhat more intense (Figure 4e), but in the “British” domain and in Iberia usually covered larger parts of the given domain, relative to other regions (Figure 4f). ETEs in the summer were, on average, the most severe in the “British” domain and Central Europe, which was mainly due to high average TI (Figure 4g–i). In the three remaining domains, summer ETEs in Eastern Europe tended to be more intense, but covered a smaller geographic area. The opposite was true in Iberia, while Western Scandinavia was somewhere in between (Figure 4h,i). In autumn, as in the case of spring, the average value of EI and variances therein tended to be similar in all the studied domains. Only in Eastern Europe did autumn ETEs more often than in other domains possess relatively high TI and TA values (Figure 4j–l). To some extent the autumn TI pattern resembled its winter pattern (Figure 4k). In the case of average TA values, these tended to be similar for all the studied domains, although in the “British” domain and Eastern Europe autumn ETEs more frequently occupied a larger surface area in comparison with that in other regions (Figure 4l).
To summarize this issue at the individual domain level, ETEs in Western Scandinavia and Iberia were, on average, the most severe in the spring, followed by the summer. In the domain encompassing the British Isles, Northern France, and Benelux countries, ETEs were most severe in the summer followed by the spring. In these three domains, winter and autumn ETEs were characterized by similar average severity, although ETEs with a higher EI value tended to occur somewhat more often in winter. In Central Europe average EI values were highest in the two most extreme seasons of the year—winter and summer. On the other hand, autumn ETEs were, on average, the least severe. The situation was still different in Eastern Europe, where ETEs were characterized by the greatest average severity in the winter and spring. This was the only one of the studied domains where average EI and variances therein were the lowest in summer (Figure 4).
Seasonal EI totals were employed to evaluate long term variances and trends in extremely hot and warm conditions. These made it possible to assess each season in terms of ETE frequency, intensity, and spatial range. Figure 5 shows the temporal variability of EI totals along with a smoothing filter. Average EI totals ranged from 6 °C to 13 °C depending on the domain and season of the year. There were some seasons during the study period which did not feature an ETE (EI = 0 °C). On the other hand, the most severe seasons had EI totals ranging from tens of degrees to more than 100 °C (Figure 5). In the wintertime, the pattern of EI totals was characterized by relatively strong agreement between domains—in many cases low and high EI totals were noted for the same years in several domains (Figure 5a). In transitional seasons of the year the differences between domains were larger (Figure 5b,d), while in the summer each domain followed its own, unique pattern (Figure 5c). Nevertheless the entire study period may be roughly divided into two subperiods. The first subperiod lasted from the beginning of the study period until the mid-1980s and was characterized by relatively low EI totals and little variance from year to year. The second subperiod began in the mid-1980s and ended with the end of the study period. This subperiod was characterized by the occurrence of seasons with severalfold higher EI totals and increased variances therein from year to year as well as an overall growth pattern in many cases. This division could be observed most readily in winter and spring (Figure 5a,b). In summer its boundary shifted back several years or shifted forward, depending on the domain (Figure 5c). In the autumn a discernible increase in EI totals was noted only for the last 20 to 30 years (Figure 5d).
Key characteristics of seasons with the highest EI totals—or number of extreme temperature events (ETEs), average total intensity (average TI), and average total area affected (average TA)—showed the high relevance of each of these variables (Table 2). Noteworthy are two domains—Central Europe and Eastern Europe—where very high EI totals were noted both in winter (61.2 °C in 1989/1990 and 54.4 °C in 2006/2007, respectively) and summer (63.0 °C in 2015 and 107.6 °C in 2010, respectively). However, summer data for Iberia were also noteworthy (71.9 °C in 2003). Such high EI totals for Central and Eastern Europe in the most extreme winter seasons were first and foremost the result of the high intensity of events, rather than their high frequency or spatial range (Table 2). On the other hand, high EI totals in summer were the result of all the studied variables. The summer of 2010 in Eastern Europe was the most severe season of all the seasons examined in the study. ETEs occurred over the course of more than 70% of summer days and, on average, covered more than half the domain, while their average TX excess equaled 2.7 °C. The summer of 2003 in Iberia was ranked second. As in the case of Eastern Europe in 2010, ETEs occurred over the course of 70% of days, although their geographic coverage remained below 50% of the domain and their average TI value was 1.9 °C (Table 2). Of all the spring seasons studied, the most severe were noted for Iberia and Western Scandinavia when EI totals attained values similar to those noted for the summer (54.4 °C in 2017 and 44.3 °C in 2007, respectively). The high severity of the 2010 autumn season stood out for Eastern Europe, which may be described as a continuation of extreme conditions in the summer of 2010. It is important to note that the last 20 years were characterized by the occurrence of the highest seasonal EI totals, as almost 90% of all the most severe seasons in the studied domains occurred after the year 2000. Exceptions consist of the 1989/1990 winter in Western Scandinavia and Central Europe and the summer of 1976 in the domain encompassing the British Isles, Northern France, and the Benelux countries (Table 2).
The readily observable increase in EI totals after 1980 (Figure 5) prompted us to examine trends for two time periods—a long period encompassing the entire investigated period 1950–2019 (1950/51–2019/20 for winters) and a short period encompassing the most recent period of rapid change: 1980–2019 (1980/81–2019/20 for winters). Seasonal trends in EI totals, ETEs frequency and average TA and TI, were examined.
An analysis of trends in EI totals and that of associated variables required attention to different rates of change in individual domains over the course of a year.
The greatest changes occurring over the course of the year were noted in Central Europe and Eastern Europe for the most recent 40-year period (Table 3). In Central Europe changes occurred most intensively in summer—EI totals increase at a rate of 2.4 °C (1950–2019) or even 6.7 °C (1980–2019) per 10 years. The latter was the highest value noted for all seasons and domains. Such a strong trend was mainly due to a rapid increase in the frequency of occurrence of ETEs, which reached 4.0 and 9.4 days per 10 years in the two analyzed periods, respectively (Table 3). The increase in average TA and average TI was less pronounced, but still statistically significant. Looking at the short term, EI totals grew rather rapidly also in the spring (3.4 °C per 10 years) and autumn (3.0 °C per 10 years). The mean area affected by extreme temperatures increased by 3% of the domain area per 10 years over the last four decades, while the average intensity of extreme temperatures increased 0.13 °C per 10 years in all seasons except winter. In the wintertime changes in all the studied variables were quite large and also statistically significant over the long term. In the late 1980s one could observe a rather sudden shift in the pattern of EI totals in the direction of higher values, as opposed to a gradual increase (Figure 5a). In the last 40 years only the frequency of ETEs in the wintertime significantly increased in Central Europe (3.1 days per 10 years; Table 3).
In Eastern Europe trends were relatively invariable when given the pattern for the entire study period. EI totals increased by 1.2 to 1.3 °C per 10 years in autumn and winter and 1.7 to 1.8 °C per 10 years in spring and summer (Table 3). Seasonal variances in trends since 1980 increased significantly (Figure 5, Table 3). Changes occurred very rapidly, especially in summer when EI totals reached 6.1 °C per 10 years and the number of ETEs grew by 10.0 days per 10 years (Table 3). The increase in average TA was also statistically significant. Trends in EI totals were also very strong for the spring and autumn: 4.8 °C and 3.5 °C per 10 years, respectively. This was primarily related to the largest increase in average surface area occupied by ETEs among the studied domains (up to 5% of a domain’s surface area per 10 years) as well as their average TI for these two seasons of the year (Table 3).
A different pattern of change applied to domains located in the west of Europe, i.e., the domain encompassing the British Isles, Northern France, and Benelux, and Iberia. In these regions changes occurred most intensively in spring and summer. This pattern of change applied to trends identified for the entire study period and the most recent 40-year period, with the rate of change in EI totals and ETE frequency always being higher in Iberia (Table 3). The “British” domain was characterized by the most constant rate of change over the course of the year. Changes were the largest in the summer and primarily related to the highest among all the studied domains increase in average TI, reaching 0.26 °C per 10 years in the period 1980–2019. The absence of a statistically significant increase in ETE frequency for this period underscored the growing intensity of events. Interestingly enough if one were to consider ETE frequency the largest increase was noted there in wintertime (Table 3). Yet these were still low severity events when compared with the other studied domains (Figure 5a).
The fastest changes in EI totals in the spring occur in Iberia and the Western Mediterranean which was primarily due to the fastest increase in ETE frequency, 3.4 days (1950–2019) and 7.1 days per 10 years (1980–2019), and due to rapidly growing average intensity of events (Table 3). In this domain ETE growth occurred even faster in the summer: 4.6 and 7.2 days per 10 years in the analyzed periods, respectively. Their average TI and average TA also increased significantly (Table 3). The rate of increase in EI totals in autumn and in winter in Iberia was two to three times smaller than in spring and summer. This pattern held for both trends identified for the entire study period and those identified for the most recent 40 years (Table 3).
In the domain located farthest to the north–Western Scandinavia—spring was the season characterized by the highest rate of change per 10 years: EI totals increased 2.0 °C in the period 1950–2019 and 4.2 °C in the period 1980–2019, while ETEs increased by 2.6 and 4.8 days, respectively. Average TA and TI for ETEs also increased significantly (Table 3). As in the case of Central Europe and Eastern Europe, quite strong changes in warm extremes have also occurred in autumn in Western Scandinavia over the last 40 years. This was especially true of their frequency: 4.0 days per 10 years. Noteworthy in this region was the virtually complete lack of statistically significant trends in variables for the summer season—a time characterized by the occurrence of rapid and mostly significant changes in extremes in all the other studied domains.
In summary, EI totals increased in all the studied domains in each season of the year, but with variable intensity and significance of changes depending on the analyzed time period. Increases in both EI totals and ETE frequency were significant for the entire study period, with the exception of trends for the summer in Western Scandinavia (Table 3). EI totals increased from 0.7 to 2.7 °C per 10 years. The average increase in ETEs is 1.0 to 4.6 per 10 years. The trends for these two variables varied more between domains in the spring and summer versus the autumn and winter (Table 3). On the contrary, changes in average TA were fairly constant. In most cases the average total area affected by extreme temperatures increased by 1% to 2% of domain area per 10 years. The situation was different in the case of trends for average TI, which fluctuate from 0.01 °C to 0.12 °C per 10 years (Table 3). Trends for all the variables for the last 40 years were stronger than those for the entire study period in every domain and season of the year, with only a few exceptions. These exceptions included weaker trends in mean TA in Eastern Europe in the winter and in Iberia in the winter and spring, as well as weaker trends in mean TI in Iberia in the winter. The strength of mean TA trends remained the same in both considered time periods in Western Scandinavia in the winter, in the ‘British’ domain in all seasons but spring, and in Iberia in the summer and autumn (Table 3). In the recent 40 years both the rate of increase in EI totals and the number of ETEs were even more than three times higher in comparison with the long term, reaching 1.4 °C to 6.7 °C per 10 years and 1.3 to 10.0 days per 10 years, respectively. The strength of trends for average TA and TI varied much more between seasons of the year and between domains and increases to a maximum of 5% of domain area and 0.26 °C per 10 years, respectively.
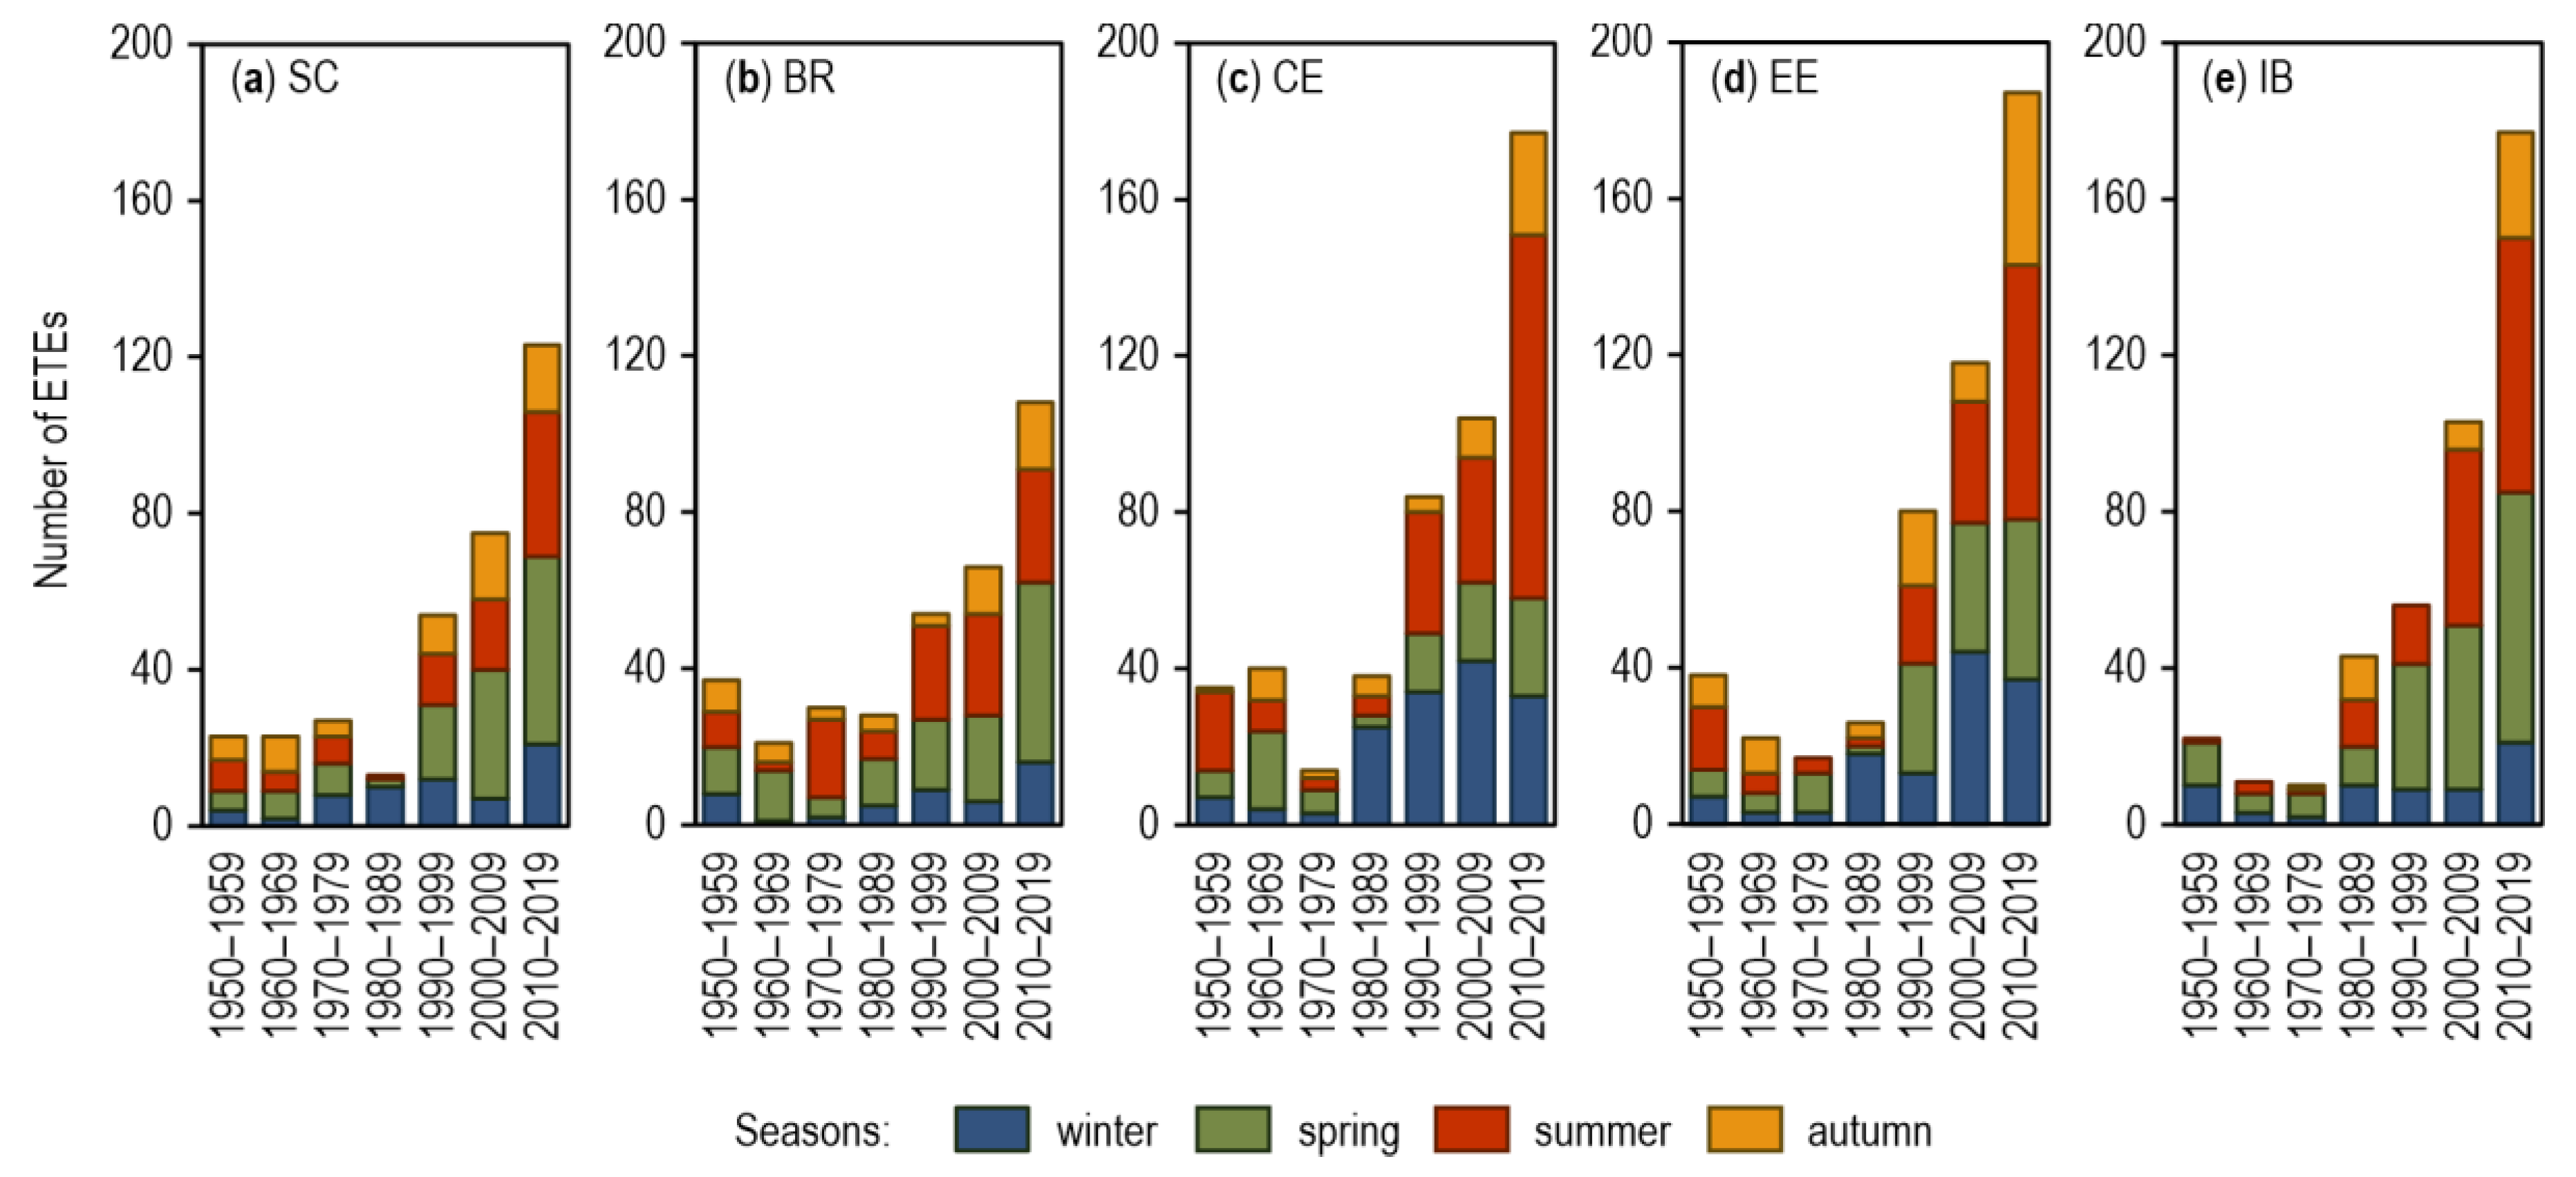
The increase in ETE frequency and their increasing average TA and TI led to an increase in the frequency of occurrence of very severe events defined as ETEs with a TA ≥ 0.5 and TI ≥ 2.0 °C. Figure 6 shows the number of ETEs that meet both requirements in each 10-year period in each studied domain. Considering all seasons of the year, averages of 48 and 49 such ETEs per 10-year period were noted in Western Scandinavia and in the domain encompassing the British Isles, Northern France, and the Benelux countries, while an average of 60 was noted in Iberia, with the largest number noted in Central Europe and Eastern Europe—an average of 70. Very severe ETEs most often occurred in spring and summer, although in Central and Eastern Europe they often also appeared in winter, and in Eastern Europe quite often in autumn (Figure 6). A gradual increase in the number of very severe ETEs at the annual scale was noted for the last four to five decades in all the studied spatial domains. The number of very severe ETEs was largest in each domain in the last decade, and this applies to all seasons of the year except for winter in Central and Eastern Europe, where the largest number of such ETEs occurred a decade earlier (Figure 6). Periods with the smallest number of very severe ETEs vary from domain to domain. In the “British” domain this was the period 1960–1969, while in Central Europe and Eastern Europe this was 1970–1979. In Iberia few very severe ETEs were noted for the period from 1960 to 1979, while in Western Scandinavia the smallest number of such events was noted in a more recent decade: from 1980 to 1989 (Figure 6).
In Western Scandinavia the increase in the number of very severe ETEs was especially high in spring and summer over the last three decades. In this period one could also observe an increase in the frequency of such events in autumn (Figure 6). In the “British” region very severe ETEs tended to increase in the spring—their number increased every decade since the 1970s. In summer a relatively large number of such ETEs were noted in this region in the years 1970–1979, and in every decade starting with the period 1990–1999. In Central Europe and Eastern Europe one could observe an abrupt increase in the frequency of wintertime very severe ETEs in the last 40 and 20 years, respectively. A large number of very severe ETEs occurred in summer in these two regions during the first decade of the study period, and then their frequency declined to increase once again in the last three decades and attain a value of almost 100 in Central Europe in the period 2010–2019 (Figure 6). The frequency of very severe ETEs in autumn in these two regions was much higher in the last decade with respect to the entire studied period—and this trend was much more pronounced in Eastern Europe (Figure 6). In Iberia a systematic and stable increase in the number of very severe ETEs was noted in the spring and summer. In the autumn such events did not occur at all in the first two decades of the study period and in the period 1990–1999, while in the period 1970–1979 only one case was noted. However, their number in the last decade was quite large, comparable to that in Central Europe (Figure 6). To summarize this issue, the number of very severe ETEs increases most rapidly in the spring and summer, and in Central Europe and Eastern Europe also in the winter. In autumn the number of very severe ETEs was relatively high, especially in the last decade of the study period in Central and Eastern Europe, and in Iberia.
4. Discussion and Conclusions
Through the use of a consistent framework for the measurement of extreme heat events and warm events (extreme temperature events, ETEs), this study presents the first comprehensive analysis of long-term changes in ETEs in Europe for the period 1950–2019 (1950/1951–2019/2020 for winters). The research was conducted in five spatial domains representing different regions of Europe that together cover a very large portion of the continent. Each studied domain was treated individually and results were examined with respect to the seasons of the year. ETEs were analyzed from a spatial perspective and were defined as days when the maximum air temperature exceeds the local percentile-based threshold across at least 10% of the area of the given domain. The severity of each ETE was assessed using the Extremity Index (EI) that combines information on the intensity and spatial range of an event—and at the same time makes it possible to examine the two characteristics separately. Given that EI is based on relative measures, it enables the comparison of results obtained in different geographic areas and seasons of the year. In addition, trends in air temperature on the warmest day of each season (TXx) were examined for every studied domain in order to check whether the direction and magnitude of changes in air temperature extremes based on relative measures are consistent with those obtained via absolute measures.
Climate warming in Europe during the studied 70-year period was accompanied by an increase in the frequency and severity of ETEs expressed in terms of their increasing intensity and spatial range. Yet, as our study demonstrates, every region of Europe is characterized by its own event pattern, and trends across the continent strongly vary geographically and seasonally. In addition, trend patterns for average air temperature do not always correspond with trend patterns for indices of extreme events. Furthermore, results based on absolute measures and relative measures of temperature extremes may in fact identify different time periods and geographic areas subject to such very intensive changes.
Areas and seasons of the year identified in our study and characterized by intense warming (in light of average seasonal TX values) correspond to results obtained by Pokorná et al. [43] who analyzed in detail variances in air temperature trends over the course of the year in Europe in the period 1961-2000. The highest rate of change was noted for winter in Western Scandinavia, spring and summer in Central Europe and Iberia, as well as winter and spring in Eastern Europe. The autumn season was characterized by the weakest warming dynamics, which is in part associated with so-called warming holes or periods and areas of non-warming or even cooling [43]. Pokorná et al. [43] proved the existence of autumn warming holes—especially for Central Europe and Eastern Europe. Our analysis of changes in TXx data clearly shows the presence of warming holes. TXx was found to decline in autumn in some parts of Central Europe and Eastern Europe. Most of these declines were statistically not significant.
Mainly significant increasing trends since 1950 are evident for seasonal EI; therefore, also for ETE frequency, intensity, and spatial range. Our study highlights that increases in indices that describe temperature extremes are accelerating and in the last 40 years the rate of change has been even more than three times greater than in the entire study period. The acceleration of the rate of change in heatwave index values in different parts of the globe was noted in a recent study by Perkins-Kirkpatrick and Lewis [3]. Lorenz et al. [44] documented these changes in trends for days with extreme heat in Europe, while in a study by Papalexiou et al. [82] these changes were shown with respect to the increase in the highest temperature of the year. The acceleration in increasing trends in extremely hot or warm days was proved also in regional studies, e.g., in the summer in Poland [83] and in the summer and winter in the western part of the Mediterranean [60]. Our results suggest that this shift in trends in indices of extremes over the last few decades is also manifested in the increasingly frequent occurrence of very severe ETEs with a large spatial range and high intensity. In light of increasing global warming [84,85] and future climate projections predicting further warming, these tendencies are likely to be continued [86].
Our study reveals some common patterns of trends in heat and warm extremes indices across different regions of Europe, but more importantly highlights regional and seasonal differences in the rate of change.
In Western Scandinavia changes occur the most rapidly in spring, although over the last 40 years an acceleration of increases is also observed in autumn. Kivinen et al. [63] also observed a rapid increase in the frequency of exceptionally warm spring and autumn seasons and extremely warm days in April and October in Northern Fennoscandia in the last 20 years of their 100-year study period. In Scandinavia increases in heat extremes indices are relatively small in summer [62,63], while in the case of TXx even declines were noted, although summertime very severe ETEs in this region have been on the rise in recent decades. Most of the aforesaid declines were not statistically significant.
On the other hand, in Central Europe and Eastern Europe, it is summer changes that are the greatest, as observed over the last four decades in terms of the frequency of ETEs that increased by 9 to 10 days per 10 years, the highest value noted for all seasons and domains. A large acceleration in increases in extremes indices may be observed in these regions also in spring and, as in the case of Scandinavia, in autumn. This amplification of trends may indicate a gradual decline of autumn warming holes in these regions of Europe. Existing studies in Central Europe and Eastern Europe focus primarily on hot extremes in summer and remain in agreement that these extremes have been rapidly increasing in terms of frequency, intensity, and spatial range since the mid-20th century [47,48,49,53,54,55]. Considerable changes also occur in these two regions in winter [66]. Our results indicate that changes in winter manifest themselves particularly strongly in terms of a large increase in TXx as well as a substantially higher frequency of occurrence of very severe ETEs in recent decades.
In the domain encompassing the British Isles, Northern France, and Benelux countries as well as in Iberia increases in indices of hot and warm extremes are largest in spring and summer. The rate of increase is almost always higher in Iberia. The one exception to this rule is the largest among all seasons and domains rise in the intensity of summer ETEs and TXx in the “British” domain. Existing studies in this area show an increase in summer heatwaves and winter warm spells in the United Kingdom [58,59,65]. In contrast to the regions described earlier, the acceleration of trends in autumn across the two aforesaid domains over the last 40 years has not been that strong. Earlier studies in the Iberian Peninsula found increases in heat and warm indices for the summer season [61,62] and winter season [87], although the rate of change in winter was smaller [60].
A multifaceted analysis of long-term variances and trends in air temperature extremes, with a special focus on their intensity and spatial extent, was possible through the use of the Extremity Index (EI). The EI proved to be a useful tool for the analysis and evaluation of the severity of ETEs. The results obtained with its use are consistent with findings published in the literature. The advantages of EI include: (1) comparability of results between different geographic regions and seasons of the year, (2) facilitation of both an assessment of the severity of individual daily events as well as the aggregation of results and assessment of the severity of extremes on a monthly and seasonal basis, (3) facilitation of a spatial examination of ETEs, (4) consideration of the excess heat load that appears in the environment due to the occurrence of ETEs and which creates a burden on living organisms, ecosystems and human society in general, (5) simple algorithm and option to choose a severity threshold. The above characteristics suggest that this index may be useful in a broader context in future research.
Author Contributions
Conceptualization, A.S. and A.W.; methodology, A.S. and A.W.; formal analysis, A.S.; writing—original draft preparation, A.S.; writing—review and editing, A.W.; visualization, A.S. All authors have read and agreed to the published version of the manuscript.
Funding
This research was funded by the Jagiellonian University in Kraków, grant number N23/MNS/000023 and by the Polish Ministry of Science and Higher Education, subsidy for the University of Agriculture in Kraków for 2021.
Conflicts of Interest
The authors declare no conflict of interest. The funders had no role in the design of the study; in the collection, analyses, or interpretation of data; in the writing of the manuscript, or in the decision to publish the results.
References
- Hartmann, D.L.; Klein Tank, A.M.G.; Rusticucci, M.; Alexander, L.V.; Brönnimann, S.; Charabi, Y.; Dentener, F.J.; Dlugokencky, E.J.; Easterling, D.R.; Kaplan, A.; et al. Observations: Atmosphere and Surface. In Climate Change 2013: The Physical Science Basis. Contribution of Working Group I to the Fifth Assessment Report of the Intergovernmental Panel on Climate Change; Stocker, T.F., Qin, D., Plattner, G.-K., Tignor, M., Allen, S.K., Boschung, J., Nauels, A., Xia, Y., Bex, V., Midgley, P.M., Eds.; Cambridge University Press: Cambridge, UK; New York, NY, USA, 2013; pp. 159–254. [Google Scholar]
- Alexander, L.V.; Zhang, X.; Peterson, T.C.; Caesar, J.; Gleason, B.; Klein Tank, A.M.G.; Haylock, M.; Collins, D.; Trewin, B.; Rahimzadeh, F.; et al. Global observed changes in daily climate extremes of temperature and precipitation. J. Geophys. Res. Atmos. 2006, 111, 1–22. [Google Scholar] [CrossRef] [Green Version]
- Perkins-Kirkpatrick, S.E.; Lewis, S.C. Increasing trends in regional heatwaves. Nat. Commun. 2020, 11, 1–8. [Google Scholar] [CrossRef]
- Perkins, S.E. A review on the scientific understanding of heatwaves-Their measurement, driving mechanisms, and changes at the global scale. Atmos. Res. 2015, 164–165, 242–267. [Google Scholar] [CrossRef]
- Xu, Z.; FitzGerald, G.; Guo, Y.; Jalaludin, B.; Tong, S. Impact of heatwave on mortality under different heatwave definitions: A systematic review and meta-analysis. Environ. Int. 2016, 89–90, 193–203. [Google Scholar] [CrossRef]
- Baccini, M.; Biggeri, A.; Accetta, G.; Kosatsky, T.; Katsouyanni, K.; Analitis, A.; Anderson, H.R.; Bisanti, L.; D’Iippoliti, D.; Danova, J.; et al. Heat effects on mortality in 15 European cities. Epidemiology 2008, 19, 711–719. [Google Scholar] [CrossRef] [PubMed]
- D’Ippoliti, D.; Michelozzi, P.; Marino, C. The impact of heat waves on mortality in 9 European cities: Results from the Euro HEATproject. Environ. Health 2010, 9, 1–9. [Google Scholar] [CrossRef] [Green Version]
- Nardone, A.; Ronchi, B.; Lacetera, N.; Ranieri, M.S.; Bernabucci, U. Effects of climate changes on animal production and sustainability of livestock systems. Livest. Sci. 2010, 130, 57–69. [Google Scholar] [CrossRef]
- Vogel, E.; Donat, M.G.; Alexander, L.V.; Meinshausen, M.; Ray, D.K.; Karoly, D.; Meinshausen, N.; Frieler, K. The effects of climate extremes on global agricultural yields. Environ. Res. Lett. 2019, 14. [Google Scholar] [CrossRef]
- Zinzi, M.; Agnoli, S.; Burattini, C.; Mattoni, B. On the thermal response of buildings under the synergic effect of heat waves and urban heat island. Sol. Energy 2020, 211, 1270–1282. [Google Scholar] [CrossRef]
- McEvoy, D.; Ahmed, I.; Mullett, J. The impact of the 2009 heat wave on Melbourne’s critical infrastructure. Local Environ. 2012, 17, 783–796. [Google Scholar] [CrossRef]
- Rübbelke, D.; Vögele, S. Impacts of climate change on European critical infrastructures: The case of the power sector. Environ. Sci. Policy 2011, 14, 53–63. [Google Scholar] [CrossRef] [Green Version]
- Zander, K.K.; Botzen, W.J.W.; Oppermann, E.; Kjellstrom, T.; Garnett, S.T. Heat stress causes substantial labour productivity loss in Australia. Nat. Clim. Chang. 2015, 5, 647–651. [Google Scholar] [CrossRef]
- Pereira, M.G.; Trigo, R.M.; Da Camara, C.C.; Pereira, J.M.C.; Leite, S.M. Synoptic patterns associated with large summer forest fires in Portugal. Agric. For. Meteorol. 2005, 129, 11–25. [Google Scholar] [CrossRef]
- Ratnayake, H.U.; Kearney, M.R.; Govekar, P.; Karoly, D.; Welbergen, J.A. Forecasting wildlife die-offs from extreme heat events. Anim. Conserv. 2019, 22, 386–395. [Google Scholar] [CrossRef]
- Grimm, N.B.; Chapin, F.S.; Bierwagen, B.; Gonzalez, P.; Groffman, P.M.; Luo, Y.; Melton, F.; Nadelhoffer, K.; Pairis, A.; Raymond, P.A.; et al. The impacts of climate change on ecosystem structure and function. Front. Ecol. Environ. 2013, 11, 474–482. [Google Scholar] [CrossRef] [Green Version]
- Potopová, V.; Boroneanţ, C.; Možný, M.; Soukup, J. Driving role of snow cover on soil moisture and drought development during the growing season in the Czech Republic. Int. J. Climatol. 2016, 36, 3741–3758. [Google Scholar] [CrossRef] [Green Version]
- Beniston, M. Is snow in the Alps receding or disappearing? Wiley Interdiscip. Rev. Clim. Chang. 2012, 3, 349–358. [Google Scholar] [CrossRef] [Green Version]
- Gilaberte-Búrdalo, M.; López-Martín, F.; Pino-Otín, M.R.; López-Moreno, J.I. Impacts of climate change on ski industry. Environ. Sci. Policy 2014, 44, 51–61. [Google Scholar] [CrossRef] [Green Version]
- Bastos, A.; Ciais, P.; Friedlingstein, P.; Sitch, S.; Pongratz, J.; Fan, L.; Wigneron, J.P.; Weber, U.; Reichstein, M.; Fu, Z.; et al. Direct and seasonal legacy effects of the 2018 heat wave and drought on European ecosystem productivity. Sci. Adv. 2020, 6, 1–14. [Google Scholar] [CrossRef] [PubMed]
- Westerling, A.L.R. Increasing western US forest wildfire activity: Sensitivity to changes in the timing of spring. Philos. Trans. R. Soc. B Biol. Sci. 2016, 371. [Google Scholar] [CrossRef]
- Menzel, A.; Seifert, H.; Estrella, N. Effects of recent warm and cold spells on European plant phenology. Int. J. Biometeorol. 2011, 55, 921–932. [Google Scholar] [CrossRef]
- Flanigan, N.P.; Bandara, R.; Wang, F.; Jastrzębowski, S.; Hidayati, S.N.; Walck, J.L. Germination responses to winter warm spells and warming vary widely among woody plants in a temperate forest. Plant. Biol. 2020, 22, 1052–1061. [Google Scholar] [CrossRef]
- Ladwig, L.M.; Chandler, J.L.; Guiden, P.W.; Henn, J.J. Extreme winter warm event causes exceptionally early bud break for many woody species. Ecosphere 2019, 10. [Google Scholar] [CrossRef] [Green Version]
- Siegmund, J.F.; Wiedermann, M.; Donges, J.F.; Donner, R.V. Impact of temperature and precipitation extremes on the flowering dates of four German wildlife shrub species. Biogeosciences 2016, 13, 5541–5555. [Google Scholar] [CrossRef] [Green Version]
- Fox, N.; Jönsson, A.M. Climate effects on the onset of flowering in the United Kingdom. Environ. Sci. Eur. 2019, 31. [Google Scholar] [CrossRef]
- Vitasse, Y.; Rebetez, M. Unprecedented risk of spring frost damage in Switzerland and Germany in 2017. Clim. Chang. 2018, 149, 233–246. [Google Scholar] [CrossRef]
- Wypych, A.; Ustrnul, Z.; Sulikowska, A.; Chmielewski, F.M.; Bochenek, B. Spatial and temporal variability of the frost-free season in Central Europe and its circulation background. Int. J. Climatol. 2017, 37, 3340–3352. [Google Scholar] [CrossRef]
- Xie, Y.; Wang, X.; Wilson, A.M.; Silander, J.A. Predicting autumn phenology: How deciduous tree species respond to weather stressors. Agric. For. Meteorol. 2018, 250–251, 127–137. [Google Scholar] [CrossRef]
- Zani, P.A. Climate change trade-offs in the side-blotched lizard (Uta stansburiana): Effects of growing-season length and mild temperatures on winter survival. Physiol. Biochem. Zool. 2008, 81, 797–809. [Google Scholar] [CrossRef]
- Williams, C.M.; Henry, H.A.L.; Sinclair, B.J. Cold truths: How winter drives responses of terrestrial organisms to climate change. Biol. Rev. 2015, 90, 214–235. [Google Scholar] [CrossRef] [PubMed] [Green Version]
- Gallinat, A.S.; Primack, R.B.; Wagner, D.L. Autumn, the neglected season in climate change research. Trends Ecol. Evol. 2015, 30, 169–176. [Google Scholar] [CrossRef]
- Buckley, L.B.; Huey, R.B. Temperature extremes: Geographic patterns, recent changes, and implications for organismal vulnerabilities. Glob. Chang. Biol. 2016, 22, 3829–3842. [Google Scholar] [CrossRef]
- McDermott Long, O.; Warren, R.; Price, J.; Brereton, T.M.; Botham, M.S.; Franco, A.M.A. Sensitivity of UK butterflies to local climatic extremes: Which life stages are most at risk? J. Anim. Ecol. 2017, 86, 108–116. [Google Scholar] [CrossRef] [PubMed] [Green Version]
- Sutherst, R.W.; Constable, F.; Finlay, K.J.; Harrington, R.; Luck, J.; Zalucki, M.P. Adapting to crop pest and pathogen risks under a changing climate. Wiley Interdiscip. Rev. Clim. Chang. 2011, 2, 220–237. [Google Scholar] [CrossRef]
- Ma, C.-S.; Ma, G.; Pincebourde, S. Survive a Warming Climate: Insect Responses to Extreme High Temperatures. Annu. Rev. Entomol. 2021, 66, 1–22. [Google Scholar] [CrossRef]
- Pureswaran, D.S.; Roques, A.; Battisti, A. Forest insects and climate change. Curr. For. Rep. 2018, 4, 35–50. [Google Scholar] [CrossRef] [Green Version]
- Sánchez-Benítez, A.; García-Herrera, R.; Barriopedro, D.; Sousa, P.M.; Trigo, R.M. June 2017: The Earliest European Summer Mega-heatwave of Reanalysis Period. Geophys. Res. Lett. 2018, 45, 1955–1962. [Google Scholar] [CrossRef]
- Sulikowska, A.; Wypych, A. How unusualwere June 2019 temperatures in the context of european climatology? Atmosphere 2020, 11, 697. [Google Scholar] [CrossRef]
- Founda, D.; Varotsos, K.V.; Pierros, F.; Giannakopoulos, C. Observed and projected shifts in hot extremes’ season in the Eastern Mediterranean. Glob. Planet. Chang. 2019, 175, 190–200. [Google Scholar] [CrossRef]
- Brooke Anderson, G.; Bell, M.L. Heat waves in the United States: Mortality risk during heat waves and effect modification by heat wave characteristics in 43 U.S. communities. Environ. Health Perspect. 2011, 119, 210–218. [Google Scholar] [CrossRef] [PubMed] [Green Version]
- Bennet, L.; Halling, A.; Berglund, J. Increased incidence of Lyme borreliosis in southern Sweden following mild winters and during warm, humid summers. Eur. J. Clin. Microbiol. Infect. Dis. 2006, 25, 426–432. [Google Scholar] [CrossRef] [Green Version]
- Pokorná, L.; Kučerová, M.; Huth, R. Annual cycle of temperature trends in Europe, 1961–2000. Glob. Planet. Chang. 2018, 170, 146–162. [Google Scholar] [CrossRef]
- Lorenz, R.; Stalhandske, Z.; Fischer, E.M. Detection of a Climate Change Signal in Extreme Heat, Heat Stress, and Cold in Europe From Observations. Geophys. Res. Lett. 2019, 46, 8363–8374. [Google Scholar] [CrossRef] [Green Version]
- Morabito, M.; Crisci, A.; Messeri, A.; Messeri, G.; Betti, G.; Orlandini, S.; Raschi, A.; Maracchi, G. Increasing heatwave hazards in the southeastern European Union capitals. Atmosphere 2017, 8, 115. [Google Scholar] [CrossRef] [Green Version]
- Kyselý, J. Recent severe heat waves in central Europe: How to view them in a long-term prospect? Int. J. Climatol. 2010, 30, 89–109. [Google Scholar] [CrossRef]
- Tomczyk, A.M.; Bednorz, E. Heat waves in Central Europe and their circulation conditions. Int. J. Climatol. 2016, 36, 770–782. [Google Scholar] [CrossRef]
- Wypych, A.; Sulikowska, A.; Ustrnul, Z.; Czekierda, D. Temporal variability of summer temperature extremes in Poland. Atmosphere 2017, 8, 51. [Google Scholar] [CrossRef] [Green Version]
- Fenner, D.; Holtmann, A.; Krug, A.; Scherer, D. Heat waves in Berlin and Potsdam, Germany—Long-term trends and comparison of heat wave definitions from 1893 to 2017. Int. J. Climatol. 2019, 39, 2422–2437. [Google Scholar] [CrossRef]
- Graczyk, D.; Pińskwar, I.; Kundzewicz, Z.W.; Hov, Ø.; Førland, E.J.; Szwed, M.; Choryński, A. The heat goes on—Changes in indices of hot extremes in Poland. Theor. Appl. Climatol. 2017, 129, 459–471. [Google Scholar] [CrossRef] [Green Version]
- Unkašević, M.; Tošić, I. An analysis of heat waves in Serbia. Glob. Planet. Chang. 2009, 65, 17–26. [Google Scholar] [CrossRef]
- Corobov, R.; Sheridan, S.; Overcenco, A.; Terinte, N. Air temperature trends and extremes in Chisinau (Moldova) as evidence of climate change. Clim. Res. 2010, 42, 247–256. [Google Scholar] [CrossRef] [Green Version]
- Shevchenko, O.; Lee, H.; Snizhko, S.; Mayer, H. Long-term analysis of heat waves in Ukraine. Int. J. Climatol. 2014, 34, 1642–1650. [Google Scholar] [CrossRef]
- Spinoni, J.; Lakatos, M.; Szentimrey, T.; Bihari, Z.; Szalai, S.; Vogt, J.; Antofie, T. Heat and cold waves trends in the Carpathian Region from 1961 to 2010. Int. J. Climatol. 2015, 35, 4197–4209. [Google Scholar] [CrossRef] [Green Version]
- Croitoru, A.; Piticar, A.; Ciupertea, A.; Florina, C. Changes in heat waves indices in Romania over the period 1961–2015. Glob. Planet. Chang. 2016, 146, 109–121. [Google Scholar] [CrossRef]
- Popov, T.; Gnjato, S.; Trbić, G.; Ivanišević, M. Recent trends in extreme temperature indices in Bosnia and Herzegovina. Carpathian J. Earth Environ. Sci. 2018, 13, 211–224. [Google Scholar] [CrossRef]
- Busuioc, A.; Dobrinescu, A.; Birsan, M.V.; Dumitrescu, A.; Orzan, A. Spatial and temporal variability of climate extremes in Romania and associated large-scale mechanisms. Int. J. Climatol. 2015, 35, 1278–1300. [Google Scholar] [CrossRef]
- Chapman, S.C.; Watkins, N.W.; Stainforth, D.A. Warming Trends in Summer Heatwaves. Geophys. Res. Lett. 2019, 46, 1634–1640. [Google Scholar] [CrossRef] [Green Version]
- Sanderson, M.; Economou, T.; Salmon, K.; Jones, S. Historical Trends and Variability in Heat Waves in the United Kingdom. Atmosphere 2017, 8, 191. [Google Scholar] [CrossRef] [Green Version]
- Efthymiadis, D.; Goodess, C.M.; Jones, P.D. Trends in Mediterranean gridded temperature extremes and large-scale circulation influences. Nat. Hazards Earth Syst. Sci. 2011, 11, 2199–2214. [Google Scholar] [CrossRef]
- De Lima, M.I.P.; Santo, F.E.; Ramos, A.M.; de Lima, J.L.M.P. Recent changes in daily precipitation and surface air temperature extremes in mainland Portugal, in the period 1941–2007. Atmos. Res. 2013, 127, 195–209. [Google Scholar] [CrossRef]
- Tomczyk, A.M.; Piotrowski, P.; Bednorz, E. Warm spells in Northern Europe in relation to atmospheric circulation. Theor. Appl. Climatol. 2017, 128, 623–634. [Google Scholar] [CrossRef] [Green Version]
- Kivinen, S.; Rasmus, S.; Jylhä, K.; Laapas, M. Long-term climate trends and extreme events in northern Fennoscandia (1914–2013). Climate 2017, 5, 16. [Google Scholar] [CrossRef] [Green Version]
- Sui, C.; Yu, L.; Vihma, T. Occurrence and drivers of wintertime temperature extremes in Northern Europe during 1979–2016. Tellus Dyn. Meteorol. Oceanogr. 2020, 72, 1–19. [Google Scholar] [CrossRef]
- Chapman, S.C.; Murphy, E.J.; Stainforth, D.A.; Watkins, N.W. Trends in winter warm spells in the central England temperature record. J. Appl. Meteorol. Climatol. 2020, 59, 1069–1076. [Google Scholar] [CrossRef]
- Tomczyk, A.M.; Sulikowska, A.; Bednorz, E.; Półrolniczak, M. Atmospheric circulation conditions during winter warm spells in Central Europe. Nat. Hazards 2019, 96, 1413–1428. [Google Scholar] [CrossRef] [Green Version]
- Beniston, M. Warm winter spells in the Swiss Alps: Strong heat waves in a cold season? A study focusing on climate observations at the Saentis high mountain site. Geophys. Res. Lett. 2005, 32, 1–5. [Google Scholar] [CrossRef] [Green Version]
- Cornes, R.C.; van der Schrier, G.; van den Besselaar, E.J.M.; Jones, P.D. An Ensemble Version of the E-OBS Temperature and Precipitation Data Sets. J. Geophys. Res. Atmos. 2018, 123, 9391–9409. [Google Scholar] [CrossRef] [Green Version]
- Huth, R.; Beck, C.; Philipp, A.; Demuzere, M.; Ustrnul, Z.; Cahynová, M.; Kyselý, J.; Tveito, O.E. Classifications of atmospheric circulation patterns: Recent advances and applications. Ann. N. Y. Acad. Sci. 2008, 1146, 105–152. [Google Scholar] [CrossRef] [PubMed]
- Philipp, A.; Bartholy, J.; Beck, C.; Erpicum, M.; Esteban, P.; Fettweis, X.; Huth, R.; James, P.; Jourdain, S.; Kreienkamp, F.; et al. Cost733cat—A database of weather and circulation type classifications. Phys. Chem. Earth 2010, 35, 360–373. [Google Scholar] [CrossRef]
- Sulikowska, A.; Wypych, A. Summer temperature extremes in Europe: How does the definition affect the results? Theor. Appl. Climatol. 2020, 141, 19–30. [Google Scholar] [CrossRef] [Green Version]
- Stefanon, M.; Dandrea, F.; Drobinski, P. Heatwave classification over Europe and the Mediterranean region. Environ. Res. Lett. 2012, 7, 1–9. [Google Scholar] [CrossRef]
- Russo, S.; Sillmann, J.; Fischer, E.M. Top ten European heatwaves since 1950 and their occurrence in the coming decades. Environ. Res. Lett. 2015, 10, 124003. [Google Scholar] [CrossRef]
- World Meteorological Organization. WMO Guidelines on the Calculation of Climate Normals; WMO Technical Report No. 1203; WMO: Geneva, Switzerland, 2017; pp. 1–101. [Google Scholar]
- Hijmans, R.J. Raster: Geographic Data Analysis and Modeling. R Package Version 3.4-13. Available online: https://CRAN.R-project.org/package=raster (accessed on 20 July 2020).
- The R Project for Statistical Computing. Available online: https://www.r-project.org/ (accessed on 7 May 2021).
- Kyselý, J. Temporal fluctuations in heat waves at Prague-Klementinum, The Czech Republic, from 1901–97, and their relationships to atmospheric circulation. Int. J. Climatol. 2002, 22, 33–50. [Google Scholar] [CrossRef]
- Nairn, J.; Fawcett, R. Defining Heatwaves: Heatwave Defined as a Heat-Impact Event Servicing All Community and Business Sectors in Australia; CAWCR Technical Report No. 060; The Centre for Australian Weather and Climate Research—A partnership between CSIRO and the Bureau of Meteorology: Melbourne, Australia, 2013; p. 96. ISBN 9781922173126. Available online: https://www.cawcr.gov.au/static/technical-reports/CTR_060.pdf (accessed on 7 May 2021).
- Sen, P.K. Estimates of the Regression Coefficient Based on Kendall’s Tau. J. Am. Stat. Assoc. 1968, 63, 1379–1389. [Google Scholar] [CrossRef]
- Evans, J.S. Spatialeco. R Package Version 1.3-2. Available online: https://CRAN.R-project.org/package=spatialEco (accessed on 20 August 2020).
- Pohlert, T. Trend. R Package Version 1.1.4. Available online: https://cran.r-project.org/web/packages/trend/index.html (accessed on 20 March 2021).
- Papalexiou, S.M.; AghaKouchak, A.; Trenberth, K.E.; Foufoula-Georgiou, E. Global, Regional, and Megacity Trends in the Highest Temperature of the Year: Diagnostics and Evidence for Accelerating Trends. Earth’s Future 2018, 6, 71–79. [Google Scholar] [CrossRef]
- Wibig, J. Hot Days and Heat Waves in Poland in the Period 1951–2019 and the Circulation Factors Favoring the Most Extreme of Them. Atmosphere 2021, 12, 340. [Google Scholar] [CrossRef]
- Perkins-Kirkpatrick, S.E.; Gibson, P.B. Changes in regional heatwave characteristics as a function of increasing global temperature. Sci. Rep. 2017, 7, 1–12. [Google Scholar] [CrossRef]
- Rahmstorf, S.; Coumou, D. Increase of extreme events in a warming world. Proc. Natl. Acad. Sci. USA 2011, 108. [Google Scholar] [CrossRef] [PubMed] [Green Version]
- Cardell, M.F.; Amengual, A.; Romero, R.; Ramis, C. Future extremes of temperature and precipitation in Europe derived from a combination of dynamical and statistical approaches. Int. J. Climatol. 2020, 40, 4800–4827. [Google Scholar] [CrossRef]
- López-Moreno, J.I.; El-Kenawy, A.; Revuelto, J.; Azorin-Molina, C.; Moran-Tejeda, E.; Lorenzo-Lacruz, J.; Zabalza, J.; Vincente-Serrano, S.M. Observed trends and future projections for winter warm events in the Ebro basin, northeast Iberian Peninsula. Int. J. Climatol. 2014, 34, 49–60. [Google Scholar] [CrossRef] [Green Version]
Figure 1.
Spatial domains used in the study. Meaning of acronyms: SC—Western Scandinavia, BR—the British Isles, Northern France and Benelux, CE—Central Europe, EE—Eastern Europe, IB—Iberia and the Western Mediterranean (see text for details).
Figure 1.
Spatial domains used in the study. Meaning of acronyms: SC—Western Scandinavia, BR—the British Isles, Northern France and Benelux, CE—Central Europe, EE—Eastern Europe, IB—Iberia and the Western Mediterranean (see text for details).

Figure 2.
Spatial distribution (a,c,e,g) of maximum air temperature trends on the warmest day of the season (TXx) and (b,d,f,h) their statistical significance at α = 0.05 in the study period. For an explanation of acronyms see Figure 1.
Figure 2.
Spatial distribution (a,c,e,g) of maximum air temperature trends on the warmest day of the season (TXx) and (b,d,f,h) their statistical significance at α = 0.05 in the study period. For an explanation of acronyms see Figure 1.

Figure 3.
Average number of extreme temperature events (ETEs) in each domain in every season of the year during the study period. For an explanation of acronyms see Figure 1.
Figure 3.
Average number of extreme temperature events (ETEs) in each domain in every season of the year during the study period. For an explanation of acronyms see Figure 1.

Figure 4.
Variation in the values of (a,d,g,j) the Extremity Index, (b,e,h,k) Total Intensity, and (c,f,i,l) Total Area of ETEs in the studied spatial domains with respect to the seasons of the year (in columns) (1950–2019 and 1950/1951–2019/2020 for winters). The “box” represents the interquartile range (IQR) that contains the middle 50% of results. Whiskers denote “maximum” and “minimum” values, which are the highest and lowest data points, excluding outliers. The “maximum” is defined as Q3 + 1.5*IQR, while the “minimum” is defined as Q1 – 1.5*IQR. Values found either above or below the “maximum” and “minimum”, as defined in this paper, are considered outliers. For an explanation of acronyms see Figure 1.

Figure 5.
Long term pattern of EI totals (°C) in all the studied domains along with a five-element Gauss smoothing filter in the (a) winter, (b) spring, (c) summer, (d) autumn. Average EI totals are shown for each domain examined in the study period. For an explanation of acronyms see Figure 1.
Figure 5.
Long term pattern of EI totals (°C) in all the studied domains along with a five-element Gauss smoothing filter in the (a) winter, (b) spring, (c) summer, (d) autumn. Average EI totals are shown for each domain examined in the study period. For an explanation of acronyms see Figure 1.

Figure 6.
Number of very severe extreme heat events (ETEs) in subsequent decades in spatial domains: (a) Western Scandinavia, (b) the British Isles, Northern France and Benelux, (c) Central Europe, (d) Eastern Europe, (e) Iberia and the Western Mediterranean, relative to the seasons of the year.
Figure 6.
Number of very severe extreme heat events (ETEs) in subsequent decades in spatial domains: (a) Western Scandinavia, (b) the British Isles, Northern France and Benelux, (c) Central Europe, (d) Eastern Europe, (e) Iberia and the Western Mediterranean, relative to the seasons of the year.


Table 1.
Trend data for the average areal maximum air temperature (TX) and average maximum air temperature on the warmest day of the season (TXx) in each studied spatial domain during the study period (°C per 10 years). The average areal TX trend is statistically significant at α = 0.05 for all the studied domains and seasons. The statistical significance of TXx trends is denoted on appropriate maps (Figure 2). For an explanation of acronyms see Figure 1.
| Variable | Season | Spatial Domain | ||||
|---|---|---|---|---|---|---|
| SC | BR | CE | EE | IB | ||
| Average areal TX trend | winter | 0.4 | 0.3 | 0.3 | 0.4 | 0.3 |
| spring | 0.3 | 0.3 | 0.4 | 0.5 | 0.4 | |
| summer | 0.2 | 0.3 | 0.4 | 0.3 | 0.4 | |
| autumn | 0.2 | 0.2 | 0.2 | 0.2 | 0.3 | |
| Average TXx trend | winter | 0.2 | 0.2 | 0.4 | 0.4 | 0.3 |
| spring | 0.5 | 0.3 | 0.3 | 0.2 | 0.4 | |
| summer | 0.2 | 0.5 | 0.4 | 0.3 | 0.4 | |
| autumn | 0.3 | 0.2 | 0.0 | 0.1 | 0.3 | |
Table 2.
Characteristics of seasons of the year with the highest totals of the Extremity Index (EI) in the study period—number of extreme temperature events (ETEs), average total intensity (average TI), and average total area affected (average TA). For an explanation of acronyms see Figure 1.
Table 2.
Characteristics of seasons of the year with the highest totals of the Extremity Index (EI) in the study period—number of extreme temperature events (ETEs), average total intensity (average TI), and average total area affected (average TA). For an explanation of acronyms see Figure 1.
| Season | Spatial Domain | Year | EI Total (°C) | Number of ETEs | Average TI (°C) | Average TA |
|---|---|---|---|---|---|---|
| winter | SC | 1989/1990 | 25.5 | 35 | 1.4 | 0.38 |
| BR | 2018/2019 | 32.0 | 32 | 1.4 | 0.51 | |
| CE | 1989/1990 | 61.2 | 47 | 2.1 | 0.53 | |
| EE | 2006/2007 | 54.4 | 49 | 2.0 | 0.47 | |
| IB | 2019/2020 | 30.4 | 48 | 1.4 | 0.37 | |
| spring | SC | 2007 | 44.3 | 31 | 2.1 | 0.53 |
| BR | 2011 | 39.4 | 43 | 1.8 | 0.43 | |
| CE | 2018 | 30.5 | 44 | 1.6 | 0.38 | |
| EE | 2014 | 38.6 | 37 | 2.0 | 0.43 | |
| IB | 2017 | 54.4 | 53 | 2.0 | 0.45 | |
| summer | SC | 2018 | 40.2 | 42 | 1.9 | 0.42 |
| BR | 1976 | 50.6 | 45 | 1.8 | 0.39 | |
| CE | 2015 | 63.0 | 51 | 2.1 | 0.51 | |
| EE | 2010 | 107.6 | 65 | 2.7 | 0.53 | |
| IB | 2003 | 71.9 | 64 | 1.9 | 0.47 | |
| autumn | SC | 2006 | 29.9 | 45 | 1.5 | 0.38 |
| BR | 2011 | 26.0 | 40 | 1.3 | 0.37 | |
| CE | 2018 | 28.6 | 40 | 1.8 | 0.38 | |
| EE | 2010 | 38.0 | 29 | 2.1 | 0.46 | |
| IB | 2017 | 31.1 | 36 | 1.6 | 0.47 |
Table 3.
Trends for Extremity Index (EI) seasonal totals, extreme temperature event (ETE) frequency, average total area (TA) affected by extreme temperatures during an ETE, and average total intensity (TI) of an ETE for two time periods: (1) a long period consisting of the period 1950–2019 (1950/1951–2019/2020 for winters), (2) a short period consisting of the period 1980–2019 (1980/1981–2019/2020 for winters). A color scale is assigned to every variable for the purpose of coherence between the two analyzed time periods. Statistically significant trends (α = 0.05) are shown in bold. For an explanation of acronyms see Figure 1.
| Variable | Season | Time Period and Spatial Domain | |||||||||
|---|---|---|---|---|---|---|---|---|---|---|---|
| 1950–2019 | 1980–2019 | ||||||||||
| SC | BR | CE | EE | IB | SC | BR | CE | EE | IB | ||
| EI seasonal totals (°C per 10 yrs) | winter | 0.8 | 0.9 | 1.5 | 1.3 | 1.2 | 1.4 | 1.9 | 2.1 | 2.0 | 1.8 |
| spring | 2.0 | 1.5 | 1.2 | 1.8 | 2.4 | 4.2 | 3.1 | 3.4 | 4.8 | 5.2 | |
| summer | 0.7 | 1.6 | 2.4 | 1.7 | 2.7 | 1.9 | 3.3 | 6.7 | 6.1 | 5.0 | |
| autumn | 0.8 | 1.0 | 1.2 | 1.2 | 0.9 | 2.3 | 1.5 | 3.0 | 3.5 | 1.8 | |
| ETE frequency (days per 10 yrs) | winter | 2.0 | 2.4 | 2.2 | 2.2 | 2.4 | 2.6 | 4.0 | 3.1 | 4.1 | 4.2 |
| spring | 2.6 | 2.2 | 2.4 | 2.2 | 3.4 | 4.8 | 3.9 | 5.3 | 5.3 | 7.1 | |
| summer | 1.0 | 2.2 | 4.0 | 3.3 | 4.6 | 1.3 | 2.6 | 9.4 | 10.0 | 7.2 | |
| autumn | 1.6 | 1.9 | 1.9 | 1.7 | 2.1 | 4.0 | 2.4 | 3.8 | 4.0 | 3.5 | |
| mean TA | winter | 0.00 | 0.01 | 0.02 | 0.02 | 0.02 | 0.02 | 0.01 | 0.01 | 0.00 | 0.01 |
| spring | 0.02 | 0.01 | 0.01 | 0.02 | 0.02 | 0.03 | 0.02 | 0.03 | 0.05 | 0.02 | |
| summer | 0.01 | 0.02 | 0.01 | 0.01 | 0.02 | 0.03 | 0.02 | 0.03 | 0.04 | 0.02 | |
| autumn | 0.01 | 0.01 | 0.01 | 0.02 | 0.01 | 0.01 | 0.01 | 0.03 | 0.04 | 0.01 | |
| mean TI (°C per 10 yrs) | winter | 0.01 | 0.04 | 0.05 | 0.06 | 0.03 | 0.02 | 0.06 | 0.08 | 0.12 | 0.02 |
| spring | 0.07 | 0.05 | 0.03 | 0.06 | 0.08 | 0.15 | 0.10 | 0.13 | 0.20 | 0.16 | |
| summer | 0.03 | 0.12 | 0.08 | 0.04 | 0.07 | 0.12 | 0.26 | 0.13 | 0.10 | 0.14 | |
| autumn | 0.02 | 0.05 | 0.05 | 0.09 | 0.05 | 0.06 | 0.08 | 0.13 | 0.18 | 0.09 | |
Publisher’s Note: MDPI stays neutral with regard to jurisdictional claims in published maps and institutional affiliations. |
© 2021 by the authors. Licensee MDPI, Basel, Switzerland. This article is an open access article distributed under the terms and conditions of the Creative Commons Attribution (CC BY) license (https://creativecommons.org/licenses/by/4.0/).
Share and Cite
MDPI and ACS Style
Sulikowska, A.; Wypych, A. Seasonal Variability of Trends in Regional Hot and Warm Temperature Extremes in Europe. Atmosphere 2021, 12, 612. https://0-doi-org.brum.beds.ac.uk/10.3390/atmos12050612
AMA Style
Sulikowska A, Wypych A. Seasonal Variability of Trends in Regional Hot and Warm Temperature Extremes in Europe. Atmosphere. 2021; 12(5):612. https://0-doi-org.brum.beds.ac.uk/10.3390/atmos12050612
Chicago/Turabian StyleSulikowska, Agnieszka, and Agnieszka Wypych. 2021. "Seasonal Variability of Trends in Regional Hot and Warm Temperature Extremes in Europe" Atmosphere 12, no. 5: 612. https://0-doi-org.brum.beds.ac.uk/10.3390/atmos12050612
Note that from the first issue of 2016, this journal uses article numbers instead of page numbers. See further details here.