
Aerosol Optical Properties around the East China Seas Based on AERONET Measurements
by
 , and
, and
Qianguang Tu
1,2,*, 
Zengzhou Hao
2,
Yunwei Yan
2,
Bangyi Tao
2,*,
Chuyong Chung
3 and
Sumin Kim
3 1
School of Surveying and Municipal Engineering, Zhejiang University of Water Resources and Electric Power, Hangzhou 310018, China
2
State Key Laboratory of Satellite Ocean Environment Dynamics, Second Institute of Oceanography, Ministry of Natural Resources, Hangzhou 310012, China
3
National Institute of Meteorological Sciences, Korea Meteorological Administration, Seogwipo-si 63568, Korea
*
Authors to whom correspondence should be addressed.
Atmosphere 2021, 12(5), 642; https://0-doi-org.brum.beds.ac.uk/10.3390/atmos12050642
Submission received: 31 March 2021
/
Revised: 29 April 2021
/
Accepted: 13 May 2021
/
Published: 18 May 2021
(This article belongs to the Special Issue Atmospheric Aerosol Optical Properties)
Abstract
:Understanding aerosols optical properties over the oceans is vital for enhancing our knowledge of aerosol effects on climate and pollutant transport between continents. In this study, the characteristics of aerosol optical thickness (AOT) at 500 nm (), Ångström exponent for the wavelength pair 440–870 nm (α) and volume size distribution (VSD), are presented and analyzed over the East China seas based on the observations at four AERONET sites during 1999–2019. The main results are: (1) the mean (α) value ranged from 0.31 to 0.36 (1.17–1.31); (2) the distribution of (α) is similar to a log-normal distribution with a right-skewed long tail larger than 0.5 (closer to the normal distribution); (3) large AOT () was frequently observed in summer (June and July) and spring (March to May), followed by autumn and winter; (4) all aerosol types were observed, and urban/industrial aerosols and mixed types were dominant throughout the period. The atmospheric column aerosol was characterized by a bimodal lognormal size distribution with a fine mode at effective radius, Reff = 0.16 ± 0.01 μm, and coarse mode at Reff = 2.05 ± 0.1 μm.
1. Introduction
Aerosols over the oceans are important for various atmospheric processes and remote sensing studies [1]. As one of the main components of the ocean-atmosphere system, aerosols can influence the regional and global climate change in the following three categories. Firstly, aerosols affect the radiative balance of the earth–atmosphere system through direct scattering and absorbing of solar and thermal radiation [2]. Secondly, aerosols act as cloud condensation nuclei and interact with clouds, which change the microscopic and macroscopic characteristics of the clouds, and then affect the weather and climate indirectly. Thirdly, aerosol particles also affect atmospheric chemical processes, changing other atmospheric components such as greenhouse gases. Additionally, the deposition of atmospheric aerosols into the oceans takes a large amount of micro- and macro-nutrients that are important components of biogeochemical cycles and fertilization of the oceans [3]. Continuous research on the physical and chemical properties of aerosol are critical for a better understanding of its role in climate change at the regional and global scales.
The optical characteristics of aerosols are essential for its monitoring and observation since they are usually taken as input parameters to the radiation calculations and climate predictions. However, high levels of uncertainty exist in aerosols optical characteristics across time and space [4]. Sea salt particles originated from the ocean surface are traditionally considered as a major impacting factor of aerosols over the open ocean. However, for the coastal regions such as the East China Seas, impacts from land sources and human emissions cannot be ignored [5]. Anthropogenic aerosols refer to aerosols produced by human activities—such as industrial emissions, urban traffic pollution, and municipal construction. These aerosols are composed of substances with different shapes, size distributions, chemical compositions, and optical properties with concentrations varying multiple orders of magnitude. The optical properties of aerosols are heavily dependent on their size distribution. For example, the change of relative humidity may lead to a variation of single scattering albedo and asymmetry factor for the water-soluble aerosol [6]. Therefore, understanding the size distribution of aerosols will improve our understanding of their environmental impacts and radiative effects. It is also the basis for satellite remote sensing retrieval and validation because the accuracy of atmospheric correction algorithms depends on the aerosol models.
Nowadays, aerosol optical properties are mainly obtained through ground-based remote sensing. The sun-sky radiometer CE-318 is the most common ground-based remote sensing instrument. It has been widely deployed around the world and established via AERONET (AErosol RObotic NETwork) [7], SKYNET [8], and SONET (Sun-Sky Radiometer Observation Network) [9], and so on. The aerosol optical properties were investigated based on these aerosol observation networks and ship-based observation over the open oceans as well as inland seas and coastal areas [10,11,12], including the Central Pacific, the Atlantic, the northern Indian Ocean, and the Eastern Mediterranean Sea.
Previous studies usually focus on the aerosol properties over the land surface. There were currently few studies focused on aerosol features over the China Seas [5,13]. The optical characteristics over the East China seas used to be investigated based on ship observation using a handheld sun photometer Microtop II in the spring of 2003 [14]. Recently, the maritime aerosol properties in the South China Sea were also analyzed using two AERONET sites [12]. However, the knowledge about the long-term variation of aerosol optical properties over the East China seas still remains unclear and limits the application of satellite data in these regions. In this study, the characteristics of aerosol optical thickness (AOT), Ångström exponent (AE), and volume size distribution (VSD) are presented and analyzed over the East China seas based on the observations at four AERONET sites during 1999–2019.
2. Study Area and Sites
The East China Seas are the marginal seas of East Asia, which are important sources of natural and anthropogenic aerosols. The complex physical, socio-economic and biological geography as well as the complicated monsoon climate play an important role in the combined effect of the properties and distribution of aerosols. Dust aerosols are usually transported from desert and arid Asian lands, which also push air pollutants out of the continents to the downstream area in springtime [15]. Therefore, aerosols over the coastal waters are generally complex mixtures of various aerosol components originated from different sources. Understanding the aerosol optical and microphysical properties is vital to enhancing our knowledge regarding Asian aerosols and their roles in climate change.
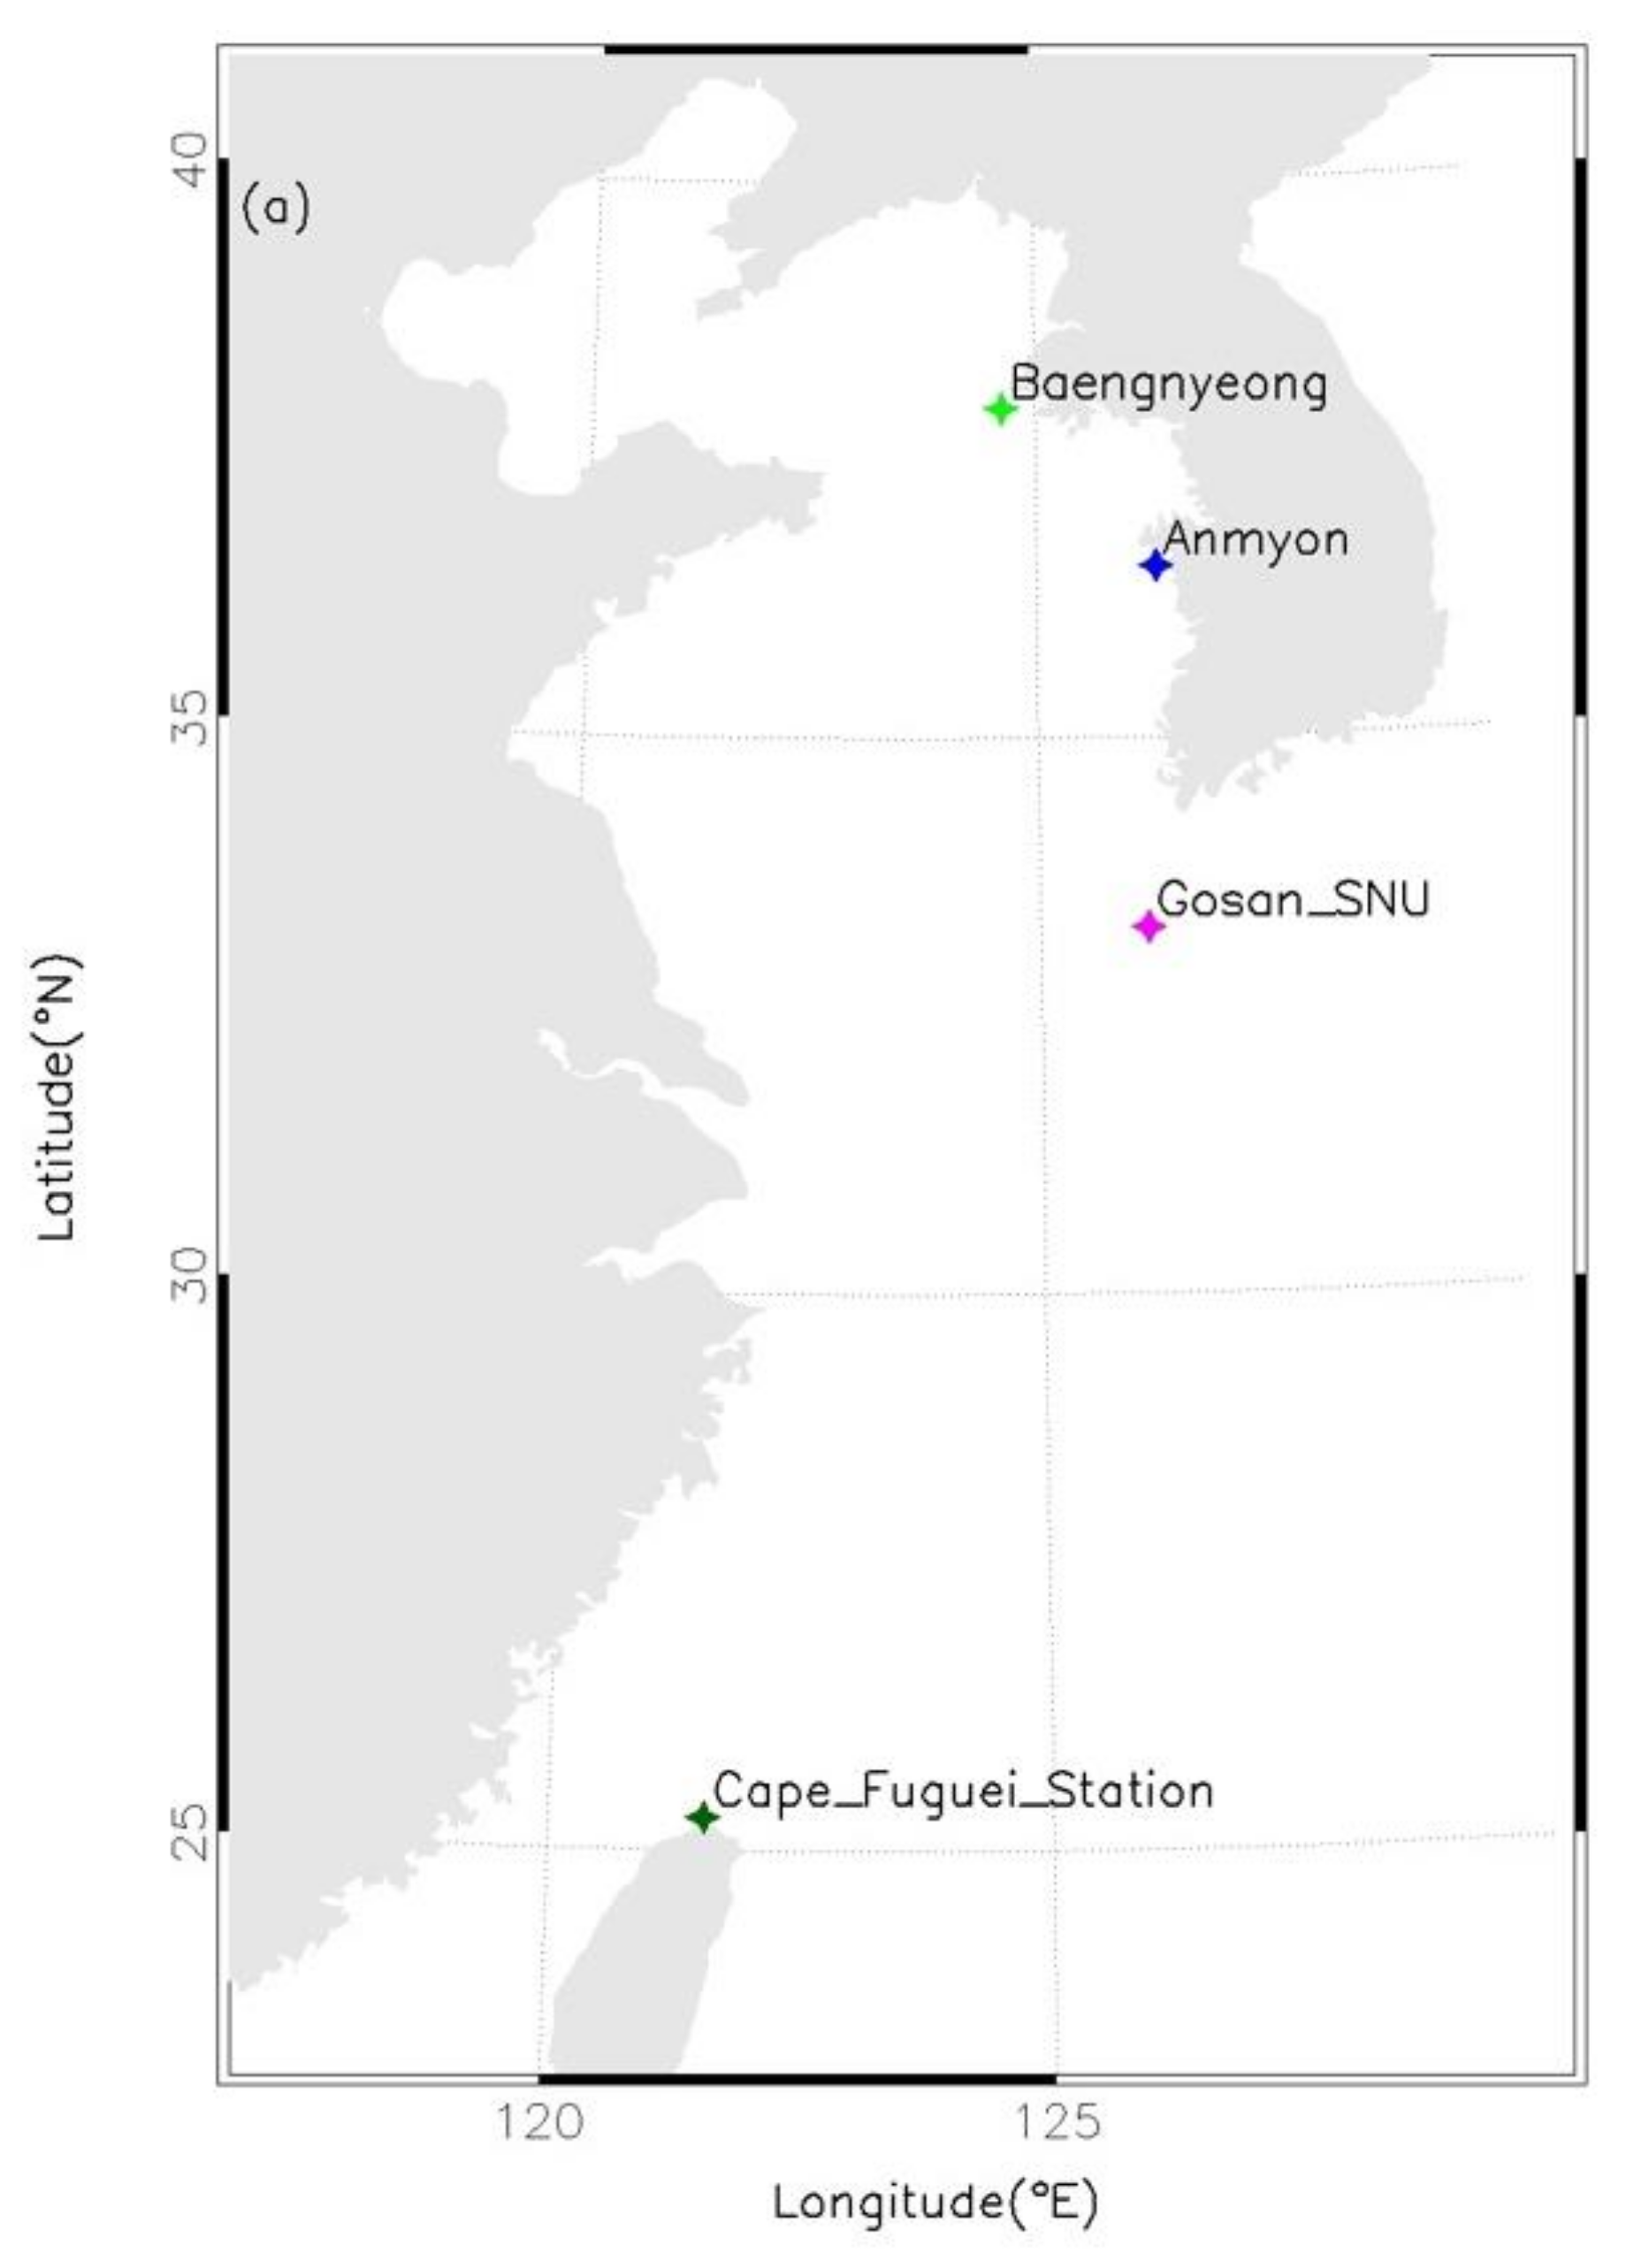
In this study, four AERONET sites over the East China seas are selected based on their distinct representativeness, including sites over the Yellow Sea (Baengnyeong and Anmyon) and the East China Sea (Gosan_SNU and Cape_Fuguei_Station). The Yellow Sea and the East China Sea are located in the east of China, which is also called the East China Seas (ECS), located in the downwind from the continent. The ECS is influenced both by the winter northwest monsoon and summer southeast monsoon. Baengnyeong is the northernmost and westernmost island of South Korea and is about 200 km east of Seoul. Anmyon Island locates at the western coast of South Korea. The rural aerosols dominate this site, while it is also affected by serious air pollutant transported from Asian lands sometimes. Gosan_SNU site locates in the southwest of Jeju Island of South Korea, where air quality is usually good. However, the aerosol concentrations of Gosan_SNU site would increase at times when strong dust storms or air pollution break out at the continent under considerable metrological conditions. Cape_Fuguei_station is located at the northern tip of Taiwan, and it receives long range transport from the main continental land. Figure 1 shows the locations of these sites and Table 1 supplements some necessary details.
3. Data and Theoretical Background
3.1. Data Collection
AERONET is an aerosol monitoring network established by the United States National Aeronautics and Space Administration (NASA) and the French National Center for Scientific Research (CNRS). It is composed of hundreds of automatic sun-sky radiometer CE-318 worldwide. The direct sun measurements at spectral channels 340, 380, 440, 500, 675, 870, 1020, and 1640 nm are used for AOT rederived. Another direct sun measurement channel at the water vapor absorption band 936 nm is used to retrieve the total precipitable water vapor content [16]. The full width at half the maximum of each channel varies from 2 nm (UV channels) to 10 nm (other channels). The sky radiance is measured by two modes: PP (principal plane) scanning and ALM (ALMucantar) scanning. PP keeps the azimuth angle constant while the zenith angles change. Thus, it is easy to obtain a larger scattering angle at noon. ALM consists of measuring the sky radiance in aerosol channels, in the azimuth plane with a zenith angle of view equal to the solar zenith angle. The main advantage is that it can use the symmetry of observation to do the cloud screening, which ensures data quality. More details about the instrument are described in [17].
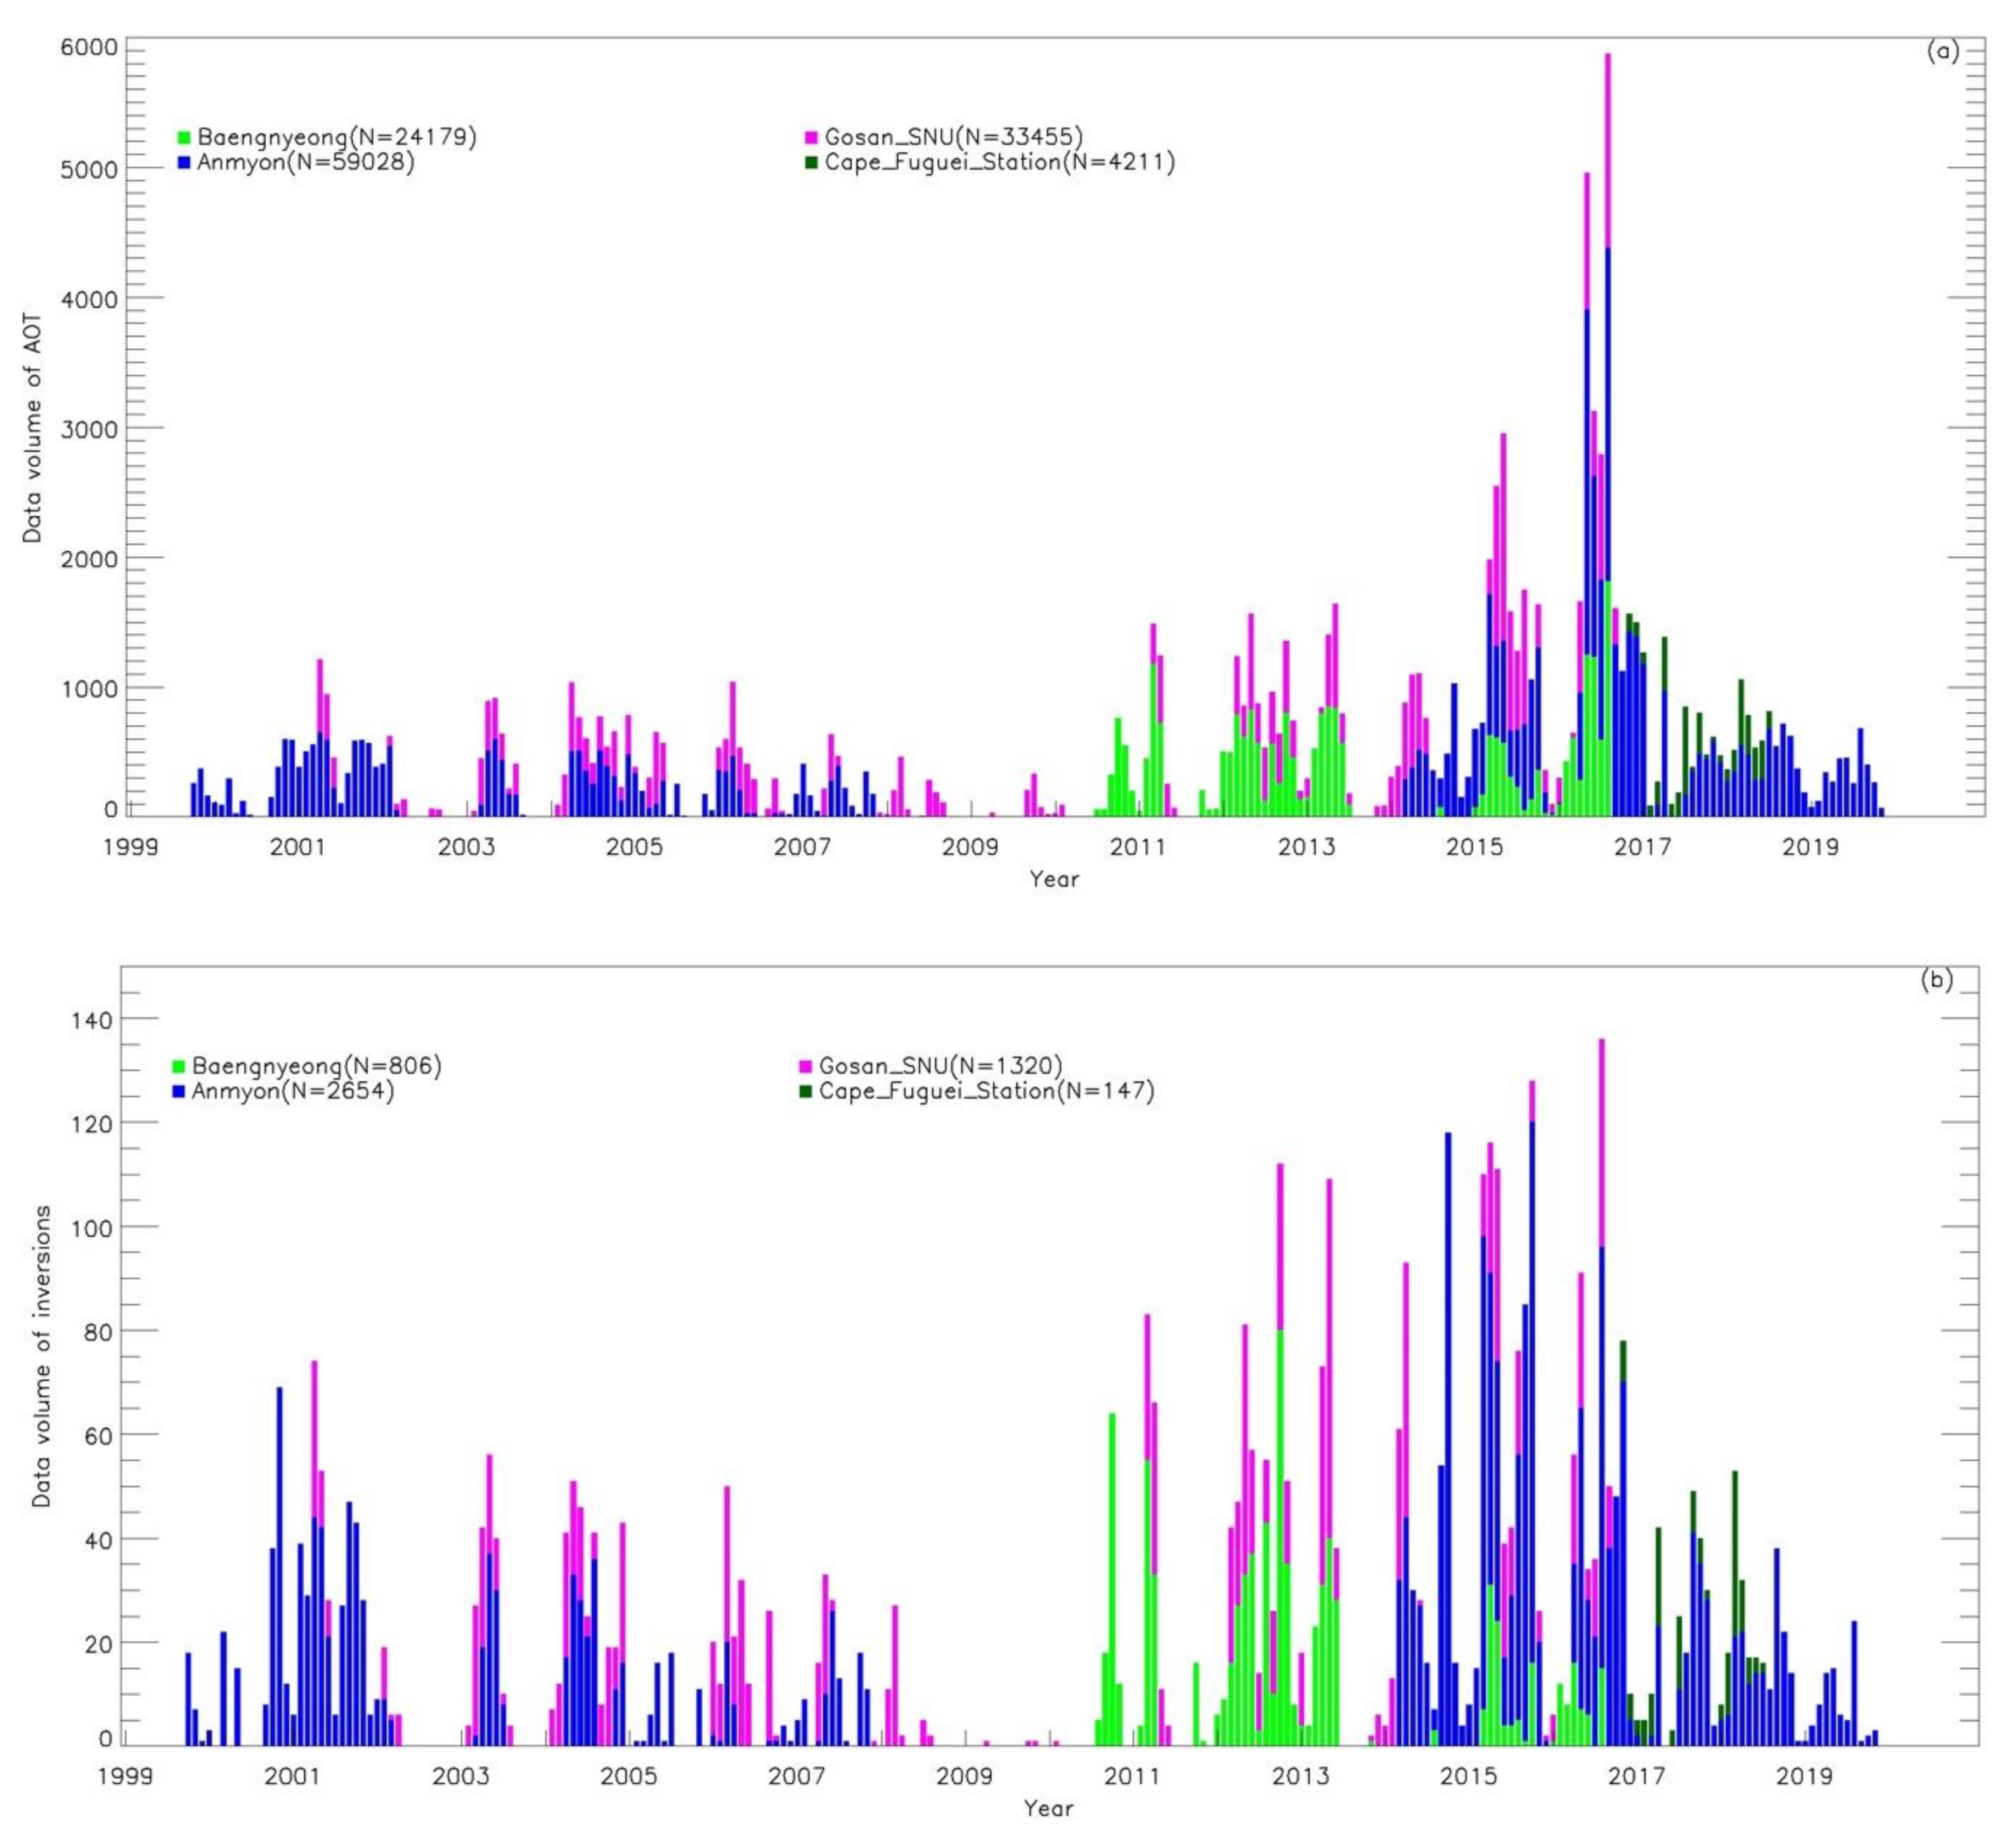
The total uncertainty in spectral AOT is within 0.01–0.02 and the calibrated sky radiance measurements typically have an uncertainty less than 5% [17]. AERONET products usually include three levels. Level 1.0 is the raw data with instrument calibrated and corrected. Level 1.5 refers to level 1.0 with automatic cloud-screening. Level 2.0 has the additional postal calibration and manual checking. The histogram distribution of the monthly Level 2.0 data volume for AOT and aerosol inversions for each site used in this study are shown in Figure 2a,b. There is a significant amount of data accumulated for these AERONET sites (see the values of N in the legend). The AOT are calculated from the direct sun radiance measurements, and the aerosol inversions are derived from both the sun and sky radiance measurements. The number of measurements of valid sky radiance is far less than the sun radiance. Therefore, the number of inversion data is very limited in all the selected sites with respect to the AOT.
3.2. Theoretical Background
The direct measurements of sun-photometer can be used to calculate the AOT and the AE (α). According to the Beer–Lambert–Bourger law, the measured spectral voltage of the sun radiometer on the ground at the narrow wavelength λ can be expressed as
where is the calibration coefficient of the instrument, which is related to the irradiance at the top of the atmosphere; is a correction factor for the distance between the sun and the earth, and m is the optical air mass, which is the function of the solar zenith angle. By these means, the total optical thickness of the atmospheric column can be calculated from Equation (1), and then the aerosol optical thickness can be obtained after subtracting Rayleigh scattering and gas molecular absorption components
where is the Rayleigh optical thickness caused by molecular scattering and the gas optical thickness caused by gas absorption. They are calculated from the knowing refractive index, absorption cross section, and number density.
The Ångström exponent α is generally used to describe the relationship between the AOT and the wavelength. When the aerosol particle size distribution is close to the Junge distribution
where β is the Ångström turbidity coefficient and the Ångström exponent α is defined as the slope of a wavelength pair on log scale as
In this study, the wavelength pair (440 nm, 870 nm) is selected. Ångström exponent α reflect the size distribution of aerosols. Smaller α correspond to larger particles (such as sea salt and dust aerosols), while larger α correspond to polluted air masses containing sub-micron particles (such as sulfates, nitrates, and carbonaceous aerosol) [18].
The volume size distribution is an important AERONET inversion product which represent the aerosol particle size distribution in a multi-modal log-normal form as
where i is the index of log-normal aerosol mode and n is the number of the modes, for each mode, is the volume concentration of the aerosol particle, is the geometric mean radius, is the geometric standard deviation, r is the particle radius. The volume size distribution consists of different types of aerosols and reflects the variation of aerosols through advection transport and convective sedimentation impacted by different meteorological conditions [19].
4. Results and Discussion
4.1. Overall Statistics
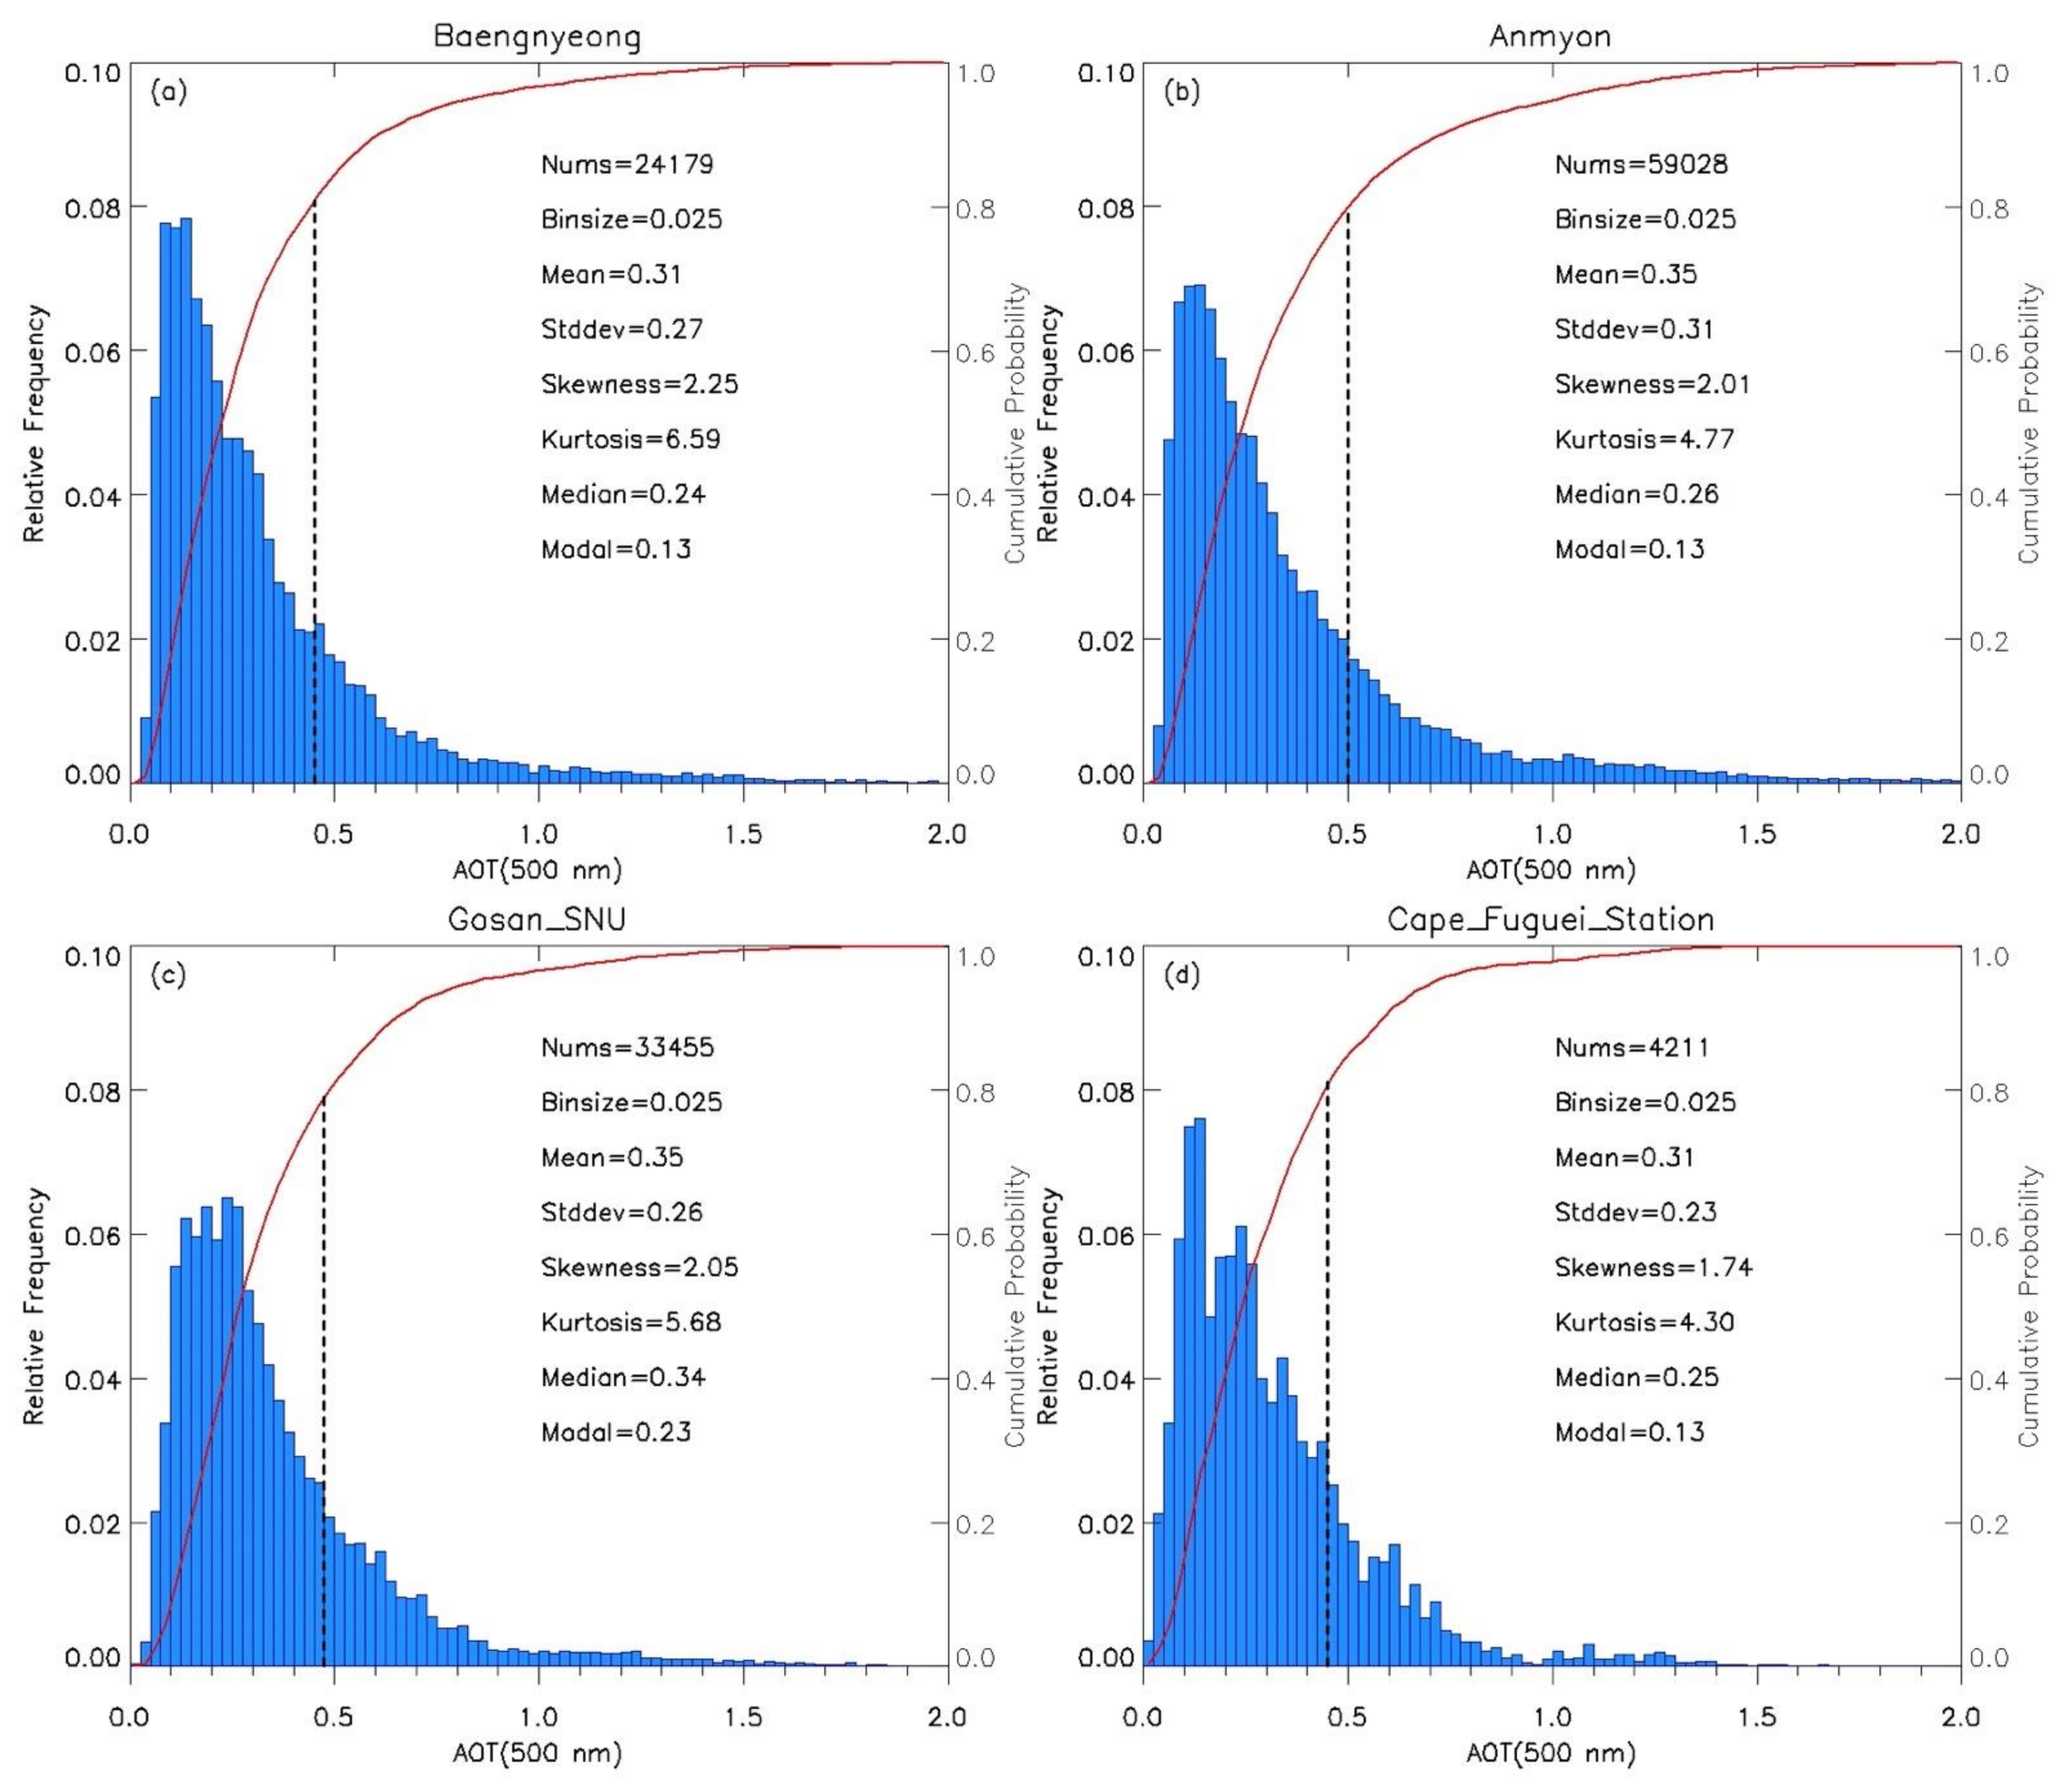
Figure 3 shows the frequency of occurrence distribution of the four sites with AOT at 500 nm (). A bin size value of 0.025 is used to generate the AOT histograms. The descriptive statistics such as the number of the observations, mean, median, skewness, kurtosis, and modal value for each site are also presented in the figure. As expected, is higher over the East China Seas sites (Baengnyeong, Anmyon, Gosan_SNU, and Cape_Fuguei_Station) than the measurements over the South China Sea [12]. The mean value of 0.31–0.35 for the East China Seas sites are close to previous studies. The observed AOTs range around 0.2–0.4 under clear sky conditions and climbed up to 0.8 when haze appear over these regions using handheld sun-photometers Microtops II reported by [14]. A standard deviation of 0.23–0.31 indicates large natural variability of AOT in these regions, which is almost three times over the remote clean maritime conditions.
The distribution of is similar to a log-normal distribution. It has a right-skewed long tail with greater than 0.5. Relatively high skewness (~1.6–2.2) indicates an asymmetric distribution, and the large positive kurtosis (~4.3–7.8) also suggests a sharply peaked distribution existed. The mean value is usually a little larger than the median, which is also an indication of non-normal distribution. The frequency histograms of for the East China Seas sites indicate that the majority values (~80%) are smaller than 0.45–0.5 (vertical dashed line in Figure 3a–d). It also shows that the width of the distribution decrease as the latitude decrease for these sites.
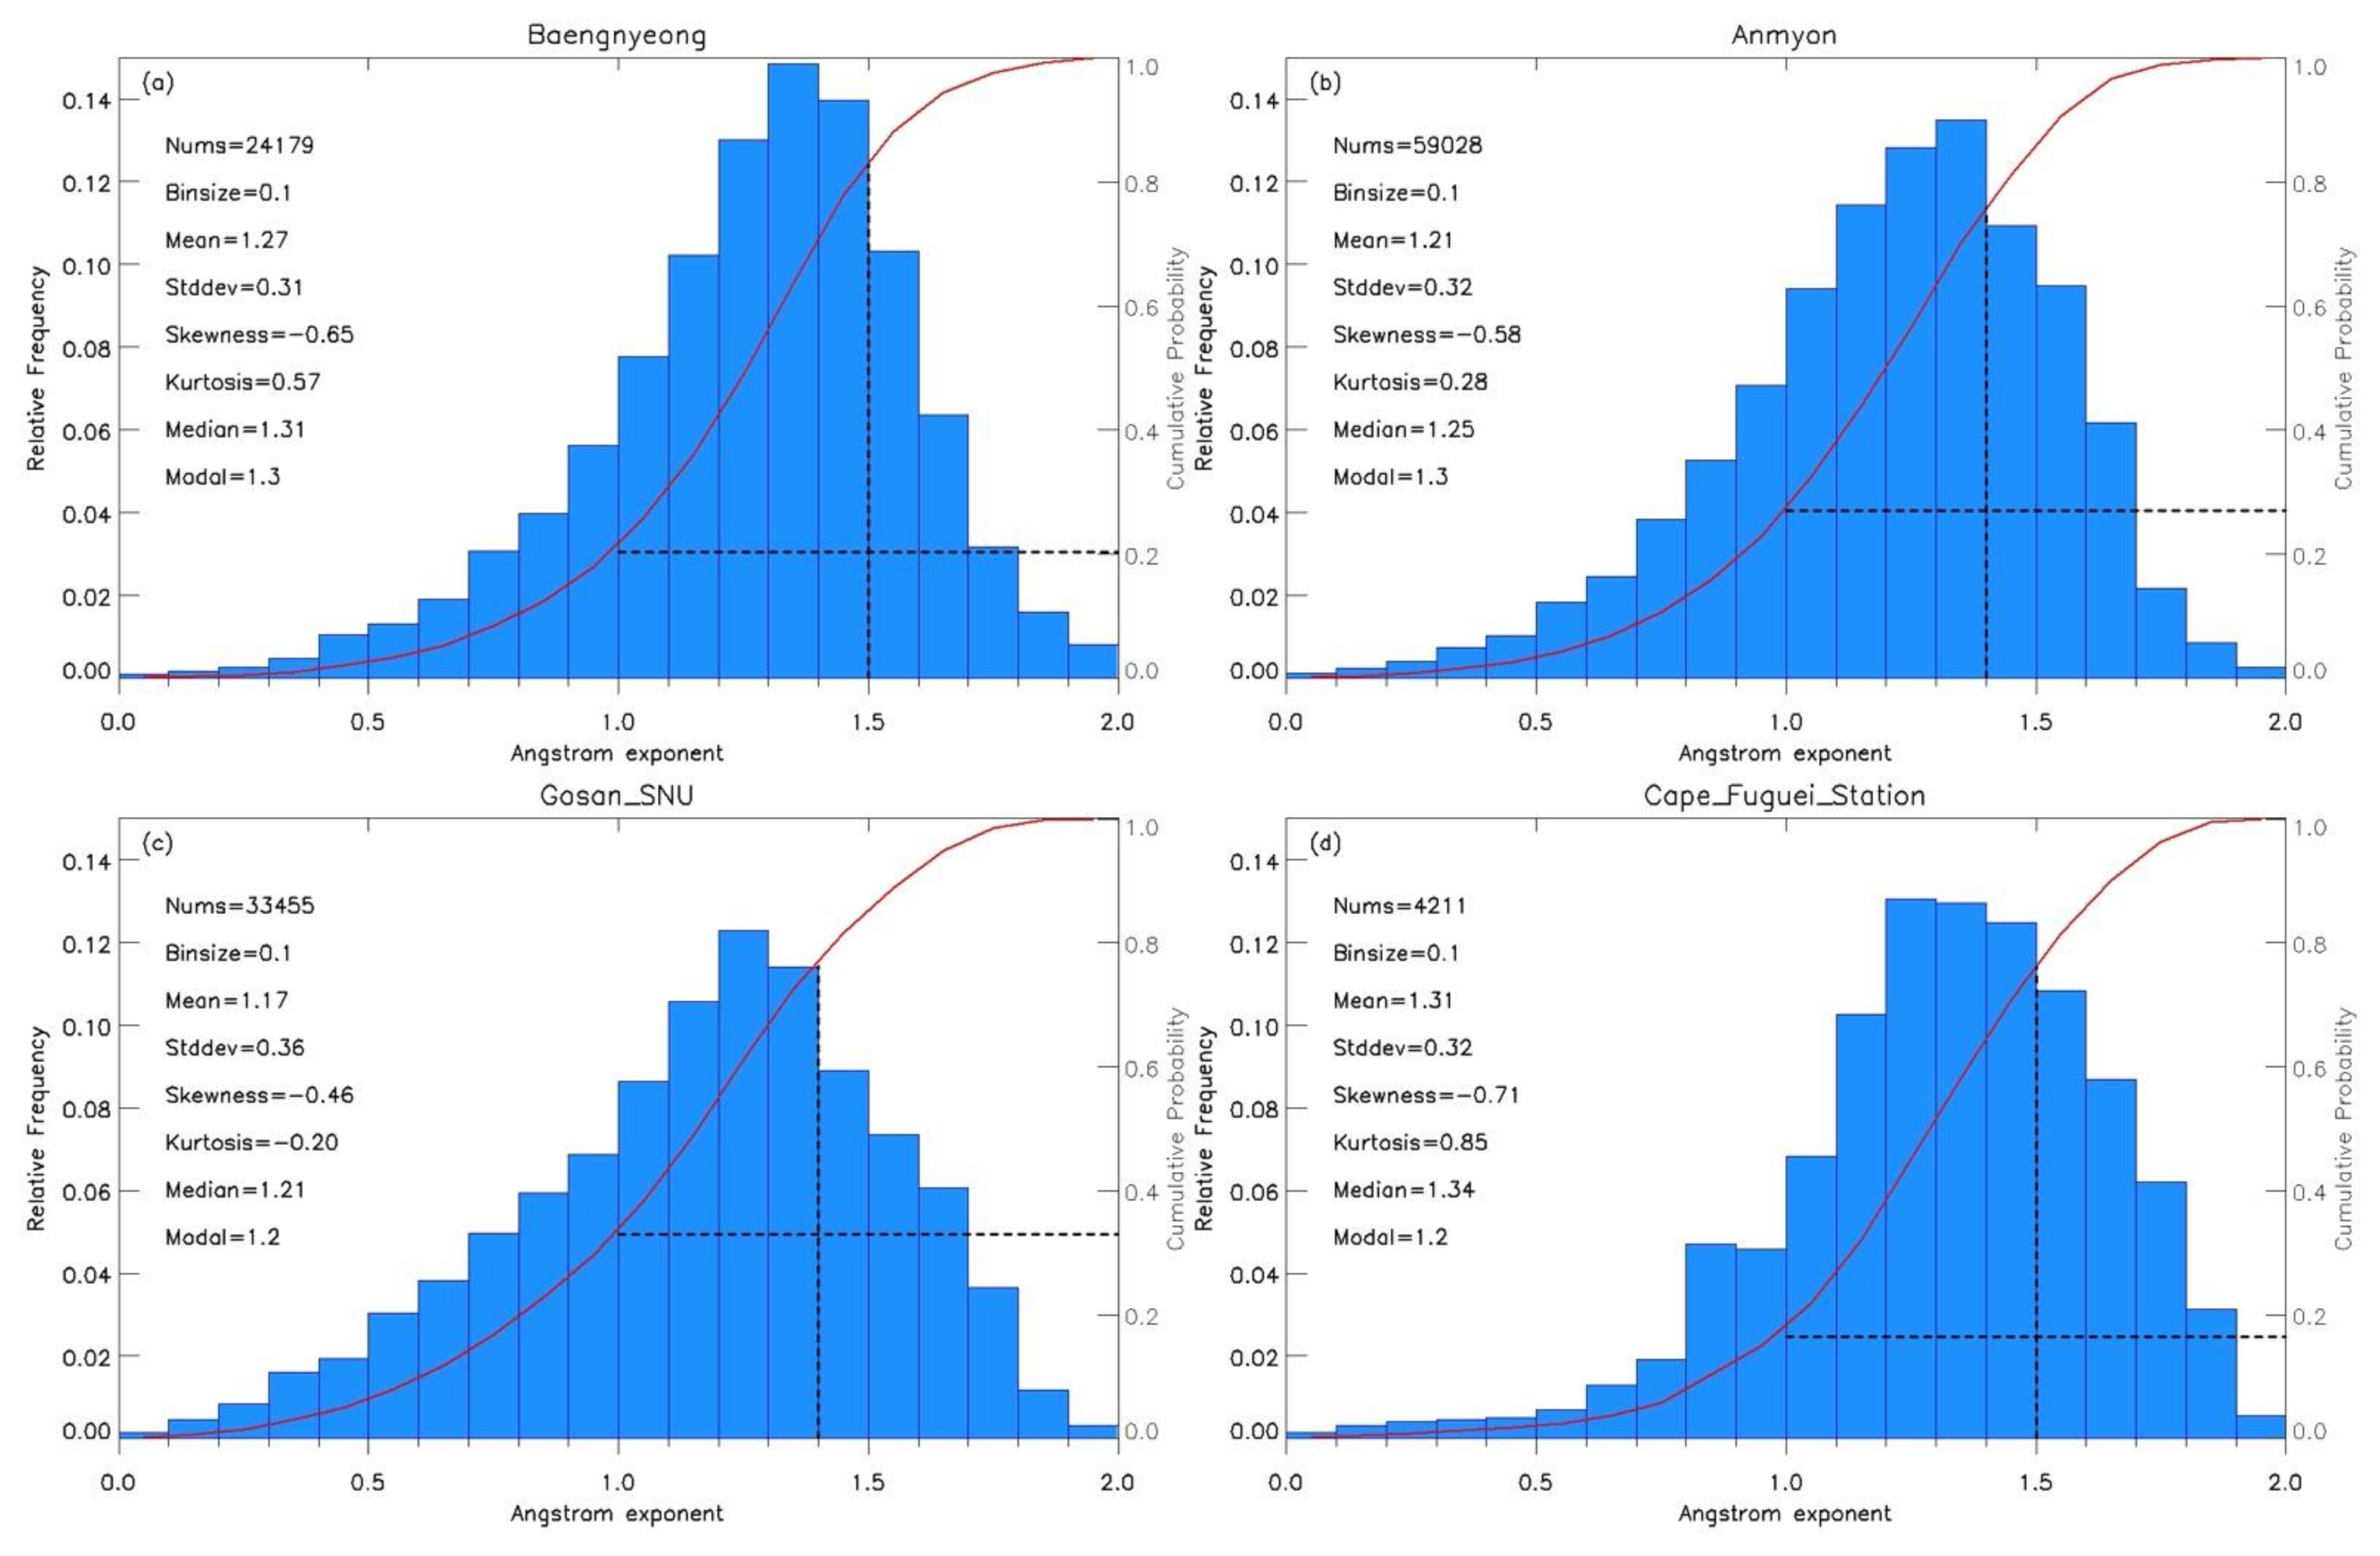
Figure 4 presents the Ångström exponent frequency distribution for the four sites. A bin size value of 0.1 is used to generate the AE histograms. Compared with the frequency histogram, the distributions of Ångström exponent are closer to a normal distribution, since a slight difference exists between the mean and median values and the skewness and kurtosis are relatively small. These sites are slightly skewed towards higher Ångström with peak frequency at the range of 1.2–1.3 and lesser frequencies trailing off at higher values. The mean α values at these sites are close to of 1.26 reported by [20]. The frequency histograms of AE for all sites demonstrate that the majority of the values (~80%) are less than 1.4–1.5 (the vertical dashed line in Figure 4). Ångström values less than 1 indicate that the size distributions are dominated by coarse-mode aerosols that can be associated with dust and sea salt, while values greater than 1 indicate size distributions dominated by fine-mode particles that are usually related to urban pollution and biomass burning. The cumulative probability of AE less than 1 for each site is 0.21, 0.27, 0.33, and 0.17, respectively (horizontal dash line in Figure 4), indicating more fine-mode particles. It also suggested a different degree of dust aerosol influence.
4.2. Daily Variation of Aerosol Optical Characteristics
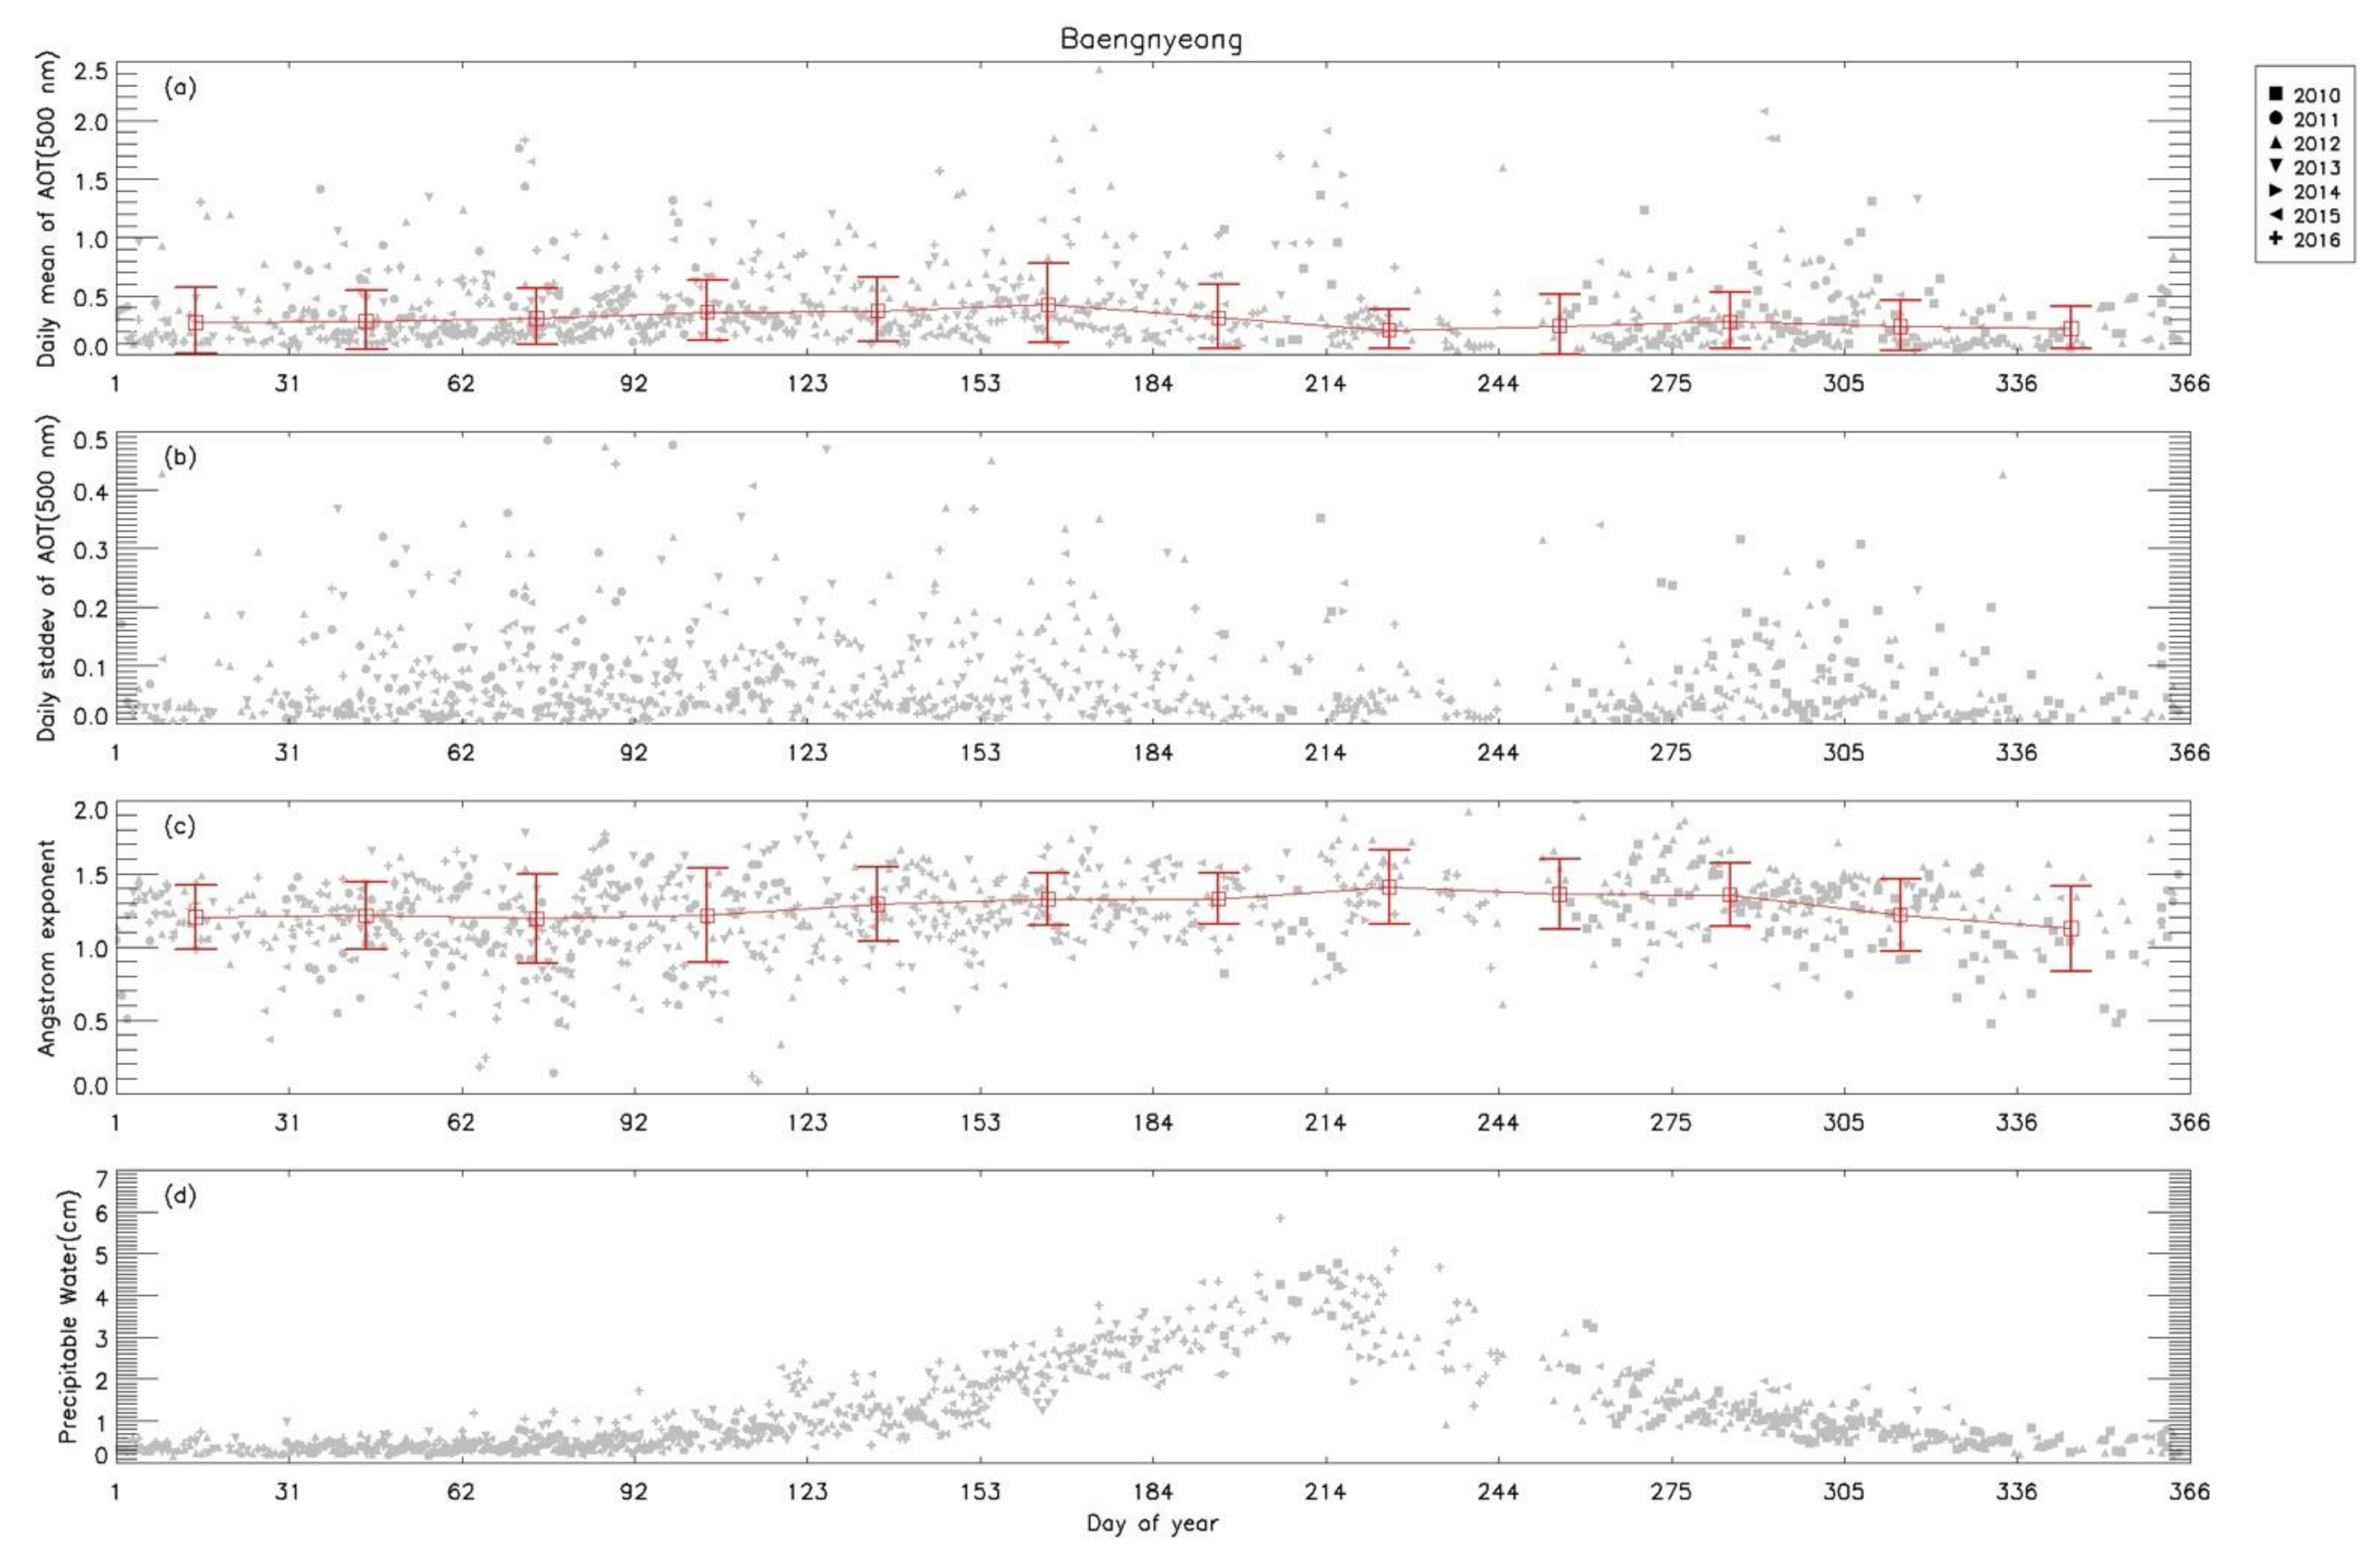
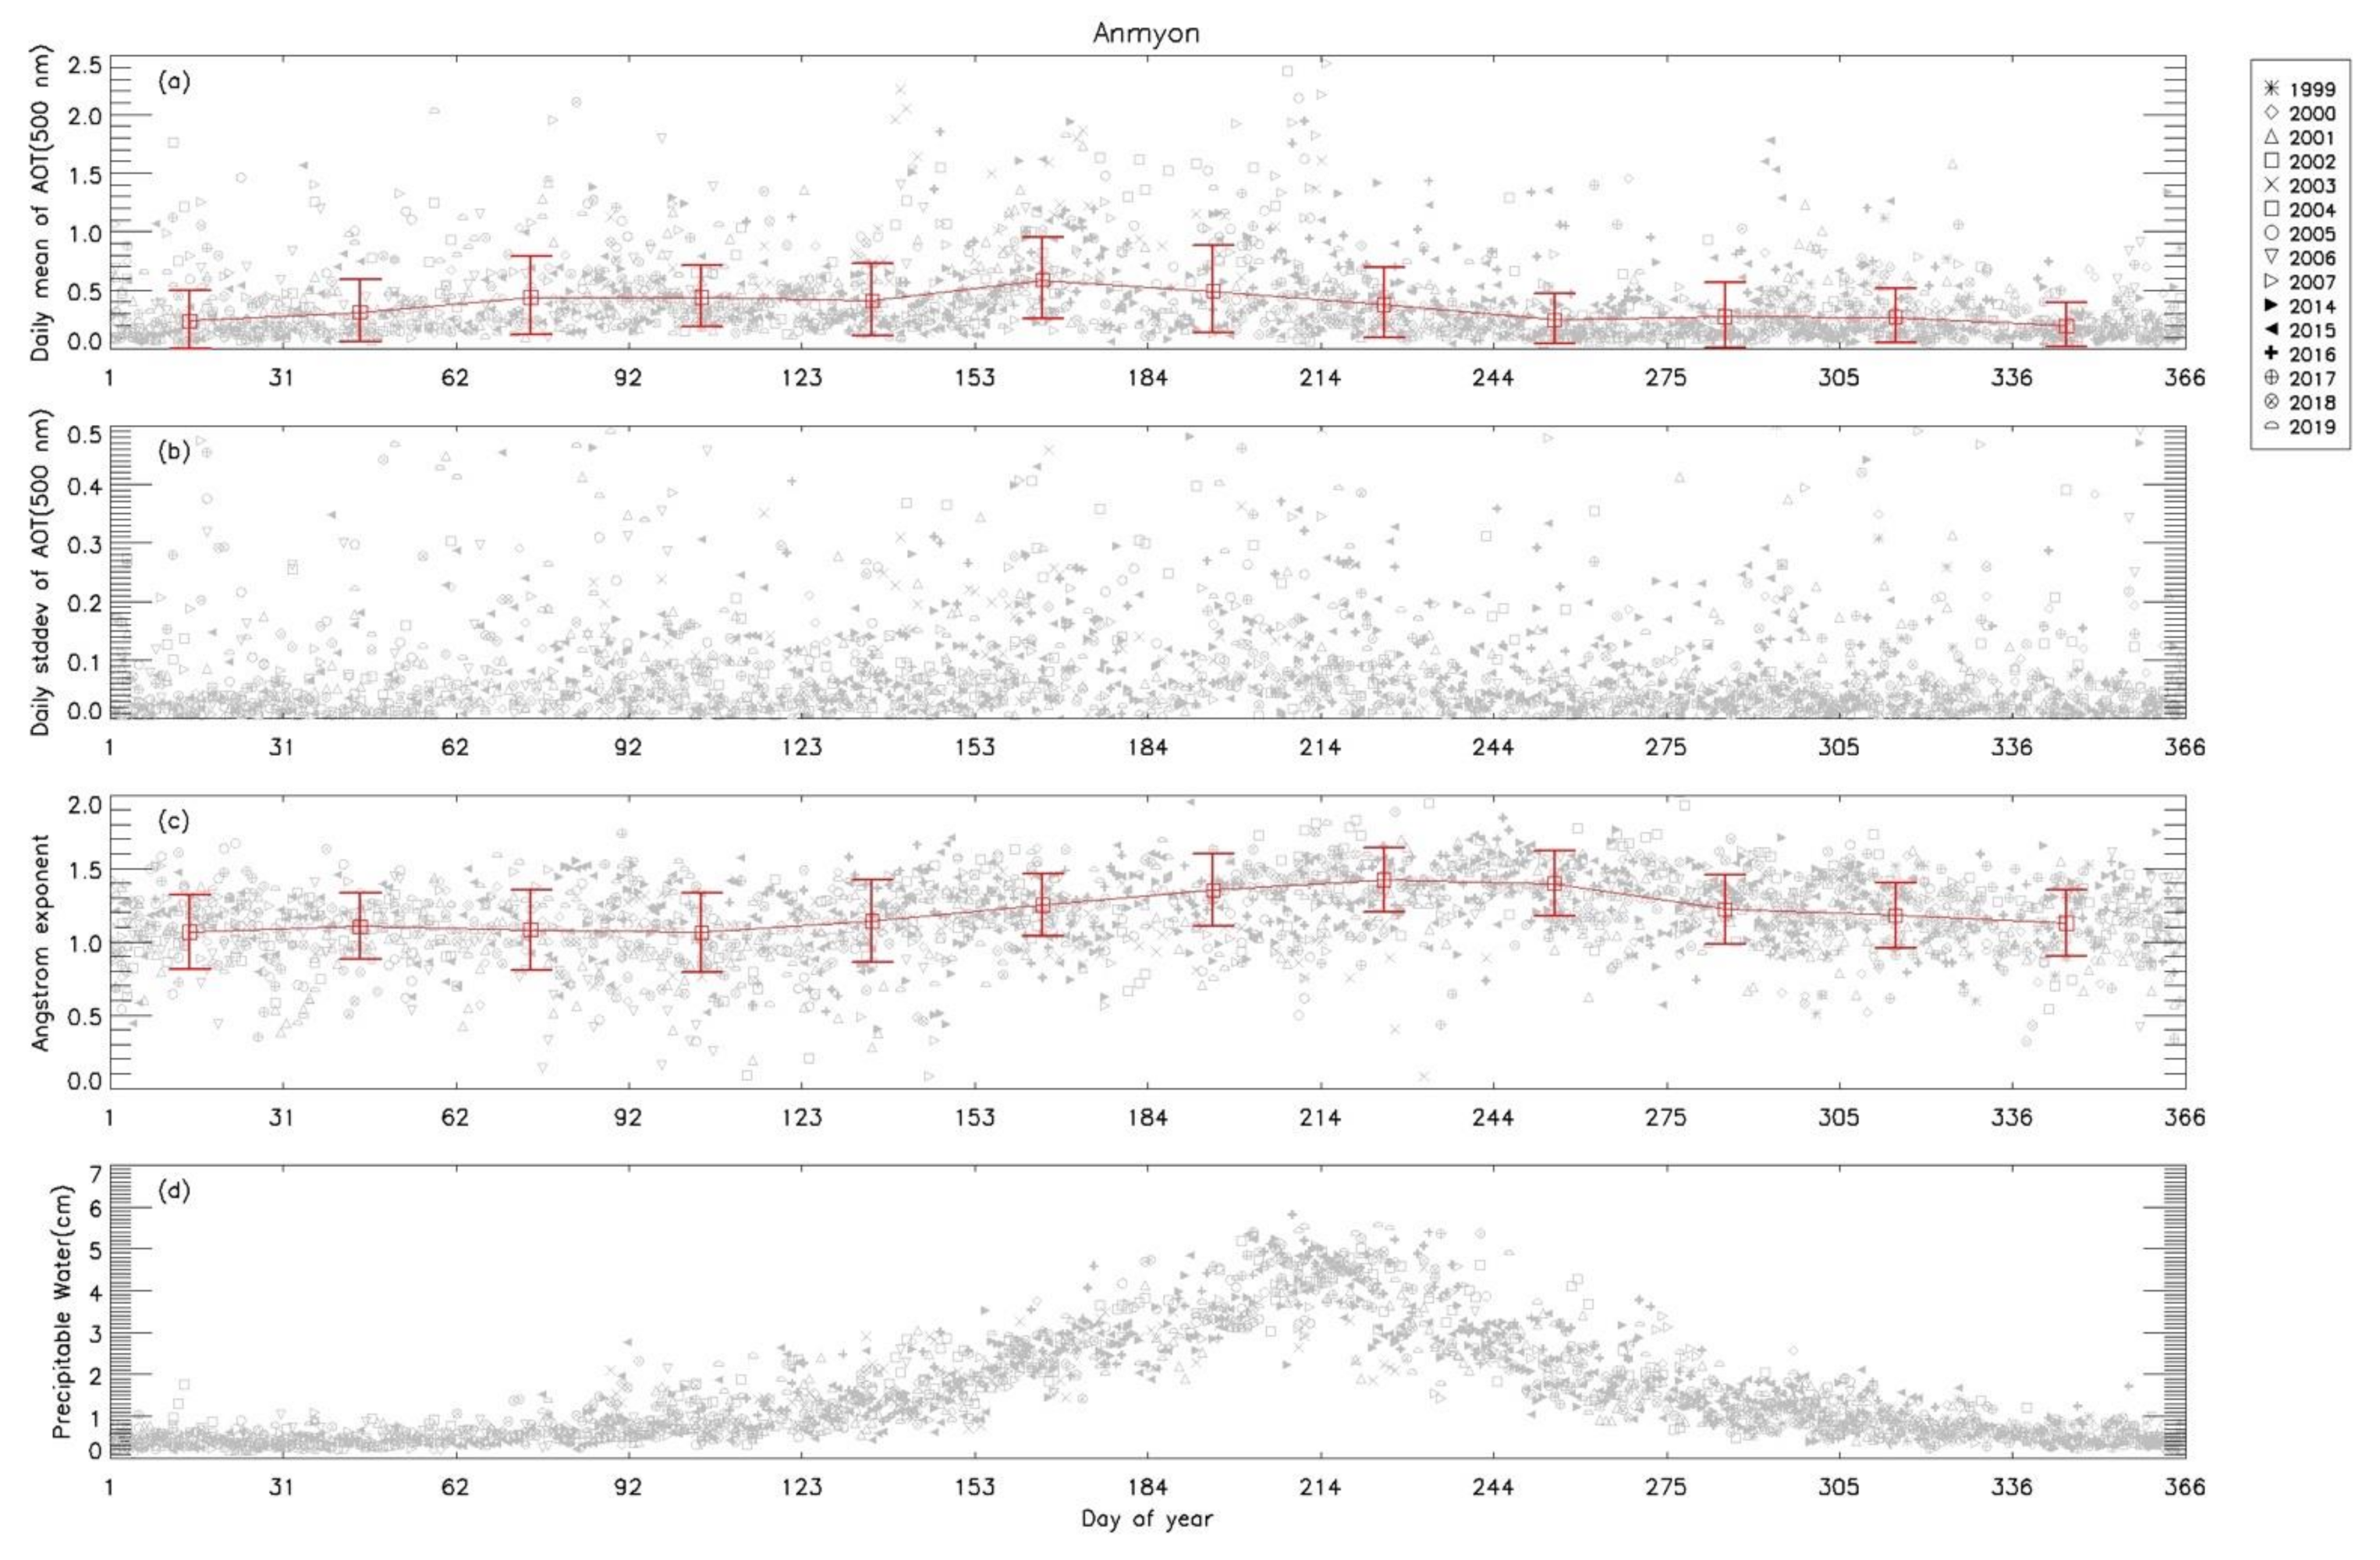
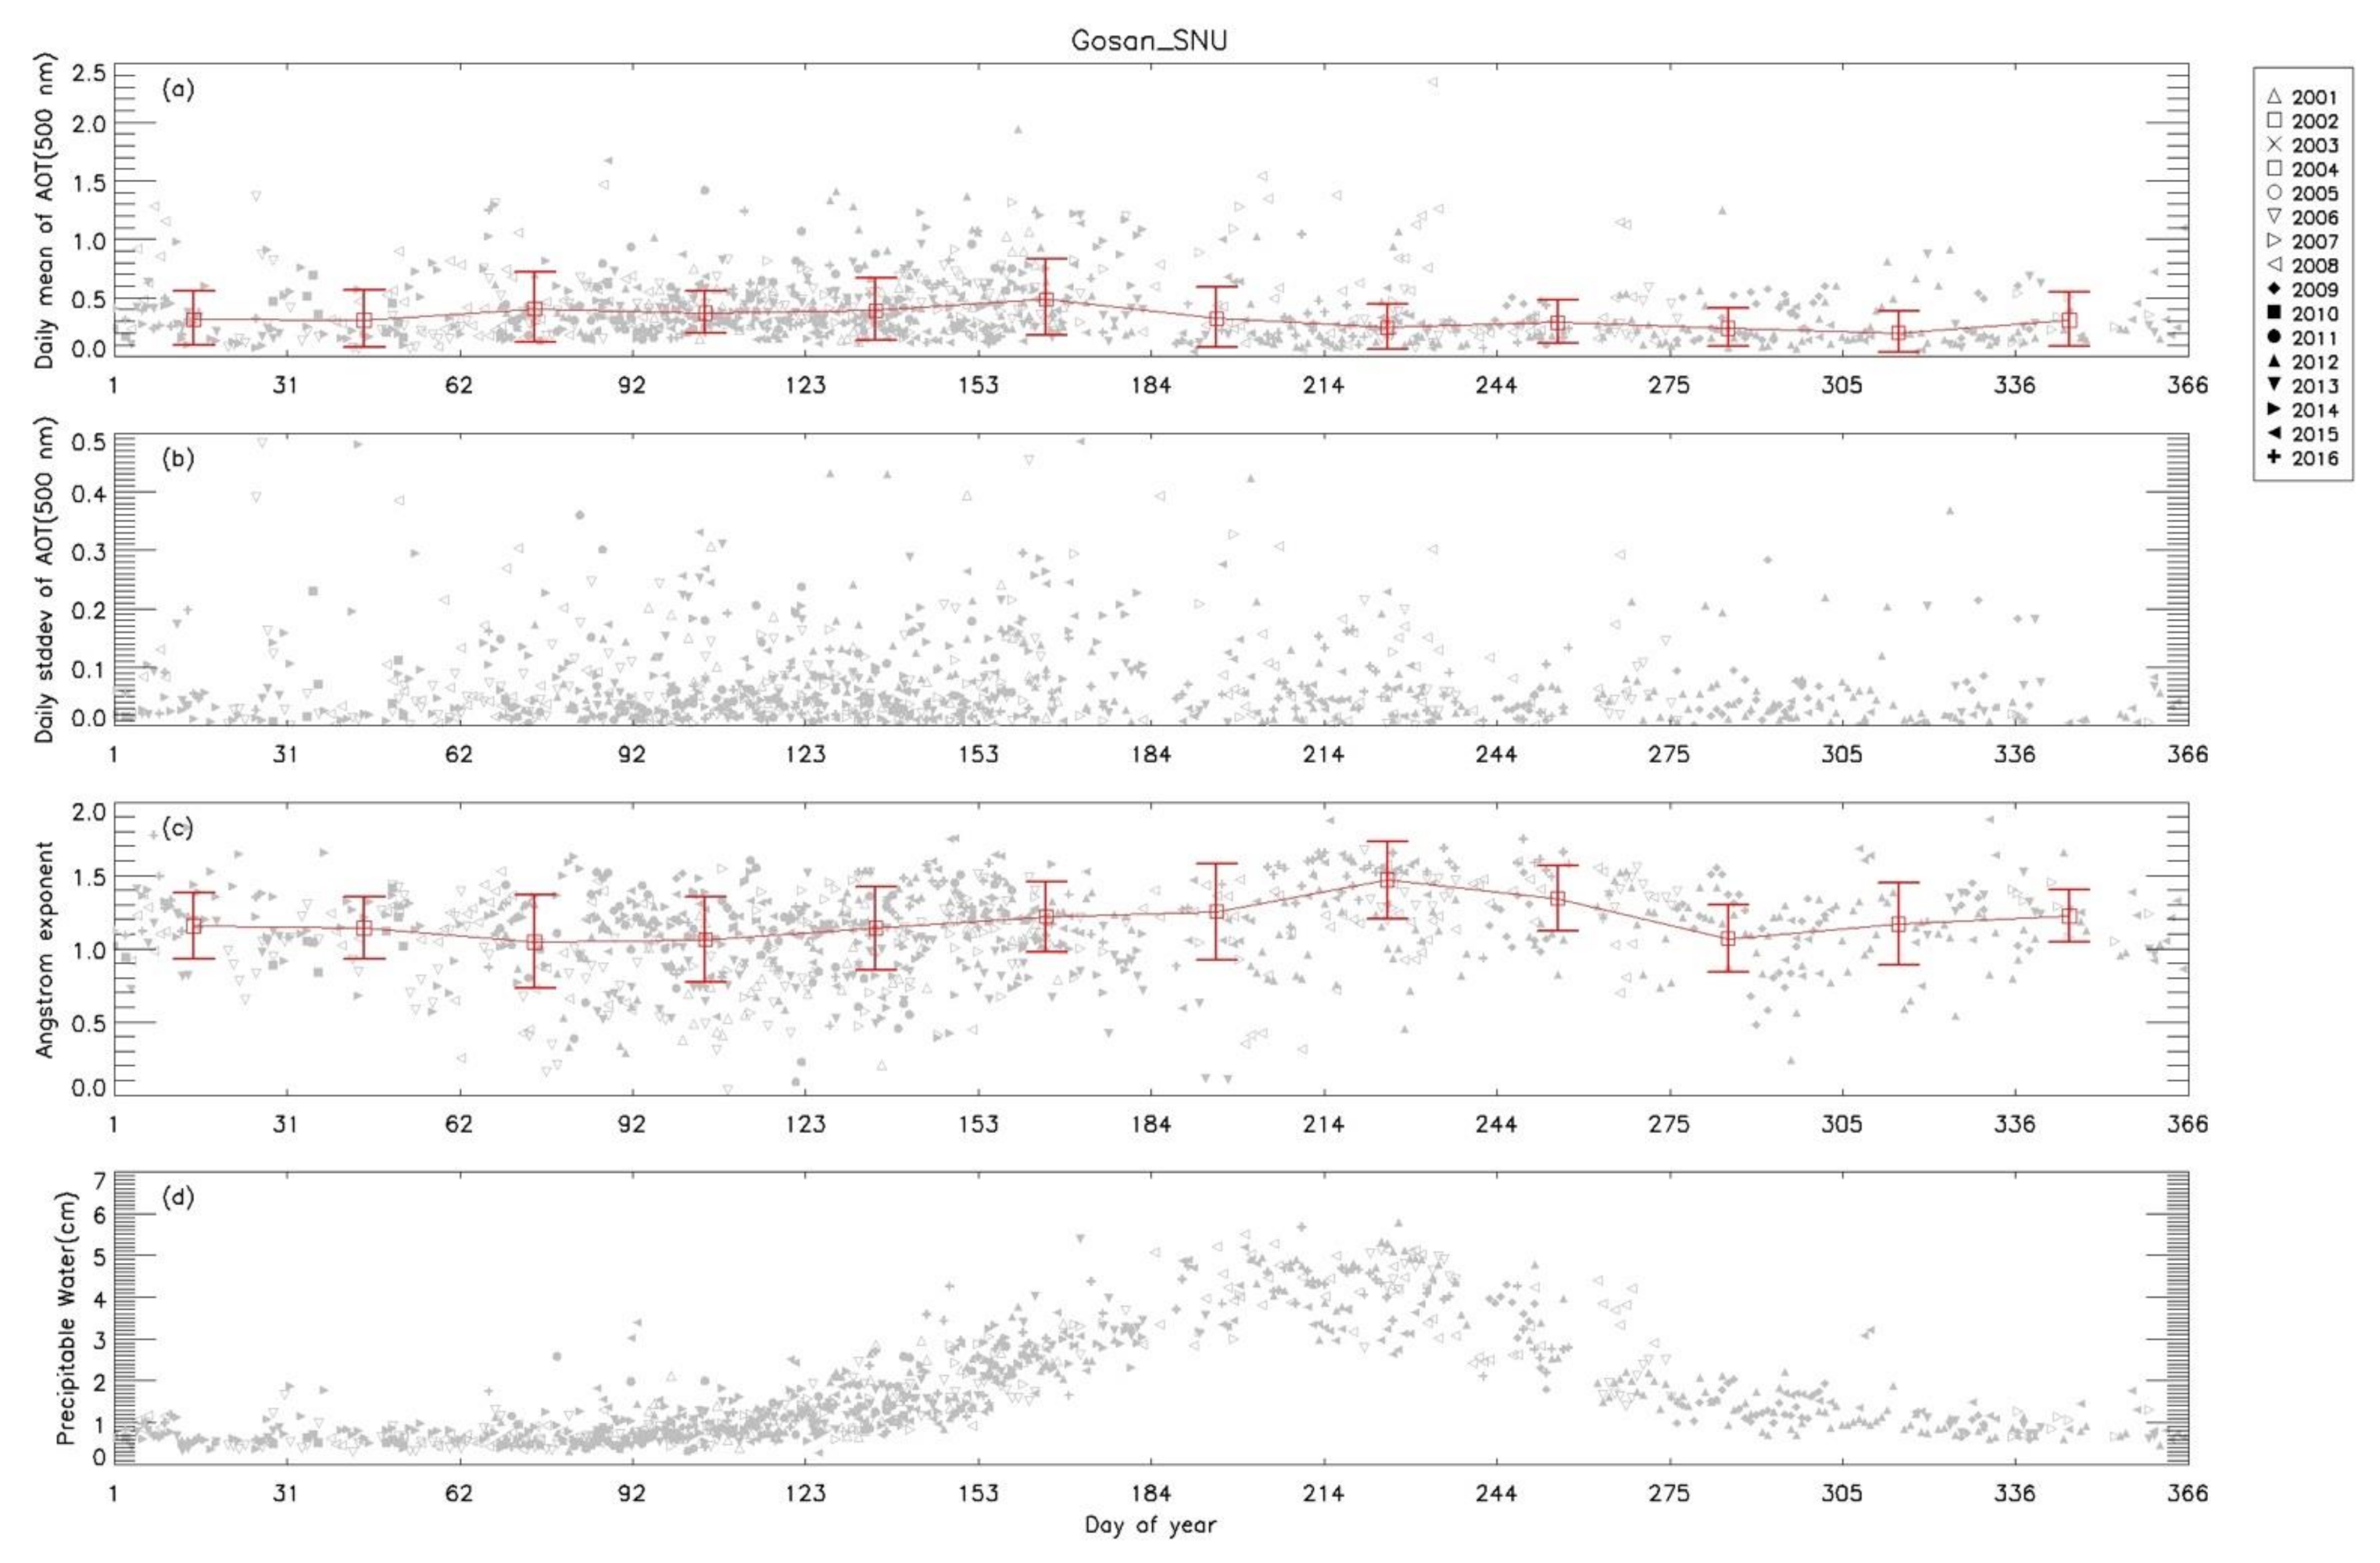
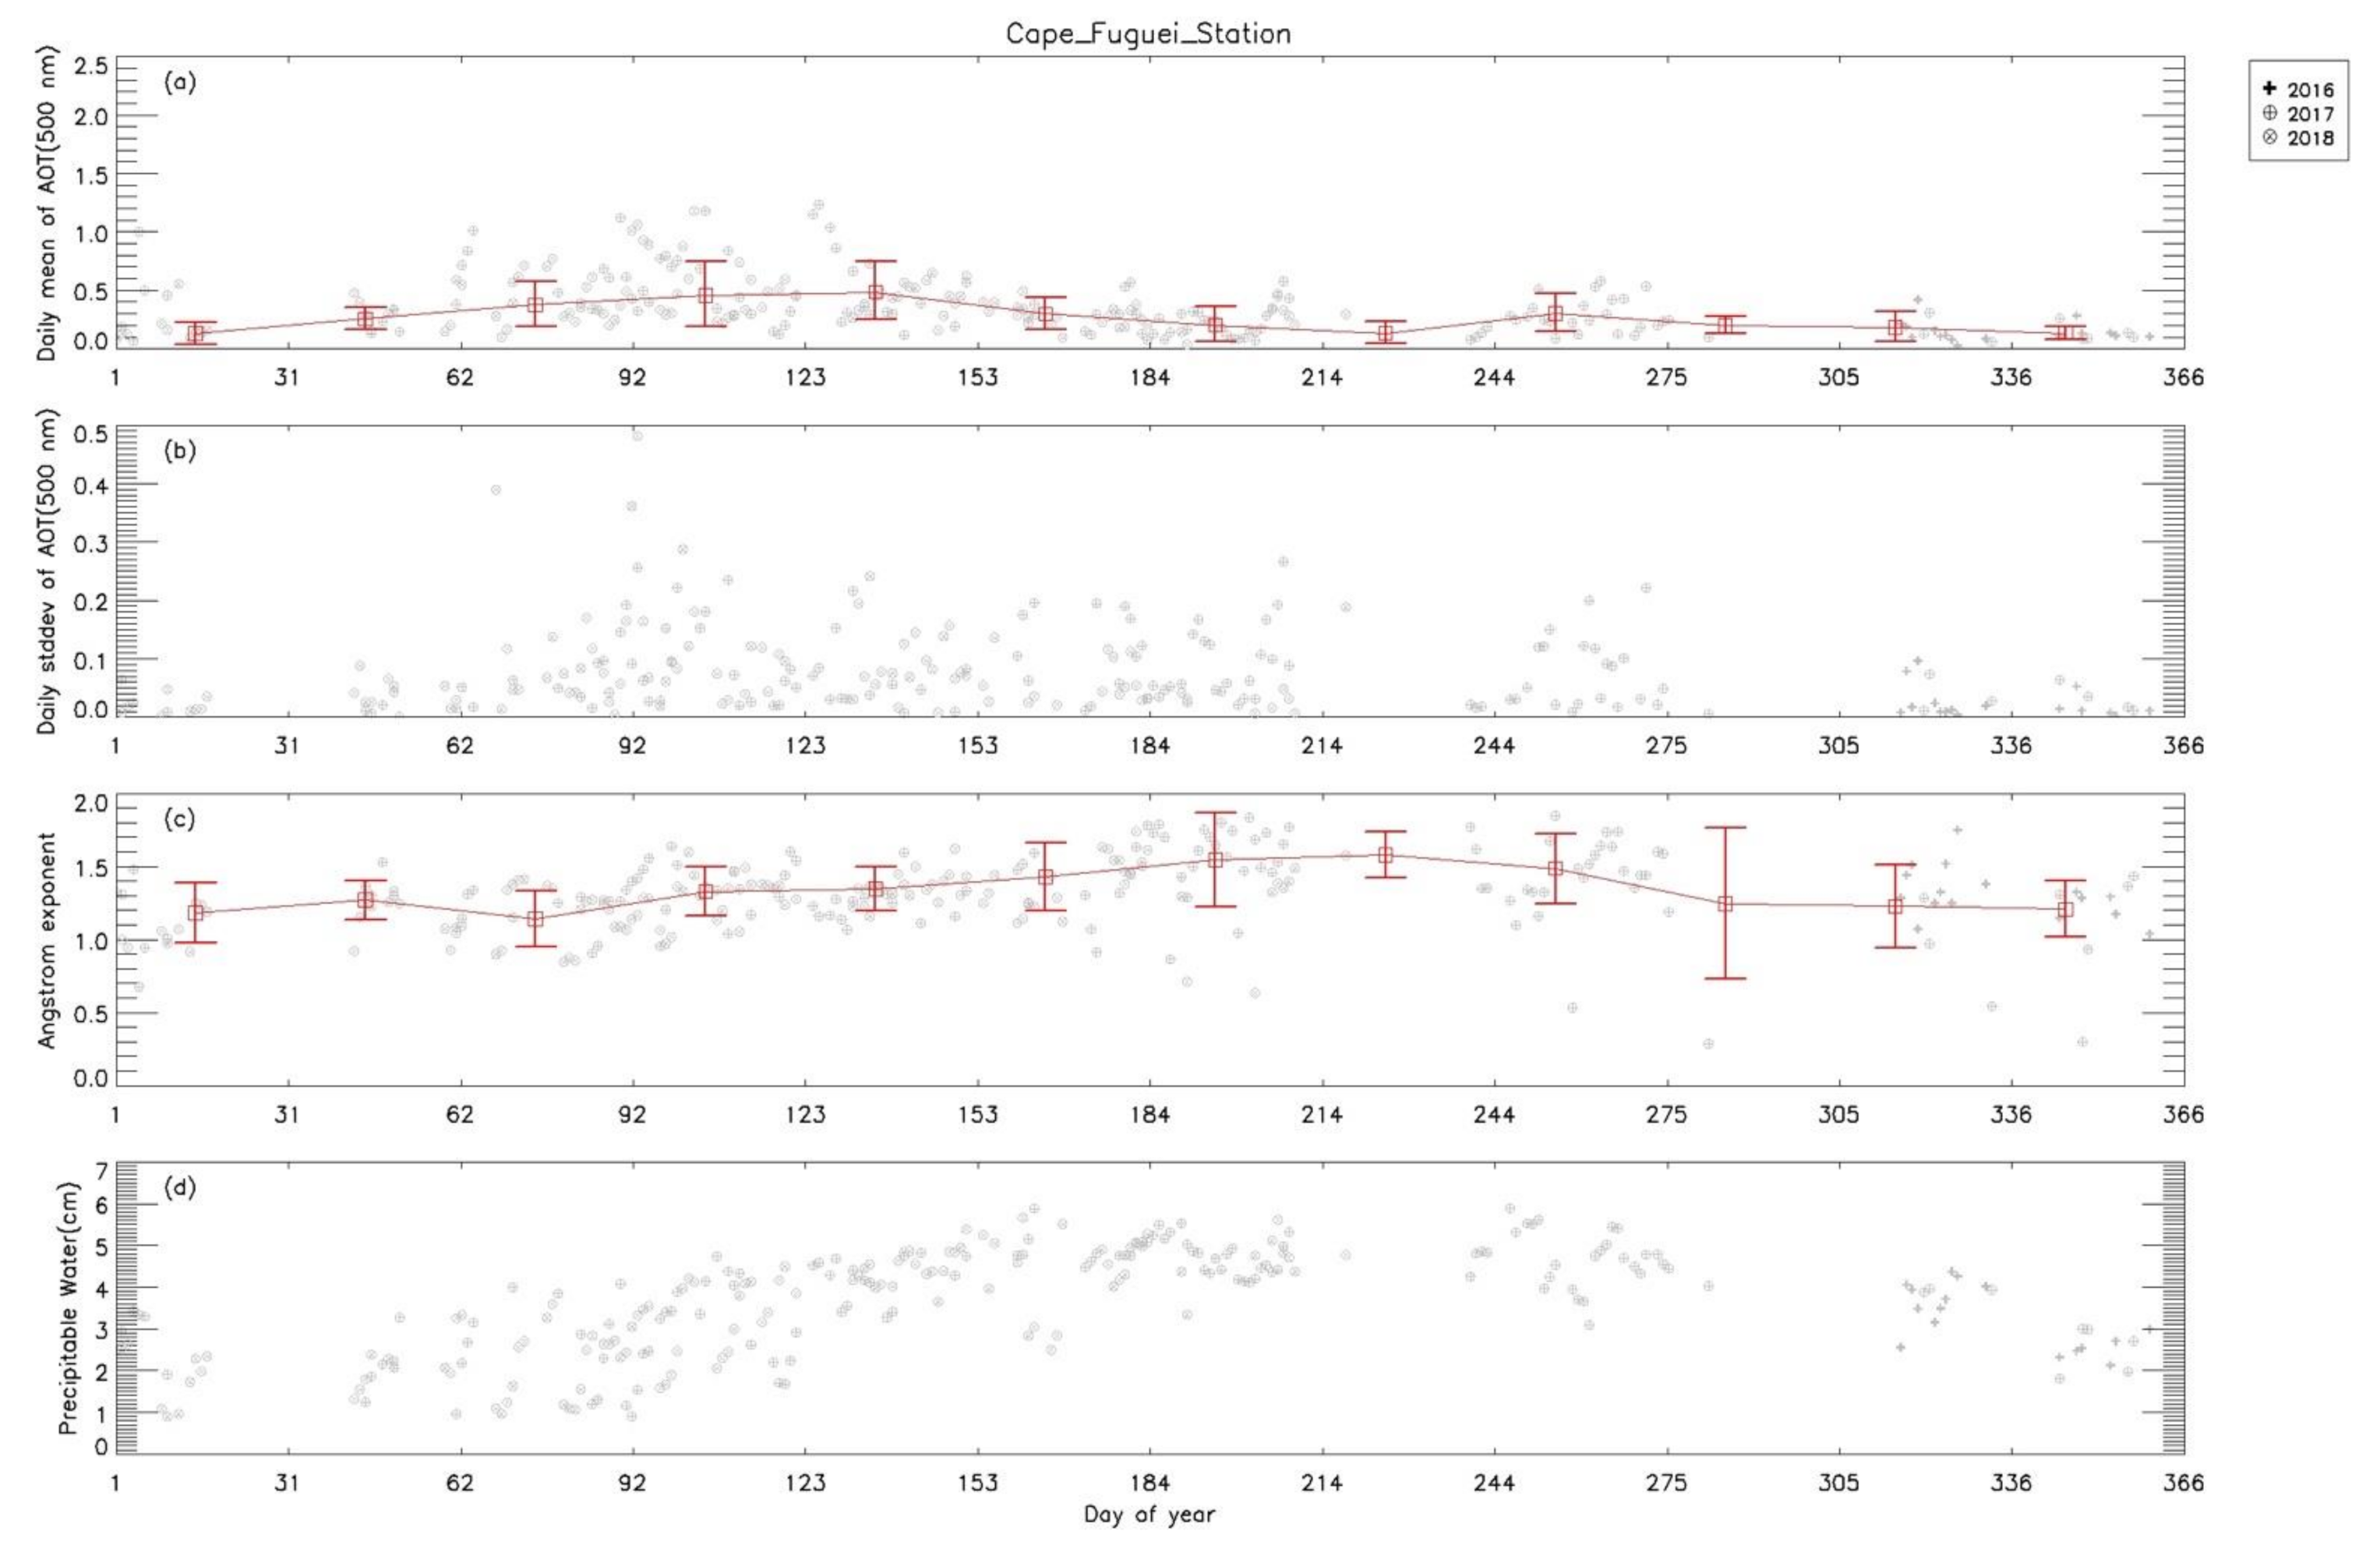
Figure 5, Figure 6, Figure 7, Figure 8, Figure 9 and Figure 10 present the daily (gray dots) and monthly (red symbols) variations of , Ångström exponent (440–870 nm), and atmospheric precipitable water at the four AERONET sites around the East China Seas during 1999–2019.
Figure 5a illustrates the daily averaged for Baengnyeong from 2010 to 2016. The measured daily values mainly range from 0.03 to 2.5 and show large daily variation. Monthly average values and standard deviation also used to characterize the data behavior in red color symbol. Computed standard deviations of daily range from below 0.01 to 0.5 (Figure 5b). The Ångström exponent is typically larger than 1 from May to October (Figure 5c). It indicates the dominance of fine-mode anthropogenic aerosol at this site during these periods. An Ångström exponent of less than 1 appears during winter and springtime. The small Ångström exponent is due to the long-range transport of Asian dust aerosols in spring. Mean daily values of the precipitable water exhibits a pronounced seasonal pattern with a maximum in the summer (Figure 5d). High temperature and humidity during the summer is suitable for the gas and particles conversion, which increases the average size of the particle and leads to larger particle extinction efficiency and AOT [21]. Note that larger than 1 seldomly appear in August and is possibly due to the washout effect and wet deposition.
The distribution and variation of daily , Ångström exponent, and precipitable water over Anmyon (Figure 6) is similar to Baengnyeong. Because there are more measurements and long-term records from 1999 to 2019, it is more representative of the coastal regions of the Yellow Sea. The maximum were observed in summer (June and July) and spring (March to May) followed by autumn and minimum were observed in December. These results indicated that the aerosol distribution over the Yellow Sea might be affected by regional atmospheric transport from the surrounding continent. Ångström less than 0.5 are also observed in January and May compared to Baengnyeong (Figure 6c). It is determined by the time when Asian dust storms appear and transport to the site. It was reported that different regions of the China seas were affected by the Asian dust storms with different probability, and they had the highest probability of affecting the Yellow Sea [22]. In short, over the Yellow Sea coastal regions, it shows higher AOT with lower AE in spring and higher AOT with higher AE in summer, while lower AOT with higher AE in autumn and winter.
Figure 7a presents the daily averaged for the measurement period over Gosan_SNU. Most of the AOT range from 0.02 to 1.5 for this site. Computed standard deviations of daily generally range from 0.01 to 0.2 (Figure 7b). Mean daily values of Ångström demonstrate obvious variability at daily scale (Figure 7c). The values of Ångström which are typically less than 1 indicate the presence of coarse mode dust aerosol in spring and sea-salt aerosol in other seasons. Daily average values of the precipitable water vapor are usually greater than 0.5 cm and less than 5 cm with no interannual significant variations from the measurements for all years (Figure 7d).
Figure 8a shows the daily averaged for the measurement period at Cape_Fuguei_Station with a spring seasonal peak. Although the AOT for this site is higher in the springtime, which may not be associated with dust transport from the Asian regions since the AE usually larger than 1 during this period. Standard deviations of daily range generally below 0.3 (Figure 8b). Mean daily values of α indicate smaller variability than other sites (Figure 8c). Daily average precipitable water (Figure 8d) are greater than 1 cm and less than 5 cm with some seasonal variations and higher values usually appear in the summer.
The descriptive statistics (such as the mean, median, and standard deviation) of AOT, Ångström exponent and precipitable water for the four selected sites are also summarized in Table 2.
4.3. Aerosol Typing
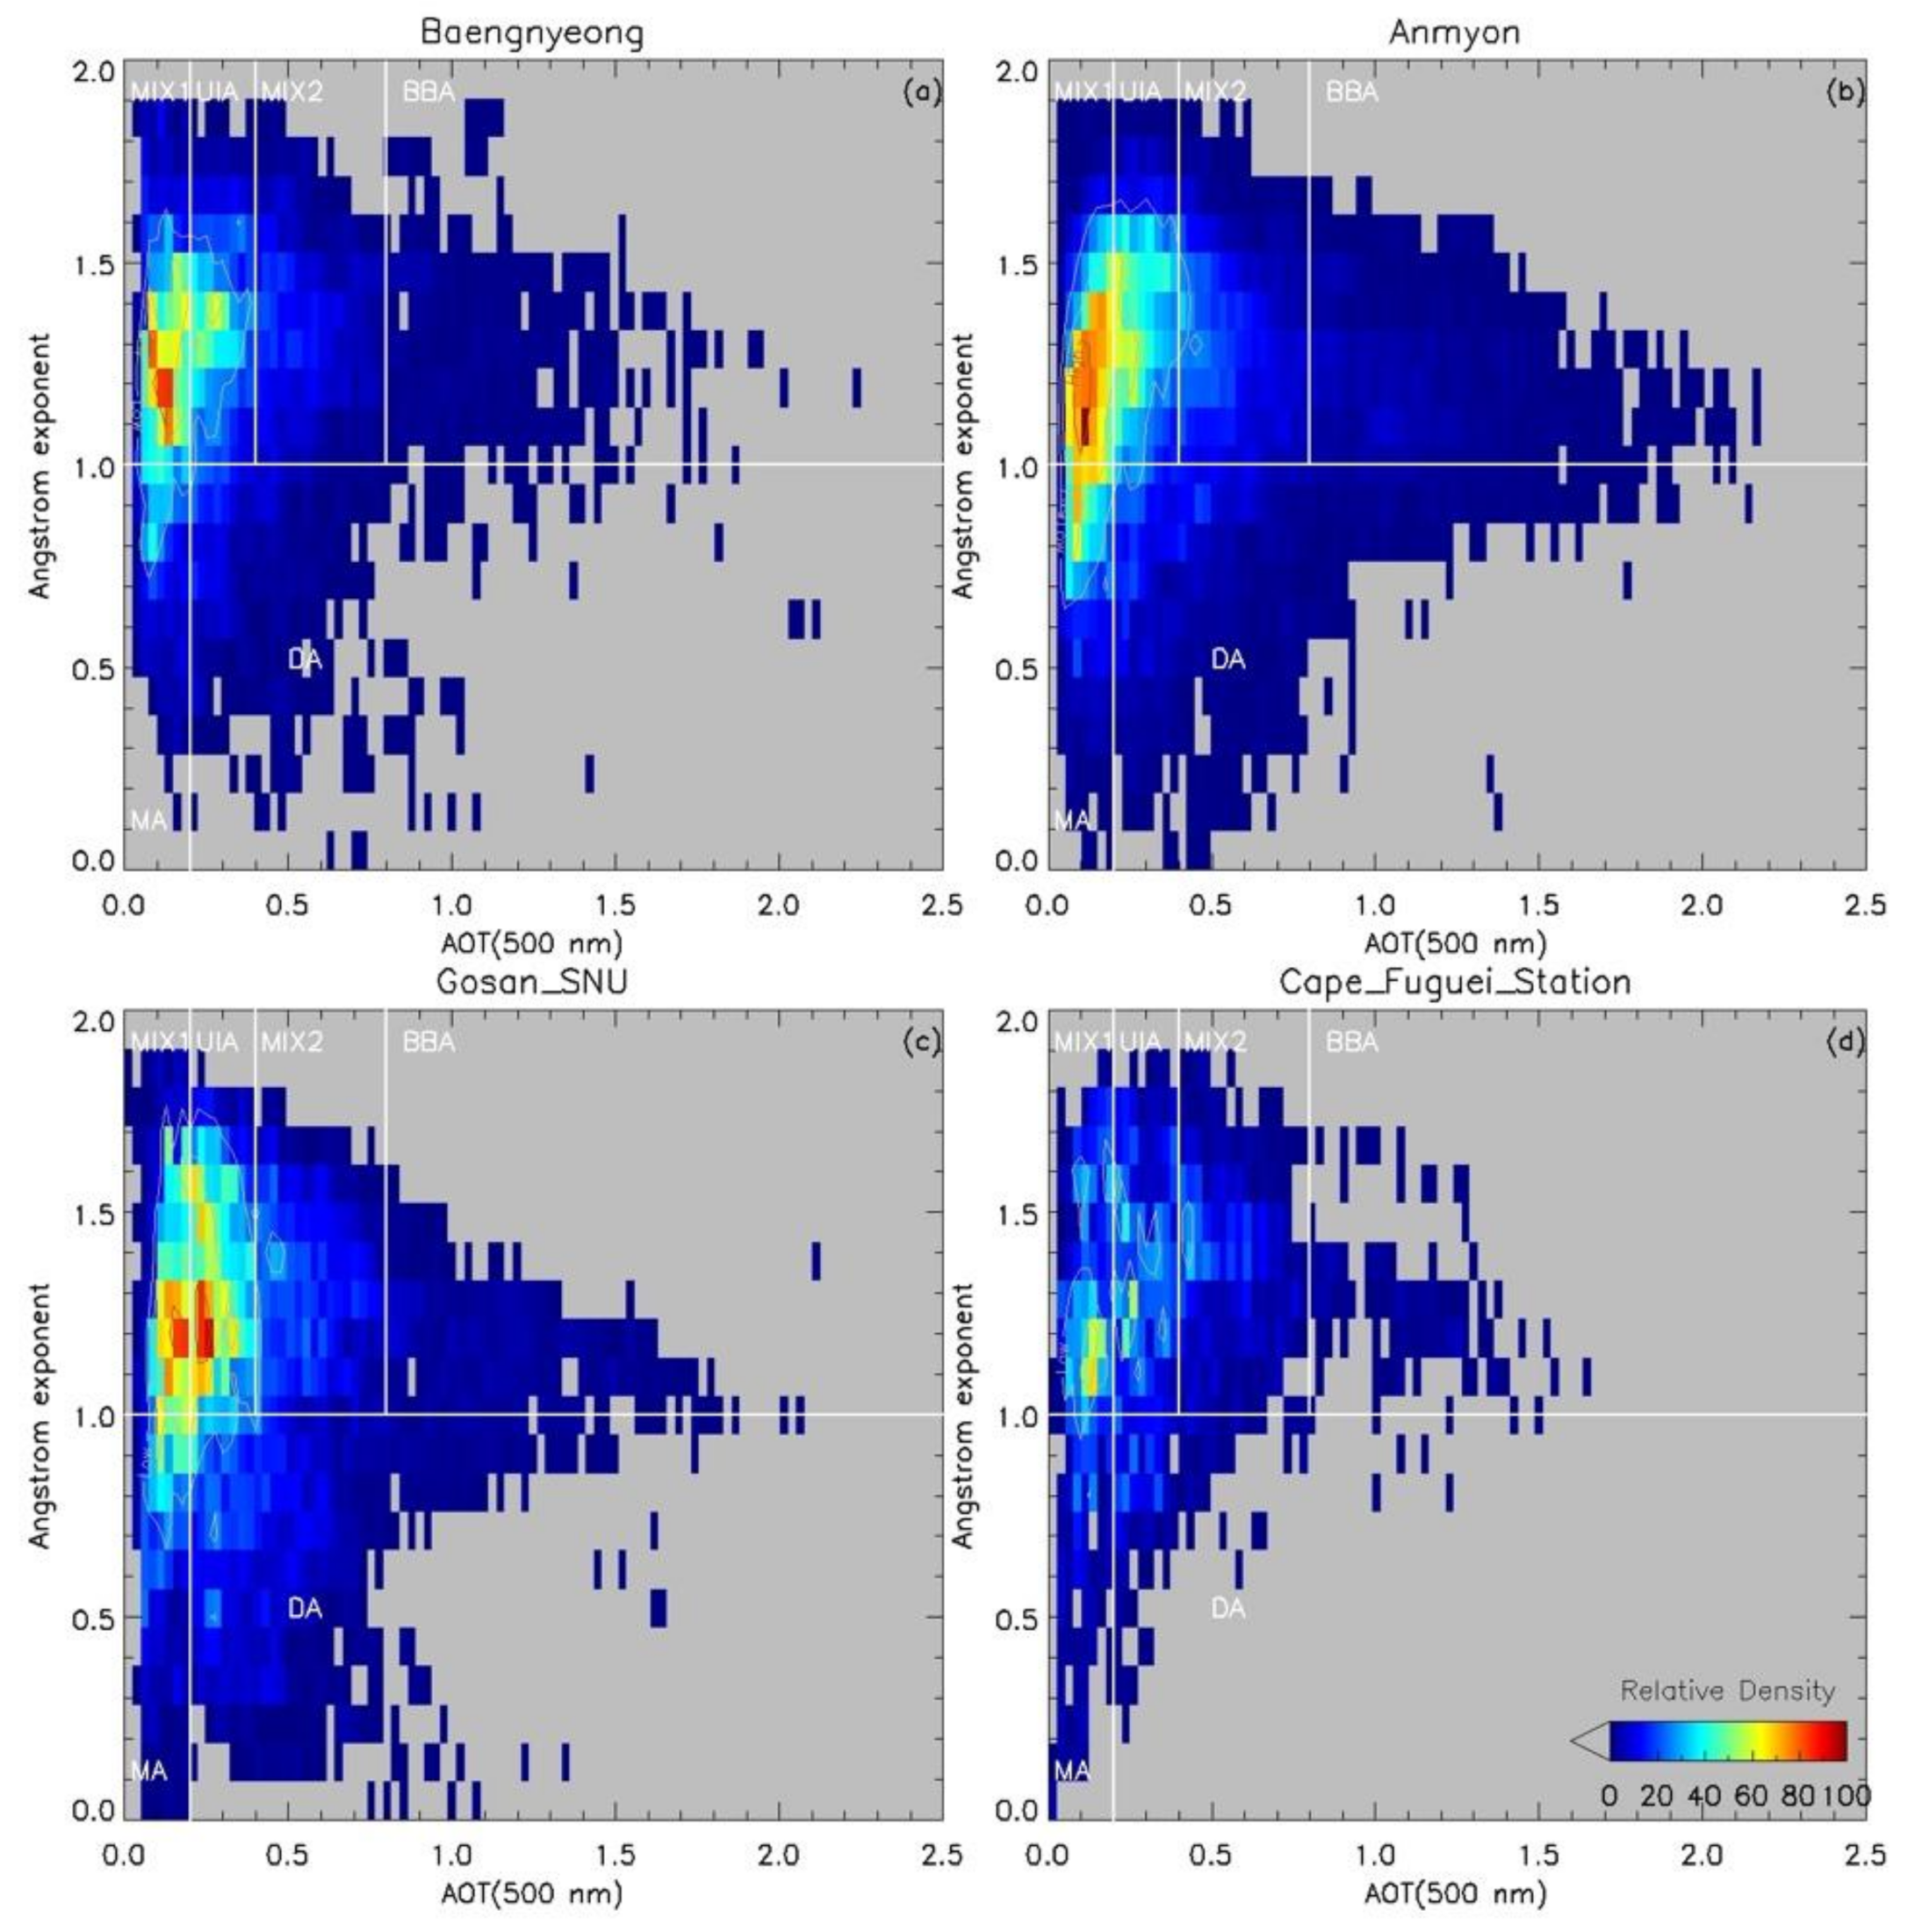
Figure 9 shows a two-dimensional (2D) density plot of the versus the Ångström exponent. The relationship between these two parameters are usually pointing to data clusters with specific aerosol types and size modes. It is currently a common tool for aerosol types classification. In this study, the threshold criteria of [23] was used to identify the following different aerosol types: (i) the pure maritime aerosol (MA), which < 0.2 and AE < 1.0; (ii) dust aerosol (DA), which > 0.2 and AE < 1.0; (iii) urban/industrial aerosols (UIA), which > 0.2 and AE > 1.0; (iv) biomass-burning aerosols (BBA), which > 0.8 and AE > 1.0; (v) the remaining aerosols were classified as mixed-aerosol type (MIX1 and MIX2). Both MIX1 and MIX2 are fine mode aerosols, and the main difference between MIX1 and MIX2 is the threshold of AOT. These aerosols are affected by various aerosol mixing process (such as humidification, condensation, coagulation, and gas-to-particle conversion), thus they are difficult to discriminate from others.
For Baengnyeong, Anmyon, and Gosan_SNU, most of the data points are concentrated in the region with Ångström values in the range of 0.7 < α < 1.7, as indicated by the warm tones in the density plot (Figure 9a–c). values are heavily concentrated in the range of 0 < < 0.4 with a substantial concentration at ~0.1 for Baengnyeong, Anmyon and at ~0.2 for Gosan_SNU. Firstly, the regions with Ångström values less than 1.0 and less than 0.2 demonstrates a substantial existence of maritime aerosols for each site. It is noted that Smirnov [24] considers the values of less than 0.15 for maritime aerosols. The maritime aerosols are typically large particles with low optical thickness. Secondly, these sites can also be contaminated by dust aerosols. The areas with Ångström values less than 1.0 and greater than 0.2 can indicate the existence of dust, because these particles tend to have large sizes with high optical thickness. The 2D density of DA at Baengnyeong, Anmyon, and Gosan_SNU site, which located on the transport passage of Asian dust storm is larger than that at the Cape_Fuguei_Station. Additionally, most of our observations are focused on the fine-mode region with Ångström exponent greater than 1.0 and less than 2.0 and intermediate values (0.2 < < 0.4). On the one hand the dust or sea salt aerosols are absent, on the other hand the urban pollution such as from fossil fuel burning (cars, incinerators, etc.) and other urban sources frequently happen. In the data set of this study, particles generated from biomass burning are rarely observed. These types of particles are very small with a large Ångström exponent (α > 1.0) and large AOT ( > 0.8).
4.4. Aerosol Size Distributions
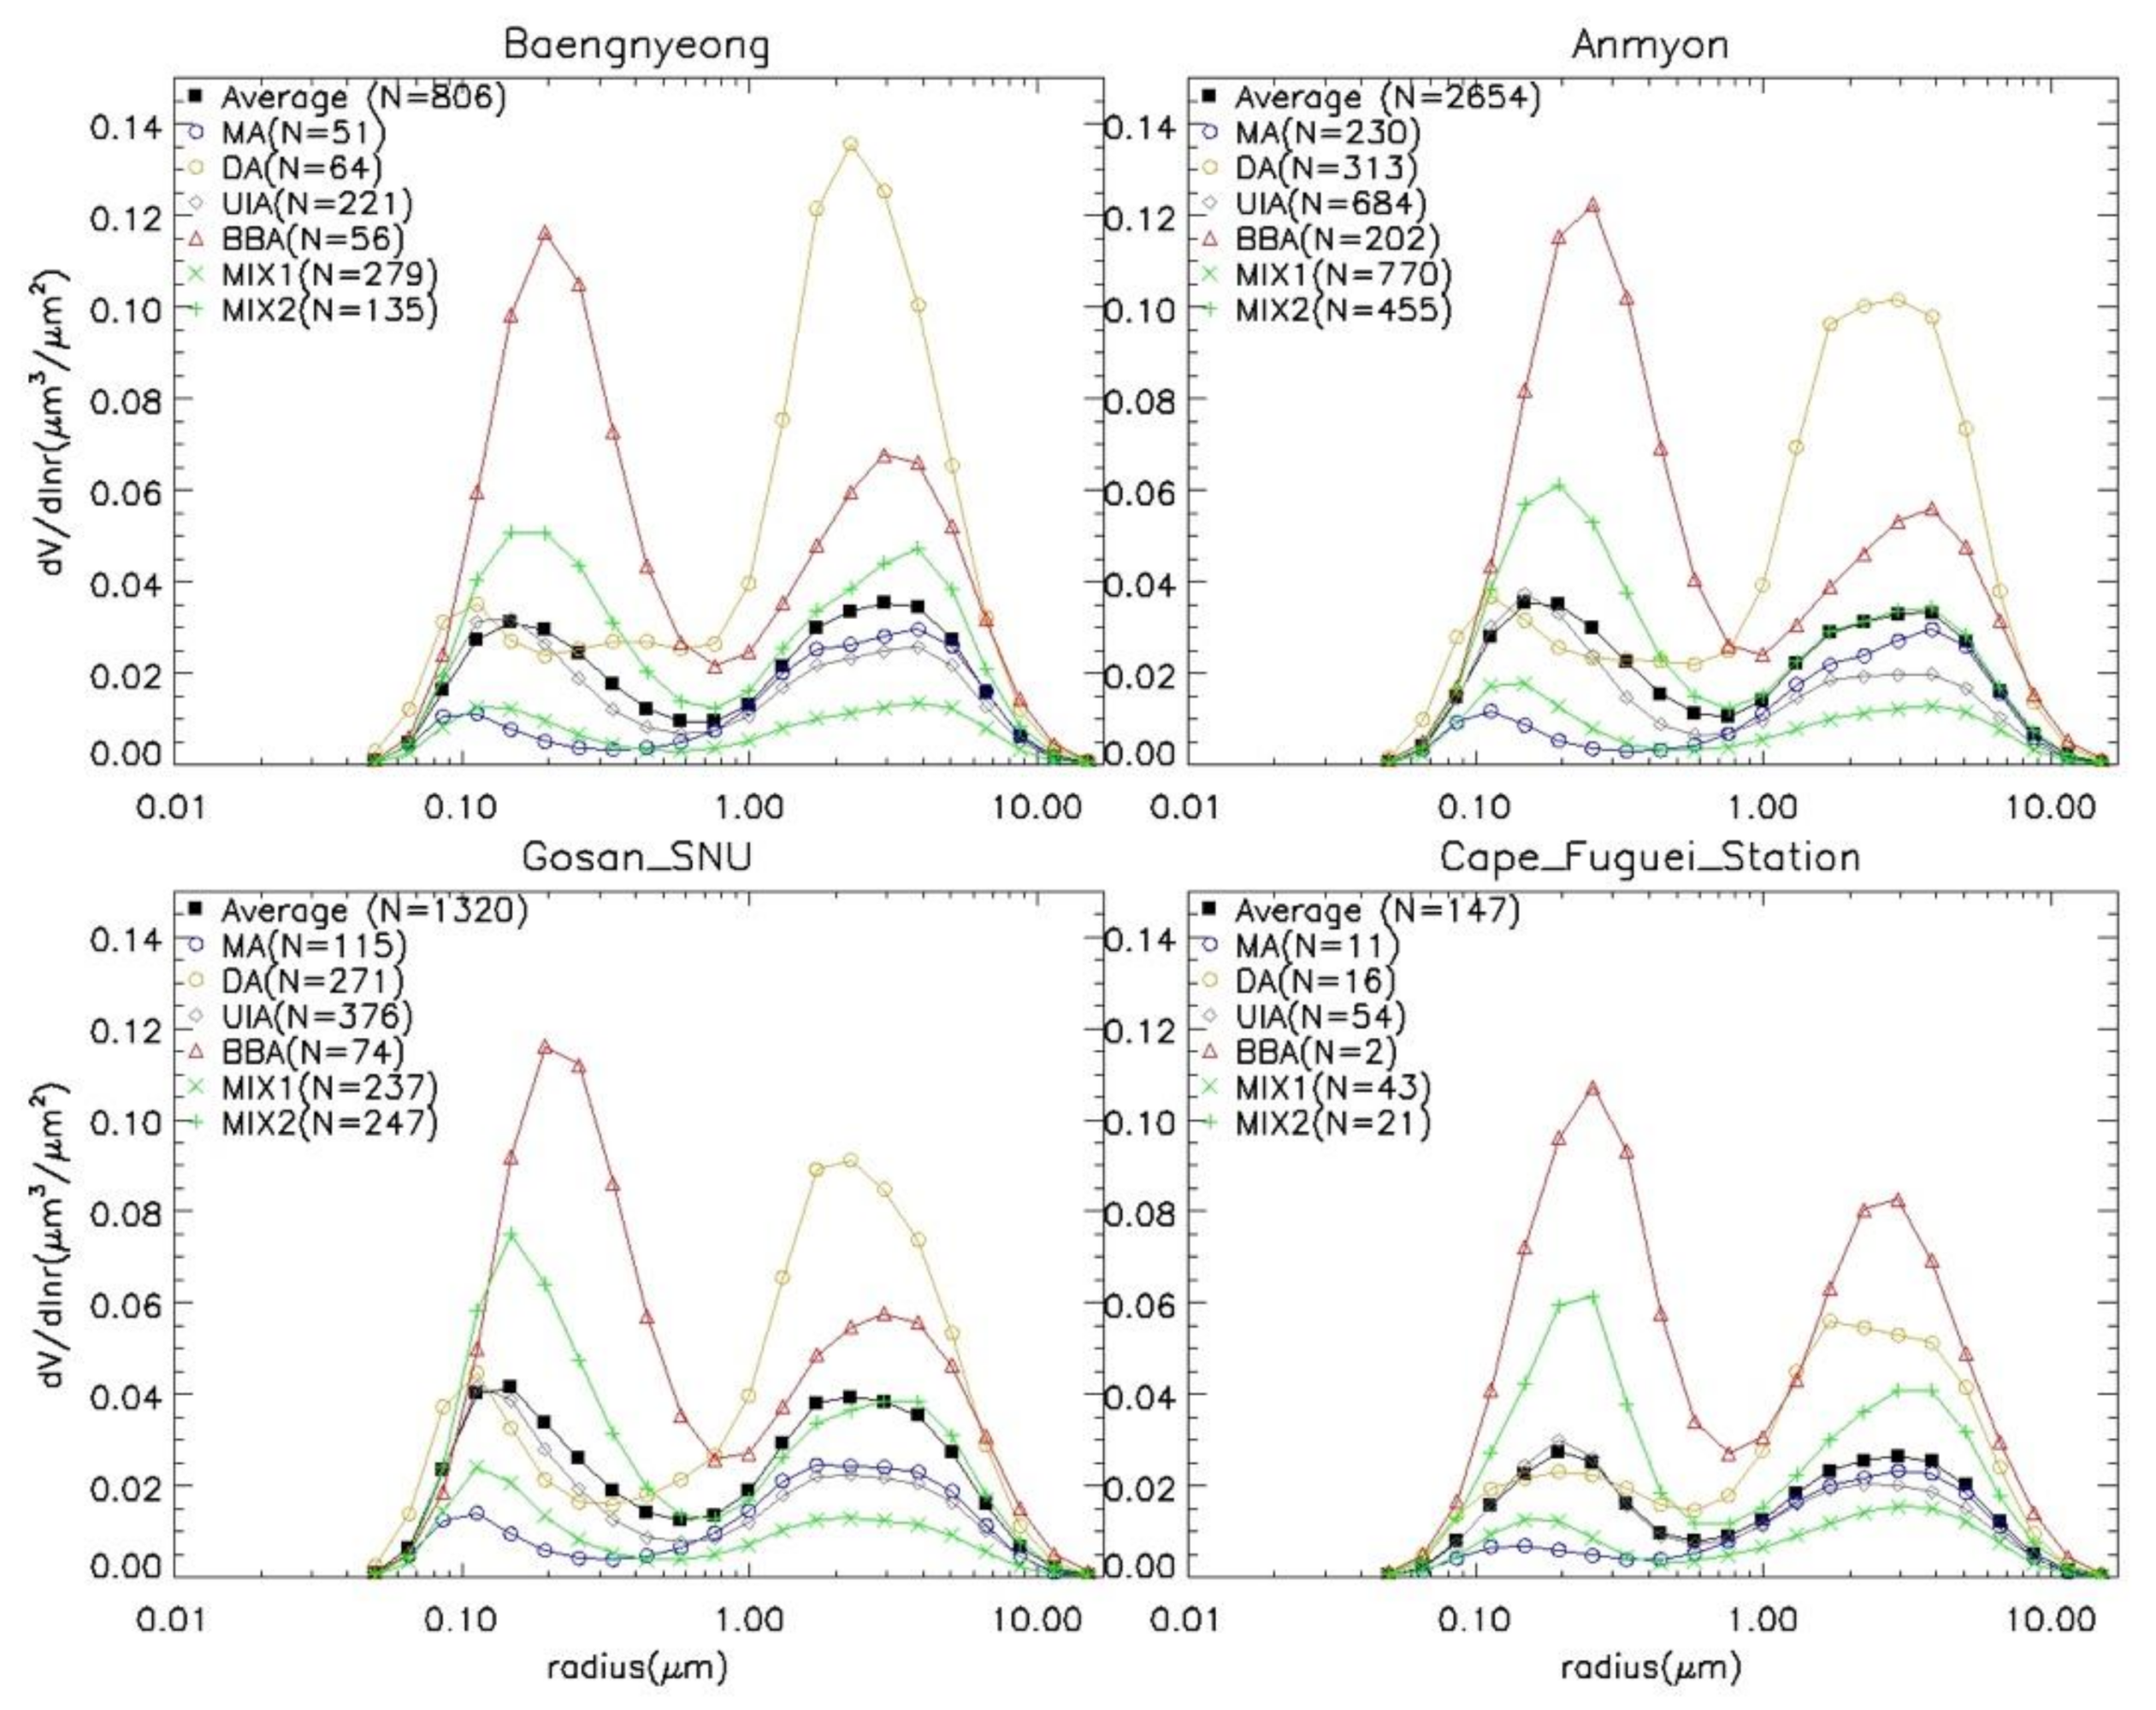
Aerosol volume size distributions (VSDs) were derived from sun and sky radiance measurements according to Formula (5), please refer to [25] for more details. The AERONET inversion algorithm provides the particle volume concentration at 22 logarithmically equidistant radii in the range of 0.05–15.0 μm. To better understand the size distribution of aerosols over the East China coastal regions, the whole inversion dataset (Level 2.0) were divided into six categories with the criterion used in the last section to character the particle size. Figure 10 shows the multi-year average aerosol particle volume size distribution of the four AERONET sites under this classification standard. The values of N in the legend are the amounts of the data involved in averaging.
It is clear that the average VSDs are quite different for each type of aerosols. The average VSD of each type of aerosols except the pure maritime aerosol also has great variations at different sites. The black filled square line illustrates the multi-year average of the VSD of all aerosol particles for each site. Two modes are obviously in these sites, a fine mode with radius < ~0.6 μm and a coarse mode with radius > ~0.6 μm. Four sites of Baengnyeong, Anmyon, Gosan_SNU, and Cape_Fuguei have roughly similar fine mode peaks (centered at ~0.15 μm) and coarse mode peaks (centered at ~2.2–2.9 μm), suggesting that similar aerosols would be present at these sites. Parameters of the columnar aerosol size distribution for the four sites are listed in Table 3. Parameters include effective radius (REff, which defined as a ratio of the third over the second moment of the size distribution), volume median radius (VMR), and width of particle size distribution (Std). Volume concentrations for fine mode, coarse mode and total are also presented in Table 3. The atmospheric column aerosol is characterized by a bimodal lognormal size distribution with a fine mode at REff = 0.16 ± 0.01 μm, and coarse mode at REff = 2.05 ± 0.1 μm. For other sites, the relative contribution of the coarse mode particles is comparable or slightly larger over the fine mode.
The blue open circle line shows the volume size distribution of pure maritime aerosol. The proportions of pure marine aerosols at each site are 6.3%, 8.7%, 8.7%, and 7.4%, respectively. The fine-mode volume concentration of pure maritime aerosol is noticeably less than the averaging value and the coarse-mode concentration. The coarse-mode volume concentration of pure maritime aerosol for Baengnyeong, Anmyon, Gosan_SNU is usually far less than the averaging value and getting more closer for the Cape_Fuguei site. It is mainly due to less amount of the dust aerosols (yellow circle line) for Cape_Fuguei site than the other sites. The VSD of dust aerosols has a noticeable larger coarse-mode volume concentration than the fine-mode. In our data set there was evidence of aerosol particles resulting from transboundary biomass burning at these sites. These types of particle are small and therefore have obvious larger fine-mode volume concentration than the coarse-mode one.
5. Conclusions
The aerosol optical properties around the East China Seas are analyzed based on 20 years (1999–2019) observations from four AERONET sites, including Baengnyeong, Anmyon, Gosan_SNU, and Cape_Fuguei_Station. The principal conclusions drawn from our work can be summarized as:
- (1)
- The frequency distribution of AOT and Ångström exponent (α) as well as the descriptive statistical for the four sites are presented. The distribution of is similar to a log-normal distribution with a right-skewed long tail larger than 0.5, while the distributions of Ångström exponent are closer to the normal distribution. The mean value (0.31–0.36) for the East China Seas sites is much larger than the background maritime conditions. The majority of Ångström exponent is usually less than 1.4–1.5 with a mean value (1.17–1.31). It is mainly because the aerosols composition over these sites are influenced by the high concentrations of natural and anthropologic from the continent.
- (2)
- Daily variations of AOT, Ångström parameter and precipitable water for the four AERONET island sites have been illustrated. Large AOT () were frequently observed in summer (June and July) and spring (March to May) followed by autumn and winter. The reason for high summer measurements in the East China Seas is that the high temperature and humidity is suitable for the gas and particles conversion, which increases the average of the particle size and leads to larger particle extinction efficiency and AOT. The large AOT observed in spring is due to the frequent presence of dust, smoke, and urban–industrial aerosol. The daily variations of Ångström exponent usually indicates a dominance of fine-mode anthropogenic aerosols from June to October while coarse-mode aerosols in the spring. The appearance of coarse-mode aerosols in spring mainly depends on the broken out and transported of Asian dust storm. While some other Ångström exponents indicate coarse mode aerosol, such as sea-salt aerosol also observed in the other seasons.
- (3)
- The 2D density plots are constructed of versus Ångström exponent to classify aerosol types as maritime aerosol (MA), dust aerosol (DA), urban/industrial aerosols (UIA), biomass burning (BBA), and mixed types. All the aerosol types were observed during the entire period. The UIA and MIX aerosol types were dominant over the East China Seas.
- (4)
- It is clear that the average VSDs are quite different for each type of aerosols. The average VSD of each type of aerosols, except for the pure maritime aerosol, also has great variations at different sites. The atmospheric column aerosol is characterized by a bimodal lognormal size distribution with a fine mode at Reff = 0.16 ± 0.01 μm, and coarse mode at Reff = 2.05 ± 0.1 μm. Variations in the size distributions were mainly due to the different types of the component and their fraction.
Author Contributions
Conceptualization, Q.T.; Observation: C.C. and S.K.; Funding acquisition, B.T., C.C. and S.K.; Supervision, Z.H.; Writing—original draft, Q.T.; Writing—review and editing, Y.Y. All authors have read and agreed to the published version of the manuscript.
Funding
This research was funded in part by the National Key Research and Development Program of China under grant no. 2018YFC0213103, in part by the National Natural Science Foundation of China, under grant no. 42006160, in part by the open fund of State Key Laboratory of Satellite Ocean Environment Dynamics, Second Institute of Oceanography, MNR, under grant no. QNHX2106, and in part by Development of Asian Dust and Haze Monitoring and Prediction Technology, under grant no. KMA2018-00521.
Institutional Review Board Statement
Not applicable.
Informed Consent Statement
Not applicable.
Data Availability Statement
AERONET data is provided freely on the internet, and possibly use and even publish with the data provided some stated guidelines are adhered to, more details please see https://aeronet.gsfc.nasa.gov/new_web/data.html (accessed on 13 May 2021).
Acknowledgments
The authors are grateful to the PIs and their staff for establishing and maintaining the four AERONET sites used in this study, Wei-Nai Chen and Charles C.K. Chou for Cape_Fuguei site, Sang-Woo_Kim for Gosan_SNU site, Mindo_Lee and Jinyoung_Choi for Baengnyeong site. The authors would also like to acknowledge the constructive criticism of anonymous reviewers.
Conflicts of Interest
The authors declare no conflict of interest.
References
- Gordon, R. Atmospheric correction of ocean color imagery in the Earth Observing System era. J. Geophys. Res. 1997, 102, 17081–17106. [Google Scholar] [CrossRef]
- Kaufman, Y.J.; Tanré, D.; Boucher, O. A satellite view of aerosols in the climate system. Nature 2002, 419, 215–223. [Google Scholar] [CrossRef] [PubMed]
- Liss, P.S.; Johnson, M.T. Ocean-Atmosphere Interactions of Gases and Particles; Springer: Berlin/Heidelberg, Germany, 2014; ISBN 9783642256424. [Google Scholar]
- Kang, L.; Chen, S.; Huang, J.; Zhao, S.; Ma, X.; Yuan, T.; Zhang, X.; Xie, T. The Spatial and Temporal Distributions of Absorbing Aerosols over East Asia. Remote Sens. 2017, 9, 1050. [Google Scholar] [CrossRef] [Green Version]
- Nakajima, T.; Sekiguchi, M.; Takemura, T.; Uno, I.; Higurashi, A.; Kim, D.; Sohn, B.J.; Oh, S.N.; Nakajima, T.Y.; Ohta, S.; et al. Significance of direct and indirect radiative forcings of aerosols in the East China Sea region. J. Geophys. Res. Atmos. 2003, 108, 2013–2015. [Google Scholar] [CrossRef]
- Tijjani, B.I.; Sha’Aibu, F.; Aliyu, A. The Effect of Relative Humidity on Maritime Tropical Aerosols. Open J. Appl. Sci. 2014, 4, 299–322. [Google Scholar] [CrossRef] [Green Version]
- Holben, B.N.; Tanré, D.; Smirnov, A.; Eck, T.F.; Slutsker, I.; Abuhassan, N.; Newcomb, W.W.; Schafer, J.S.; Chatenet, B.; Lavenu, F. An emerging ground-based aerosol climatology: Aerosol optical depth from AERONET. J. Geophys. Res. 2001, 106, 12067–12097. [Google Scholar] [CrossRef]
- Takamura, T.; Nakajima, T. Overview of SKYNET and its activities. Opt. Pura Apl. 2004, 37, 3303–3308. [Google Scholar]
- Li, Z.Q.; Xu, H.; Li, K.T.; Li, D.H.; Xie, Y.S.; Li, L.; Zhang, Y.; Gu, X.F.; Zhao, W.; Tian, Q.J. Comprehensive study of optical, physical, chemical and radiative properties of total columnar atmospheric aerosols over China: An overview of Sun-sky radiometer Observation NETwork (SONET) measurements. Bull. Am. Meteorol. Soc. 2018, 99, 739–755. [Google Scholar] [CrossRef]
- Smirnov, A.; Holben, B.N.; Kaufman, Y.J.; Dubovik, O.; Eck, T.F.; Slutsker, I.; Pietras, C.; Halthore, R.N. Optical properties of atmospheric aerosol in maritime environments. J. Atmos. Sci. 2002, 59, 501–523. [Google Scholar] [CrossRef] [Green Version]
- Sakerin, S.M.; Smirnov, A.; Kabanov, D.M.; Pol’kin, V.V.; Panchenko, M.V.; Holben, B.N.; Kopelevich, O.V. Aerosol optical and microphysical properties over the Atlantic Ocean during the 19th cruise of the Research Vessel Akademik Sergey Vavilov. J. Geophys. Res. Atmos. 2007, 112. [Google Scholar] [CrossRef] [Green Version]
- Zhang, C.; Xu, H.; Li, Z.; Xie, Y.; Li, D. Maritime Aerosol Optical and Microphysical Properties in the South China Sea Under Multi-source Influence. Sci. Rep. 2019, 9, 1–8. [Google Scholar] [CrossRef]
- Xu, X.; Xie, L.; Yang, X.; Wu, H.; Cai, L.; Qi, P. Aerosol optical properties at seven AERONET sites over Middle East and Eastern Mediterranean Sea. Atmos. Environ. 2020, 243, 117884. [Google Scholar] [CrossRef]
- Zhao, W.; Tang, J.; Gao, F.; Lin, M. Measurement and Study of Aerosol Optical Properties over the Huanghai Sea and the East China Sea in the Spring. Acta Oceanol. Sin. 2005, 27, 46–53. [Google Scholar]
- Tu, Q.; Hao, Z.; Pan, D. Mass deposition fluxes of Asian dust to the Bohai Sea and Yellow Sea from geostationary satellite MTSAT: A case study. Atmosphere 2015, 6, 1771–1784. [Google Scholar] [CrossRef] [Green Version]
- Che, H.; Gui, K.; Chen, Q.; Zheng, Y.; Yu, J.; Sun, T.; Zhang, X.; Shi, G. Calibration of the 936 nm water-vapor channel for the China aerosol remote sensing NETwork (CARSNET) and the effect of the retrieval water-vapor on aerosol optical property over Beijing, China. Atmos. Pollut. Res. 2016, 7, 743–753. [Google Scholar] [CrossRef] [Green Version]
- Holben, B.N.; Eck, T.F.; Slutsker, I.; Tanré, D.; Buis, J.P.; Setzer, A.; Vermote, E.; Reagan, J.A.; Kaufman, Y.J.; Nakajima, T. AERONET—A Federated Instrument Network and Data Archive for Aerosol Characterization. Remote Sens. Environ. 1998, 66, 1–16. [Google Scholar] [CrossRef]
- Alam, K.; Trautmann, T.; Blaschke, T.; Majid, H. Aerosol optical and radiative properties during summer and winter seasons over Lahore and Karachi. Atmos. Environ. 2012, 50, 234–245. [Google Scholar] [CrossRef]
- Adesina, J.A.; Piketh, S.J.; Formenti, P.; Maggs-Kölling, G.; Holben, B.N.; Sorokin, M.G. Aerosol optical properties and direct radiative effect over Gobabeb, Namibia. Clean Air J. 2019, 29, 1–12. [Google Scholar] [CrossRef]
- Liu, Y.; Yang, D.; Chen, W.; Zhang, H. Measurements of Asian dust optical properties over the Yellow Sea of China by shipboard and ground-based photometers, along with satellite remote sensing: A case study of the passage of a frontal system during April 2006. J. Geophys. Res. Atmos. 2010, 115, 1–11. [Google Scholar] [CrossRef] [Green Version]
- Qu, W.J.; Wang, J.; Zhang, X.Y.; Wang, D.; Sheng, L.F. Influence of relative humidity on aerosol composition: Impacts on light extinction and visibility impairment at two sites in coastal area of China. Atmos. Res. 2015, 153, 500–511. [Google Scholar] [CrossRef]
- Tan, S.-C.; Shi, G.-Y.; Wang, H. Long-range transport of spring dust storms in Inner Mongolia and impact on the China seas. Atmos. Environ. 2012, 46, 299–308. [Google Scholar] [CrossRef]
- Salinas, S.V.; Chew, B.N.; Liew, S.C. Retrievals of aerosol optical depth and Angström exponent from ground-based Sun-photometer data of Singapore. Appl. Opt. 2009, 48, 1473–1484. [Google Scholar] [CrossRef] [PubMed]
- Smirnov, A.; Holben, B.N.; Slutsker, I.; Giles, D.M.; McClain, C.R.; Eck, T.F.; Sakerin, S.M.; Macke, A.; Croot, P.; Zibordi, G.; et al. Maritime Aerosol Network as a component of Aerosol Robotic Network. J. Geophys. Res. Atmos. 2009, 114, 1–10. [Google Scholar] [CrossRef] [Green Version]
- Dubovik, O.; King, M.D. A flexible inversion algorithm for retrieval of aerosol optical properties from Sun and sky radiance measurements. J. Geophys. Res. Atmos. 2000, 105, 20673–20696. [Google Scholar] [CrossRef] [Green Version]
Figure 1.
The locations of the four AERONET sites.

Figure 2.
The monthly Level 2.0 data volume plot of aerosol optical thickness (a) and aerosol inversions (b) for each site used in this study.
Figure 2.
The monthly Level 2.0 data volume plot of aerosol optical thickness (a) and aerosol inversions (b) for each site used in this study.

Figure 3.
Frequency distribution of AOT (500 nm) for (a) Baengnyeong, (b) Anmyon, (c) Gosan_SNU, and (d) Cape_Fuguei_Station.
Figure 3.
Frequency distribution of AOT (500 nm) for (a) Baengnyeong, (b) Anmyon, (c) Gosan_SNU, and (d) Cape_Fuguei_Station.

Figure 4.
Frequency distribution of Ångström exponent for (a) Baengnyeong, (b) Anmyon, (c) Gosan_SNU, and (d) Cape_Fuguei_Station.
Figure 4.
Frequency distribution of Ångström exponent for (a) Baengnyeong, (b) Anmyon, (c) Gosan_SNU, and (d) Cape_Fuguei_Station.

Figure 5.
(a) Mean daily values of , (b) daily standard deviations of , (c) mean daily values of Ångström exponent, and (d) precipitable water vapor in the total atmospheric column at Baengnyeong, the Yellow Sea.
Figure 5.
(a) Mean daily values of , (b) daily standard deviations of , (c) mean daily values of Ångström exponent, and (d) precipitable water vapor in the total atmospheric column at Baengnyeong, the Yellow Sea.

Figure 6.
(a) Mean daily values of , (b) daily standard deviations of , (c) mean daily values of Ångström exponent, and (d) precipitable water vapor in the total atmospheric column at Anmyon, the Yellow Sea.
Figure 6.
(a) Mean daily values of , (b) daily standard deviations of , (c) mean daily values of Ångström exponent, and (d) precipitable water vapor in the total atmospheric column at Anmyon, the Yellow Sea.

Figure 7.
(a) Mean daily values of , (b) daily standard deviations of , (c) mean daily values of Ångström exponent, and (d) precipitable water vapor in the total atmospheric column at Gosan SNU, the East China Sea.
Figure 7.
(a) Mean daily values of , (b) daily standard deviations of , (c) mean daily values of Ångström exponent, and (d) precipitable water vapor in the total atmospheric column at Gosan SNU, the East China Sea.

Figure 8.
(a) Mean daily values of , (b) daily standard deviations of , (c) mean daily values of Ångström exponent, and (d) precipitable water vapor in the total atmospheric column at Cape_Fuguei_Station, the East China Sea.
Figure 8.
(a) Mean daily values of , (b) daily standard deviations of , (c) mean daily values of Ångström exponent, and (d) precipitable water vapor in the total atmospheric column at Cape_Fuguei_Station, the East China Sea.

Figure 9.
Density plots of the Ångström exponent against the AOT (500 nm) for (a) Baengnyeong, (b) Anmyon, (c) Gosan_SNU, and (d) Cape_Fuguei_Station. Legend: MA = marine aerosol, DA = dust aerosol, UIA = urban/industrial aerosol, BBA = biomass burning aerosol, MIX = mixed aerosol.
Figure 9.
Density plots of the Ångström exponent against the AOT (500 nm) for (a) Baengnyeong, (b) Anmyon, (c) Gosan_SNU, and (d) Cape_Fuguei_Station. Legend: MA = marine aerosol, DA = dust aerosol, UIA = urban/industrial aerosol, BBA = biomass burning aerosol, MIX = mixed aerosol.

Figure 10.
Multi-year average aerosol particle volume size distribution for Baengnyeong, Anmyon, Gosan_SNU, and Cape_Fuguei_Station.
Figure 10.
Multi-year average aerosol particle volume size distribution for Baengnyeong, Anmyon, Gosan_SNU, and Cape_Fuguei_Station.


Table 1.
Information of the four AERONET sites.
| Site Name | Longitude | Latitude | Altitude | Time Period | Measurements | Days | Months |
|---|---|---|---|---|---|---|---|
| Baengnyeong | 124.6303 | 37.9661 | 136 | 2010.07–2016.08 | 24,179 | 955 | 54 |
| Anmyon | 126.3302 | 36.5385 | 47 | 1999.09–2019.11 | 59,028 | 2413 | 143 |
| Gosan_SNU | 126.1617 | 33.2922 | 72 | 2001.04–2016.09 | 33,455 | 1399 | 108 |
| Cape_Fuguei | 121.5379 | 25.2975 | 40 | 2016.11–2018.08 | 4211 | 257 | 22 |
Table 2.
Descriptive statistics of AOT, Ångström exponent, and precipitable water for the four sites.
Table 2.
Descriptive statistics of AOT, Ångström exponent, and precipitable water for the four sites.
| Site Name | AOT | Angstrom | Precipitable Water | ||||||
|---|---|---|---|---|---|---|---|---|---|
| Mean | Median | Stddev | Mean | Median | Stddev | Mean | Median | Stddev | |
| Baengnyeong | 0.316 | 0.234 | 0.278 | 1.275 | 1.31 | 0.295 | 1.247 | 0.852 | 1.085 |
| Anmyon | 0.357 | 0.258 | 0.318 | 1.21 | 1.234 | 0.298 | 1.588 | 1.169 | 1.264 |
| Gosan_SNU | 0.355 | 0.281 | 0.266 | 1.18 | 1.218 | 0.334 | 1.84 | 1.343 | 1.313 |
| Cape_Fuguei | 0.311 | 0.253 | 0.227 | 1.348 | 1.361 | 0.294 | 3.384 | 3.724 | 1.353 |
Table 3.
Parameters of aerosol volume size distributions.
| Site Name | Total | Fine Mode | Coarse Mode | |||||||||
|---|---|---|---|---|---|---|---|---|---|---|---|---|
| VolC | REff | VMR | Std | VolC | REff | VMR | Std | VolC | REff | VMR | Std | |
| Baengnyeong | 0.11 | 0.36 | 0.89 | 1.38 | 0.05 | 0.16 | 0.18 | 0.49 | 0.06 | 2.15 | 2.65 | 0.64 |
| Anmyon | 0.11 | 0.36 | 0.85 | 1.34 | 0.05 | 0.16 | 0.18 | 0.48 | 0.06 | 2.14 | 2.65 | 0.65 |
| Gosan_SNU | 0.13 | 0.34 | 0.79 | 1.34 | 0.06 | 0.15 | 0.17 | 0.48 | 0.07 | 1.95 | 2.41 | 0.65 |
| Cape_Fuguei | 0.09 | 0.4 | 0.93 | 1.33 | 0.04 | 0.17 | 0.19 | 0.47 | 0.05 | 1.99 | 2.49 | 0.67 |
Note: Fine mode, radius < 0.6 μm; Coarse mode, radius > 0.6 μm; VolC, volume concentration; REff, effective radius; Std, particle size distribution; VMR, volume median radius.
Publisher’s Note: MDPI stays neutral with regard to jurisdictional claims in published maps and institutional affiliations. |
© 2021 by the authors. Licensee MDPI, Basel, Switzerland. This article is an open access article distributed under the terms and conditions of the Creative Commons Attribution (CC BY) license (https://creativecommons.org/licenses/by/4.0/).
Share and Cite
MDPI and ACS Style
Tu, Q.; Hao, Z.; Yan, Y.; Tao, B.; Chung, C.; Kim, S. Aerosol Optical Properties around the East China Seas Based on AERONET Measurements. Atmosphere 2021, 12, 642. https://0-doi-org.brum.beds.ac.uk/10.3390/atmos12050642
AMA Style
Tu Q, Hao Z, Yan Y, Tao B, Chung C, Kim S. Aerosol Optical Properties around the East China Seas Based on AERONET Measurements. Atmosphere. 2021; 12(5):642. https://0-doi-org.brum.beds.ac.uk/10.3390/atmos12050642
Chicago/Turabian StyleTu, Qianguang, Zengzhou Hao, Yunwei Yan, Bangyi Tao, Chuyong Chung, and Sumin Kim. 2021. "Aerosol Optical Properties around the East China Seas Based on AERONET Measurements" Atmosphere 12, no. 5: 642. https://0-doi-org.brum.beds.ac.uk/10.3390/atmos12050642
Note that from the first issue of 2016, this journal uses article numbers instead of page numbers. See further details here.