
Recent Advances in Our Understanding of Tropical Cyclone Intensity Change Processes from Airborne Observations


Hurricane Research Division, Atlantic Oceanographic and Meteorological Laboratory, NOAA, 4301 Rickenbacker Causeway, Miami, FL 33149, USA
Atmosphere 2021, 12(5), 650; https://0-doi-org.brum.beds.ac.uk/10.3390/atmos12050650
Submission received: 9 April 2021
/
Revised: 5 May 2021
/
Accepted: 6 May 2021
/
Published: 19 May 2021
(This article belongs to the Special Issue Rapid Intensity Changes of Tropical Cyclones)
Abstract
:Recent (past ~15 years) advances in our understanding of tropical cyclone (TC) intensity change processes using aircraft data are summarized here. The focus covers a variety of spatiotemporal scales, regions of the TC inner core, and stages of the TC lifecycle, from preformation to major hurricane status. Topics covered include (1) characterizing TC structure and its relationship to intensity change; (2) TC intensification in vertical shear; (3) planetary boundary layer (PBL) processes and air–sea interaction; (4) upper-level warm core structure and evolution; (5) genesis and development of weak TCs; and (6) secondary eyewall formation/eyewall replacement cycles (SEF/ERC). Gaps in our airborne observational capabilities are discussed, as are new observing technologies to address these gaps and future directions for airborne TC intensity change research.
1. Introduction
Tropical cyclones (TCs) plague coastal communities around the world, threatening millions of lives and causing many billions of dollars in damage to infrastructure. The primary hazards responsible for many of the fatalities and damage in coastal communities include storm surge and wind damage, while further inland hazards include torrential rainfall and severe weather that often accompany landfalling TCs. The danger from these hazards is only increasing due to greater coastal development worldwide, increasing sea surface temperature, and sea level rise.
The ongoing threat from these hazards has necessitated significant efforts to improve their prediction. The intensity of TCs, as indicated by the minimum sea-level pressure and the peak winds, is a key parameter in determining how much damage occurs when a TC makes landfall. Compared to TC track forecasting, which has seen steady improvement over the past several decades, progress in predicting TC intensity, while improving in recent years [1], has advanced more slowly [2,3]. When considering cases of a TC undergoing rapid intensification (RI), defined as when the peak winds increase by ~15 m s−1 over a 24 h period [4], intensity forecasts perform even worse, sometimes by as much as a factor of three compared with forecasts of non-RI cases (Figure 1). Clearly improvements in the prediction of intensifying TCs—RI, in particular—are a crucial step in improving overall TC intensity forecasts.
As with any forecast system, an improved understanding of the underlying physical processes is a vital step in making better forecasts. TC intensity change is difficult to predict largely because of its multiscale nature, with physical processes ranging from thousands of kilometers and multiple days (e.g., environmental vertical shear, trough interactions) to ~100 km and 12–24 h (e.g., eyewall replacement cycles) to 0.1–10 km and 0.1–3 h (e.g., deep convection and turbulent mixing) to micron to centimeter-scale and seconds (e.g., hydrometeor production and conversion, latent heat release). Accurately representing these processes and their interactions across spatiotemporal scales requires a comprehensive understanding of them and a faithful depiction, or reasonable approximation of them in the initial conditions, governing equations, and physical parameterizations of numerical modeling systems.
A great deal of resources has been dedicated on a global scale to improving spaceborne, airborne, and ground-based observing systems [5] that monitor TC position, intensity, and structure. Data from these observing systems are key as inputs to the numerical model guidance crucial in making forecasts of TC hazards. Each of these observing systems bring their own advantages to the ability to sample the TC and its environment. Aircraft and the associated remote-sensing instrumentation and expendables released from them provide a unique capability to sample many different aspects of TCs, including environmental conditions ranging from the lower stratosphere to the air–sea interface and below as well as inner-core structures in the most hostile environments possible.
The unique capabilities of airborne observing systems allow them to be an important complement to satellites and ground-based assets in providing data sets for fundamental process studies as well as assimilation in and evaluation of numerical modeling systems. In recognition of this importance, numerous efforts within the United States (U.S.) and, increasingly, in the international community have taken advantage of aircraft. In recent years, there have been multiple aircraft field campaigns designed to study aspects of the TC intensity change problem. In the U.S., this began ~15 years ago, with the National Oceanic and Atmospheric Administration (NOAA) Intensity Forecasting Experiment (IFEX; [3,6]). There was additionally the NOAA Sensing Hazards with Operational Unmanned Technology (SHOUT) experiment in 2015–2016 [7]. Other U.S.-based field campaigns include the National Aeronautical and Space Administration (NASA) extension to the African Monsoon Multidisciplinary Analyses (NAMMA; [8]), Genesis and Rapid Intensification Project (GRIP; [9]), and Hurricane and Severe Storm Sentinel (HS3; [10]); the National Science Foundation (NSF) Pre-depression Investigation of Cloud Systems in the Tropics (PREDICT; [11]); and the Office of Naval Research (ONR) Tropical Cyclone Structure—08 Experiment (TCS-08), Tropical Cyclone Intensity Experiment (TCI; [12]), and Impact of Typhoons on the Ocean in the Pacific (ITOP; [13]). The aircraft used in these experiments include crewed aircraft capable of penetrating the inner core of TCs at altitudes of ~0.5–5 km (NOAA WP-3D, Air Force C-130) and sampling broad regions of the environment and over the inner core at altitudes as high as ~12–18 km (NOAA G-IV, National Center for Atmospheric Research (NCAR)/NSF G-V, and NASA DC-8, ER-2, WB-57). They also include uncrewed aircraft capable of sampling the lowest altitudes within the TC boundary layer (Raytheon Corporation’s Coyote) and highest altitudes for extremely long durations of ~24 h (NASA Global Hawk). Many of the experiments mentioned above occurred in partnership with one another, leveraging airborne assets to provide an even greater ability to sample TCs.
Recent years have also seen increasing capacity for airborne sampling of TCs internationally, with many field campaigns primarily concentrated in the west Pacific basin. These include the Dropwindsonde Observations for Typhoon Surveillance near the Taiwan Region program (DOTSTAR; [14]); typhoon reconnaissance missions flown by the Hong Kong Observatory [15,16]; the Experiment on Typhoon Intensity Change in Coastal Area (EXOTICCA; [17]) in China; and the Tropical cyclone-Pacific Asian Research Campaign for Improvement of Intensity estimates/forecasts (T-PARCII; [18]) in Japan. These experiments have used platforms with generally similar capabilities to those in the U.S., and their teams have sometimes collaborated in ways similar to those of U.S. experimental teams.
This paper will present a review of research since the advent of the U.S. NOAA IFEX field campaign, i.e., ~15 years ago, that has used aircraft data to advance our understanding of physical processes important in TC intensity change. In extensive studies prior to this period, TCs were examined with aircraft, but, with limited exception, those studies will not be covered here. The interested reader is referred to [19,20] for a comprehensive assessment of these earlier studies that documented TC structure and intensity from aircraft observations.
Intensity change, as defined here, includes a range of intensification rates, including the RI of tropical storms to major hurricanes; slower (but still substantial) intensification of TCs with initial intensities ranging from tropical depressions to hurricane strength; the organization of tropical depressions into tropical storms that subsequently undergo RI; and the formation of tropical depressions from disorganized tropical cloud clusters. While the relevant physical processes may differ depending on the initial structure and intensity of the TC and its environment, what these situations share is that they are a challenging forecast problem that can be aided by insights gained from aircraft observations. This paper will discuss the studies that have contributed to our improved understanding of intensity change processes using aircraft data, focusing on several different aspects of TC intensity change, regions of the atmosphere, and stages of the TC lifecycle:
- (a)
- Characterizing TC structure and its relationship to intensity change
- (b)
- TC intensification in vertical shear
- (c)
- Planetary boundary layer (PBL) processes and air–sea interaction
- (d)
- Upper-level warm core structure and evolution
- (e)
- Genesis and development of weak TCs
- (f)
- Secondary eyewall formation/eyewall replacement cycles (SEF/ERC)
and then provide a discussion of future directions, including an assessment of continued observational gaps in airborne TC data collection, new observing technologies, and new research directions.
2. Characterizing TC Structure and Its Relationship to Intensity Change
With several decades worth of TC missions flown by aircraft, there is a tremendous database of airborne observations that has been accumulated. Such a database allows for analyses of individual cases to provide in-depth exploration of physical processes and their evolution in time, and composite studies to identify statistically robust differences in vortex- and convective-scale structures of TCs encountering a variety of environmental conditions and structure and intensity changes.
Most of the recent research involving aircraft data for TC intensity change studies has used dropsondes, which collect in situ near-vertical profiles of winds, temperature, moisture, and pressure; airborne radar (often tail Doppler radar; TDR), which remotely samples reflectivity and three-dimensional winds (if it is a Doppler radar and when adequate scatterers are present); and flight-level measurements of winds, temperature, moisture, and pressure. In some cases, these data sets have been used in combination, providing a rich context for observing TC kinematic, thermodynamic, and precipitation structures and understanding their interactions. These studies span a range of topics, locations in the atmosphere, ocean, and its interface, and stages of the TC lifecycle. This range of topics is discussed below.
2.1. Characteristics of Inner-Core Structure
Rogers et al. [21] was the first paper to demonstrate the ability of multicase composites of TDR data to capture the inner-core structure of TCs seen in previous single-case studies (e.g., [22]). This study showed the composite mean structure of tangential and radial wind, vertical velocity, reflectivity, and vorticity and divergence for missions into eight hurricanes that occurred over a ~11-year period (Figure 2). In addition to the vortex-scale properties shown in Figure 2, Rogers et al. [21] also showed statistics of convective-scale properties of vertical velocity and reflectivity and turbulent-scale properties of turbulent kinetic energy (TKE), as well as the variance of different parameters within the data set. This approach set the stage for several composite-based studies that followed, including the development of a more extensive database of TDR measurements spanning a much broader time and larger number of TCs [23].
Characteristics of eyewall slope were explored using TDR data first in [24], and subsequently by [25,26], who considered variations in eyewall slope relative to the environmental wind shear vector. Lorsolo et al. (2010) [27] calculated two-dimensional profiles of TKE using the TDR data, finding that the strongest turbulence was generally located in convective regions, such as the eyewall, and in the boundary layer in the lowest kilometer. The strong turbulence was generally associated with strong horizontal shear of vertical and radial wind components in the eyewall and strong vertical shear of horizontal wind in the boundary layer. Creasey and Elsberry [28] showed a novel technique for using high-altitude dropsondes to estimate the variation of TC centers with height. This technique was used in a study of the structural evolution of Hurricane Joaquin (2015) during its rapid decay [29].
2.2. Response of TC Structure to Environmental Forcing
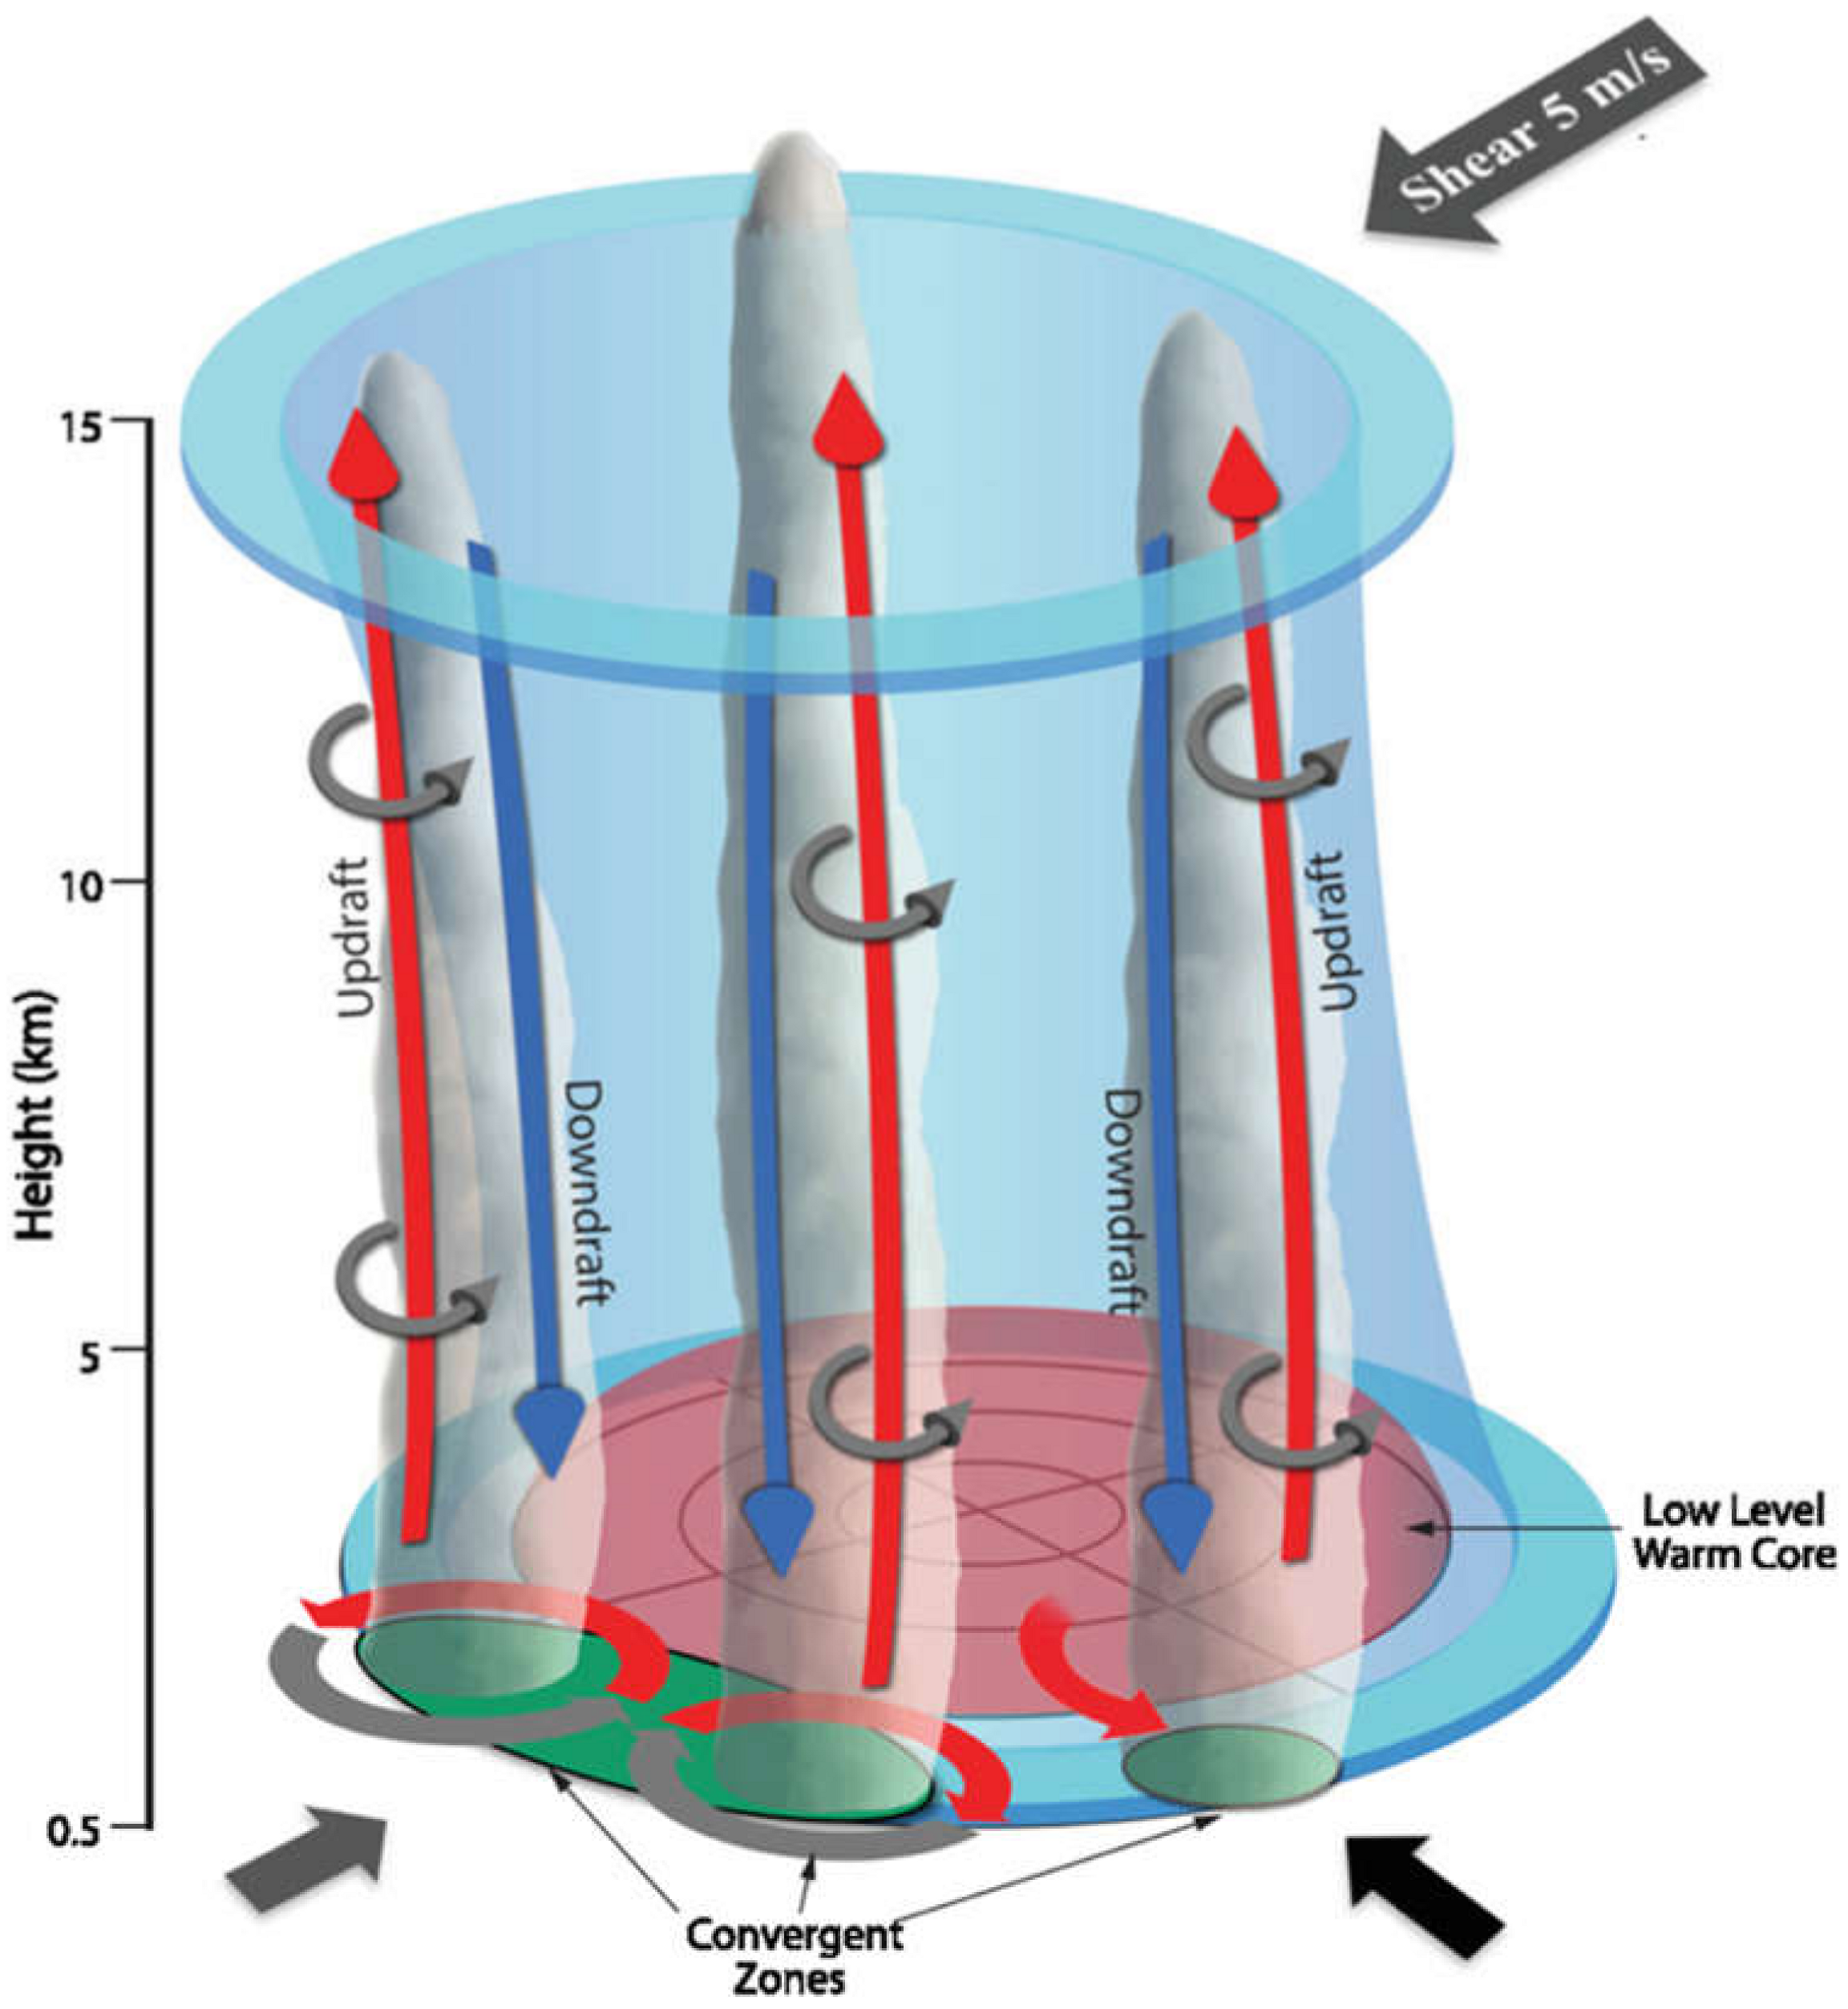
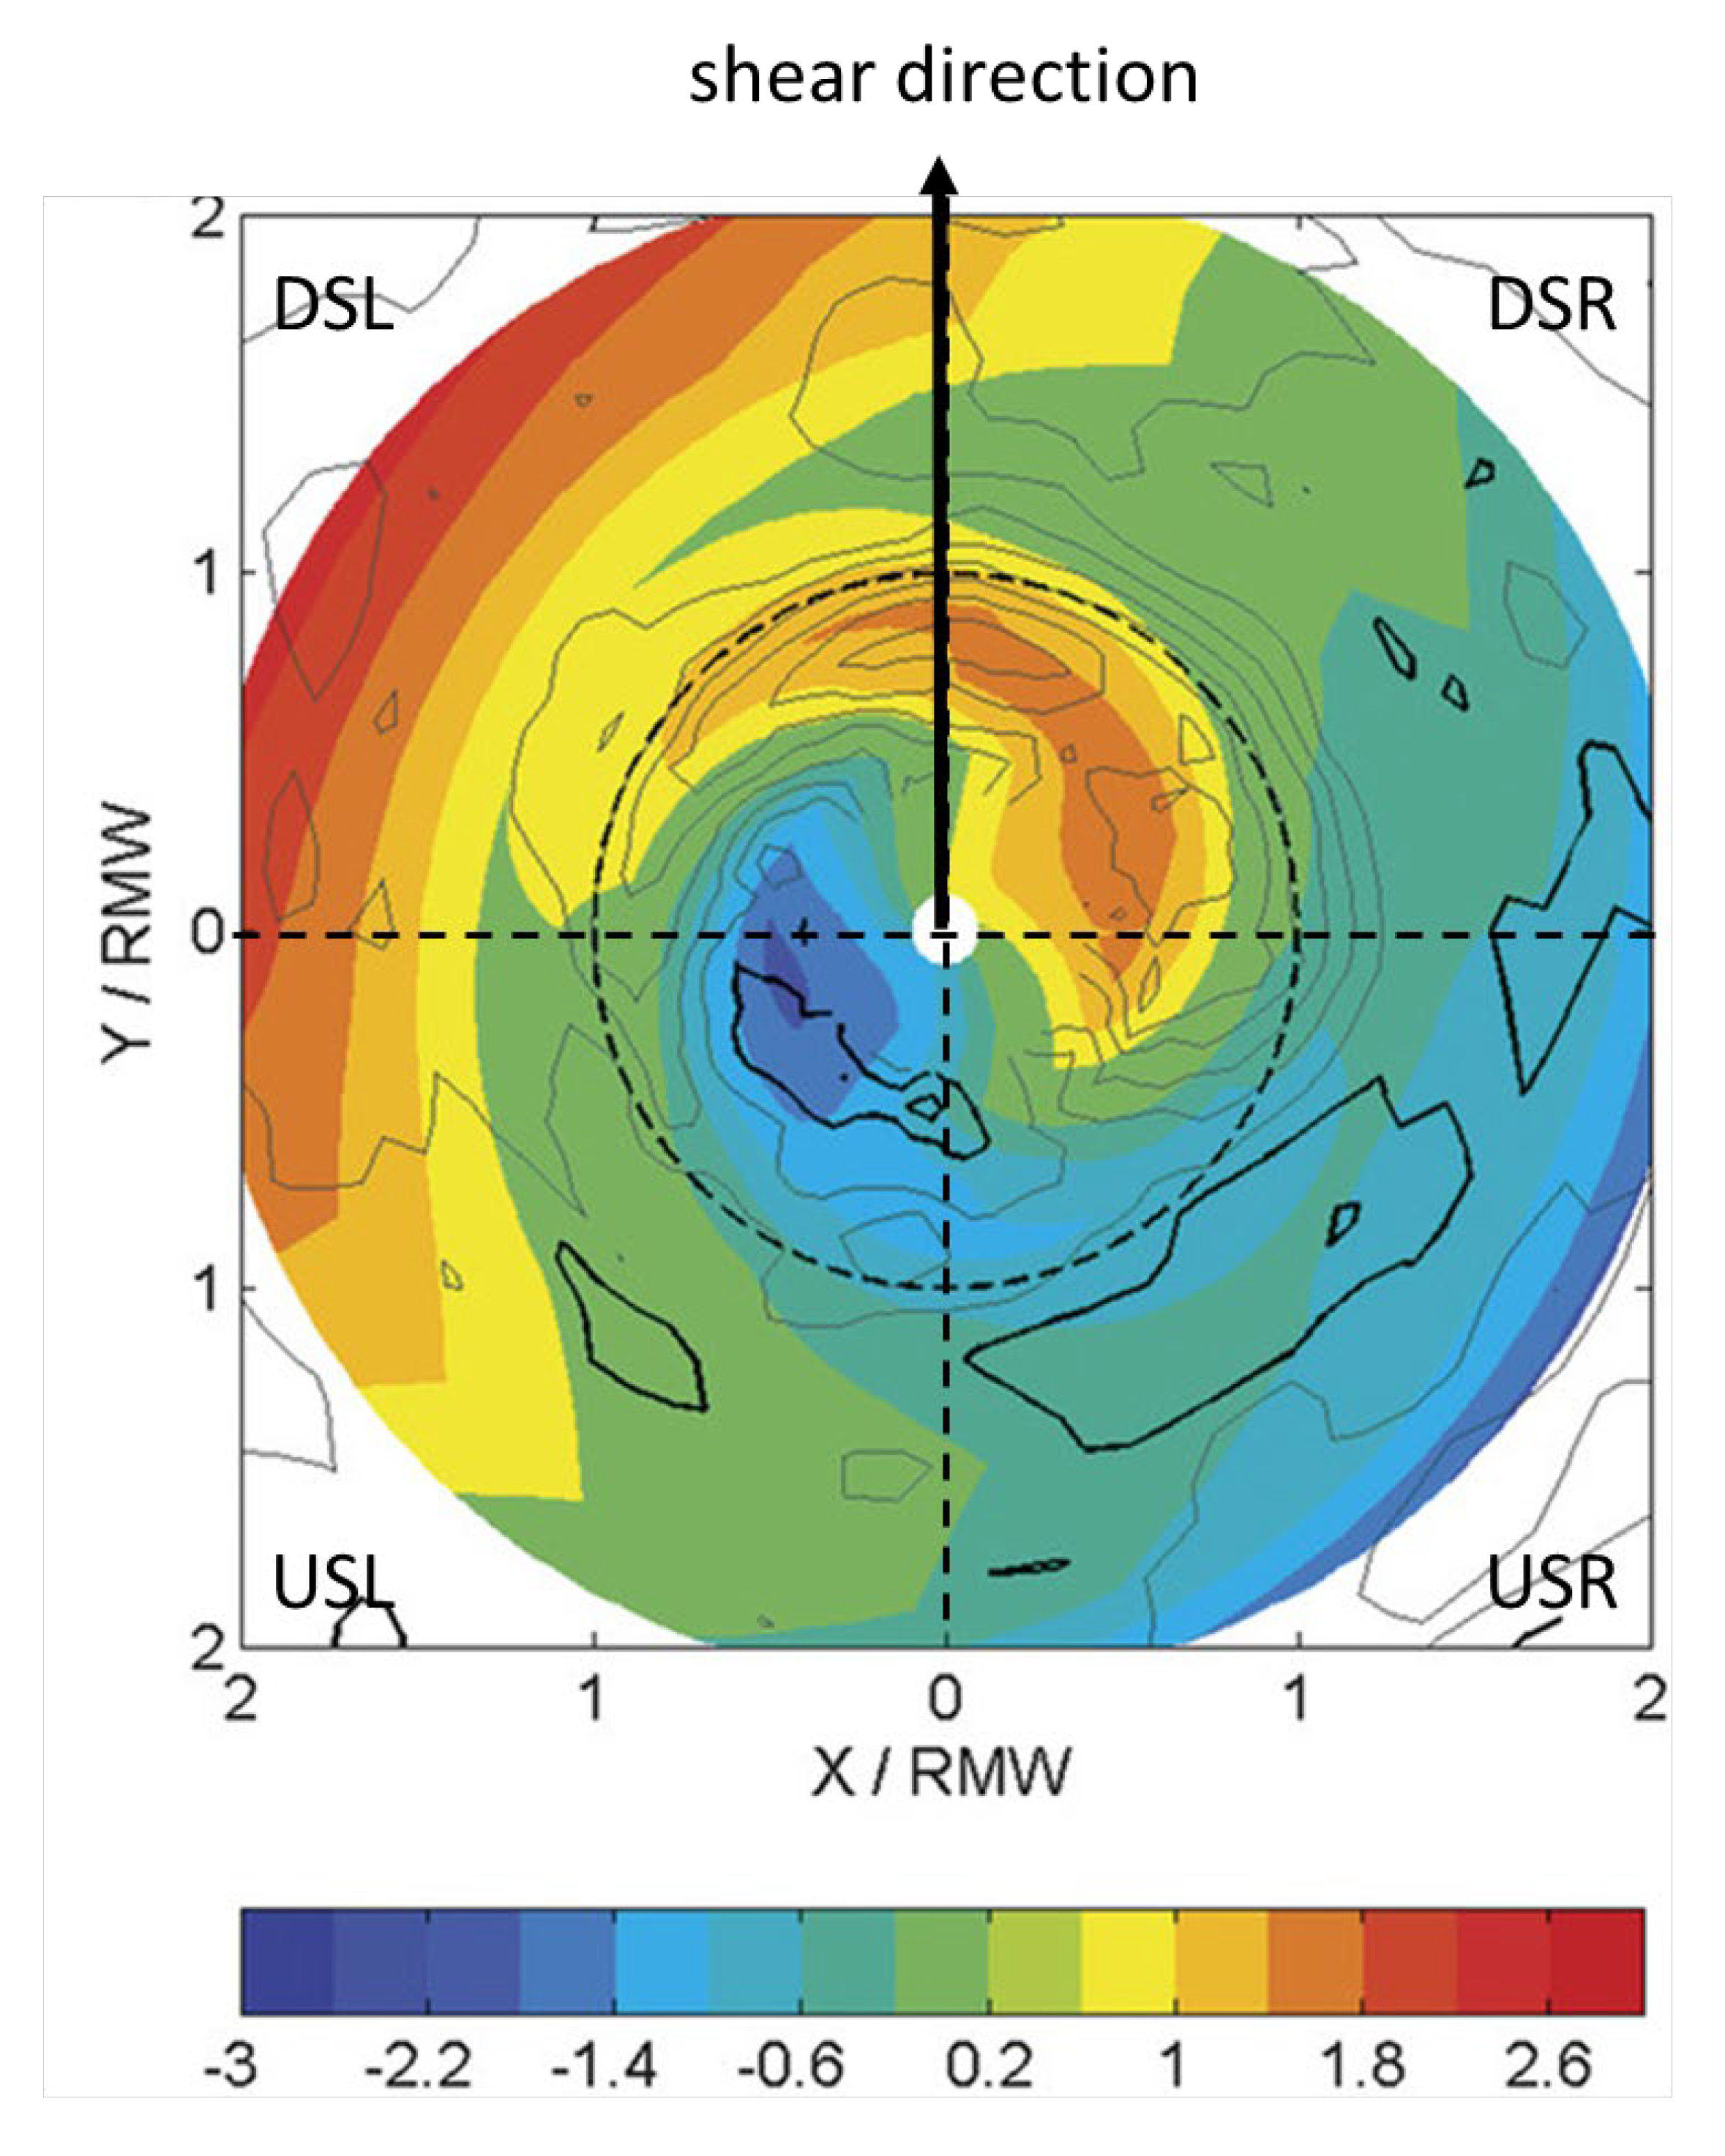
Following the TDR composite methodology described in [21], the response of TC structure to environmental vertical shear was investigated in [30]. Their analysis showed many of the vortex-scale characteristics seen in previous studies for TCs of hurricane strength encountering moderate to strong shear (850–200 hPa shear > 7 m s−1); e.g., downshear tilt, a precipitation maximum downshear left, low-level (midlevel) inflow (outflow) downshear right (DSR) and downshear left (DSL), and midlevel (low-level) inflow (outflow) upshear left (USL) and upshear right (USR; Figure 3). A similar composite approach focusing on variations in convective-scale structure relative to the vertical shear was shown in DeHart et al. (2014) [31]. A schematic from their paper (Figure 4) shows that convective initiation occurs primarily in the DSR quadrant, matures DSL, and becomes predominantly downdrafts in the USL and USR quadrants.
Other composite studies, using dropsonde and flight-level data, have further elucidated TC structure and its response to environmental forcing, such as the relationship between azimuthal asymmetries in surface and flight-level wind speed and vertical shear and storm motion (e.g., [32]). Zhang et al. [33] used composites of dropsonde data to investigate TC structure in response to another environmental forcing, i.e., the diurnal cycle. They found oscillations in the strength of inflow in the planetary boundary layer that varied in phase with the diurnal cycle, consistent with numerical model studies and satellite observations showing expanding cold cloud shields also tied to the diurnal cycle (e.g., [34,35]).
2.3. Relationship between TC Structure and Intensity Change
Composites of TC structure have also been related to subsequent intensity change. A composite analysis of TDR data for intensifying (ΔVmax ≥ 20 kt in 24 h after mission, where Vmax is best-track wind speed) vs. nonintensifying (−10 kt ≤ ΔVmax ≤ 10 kt in 24 h) TCs of hurricane strength found that intensifying TCs were associated with a ring-like vorticity structure inside the RMW, lower vorticity in the outer core, and a stronger and deeper inflow layer compared to steady-state TCs [36]. Another key result from this study was that intensifying TCs had the majority of grid points with the strongest updrafts, identified as “convective bursts” in this study, inside the radius of maximum wind (RMW) at 2 km altitude. By contrast, steady-state TCs had the majority of their convective bursts outside the 2-km RMW (Figure 5). A similar relationship was noted in a case study of Hurricane Earl (2010; Rogers et al., 2015, [37,38,39]). The relationship between bursts inside the RMW and TC intensification was initially interpreted as providing a more efficient, vorticity-rich environment for the conversion of diabatic heating into increases in the TC primary circulation [40,41,42,43]. Recent work, however, has challenged that interpretation, and instead emphasized the role of deep convection inside the RMW as providing a favorable environment for spinning up angular momentum in the planetary boundary layer (PBL; [44,45,46]).
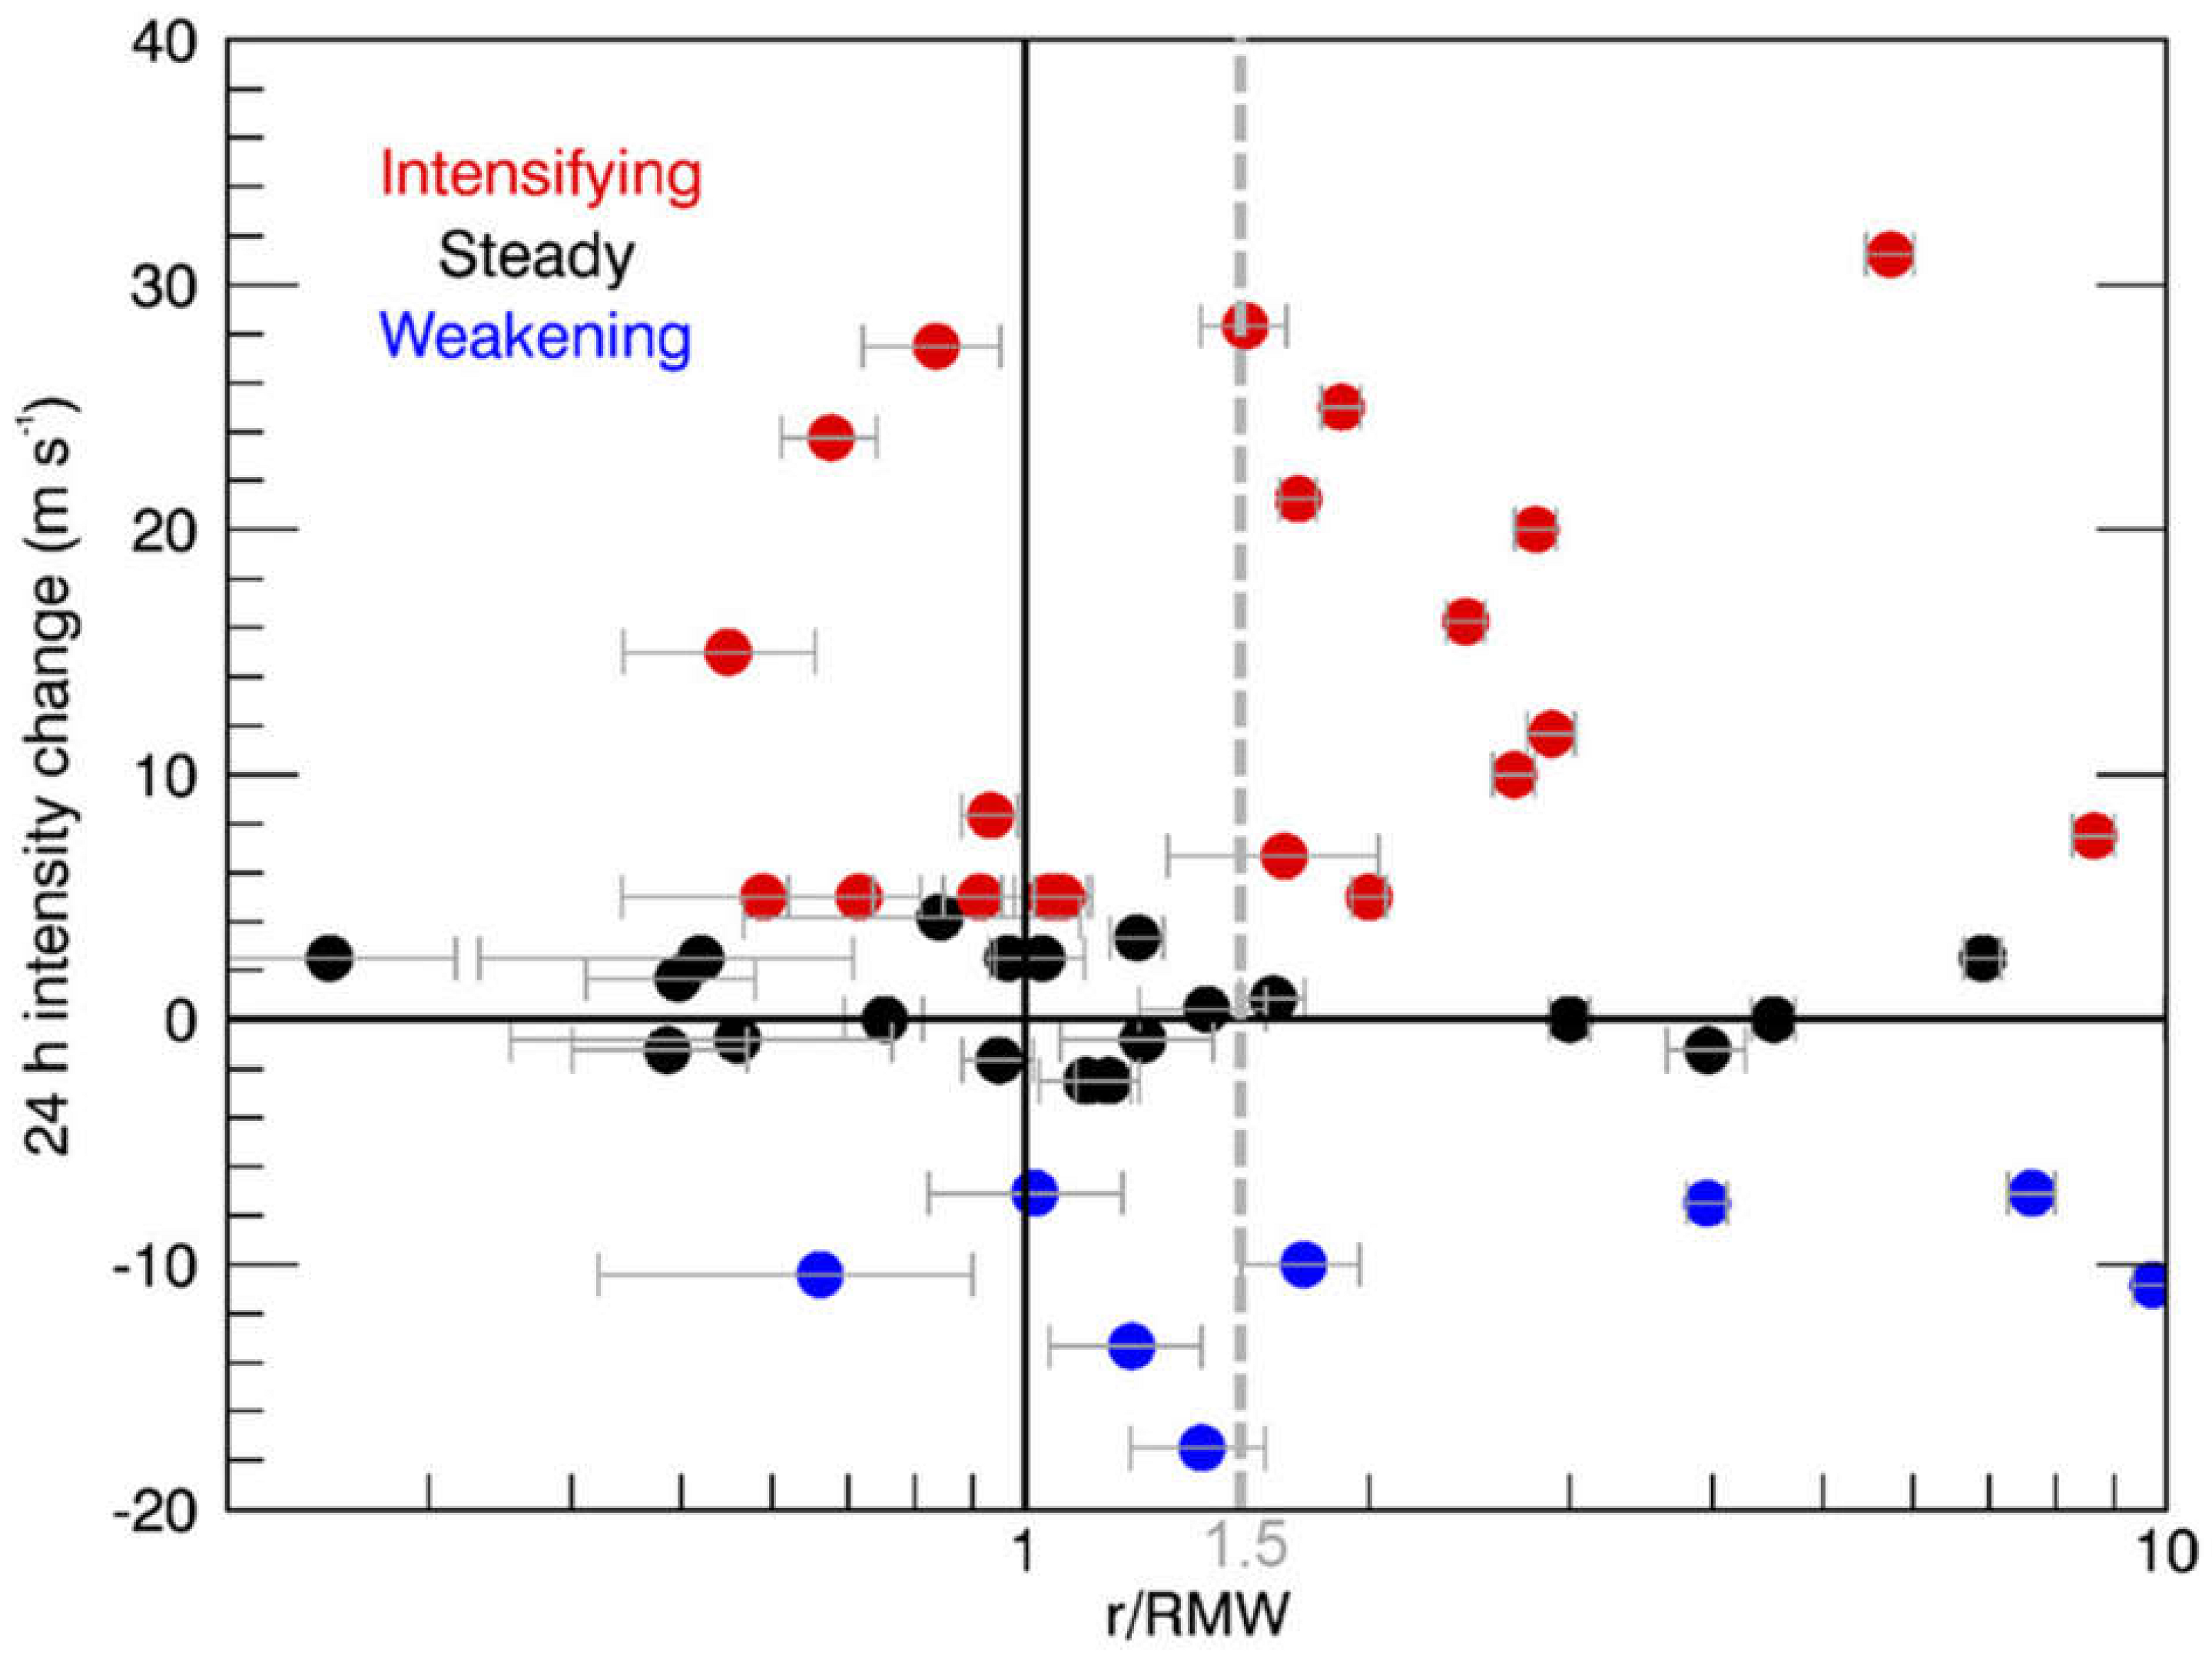
Regardless of the mechanism for intensification, the occurrence of the bulk of deep convection inside the RMW has been identified as an indicator of TC intensification by a diverse array of observational platforms. Stevenson et al. [47] used an aircraft flight-level database (FLIGHT+, Extended Flight Level Dataset for Tropical Cyclones; [48]) in conjunction with ground-based lightning detection (World Wide Lightning Location Network, WWLLN; [49]) to note a similar relationship. This study related the radial location of lightning flashes with the flight-level RMW (Figure 6). The average 24-h intensity change of TCs with an inner-core lightning burst inside the RMW was 5.3 m s−1, with seven TCs intensifying and only one weakening after the onset of the lightning burst. By contrast, the average intensity change for TCs with a lightning burst outside the RMW (between 1 and 1.5 ×RMW) was −2.6 m s−1. This result, using a completely different data set in different TCs, supports the notion that deep convection inside the RMW is a favorable configuration for TC intensification.
Similar relationships between vortex structure and TC intensity change were found in other composites of flight-level data, along with higher inner- and outer-core moisture for intensifying TCs [50]. Case study analyses were conducted for the record-breaking rapidly intensifying East Pacific Hurricane Patricia [51], including a novel analysis of potential vorticity using airborne Doppler and dropsonde data [52] that found that Patricia’s rapid intensification was closely related to the distribution of diabatic heating and eddy mixing. Guimond et al. [53], using Doppler radar data from the high-altitude NASA ER-2 aircraft, documented an episode of convective bursts occurring during the mature stage of Hurricane Dennis (2005) that preceded a period of RI. They observed significant downdrafts on the flanks of the updrafts at high altitude, with their cumulative effects hypothesized to result in the observed increases in the warm core strength.
3. TC Intensification in Vertical Shear
A significant amount of effort in the past ~10 years has been devoted to collecting and analyzing aircraft data to explore the relationship between environmental vertical wind shear and TC intensification. While the detrimental impact of strong vertical shear on TC intensification is well-documented, when shear falls into a moderate range (defined as falling within 4.5–11 m s−1 between 850 and 200 hPa [54], significant forecast errors can result [55,56]. As a result of this uncertainty, a better understanding of TC response to moderate shear has been identified by the National Hurricane Center as a high priority [57].
3.1. Vortex Tilt and Precipitation Symmetry
Much of this work has been done within the context of latent heating distributions in the TC core. In terms of the azimuthal distribution of precipitation, coverage that extends around the storm results in a greater projection of latent heating onto the symmetric mode, a configuration noted as being more favorable for intensification [40,58,59,60]. A primary factor inhibiting precipitation symmetry is vertical wind shear, which imparts a tilt of the vortex and a wavenumber-1 asymmetry in precipitation maximized in the DSL quadrant of the storm, relationships that have been documented by numerous studies (e.g., [30,31,61,62,63,64]).
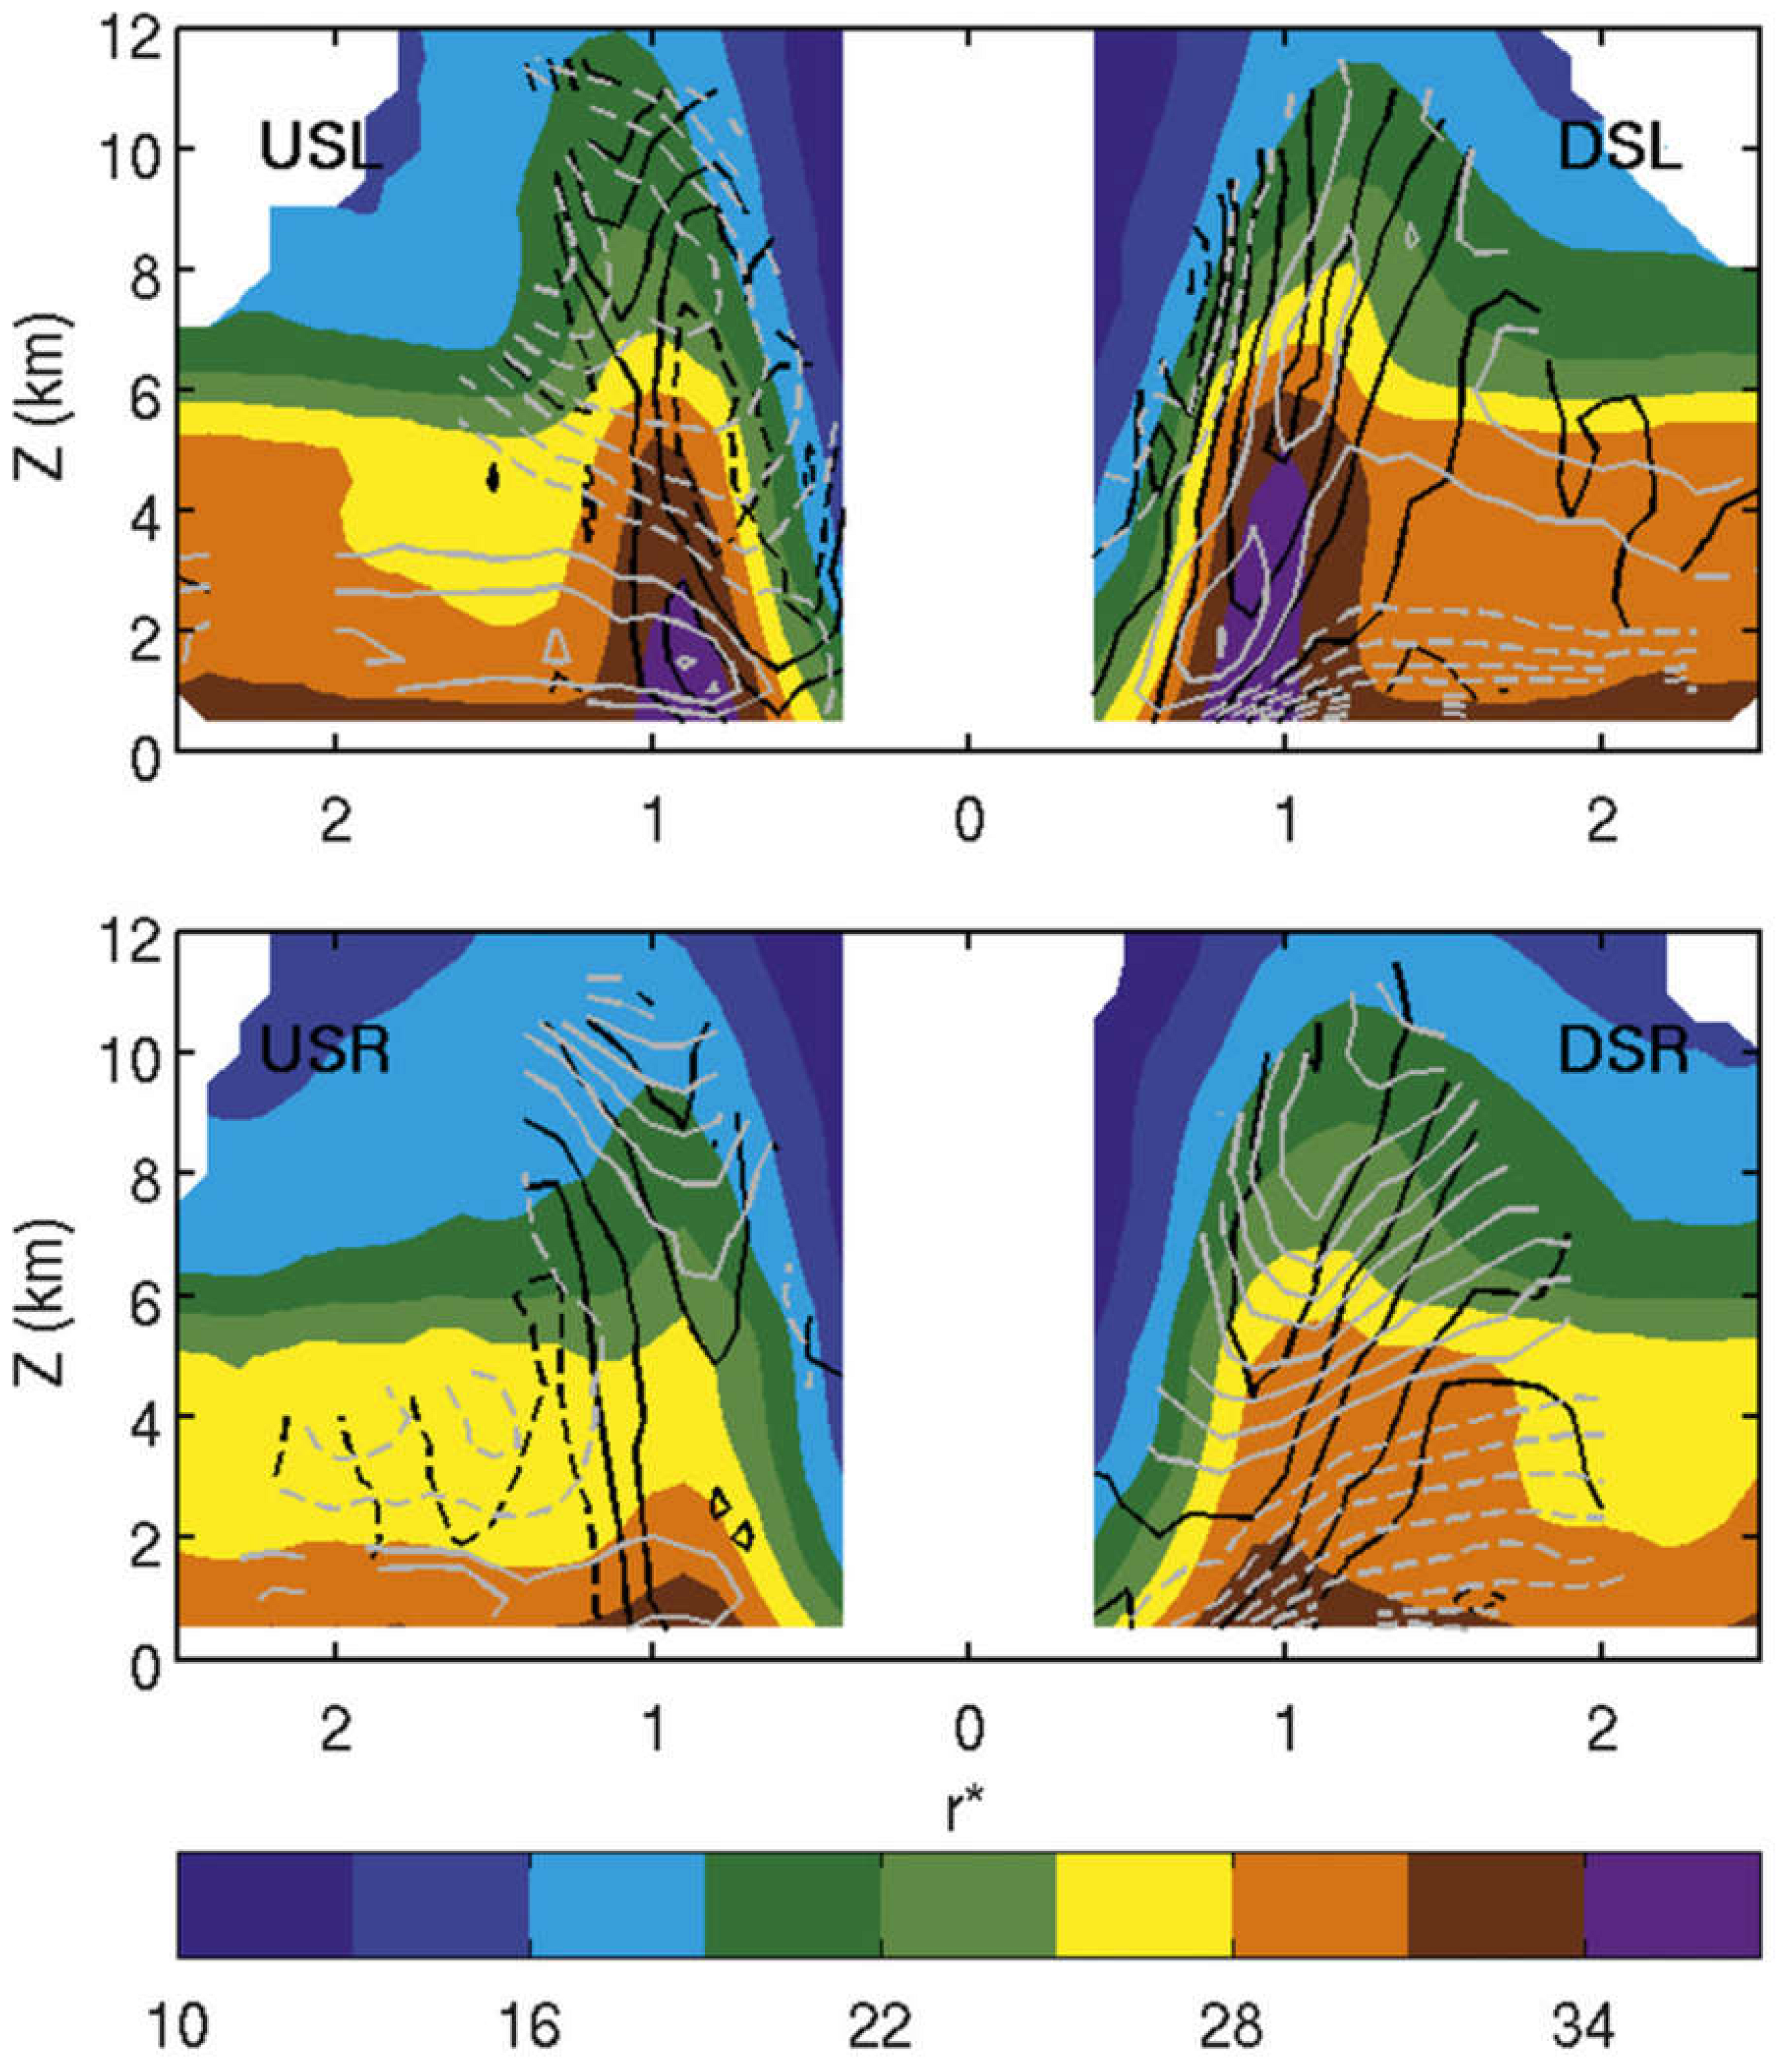
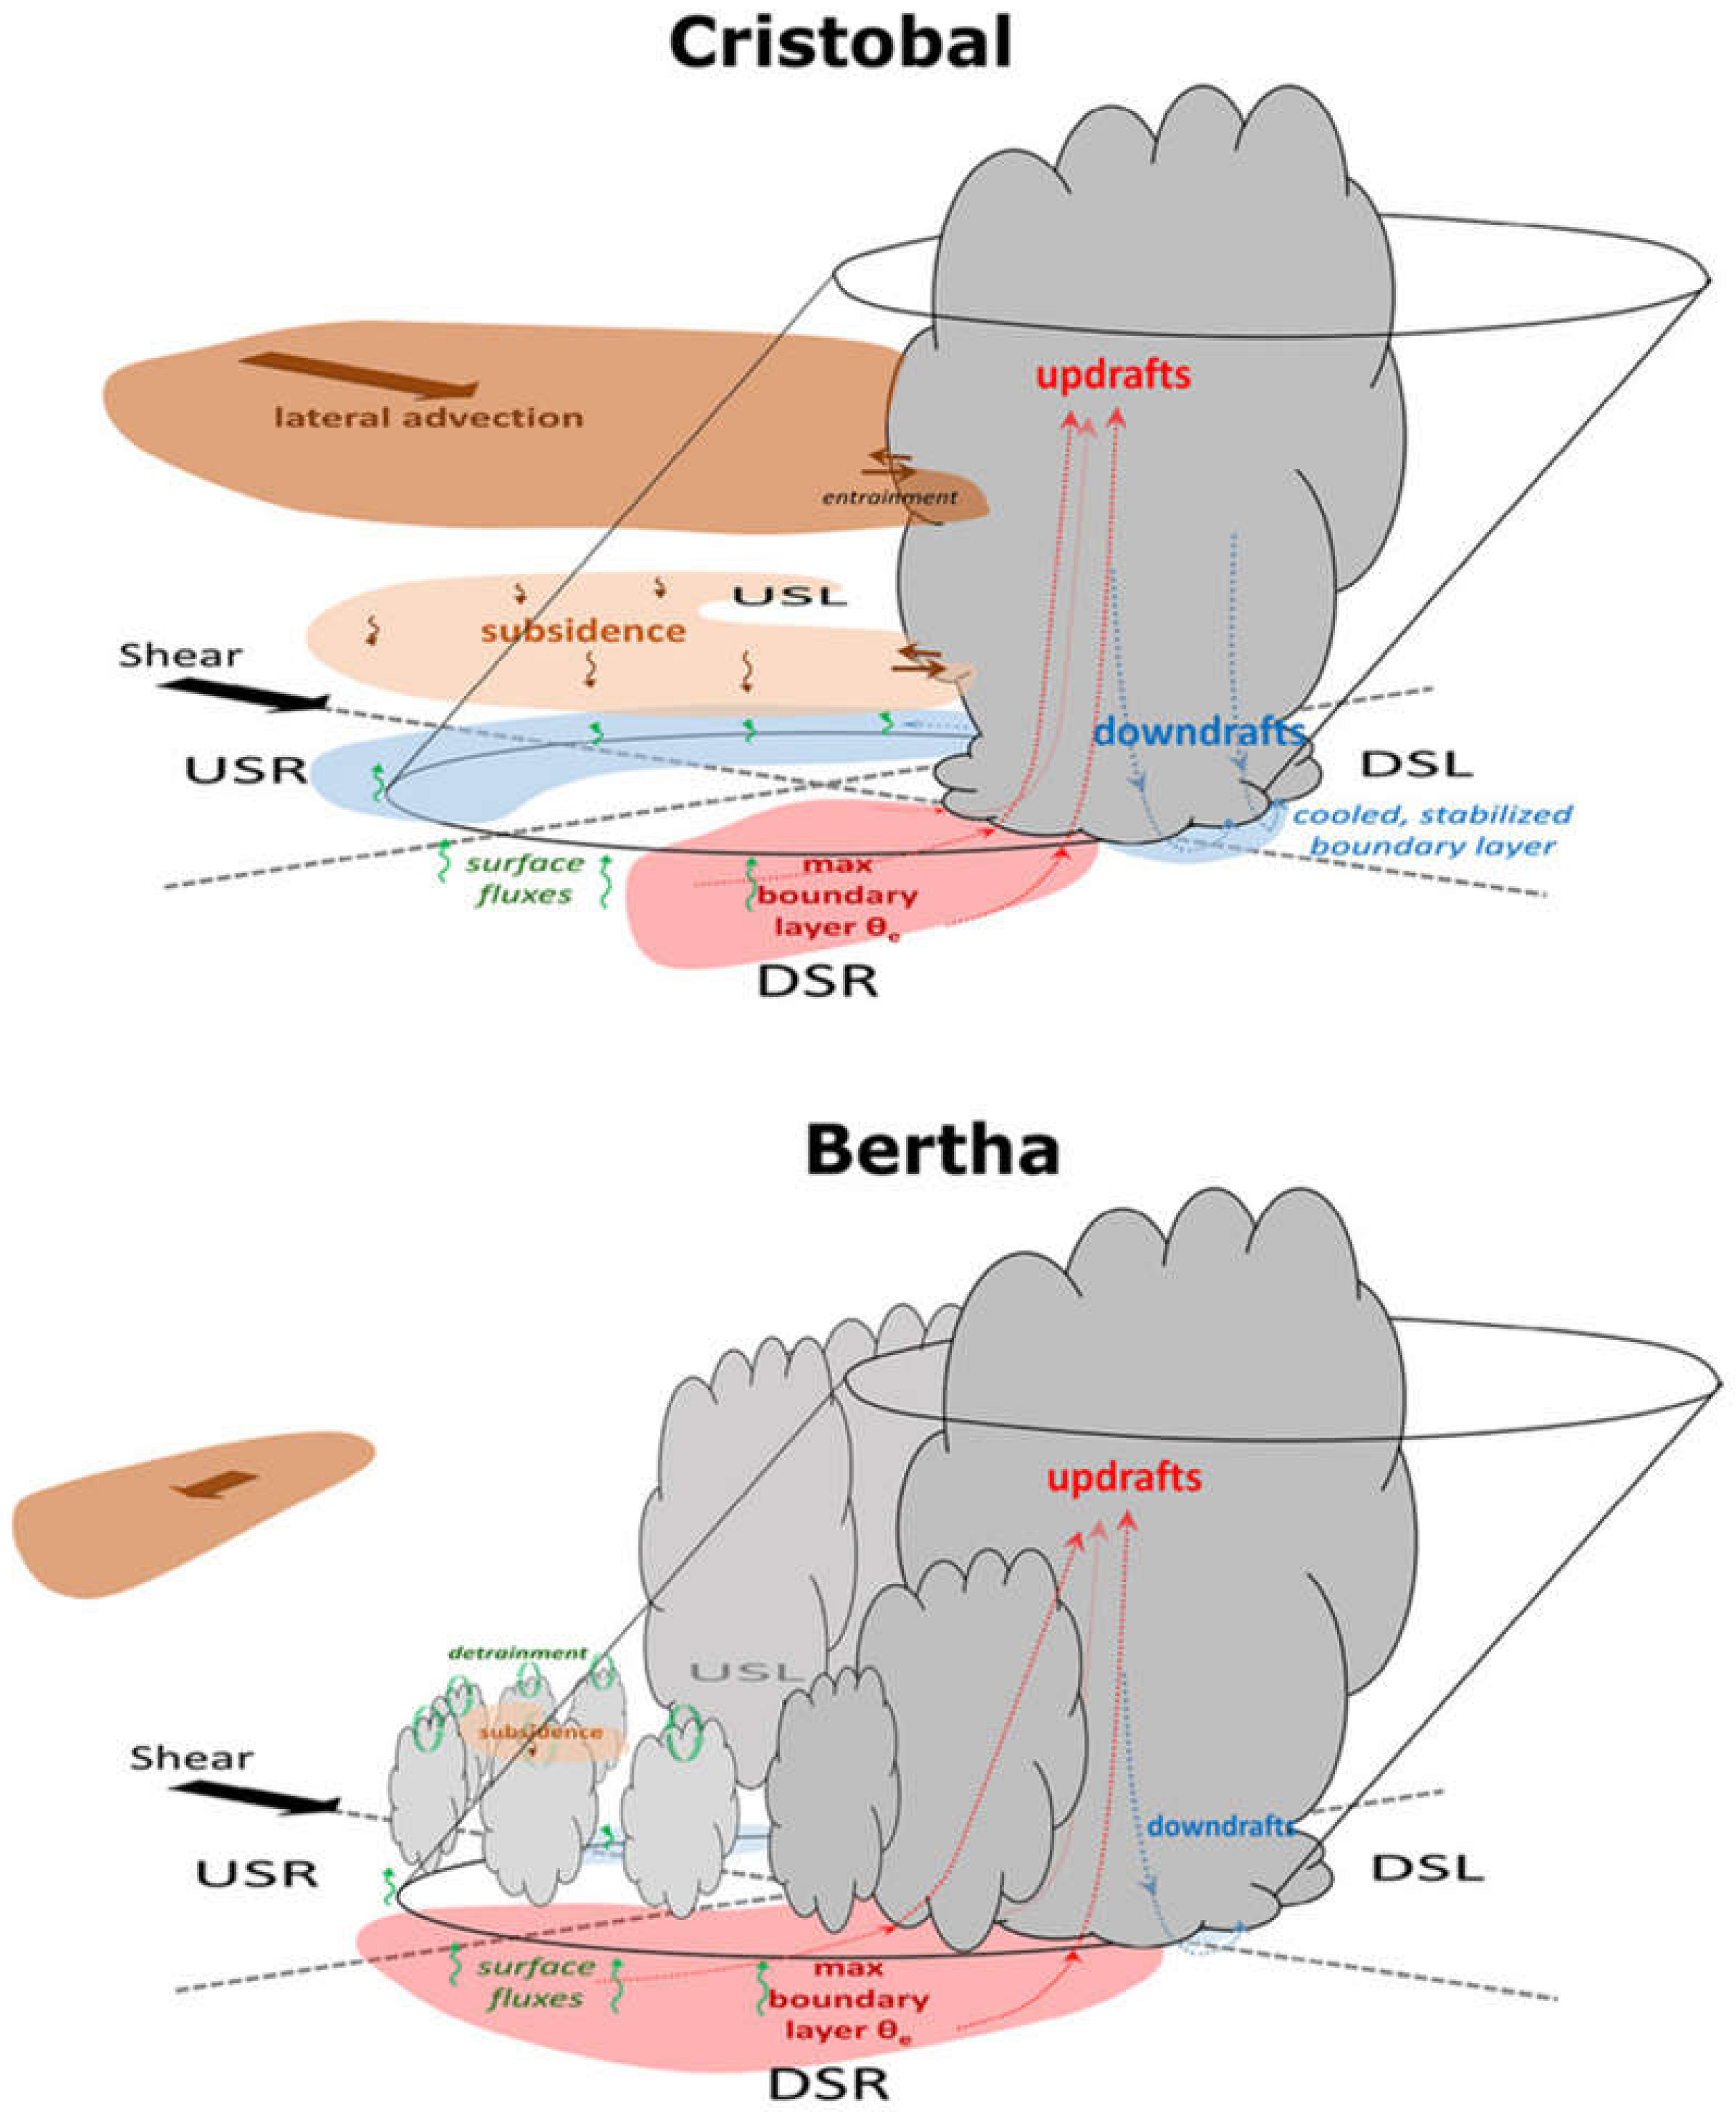
Factors hypothesized to augment vertical shear in determining the azimuthal distribution of precipitation, and by extension latent heating, include the shear-relative distributions of midlevel relative humidity, low-level equivalent potential temperature (θe), sea surface temperature, and vortex tilt. In an analysis of deep-layer dropsondes from the Global Hawk aircraft and airborne Doppler radar from the WP-3D in Hurricane Edouard (2014), Zawislak et al. [65] found that a wavenumber-1 asymmetry exists where the downshear quadrants consistently exhibited the greatest precipitation coverage and highest relative humidity, while the upshear quadrants (especially USR) exhibited relatively less precipitation coverage and lower humidity, particularly in the midtroposphere. Nguyen et al. [60] noted a similar relationship when examining differences in the precipitation coverage for Hurricanes Bertha (2014) and Cristobal (2014), with potential hindrances to precipitation symmetry identified as convective downdrafts cooling and stabilizing the lower troposphere in the left-of-shear and upshear quadrants; subsidence in the upshear quadrants, which acted to increase the temperature and decrease the relative humidity of the midtroposphere; and lateral advection of midtropospheric dry air from the environment, which dried the TC’s upshear quadrants (Figure 7).
3.2. Deep Convection and Eye-Eyewall Mixing
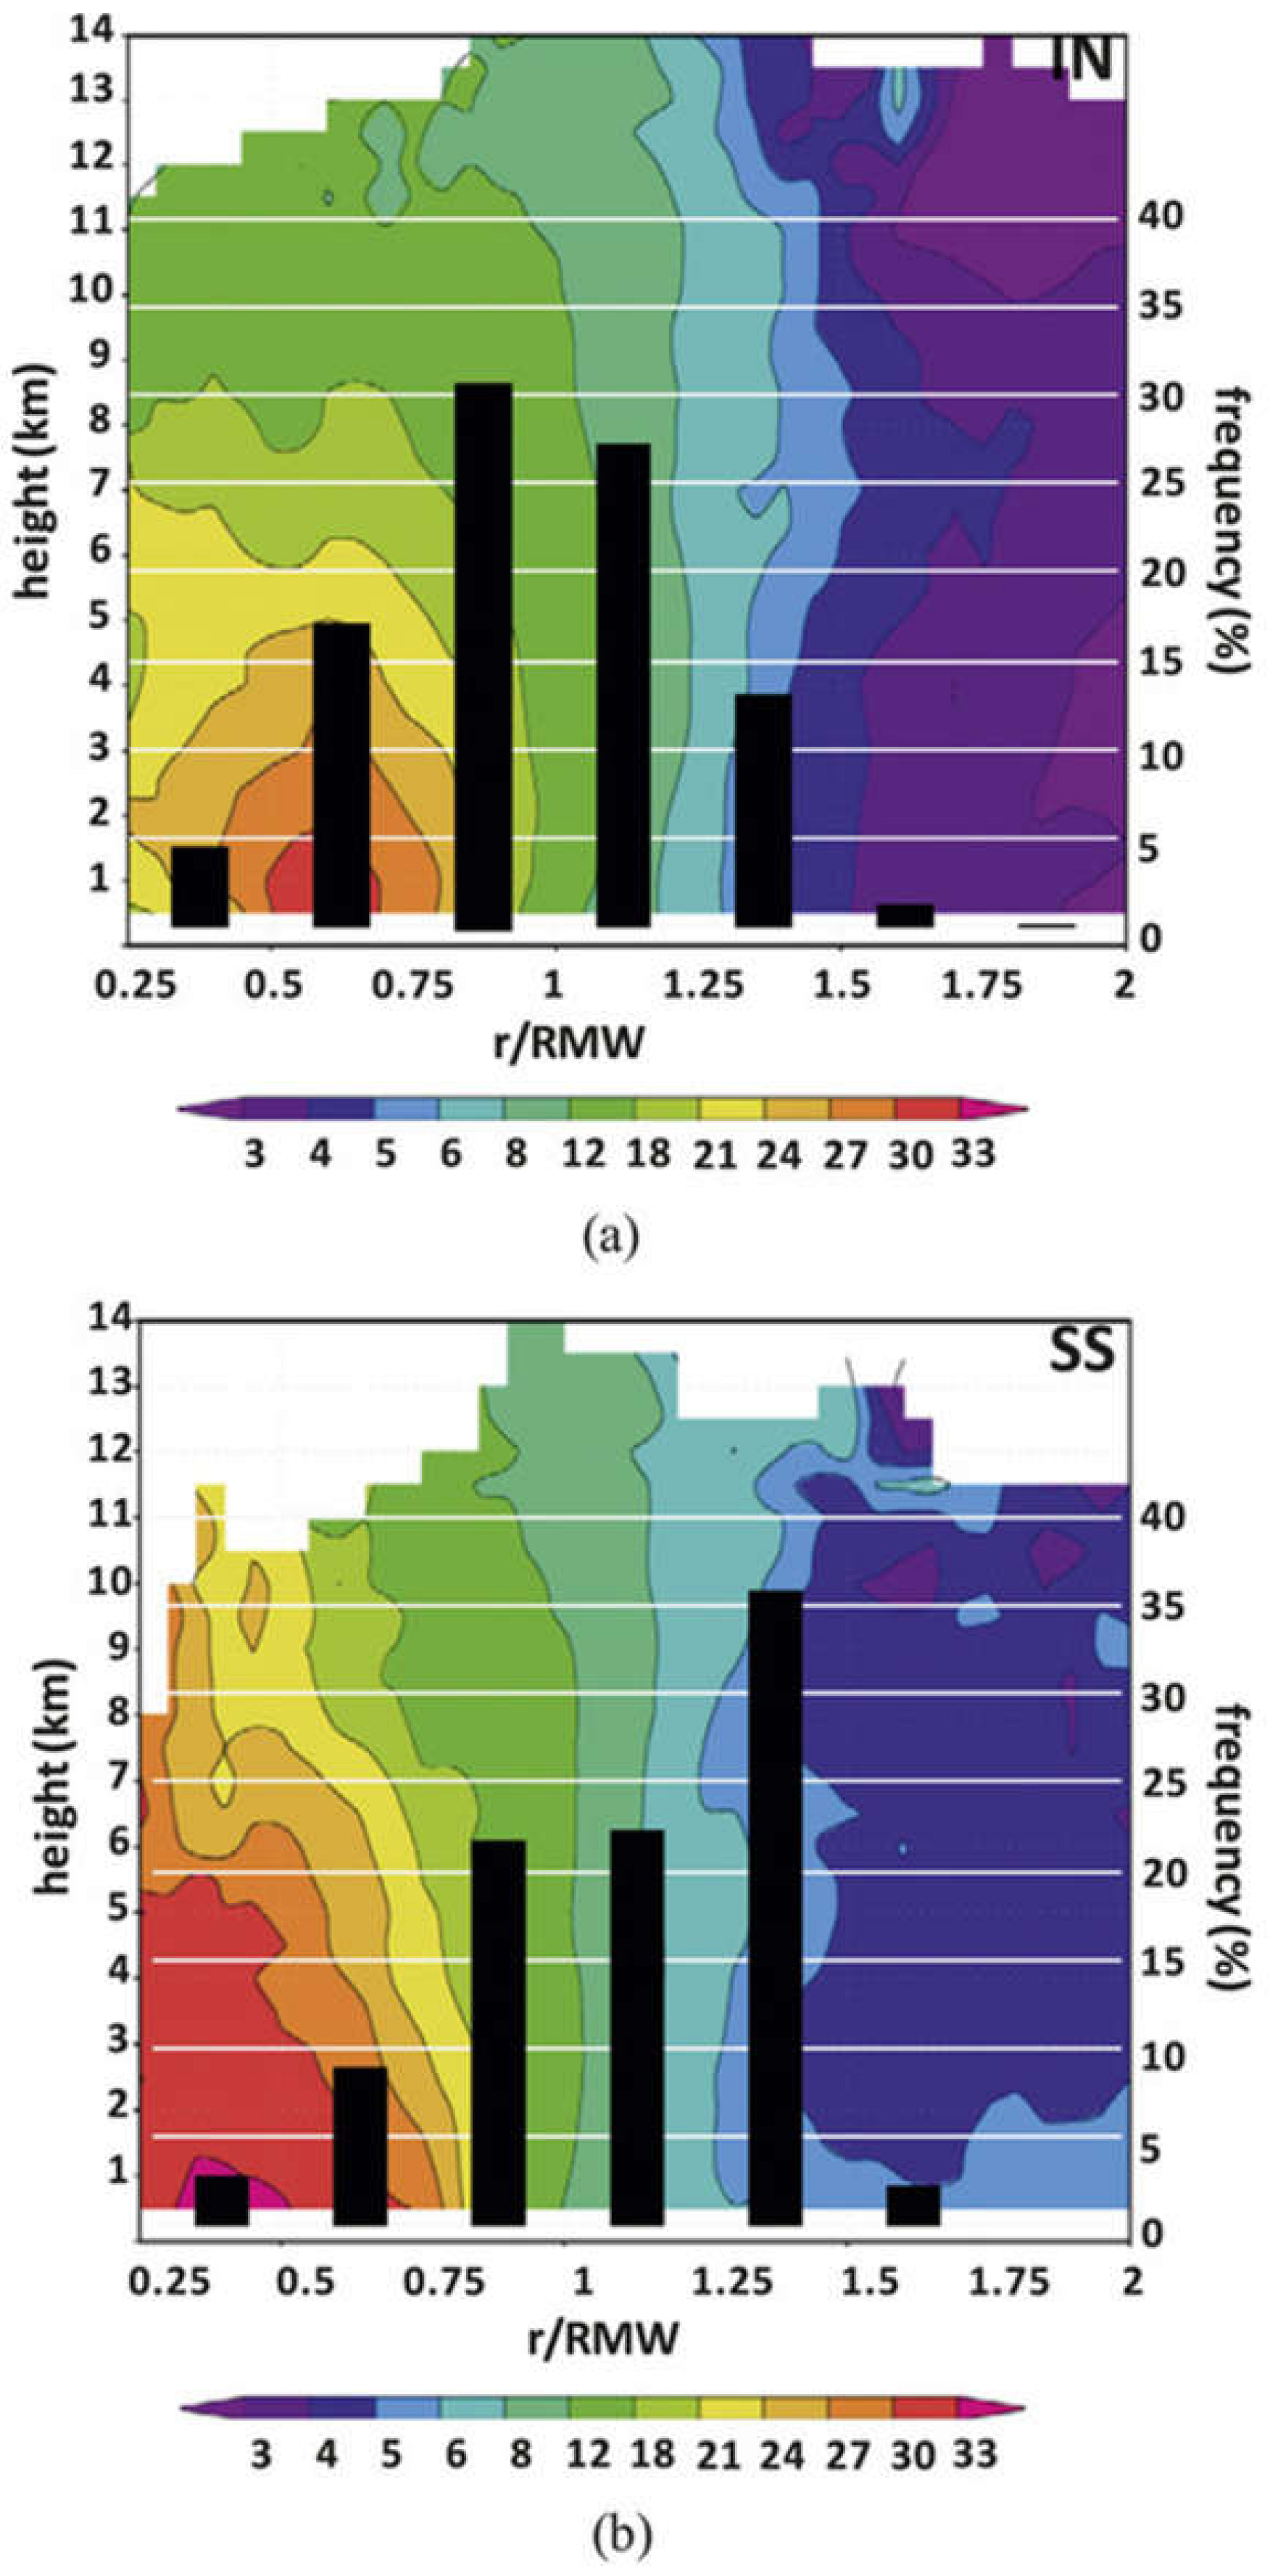
A preference for intensifying TCs to have deep convection left of the shear vector, particularly in the USL quadrant, was noted in case studies using NOAA TDR data [37,38,63,66,67] (Rogers et al., 2015, 2016). Rogers et al. (2016) [67] used TDR data along with deep-layer dropsondes from the NASA Global Hawk aircraft to distinguish the intensifying period of Hurricane Edouard (2014)’s lifecycle as containing a larger proportion of convective bursts USL, and radially inward, than Edouard’s steady-state period did (Figure 8). They attributed this preference for the distribution of deep convection USL and radially inward to a series of factors: PBL convergence maximizing further inward in the DSR quadrant, where convection is typically initiated (Reasor et al., 2013 [30,31]), and greater humidity in the midtroposphere in the local environment of the deep convection DSL and USL. The relationship between upshear humidity and precipitation symmetry was also discussed in Nguyen et al. ([60]; cf. Figure 7).
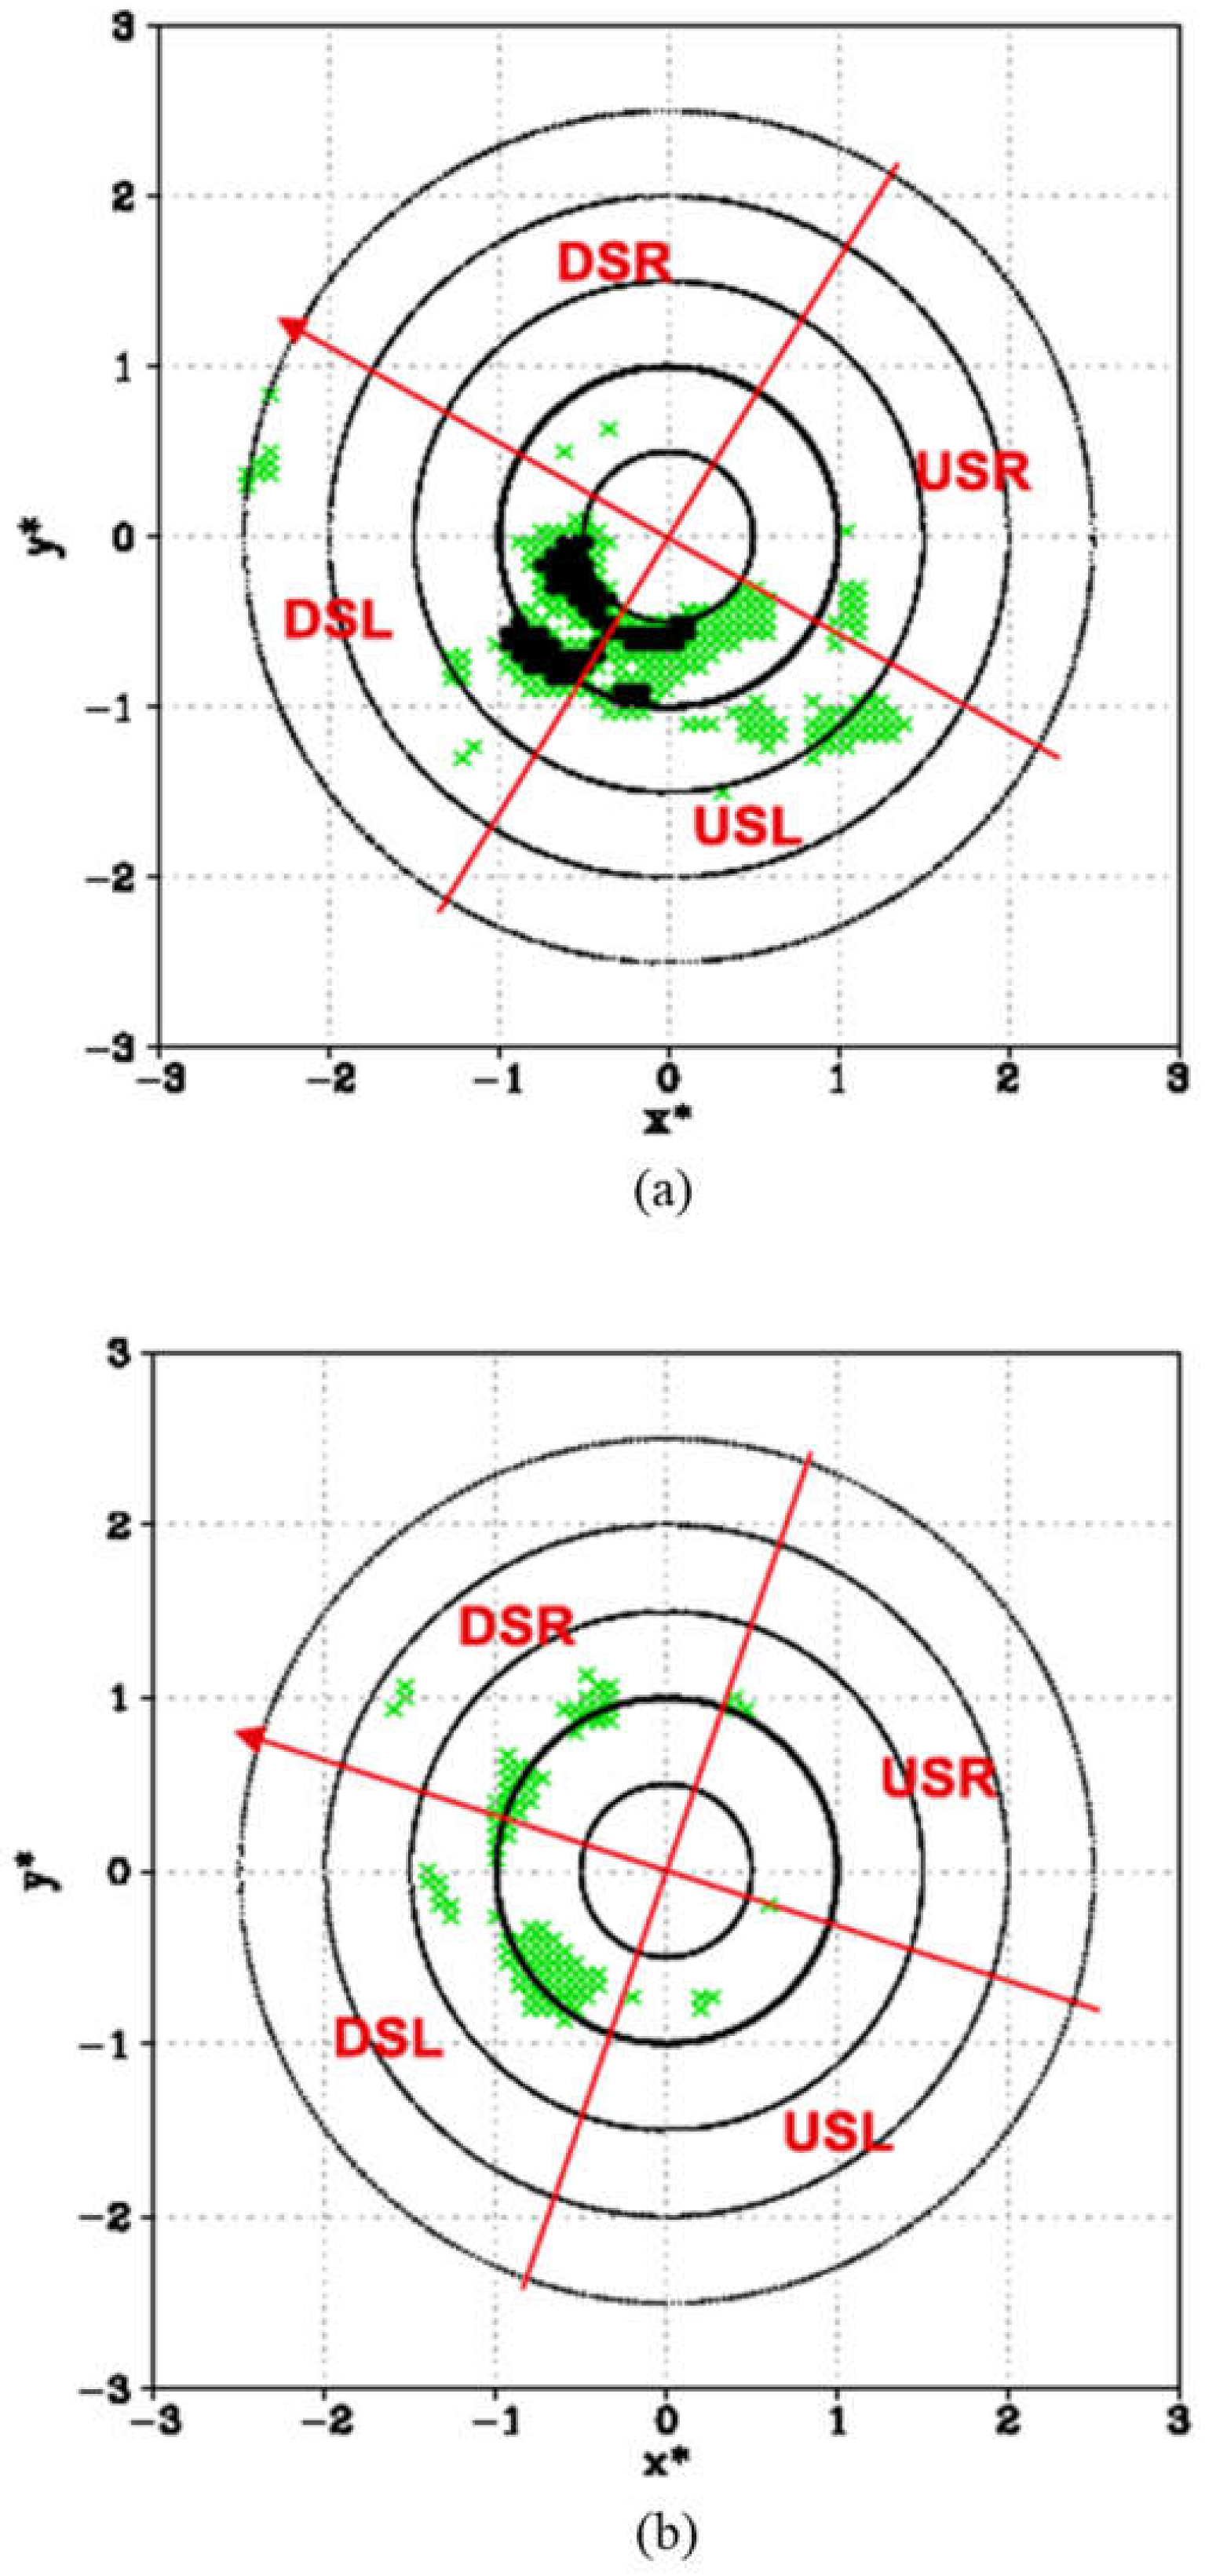
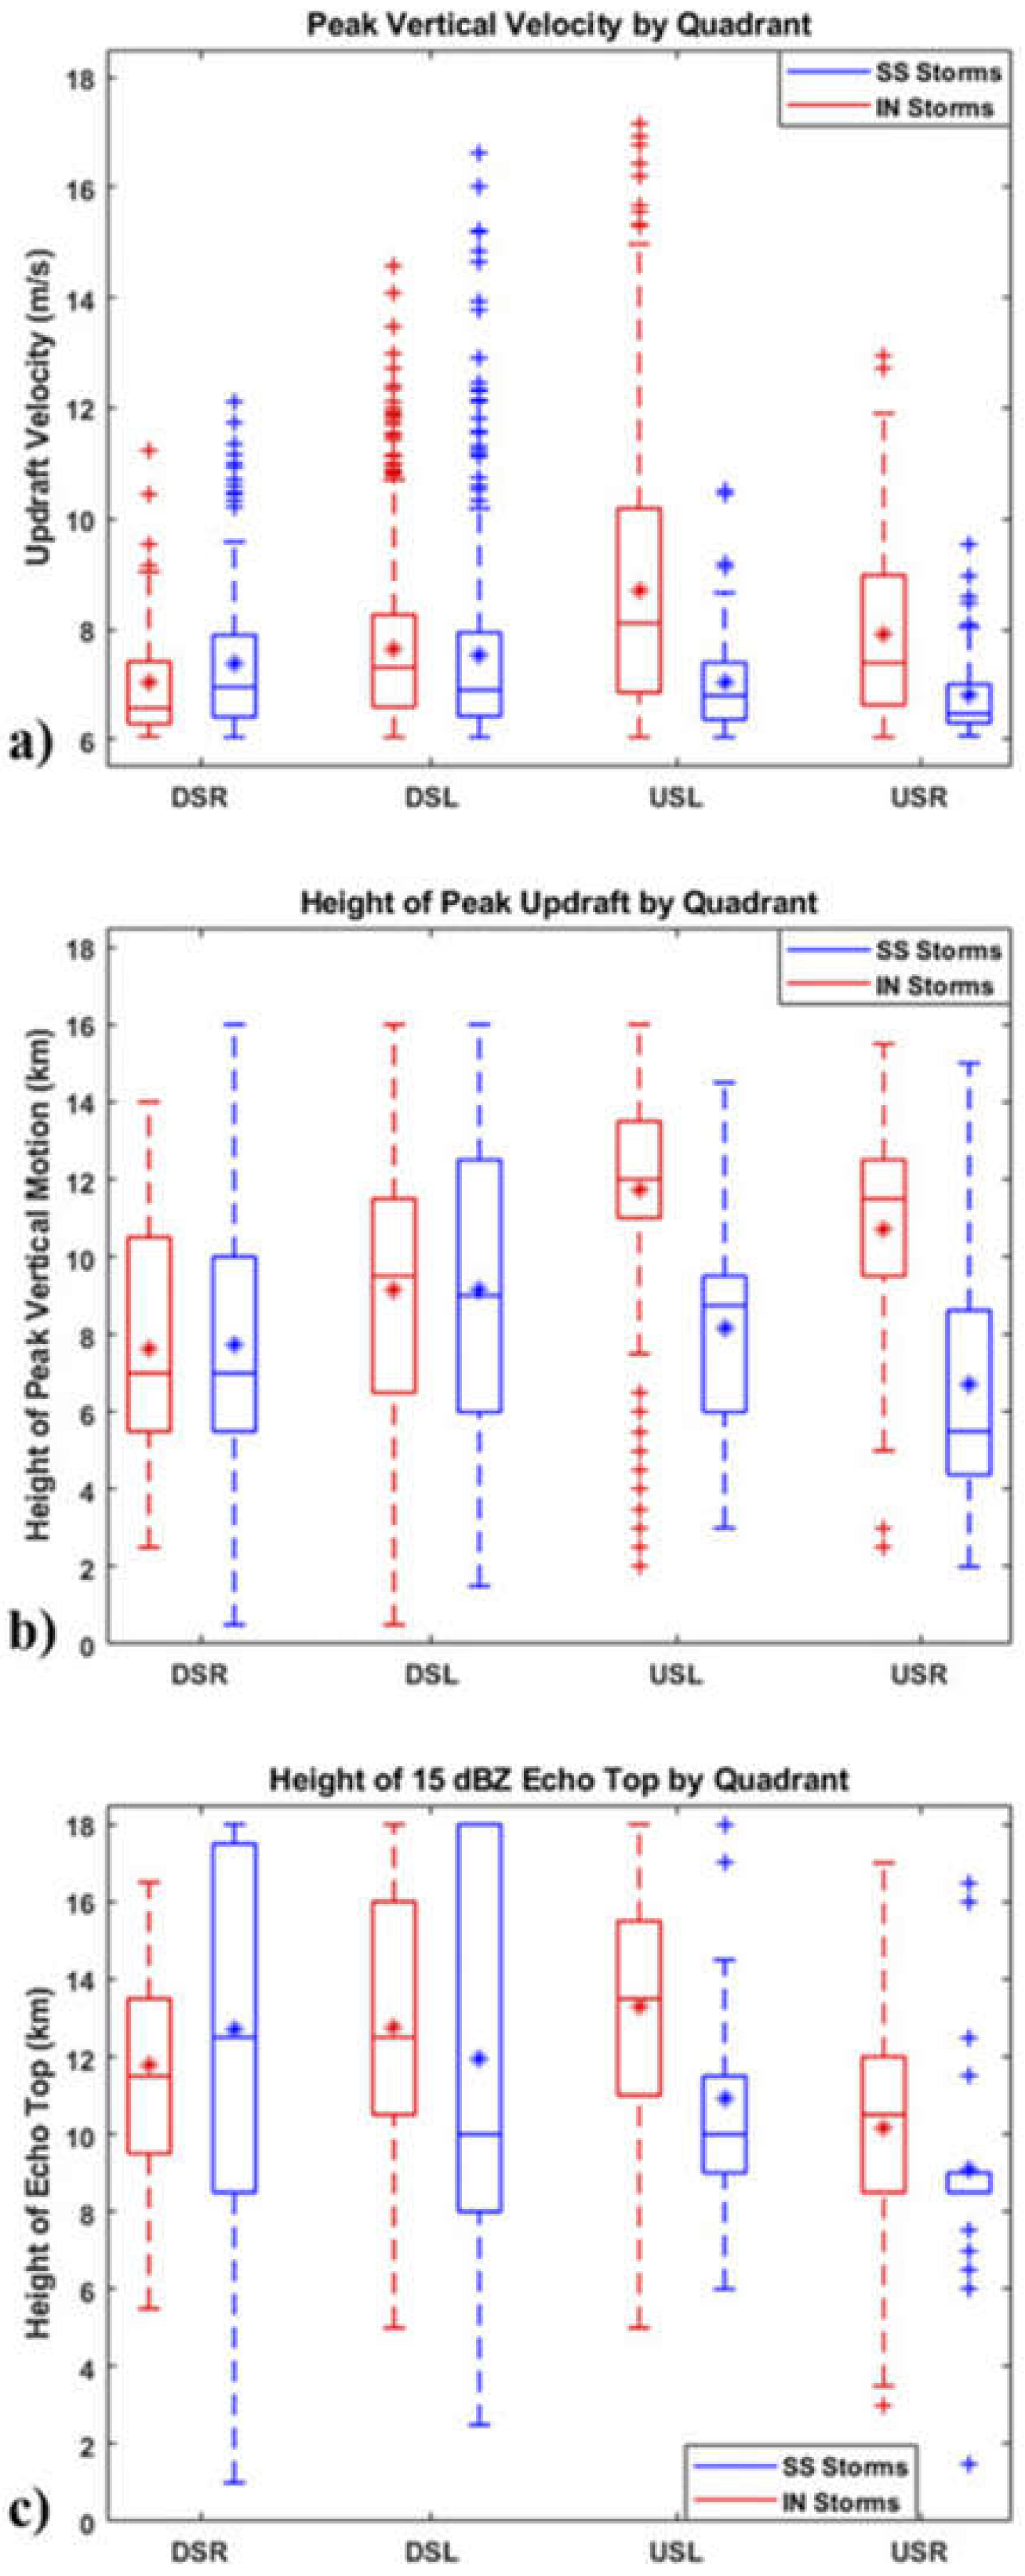
In their TDR composite study of eyewall slope and its relationship to the vertical shear, Hazelton et al. [26] identified a statistically significant difference in the slope of the reflectivity surface (slope defined as the difference in radius between 2 and 8 km altitude of the inner edge of the reflectivity defining the radar-derived eyewall) relative to the slope of the angular momentum (M) surface (slope defined as the change in the radius of the M surface at the RMW at 2 km altitude and its radius at 8 km altitude) in the DSL and USL quadrants for intensifying vs. steady-state TCs (Figure 9). They found that the slope of the reflectivity surface in intensifying TCs was less than the angular momentum surface in those left-of-shear quadrants. By contrast, the reflectivity slope was greater than the angular momentum slope for steady-state TCs. This was interpreted as depicting stronger, more upright, and deeper convection left of shear for intensifying vs. steady-state TCs. This interpretation was confirmed by a separate composite study of convective burst structures from TDR observations in multiple hurricanes (Figure 10; [68]). This study found that intensifying TCs had bursts with updrafts in the USL quadrant that peaked with a higher magnitude, at a higher altitude, and with higher 15 dBZ echo tops, than nonintensifying TCs. The USL quadrant was the only quadrant where these differences were observed to be statistically significant.
Guimond et al. [69] examined the rapid intensification of Hurricane Karl (2010) using a combination of Global Hawk and P-3 data. They noted a 12-h period where a series of convective bursts initiated downshear and rotated through the left-of-shear side of the TC during the RI phase, similar to what was documented in Hurricane Guillermo (1997) in [66]. Using data from the airborne Doppler radar High-Altitude Imaging Wind and Rain Airborne Profiler (HIWRAP; Li et al., 2016 [70]) and high-altitude microwave sounder flying on the Global Hawk (the High-Altitude Monolithic Microwave Integrated Circuit (MMIC) Sounding Radiometer, HAMSR, [71]) as well as the TDR on the NOAA P-3, [72] found that the bursts were being formed and maintained through a combination of two main processes: (1) convergence generated from counterrotating mesoscale circulations and the larger vortex-scale flow, and (2) the turbulent transport of anomalously warm, buoyant air from the eye to the eyewall at low levels. Subsidence along the inner periphery of the convective bursts asymmetrically warmed the inner core of Karl, where it was subsequently symmetrized during and after the RI period (Figure 11).
4. Planetary Boundary Layer (PBL) Processes and Air–Sea Interaction
4.1. Mean PBL Kinematic and Thermodynamic Structure
Much of the above discussion has focused on insights obtained through examining airborne Doppler radar data, which can provide a depiction of the three-dimensional winds in the presence of scatterers. However, this radar data is usually less effective at capturing the kinematic structure in the PBL (lowest ~1 km) due to sea clutter and is incapable of providing any information on the thermodynamic structure. Understanding PBL processes is crucial for better predictions of TC intensity change, because these processes regulate the radial and vertical distributions of momentum and enthalpy that are closely tied to storm development and intensification (e.g., [73,74,75,76,77]). While there have been attempts to sample the PBL with flight-level measurements, this usually is only done well outside the eyewall for safety reasons. Dropsondes, which have been used in TC research for decades, are a valuable tool for sampling the PBL, as they provide a vertical (or near-vertical) profile of temperature, moisture, winds, and pressure from flight-level down to the surface.
Zhang et al. [78] examined the kinematic and thermodynamic axisymmetric structure of the PBL using a composite of ~800 dropsondes in 13 hurricanes. They focused on assessing different height scales for the PBL: a kinematic (either the height of the peak tangential wind or the depth of the inflow layer) and thermodynamic (depth of the mixed layer) definition (Figure 12). There was a clear separation between dynamic and thermodynamic boundary layer heights, with the thermodynamic height much shallower than either kinematic definition. Other structural characteristics were found to be consistent with previous studies, such as an increasing PBL height with increasing distance from the center. The recommendation from this paper was that the inflow layer best describes the true PBL depth. This recommendation stems from considerations of the radial variation in inflow layer depth, and the fact that direct flux measurements in the outer-core regions of hurricanes suggest the turbulent flux transport mainly occurs in the inflow layer [79]. Similar relationships were seen in a composite study of dropsondes in typhoons in the West Pacific [80].
Ahern et al. [81] used a similar dropsonde composite methodology, though with a much larger database, to assess differences in the axisymmetric PBL structure for intensifying, steady-state, and weakening hurricanes. In steady-state and weakening hurricanes, the low-level tangential wind is greater outside the RMW than for intensifying hurricanes, implying higher inertial stability there, consistent with the results shown in Rogers et al. (2013) [36]. Outside the RMW inflow layer, θe is lowest in weakening hurricanes, suggesting greater subsidence or more convective downdrafts at those radii compared to intensifying and steady-state hurricanes.
4.2. PBL Recovery in a Sheared Environment
Shear impacts on TC boundary layer structure and surface enthalpy fluxes were explored observationally in [82], who composited dropsondes to examine boundary layer kinematic and thermodynamic structure in a shear-relative framework. They found that air parcels acquired θe from surface fluxes as they rotated through the USR quadrant from the USL quadrant (Figure 13). Convection was triggered in the DSR quadrant in the presence of asymmetric mesoscale lifting coincident with a maximum in θe, and convective downdrafts brought down cool and dry air to the surface that reduced θe again in the DSL and USL quadrants. This cycling process, also found in [83], was tied directly to the shear-induced asymmetry of convection.
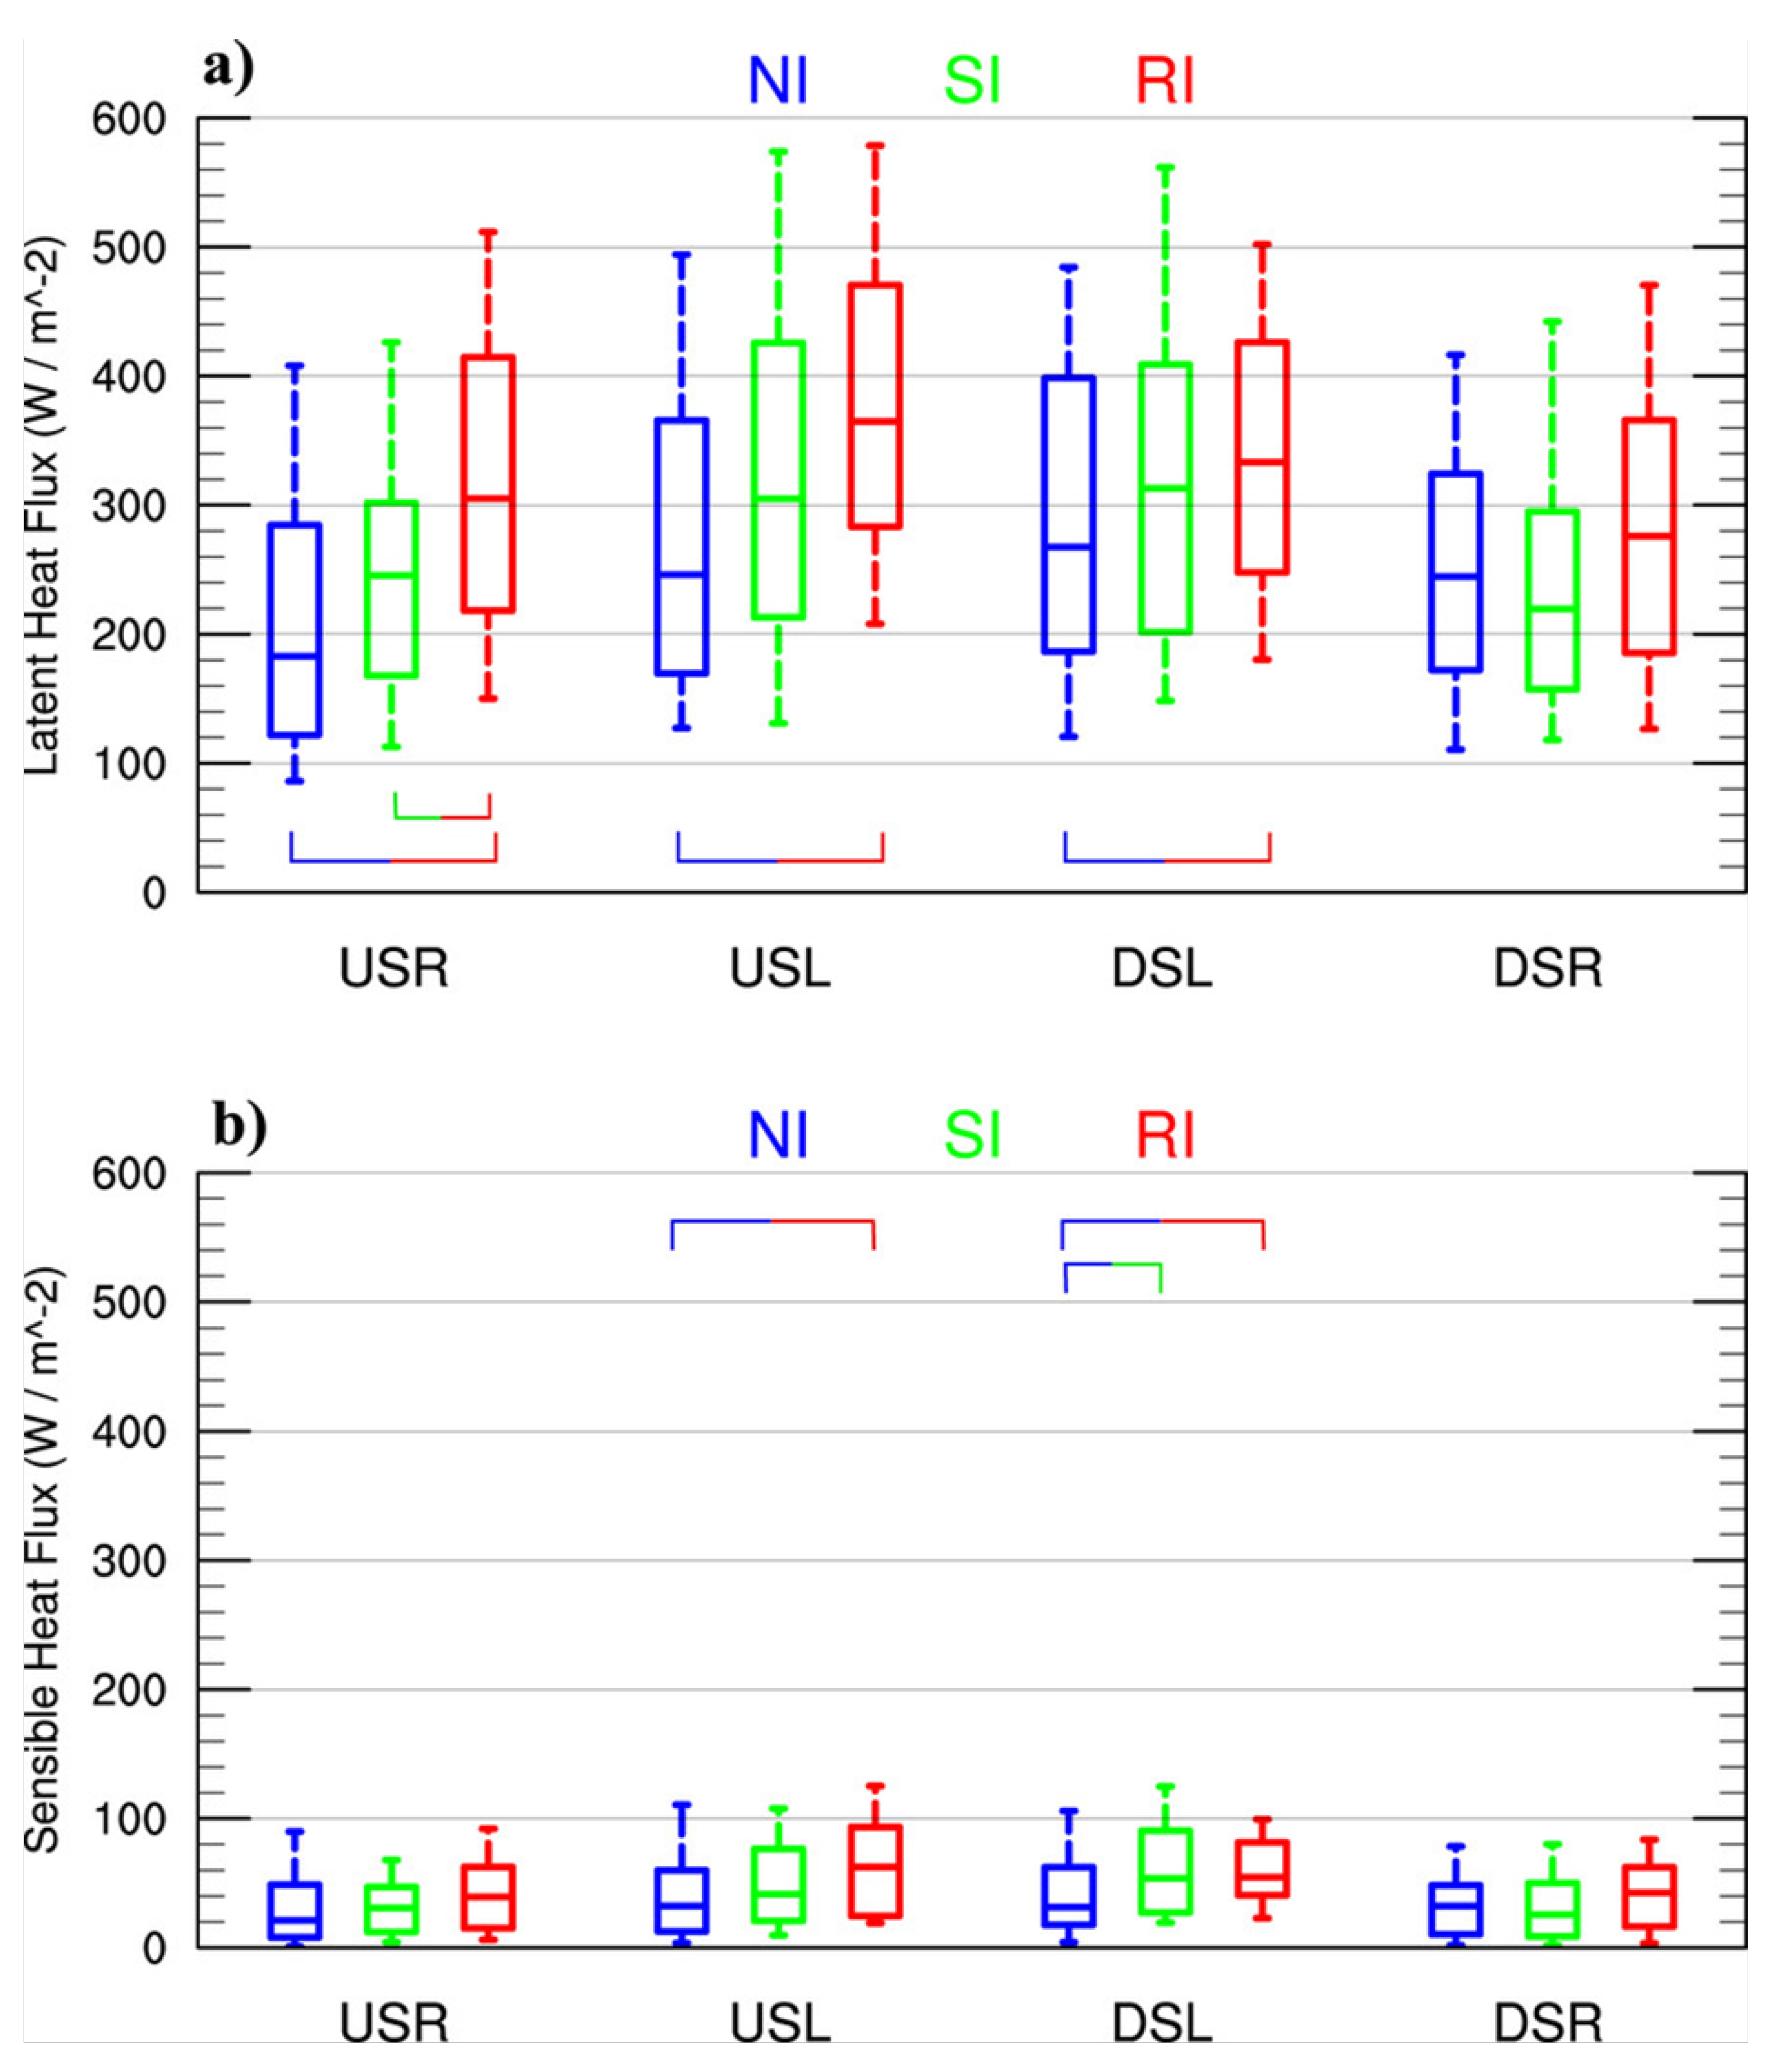
Following a similar compositing methodology, Nguyen et al. [84] extended this analysis to examine differences in the PBL structure and surface enthalpy fluxes for nonintensifying, slowly intensifying, and rapidly intensifying tropical depressions, storms, and Category 1 hurricanes. A key difference between intensifying and nonintensifying TCs was significantly larger surface enthalpy fluxes for intensifying cases, particularly in the upshear quadrants (Figure 14). These results suggest that in intensifying storms, enhanced surface enthalpy fluxes in the upshear quadrants allowed downdraft-modified boundary layer air to recover moisture and heat more effectively as it was advected cyclonically around the storm. By the time the air reached the downshear quadrants, the lower-tropospheric conditional instability was enhanced, which was speculated to be more favorable for updraft growth and deep convection.
In an analysis of Hurricane Earl (2010), Wadler et al. [85] found a similar result, focusing on downdrafts transporting low-θe air into the PBL on the upshear side. They identified boundary layer recovery and turbulent mixing by atmospheric eddies as possible mechanisms for overcoming this low-θe air, promoting convection and subsequent intensification. Similar results were also found in a study of Hurricane Michael (2018; [86]). Jaimes et al. [87], also examining Hurricane Earl (2010), found that surface enthalpy fluxes were controlled by the thermodynamic disequilibrium between the sea surface and the near-surface air, independent of wind speed. This disequilibrium was strongly influenced by underlying warm oceanic features, pointing to the importance of these oceanic features, particularly in RI scenarios.
4.3. Surface Exchange and PBL Mixing
It is well-known that the exchange of enthalpy and momentum across the air–sea interface is the key energy source for TCs [75,88,89]. Bulk formulas relying on drag, moisture, and enthalpy exchange coefficients are often used to represent these exchanges. Numerous studies have attempted to estimate these coefficients, including estimating how they vary when wind speeds exceed 50 m s−1. Analyses of dropsonde observations showed that drag coefficients typically reach their peak at about 30–40 m s−1 before leveling off or even decreasing [90,91], a relationship also confirmed by wave tank measurements [92]. Analyses using flight-level and wave tank measurements also showed that the surface enthalpy exchange coefficient has little relationship to surface wind speed [93,94]. Despite progress in estimating coefficients from these studies, as well as studies arising from the Coupled Boundary Layers Air–Sea Transfer (CBLAST) field program [95,96,97], considerable uncertainty remained, largely due to the challenge of obtaining in situ measurements near the surface in hurricane conditions. Bell et al. [98] used a novel approach where momentum and enthalpy fluxes were deduced via absolute angular momentum and total energy budgets from dropsonde measurements. They were the first known estimates of the enthalpy exchange coefficient and the ratio of enthalpy to drag coefficient in major hurricanes. The results also showed that there is no significant change in the magnitude of the bulk exchange coefficients estimated at minimal hurricane wind speeds, and that the ratio of enthalpy to drag coefficient does not significantly increase for wind speeds greater than 50 m s−1.
In addition to the exchange of enthalpy and momentum across the air–sea interface, the subsequent mixing of those properties in the vertical and the horizontal (i.e., eddy diffusivity) is also key in determining the PBL’s role in governing TC structure and intensity. As such, considerable effort has been made to properly estimate the magnitude and distribution of this mixing. Observational estimates of eddy diffusivity are rare, however, especially for wind conditions >15 m s−1. Using flight-level data during the low-level eyewall penetrations of Hurricanes Allen (1980) and Hugo (1989), Zhang et al. [99] made the first attempt to estimate momentum fluxes, turbulent kinetic energy, and vertical eddy diffusivity in the intense eyewall at around 500 m altitude. They found that the vertical eddy diffusivity in the intense eyewall region increases with wind speed. Zhang and Drennan [100] extended this calculation to obtain vertical profiles of vertical eddy diffusivity from directly measured turbulent fluxes and vertical gradients of the mean variable, such as wind speed, temperature, and humidity, obtained from dropsondes released at a location coincident with the flight-level measurement (Figure 15). Performing this calculation for a variety of wind speeds in the PBL showed a direct relationship between wind speed and vertical eddy diffusivity.
These calculations from aircraft observations have played a crucial role in improving the formulation of PBL parameterization in the NOAA operational Hurricane Weather Research and Forecasting (HWRF) model [101], resulting in an improved representation of inflow layer depth and strength as well as better forecasts of rapid intensification [102,103,104]. A similar type of improvement to HWRF was made by improving horizontal mixing based on aircraft measurements of the horizontal mixing length provided in [105]. Using realistic values of horizontal mixing length led to improvements in the forecasted storm size, eyewall slope, and warm-core structure, and resulted in significant reduction of intensity biases [106,107].
4.4. Angular Momentum Convergence and PBL Spinup
Smith et al. [46] and Montgomery and Smith (2014) [108] emphasized the convergence of angular momentum within the PBL as a key driver of TC spinup. Unbalanced dynamics within the PBL leads to agradient forcing that helps spin up the TC vortex when the inflowing air radially advects absolute angular momentum at a rate that exceeds that removed by friction. These unbalanced dynamics were confirmed in numerical simulations independent of boundary layer physics [104,109,110]. Such a process is manifested by supergradient flow at the location of maximum winds. Analyses of dropsonde data in both Atlantic hurricanes [37,44,67] (Rogers et al., 2015, 2016) and Pacific typhoons [111] have confirmed the presence of this supergradient flow for intensifying TCs. These observational results were also used to illustrate how angular momentum convergence in the PBL provides an alternative explanation [45] to the efficiency argument of [40,41,42] for why peak diabatic heating inside the RMW is favorable to TC intensification. Smith and Montgomery [45] argued that angular momentum surfaces can be advected inward toward the TC center within and above the PBL, resulting in intensification, if deep convection is located inside the RMW.
5. Upper-Level Warm Core Structure and Evolution
Dropsonde data from high-altitude aircraft have been used to investigate upper-level forcing and its relationship to TC intensification. Overshooting tops from deep convection are a common feature in intensifying TCs. Guimond et al. [53] showed these overshooting tops, i.e., convective bursts, in analyses of Hurricane Dennis (2005) from the high-altitude NASA ER-2 aircraft. They found peak updrafts of 20 m s−1 at 12–14 km height, along with significant downdrafts around the periphery of the updrafts. These downdrafts were hypothesized to contribute to the intensification of the upper-level warm core during Dennis’s intensification. Duran and Molinari [112] showed evidence of similar overshooting tops in Hurricane Patricia (2015) using dropsondes from the NASA WB-57. These dropsonde measurements showed the weakening and elevation of the inversion layer as the overshooting tops penetrated the tropopause (Figure 16). Duran and Molinari [112] also showed a narrow inflow layer near the tropopause and hypothesized about the role of subsidence from the stratosphere in developing an upper-level warm core, similar to what was discussed in [69]. Composites of dropsondes from the NASA Global Hawk [113] showed similar structures to those studied in [112].
6. Genesis and Development of Weak TCs
Much of the research described above has focused on tropical cyclones at a mature stage of their lifecycle. “Mature” in this context means TCs of moderate tropical storm strength or stronger. Such TCs have a degree of organization (as shown, e.g., in [21]) typified by a well-defined primary and secondary circulation that extends from the surface to the upper troposphere, a reasonably-aligned orientation of circulation centers with height, and some degree of precipitation coverage around the low-level center. Prior to this stage, however, TCs can be quite disorganized, with a shallow (or nonexistent) primary circulation in the lower troposphere; circulation centers—when they exist—displaced by hundreds of km with height; and precipitation confined to one small region, if at all. TCs at this stage of their lifecycle are termed “weak TCs” here, which in effect means TCs ranging from pretropical depression, to tropical depression, and up through weak tropical storm strength. Before any substantial intensification can occur, the structure of a weak TC must become better organized. The formation of a deep circulation rooted in the lower troposphere falls under the category of tropical cyclogenesis, while the development of a circulation aligned between the low- and midlevels can occur through a process termed reformation.
6.1. Tropical Cyclogenesis
Much of the work with aircraft data and tropical cyclogenesis has focused on precipitation processes. One line of research uses a rotating convection paradigm that focuses on deep convective towers, termed vortical hot towers (VHTs), which collectively drive a system-scale inflow during the genesis process [44,114,115,116]. Reasor et al. [117] and Houze et al. [118] used airborne Doppler data to examine deep convection and its effect on the amplification of a low-level circulation. Houze et al. [118] noted the importance of such an intense convective cell in stretching lower tropospheric vorticity during the development of the system that became Hurricane Ophelia (2005). Bell and Montgomery [119] analyzed airborne Doppler measurements of an area of deep convection in predepression Hagupit (2008) in the western Pacific, finding that the low-level circulation of the predepression disturbance was enhanced by the coupling of the low-level vorticity and convergence in the deep convection.
Other studies approach the development of a deep, aligned vortex and subsequent intensification from a more mesoscale perspective, focusing on the local thermodynamic environment, as measured by dropsondes, and examining its impact on the vertical mass flux profile within a mesoscale domain. Raymond et al. [120], Raymond and López Carrillo [121] (2011), and Gjorgjievska and Raymond [122] note that a midlevel vortex is more conducive for convection with a vertical mass flux profile that peaks in the lower troposphere—what they term a “bottom-heavy” mass flux profile—which is associated with strong low-level convergence of mass and vorticity and a spin-up of the low-level cyclone. While the [118] Ophelia study focused on an intense convective cell, they noted that the mass flux profile in the lower troposphere within the convective cell peaked in the lower troposphere, resulting in a maximum in potential vorticity production in that layer.
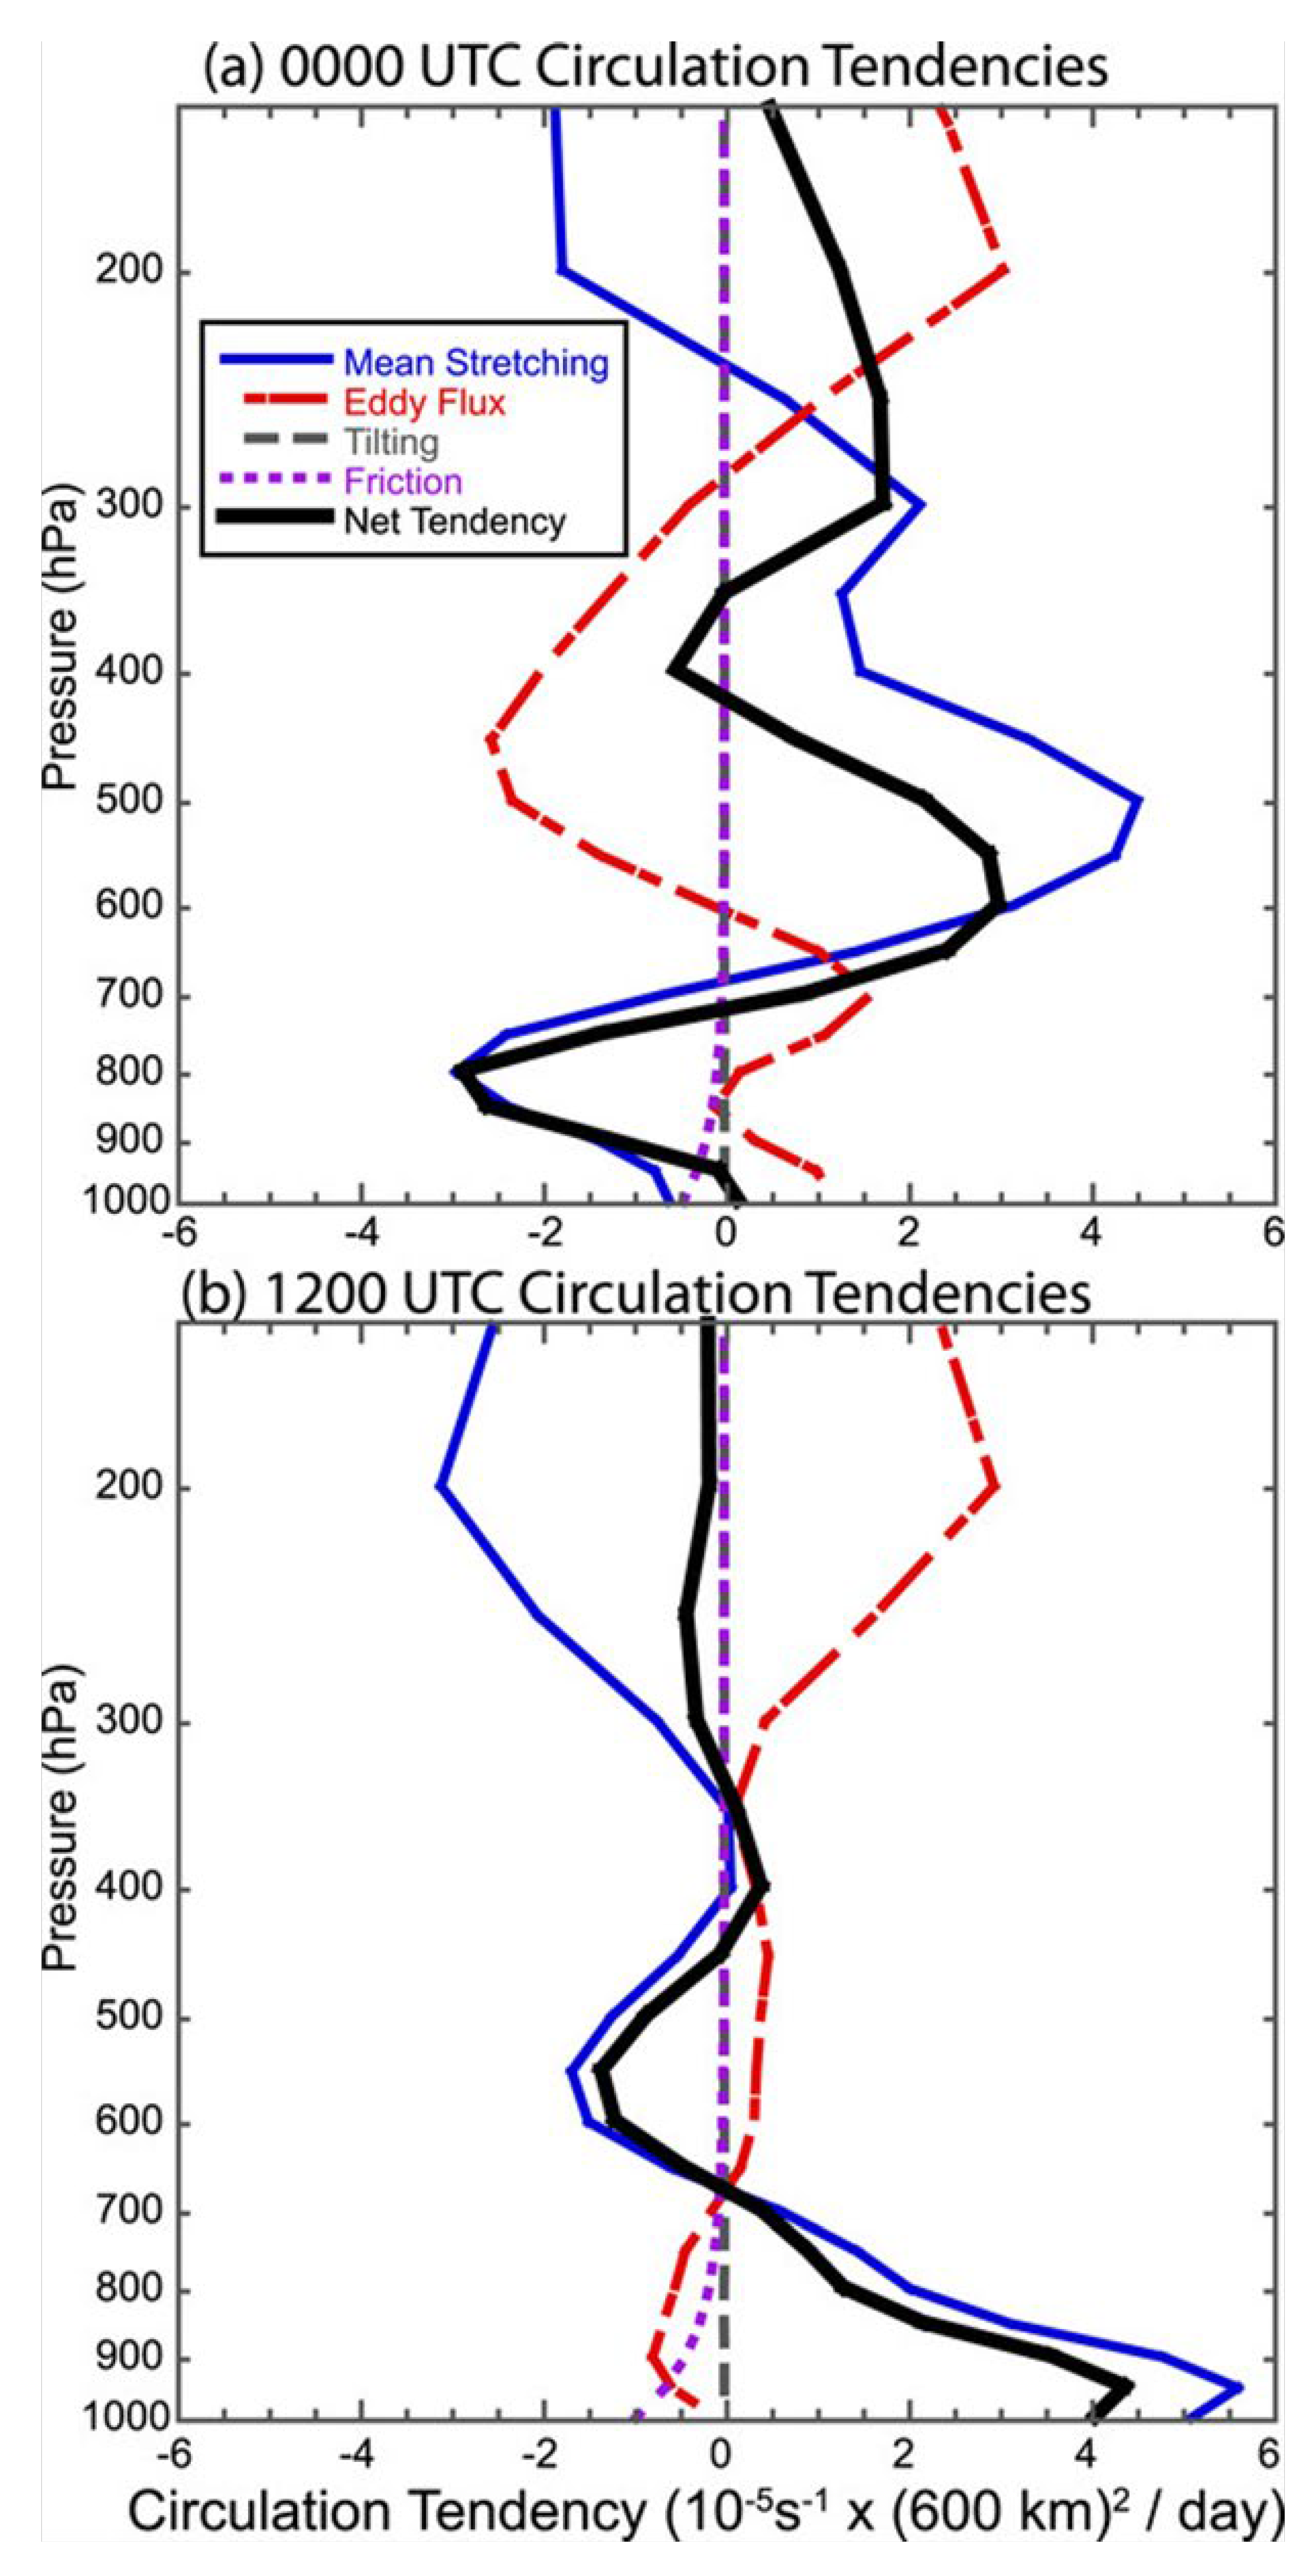
Both of the approaches mentioned above presume a specific structure to the precipitation within the mesoscale environment of the low- and midlevel circulation centers. The structure of the precipitation (e.g., convective or stratiform; deep, moderate, or shallow convection) determines parameters such as the profiles of vertical velocity, vertical mass flux, and divergence, which has important implications for vorticity production. The precipitation structure can also be modulated by environmental conditions such as humidity and static stability. In an examination of deep-layer dropsondes from a variety of field campaigns in the Atlantic and Pacific basins, Raymond et al. [123] noted that thermodynamic profiles with a lower instability index were associated with midlevel vortices, more humid environments, and more bottom-heavy mass flux profiles. Such profiles were more likely to develop into tropical storms within 48 h. Bell and Montgomery [124], by contrast, argued that stretching in cycles of deep convection and stratiform precipitation in Hurricane Karl (2010), tied to the diurnal cycle, alternately build the low- and midlevel circulations episodically (Figure 17), rather than through a sustained lowering of the convective mass flux associated with stabilization as suggested by [123].
Much has been learned from comparisons of dropsondes released in developing vs. nondeveloping African easterly waves in the East Atlantic. Characteristics of those waves were found to vary widely [125], with some waves exhibiting a higher-amplitude trough signature that had characteristically less precipitation (drier from the Saharan Air Layer) and were less favorable for development, while some were lower amplitude, but those waves also had more precipitation, and thus were more favorable for development. Analyses of dropsondes from developing and nondeveloping cases downstream in the western Atlantic [126,127,128,129,130,131] (Komaromi, 2013) [129] revealed that developing cases exhibit a “priming” process where they become progressively more statically stable and humid/moist in the middle troposphere within 1–2 days of genesis. The increased stability occurred as a warm temperature anomaly grew in the middle to upper troposphere and deepened with time, while a cool anomaly developed in the lower troposphere. Nondeveloping cases were less humid in the midlevels than in developing cases and became drier and more unstable with time.
6.2. Reformation
Even if tropical cyclogenesis has occurred, a TC can still struggle to organize, as it sometimes has to contend with a disorganized structure characterized by circulation centers that are tilted or displaced (sometimes substantially) with height, considerable dry air in the developing circulation, and localized areas of vigorous convection (e.g., [126,127,128,129,132,133]. Despite the disorganized structure often seen at this stage of a TC’s lifecycle, most cases of RI onset occur then [4], suggesting a substantial improvement in organization prior to RI onset. This improvement in TC structure, into a persistently aligned vortex with a moist core, is what determines whether the TC can undergo RI, provided the environment is supportive.
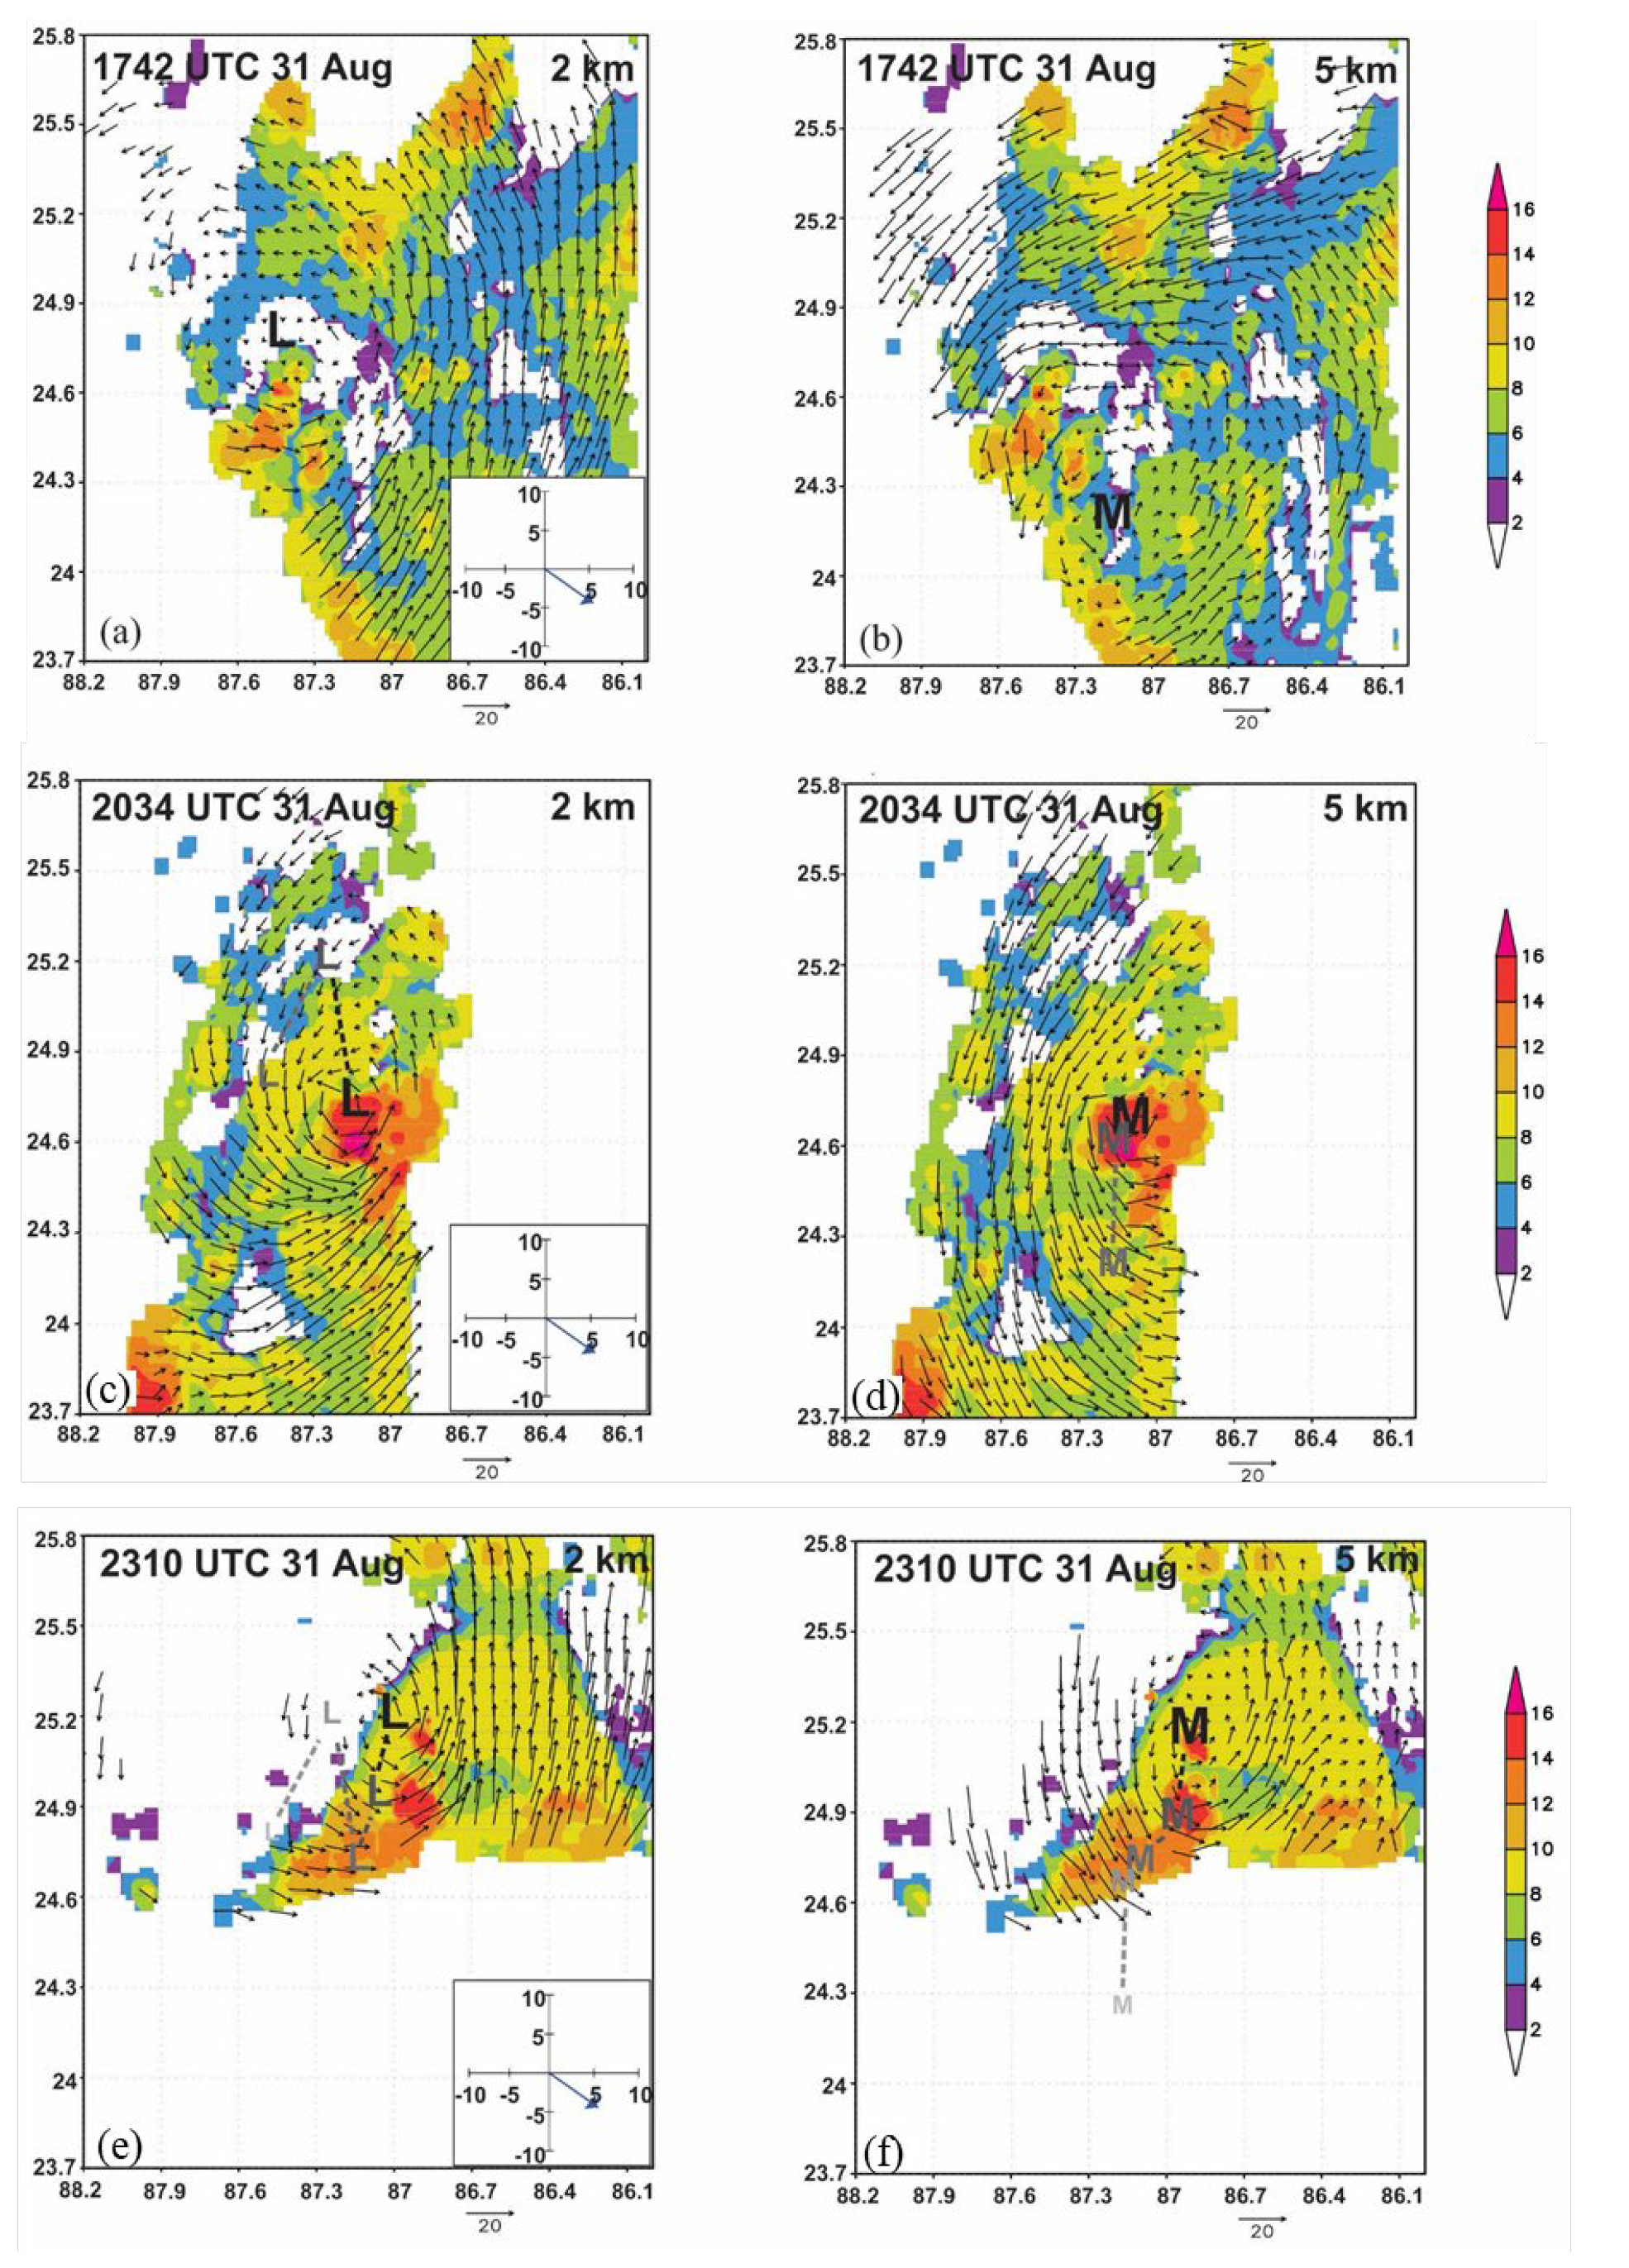
Reformation, which often occurs on the downshear side of a low-level circulation and is thus termed downshear reformation, is one way in which such an aligned circulation occurs. Molinari and Vollaro [134] used flight-level data from Air Force aircraft combined with ground-based radar and lightning detection, model analyses, and a satellite microwave overpass to examine a weak tropical storm (Gabrielle, 2001) that underwent a 22 hPa pressure fall in a few hour period. The pressure fall occurred as an intense convective cell developed within a broader cyclonic circulation that was tilted left of the shear vector. They attributed the rapid deepening of the TC to the growth of the intense convective cell within a region of high efficiency of latent heating in the background cyclonic circulation. This evolution reflected a multiscale process in which a new circulation center formed within the downshear precipitation shield, continued ambient shear created a favored region for cell formation just downshear of the new center, and an intense convective cell produced enhanced diabatic heating located close to the center in a region of high efficiency of kinetic energy production.
Rogers et al. [135] examined a weak TC undergoing a similar evolution (Hermine, 2016) to that studied in [134]. Using airborne Doppler data and Global Hawk dropsondes, Rogers et al. [135] examined the vertical structure of latent heating and its temporal evolution during the period when Hermine intensified from a tropical depression to a hurricane over a 72 h period prior to landfall in the northeast Gulf of Mexico. Tracking the location of initially displaced low- and midlevel centers from pass to pass of the P-3 aircraft, they showed a clear shift over a ~5 h period of the low-level center toward a region of high echo tops, indicative of deep convection, located nearly coincident with the midlevel center (Figure 18). They identified a multiscale cooperative interaction between deep and moderate convection that fostered a persistently aligned vortex, marking the onset of RI. The transition of precipitation on the downshear side of the TC from deep convection to mostly moderate convection was associated with a moistening environment that was less unstable than previous days, resulting in a vertical mass flux profile maximized in the lower troposphere with stretching on the mesoscale that sustained the aligned vortex as RI occurred. Alvey et al. (2021) [58] showed a similar evolution in the early stages of Hurricane Dorian (2019), using a combination of airborne Doppler and ground-based radar data as Dorian moved through the Windward Islands in the Caribbean.
7. Secondary Eyewall Formation/Eyewall Replacement Cycles (SEF/ERC)
Both the intensity and inner-core structure of mature TCs are frequently affected by secondary eyewall formation (SEF) and eyewall replacement cycles (ERCs). Sitkowski et al. [136] used flight-level data to identify common structure and intensity changes that occur in TCs undergoing SEF/ERC. Airborne observations have helped to identify multiple pathways to SEF. In an analysis of an SEF event in Hurricane Earl (2010), Didlake et al. [137] used TDR observations to determine that SEF was the result of boundary layer convergence driven by a mesoscale descending inflow jet originating from a region of stratiform precipitation. Other studies have emphasized the role of unbalanced boundary layer processes in SEF. In a case study of SEF in Hurricane Edouard (2014), Abarca et al. [138] used dropsonde observations to show that SEF occurred in a region characterized by a local maximum in boundary layer inflow associated with agradient forcing. Other studies have hypothesized the stagnation and axisymmetrization of outward-propagating vortex Rossby waves can lead to SEF (Dougherty et al., 2018; Guimond et al., 2020) [72,139]. Alternatively, Fischer et al. [140] analyzed TDR observations of two consecutive periods of SEF in Hurricane Irma (2017; Figure 19) and concluded multiple processes occurred in tandem to produce SEF. In this case, it was theorized that the first SEF event was driven by both a mesoscale descending inflow jet and axisymmeterizing vortex Rossby waves, whereas the second SEF was initiated by unbalanced boundary layer processes and continued vortex Rossby wave activity.
Following SEF, a TC will typically undergo an ERC, which can have a significant impact on both the intensity and structure of the storm. Although conventional wisdom has claimed TCs experience a period of weakening during an ERC, recent work using airborne observations has found that in some cases, the TC will fail to weaken as the ERC completes (Dougherty et al., 2018) [139], or even rapidly intensify [140]. Insight on the variability of the temporal scales of ERCs has also been gained, as the duration of an ERC can range from less than 12 h to multiple days [140,141]. Furthermore, the nature of TC convective asymmetries during ERCs has also been assessed [137,139,140,142] (Didlake et al., 2018; Dougherty et al., 2018). Didlake et al. (2017) [142] discovered not only that updrafts in the outer eyewall tend to occur more cyclonically downwind of updrafts in the inner eyewall but also that the outer eyewall deprives the inner eyewall of boundary layer inflow, facilitating its eventual demise.
8. Challenges, Opportunities, and Future Directions
The research advances described above are possible because of the numerous technologies that allow for a sampling of the TC inner core and environment in even the harshest conditions. While these technologies have proved invaluable to enable airborne sampling in TCs and their environment, there are areas where aircraft observations are deficient and new capabilities are needed.
8.1. Observational Gaps
While such airborne observational capabilities provide crucial information on TC structure and intensity change processes, there are gaps in our observations that have hampered a more complete understanding of the important physical processes. These gaps include turbulence measurements in the lowest 1 km in hurricane-force winds, measurements of temperature and humidity in the midlevels (~4 km) and above, upper-level measurements near and above the tropopause within the inner core, and measurements of hydrometeor species and concentrations above the freezing level, particularly in convection. While the use of the term “gap” implies an absence of measurements, that is not the case here. There are measurements of many of these parameters, but they are few and far between, and their limited number prevents research from being conducted in a manner that allows for robust conclusions to be drawn.
8.2. New Observing Technologies
New technologies have been, and are being, developed and tested to address many of these gaps. Uncrewed technologies provide the capability of sampling regions of the tropical cyclone and its environment that are unsafe for or beyond the capability of crewed aircraft. The NASA Global Hawk aircraft, capable of flying above 15–20 km altitude for 24 h or longer, has already been used to sample broad regions of the Tropics, and composite studies have revealed important upper-level structures [113]. Low-level uncrewed aircraft have provided measurements of temperature, moisture, wind, and pressure in the TC PBL [143]. With the planned addition of fast-response instrumentation for turbulence estimates and battery life expected to allow these systems to remain airborne for 2 h or longer, there is tremendous potential for these systems to advance our understanding of air–sea exchange and PBL mixing processes. Uncrewed technologies are also being applied to ocean measurements, with Gliders capable of measuring temperature, current, and salinity profiles in localized regions for extended (~1 month) periods of time [144] and a Saildrone that will be able to provide measurements of near-surface temperature, moisture, and wind, and surface salinity, temperature, current, and wave fields [145].
Other technologies have been developed that fly on crewed aircraft. A dropsonde fitted with an infrared (IR) sensor provides the ability to measure sea surface temperature in the absence of rain. These IR sondes have been shown to aid in the interpretation of the intensification of TCs (Zhang et al., 2017 [146]). Lidars can provide information on the wind, temperature, and humidity field in the absence of scatterers that radars require [147] (Zhang et al., 2018) [148]. The Hurricane Imaging Radiometer (HIRAD) instrument provides surface wind retrievals over a wide (~50 km) swath [149]. This provides a significantly improved capability of capturing the peak surface wind speeds, a common limitation of the Stepped Frequency Microwave Radiometer that only scans nadir [150]. A system for rapid deployment of dropsondes from a high-altitude aircraft, the High Density Sounding System (HDSS; [151]) provides the ability to collect high-resolution profiles of temperature, humidity, and winds from high altitude in the core and environment of TCs. A polarimetric, Doppler, airborne phased array radar (APAR) is being developed that can provide information on microphysical species and three-dimensional winds in all conditions. These instruments, and others not listed here, provide the potential to vastly expand our capability to sample the TC and its environment.
8.3. Future Research Directions
As discussed at the beginning of this manuscript, TC intensity change is a complex, multiscale process. While much of the research using aircraft data that addresses this topic has spanned a variety of processes, there are some processes that have received less attention than others, and they represent opportunities for greater emphases. Figure 20 provides an example of this. This figure takes all published manuscripts with authors from the NOAA/Atlantic Oceanographic and Meteorological Laboratory’s Hurricane Research Division over the past 15 years and categorizes them by what topic they primarily address [152]. The most frequently published topics include those related to TC structure, intensity change, ocean and air–sea interaction, PBL, and precipitation. Fewer studies have been published on TC–environment interactions, turbulence, and microphysics, suggesting a need for additional focus on these topics in the future. This relative lack of focus on those topics reflects the challenge of sampling them. The new technologies for measuring them discussed above provides the ability to increase this emphasis.
Additionally, while TC intensity change is an important process to understand and predict, there are other hazards from a landfalling TC, such as storm surge, rainfall, and severe weather, that can cause substantial loss of life and property damage. As a result, a broader emphasis on TC hazards, rather than simply peak 1-min winds, is becoming the focus of much of the research on TCs, as captured in the new NOAA airborne field campaign called Advancing the Prediction of Hurricanes Experiment (APHEX, [152]).
A variety of other field campaigns are ongoing or are planned that will address many of the issues described here. ONR has a multiyear field campaign with a primary emphasis on TC rapid intensification (TCRI) underway. NSF has funded a project called Prediction of Rainfall Extremes Campaign In the Pacific (PRECIP); its focus is on improved understanding of extreme rainfall events from TCs, mesoscale convective systems, and the Mei-Yu front. NASA is conducting an experiment called Convective Processes Experiment—Aerosols and Winds (CPEX-AW); its aim is to use their DC-8 aircraft to better understand the interactions between the larger-scale environmental features typical of the summer in the Atlantic (e.g., African easterly waves, the Intertropical Convergence Zone, and aerosols carried by the Saharan Air Layer) and the life cycle of convective cloud systems; its application to cases of tropical cyclogenesis is a subset of these interests. Future efforts will look to target TCs with aircraft at different stages of their lifecycle and in different basins, including the East Atlantic and West Pacific basins, where experiments with aircraft from partnering countries mentioned above are possible.
9. Conclusions
The studies described here represent a significant amount of progress in our understanding of processes important in TC structure and intensity change. This progress has occurred in a variety of topics, spanning interactions across multiple spatiotemporal scales, covering regions from the ocean subsurface to the stratosphere, and for TCs at all stages of their lifecycle. Aircraft data have played a vital role in these advancements, providing valuable information for numerical model initialization and evaluation and serving as an important check on theories of TC intensity change. While gaps in our airborne observational capability exist, new technologies hold the promise of filling them and providing the ability for continued advancement. New research directions also have the potential to broaden the impact of research advances on the complete array of hazards that accompany TC landfall.
A great deal has been learned from aircraft observations about TC structure and intensity changes processes, but there is much that remains to be discovered. This discovery, of course, cannot occur with aircraft data only. Other observational systems, including spaceborne and ground-based platforms, are needed, as are numerical modeling and theoretical studies. With an optimal blend of these approaches, our understanding of TCs will continue to advance substantially. Only with close collaboration with the operational forecasting community will these research advances be transitioned to operational forecasts. Such effective transitions, combined with continued advancements in data assimilation, provide the promise of maximizing the beneficial impact of observations to TC forecasts and ultimately enhancing society’s efforts to mitigate loss of life and damage from the continual threat of TCs.
Funding
This work was supported by NOAA Base funds.
Acknowledgments
I am grateful to Paul Reasor, Jon Zawislak, and Jun Zhang, all of whom provided helpful comments on earlier drafts of this manuscript. I am also grateful to all of the aircraft flight crews from the various agencies, whose tireless devotion to airborne data collection have provided the ability to make the advancements to our knowledge described here.
Conflicts of Interest
The authors declare no conflict of interest.
References
- Cangialosi, J.P.; Blake, E.; DeMaria, M.; Penny, A.; Latto, A.; Rappaport, E.; Tallapragada, V. Recent Progress in Tropical Cyclone Intensity Forecasting at the National Hurricane Center. Weather. Forecast. 2020, 35, 1913–1922. [Google Scholar] [CrossRef]
- Elsberry, R.L.; Chen, L.; Davidson, J.; Rogers, R.F.; Wang, Y.; Wu, L. Advances In Understanding And Forecasting Rapidly Changing Phenomena In Tropical Cyclones. Trop. Cyc. Res. Rev. 2013, 2, 13–24. [Google Scholar]
- Rogers, R.; Aberson, S.; Aksoy, A.; Annane, B.; Black, M.; Cione, J.; Dorst, N.; Dunion, J.; Gamache, J.; Goldenberg, S.; et al. NOAA’S Hurricane Intensity Forecasting Experiment: A Progress Report. Bull. Am. Meteorol. Soc. 2013, 94, 859–882. [Google Scholar] [CrossRef] [Green Version]
- Kaplan, J.; DeMaria, M.; Knaff, J.A. A Revised Tropical Cyclone Rapid Intensification Index for the Atlantic and Eastern North Pacific Basins. Weather. Forecast. 2010, 25, 220–241. [Google Scholar] [CrossRef]
- Rogers, R.F.; Velden, C.S.; Zawislak, J.; Zhang, J.A. Tropical Cyclones and Hurricanes: Observations. In Reference Module in Earth Systems and Environmental Sciences; Elsevier: Amsterdam, The Netherlands, 2019; p. 25. [Google Scholar]
- Rogers, R.; Aberson, S.; Black, M.; Black, P.; Cione, J.; Dodge, P.; Dunion, J.; Gamache, J.; Kaplan, J.; Powell, M.; et al. The Intensity Forecasting Experiment: A NOAA Multiyear Field Program for Improving Tropical Cyclone Intensity Forecasts. Bull. Am. Meteorol. Soc. 2006, 87, 1523–1538. [Google Scholar] [CrossRef] [Green Version]
- Wick, G.A.; Dunion, J.P.; Black, P.G.; Walker, J.R.; Torn, R.D.; Kren, A.C.; Aksoy, A.; Christophersen, H.; Cucurull, L.; Dahl, B.; et al. NOAA’s Sensing Hazards with Operational Unmanned Technology (SHOUT) Experiment Observations and Forecast Impacts. Bull. Am. Meteorol. Soc. 2020, 101, E968–E987. [Google Scholar] [CrossRef] [Green Version]
- Zipser, E.J.; Twohy, C.H.; Tsay, S.-C.; Thornhill, K.L.; Tanelli, S.; Ross, R.; Krishnamurti, T.N.; Ji, Q.; Jenkins, G.; Ismail, S.; et al. The Saharan Air Layer and the Fate of African Easterly Waves—NASA’s AMMA Field Study of Tropical Cyclogenesis. Bull. Am. Meteorol. Soc. 2009, 90, 1137–1156. [Google Scholar] [CrossRef] [Green Version]
- Braun, S.A.; Kakar, R.; Zipser, E.; Heymsfield, G.; Albers, C.; Brown, S.; Durden, S.L.; Guimond, S.; Halverson, J.; Heymsfield, A.; et al. NASA’s Genesis and Rapid Intensification Processes (GRIP) Field Experiment. Bull. Am. Meteorol. Soc. 2013, 94, 345–363. [Google Scholar] [CrossRef]
- Braun, S.A.; Newman, P.A.; Heymsfield, G.M. NASA’s Hurricane and Severe Storm Sentinel (HS3) Investigation. Bull. Am. Meteorol. Soc. 2016, 97, 2085–2102. [Google Scholar] [CrossRef]
- Montgomery, M.T.; Davis, C.; Dunkerton, T.; Wang, Z.; Velden, C.; Torn, R.; Majumdar, S.J.; Zhang, F.; Smith, R.K.; Bosart, L.; et al. The Pre-Depression Investigation of Cloud-Systems in the Tropics (PREDICT) Experiment: Scientific Basis, New Analysis Tools, and Some First Results. Bull. Am. Meteorol. Soc. 2012, 93, 153–172. [Google Scholar] [CrossRef] [Green Version]
- Doyle, J.D.; Moskaitis, J.R.; Feldmeier, J.W.; Ferek, R.J.; Beaubien, M.; Bell, M.M.; Cecil, D.L.; Creasey, R.L.; Duran, P.; Elsberry, R.L.; et al. A View of Tropical Cyclones from Above: The Tropical Cyclone Intensity Experiment. Bull. Am. Meteorol. Soc. 2017, 98, 2113–2134. [Google Scholar] [CrossRef]
- D’Asaro, E.; Black, P.G.; Centurioni, L.R.; Chang, Y.-T.; Chen, S.S.; Foster, R.C.; Graber, H.C.; Harr, P.; Hormann, V.; Lien, R.-C.; et al. Impact of Typhoons on the Ocean in the Pacific. Bull. Am. Meteorol. Soc. 2014, 95, 1405–1418. [Google Scholar] [CrossRef]
- Wu, C.-C.; Lin, P.-H.; Aberson, S.; Yeh, T.-C.; Huang, W.-P.; Chou, K.-H.; Hong, J.-S.; Lu, G.-C.; Fong, C.-T.; Hsu, K.-C. Dropwindsonde Observations for Typhoon Surveillance near the Taiwan Region (DOTSTAR): An overview. Bull. Amer. Meteor. Soc. 2005, 86, 787–790. [Google Scholar]
- Chan, P.; Hon, K.; Foster, S. Wind data collected by a fixed-wing aircraft in the vicinity of a tropical cyclone over the south China coastal waters. Meteorol. Z. 2011, 20, 313–321. [Google Scholar] [CrossRef]
- Wong, W.K.; Tse, S.M.; Chan, P.W. Impacts of reconnaissance flight data on numerical simulation of tropical cyclones over South China Sea. Meteorol. Appl. 2013, 21, 831–847. [Google Scholar] [CrossRef] [Green Version]
- Lei, X.T.; Wong, W.K.; Fong, C. A Challenge of the Experiment on Typhoon Intensity Change in Coastal Area. Trop. Cyclone Res. Rev. 2017, 6, 94–97. [Google Scholar] [CrossRef]
- Ito, K.; Yamada, H.; Yamaguchi, M.; Nakazawa, T.; Nagahama, N.; Shimizu, K.; Ohigashi, T.; Shinoda, T.; Tsuboki, K. Analysis and Forecast Using Dropsonde Data from the Inner-Core Region of Tropical Cyclone Lan (2017) Obtained during the First Aircraft Missions of T-PARCII. SOLA 2018, 14, 105–110. [Google Scholar] [CrossRef] [Green Version]
- Aberson, S.D.; Cione, J.J.; Wu, C.-C.; Bell, M.M.; Halverson, J.; Fogarty, C.; Weissmann, M. Aircraft observations of tropical cyclones. In Global Perspectives on Tropical Cyclones: From Science to Mitigation; Chan, J.C.L., Kepert, J.D., Eds.; World Scientific: Singapore, 2010; pp. 227–240. [Google Scholar]
- Marks, F., Jr. Hurricanes: Observation. In Encyclopedia of Atmospheric Sciences, 2nd ed.; Elsevier: Amsterdam, The Netherlands, 2015; Volume 6, pp. 35–56. [Google Scholar]
- Rogers, R.; Lorsolo, S.; Reasor, P.; Gamache, J.; Marks, F. Multiscale Analysis of Tropical Cyclone Kinematic Structure from Airborne Doppler Radar Composites. Mon. Weather. Rev. 2012, 140, 77–99. [Google Scholar] [CrossRef]
- Marks, F.D.; Houze, R.A. Inner Core Structure of Hurricane Alicia from Airborne Doppler Radar Observations. J. Atmos. Sci. 1987, 44, 1296–1317. [Google Scholar] [CrossRef] [Green Version]
- Fischer, M.S.; Rogers, R.F.; Reasor, P.D.; Gamache, J. An Analysis of Tropical Cyclone Vortex and Convective Characteristics in Relation to Storm Intensity using a Novel Airborne Doppler Radar Database. Bull. Am. Meteorol. Soc. 2021, 87, 1503–1522, Manuscript in preparation. [Google Scholar]
- Stern, D.P.; Nolan, D.S. Reexamining the Vertical Structure of Tangential Winds in Tropical Cyclones: Observations and Theory. J. Atmos. Sci. 2009, 66, 3579–3600. [Google Scholar] [CrossRef] [Green Version]
- Hazelton, A.T.; Hart, R.E. Hurricane Eyewall Slope as Determined from Airborne Radar Reflectivity Data: Composites and Case Studies. Weather. Forecast. 2013, 28, 368–386. [Google Scholar] [CrossRef]
- Hazelton, A.T.; Rogers, R.; Hart, R.E. Shear-Relative Asymmetries in Tropical Cyclone Eyewall Slope. Mon. Weather. Rev. 2015, 143, 883–903. [Google Scholar] [CrossRef]
- Lorsolo, S.; Zhang, J.A.; Marks, F., Jr.; Gamache, J. Estimation and Mapping of Hurricane Turbulent Energy Using Airborne Doppler Measurements. Mon. Weather. Rev. 2010, 138, 3656–3670. [Google Scholar] [CrossRef]
- Creasey, R.L.; Elsberry, R.L. Tropical Cyclone Center Positions from Sequences of HDSS Sondes Deployed along High-Altitude Overpasses. Weather. Forecast. 2017, 32, 317–325. [Google Scholar] [CrossRef]
- Hendricks, E.A.; Elsberry, R.L.; Velden, C.S.; Jorgensen, A.C.; Jordan, M.S.; Creasey, R.L. Environmental Factors and Internal Processes Contributing to the Interrupted Rapid Decay of Hurricane Joaquin (2015). Weather. Forecast. 2018, 33, 1251–1262. [Google Scholar] [CrossRef]
- Reasor, P.D.; Rogers, R.; Lorsolo, S. Environmental Flow Impacts on Tropical Cyclone Structure Diagnosed from Airborne Doppler Radar Composites. Mon. Weather. Rev. 2013, 141, 2949–2969. [Google Scholar] [CrossRef]
- Dehart, J.C.; Houze, R.A., Jr.; Rogers, R.F. Quadrant Distribution of Tropical Cyclone Inner-Core Kinematics in Relation to Environmental Shear. J. Atmos. Sci. 2014, 71, 2713–2732. [Google Scholar] [CrossRef]
- Uhlhorn, E.W.; Klotz, B.W.; Vukicevic, T.; Reasor, P.D.; Rogers, R.F. Observed Hurricane Wind Speed Asymmetries and Relationships to Motion and Environmental Shear. Mon. Weather. Rev. 2014, 142, 1290–1311. [Google Scholar] [CrossRef]
- Zhang, J.A.; Dunion, J.P.; Nolan, D.S. In Situ Observations of the Diurnal Variation in the Boundary Layer of Mature Hurricanes. Geophys. Res. Lett. 2020, 47, 2019GL086206. [Google Scholar] [CrossRef]
- Dunion, J.P.; Thorncroft, C.D.; Velden, C.S. The Tropical Cyclone Diurnal Cycle of Mature Hurricanes. Mon. Weather. Rev. 2014, 142, 3900–3919. [Google Scholar] [CrossRef] [Green Version]
- Dunion, J.P.; Thorncroft, C.D.; Nolan, D.S. Tropical Cyclone Diurnal Cycle Signals in a Hurricane Nature Run. Mon. Weather. Rev. 2019, 147, 363–388. [Google Scholar] [CrossRef]
- Rogers, R.; Reasor, P.; Lorsolo, S. Airborne Doppler Observations of the Inner-Core Structural Differences between Intensifying and Steady-State Tropical Cyclones. Mon. Weather. Rev. 2013, 141, 2970–2991. [Google Scholar] [CrossRef]
- Rogers, R.F.; Reasor, P.D.; Zhang, J.A. Multiscale Structure and Evolution of Hurricane Earl (2010) during Rapid Intensification. Mon. Weather. Rev. 2015, 143, 536–562. [Google Scholar] [CrossRef]
- Rogers, R.F.; Reasor, P.D.; Zhang, J.A. Reply to “Comments on ‘Multiscale Structure and Evolution of Hurricane Earl (2010) during Rapid Intensification’”. Mon. Weather. Rev. 2017, 145, 1573–1575. [Google Scholar] [CrossRef]
- Susca-Lopata, G.; Zawislak, J.; Zipser, E.J.; Rogers, R.F. The Role of Observed Environmental Conditions and Precipitation Evolution in the Rapid Intensification of Hurricane Earl (2010). Mon. Weather. Rev. 2015, 143, 2207–2223. [Google Scholar] [CrossRef]
- Nolan, D.S.; Moon, Y.; Stern, D.P. Tropical Cyclone Intensification from Asymmetric Convection: Energetics and Efficiency. J. Atmos. Sci. 2007, 64, 3377–3405. [Google Scholar] [CrossRef]
- Pendergrass, A.G.; Willoughby, H.E. Diabatically Induced Secondary Flows in Tropical Cyclones. Part I: Quasi-Steady Forcing. Mon. Weather. Rev. 2009, 137, 805–821. [Google Scholar] [CrossRef] [Green Version]
- Schubert, W.H.; Hack, J.J. Inertial Stability and Tropical Cyclone Development. J. Atmos. Sci. 1982, 39, 1687–1697. [Google Scholar] [CrossRef]
- Vigh, J.L.; Schubert, W.H. Rapid Development of the Tropical Cyclone Warm Core. J. Atmos. Sci. 2009, 66, 3335–3350. [Google Scholar] [CrossRef] [Green Version]
- Montgomery, M.T.; Zhang, J.A.; Smith, R.K. An analysis of the observed low-level structure of rapidly intensifying and mature hurricane Earl (2010). Q. J. R. Meteorol. Soc. 2014, 140, 2132–2146. [Google Scholar] [CrossRef] [Green Version]
- Smith, R.K.; Montgomery, M.T. The efficiency of diabatic heating and tropical cyclone intensification. Q. J. R. Meteorol. Soc. 2016, 142, 2081–2086. [Google Scholar] [CrossRef]
- Smith, R.K.; Montgomery, M.T.; Van Sang, N. Tropical cyclone spin-up revisited. Q. J. R. Meteorol. Soc. 2009, 135, 1321–1335. [Google Scholar] [CrossRef] [Green Version]
- Stevenson, S.N.; Corbosiero, K.L.; DeMaria, M.; Vigh, J.L. A 10-Year Survey of Tropical Cyclone Inner-Core Lightning Bursts and Their Relationship to Intensity Change. Weather. Forecast. 2017, 33, 23–36. [Google Scholar] [CrossRef]
- Vigh, J.L.; Dorst, N.M.; Williams, C.L.; Stern, D.P.; Uhlhorn, E.W.; Klotz, B.W.; Martinez, J.; Willoughby, H.E. FLIGHT+: The Extended Flight Level Dataset for Tropical Cyclones; Tropical Cyclone Data Project, National Center for Atmospheric Research, Research Applications Laboratory: Boulder, CO, USA, 2016; Available online: http://0-dx-doi-org.brum.beds.ac.uk/10.5065/D6WS8R93 (accessed on 17 May 2021).
- Price, C.; Asfur, M.; Yair, Y. Maximum hurricane intensity preceded by increase in lightning frequency. Nat. Geosci. 2009, 2, 329–332. [Google Scholar] [CrossRef]
- Martinez, J.; Bell, M.M.; Vigh, J.L.; Rogers, R.F. Examining Tropical Cyclone Structure and Intensification with the FLIGHT+ Dataset from 1999 to 2012. Mon. Weather. Rev. 2017, 145, 4401–4421. [Google Scholar] [CrossRef] [Green Version]
- Rogers, R.F.; Aberson, S.; Bell, M.M.; Cecil, D.J.; Doyle, J.D.; Kimberlain, T.B.; Morgerman, J.; Shay, L.K.; Velden, C. Rewriting the Tropical Record Books: The Extraordinary Intensification of Hurricane Patricia (2015). Bull. Am. Meteorol. Soc. 2017, 98, 2091–2112. [Google Scholar] [CrossRef]
- Martinez, J.; Bell, M.M.; Rogers, R.F.; Doyle, J.D. Axisymmetric Potential Vorticity Evolution of Hurricane Patricia (2015). J. Atmos. Sci. 2019, 76, 2043–2063. [Google Scholar] [CrossRef] [Green Version]
- Guimond, S.R.; Heymsfield, G.M.; Turk, F.J. Multiscale Observations of Hurricane Dennis (2005): The Effects of Hot Towers on Rapid Intensification. J. Atmos. Sci. 2010, 67, 633–654. [Google Scholar] [CrossRef]
- Rios-Berrios, R.; Torn, R.D. Climatological Analysis of Tropical Cyclone Intensity Changes under Moderate Vertical Wind Shear. Mon. Weather. Rev. 2017, 145, 1717–1738. [Google Scholar] [CrossRef]
- Bhatia, K.T.; Nolan, D.S. Relating the Skill of Tropical Cyclone Intensity Forecasts to the Synoptic Environment. Weather. Forecast. 2013, 28, 961–980. [Google Scholar] [CrossRef]
- Zhang, F.; Tao, D. Effects of Vertical Wind Shear on the Predictability of Tropical Cyclones. J. Atmos. Sci. 2013, 70, 975–983. [Google Scholar] [CrossRef]
- Sumwalt, R.L., III; Hart, C.A.; Weener, E.F.; Dinh-Zahr, T.B. Safety Recommendation Report: Tropical Cyclone Information for Mariners; Technical Report MSR-17/02; National Transportation Safety Board: Washington, DC, USA, 2017; p. 21. Available online: https://www.ntsb.gov/investigations/AccidentReports/Reports/MSR1702.pdf (accessed on 17 May 2021).
- Alvey, G.A.; Fischer, M.S.; Reasor, P.D.; Rogers, R.F.; Zawislak, J.A. Processes underlying the Vortex Repositioning during Dorian’s (2019) Early Stages that increased its favorability for Rapid Intensification. Mon. Weather. Rev. 2021. in review. [Google Scholar]
- Jiang, H. The Relationship between Tropical Cyclone Intensity Change and the Strength of Inner-Core Convection. Mon. Weather. Rev. 2012, 140, 1164–1176. [Google Scholar] [CrossRef]
- Nguyen, L.T.; Rogers, R.F.; Reasor, P.D. Thermodynamic and Kinematic Influences on Precipitation Symmetry in Sheared Tropical Cyclones: Bertha and Cristobal (2014). Mon. Weather. Rev. 2017, 145, 4423–4446. [Google Scholar] [CrossRef]
- Black, M.L.; Gamache, J.F.; Marks, F.D.; Samsury, C.E.; Willoughby, H.E. Eastern Pacific Hurricanes Jimena of 1991 and Olivia of 1994: The Effect of Vertical Shear on Structure and Intensity. Mon. Weather. Rev. 2002, 130, 2291–2312. [Google Scholar] [CrossRef]
- Corbosiero, K.L.; Molinari, J. The Relationship between Storm Motion, Vertical Wind Shear, and Convective Asymmetries in Tropical Cyclones. J. Atmos. Sci. 2003, 60, 366–376. [Google Scholar] [CrossRef]
- Reasor, P.D.; Eastin, M.D. Rapidly Intensifying Hurricane Guillermo (1997). Part II: Resilience in Shear. Mon. Weather. Rev. 2012, 140, 425–444. [Google Scholar] [CrossRef]
- Rogers, R.; Chen, S.; Tenerelli, J.; Willoughby, H. A Numerical Study of the Impact of Vertical Shear on the Distribution of Rainfall in Hurricane Bonnie (1998). Mon. Weather. Rev. 2003, 131, 1577–1599. [Google Scholar] [CrossRef]
- Zawislak, J.; Jiang, H.; Alvey, G.R.; Zipser, E.J.; Rogers, R.F.; Zhang, J.A.; Stevenson, S.N. Observations of the Structure and Evolution of Hurricane Edouard (2014) during Intensity Change. Part I: Relationship between the Thermodynamic Structure and Precipitation. Mon. Weather. Rev. 2016, 144, 3333–3354. [Google Scholar] [CrossRef]
- Reasor, P.D.; Eastin, M.D.; Gamache, J.F. Rapidly Intensifying Hurricane Guillermo (1997). Part I: Low-Wavenumber Structure and Evolution. Mon. Weather. Rev. 2009, 137, 603–631. [Google Scholar] [CrossRef]
- Rogers, R.F.; Zhang, J.A.; Zawislak, J.; Jiang, H.; Alvey, G.R.; Zipser, E.J.; Stevenson, S.N. Observations of the Structure and Evolution of Hurricane Edouard (2014) during Intensity Change. Part II: Kinematic Structure and the Distribution of Deep Convection. Mon. Weather. Rev. 2016, 144, 3355–3376. [Google Scholar] [CrossRef]
- Wadler, J.B.; Rogers, R.F.; Reasor, P.D. The Relationship between Spatial Variations in the Structure of Convective Bursts and Tropical Cyclone Intensification as Determined by Airborne Doppler Radar. Mon. Weather. Rev. 2018, 146, 761–780. [Google Scholar] [CrossRef]
- Guimond, S.R.; Heymsfield, G.M.; Reasor, P.D.; Didlake, J.A.C. The Rapid Intensification of Hurricane Karl (2010): New Remote Sensing Observations of Convective Bursts from the Global Hawk Platform. J. Atmos. Sci. 2016, 73, 3617–3639. [Google Scholar] [CrossRef] [PubMed]
- Li, L.; Heymsfield, G.; Carswell, J.; Schaubert, D.H.; McLinden, M.L.; Creticos, J.; Perrine, M.; Coon, M.; Cervantes, J.I.; Vega, M.; et al. The NASA High-Altitude Imaging Wind and Rain Airborne Profiler. IEEE Trans. Geosci. Remote. Sens. 2015, 54, 298–310. [Google Scholar] [CrossRef]
- Brown, S.T.; Lambrigtsen, B.; Denning, R.F.; Gaier, T.; Kangaslahti, P.; Lim, B.H.; Tanabe, J.M.; Tanner, A.B. The High-Altitude MMIC Sounding Radiometer for the Global Hawk Unmanned Aerial Vehicle: Instrument Description and Performance. IEEE Trans. Geosci. Remote. Sens. 2011, 49, 3291–3301. [Google Scholar] [CrossRef]
- Guimond, S.R.; Reasor, P.D.; Heymsfield, G.M.; McLinden, M.M. The Dynamics of Vortex Rossby Waves and Secondary Eyewall Development in Hurricane Matthew (2016): New Insights from Radar Measurements. J. Atmos. Sci. 2020, 77, 2349–2374. [Google Scholar] [CrossRef]
- Bryan, G.H. Effects of Surface Exchange Coefficients and Turbulence Length Scales on the Intensity and Structure of Numerically Simulated Hurricanes. Mon. Weather. Rev. 2012, 140, 1125–1143. [Google Scholar] [CrossRef] [Green Version]
- Cione, J.J.; Kalina, E.A.; Zhang, J.A.; Uhlhorn, E.W. Observations of Air–Sea Interaction and Intensity Change in Hurricanes. Mon. Weather. Rev. 2013, 141, 2368–2382. [Google Scholar] [CrossRef]
- Emanuel, K.A. Sensitivity of Tropical Cyclones to Surface Exchange Coefficients and a Revised Steady-State Model incorporating Eye Dynamics. J. Atmos. Sci. 1995, 52, 3969–3976. [Google Scholar] [CrossRef] [Green Version]
- Kilroy, G.; Smith, R.K.; Montgomery, M.T. Why Do Model Tropical Cyclones Grow Progressively in Size and Decay in Intensity after Reaching Maturity? J. Atmos. Sci. 2016, 73, 487–503. [Google Scholar] [CrossRef]
- Ooyama, K. Numerical Simulation of the Life Cycle of Tropical Cyclones. J. Atmos. Sci. 1969, 26, 3–40. [Google Scholar] [CrossRef]
- Zhang, J.A.; Rogers, R.F.; Nolan, D.S.; Marks, F.D., Jr. On the characteristic height scales of the hurricane boundary layer. Mon. Weather Rev. 2011, 139, 2523–2535. [Google Scholar] [CrossRef]
- Zhang, J.A.; Drennan, W.M.; Black, P.G.; French, J.R. Turbulence Structure of the Hurricane Boundary Layer between the Outer Rainbands. J. Atmos. Sci. 2009, 66, 2455–2467. [Google Scholar] [CrossRef]
- Ming, J.; Zhang, J.A.; Rogers, R.F. Typhoon kinematic and thermodynamic boundary layer structure from dropsonde composites. J. Geophys. Res. Atmos. 2015, 120, 3158–3172. [Google Scholar] [CrossRef]
- Ahern, K.; Bourassa, M.A.; Hart, R.E.; Zhang, J.A.; Rogers, R.F. Observed Kinematic and Thermodynamic Structure in the Hurricane Boundary Layer during Intensity Change. Mon. Weather. Rev. 2019, 147, 2765–2785. [Google Scholar] [CrossRef]
- Zhang, J.A.; Rogers, R.F.; Reasor, P.D.; Uhlhorn, E.W.; Marks, F.D., Jr. Asymmetric Hurricane Boundary Layer Structure from Dropsonde Composites in Relation to the Environmental Vertical Wind Shear. Mon. Weather. Rev. 2013, 141, 3968–3984. [Google Scholar] [CrossRef]
- Molinari, J.; Frank, J.; Vollaro, D. Convective Bursts, Downdraft Cooling, and Boundary Layer Recovery in a Sheared Tropical Storm. Mon. Weather. Rev. 2013, 141, 1048–1060. [Google Scholar] [CrossRef]
- Nguyen, L.T.; Rogers, R.; Zawislak, J.; Zhang, J.A. Assessing the Influence of Convective Downdrafts and Surface Enthalpy Fluxes on Tropical Cyclone Intensity Change in Moderate Vertical Wind Shear. Mon. Weather. Rev. 2019, 147, 3519–3534. [Google Scholar] [CrossRef]
- Wadler, J.B.; Zhang, J.A.; Jaimes, B.; Shay, L.K. Downdrafts and the Evolution of Boundary Layer Thermodynamics in Hurricane Earl (2010) before and during Rapid Intensification. Mon. Weather. Rev. 2018, 146, 3545–3565. [Google Scholar] [CrossRef]
- Wadler, J.B.; Zhang, J.A.; Rogers, R.F.; Jaimes, B.; Shay, L.K. The Rapid Intensification of Hurricane Michael (2018): Storm Structure and the Relationship to Environmental and Air–Sea Interactions. Mon. Weather. Rev. 2021, 149, 245–267. [Google Scholar] [CrossRef]
- Jaimes, B.; Shay, L.K.; Uhlhorn, E.W. Enthalpy and Momentum Fluxes during Hurricane Earl Relative to Underlying Ocean Features. Mon. Weather. Rev. 2015, 143, 111–131. [Google Scholar] [CrossRef]
- Emanuel, K.A. An air–sea interaction theory for tropical cyclones. Part I: Steady-state maintenance. J. Atmos. Sci. 1986, 43, 585–604. [Google Scholar] [CrossRef]
- Malkus, J.S.; Riehl, H. On the dynamics and energy transformations in steady-state hurricanes. Tellus 1960, 12, 1–20. [Google Scholar] [CrossRef] [Green Version]
- Powell, M.D.; Vickery, P.J.; Reinhold, T.A. Reduced drag coefficient for high wind speeds in tropical cyclones. Nat. Cell Biol. 2003, 422, 279–283. [Google Scholar] [CrossRef]
- Vickery, P.J.; Wadhera, D.; Powell, M.D.; Chen, Y. A Hurricane Boundary Layer and Wind Field Model for Use in Engineering Applications. J. Appl. Meteorol. Clim. 2009, 48, 381–405. [Google Scholar] [CrossRef]
- Donelan, M.A.; Haus, B.K.; Reul, N.; Plant, W.J.; Stiassnie, M.; Graber, H.C.; Brown, O.B.; Saltzman, E.S. On the limiting aerodynamic roughness of the ocean in very strong winds. Geophys. Res. Lett. 2004, 31, L18306. [Google Scholar] [CrossRef] [Green Version]
- Haus, B.K.; Jeong, D.; Donelan, M.A.; Zhang, J.A.; Savelyev, I. Relative rates of sea-air heat transfer and frictional drag in very high winds. Geophys. Res. Lett. 2010, 37, 07802. [Google Scholar] [CrossRef]
- Zhang, J.A.; Black, P.G.; French, J.R.; Drennan, W.M. First direct measurements of enthalpy flux in the hurricane boundary layer: The CBLAST results. Geophys. Res. Lett. 2008, 35. [Google Scholar] [CrossRef] [Green Version]
- Black, P.G.; D’Asaro, E.A.; Drennan, W.M.; French, J.R.; Niiler, P.P.; Sanford, T.B.; Terrill, E.J.; Walsh, E.J.; Zhang, J.A. Air–Sea Exchange in Hurricanes: Synthesis of Observations from the Coupled Boundary Layer Air–Sea Transfer Experiment. Bull. Am. Meteorol. Soc. 2007, 88, 357–374. [Google Scholar] [CrossRef] [Green Version]
- Drennan, W.M.; Zhang, J.A.; French, J.R.; McCormick, C.; Black, P.G. Turbulent Fluxes in the Hurricane Boundary Layer. Part II: Latent Heat Flux. J. Atmos. Sci. 2007, 64, 1103–1115. [Google Scholar] [CrossRef] [Green Version]
- French, J.R.; Drennan, W.M.; Zhang, J.A.; Black, P.G. Turbulent Fluxes in the Hurricane Boundary Layer. Part I: Momentum Flux. J. Atmos. Sci. 2007, 64, 1089–1102. [Google Scholar] [CrossRef] [Green Version]
- Bell, M.M.; Montgomery, M.T.; Emanuel, K.A. Air–Sea Enthalpy and Momentum Exchange at Major Hurricane Wind Speeds Observed during CBLAST. J. Atmos. Sci. 2012, 69, 3197–3222. [Google Scholar] [CrossRef]
- Zhang, J.A.; Marks, F.D.; Montgomery, M.T.; Lorsolo, S. An Estimation of Turbulent Characteristics in the Low-Level Region of Intense Hurricanes Allen (1980) and Hugo (1989). Mon. Weather. Rev. 2011, 139, 1447–1462. [Google Scholar] [CrossRef] [Green Version]
- Zhang, J.A.; Drennan, W.M. An Observational Study of Vertical Eddy Diffusivity in the Hurricane Boundary Layer. J. Atmos. Sci. 2012, 69, 3223–3236. [Google Scholar] [CrossRef]
- Gopalakrishnan, S.G.; Marks, F.D.; Zhang, J.A.; Zhang, X.; Bao, J.-W.; Tallapragada, V. A Study of the Impacts of Vertical Diffusion on the Structure and Intensity of the Tropical Cyclones Using the High-Resolution HWRF System. J. Atmos. Sci. 2013, 70, 524–541. [Google Scholar] [CrossRef]
- Zhang, J.A.; Nolan, D.S.; Rogers, R.F.; Tallapragada, V. Evaluating the Impact of Improvements in the Boundary Layer Parameterization on Hurricane Intensity and Structure Forecasts in HWRF. Mon. Weather. Rev. 2015, 143, 3136–3155. [Google Scholar] [CrossRef]
- Zhang, J.A.; Rogers, R.F.; Tallapragada, V. Impact of Parameterized Boundary Layer Structure on Tropical Cyclone Rapid Intensification Forecasts in HWRF. Mon. Weather. Rev. 2017, 145, 1413–1426. [Google Scholar] [CrossRef]
- Zhang, J.A.; Rogers, R.F. Effects of Parameterized Boundary Layer Structure on Hurricane Rapid Intensification in Shear. Mon. Weather. Rev. 2019, 147, 853–871. [Google Scholar] [CrossRef]
- Zhang, J.A.; Montgomery, M.T. Observational Estimates of the Horizontal Eddy Diffusivity and Mixing Length in the Low-Level Region of Intense Hurricanes. J. Atmos. Sci. 2012, 69, 1306–1316. [Google Scholar] [CrossRef] [Green Version]
- Zhang, J.A.; Marks, F.D. Effects of Horizontal Diffusion on Tropical Cyclone Intensity Change and Structure in Idealized Three-Dimensional Numerical Simulations. Mon. Weather. Rev. 2015, 143, 3981–3995. [Google Scholar] [CrossRef]
- Zhang, J.A.; Marks, F.D.; Sippel, J.A.; Rogers, R.F.; Zhang, X.; Gopalakrishnan, S.G.; Zhang, Z.; Tallapragada, V. Evaluating the Impact of Improvement in the Horizontal Diffusion Parameterization on Hurricane Prediction in the Operational Hurricane Weather Research and Forecast (HWRF) Model. Weather. Forecast. 2018, 33, 317–329. [Google Scholar] [CrossRef]
- Montgomery, M.; Smith, R. Paradigms for tropical cyclone intensification. J. South. Hemisphere Earth Syst. Sci. 2014, 64, 37–66. [Google Scholar] [CrossRef]
- Smith, R.K.; Thomsen, G.L. Dependence of tropical-cyclone intensification on the boundary-layer representation in a numerical model. Q. J. R. Meteorol. Soc. 2010, 136, 1671–1685. [Google Scholar] [CrossRef]
- Zhang, J.; Kalina, E.; Biswas, M.; Rogers, R.; Zhu, P.; Marks, F. A Review and Evaluation of Planetary Boundary Layer Parameterizations in Hurricane Weather Research and Forecasting Model Using Idealized Simulations and Observations. Atmosphere 2020, 11, 1091. [Google Scholar] [CrossRef]
- Sanger, N.T.; Montgomery, M.T.; Smith, R.K.; Bell, M.M. An Observational Study of Tropical Cyclone Spinup in Supertyphoon Jangmi (2008) from 24 to 27 September. Mon. Weather. Rev. 2014, 142, 3–28. [Google Scholar] [CrossRef] [Green Version]
- Duran, P.; Molinari, J. Dramatic Inner-Core Tropopause Variability during the Rapid Intensification of Hurricane Patricia (2015). Mon. Weather. Rev. 2018, 146, 119–134. [Google Scholar] [CrossRef]
- Komaromi, W.A.; Doyle, J.D. Tropical Cyclone Outflow and Warm Core Structure as Revealed by HS3 Dropsonde Data. Mon. Weather. Rev. 2017, 145, 1339–1359. [Google Scholar] [CrossRef]
- Hendricks, E.A.; Montgomery, M.T.; Davis, C.A. The role of “vortical” hot towers in the formation of Tropical Cyclone Diana. J. Atmos. Sci. 2004, 1984, 1209–1232. [Google Scholar] [CrossRef] [Green Version]
- Montgomery, M.T.; Nicholls, M.E.; Cram, T.A.; Saunders, A.B. A Vortical Hot Tower Route to Tropical Cyclogenesis. J. Atmos. Sci. 2006, 63, 355–386. [Google Scholar] [CrossRef] [Green Version]
- Nguyen, S.V.; Smith, K.R.; Montgomery, T.M. Tropical cyclone intensification and predictability in three dimensions. Q. J. R. Meteorol. Soc. 2008, 134, 563–582. [Google Scholar]
- Reasor, P.D.; Montgomery, M.T.; Bosart, L.F. Mesoscale Observations of the Genesis of Hurricane Dolly (1996). J. Atmos. Sci. 2005, 62, 3151–3171. [Google Scholar] [CrossRef]
- Houze, R.A.; Lee, W.-C.; Bell, M.M. Convective Contribution to the Genesis of Hurricane Ophelia (2005). Mon. Weather. Rev. 2009, 137, 2778–2800. [Google Scholar] [CrossRef]
- Bell, M.M.; Montgomery, M.T. Sheared deep vortical convection in pre-depression Hagupit during TCS08. Geophys. Res. Lett. 2010, 37, 5. [Google Scholar] [CrossRef] [Green Version]
- Raymond, D.J.; Sessions, S.L.; Carrillo, C.L. Thermodynamics of tropical cyclogenesis in the northwest Pacific. J. Geophys. Res. Space Phys. 2011, 116. [Google Scholar] [CrossRef] [Green Version]
- Raymond, D.J.; Carrillo, C.L. The vorticity budget of developing typhoon Nuri (2008). Atmos. Chem. Phys. Discuss. 2011, 11, 147–163. [Google Scholar] [CrossRef] [Green Version]
- Gjorgjievska, S.; Raymond, D.J. Interaction between dynamics and thermodynamics during tropical cyclogenesis. Atmos. Chem. Phys. Discuss. 2014, 14, 3065–3082. [Google Scholar] [CrossRef] [Green Version]
- Raymond, D.; Gjorgjievska, S.; Sessions, S.; Fuchs, K. Tropical cyclogenesis and mid-level vorticity. J. South. Hemisphere Earth Syst. Sci. 2014, 64, 11–25. [Google Scholar] [CrossRef]
- Bell, M.M.; Montgomery, M.T. Mesoscale processes during the genesis of Hurricane Karl. J. Atmos. Sci. 2019, 76, 2235–2255. [Google Scholar] [CrossRef]
- Zawislak, J.; Zipser, E.J. Observations of Seven African Easterly Waves in the East Atlantic during 2006. J. Atmos. Sci. 2010, 67, 26–43. [Google Scholar] [CrossRef]
- Davis, C.A.; Ahijevych, D.A. Mesoscale Structural Evolution of Three Tropical Weather Systems Observed during PREDICT. J. Atmos. Sci. 2012, 69, 1284–1305. [Google Scholar] [CrossRef]
- Davis, C.A.; Ahijevych, D.A. Thermodynamic Environments of Deep Convection in Atlantic Tropical Disturbances. J. Atmos. Sci. 2013, 70, 1912–1928. [Google Scholar] [CrossRef]
- Helms, C.N.; Hart, R.E. The Evolution of Dropsonde-Derived Kinematic and Thermodynamic Structures in Developing and Nondeveloping Atlantic Tropical Convective Systems. Mon. Weather. Rev. 2015, 143, 3109–3135. [Google Scholar] [CrossRef]
- Komaromi, W.A. An Investigation of Composite Dropsonde Profiles for Developing and Nondeveloping Tropical Waves during the 2010 PREDICT Field Campaign. J. Atmos. Sci. 2013, 70, 542–558. [Google Scholar] [CrossRef]
- Smith, R.K.; Montgomery, M.T. Observations of the convective environment in developing and non-developing tropical disturbances. Q. J. R. Meteorol. Soc. 2012, 138, 1721–1739. [Google Scholar] [CrossRef] [Green Version]
- Zawislak, J.; Zipser, E.J. Analysis of the Thermodynamic Properties of Developing and Nondeveloping Tropical Disturbances Using a Comprehensive Dropsonde Dataset. Mon. Weather. Rev. 2014, 142, 1250–1264. [Google Scholar] [CrossRef]
- Brammer, A.; Thorncroft, C.D.; Dunion, J.P. Observations and Predictability of a Nondeveloping Tropical Disturbance over the Eastern Atlantic. Mon. Weather. Rev. 2018, 146, 3079–3096. [Google Scholar] [CrossRef]
- Penny, A.B.; Harr, P.A.; Bell, M.M. Observations of a Nondeveloping Tropical Disturbance in the Western North Pacific during TCS-08 (2008). Mon. Weather. Rev. 2015, 143, 2459–2484. [Google Scholar] [CrossRef] [Green Version]
- Molinari, J.; Vollaro, D. Rapid Intensification of a Sheared Tropical Storm. Mon. Weather. Rev. 2010, 138, 3869–3885. [Google Scholar] [CrossRef]
- Rogers, R.F.; Reasor, P.D.; Zawislak, J.A.; Nguyen, L.T. Precipitation Processes and Vortex Alignment during the Intensification of a Weak Tropical Cyclone in Moderate Vertical Shear. Mon. Weather. Rev. 2020, 148, 1899–1929. [Google Scholar] [CrossRef] [Green Version]
- Sitkowski, M.; Kossin, J.P.; Rozoff, C.M. Intensity and Structure Changes during Hurricane Eyewall Replacement Cycles. Mon. Weather. Rev. 2011, 139, 3829–3847. [Google Scholar] [CrossRef]
- Didlake, A.C.; Reasor, P.D.; Rogers, R.F.; Lee, W.-C. Dynamics of the Transition from Spiral Rainbands to a Secondary Eyewall in Hurricane Earl (2010). J. Atmos. Sci. 2018, 75, 2909–2929. [Google Scholar] [CrossRef]
- Abarca, S.F.; Montgomery, M.T.; Braun, S.A.; Dunion, J. On the Secondary Eyewall Formation of Hurricane Edouard (2014). Mon. Weather. Rev. 2016, 144, 3321–3331. [Google Scholar] [CrossRef]
- Dougherty, E.M.; Molinari, J.; Rogers, R.F.; Zhang, J.A.; Kossin, J.P. Hurricane Bonnie (1998): Maintaining Intensity during High Vertical Wind Shear and an Eyewall Replacement Cycle. Mon. Weather. Rev. 2018, 146, 3383–3399. [Google Scholar] [CrossRef]
- Fischer, M.S.; Rogers, R.F.; Reasor, P.D. The Rapid Intensification and Eyewall Replacement Cycles of Hurricane Irma (2017). Mon. Weather. Rev. 2020, 148, 981–1004. [Google Scholar] [CrossRef]
- Molinari, J.; Zhang, J.A.; Rogers, R.F.; Vollaro, D. Repeated Eyewall Replacement Cycles in Hurricane Frances (2004). Mon. Weather. Rev. 2019, 147, 2009–2022. [Google Scholar] [CrossRef] [Green Version]
- Didlake, A.C.; Heymsfield, G.M.; Reasor, P.D.; Guimond, S.R. Concentric Eyewall Asymmetries in Hurricane Gonzalo (2014) Observed by Airborne Radar. Mon. Weather. Rev. 2017, 145, 729–749. [Google Scholar] [CrossRef]
- Cione, J.J.; Bryan, G.H.; Dobosy, R.; Zhang, J.A.; de Boer, G.; Aksoy, A.; Wadler, J.B.; Kalina, E.A.; Dahl, B.A.; Ryan, K.; et al. Eye of the Storm: Observing Hurricanes with a Small Unmanned Aircraft System. Bull. Am. Meteorol. Soc. 2020, 101, E186–E205. [Google Scholar] [CrossRef]
- Domingues, R.; Kuwano-Yoshida, A.; Chardon-Maldonado, P.; Todd, R.E.; Halliwell, G.; Kim, H.-S.; Lin, I.-I.; Sato, K.; Narazaki, T.; Shay, L.K.; et al. Ocean Observations in Support of Studies and Forecasts of Tropical and Extratropical Cyclones. Front. Mar. Sci. 2019, 6, 23. [Google Scholar] [CrossRef] [Green Version]
- Meinig, C.; Burger, E.F.; Cohen, N.; Cokelet, E.D.; Cronin, M.; Cross, J.N.; De Halleux, S.; Jenkins, R.; Jessup, A.T.; Mordy, C.W.; et al. Public–Private Partnerships to Advance Regional Ocean-Observing Capabilities: A Saildrone and NOAA-PMEL Case Study and Future Considerations to Expand to Global Scale Observing. Front. Mar. Sci. 2019, 6. [Google Scholar] [CrossRef] [Green Version]
- Zhang, J.A.; Cione, J.J.; Kalina, E.A.; Uhlhorn, E.W.; Hock, T.; Smith, J.A. Observations of Infrared Sea Surface Temperature and Air–Sea Interaction in Hurricane Edouard (2014) Using GPS Dropsondes. J. Atmos. Ocean. Technol. 2017, 34, 1333–1349. [Google Scholar] [CrossRef]
- Bucci, L.R.; O’Handley, C.; Emmitt, G.D.; Zhang, J.A.; Ryan, K.; Atlas, R. Validation of an Airborne Doppler Wind Lidar in Tropical Cyclones. Sensors 2018, 18, 4288. [Google Scholar] [CrossRef] [PubMed] [Green Version]
- Zhang, J.A.; Atlas, R.; Emmitt, G.D.; Bucci, L.; Ryan, K. Airborne Doppler Wind Lidar Observations of the Tropical Cyclone Boundary Layer. Remote Sens. 2018, 10, 825. [Google Scholar] [CrossRef] [Green Version]
- Cecil, D.J.; Biswas, S.K. Hurricane Imaging Radiometer (HIRAD) Wind Speed Retrievals and Validation Using Dropsondes. J. Atmos. Ocean. Technol. 2017, 34, 1837–1851. [Google Scholar] [CrossRef]
- Uhlhorn, E.W.; Black, P.G. Verification of Remotely Sensed Sea Surface Winds in Hurricanes. J. Atmos. Ocean. Technol. 2003, 20, 99–116. [Google Scholar] [CrossRef]
- Black, P.; Harrison, L.; Beaubien, M.; Bluth, R.; Woods, R.; Penny, A.; Smith, R.W.; Doyle, J.D. High-Definition Sounding System (HDSS) for Atmospheric Profiling. J. Atmos. Ocean. Technol. 2017, 34, 777–796. [Google Scholar] [CrossRef]
- Zawislak, J.A.; Rogers, R.F.; Bucci, L.; Dunion, J.P.; Reasor, P.D.; Aberson, S.D.; Alaka, G.; Alvey, G.; Aksoy, A.; Cione, J. Accomplishments of NOAA’s Airborne Hurricane Field Program and a Broader Future Approach to Forecast Improvement. Bull. Amer. Meteor. Soc. 2021. In review. [Google Scholar]
Figure 1.
Intensity forecast errors (kt) from consensus of two statistical/dynamical models (Decav-SHIPS, Logistical Growth Equation Model) and two regional deterministic models (intelpolated HWRE, COAMPS-TC) for TCs between 2015 and 2017. Black line shows intensity forecast errors for all TCs not undergoing RI; red line shows errors for all TC’s undergoing RI.
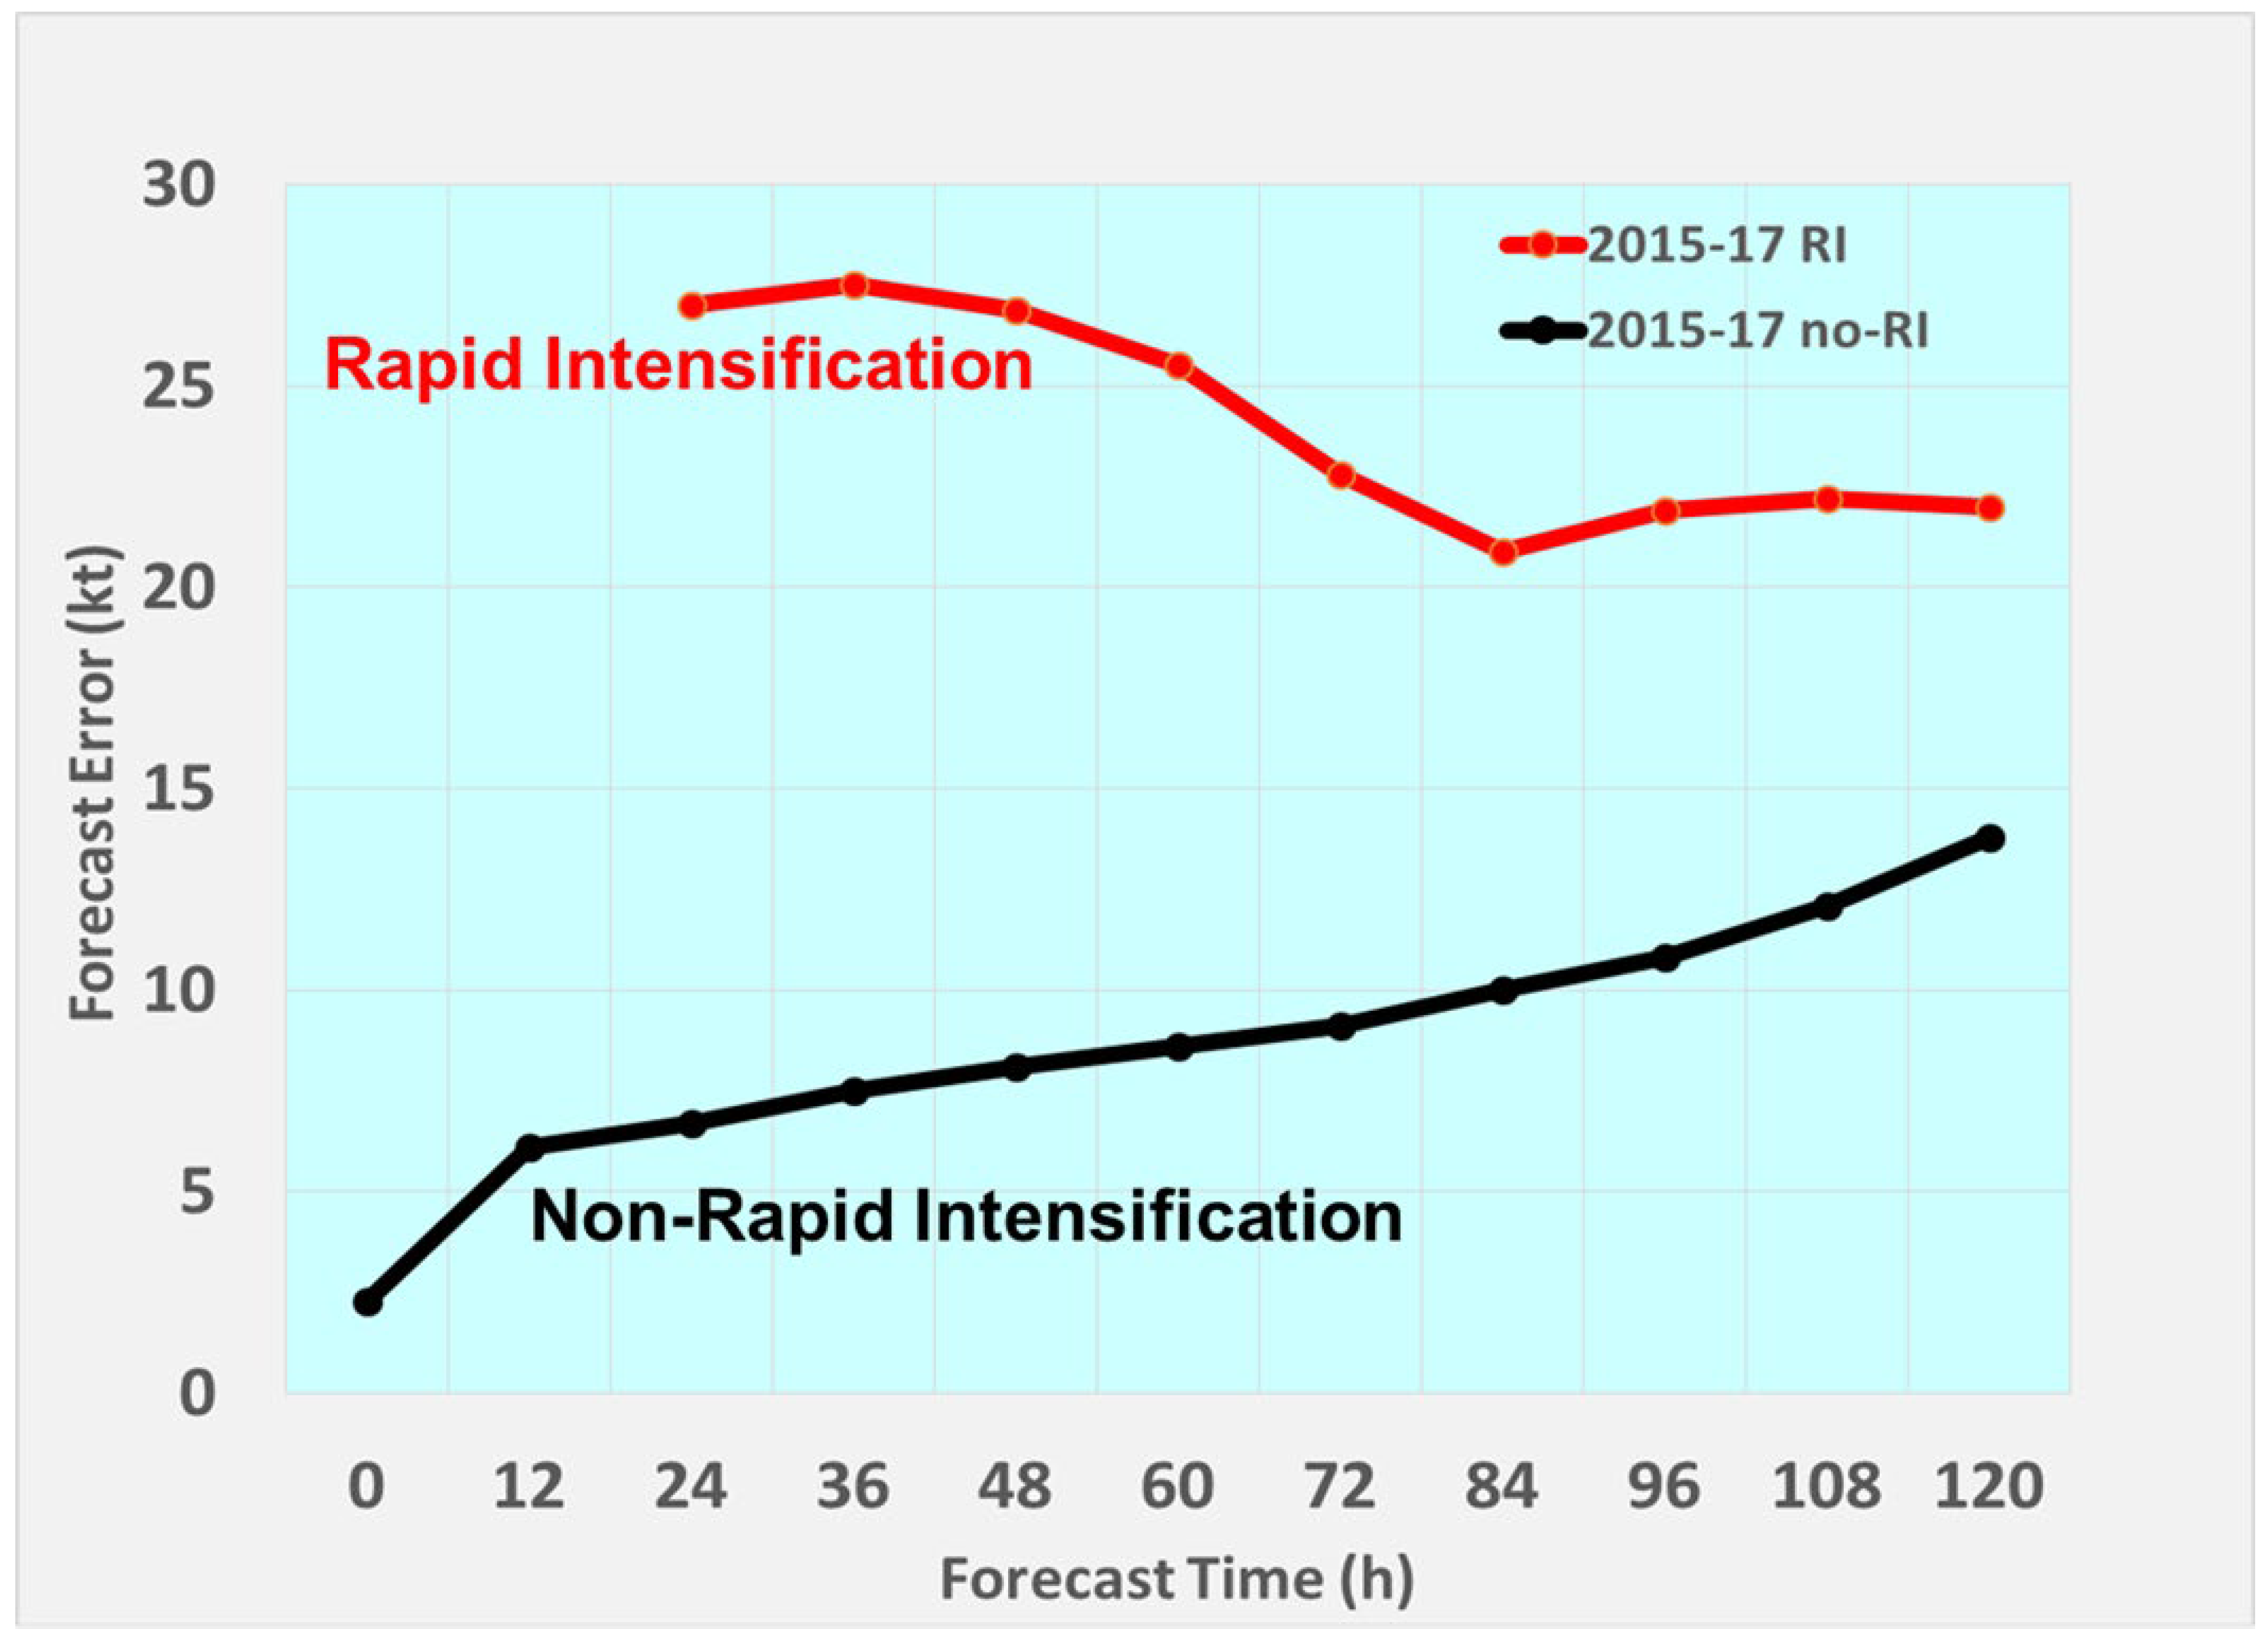
Figure 2.
Composite azimuthally-averaged fields of three-dimensional analyses from cases in Rogers et al. (2012). (a) tangential wind (m s−1); (b) Reflectivity (dBZ); (c) Radial wind (m s−1). (d) Relative vorticity (×10−4 s−1); (e) Vertical velocity (m s−1); (f) Horizontal divergence (×10−4 s−1). Data from a minimum of 20 analyses are required for plotting. All composites plotted as a function of normalized radius r* and height above ground level. The dashed line denotes the axis of peak axisymmetric tangential wind from 0.5- to 10-km altitude calculated from the composite in (a). Adapted from [21].
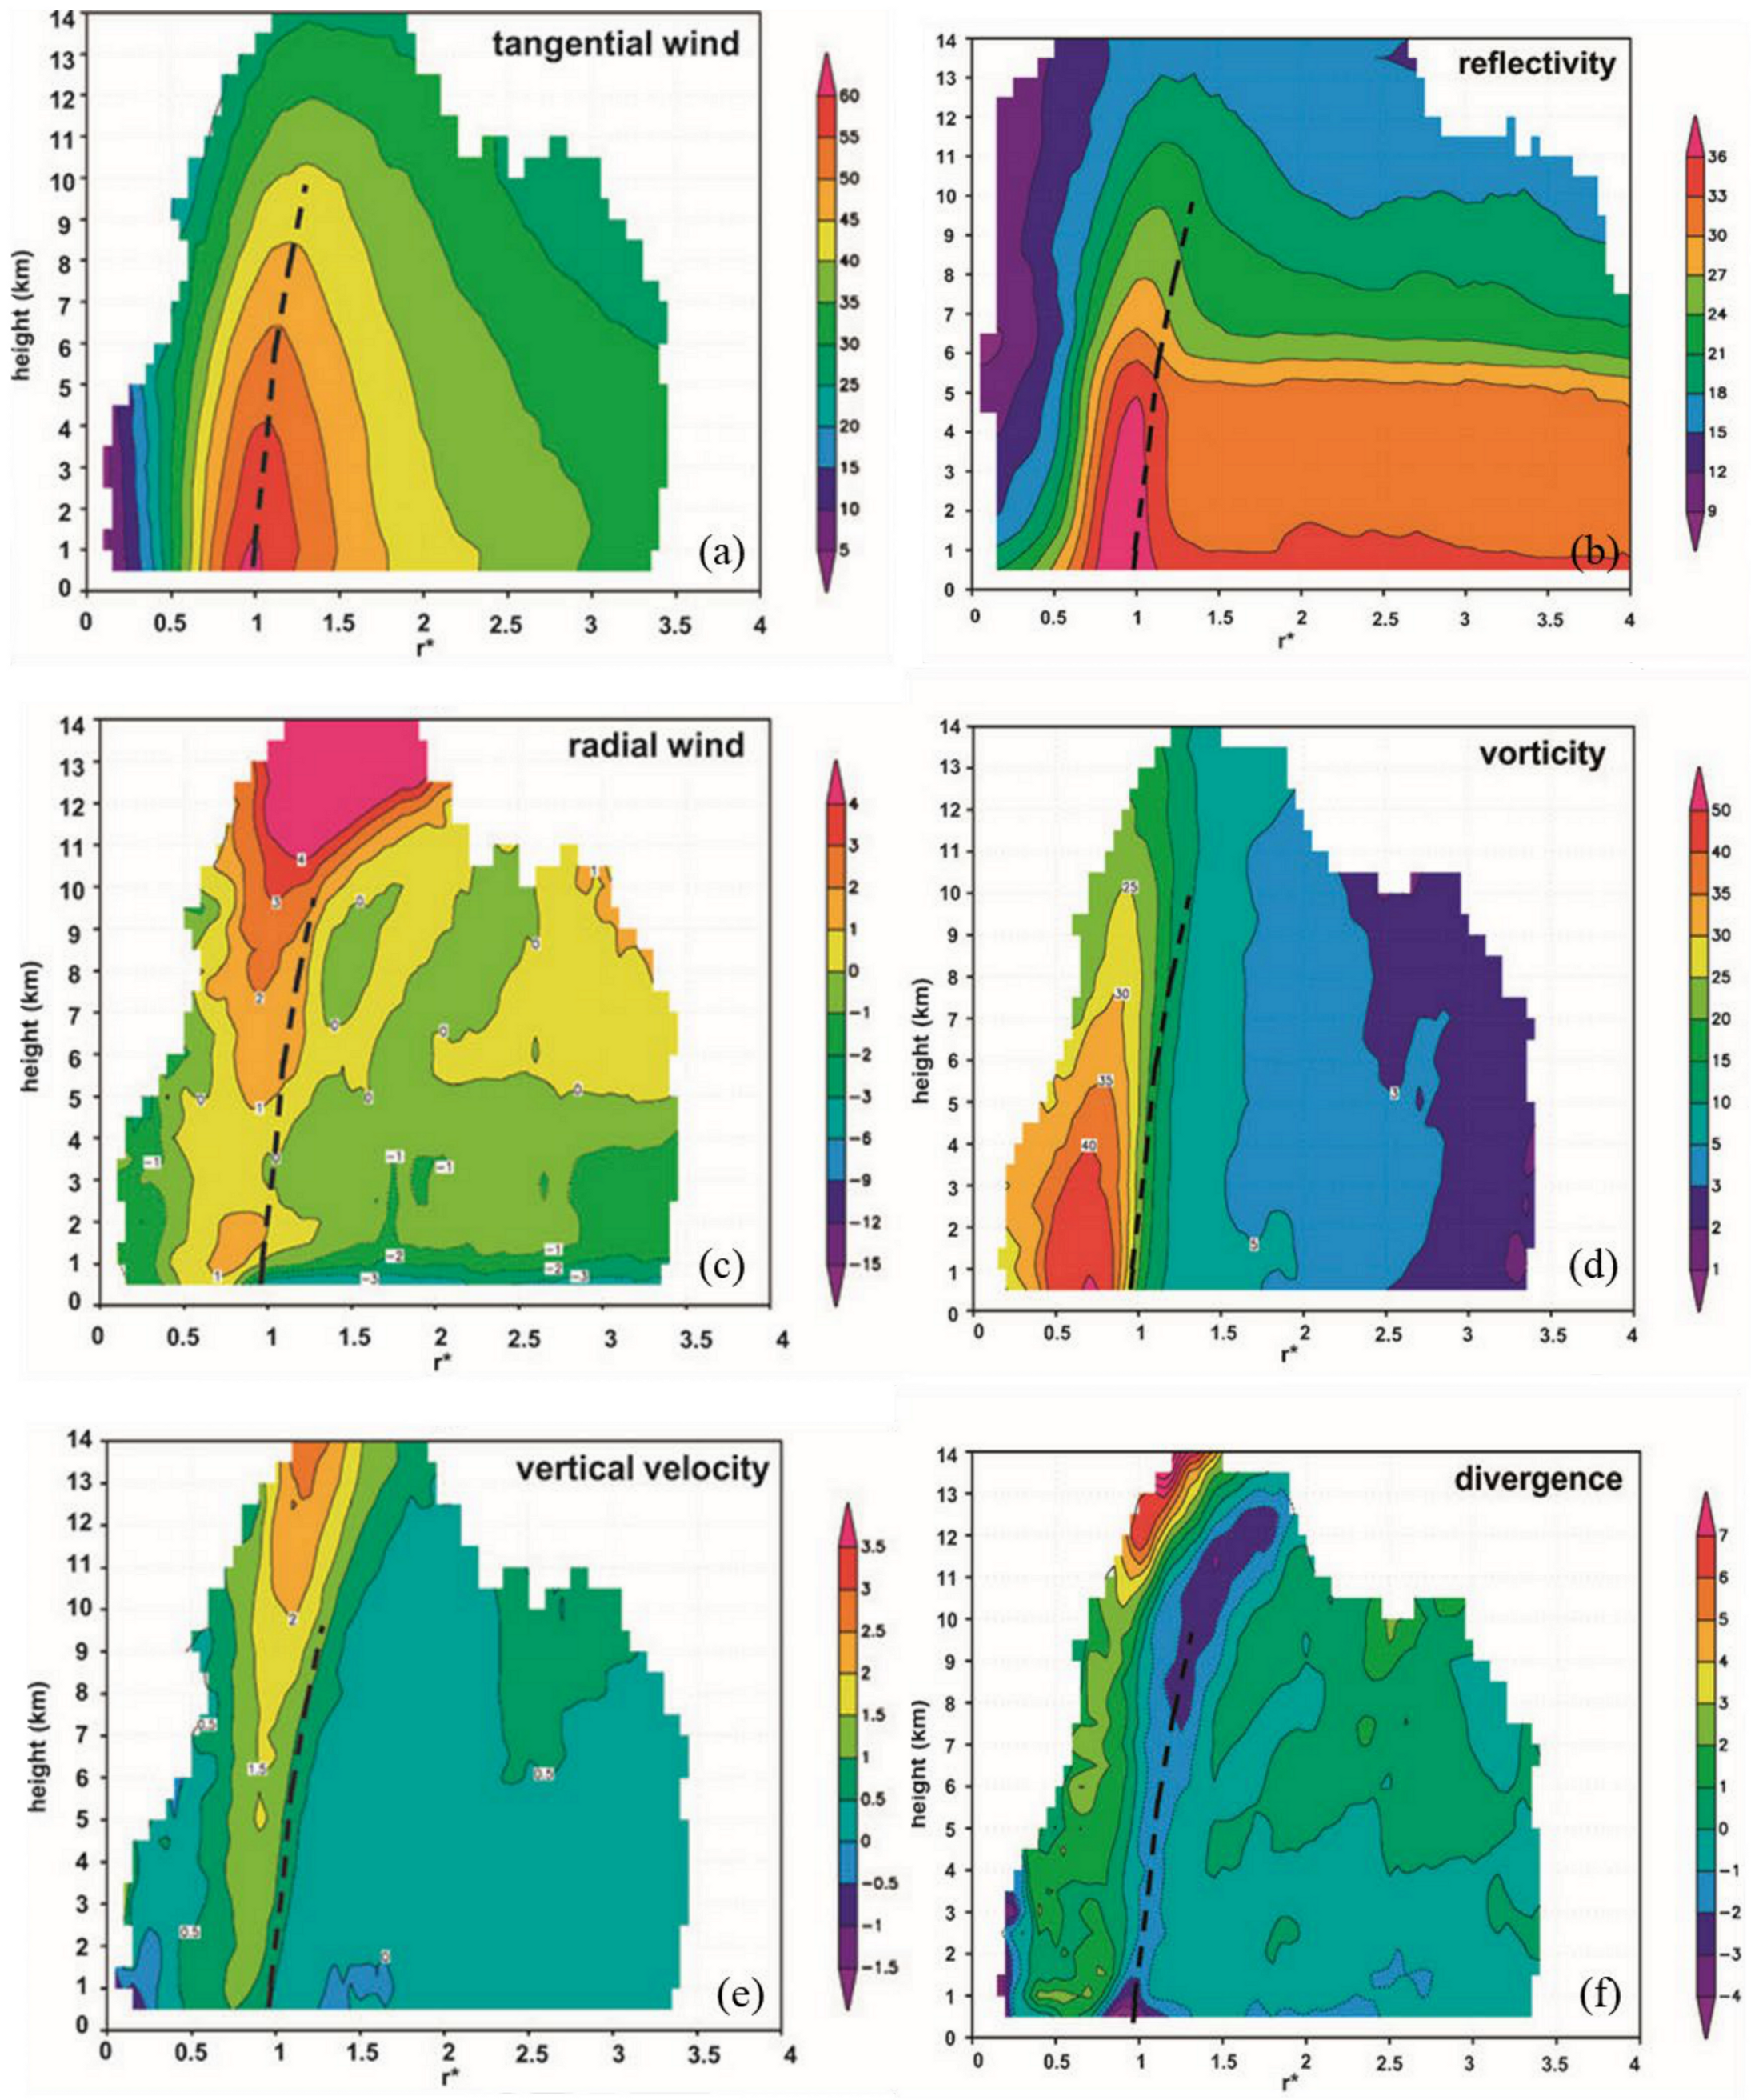
Figure 3.
Quadrant-average cross sections of shear-relative composite reflectivity (dBZ, shaded), vertical velocity (m s−1, black contours), and radial velocity (m s−1, gray contours) for cases with peak winds >31 m s−1 and 850–200 hPa vertical shear >7 m s−1. The quadrants are arranged such that the shear vector points to the right of the page. Regions of negative vertical motion are highlighted by the 0 and −0.25 m s−1 dashed black contours. Contours of positive vertical motion (solid black) are drawn at 0.25, 0.5, 1, 1.5, 2, and 2.5 m s−1. The contour interval for radial inflow (dashed gray) and outflow (solid gray) is 1 m s−1 (zero contour omitted). The radial coordinate r* represents the radius normalized bythe RMWat 2 km altitude. Adapted from [30].

Figure 4.
(a) Three-dimensional schematic depicting the vertical motion distribution in each quadrant. The environmental shear vector is denoted by an arrow pointing toward the top of the figure, and quadrants are labeled according to their direction relative to the shear vector (DR, DL, UL, and UR). Concentric circles below the clouds show the locations of the eyewall normalized radius values between 0.75 and 1.25), which connect to gray dashed boxes encompassing the eyewall up to 10-km altitude. Vertical arrows denote the vertical motion distribution, where size is proportional to magnitude. (b) As in (a), except illustrating the mean circulation that occurs when intense updrafts are present. Arrow width corresponds to composite velocity magnitude, as noted in the legend at the bottom. Dashed arrows refer to features that were present in the composite analysis but were shown to be not significant. (c) As in (b), except illustrating the mean circulation that occurs when intense downdrafts are present. The question mark denotes the structure existing UR is weak, disorganized, and not robust. Adapted from [31].
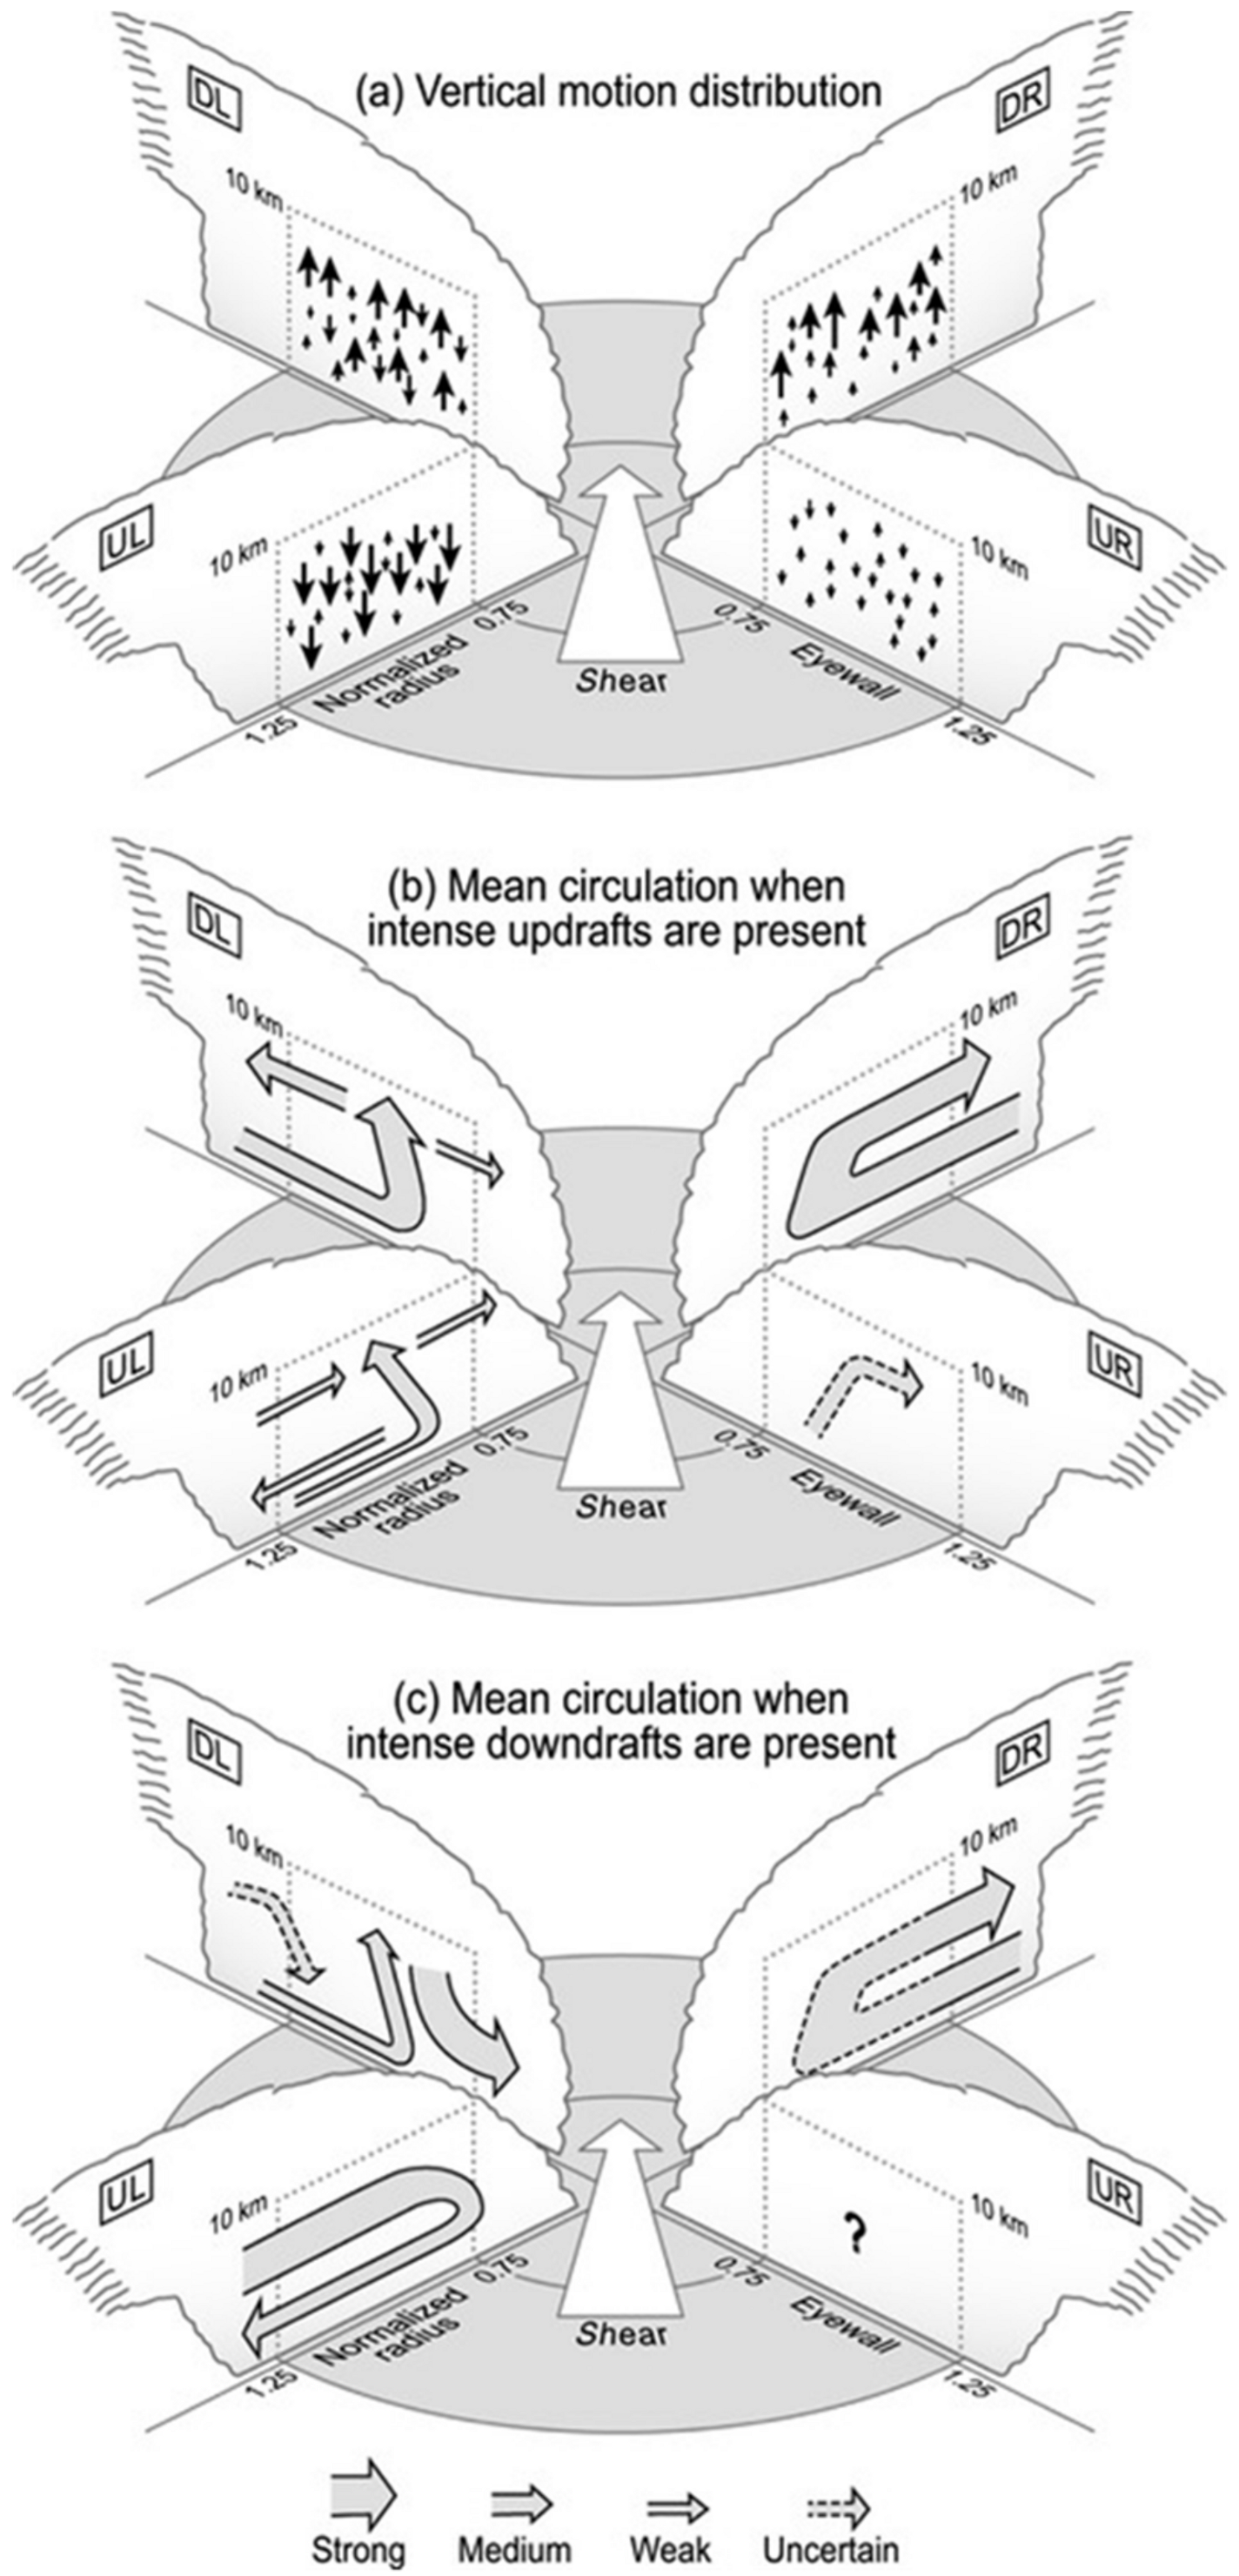
Figure 5.
Frequency of convective burst points as a function of normalized radial location (bar chart, %) overlain on normalized radius-height plot of composite-mean axisymmetric vertical vorticity (color shaded, ×10−4 s−1) for the (a) intensifying (IN) and (b) steady-state (SS) TC composites. Adapted from Rogers et al. (2013).

Figure 6.
The 24-h intensity change (m s−1) of North Atlantic TCs with an inner-core lightning burst (ICLB) relative to the RMW (r/RMW; logarithmic scale) with aircraft reconnaissance within 1 h of the observed ICLB. The error bars indicate one standard deviation of 10,000 random errors (+0.2°) added to the NHC best-track position. Adapted from [47].

Figure 7.
Three-dimensional schematics summarizing the hypothesized hindrances to precipitation symmetry intropical cyclones. The top schematic depicts the more asymmetric case (Cristobal), while the bottomschematic depicts the more symmetric case (Bertha). Adapted from [60].
Figure 7.
Three-dimensional schematics summarizing the hypothesized hindrances to precipitation symmetry intropical cyclones. The top schematic depicts the more asymmetric case (Cristobal), while the bottomschematic depicts the more symmetric case (Bertha). Adapted from [60].

Figure 8.
(a) Locations of all points in Doppler analysis in a radial coordinate system normalized by the 2-km RMW (x*, y*) where peak upward motion in the 8–16-km layer is greater than 3 m s−1 (green ×s) and 5 m s−1 (black dots) for all center passes during the 14 Sep (intensifying) mission. (b) As in (a), but forthe 16 Sep (steady-state) mission. Arrow denotes shear direction; shear-relative quadrants are labeled. Adapted from Rogers et al. (2016) [67].

Figure 9.
Average and 95% confidence intervals of the M (solid) and 20-dBZ (dashed) slopes for (a) intensifying and (b) weakening/steady cases. Higher (lower) values of slope denote a more sloped (upright) configuration. Inset in each panel shows schematic illustrating relationship between momentum and reflectivitym surfaces for each intensity change category. Adapted from Hazelton et al. [26].
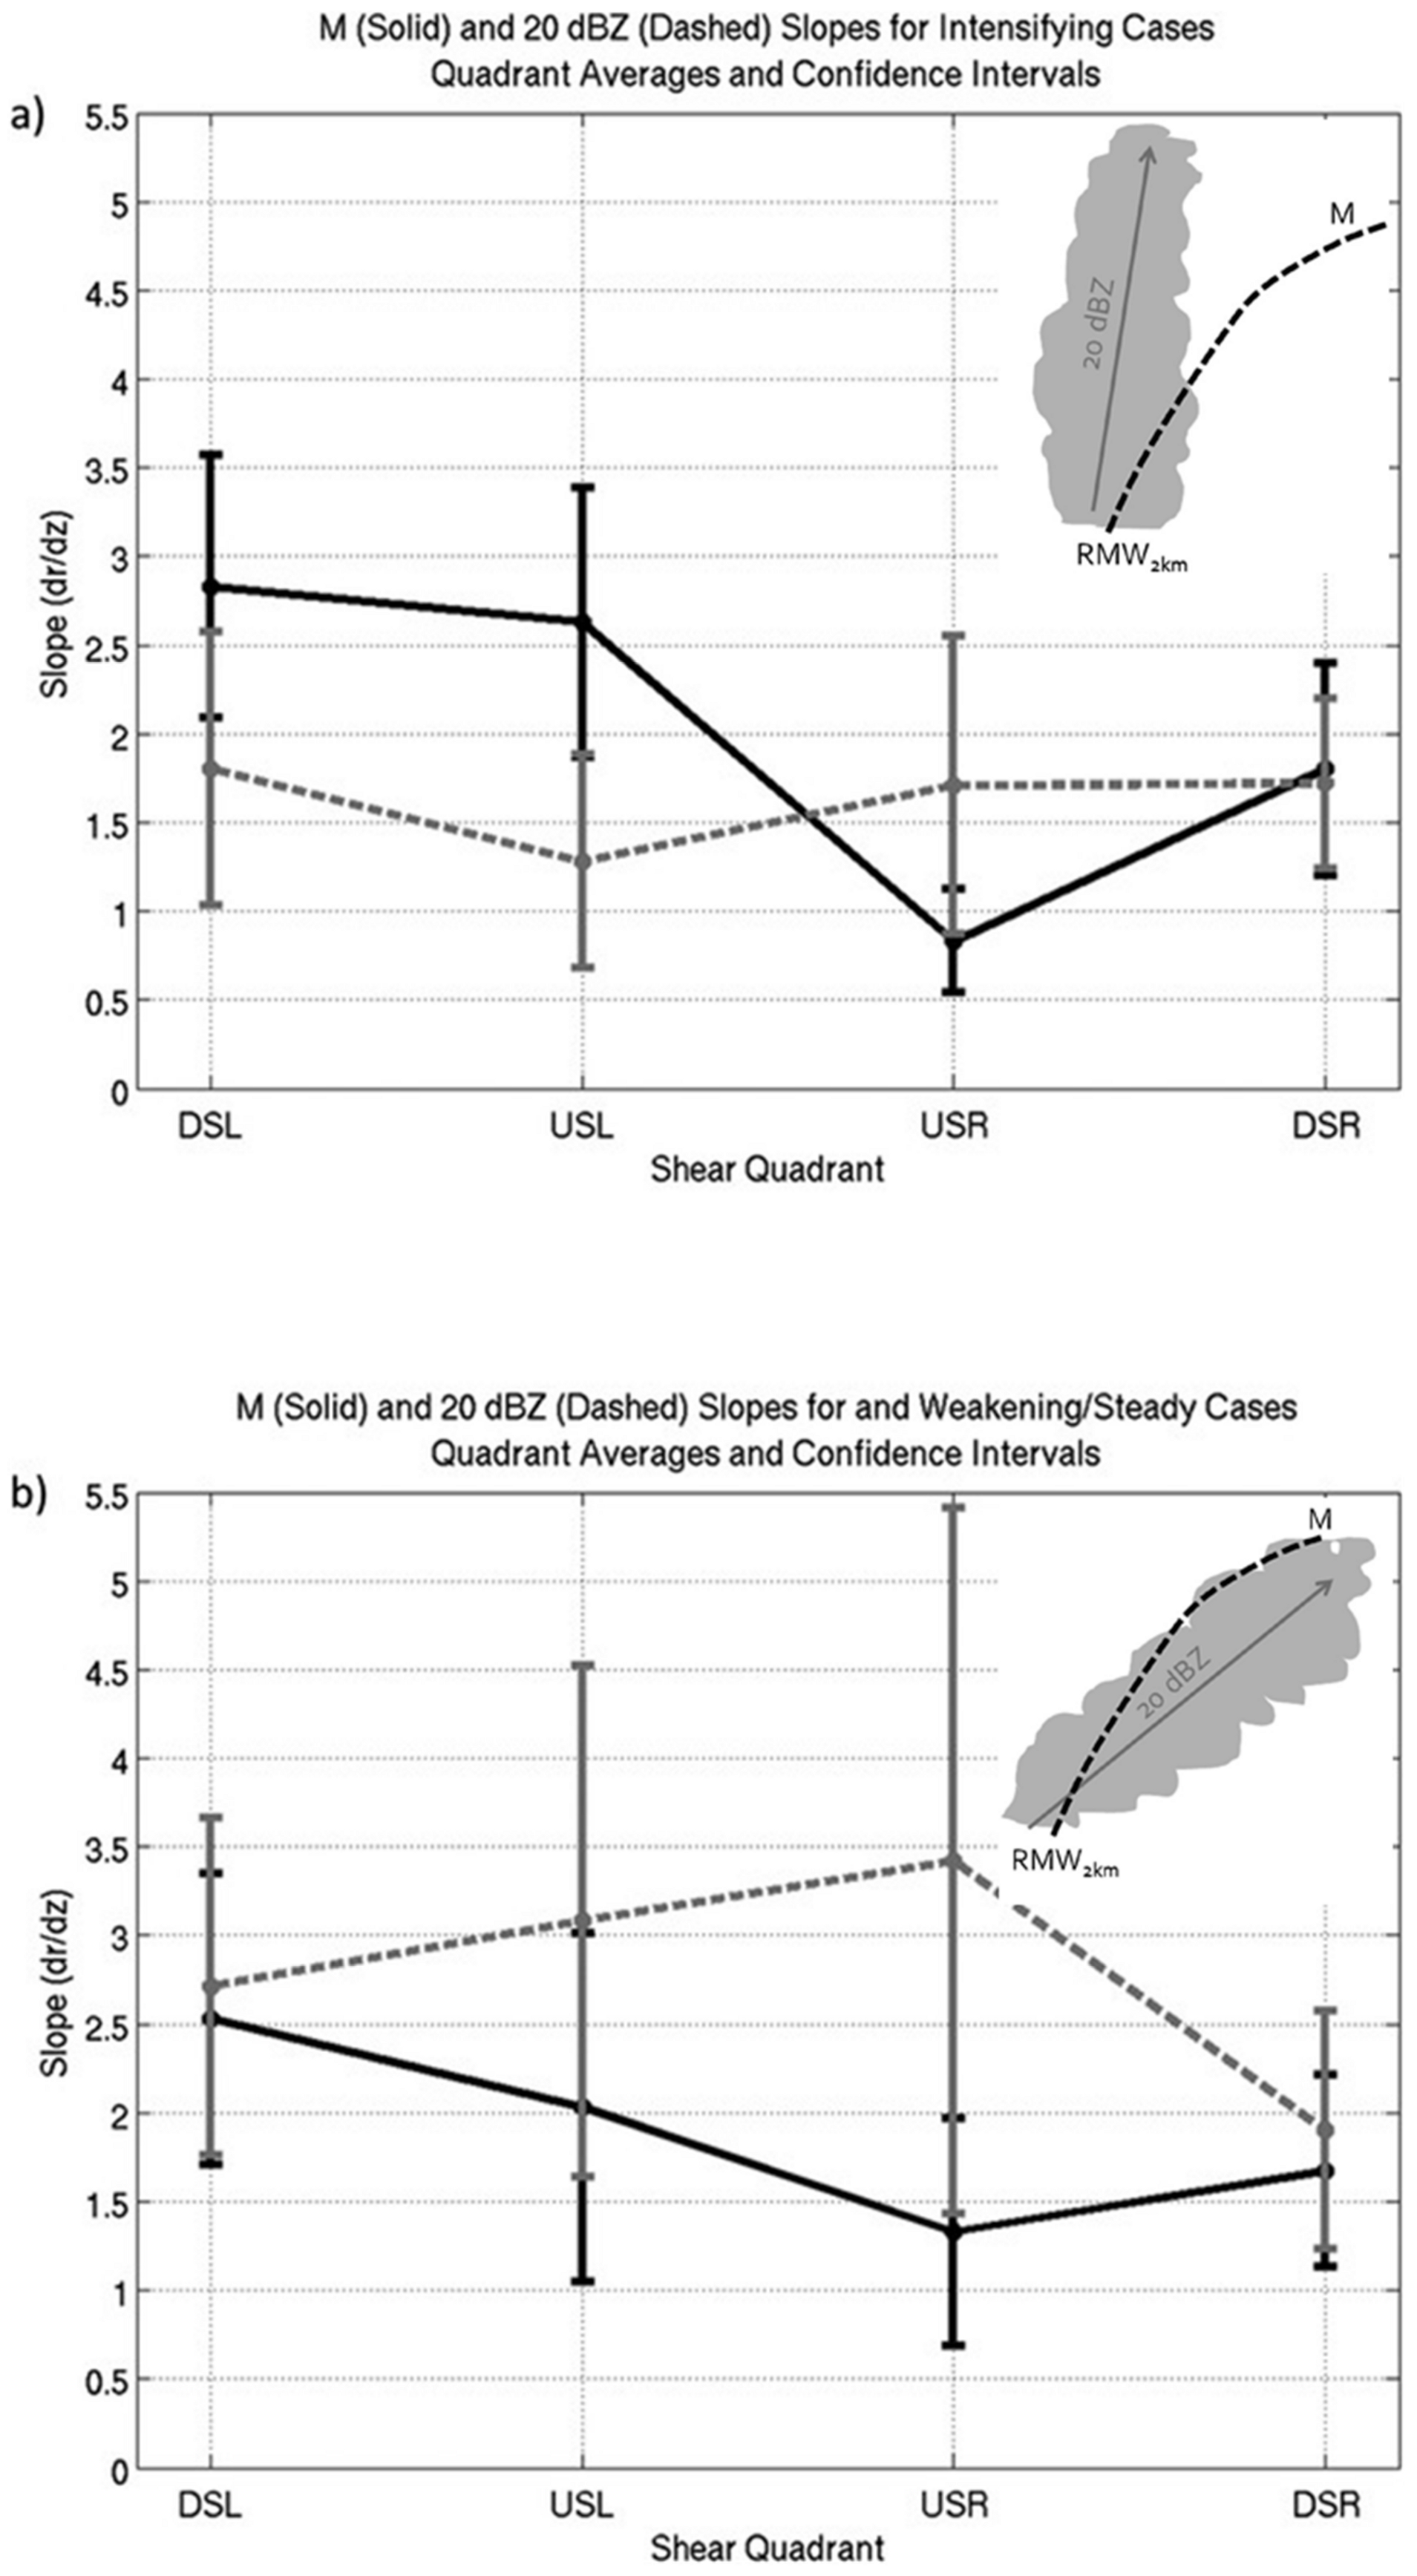
Figure 10.
(a) Boxplot comparison of the maximum updraft magnitude between the shear-relative quadrants and TC intensity change—intensifying (IN) and steady-state (SS); (b) as in (a), but for the height of the maximumupdraft; (c) as in (a), but for the maximum height of the 15-dBZ echo top. In the boxplots, the solid line in the box denotes the median value, while the upper and lower edges of the box represent 75th and 25th quartiles, respectively. The difference between the 75th and 25th percentiles represents the interquartile range (IOR). Whiskers extending above and below the box represent either 1.5 × IOR above the 75th and below the 25th percentiles respectively, or to the maximum/minimum values. Beyond the whiskers, values are statisticaloutliers and are represented as plus signs. Adapted from Wadler et al. (2018) [68].

Figure 11.
Conceptual diagram highlighting the measurements and analysis from the HIWRAP, HAMSR, and WP-3D TDR during the Hurricane Karl (2010) sampling. The arrows at lower levels represent the mesoscale flow and the arrows in the clouds represent the convective-scale flow. Red arrows indicate anomalously warm, buoyant air with blue arrows the opposite. Adapted from [72].

Figure 12.
Composite analysis of (a) the relative tangential wind (m s−1: contour interval 2 m s−1), (b) radial wind (m s−1; contour interval 2 m s−1), and (c) virtual potential temperature (K; contour interval 0.5 K) as a function of altitude and the normalized radius to the storm center. The thick black lines in (a) are the 40 and 50 m s−1 contours and the black dashed line depicts the height of the maximum wind speed varying with radius. The thick black line in (b) depicts the inflow laver height defined as the height where the radial wind speed is 10% of the peak inflow. In (b), negative values are contoured in dashed lines. The white dashed line in (b) represents the zero contour, and the black × represents the location of the maximum tangential wind speed. The thick black lines in (c) are the 305- and 310-K contours. Adapted from Zhang et al. (2011) [78].
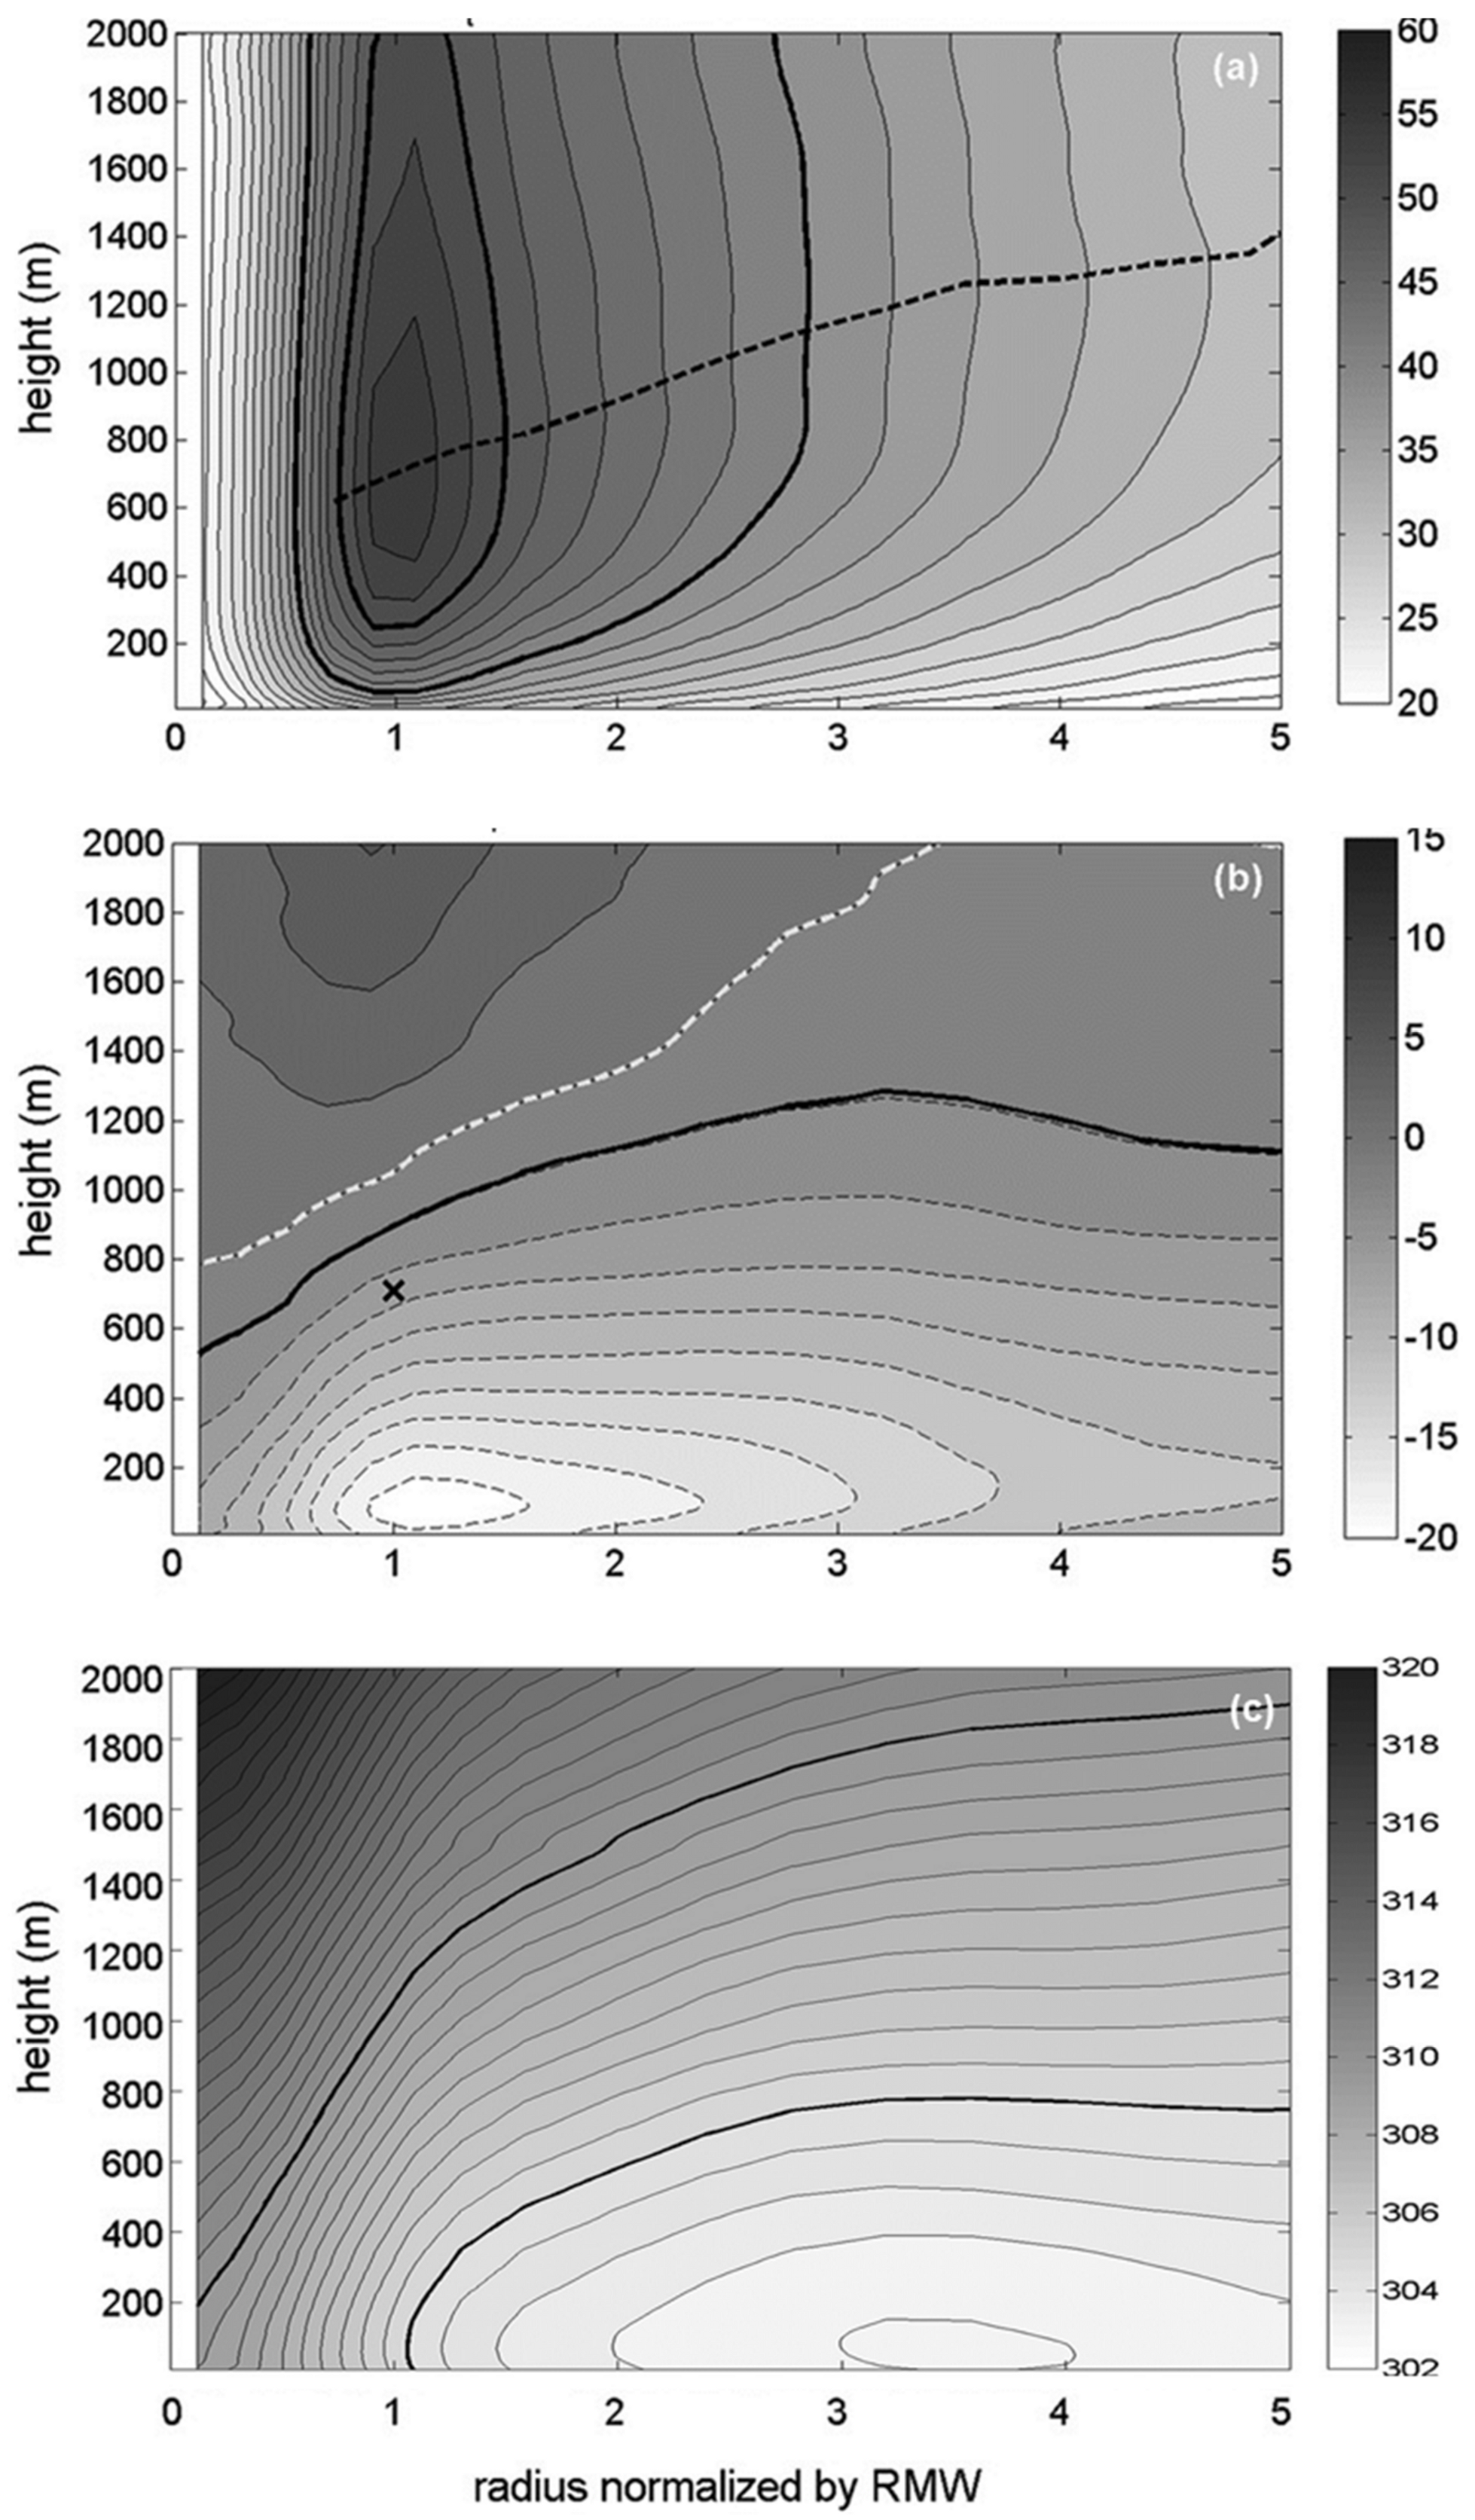
Figure 13.
(a) Plots of the wavenumber-1 component of equivalent potential temperature (shaded; K) at 50 m from dropsondes and contours of vertical velocity measured by TDR (contours, 0.2 m s−l contour interval) at 1.5 km ltitude. Gray contours represent updrafts and black contours represent downdrafts. Shear direction is shown by the black arrow. The thick dashed black line represents the radius of maximum wind speed. Adapted from [82].

Figure 14.
Distributions of surface (a) latent heat flux and (b) sensible heat flux in non-intensifying (NI; blue), slowly intensifying (SI; green), and rapidly intensifying (RI; red) cases in each shear-relative quadrant. Boxes encompass the 25th, 50th, and 75th percentiles, while whiskers extend to the 10th and 90th percentile values. Brackets denote the differences in the means of the distributions that were significant at the 95% confidence level as determined by a bootstrap test. Adapted from [84].

Figure 15.
Plots of (a) P-3 aircraft (N43) horizontal track varving with altitude in color and dropsonde locations (squares) released by a second P-3 aircraft (N42) flying above N43, (b) vertical profiles of wind speed from dropsondes with the mean wind profile (dashed line) and smoothed mean profile (black line), (c) vertical profile of the vertical wind shear with low-level aircraft altitudes (circles), and (d) vertical eddy diffusivity from a multitude of dropsonde and flight-level gmeasurement locations as a function of wind speed. Reproduced and adapted from [99,100].

Figure 16.
(a) Vertical cross section of potential temperature (°C; filled contours) and the cold-point tropopause height (green lines) along the high-altitude WB-57 transects over the center of Hurricane Patricia (2015) while it was rapidly intensifying on 22 Oct 2015. Dropsonde locations and compass directions indicated. Dashed vertica lines mark the storm center and hatching indicates regions of missing values, where linear interpolation is performed in the radial direction. (b) As in (a), but vertical cross sections of the potential temperature anomaly (°C) for same transect. (c) As in (a), but storm-relative radial flow (shaded, m s−1) for same transect. Adapted from [112].

Figure 17.
Meso-α-scale (600 km × 600 km) circulation tendencies with height at (a) 0000 and (b) 1200 UTC 13 Sep. Budget terms are mean stretching tendency (solid blue), eddy flux tendency (dash-dotted red), tilting tendency (long-dashed gray), friction tendency (short-dashed purple), and net tendency calculated by summation of thecomponent tendencies (thick solid black). Adapted from [124].

Figure 18.
(a) Plot of 20 dBZ echo top heights (shaded, km) and storm-relative winds (vectors, m s−1) at 2-km altitude forindividual center passes centered at 1742 UTC August 31 in Tropical Depression #9 (future Hermine); (b) As in (a), but for winds at 5-km altitude; (c) As in (a), but for 2034 UTC August 31; (d) As in (b), but for 2034UTC August 31; (e) As in (a), but for 2310 UTC August 31; (f) As in (b), but for 2310 UTC August 31. “L”and “M” denote locations of subjectively-determined circulation centers at 2- and 5-km altitudes, respectively. Lighter, smaller letters denote locations from previous center passes. Inset in lower right corner in (a,c,e) denotes SHIPS-derived 850–200 hPa shear. Adapted from [135].

Figure 19.
Azimuthally averaged tangential wind (m s−1; shaded) and vertical velocity (contours) obtained from (a) the 2358 UTC 3 Sep center pass. Positive vertical velocity values are shown in the solid contours every 0.5 m s−1, while negative vertical velocity values are shown in the dashed contours every 0.2 m s−1. The inset of the panel depicts the magnitude of the maximum azimuthally averaged tangential wind (VT3; m s−1) and RMW (km) at a height of 3 km. (b) As in (a), but for the 0904 UTC 4 Sep center pass. (c) As in (a), but for the 1027 UTC 4 Sep center pass. (d) As in (a), but for the 1142 UTC 4 Sep center pass. (e) As in (a), but for the 1313 UTC 4 Sep center pass. (f) As in (a), but for the 2140 UTC 4 Sep center pass. For each flight, only radii withat least 33% azimuthal coverage are shown. Adapted from [140].
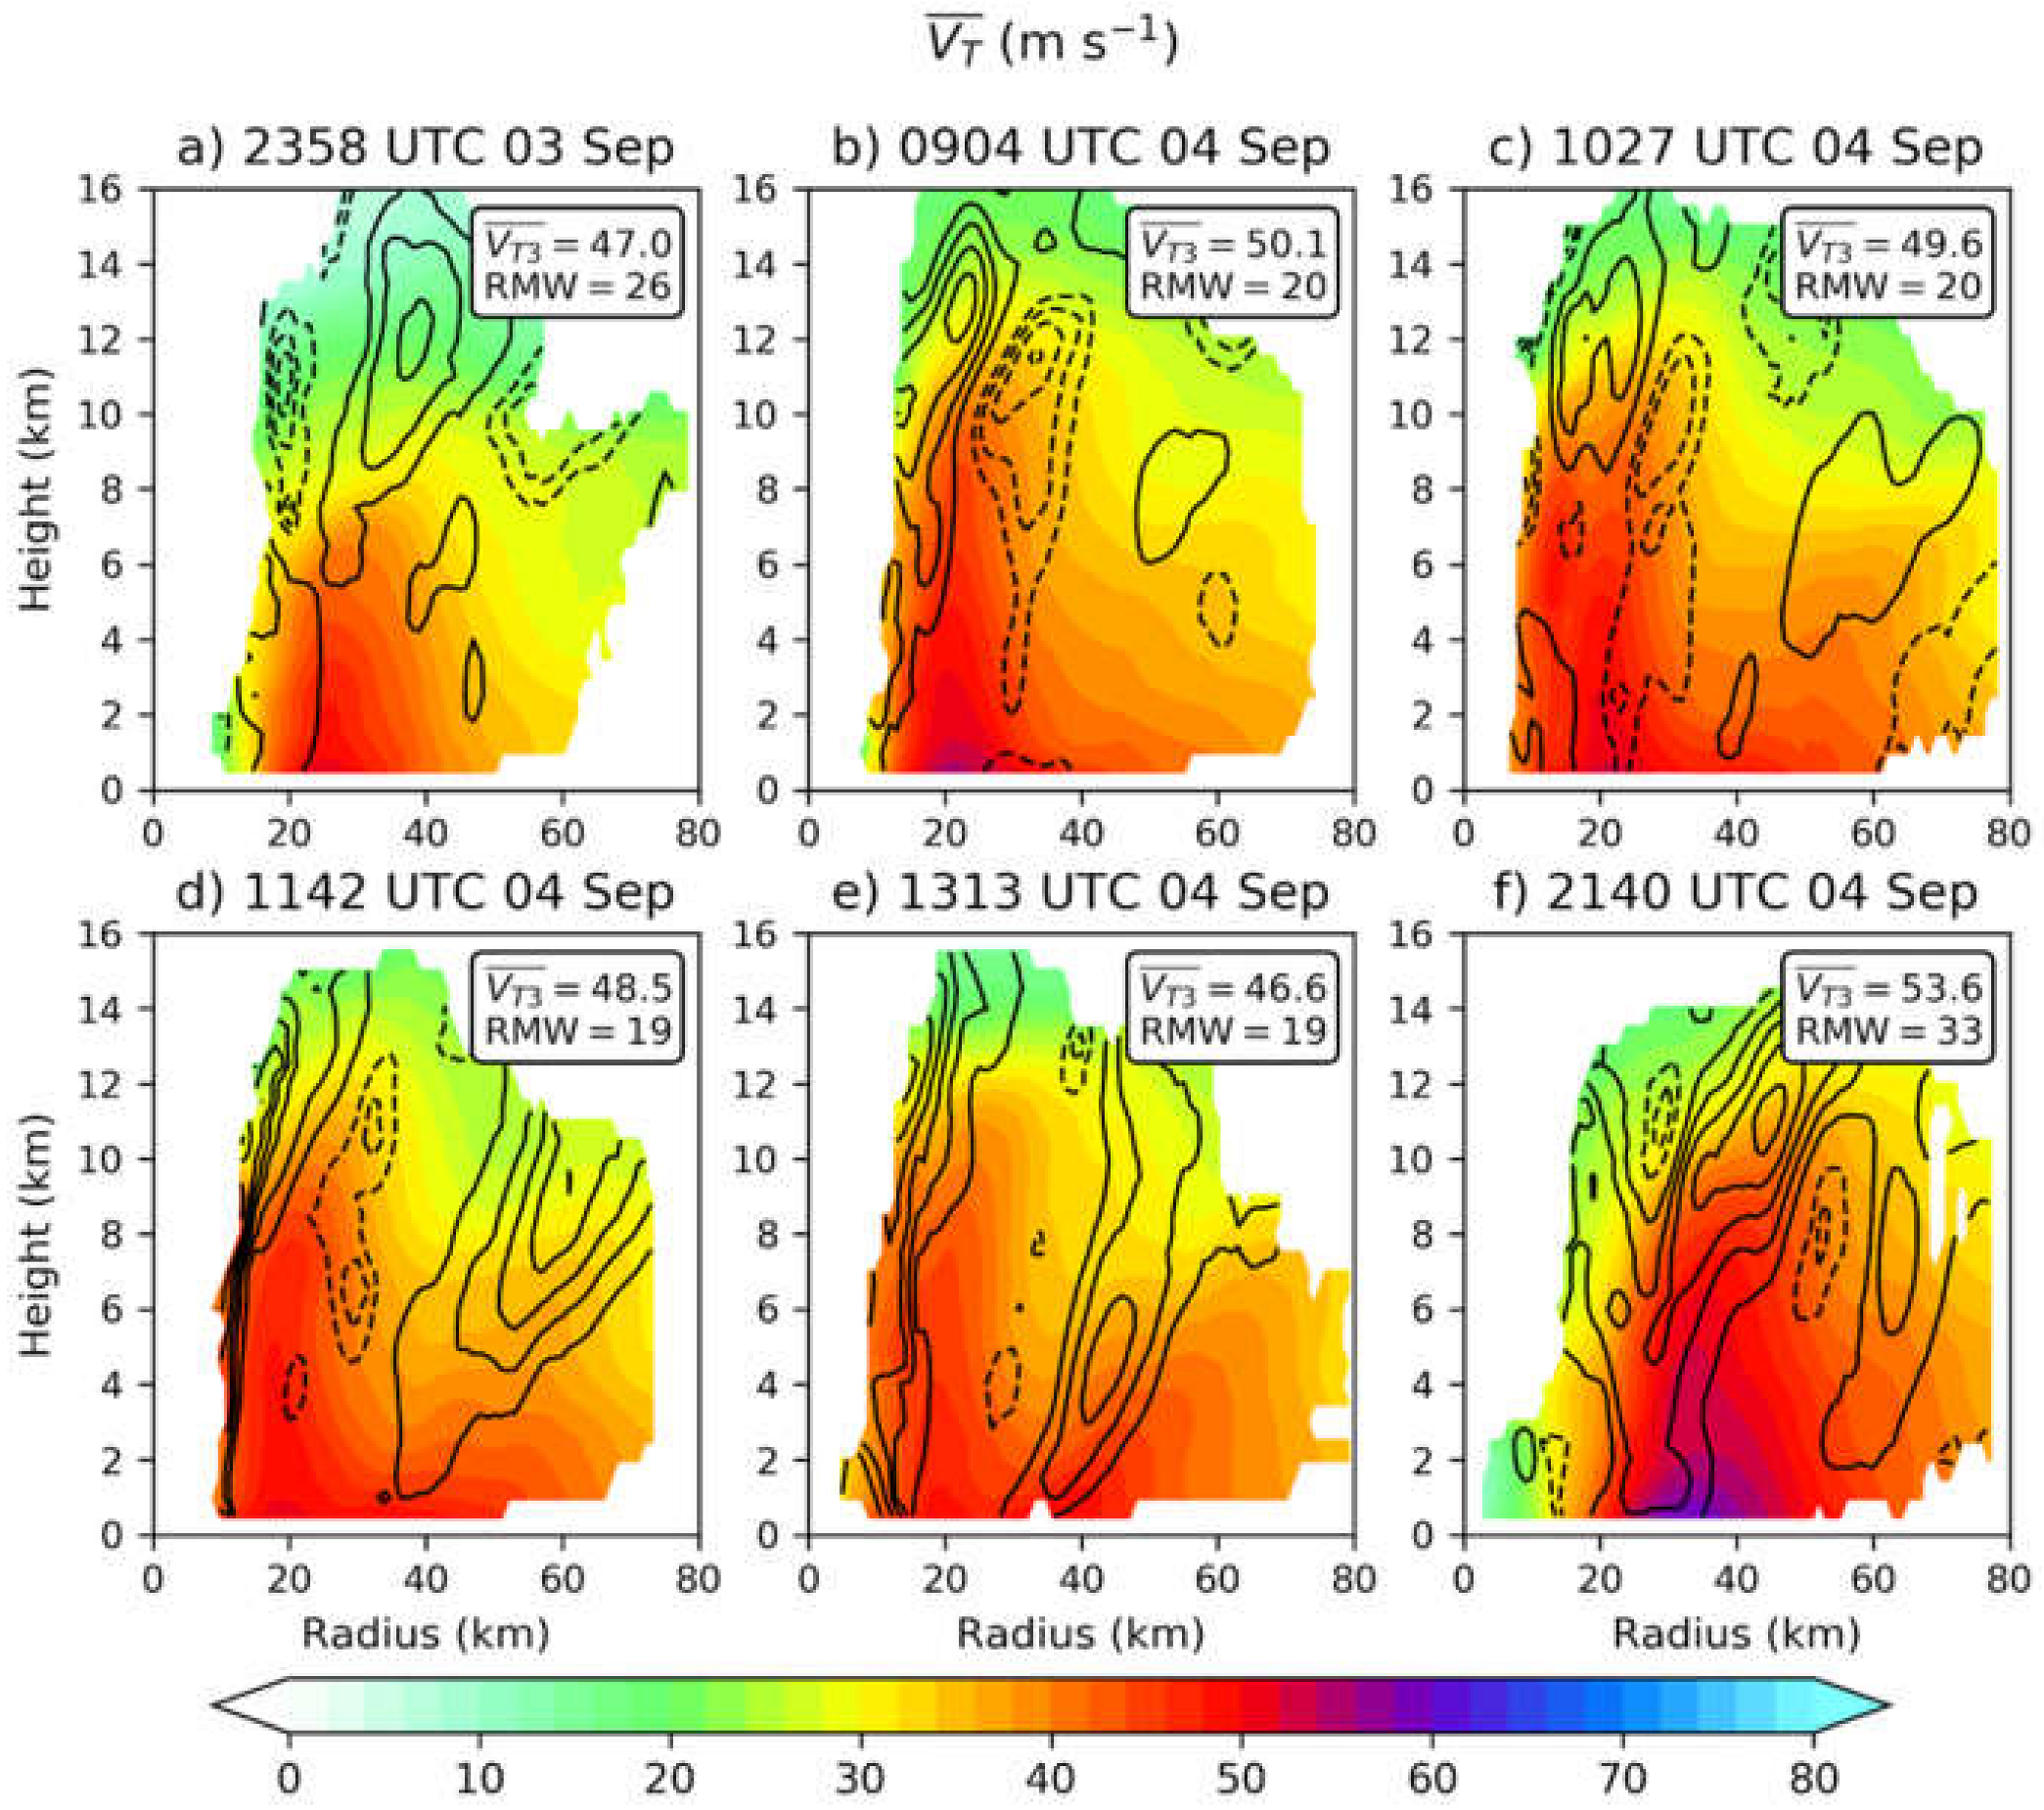
Figure 20.
Number of publications from 2006–2020 using NOAA IFEX aircraft data that include NOAA/AOML/HRD and affiliated scientists, stratified by primary TC physical process topic addressed. Adapted from [152].
Figure 20.
Number of publications from 2006–2020 using NOAA IFEX aircraft data that include NOAA/AOML/HRD and affiliated scientists, stratified by primary TC physical process topic addressed. Adapted from [152].
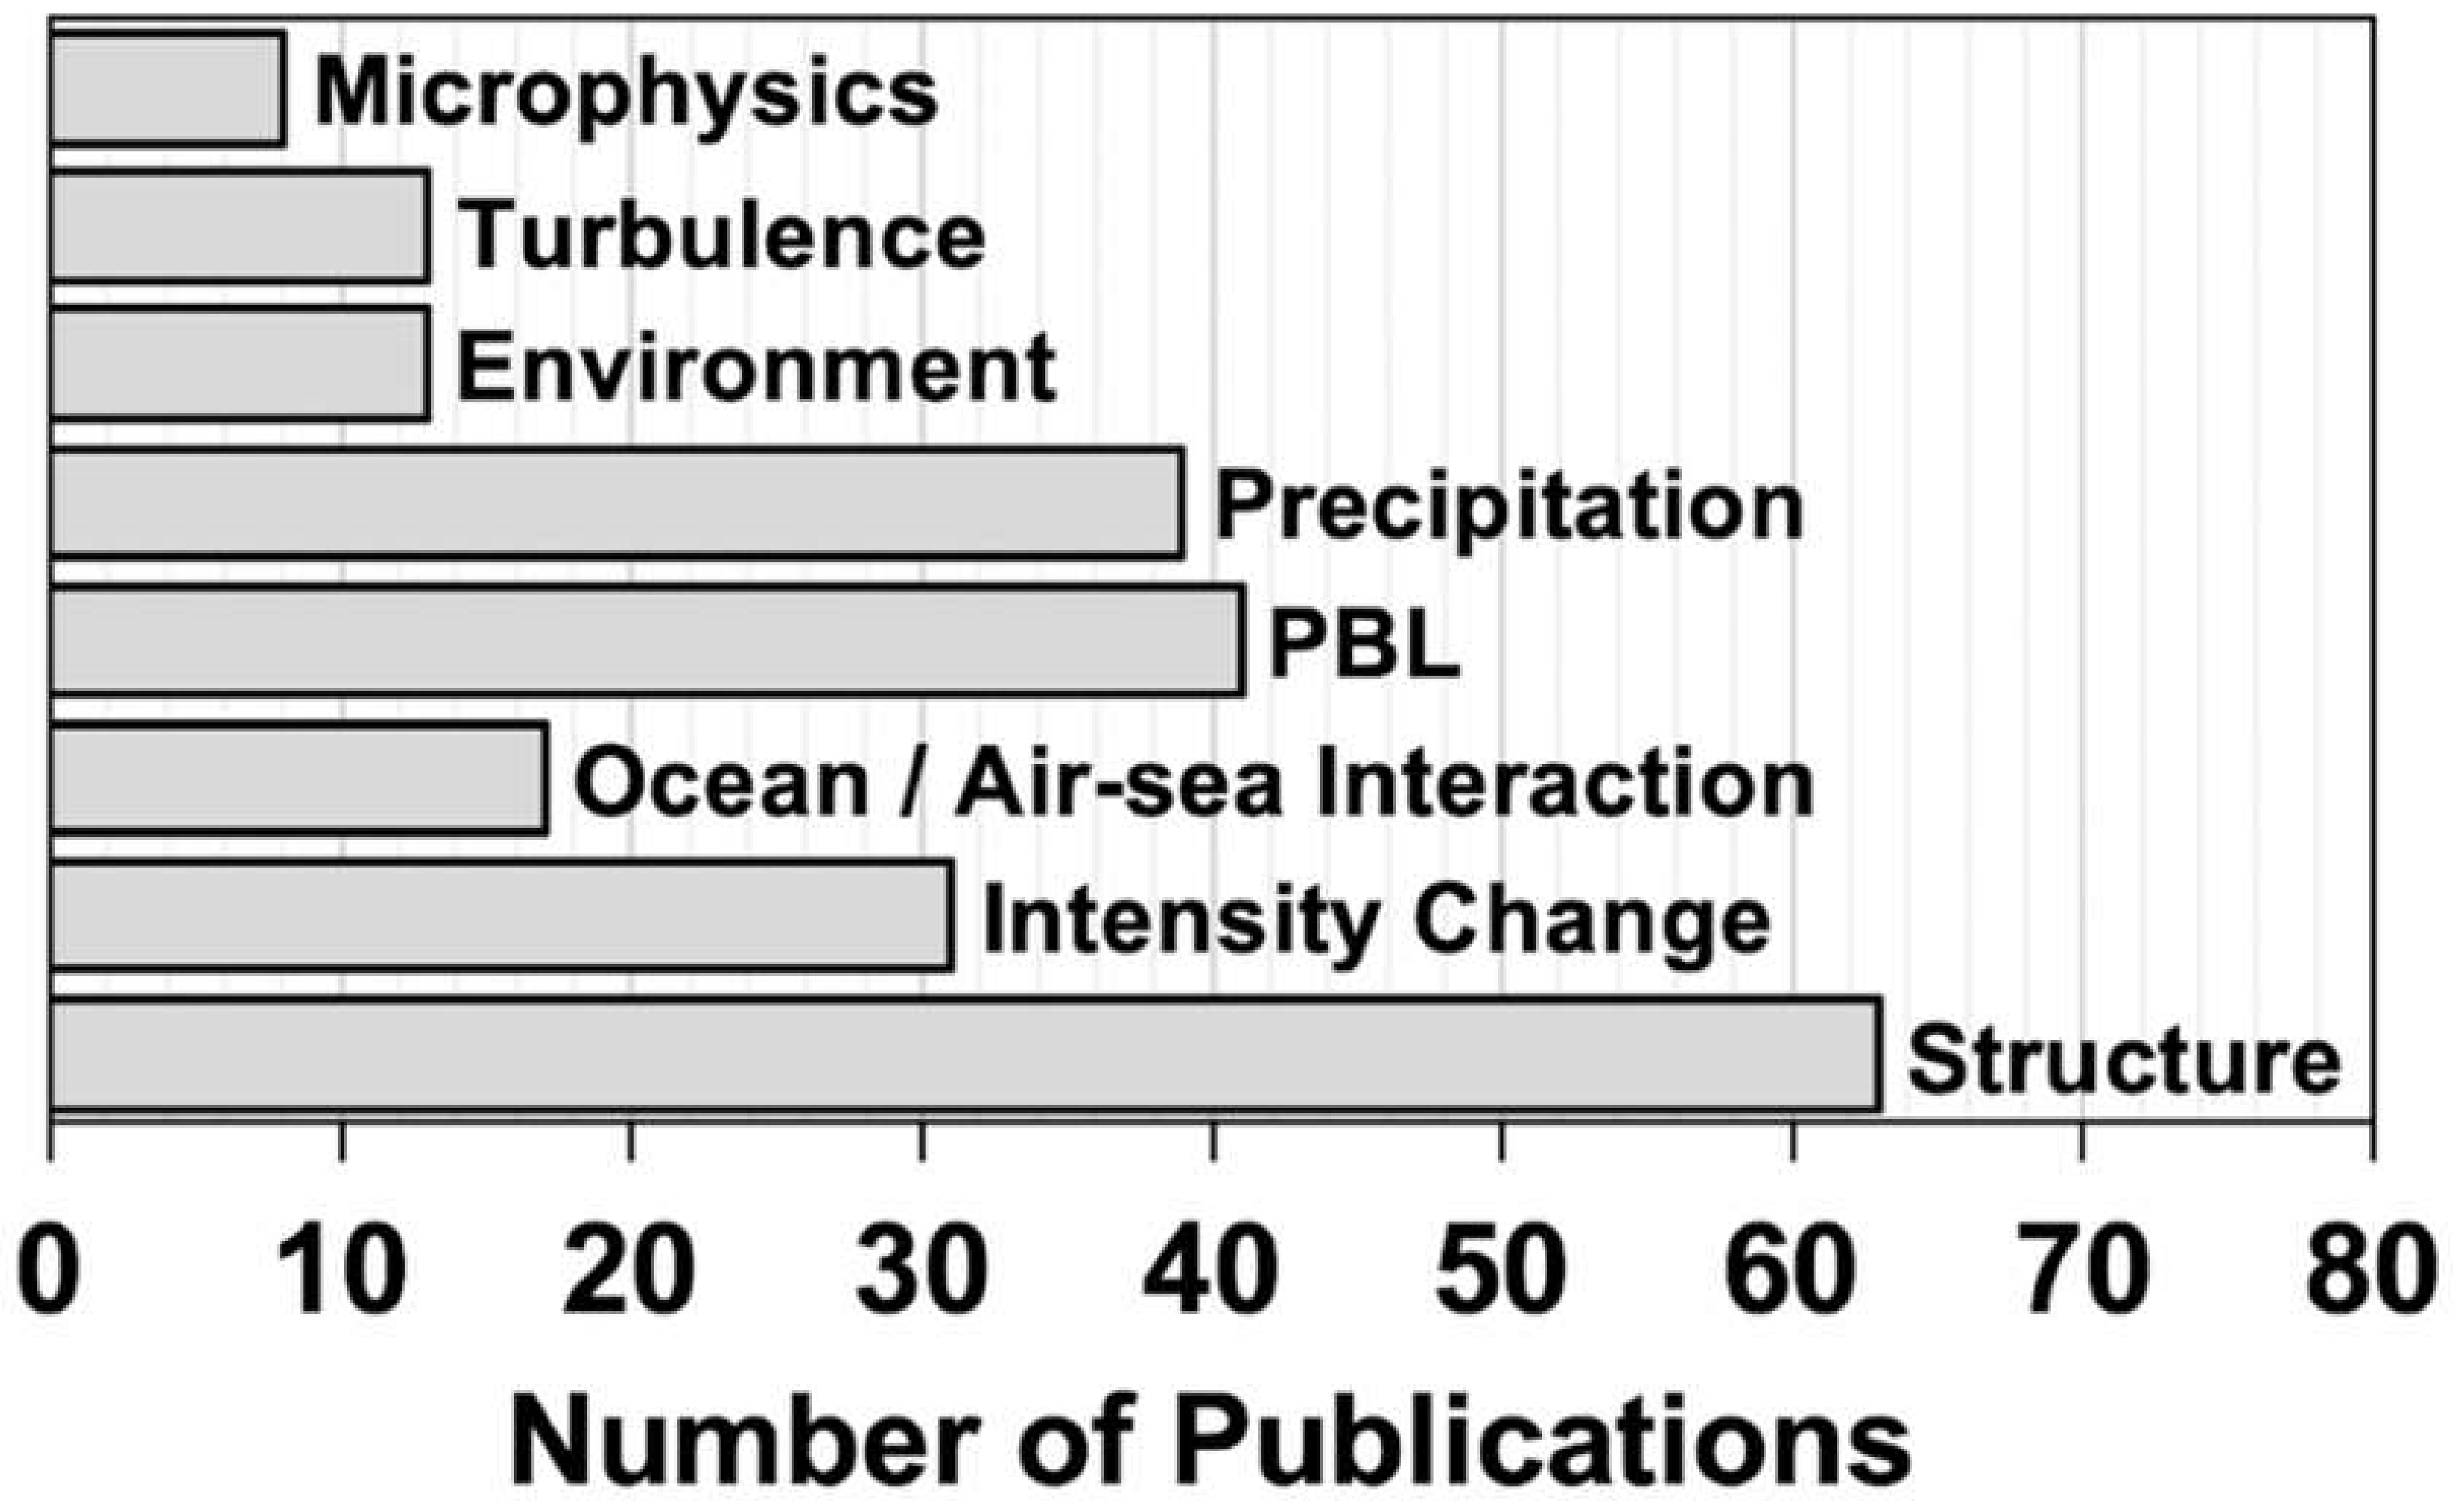
Publisher’s Note: MDPI stays neutral with regard to jurisdictional claims in published maps and institutional affiliations. |
© 2021 by the author. Licensee MDPI, Basel, Switzerland. This article is an open access article distributed under the terms and conditions of the Creative Commons Attribution (CC BY) license (https://creativecommons.org/licenses/by/4.0/).
Share and Cite
MDPI and ACS Style
Rogers, R.F. Recent Advances in Our Understanding of Tropical Cyclone Intensity Change Processes from Airborne Observations. Atmosphere 2021, 12, 650. https://0-doi-org.brum.beds.ac.uk/10.3390/atmos12050650
AMA Style
Rogers RF. Recent Advances in Our Understanding of Tropical Cyclone Intensity Change Processes from Airborne Observations. Atmosphere. 2021; 12(5):650. https://0-doi-org.brum.beds.ac.uk/10.3390/atmos12050650
Chicago/Turabian StyleRogers, Robert F. 2021. "Recent Advances in Our Understanding of Tropical Cyclone Intensity Change Processes from Airborne Observations" Atmosphere 12, no. 5: 650. https://0-doi-org.brum.beds.ac.uk/10.3390/atmos12050650
Note that from the first issue of 2016, this journal uses article numbers instead of page numbers. See further details here.