Article

Potential Human and Plant Pathogenic Species in Airborne PM10 Samples and Relationships with Chemical Components and Meteorological Parameters

1
Department of Mathematics and Physics “E. De Giorgi”, University of Salento and I.N.F.N. (Unit of Lecce), 73100 Lecce, Italy
2
Department of Environmental and Biological Sciences and Technologies (DISTEBA), University of Salento, 73100 Lecce, Italy
*
Author to whom correspondence should be addressed.
Submission received: 12 April 2021 / Revised: 30 April 2021 / Accepted: 18 May 2021 / Published: 20 May 2021
(This article belongs to the Special Issue Bioaerosols: Composition, Meteorological Impact, and Transport)

Abstract

:
A preliminary local database of potential (opportunistic) airborne human and plant pathogenic and non-pathogenic species detected in PM10 samples collected in winter and spring is provided, in addition to their seasonal dependence and relationships with meteorological parameters and PM10 chemical species. The PM10 samples, collected at a Central Mediterranean coastal site, were analyzed by the 16S rRNA gene metabarcoding approach, and Spearman correlation coefficients and redundancy discriminant analysis tri-plots were used to investigate the main relationships. The screening of 1187 detected species allowed for the detection of 76 and 27 potential (opportunistic) human and plant pathogens, respectively. The bacterial structure of both pathogenic and non-pathogenic species varied from winter to spring and, consequently, the inter-species relationships among potential human pathogens, plant pathogens, and non-pathogenic species varied from winter to spring. Few non-pathogenic species and even fewer potential human pathogens were significantly correlated with meteorological parameters, according to the Spearman correlation coefficients. Conversely, several potential plant pathogens were strongly and positively correlated with temperature and wind speed and direction both in winter and in spring. The number of strong relationships between presumptive (human and plant) pathogens and non-pathogens, and meteorological parameters slightly increased from winter to spring. The sample chemical composition also varied from winter to spring. Some potential human and plant pathogens were correlated with chemicals mainly associated with marine aerosol and/or with soil dust, likely because terrestrial and aquatic environments were the main habitats of the detected bacterial species. The carrier role on the species seasonal variability was also investigated.

1. Introduction

Natural and anthropogenic air pollution consists of complex mixtures of chemical and biochemical species as well as airborne pathogens. Therefore, in addition to the human health risks posed by fine aerosol particles, bioaerosols can also influence public health and ecological systems [1,2], since biological airborne contaminants (or bioaerosols) like bacteria, viruses, and fungi are usually transported by aerosols [3,4,5]. Potential pathogenic bacteria are of considerable interest since they can spread and induce diseases [6,7]. The most recent assessment has found that communicable diseases have been directly responsible for nearly nine million deaths in 2013, about 16% of the total [2]. The atmosphere can also represent a relevant vector for the rapid diffusion of plant diseases. The airborne transport of bioaerosols over long distances depends on many factors like reproductive rate, atmospheric turbulence and stability, survival of microbial species during exposure to extreme values of temperature, humidity, and wind speed (e.g., [8]). Airborne pathogens have not been as well characterized as the organisms present in soil and aquatic environments [3]. Risk assessment models simulating the pathogen dispersion must be modified according to [9] by improving their knowledge from experimental measurements. The current progress in airborne metagenomics has offered a unique opportunity to analyze bacterial and viral diversity in the air and monitor their spread locally or across the globe, since bio-surveillance activities should be promoted by national strategies to prevent the dissemination of pathogenic biological agents [3].
In this study, high-throughput sequencing of the 16SrRNA gene was applied to the DNA extracted from airborne PM10 samples, with the main goal of detecting potential (opportunistic) pathogenic bacterial species for humans and plants, in addition to non-pathogenic bacterial species. More specifically, this work aims to provide a preliminary local dataset of potential (opportunistic) human and plant pathogenic bacterial species at a coastal site representative of the central Mediterranean. The Mediterranean Basin is significantly affected by the long-range transport of particles of anthropogenic and/or natural origin from surrounding countries [10]. Moreover, the physiographic characteristics of the Mediterranean Basin and the prevailing climate conditions are responsible for the development of atmospheric flow patterns, leading to a climate profile roughly characterized by both cold and warm periods [11]. Previous studies have proven that the main PM chemical components [12,13,14] and bacterial phyla and genera [15,16] vary from the cold to warm season at the study site. Romano et al. [15] reported preliminary data on the presumptive presence of potential (opportunistic) human pathogenic bacteria in the PM10 samples of this study. They used a non-metric multi-dimensional scaling (NMDS) ordination plot to show the likely seasonal impact on the human pathogen variability.
Potential (opportunistic) human and plant pathogenic species, in addition to non-pathogenic species, detected both in winter and in spring samples, were analyzed in more detail in this study. The main objective was to provide a winter- and spring-local database, which also takes into account the carrier role on the bacterial species variability. The redundancy discriminant analysis (RDA) and Spearman’s rank-order correlation coefficients were used to analyze and discuss inter-species relationships among potential pathogens and non-pathogenic species, in addition to their relations with PM10 chemical components (and related pollution sources) and meteorological parameters.

2. Materials and Methods

2.1. Monitoring Site Location and PM10 Sample Collection

The study site is located in a suburban area (40.3° N; 18.1° E) of the flat Salento Peninsula (Figure S1). It is away from large pollution sources and may be considered representative of coastal sites of the central Mediterranean [17]. The PM10 samples were collected on the roof (~10 m above ground level) of the Mathematics and Physics Department of the University of Salento. Different low volume PM samplers operating at 2.3 m3 h−1 were used to simultaneously collect PM10 particles on PTFE (polytetra-fluoroethylene; TEFLO W/RING 2 μm from VWR International S.R.L) and preheated quartz filters (PALLFLEX, Tissuquartz), which were used for the recovery of bacteria and chemical species, respectively. The PTFE and Tissuquartz filters were conditioned for 48 h (25 °C and 50% humidity) before and after sampling and PM10 mass concentrations were determined by the gravimetric method. Each filter was located in a sterilized box and stored at −20 °C before use to avoid changes in the PM chemical properties and bacteria growth, highly reduced at such temperatures [18]. Filters were not subjected to sampling, but handled and stored in the same way as the sampled filters and were used as negative control filters.

2.2. Ions, Metals, and Organic and Elemental Carbon Analyses

Loaded and blank PM10 filters were subjected to different analyses to characterize their chemical composition. Anion (Cl, NO3, SO42−, and MS) and cation (Na+, NH4+, and Mg2+) mass concentrations were determined on quartz filters by flow analysis ion chromatography (FA-IC) [19]. A Sunset Carbon Analyzer Instrument with the EUSAAR-2 temperature program protocol [20] was used to determine organic and elemental carbon (OC and EC, respectively) mass concentrations on quartz filters. The particle-induced x-ray emission (PIXE) technique [21] was used to determine the total (soluble and insoluble) mass concentration of As, Ba, Cd, Cr, Mo, Ni, Pb, V, Al, Si, P, S, K, Ca, Ti, Mn, Fe, Cu, Zn, Se, Br, Rb, Sr, and Zr in PTFE filters.

2.3. DNA Extraction and 16SrRNA Gene High-Throughput Sequencing

Romano et al. [15,16] provided a comprehensive description of the procedure used for the recovery of bacteria and debris from the PTFE PM10 samples. The DNeasy PowerSoil Kit (Qiagen) was used to carry out DNA extraction. Genomix4life S.R.L. (Baronissi, Salerno, Italy) performed the library preparation and the sequencing of the V3 and V4 regions of the 16S rRNA gene, in addition to the bioinformatics analysis. ClassifyReads, a classifier of the Ribosomal Database Project (RDP, [22]), allowed the taxonomic grouping of the 16S rRNA targeted amplicon reads up to the species level. The used classifier was also able to identify unclassified reads by considering those that did not match a reference sequence [23,24].

2.4. Establishment of Potential Human and Plant Pathogenic Species and Non-Pathogenic Species

The full list of bacterial species detected in the PM10 samples, resulting from the 16S rRNA gene metabarcoding analysis, was screened to obtain a preliminary dataset on the presumptive presence of potential human and plant pathogens, and non-pathogenic species. The American Biological Safety Association (ABSA) International database (https://my.absa.org/, accessed on 27 April 2021) was used to identify the human pathogenic species [25,26]. The ABSA database consisted of 693 species, integrated with the opportunistic Acinetobacter species. The list of plant pathogenic bacteria provided by [27] and published according to the International Code of Bacteria and the Standards for Naming Pathovars was used to identify plant pathogens in our 16S rRNA gene-based bacterial species dataset. All the species included neither in the human pathogenic database nor in the plant pathogenic database were defined as “non-pathogenic species”. The associations of these last bacterial species with the other living organisms were investigated using the EID2 (Enhanced Infectious Diseases) web-fronted relational-database (https://eid2.liverpool.ac.uk/ [2], accessed on 27 April 2021). The EID2 database allowed us to identify the interactions among species including host–pathogen interactions, commensal (neither beneficial nor costly) or mutualistic (beneficial to both species), or vector–host interactions. Analogously to the EID2, many other pathogen libraries were defined using the NCBI (National Center for Biotechnology Information) Taxonomy database (http://0-www-ncbi-nlm-nih-gov.brum.beds.ac.uk/taxonomy, accessed on 27 April 2021) and the NCBI Nucleotide database (http://0-www-ncbi-nlm-nih-gov.brum.beds.ac.uk/nuccore, accessed on 27 April 2021). If compared with pathogen databases at the species levels, the full list of the PM10 bacterial species, resulting from a metabarcoding analysis, for non-pathogenic species and both for potential human and plant pathogens, could likely provide only speculation about the pathogenic abilities of the identified species. However, the deduced local sub-datasets could be a starting point for setting up a culture-based approach aimed at targeted isolation of presumptive pathogenic bacterial strains and at in vitro and in vivo virulence analyses. Liu et al. [5] used the 16SrRNA gene high-throughput sequencing of PM samples to characterize airborne bacteria at Hangzhou (China). They established a new local database of pathogens for their site, called the “Human Pathogen Database”, which consisted of 74 pathogenic species extracted from the NCBI database, according to [28,29,30,31].

2.5. Statistical Methodologies for Data Analysis

The Bray–Curtis dissimilarity indices BCi,j were used to determine the dissimilarity between two samples denoted by the letters i and j. More specifically, the dissimilarity among samples with respect to their chemical components, the bacterial species structure, the potential (opportunistic) human and plant pathogens, and non-pathogenic species was also evaluated by means of the BCi,j indices. The PAST (PAleontological STatistics) software package (Version 4.03; [32]) was used to calculate both BCi,j matrices and non-parametric Spearman’s rank-order correlation coefficients. Note that we used a non-parametric statistical method as the Spearman’s correlation test because all the investigated parameters were not normally-distributed based on the one-sample Kolmogorov–Smirnov test (according to [33]). The MATLAB software was used to carry out the redundancy discriminant analysis (RDA; [34]) following the procedure described in [35]. This technique represents the multivariate extension of a simple linear regression applied to some sets of variables [36] by using a combination of two datasets: “species data” as response (or dependent) variables and “environmental variables” as explanatory (or predictive) variables [37,38]. In particular, in this work, the RDA technique was used to investigate the relationships between relative abundances of potential (opportunistic) human and plant pathogens, and non-pathogenic species as “species data” and chemical species mass concentrations as “environmental variables”. The RDA analysis was applied to the selected datasets using the Fathom Toolbox by the f_rda and f_rdaPlot functions [39]. Note that the arrow length and direction in the RDA score plots are strictly related to the variance that can be explained by the analyzed variables [37]. Stronger correlations between two parameters involve a greater absolute value of the cosine of the angle between the two corresponding arrows. Arrows in the same and in the opposite direction suggest a positive and a negative correlation, respectively, among the corresponding variables [40,41]. We also compared the accuracy of each performed RDA analysis using the Akaike’s information criterion (AIC), the small sample-size corrected AIC (AICc), and the Bayesian information criteria (BIC) [42,43,44,45]. These statistical indices were estimated using the f_AIC and f_rdaAIC functions included in the MATLAB Fathom Toolbox [39].

3. Results and Discussion

3.1. Detection of Potential (Opportunistic) Human and Plant Pathogenic Species and Non-Pathogenic Species

In our samples, 1738 OTUs (based on a total number of reads equal to 7,317,407 and with >0.01% within-sample abundance) were identified using a threshold of 97% sequence similarity [46].Table S1 in the Supplementary Materials lists the sampling date of the 10 investigated winter (a, January–March 2018) and spring (b, May–June 2018) samples, denoted as S1–S10 and S11–S20, respectively. The PM10 mass concentration and the total number of operational taxonomic units (OTUs), phyla, orders, genera, and species detected in each sample were also provided. The listed parameters varied from sample to sample in winter (Table S1a) and spring (Table S1b) and the number of OTUs, phyla, orders, genera, and species increased from about twice to more than twice from winter to spring because of the seasonal impact on the bacterial community structure. The PM10 mass concentrations varied weakly from winter to spring, likely for the weak seasonal dependence of the planetary boundary layer height at the study site [12].
Figure S2a,b shows the heat map of all the detected bacterial species in the winter (S1–S10) and spring (S11–S20) samples, respectively. In total, 1187 species were detected: 133 and 446 species were only detected in winter and spring, respectively. The remaining 608 species were detected in both winter and spring. Seventy-six potential (opportunistic) human pathogenic species were detected [15]. Corresponding heat maps are shown in Figure S3a,b for winter and spring, respectively. Seven and 23 human pathogens were exclusively found in winter and spring, respectively. The screening of the 179 plant pathogens [27] allowed for the identification of 27 potential (opportunistic) plant pathogens, whose heat maps are shown in Figure S4a,b for winter and spring, respectively. Four and 10 plant pathogens were exclusively found in winter and spring, respectively. Three plant pathogens (Clavibacter michiganensis, Curtobacterium flaccumfaciens, and Enterobacter cloacae) are also classified as human pathogens. We identified 1084 potential non-pathogenic species (out of 1187; 91%), whose heat maps are shown in Figure S5a,b for winter and spring, respectively. A total of 122 and 413 non-pathogens were exclusively found in winter and spring, respectively.
Figure S6 shows the relative abundance (RA) of potential human and plant pathogens, non-pathogenic species, and unclassified bacterial species in winter and spring. The percentage contribution of unclassified bacterial and non-pathogenic species increases and decreases, respectively, from winter to spring. Plant- and human-pathogen RAs do not appear to be significantly affected by the seasons. The RA-based BCi,jdissimilarity indices were calculated to determine the dissimilarity between the bacterial species components of the two sampling groups (Table S2a,b). The BCi,j values vary between 0 if two samples share the same bacterial structure, and 1 if not. The BCi,jvalues with ij varied within the 0.01–0.51 range in winter samples and 38% of the BCi,j values were ≥0.20. The spring BCi,jvalues were, on average, smaller than the winter ones: these varied within the 0.01–0.33 range and 18% of the BCi,jvalues were ≥0.20. The greater number of rainy and windy days occurring in winter than in spring was likely responsible for the high day-by-day variability of the airborne-bacterial-community in winter. In contrast, the stagnant atmospheric conditions, fostered all over the Mediterranean Basin by the spring meteorological conditions, likely contributed to the low spring variability of the airborne-bacterial-community [15]. Figure 1 shows the dendrograms based on the RA-BCi,j dissimilarity indices associated with the relatedness of potential plant and human pathogens, non-pathogenic species, and unclassified species in (a) the S1–S10 winter and (b) the S11–S20 spring samples. With the exception of sample S5, the RA of plant pathogens was rather small in all the winter samples (Figure 1a) and was equal to 0 for S8, where non-pathogenic and unclassified bacterial species reached the highest and the smallest RA, respectively.
Potential plant pathogens were found in all the spring samples (Figure 1b) and their RA decreased with the increase in human pathogen RAs, suggesting different aerial dispersal routes and/or sources. The higher plant pathogen abundance from S12 to S18 (Figure 1b) may be indicative of a seasonal pattern in response to crop cycles. However, the plant pathogenic potential and tropism of detected species are often associated with specific subspecies and/or pathovars that could not be defined by our level of analysis.
Human and plant pathogens reached the highest percentage in S5, which was collected in heavy rain days [15]. Rain can affect the PM bacterial community through washout and rainout mechanisms, which remove the bacterial species below the cloud base and in the clouds, respectively. Raindrops clearly scavenge bacteria as they fall, but washout processes likely contribute more to the diversity than to the total amount of bacteria in cloud water. This topic has aroused an increasing interest in the scientific community (e.g., [47]). Ouyang et al. [48] provided useful data to assess the variations in the airborne bacteria and antibiotic resistance genes in PM2.5 samples before, during, and after rain events.

3.2. Chemical Components and Potential (Opportunistic) Human and Plant Pathogens, and Non-Pathogenic Species in Winter and Spring Samples

Table S3a,b provides the mass concentration of PM10, elemental and organic carbon (EC and OC, respectively), ionic species, and elements in winter and spring samples, respectively. Figure S7a,b displays the day-by-day changes of the most abundant chemical species RAs in the winter and spring samples, respectively, and shows the relatedness between samples by means of chemical species BCi,jdissimilarity dendrograms. The comparison of Figure 1 and Figure S7 shows that the sample clustering based on the RA-BCi,j dissimilarity dendrogram of potential human and plant pathogens, non-pathogenic species, and unclassified bacterial species is different from the corresponding one based on chemical component RAs. This last result likely suggests that bacterial species and chemical components were differently affected by pollution sources, meteorological parameters, and/or long range transported air masses [15]. The link of potential human and plant pathogens, and non-pathogenic species with meteorological parameters and chemical components was analyzed to obtain a better understanding of the factors affecting their structure and seasonal change. Temperature (T), relative humidity (RH), pressure (P), cumulative rain (CR), wind direction (WD), and speed (WS) were the investigated meteorological parameters, which may affect surface emissions and atmospheric bacterial concentrations. Temperature and wind speed are the most relevant parameters when bacteria are emitted by local sources [49].
Our analysis was restricted to the 10 most abundant and pervasive potential human and plant pathogens and non-pathogenic species, requiring that the most abundant pathogens were also detected at least in four out of the 10 winter or spring samples to better investigate their inter-relationships.

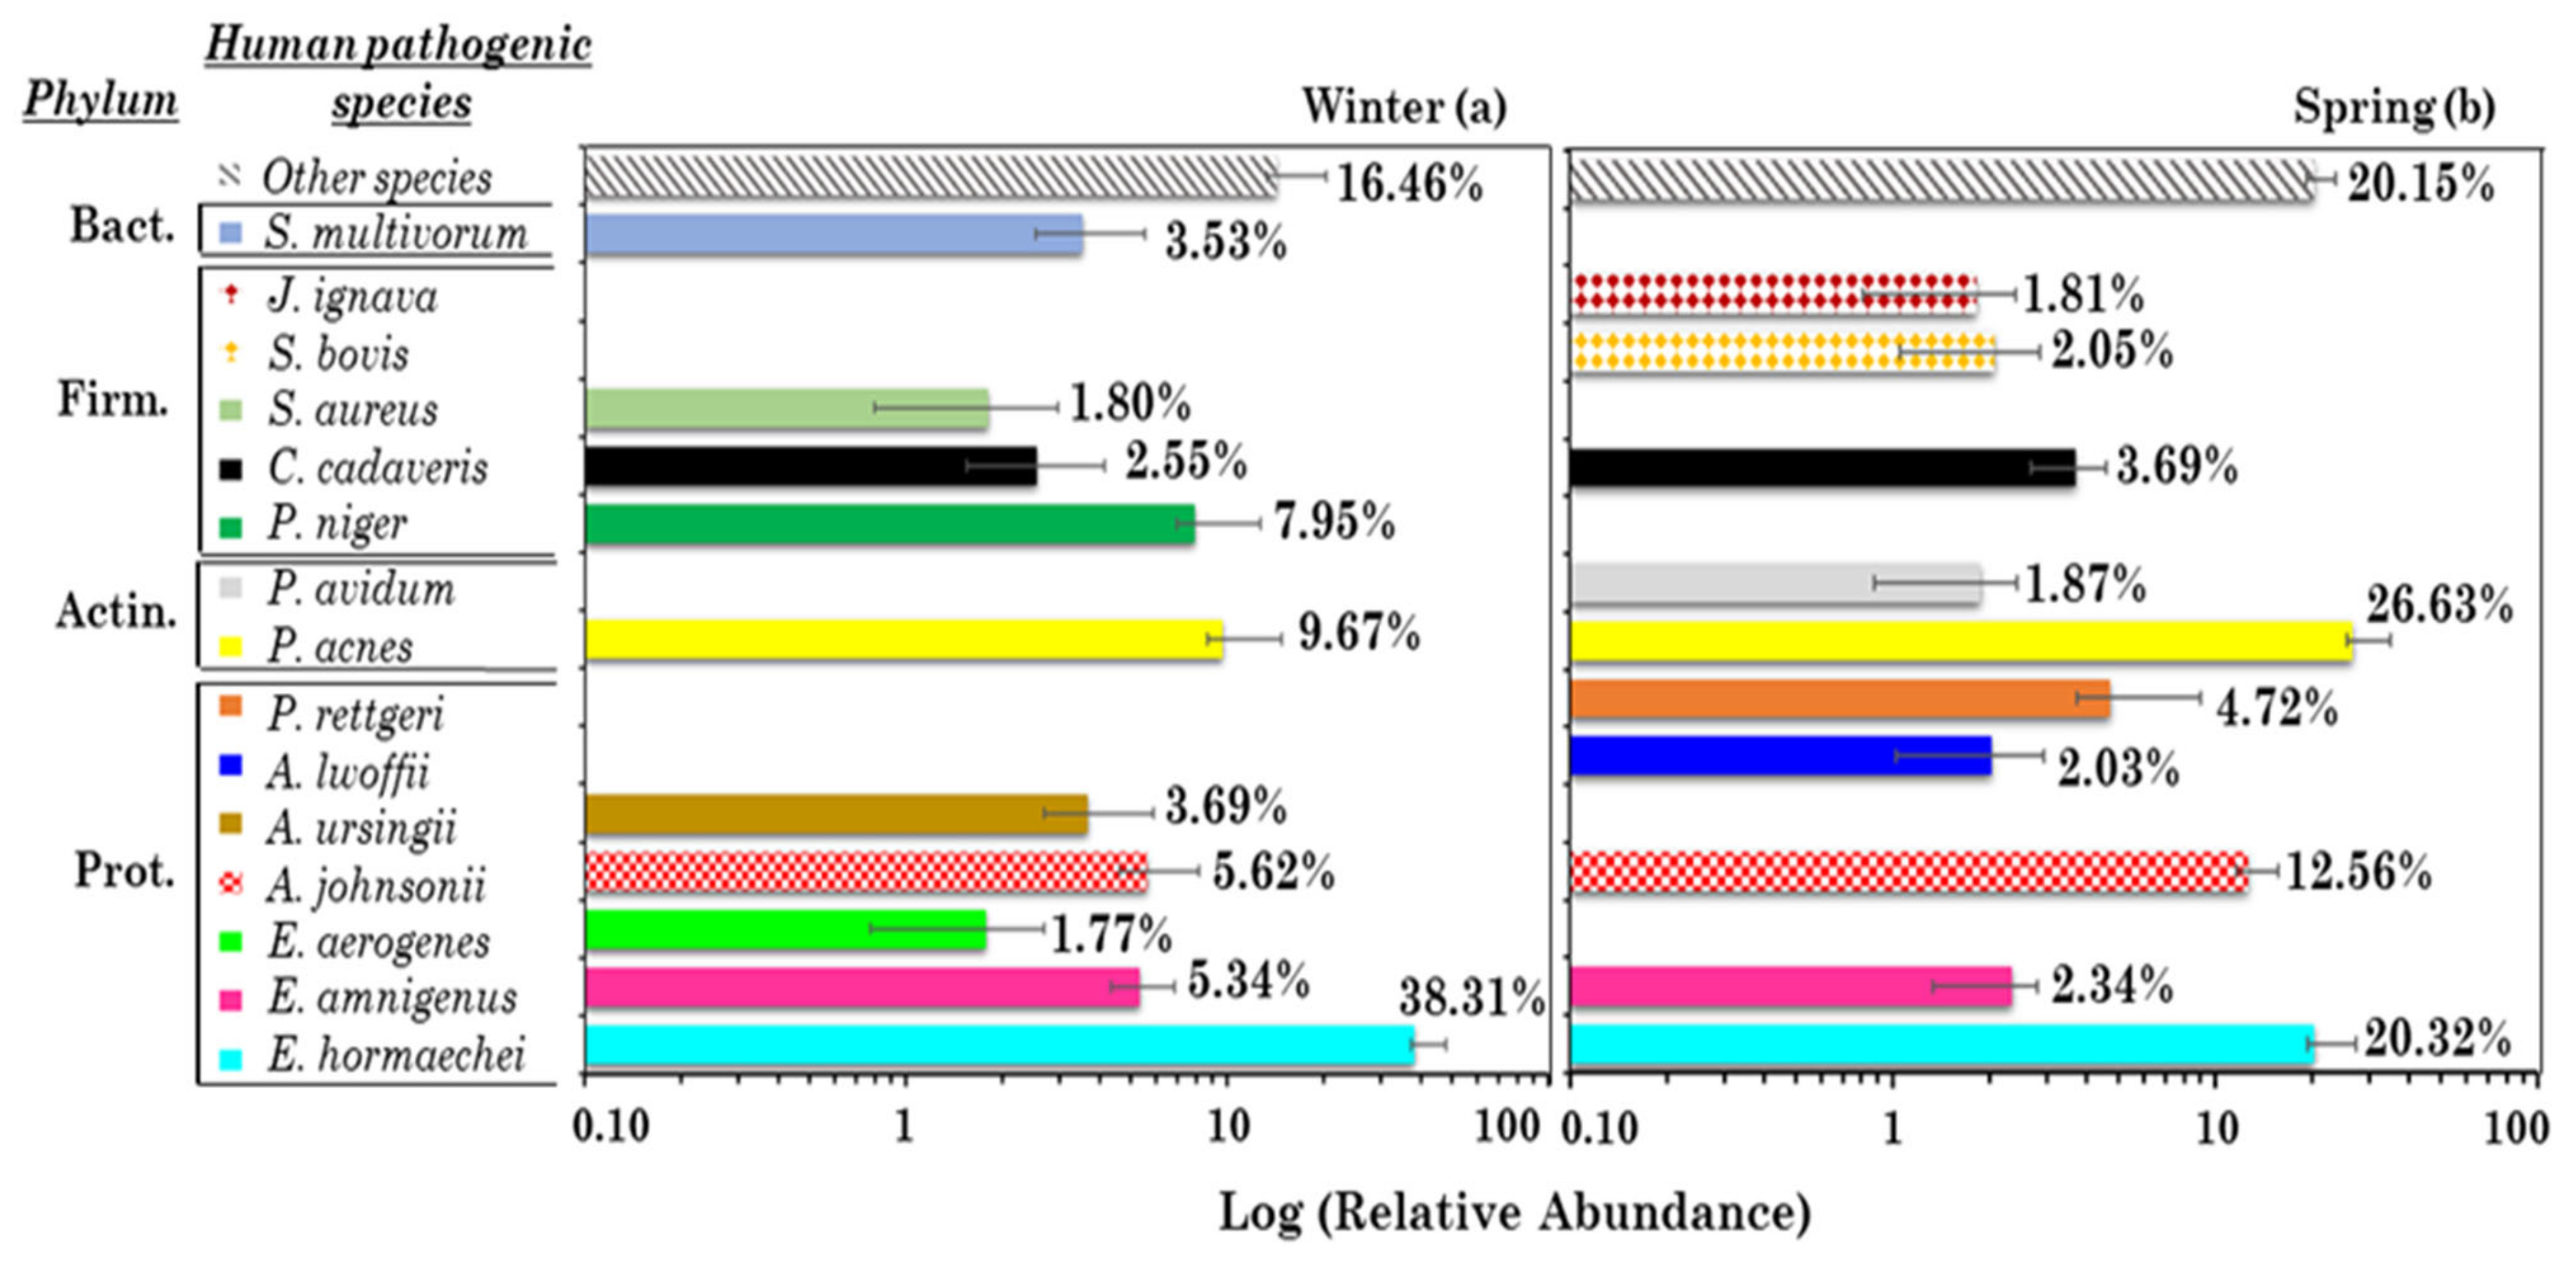
3.2.1. Analysis of the 10 Most Abundant and Pervasive Potential (Opportunistic) Human Pathogens in Winter and Spring

Figure 2 shows the mean percentage contributions of the 10 most abundant and pervasive potential human pathogens in (a) winter and (b) spring. Their RA in the winter and spring PM10 samples is shown in Figure S8a,b. Five out of the 10 most abundant human pathogens were only detected in winter and spring, according to Figure 2. Human pathogen RAs varied within the (1.77–38.31%) and (1.81–26.63%) range in winter and spring, respectively. The <1.77% (winter) and <1.81% (spring) mean within-sample RA human pathogenic species, in addition to the corresponding not-pervasive high-RA human pathogens, denoted as Other species, in winter and spring, respectively, are also represented in each plot. The Other species RA increased from winter (16.46%) to spring (20.15%). In fact, the total species number increased more than twice from winter to spring (Table S1). The RA-BCi,j matrix calculated by considering the 10 most abundant and pervasive human pathogens in winter and spring is shown in Table S4a,b, respectively. Their values spanned the 0.26–1.00 and the 0.06–0.91 range in winter and spring, respectively, and 13.7% of the RA-BCi,j values were ≥0.91 in winter. Therefore, although the total number of human pathogens increased from winter to spring (Figure S3a,b), the sample dissimilarity on average decreased from winter to spring. The reduced amount of wet-scavenging processes and the more stagnant atmospheric conditions in spring likely contributed to this result. Dendrograms based on the RA-BCi,j dissimilarity indices are shown in Figure S8a,b to display the relatedness of human pathogens in the winter and spring samples, respectively.
Proteobacteria potential human pathogens were the most abundant in both winter and spring, respectively (Figure 2a,b), with Proteobacteria being the most abundant phylum [15]. The sample clustering depicted by Figure S8a shows that Enterobacter hormaechei, the most abundant human pathogen in winter (Figure 2a), was also the prevailing human pathogen of the cluster composed of samples S2, S7, S5, S1, S9, and S4. In fact, E. hormaechei is widespread in many environmental niches [50] and is commonly considered a causative pathogen of infections in nosocomial environments [51]. Propionibacterium acnes and Peptococcus niger, the second and the third most abundant human pathogens, respectively, were the only human pathogens in S8. Propionibacterium acnes is an opportunistic pathogen that forms part of the normal microbiota on human skin and mucosal surfaces and growing evidence also supports its important role in other human diseases [52,53,54]. Peptococcus niger, a human pathogen only detected in winter, is a constituent of the normal intestinal mucous membranes and umbilicus flora, and rarely isolated from human pathogenic specimens [55]. The Other species RA reached the highest value (>50%) in S3 and the BC3,j values spanned the 0.57–0.96 range because of the high S3 dissimilarity. Sample S3 was significantly affected by desert dust from northwestern Africa, as shown in [15]. Desert dust events may increase the microbial biodiversity [56,57,58]. Propionibacterium acnes and Enterobacter hormaechei reached the highest contributions both in winter and in spring (Figure 2a,b). In spring, Propionibacterium acnes was the prevailing human pathogen in S16 and S14, while Enterobacter hormaechei was the prevailing one in S11 and S20 (Figure S8b), which had a quite similar bacterial species structure (BC11,20= 0.06, Table S4b). In conclusion, besides showing the day-by-day changes of the most abundant and pervasive human-pathogen RAs, Figure 2 also highlights the seasonal dependence of their RAs.

3.2.2. Correlations between the 10 Most Abundant and Pervasive Potential Human Pathogens, and with PM10 and Chemical Component Mass Concentrations, and Meteorological Parameters

The relationships among potential human pathogens, PM10 and chemical component mass concentrations, and meteorological parameters were analyzed by means of Spearman correlation coefficients and RDA tri-plots. The last ones are shown in Figure S9a,b for winter and spring, respectively, to visualize the relationships between chemical components as predictive variables and human pathogens as dependent variables. As reported in Section 2.5, the abundances of all the identified most abundant and pervasive potential human pathogens (both for the winter and spring samples) were not normally-distributed based on the one-sample Kolmogorov–Smirnov test (p-values < 0.01, Table S5). Therefore, this last result allowed us to use a non-parametric statistical method as the Spearman’s correlation test for the human pathogen abundance characterization (Table S6). Table 1 lists the human pathogens characterized in winter and spring by positive Spearman coefficients significant at a p-level < 0.05 (*) and 0.01 (**). Spearman correlation coefficients (r) are given in brackets. Peptococcus niger correlated with T (r = 0.70) is the only human pathogen with strong positive correlations with meteorological parameters in winter. None of the human pathogens were positively correlated with the meteorological parameters in spring. Liu et al. [5] found that RH was the most crucial meteorological parameter positively correlated with pathogenic bacteria at Hangzhou (China). Table 1 also highlights rather few correlations among the potential human pathogens and between human pathogens and PM10 and chemical component mass concentrations. As an example, a very strong correlation occurred between Enterobacter hormaechei and Enterobacter amnigenus in winter and spring, respectively. The other strong correlations in winter occurred between Acinetobacter ursingii, Acinetobacter johnsonii, and Enterobacter aerogenes. The correlations among human pathogens increased from winter to spring. Propionibacterium acnes was strongly correlated with Zn in winter and with Mg2+, MS, Mo, and Sr in spring, while Clostridium cadaveris, the only human pathogen significantly correlated with PM10 in winter, was strongly correlated with As and Pb in winter and with MS-, V, Ca, and Sr in spring (Table 1). However, rather few correlations occurred between potential human pathogens and chemical components, mainly in winter. Note that Zn, As, Sr, and Pb are mainly associated with a mixed anthropogenic source, while Mg2+, MS, V, and Ca are mainly associated with a secondary marine source according to [14,59]. The correlations between human pathogens and chemical components also increased from winter to spring.
The BCi,j dissimilarity indices with on average smaller values in spring than in winter support this last comment. We must be aware that correlations of microorganisms with chemical components depend on several factors as the microorganism habitat, the pathway of their aerial dispersal from the source to the collecting site, the monitoring site pollution sources, and/or the chemical species that facilitate their survival and growth. Furthermore, the chemical composition of PM filters resulted from the contribution of different sources. The elements As, Ba, Cd, Cr, Pb, V, Al, Ti, Br, Rb, Sr, and Zr have a prevalent anthropogenic or environmental origin, while Mo, Ni, P, S, K, Ca, Mn, Fe, Cu, Zn, and Se, anions (Cl, NO3, and SO42−) and cations (Na+, NH4+, and Mg2+) are also essential for the structure and biochemical reactions of all living cells. Therefore, bacteria and/or other airborne living beings (like eukaryotic microbes, plants, and viruses) captured by the filter during the samplings may also contribute to the PM ions and elements, in addition to the ones due to aerosol particles. Knowledge and technology gaps limit the understanding of the relationships between chemical species and bacterial community and might lead to contradictory results [60]. The comparison of Table 1 with RDA tri-plots (Figure S9) shows that some relationships are common, while others are contrasting, likely because of the dependence of the bacterial species arrows in RDA tri-plots also on sample location (black symbols), as discussed in [16]. Nevertheless, both Table 1 and the RDA tri-plots show that the relationships vary from winter to spring. In fact, it can be observed from Figure S9 that the arrows associated with the spring chemical species concentrations were spread over a wider area with respect to the corresponding winter arrows. The air mass aging over the Mediterranean, typical of warm periods like spring and summer, favored the mixing of particles of different types/sources [61] and, therefore likely contributed to this result, in agreement with the findings reported in [16,35]. The AIC, AICc, and BIC index values (Table S7) were estimated for the statistical representativeness of each RDA analysis performed with relative abundances of human pathogens as “response variables” and chemical species mass concentrations as “explanatory variables”, both for the winter and for spring samples. We found negative values of AIC and BIC that could be due to the limited number of the analyzed samples. However, the RDA analysis accuracy increased with the decrease of these indices [62]. Table S7 shows that the statistical indices AIC, AICc, and BIC decreased from winter to spring and, therefore, spring results are likely to be more accurate than the winter ones [45]. This last result was also confirmed by the increase in the total variance explained by the two RDA axes from winter to spring (Figure S9).

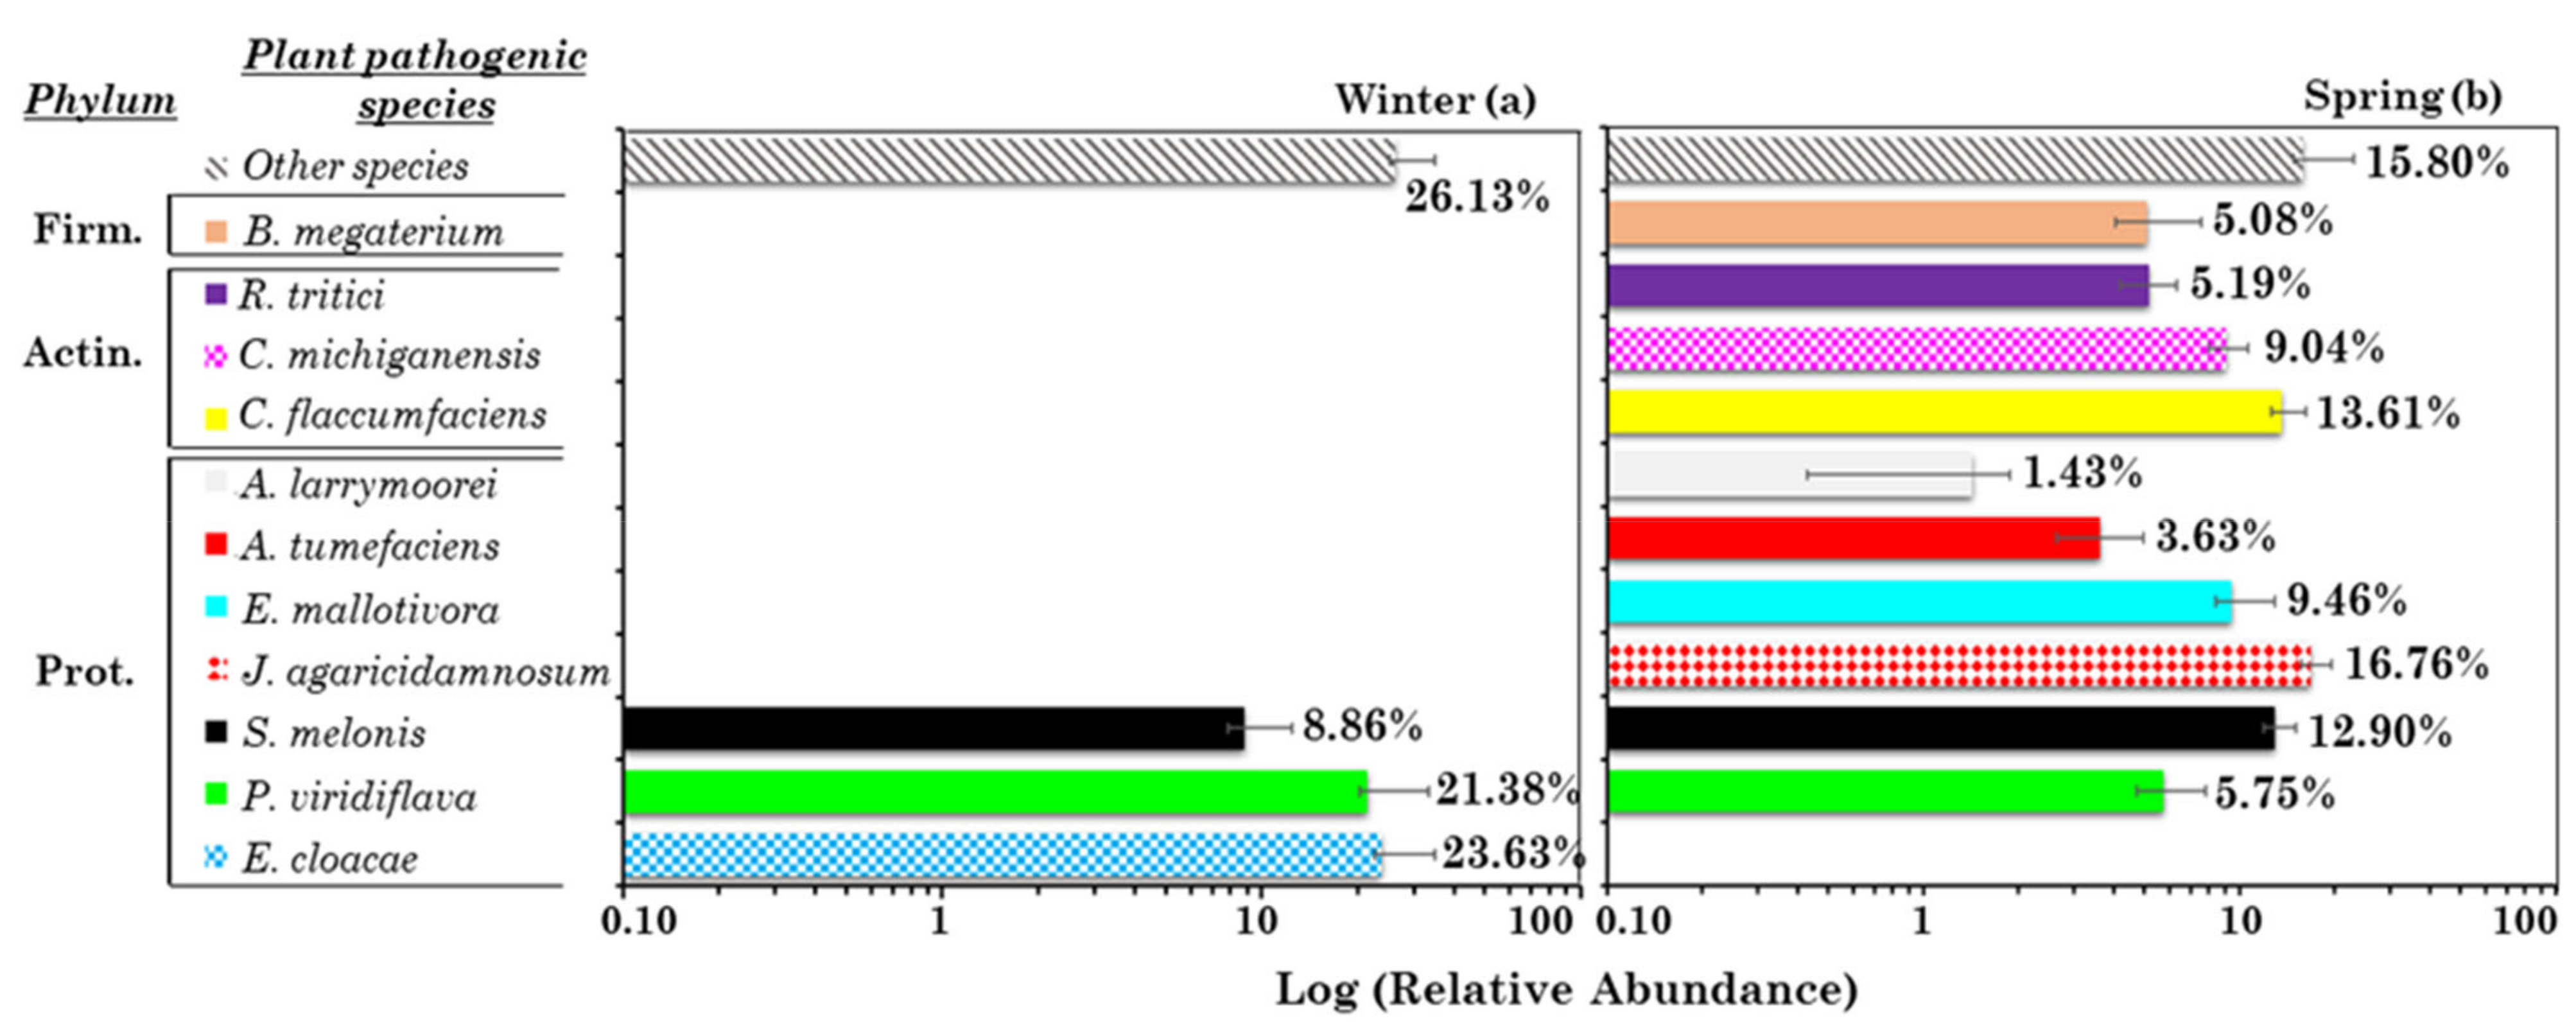
3.2.3. Analysis of the Most Abundant and Pervasive Potential (Opportunistic) Plant Pathogenic Species in Winter and Spring

The RA of potential plant pathogens was rather small in all the winter samples (Figure 1a). Consequently, three plant pathogens were only detected in four or more winter PM10 samples (Figure S4a). Figure 3a shows their RAs. Other species represents the RA due to all the remaining plant pathogens in winter. Enterobacter cloacae, the most abundant plant pathogen, was detected in four winter samples, but only in two spring samples at quite high RA. The winter RA-BCi,j dissimilarity matrix is shown in Table S8a, while Figure S10a shows the three potential plant pathogen contributions in the 10 winter samples, in addition to the RA-BCi,j dissimilarity dendrogram. The sample clustering depicted by Figure S10a allowed us to identify a first cluster composed of S1, S4, and S2, where Enterobacter cloacae is the prevailing pathogen, a second cluster made up of S6 and S3 where Sphingomonas melonis prevails, and a third cluster made up of S7 and S5 where Pseudomonas viridiflava prevails. P. viridiflava is a pectinolytic bacterium in the P. syringae complex with a broad host range and capacity to live as either a pathogen or saprophyte [63].
During the springs from 2006 to 2008, P. viridiflava caused an outbreak of bacterial blossom blight on Actinidia chinensis kiwi fruit plants in Italy [64]. Ten of the most abundant and pervasive potential plant pathogenic species were detected in spring samples (Figure 3b). Figure S10b shows the plant pathogen contributions in the 10 winter samples, in addition to the RA-BCi,j dissimilarity dendrogram (with corresponding values in Table S8b). Janthinobacterium agaricidamnosum, the most abundant plant pathogen in spring, was detected in all the spring samples, while Curtobacterium flaccumfaciens and Sphingomonas melonis, the second and third most abundant plant pathogens, were detected in all the spring samples except S11, where Bacillus megaterium reaches the highest RA (Figure S10b).

3.2.4. Correlations between the Most Abundant and Pervasive Potential Plant Pathogens and with Human Pathogens, PM10 and Chemical Component Mass Concentrations, and Meteorological Parameters

The abundances of all the identified most abundant and pervasive potential plant pathogens were not normally-distributed based on the one-sample Kolmogorov–Smirnov test (p-values < 0.01, Table S5). Consequently, the spring and winter relationships between the most abundant and pervasive potential plant pathogens, and with the most abundant and pervasive potential human pathogens, the PM10 and chemical component mass concentrations, and meteorological parameters were investigated by Spearman correlation coefficients (Table S9) in addition to the RDA tri-plots. Table 2 summarizes very strong (**) and strong (*) relationships from Spearman coefficients: plant pathogens were not correlated among them in winter, while Enterobacter cloacae was the only plant pathogen significantly and positively correlated with the identified potential human pathogens. More specifically, it was correlated with Acinetobacter johnsonii (0.65*), Acinetobacter ursingii (0.85**), and Enterobacter aerogenes (0.95**). Few positive and significant correlations also occurred between plant pathogens and chemical component mass concentrations: Enterobacter cloacae was correlated with NH4+ and Sphingomonas melonis was correlated with Al, Si, and Ti. No plant pathogens were significantly correlated with PM10 mass concentrations in winter. Table 2 also shows that in winter Enterobacter cloacae is strongly correlated with WD and Sphingomonas melonis with RH. Positive and strong/very strong correlations between plant pathogens and with human pathogens increased from winter to spring. Moreover, Table 2 shows that Sphingomonas melonis, Erwinia mallotivora, Pseudomonas viridiflava, and Agrobacterium larrymoorei were correlated in spring with some chemical components associated with a marine particle source, according to [14]. Rathayibacter tritici and Agrobacterium larrymoorei were instead associated with chemical components representative of soil dust source [14] in spring. Rathayibacter tritici is the only potential plant pathogen correlated with the PM10 mass concentration in spring. Five out of 10 plant pathogens were positively and significantly correlated in spring with meteorological parameters: Sphingomonas melonis and Clavibacter michiganensis were correlated with T, Janthinobacterium agaricidamnosum and Agrobacterium tumefaciens were correlated with WD, Curtobacterium flaccumfaciens, Clavibacter michiganensis, and Agrobacterium tumefaciens were correlated with WS. The long-distance dispersal of plant pathogens by the wind contributes to the spread of plant diseases across and even between continents and may re-establish diseases in areas where host plants are absent in some seasons [65]. Therefore, most relationships between potential plant pathogens, chemical components, and meteorological parameters vary from winter to spring (Table 2), as the RDA tri-plots also show (Figure S11a,b), even if some results are in contrast to those in Table 2. Note that the statistical indices AIC, AICc, and BIC (Table S7) also decreased from winter to spring, highlighting the larger statistical significance of the RDA results in spring. The larger number of the most abundant and pervasive potential plant pathogens identified in spring (10) than in winter (3) has likely contributed to this last result.

3.2.5. Analysis of the 10 Most Abundant and Pervasive Potential Non-Pathogenic Species in Winter and Spring

The mean percentage contributions of the 10 most abundant and pervasive potential non-pathogenic species in winter and spring are shown in Figures S12a and S13a, respectively. Other species represents the RA of all the other non-pathogenic species, whose contribution was as high as 31.69 and 60.70% in winter and spring, respectively, confirming the increase and the large variability of the bacterial species in spring. The RA-BCi,j matrix associated with the 10 most abundant and pervasive potential non-pathogenic species in winter and spring is shown in Table S10a,b, respectively. Figures S12b and S13b show the relative contribution of the most abundant and pervasive non-pathogenic species in the winter and spring PM10 samples, respectively, in addition to the corresponding RA-BCi,j dissimilarity dendrograms. Underlined non-pathogenic species in Figure S12a represent the four only found in winter. Bold-italics species in Figure S13a represent the four (out of 10) non-pathogenic species only found in spring. Calothrix parietina and Pseudomonas plecoglossicida were the first and the second most abundant non-pathogenic species in winter and in spring. Calothrix parietina was detected in all of the winter (Figure S12b) and spring (Figure S13b) samples.

3.2.6. Correlations between the Most Abundant and Pervasive Potential Non-Pathogenic Species, and with the Human and Plant Pathogens, PM10 and Chemical Component Mass Concentrations, and Meteorological Parameters

Table S11a,b provide the Spearman correlation coefficients between the 10 most abundant and pervasive potential non-pathogenic species (characterized by abundances not-normally distributed as reported in Table S5) and with the potential and most abundant and pervasive human and plant pathogens, PM10 and chemical component concentrations, and meteorological parameters in winter and spring, respectively. Table 3 summarizes their strong and very strong correlations. Most non-pathogenic species are inter-correlated and correlated with potential human and plant pathogens both in winter and in spring, even if some correlations vary from winter to spring. More specifically, Calothrix parietina, which was the most abundant potential non-pathogenic species in winter and spring, was only positively correlated with the human pathogen Peptococcus niger in winter, while in spring, it was correlated with the non-pathogenic species Thiomonas thermosulfata and Sphingomonas oligophenolica, the human pathogen Acinetobacter lwoffii, and the plant pathogen Erwinia mallotivora. Rather few correlations occurred in winter between the most abundant non-pathogenic species and the investigated chemical components and meteorological parameters. In particular, Table 3 shows that in winter Chryseobacterium hispanicum was correlated with Pb and P, while Bacillus badius was correlated with Na+, Mg2+, Cl, Al, Si, Ti, Br, and WS. Several potential non-pathogenic species were positively correlated with chemical components in spring, while Methylotenera mobilis (correlated with WS) and Rhodococcus ruber (correlated with RH) were the only potential non-pathogenic species correlated with meteorological parameters in spring.
The RDA tri-plots shown in Figure S14 also indicate that the correlations of non-pathogens with chemical components varied from (a) winter to (b) spring, although some results were in contrast with those from the Spearman coefficients reported in Table 3. Table S7 highlights the absence of relevant seasonal changes of the AIC, AICc, and BIC values, in accordance with the small seasonal change of the total variance explained by the two RDA axes.

3.3. Carriers of Potential Non-Pathogenic Species in Winter and Spring

Species–species interactions indicate the possibility of one bacterial species being found in or on another species (named “carrier”). The seasonal dependence of non-pathogen-carriers was analyzed to contribute to their characterization. We used the EID2 database, which provides a full list of species–species interactions. We restricted the analysis to the 122 and the 413 non-pathogenic species exclusively found in winter and spring, respectively, to better visualize the seasonal changes. The screening of our non-pathogenic database showed that 36 out of 122 (29%) and 92 out of 413 (22%) bacterial species were in common with the EID2 database. Therefore, the species–species interaction analysis was further restricted to the 36 and 92 non-pathogenic species detected in winter and spring, respectively, which are listed in Table S12a,b, respectively. Figure S15 shows the carrier contributions in (a) winter and in (b) spring. Non-pathogen-carriers showed some seasonal variations: Mollusca were detected as a carrier only in winter, while green algae, fungi, rodents, other plants, and reptiles were exclusively spring carriers and all the other carriers were common. Higher plant contribution increased from 15% in winter to 34% in spring, likely due to the spring growth of vegetation favoring their aerial dispersal. The contributions due to Cnidaria and fish, 8 and 14% in winter, respectively, decreased up to 1 and 6% in spring, respectively. This last result is likely due to the winter-to-spring decrease in the advection of aerosol and bioaerosols from the sea, as the winter-to-spring decrease in (Na+ + Cl) mass percentage from 15 to 5% also indicates (Table S3a,b). Although these last results were restricted to a small number of non-pathogens, they may indicate that seasonal changes of species-carriers may contribute to the seasonal dependence of the bacterial species RAs.

4. Conclusions

In this work, we provided a preliminary local database of airborne (human and plant) potential (opportunistic) pathogenic and non-pathogenic bacterial species in PM10 samples collected at a monitoring site in southeastern Italy. The 16S rRNA gene metabarcoding approach allowed for the detection of 1187 species. The comparison of the identified species-dataset with the corresponding ones from the NCBI revealed that only 366 bacterial species were common to the two datasets because of the high worldwide variability of bacterial species. The analysis of relationships between potential (opportunistic) pathogenic and non-pathogenic species with chemical components and meteorological parameters contributed to the characterization of the environmental parameters affecting the bacterial structure.
  • Sample chemical composition and bacterial community varied from winter to spring. In particular, the total number of detected bacterial species increased more than twice from winter to spring. The stagnant and more favorable atmospheric conditions in spring for the bacterial survival and long-distance aerial dispersal likely contributed to this result, in addition to the seasonal dependence of the bacterial species-carriers.
  • The number of strong relationships between potential (human and plant) pathogens and non-pathogens, chemical components, and meteorological parameters increased slightly from winter to spring, according to the Spearman coefficients.
  • Rather few potential (opportunistic) human pathogens were significantly correlated with meteorological parameters. Conversely, many potential plant pathogens were strongly and positively correlated with wind direction and speed in winter and spring, suggesting that the dispersal of plant pathogens by the wind may likely contribute to the spreading of plant diseases.
  • In winter, some potential human pathogens were correlated with chemical components that are tracers of marine and soil dust/mixed anthropogenic sources. Conversely, in spring, some potential human pathogens were mainly correlated with chemical components considered as marine aerosol tracers.
  • We found that potential plant pathogens were not correlated among them in winter and that Enterobacter cloacae was the only plant pathogen significantly and positively correlated with the identified potential human pathogens. Few positive and significant correlations occurred between the plant pathogens and chemical component mass concentrations.
Most chemical components correlated with bacterial species were also tracers of the bacteria main habitats as well as being essential for the structure and metabolism of all living cells. Hence, airborne living beings caught by the sampling filters may also have contributed to the PM chemical components. The weak knowledge of the latter contributions may limit the understanding of the relationships between pollution and bacterial community.
In conclusion, besides providing a preliminary database of airborne potential (opportunistic human and plant) pathogenic and non-pathogenic species representative of a central Mediterranean coastal site, our paper also investigated their inter-relationships and those with chemical components and meteorological parameters. The reported pilot study and its results could be of large interest since they contribute to the characterization of the main Mediterranean potential (opportunistic) pathogens, and hence to the studies required for the detection of potential epidemics due to airborne pathogens. Moreover, the deduced local dataset could be a starting point for setting up a culture-based approach aimed at targeted isolation of presumptive pathogenic bacterial strains and at in vitro and in vivo virulence analyses.

Supplementary Materials

The following are available online at https://0-www-mdpi-com.brum.beds.ac.uk/article/10.3390/atmos12050654/s1, Figure S1: Geographical location of the monitoring site; Figure S2: Heat maps of bacterial species abundances; Figure S3: Heat maps of potential human pathogenic species abundances; Figure S4: Heat maps of potential plant pathogenic species abundances; Figure S5: Heat maps of potential non-pathogenic species abundances; Figure S6: Contribution of potential plant pathogenic, human pathogenic, non-pathogenic, and unclassified bacterial species; Figure S7: Contribution and Bray–Curtis dissimilarity dendrograms of chemical species; Figure S8: Contribution and Bray–Curtis dissimilarity dendrograms of potential and pervasive human pathogenic species; Figure S9: Redundancy discriminant analysis ordination plot of potential and pervasive human pathogenic species; Figure S10: Contribution and Bray–Curtis dissimilarity dendrograms of potential and pervasive plant pathogenic species; Figure S11: Redundancy discriminant analysis ordination plot of potential and pervasive plant pathogenic species; Figure S12: Contribution and Bray-Curtis dissimilarity dendrograms of potential and pervasive winter non-pathogenic species; Figure S13: Contribution and Bray–Curtis dissimilarity dendrograms of potential and pervasive spring non-pathogenic species; Figure S14: Redundancy discriminant analysis ordination plot of potential and pervasive non-pathogenic species; Figure S15: EID2 carrier contribution of potential non-pathogenic species; Table S1: PM10 concentration and number of OTUs, phyla, orders, genera, and species; Table S2: Bray–Curtis dissimilarity matrix for winter and spring samples; Table S3: Chemical species mass concentrations; Table S4: Bray–Curtis dissimilarity matrix for the most abundant potential and pervasive human pathogens; Table S5: Results from the Kolmogorov–Smirnov test for potential and pervasive pathogens and non-pathogens, PM10 concentration, and meteorological parameters; Table S6: Spearman correlation coefficient matrix for the most abundant potential and pervasive human pathogens; Table S7: AIC, AICc, and BIC values based on RDA analyses of potential and pervasive human, plant, and non-pathogens, and chemical species; Table S8: Bray–Curtis dissimilarity matrix for the most abundant potential and pervasive plant pathogens; Table S9: Spearman correlation coefficient matrix for the most abundant potential and pervasive plant pathogens; Table S10: Bray–Curtis dissimilarity matrix for most abundant potential and pervasive non-pathogenic species; Table S11: Spearman correlation coefficient matrix for the most abundant potential and pervasive non-pathogenic species; Table S12: EID2 carriers of non-pathogenic species.

Author Contributions

Conceptualization, S.R., M.R.P., and A.T.; Methodology, S.R., M.R.P., and A.T.; Software, S.R. and M.F.; Validation, S.R., M.R.P., and A.T.; Formal analysis, S.R. and M.F.; Investigation, S.R., M.F., M.R.P., and A.T.; Data curation, S.R. and M.F.; Writing—original draft preparation, S.R. and M.R.P.; Writing—review and editing, S.R. and M.R.P.; Supervision, P.A., M.R.P., and A.T.; Funding acquisition, S.R. and M.R.P. All authors have read and agreed to the published version of the manuscript.

Funding

The work was partially supported by the INFN (Istituto Nazionale Fisica Nucleare) of Italy, in the framework of the project IS-ABS (Integrated System for Aerosol and Bioaerosol Studies at the Pierre Auger Observatory), and by the Project PER-ACTRIS-IT Enhancement of the Italian Component of the Aerosol, Clouds, and Trace Gases Research InfraStructure (PIR01_00015).

Institutional Review Board Statement

Not applicable.

Informed Consent Statement

Not applicable.

Data Availability Statement

The authors declare that all the used data have been reported in the Supplementary Material.

Acknowledgments

S. Romano carried out this work with the support of a Temporary Researcher position financed by the Italian “Programma Operativo Nazionale (PON) Ricerca e Innovazione 2014–2020 (Azione I.2-Attrazione e Mobilità dei Ricercatori)”. M. Fragola carried out this work with the support of a PhD fellowship from Regione Puglia (FSE-2020). S. Becagli from the Department of Chemistry and F. Lucarelli from the Department of Physics, both of the University of Florence, Sesto Fiorentino (Italy), who performed the ion chromatography and metal analyses of the PM10 samples, respectively, are kindly acknowledged.

Conflicts of Interest

The authors declare no conflict of interest.

References

  1. Lelieveld, J.; Evans, J.S.; Fnais, M.; Giannadaki, D.; Pozzer, A. The Contribution of Outdoor Air Pollution Sources to Premature Mortality on a Global Scale. Nature 2015, 525, 367–371. [Google Scholar] [CrossRef]
  2. Wardeh, M.; Risley, C.; McIntyre, M.; Setzkorn, C.; Baylis, M. Database of host-pathogen and related species interactions, and their global distribution. Sci. Data 2015, 2, 150049. [Google Scholar] [CrossRef] [Green Version]
  3. Be, N.A.; Thissen, J.B.; Fofanov, V.Y.; Allen, J.E.; Rojas, M.; Golovko, G.; Fofanov, Y.; Koshinsky, H.; Jaing, C.J. Metagenomic Analysis of the Airborne Environment in Urban Spaces. Microb. Ecol. 2015, 69, 346–355. [Google Scholar] [CrossRef] [Green Version]
  4. Fröhlich-Nowoisky, J.; Kampf, C.J.; Weber, B.; Huffman, J.A.; Pöhlker, C.; Andreae, M.O.; Lang-Yona, N.; Burrows, S.M.; Gunthe, S.S.; Elbert, W.; et al. Bioaerosols in the earth system: Climate, health, and ecosystem interactions. Atmos. Res. 2016, 182, 346–376. [Google Scholar] [CrossRef] [Green Version]
  5. Liu, H.; Zhang, X.; Zhang, H.; Yao, X.; Zhou, M.; Wang, J.; He, Z.; Zhang, H.; Lou, L.; Mao, W.; et al. Effect of air pollution on the total bacteria and pathogenic bacteria in different sizes of particulate matter. Environ. Pollut. 2018, 233, 483–493. [Google Scholar] [CrossRef]
  6. Fan, C.; Li, Y.; Liu, P.; Mu, F.; Xie, Z.; Lu, R.; Qi, Y.; Wang, B.; Jin, C. Characteristics of airborne opportunistic bacteria during autumn and winter in Xi’an, China. Sci. Total. Environ. 2019, 672, 834–845. [Google Scholar] [CrossRef] [PubMed]
  7. Chen, X.; Kumari, D.; Achal, V. A Review on Airborne Microbes: The Characteristics of Sources, Pathogenicity and Geography. Atmosphere 2020, 11, 919. [Google Scholar] [CrossRef]
  8. Aylor, D.E. Spread of plant disease on a continental scale: Role of aerial dispersal of pathogens. Ecology 2003, 84, 1989–1997. [Google Scholar] [CrossRef]
  9. Van Leuken, J.P.G.; Swart, A.N.; Havelaar, A.H.; Van Pul, A.; Van der Hoek, W.; Heederik, D. Atmospheric dispersion modelling of bioaerosols that are pathogenic to humans and livestock—A review to inform risk assessment studies. Microb. Risk Analysis 2016, 1, 19–39. [Google Scholar]
  10. Kallos, G.; Astitha, M.; Katsafados, P.; Spyrou, C. Long-range transport of anthropogenically and naturally produced particulate matter in the Mediterranean and North Atlantic: Current state of knowledge. J. Appl. Meteorol. Climatol. 2007, 46, 1230–1251. [Google Scholar] [CrossRef] [Green Version]
  11. Maheras, P.; Xoplaki, E.; Davies, T.; Martin-Vide, J.; Bariendos, M.; Alcoforado, M.J. Warm and cold monthly anomalies across the Mediterranean basin and their relationship with circulation; 1860–1990. Int. J. Climatol. 1999, 19, 1697–1715. [Google Scholar] [CrossRef]
  12. Perrone, M.R.; Romano, S. Relationship between the planetary boundary layer height and the particle scattering coefficient at the surface. Atmos. Res. 2018, 213, 57–69. [Google Scholar] [CrossRef]
  13. Perrone, M.R.; Bertoli, I.; Romano, S.; Russo, M.; Rispoli, G.; Pietrogrande, M.C. PM2.5 and PM10 oxidative potential at a Central Mediterranean Site: Contrasts between dithiothreitol- and ascorbic acid-measured values in relation with particle size and chemical composition. Atmos. Environ. 2019, 210, 143–155. [Google Scholar] [CrossRef]
  14. Perrone, M.R.; Vecchi, R.; Romano, S.; Becagli, S.; Traversi, R.; Paladini, F. Weekly cycle assessment of PM mass concentrations and sources, and impacts on temperature and wind speed in Southern Italy. Atmos. Res. 2019, 218, 129–144. [Google Scholar] [CrossRef]
  15. Romano, S.; Di Salvo, M.; Rispoli, G.; Alifano, P.; Perrone, M.R.; Talà, A. Airborne Bacteria in the Central Mediterranean: Structure and role of meteorology and air mass transport. Sci. Total. Environ. 2019, 697, 134020. [Google Scholar] [CrossRef]
  16. Romano, S.; Becagli, S.; Lucarelli, F.; Rispoli, G.; Perrone, M.R. Airborne Bacteria Structure and Chemical Composition Relationships in Winter and Spring PM10 Samples over Southeastern Italy. Sci. Total Environ. 2020, 730, 138899. [Google Scholar] [CrossRef]
  17. Perrone, M.; Becagli, S.; Garcia Orza, J.A.G.; Vecchi, R.; Dinoi, A.; Udisti, R.; Cabello, M. The impact of long-range-transport on PM1 and PM2.5 at a Central Mediterranean site. Atmos. Environ. 2013, 71, 176–186. [Google Scholar] [CrossRef]
  18. Mykytczuk, N.C.; Wilhelm, R.C.; Whyte, L.G. Planococcus halocryophilus sp. nov., an extreme sub-zero species from high Arctic permafrost. Int. J. Syst. Evol. Microbiol. 2012, 62, 1937–1944. [Google Scholar] [CrossRef] [Green Version]
  19. Becagli, S.; Anello, F.; Bommarito, C.; Cassola, F.; Calzolai, G.; Di Iorio, T.; di Sarra, A.; Gómez-Amo, J.-L.; Lucarelli, F.; Marconi, M.; et al. Constraining the ship contribution to the aerosol of the central Mediterranean. Atmos. Chem. Phys. 2017, 17, 2067–2084. [Google Scholar] [CrossRef] [Green Version]
  20. Cavalli, F.; Viana, M.; Yttri, K.; Genberg, J.; Putaud, J. Toward a standardized thermal-optical protocol for measuring atmospheric organic and elemental carbon: The EUSAAR protocol. Atmos. Meas. Tech. 2010, 3, 79–89. [Google Scholar] [CrossRef] [Green Version]
  21. Lucarelli, F.; Nava, S.; Calzolai, G.; Chiari, M.; Udisti, R.; Marino, F. Is PIXE still a useful technique for the analysis of atmospheric aerosols? The LABEC experience. X-Ray Spectrom. 2011, 40, 162–167. [Google Scholar] [CrossRef]
  22. Wang, Q.; Garrity, G.M.; Tiedje, J.M.; Cole, J.R. Naive Bayesian classifier for rapid assignment of rRNA sequences into the new bacterial taxonomy. Appl. Environ. Microb. 2007, 73, 5261e5267. [Google Scholar] [CrossRef] [PubMed] [Green Version]
  23. Werner, J.J.; Koren, O.; Hugenholtz, P.; DeSantis, T.Z.; Walters, W.A.; Caporaso, J.G.; Angenent, L.T.; Knight, R.; Ley, R.E. Impact of training sets on classification of high-throughput bacterial 16s rRNA gene surveys. ISME J. 2012, 6, 94–103. [Google Scholar] [CrossRef] [Green Version]
  24. Roura, A.; Doyle, S.R.; Nande, M.; Strugnell, J.M. You are what you eat: A genomic analysis of the gut microbiome of captive and wild Octopus vulgaris paralarvae and their zooplankton prey. Front. Physiol. 2017, 31, 362. [Google Scholar] [CrossRef] [Green Version]
  25. Ghaju Shrestha, R.; Tanaka, Y.; Malla, B.; Bhandari, D.; Tandukar, S.; Inoue, D.; Sei, K.; Sherchand, J.B.; Haramoto, E. Next-generation sequencing identification of pathogenic bacterial genes and their relationship with fecal indicator bacteria in different water sources in the Kathmandu Valley, Nepal. Sci. Total Environ. 2017, 1, 278–284. [Google Scholar] [CrossRef]
  26. Hugon, P.; Dufour, J.C.; Colson, P.; Fournier, P.E.; Sallah, K.; Raoult, D. A comprehensive repertoire of prokaryotic species identified in human beings. Lancet Infect. Dis. 2015, 15, 1211–1219. [Google Scholar] [CrossRef]
  27. Bull, C.T.; de Boer, S.H.; Denny, T.P.; Firrao, G.; Fischer-Le Saux, M.; Saddler, G.S.; Scortichini, M.; Stead, D.E.; Takikawa, Y. Comprehensive list of names of plant pathogenic bacteria, 1980–2007. Plant. Pathol. J. 2010, 92, 551–592. [Google Scholar]
  28. Bibby, K.; Viau, E.; Peccia, J. Pyrosequencing of the 16S rRNA gene to reveal bacterial pathogen diversity in biosolids. Water Res. 2010, 44, 4252–4260. [Google Scholar] [CrossRef]
  29. Guo, F.; Zhang, T. Profiling bulking and foaming bacteria in activated sludge by high throughput sequencing. Water Res. 2012, 46, 2772–2782. [Google Scholar] [CrossRef]
  30. Quast, C.; Pruesse, E.; Yilmaz, P.; Gerken, J.; Schweer, T. The SILVA ribosomal RNA gene database project: Improved data processing and web-based tools. Nucleic Acids Res. 2013, 41, 590–596. [Google Scholar] [CrossRef] [PubMed]
  31. Ye, L.; Zhang, T. Pathogenic bacteria in sewage treatment plants as revealed by 454 pyrosequencing. Environ. Sci. Technol. 2011, 45, 7173–7179. [Google Scholar] [CrossRef]
  32. Hammer, O.; Harper, D.A.T.; Ryan, P.D. PAST: Paleontological Statistics Software Package for Education and Data Analysis. Palaeontol. Electron. 2001, 4, 9. [Google Scholar]
  33. Sulaymon, I.D.; Zhang, Y.; Hopke, P.K.; Zhang, Y.; Hua, J.; Mei, X. COVID-19 pandemic in Wuhan: Ambient air quality and the relationships between criteria air pollutants and meteorological variables before, during, and after lockdown. Atmos. Res. 2021, 250, 105362. [Google Scholar] [CrossRef]
  34. Zuur, A.F.; Ieno, E.N.; Smith, G.M. Analysing Ecological Data. In Statistics for Biology and Health; Springer: New York, NY, USA, 2007. [Google Scholar]
  35. Romano, S.; Becagli, S.; Lucarelli, F.; Russo, M.; Pietrogrande, M.C. Oxidative Potential Sensitivity to Metals, Br, P, S, and Se in PM10 Samples: New Insights from a Monitoring Campaign in Southeastern Italy. Atmosphere 2020, 11, 367. [Google Scholar] [CrossRef] [Green Version]
  36. Van den Wollenberg, A.L. Redundancy analysis an alternative for canonical correlation analysis. Psychometrika 1977, 42, 207–219. [Google Scholar] [CrossRef]
  37. Paliy, O.; Shankar, V. Application of multivariate statistical techniques in microbial ecology. Mol. Ecol. 2016, 25, 1032–1057. [Google Scholar] [CrossRef] [Green Version]
  38. Hervé, M.R.; Nicolè, F.; Lê Cao, K.A. Multivariate Analysis of Multiple Datasets: A Practical Guide for Chemical Ecology. J. Chem. Ecol. 2018, 44, 215–234. [Google Scholar] [CrossRef] [PubMed]
  39. Jones, D.L. Fathom Toolbox for MATLAB: Software for Multivariate Ecological and Oceanographic Data Analysis; College of Marine Science, University of South Florida: St. Petersburg, FL, USA, 2017; Available online: https://www.marine.usf.edu/research/matlab-resources/ (accessed on 26 April 2021).
  40. Sun, Y.; Xu, S.; Zheng, D.; Li, J.; Tian, H.; Wang, Y. Effects of haze pollution on microbial community changes and correlation with chemical components in atmospheric particulate matter. Sci. Total Environ. 2018, 637–638, 507–516. [Google Scholar] [CrossRef]
  41. Angeler, D.G.; Viedma, O.; Moreno, J.M. Statistical performance and information content of time lag analysis and redundancy analysis in time series modeling. Ecology 2009, 90, 3245–3257. [Google Scholar] [CrossRef] [PubMed]
  42. Warton, D.I. Many zeros does not mean zero inflation: Comparing the goodness-of-fit of parametric models to multivariate abundance data. Environmetrics 2005, 16, 275–289. [Google Scholar] [CrossRef]
  43. Herliansyah, R.; Fitria, I. Latent variable models for multi-species counts modeling in ecology. Biodiversitas 2018, 19, 1871–1876. [Google Scholar] [CrossRef]
  44. Caraka, R.E.; Chen, R.C.; Lee, Y.; Toharudin, T.; Rahmadi, C.; Tahmid, M.; Achmadi, A.S. Using multivariate generalized linear latent variable models to measure the difference in event count for stranded marine animals. Global J. Environ. Sci. Manag. 2021, 7, 117–130. [Google Scholar]
  45. Han, D.; Zhang, C.; Wang, C.; She, J.; Sun, Z.; Zhao, D.; Bian, Q.; Han, W.; Yin, L.; Sun, R.; et al. Differences in Response of Butterfly Diversity and Species Composition in Urban Parks to Land Cover and Local Habitat Variables. Forests 2021, 12, 140. [Google Scholar] [CrossRef]
  46. Edgar, R.C. UPARSE: Highly accurate OTU sequences from microbial amplicon reads. Nat. Methods 2013, 10, 996–998. [Google Scholar] [CrossRef]
  47. Hughes, D.D.; Mampage, C.B.A.; Jones, L.M.; Liu, Z.; Stone, E.A. Characterization of Atmospheric Pollen Fragments during Springtime Thunderstorms. Environ. Sci. Technol. Lett. 2020, 7, 409–414. [Google Scholar] [CrossRef]
  48. Ouyang, W.; Gao, B.; Cheng, H.; Zhang, L.; Wang, Y.; Lin, C.; Chen, J. Airborne bacterial communities and antibiotic gene dynamics in PM2.5 during rainfall. Environ. Int. 2020, 134, 105318. [Google Scholar] [CrossRef]
  49. Burrows, S.M.; Butler, T.; Jöckel, P.; Tost, H.; Kerkweg, A.; Pöschl, U.; Lawrence, M.G. Bacteria in the global atmosphere—Part 2: Modeling of emissions and transport between different ecosystems. Atmos. Chem. Phys. 2009, 9, 9281–9297. [Google Scholar] [CrossRef] [Green Version]
  50. Halda-Alija, L.; Hendricks, S.P.; Johnston, T.C. Spatial and temporal variation of Enterobacter genotypes in sediments and the underlying hyporheic zone of an agricultural stream. Microb. Ecol. 2001, 42, 286–294. [Google Scholar] [CrossRef] [PubMed]
  51. Paauw, A.; Caspers, M.P.; Leverstein-van Hall, M.A.; Schuren, F.H.; Montijn, R.C.; Verhoef, J.; Fluit, A.C. Identification of resistance and virulence factors in an epidemic Enterobacter hormaechei outbreak strain. Microbiology 2009, 155, 1478–1488. [Google Scholar] [CrossRef] [PubMed] [Green Version]
  52. Dessinioti, C.; Katsambas, A.D. The role of Propionibacterium acnes in acne pathogenesis: Facts and controversies. Clin. Dermatol. 2010, 28, 2–7. [Google Scholar] [CrossRef]
  53. McDowell, A.; Nagy, I.; Magyari, M.; Barnard, E.; Patrick, S. The Opportunistic Pathogen Propionibacterium acnes: Insights into Typing, Human Disease, Clonal Diversification and CAMP Factor Evolution. PLoS ONE 2013, 8, e70897. [Google Scholar] [CrossRef] [PubMed] [Green Version]
  54. Zeller, V.; Ghorbani, A.; Strady, C.; Leonard, P.; Mamoudy, P.; Desplaces, N. Propionibacterium acnes: An agent of prosthetic joint infection and colonization. J. Infect. 2007, 55, 119–124. [Google Scholar] [CrossRef]
  55. Murdoch, D.A. Gram-positive anaerobic cocci. Clin. Microbiol. Rev. 1998, 11, 81–120. [Google Scholar] [CrossRef] [PubMed] [Green Version]
  56. Polymenakou, P.N.; Mandalakis, M.; Stephanou, E.G.; Tselepides, A. Particle size distribution of airborne microorganisms and pathogens during an intense African dust event in the Eastern Mediterranean. Environ. Health Persp. 2008, 116, 292–296. [Google Scholar] [CrossRef] [PubMed] [Green Version]
  57. Mazar, Y.; Cytryn, E.; Erel, Y.; Rudich, Y. Effect of dust storms on the atmospheric microbiome in the Eastern Mediterranean. Environ. Sci. Technol. 2016, 50, 4194–4202. [Google Scholar] [CrossRef]
  58. Gat, D.; Mazar, Y.; Cytryn, E.; Rudich, Y. Origin-dependent variations in the atmospheric microbiome community in Eastern Mediterranean Dust Storms. Environ. Sci. Technol. 2017, 51, 6709–6718. [Google Scholar] [CrossRef]
  59. Romano, S.; Vecchi, R.; Perrone, M.R. Intensive optical parameters of pollution sources identified by the positive matrix factorization technique. Atmos. Res. 2020, 244, 105029. [Google Scholar] [CrossRef]
  60. Du, P.; Du, R.; Ren, W.; Lu, Z.; Zhang, Y.; Fu, P. Variations of bacteria and fungi in PM2.5 in Beijing, China. Atmos. Environ. 2018, 172, 55–64. [Google Scholar] [CrossRef]
  61. Perrone, M.R.; Romano, S.; Orza, J.A.G. Columnar and ground-level aerosol optical properties: Sensitivity to the transboundary pollution, daily and weekly patterns, and relationships. Environ. Sci. Pollut. R. 2015, 22, 16570–16589. [Google Scholar] [CrossRef]
  62. Hettema, J.M.; Prescott, C.A.; Kendler, K.S. Genetic and Environmental Sources of Covariation between Generalized Anxiety Disorder and Neuroticism. Am. J. Psychiatry 2004, 161, 1581–1587. [Google Scholar] [CrossRef]
  63. Bartoli, C.; Lamichhane, J.R.; Berge, O.; Varvaro, L.; Morris, C.E. Mutability in Pseudomonas viridiflava as a programmed balance between antibiotic resistance and pathogenicity. Mol. Plant. Pathol. 2015, 16, 860–869. [Google Scholar] [CrossRef] [PubMed]
  64. Balestra, G.M.; Mazzaglia, A.; Rossetti, A. Outbreak of bacterial blossom blight caused by Pseudomonas viridiflava on Actinidia chinensis kiwifruit plants in Italy. Plant. Dis. 2008, 92, 1707. [Google Scholar] [CrossRef] [PubMed]
  65. Brown, J.K.M.; Hovmoller, M.S. Aerial dispersal of pathogens on the global and continental scales and its impact on plant desease. Science 2002, 297, 537–541. [Google Scholar] [CrossRef] [PubMed] [Green Version]
Figure 1. Relative percentage contribution of the overall amount of the 27 potential plant pathogenic species, 76 potential human pathogenic species, 1084 potential non-pathogenic species, and unclassified species in (a) winter (S1–S10) and (b) spring (S11–S20) samples. Bray–Curtis dissimilarity dendrograms highlighting the relatedness of the species-level bacterial communities in (a) winter and (b) spring samples have also been reported.
Atmosphere 12 00654 g001
Figure 2. Mean percentage contribution (on a logarithmic scale) of the 10 most abundant potential and pervasive human pathogenic species in (a) winter and (b) spring: Sphingobacterium multivorum (S. multivorum), Johnsonella ignava (J. ignava), Streptococcus bovis (S. bovis), Staphylococcus aureus (S. aureus), Clostridium cadaveris (C. cadaveris), Peptococcus niger (P. niger), Propionibacterium avidum (P. avidum), Propionibacterium acnes (P. acnes), Providencia rettgeri (P. rettgeri), Acinetobacter lwoffii (A. lwoffii), Acinetobacter ursingii (A. ursingii), Acinetobacter johnsonii (A. johnsonii), Enterobacter aerogenes (E. aerogenes), Enterobacter amnigenus (E. amnigenus), and Enterobacter hormaechei (E. hormaechei). Error bars represent the standard error of the mean. Phyla related to each species are also reported on the left (Prot.: Proteobacteria, Actin.: Actinobacteria, Firm.: Firmicutes, Bact.: Bacteroidetes).
Atmosphere 12 00654 g002
Figure 3. Mean percentage contribution (on a logarithmic scale) of the most abundant potential and pervasive plant pathogenic species in (a) winter and (b) spring: Bacillus megaterium (B. megaterium), Rathayibacter tritici (R. tritici), Clavibacter michiganensis (C. michiganensis), Curtobacterium flaccumfaciens (C. flaccumfaciens), Agrobacterium larrymoorei (A. larrymoorei), Erwinia mallotivora (E. mallotivora), Janthinobacterium agaricidamnosum (J. agaricidamnosum), Sphingomonas melonis (S. melonis), Pseudomonas viridiflava (P. viridiflava), and Enterobacter cloacae (E. cloacae). Error bars represent the standard error of the mean. Phyla related to each species are also reported on the left (Prot.: Proteobacteria, Actin.: Actinobacteria, Firm.: Firmicutes).
Atmosphere 12 00654 g003
Table 1. Relationships between the 10 most abundant potential and pervasive human pathogens (blue) and with PM10 (grey) and chemical species (pink) mass concentrations, and meteorological parameters (black) in winter and spring samples. The related Spearman correlation coefficient is reported in brackets (values significant at a p-level < 0.05 and 0.01 are marked by * and **, respectively). Underlined and bold-italic species represent the ones only found in winter and spring, respectively.
Potential Human PathogensSpearman Correlation Coefficients
WinterSpring
Enterobacter hormaecheiEnterobacter amnigenus (0.95 **)Enterobacter amnigenus (0.79 **),
Cr (0.74 *)
Enterobacter amnigenusEnterobacter hormaechei (0.95 **)Enterobacter hormaechei (0.79 **)
Enterobacter aerogenesAcinetobacter ursingii (0.75 *), NH4+(0.71 *)
Acinetobacter johnsoniiAcinetobacter ursingii (0.72 *), NH4+ (0.68 *), S (0.67 *)
Acinetobacter ursingiiAcinetobacter johnsonii (0.72 *), Enterobacter aerogenes (0.75 *)
Acinetobacter lwoffii
Providencia rettgeri
Propionibacterium acnesZn (0.68 *)Propionibacterium avidum (0.93 **), Mg2+ (0.67*), MS (0.74 *), Mo (0.74 *), Sr (0.66 *)
Propionibacterium avidum Propionibacterium acnes (0.93 **), Clostridium cadaveris (0.71 *), MS (0.70 *), Sr (0.83 **)
Peptococcus nigerNa+ (0.66 *), T (0.70 *)
Clostridium cadaverisPM10 (0.82 **), As (0.75 *), Pb (0.67 *)Streptococcus bovis (0.68 *), Propionibacterium avidum (0.71 *), Johnsonella ignava (0.87 **), MS (0.66 *), V(0.68 *), Ca (0.67 *), Sr (0.72 *)
Staphylococcus aureus
Streptococcus bovis Clostridium cadaveris (0.68 *), Johnsonella ignava (0.77 **)
Johnsonella ignava Clostridium cadaveris (0.87 **), Streptococcus bovis (0.77 **), PM10 (0.63 *), Ni (0.63 *), V (0.77 **), Ca (0.65 *),
Sr (0.70 *)
Sphingobacterium multivorum
Table 2. Relationships between the most abundant potential and pervasive plant pathogens (green) and with the most abundant and pervasive potential human pathogens (blue), the PM10 (grey) and chemical species (pink) mass concentrations, and meteorological parameters (black) in the winter and spring samples. The related Spearman correlation coefficient is reported in brackets (values significant at a p-level < 0.05 and 0.01 are marked by * and **, respectively). Underlined and bold-italic species represent the ones only found in winter and spring, respectively.
Potential Plant PathogensSpearman Correlation Coefficients
WinterSpring
Enterobacter cloacaeEnterobacter aerogenes (0.95 **), Acinetobacter johnsonii (0.65 *), Acinetobacter ursingii (0.85 **), NH4+ (0.65 *), WD (0.75 *)
Pseudomonas viridiflava Na+ (0.73 *), Cl (0.75 *)
Sphingomonas melonisAl (0.65 *), Si (0.65 *), Ti (0.69 *),
RH (0.67 *)
Clavibacter michiganensis (0.67 *), Mg2+ (0.79 **), T (0.64 *)
Janthinobacterium agaricidamnosum WD (0.64 *)
Erwinia mallotivora Agrobacterium larrymoorei (0.67 *), Streptococcus bovis (0.74 *), Acinetobacter lwoffii (0.78 **), Cl (0.75 *)
Agrobacterium tumefaciens Rathayibacter tritici (0.65 *), Propionibacterium acnes (0.63 *), Ni (0.66 *),V (0.78 **), WD (0.64 *), WS (0.64 *)
Agrobacterium larrymoorei Erwinia mallotivora (0.67 *), Propionibacterium avidum (0.68 *), Streptococcus bovis (0.70 *), Na+ (0.69 *), Cl (0.75 *), NO3 (0.72 *), Mo (0.69 *)
Curtobacterium flaccumfaciens Clavibacter michiganensis (0.77 **), Propionibacterium avidum (0.70 *), WS (0.71 *)
Clavibacter michiganensis Curtobacterium flaccumfaciens (0.77 **), Sphingomonas melonis (0.67 *), T (0.65 *), WS (0.69 *)
Rathayibacter tritici Agrobacterium tumefaciens (0.65 *), Propionibacterium acnes (0.66 *), Clostridium cadaveris (0.83 **), Streptococcus bovis (0.65 *), Propionibacterium avidum (0.73 *), Johnsonella ignava (0.89 **), PM10 (0.72 *), MS (0.71 *), Ni (0.80 **), V (0.91 **), Al (0.68 *), Si (0.71 *), Ca (0.70 *), Ti (0.69 *),Fe (0.68 *), Rb (0.66 *), Sr (0.77 **)
Bacillus megaterium
Table 3. Relationships between the 10 most abundant potential and pervasive non-pathogens (ochre) and with the 10 most abundant potential and pervasive human pathogens (blue), the most abundant and pervasive plant pathogens (green), PM10 (grey) and chemical species (pink) mass concentrations, and meteorological parameters (black) in winter and spring samples. The related Spearman correlation coefficient is reported in brackets (values significant at a p-level < 0.05 and 0.01 are marked by * and **, respectively). Underlined and bold-italic species represent the ones only found in winter and spring, respectively.
Potential Non-Pathogenic SpeciesSpearman Correlation Coefficients
WinterSpring
Calothrix parietinaPeptococcus niger (0.89 **)Thiomonas thermosulfata (0.78 **), Sphingomonas oligophenolica (0.75 *), Acinetobacter lwoffii (0.66 *), Erwinia mallotivora (0.73 *)
Pseudomonas plecoglossicidaPseudomonas entomophila (0.96 **), Arthrospira fusiformis (0.85 **), Pseudomonas putida (0.93 **), Enterobacter aerogenes (0.70 *) Pseudomonas entomophila (0.82 **), Enterobacter aerogenes (0.80 **), Cd (0.70 *), Cr (0.72 *)
Stenotrophomonas geniculataStaphylococcus aureus (0.71 *)
Hyphomicrobium zavarziniiRhodococcus ruber (0.93 **)Rhodococcus ruber (0.90 **)
Pseudomonas entomophilaPseudomonas plecoglossicida (0.96 **), Arthrospira fusiformis (0.93 **), Chryseobacterium hispanicum (0.75 *), Pseudomonas putida (0.85 **), Acinetobacter johnsonii (0.63 *), Enterobacter aerogenes (0.80 **), Enterobacter cloacae (0.77 **)
Thiomonas thermosulfata Calothrix parietina (0.78 **), Sphingomonas oligophenolica (0.79 **), Propionibacterium acnes (0.78 **), Propionibacterium avidum (0.71 *), Mg2+ (0.79 **), Sr (0.66 *)
Methylotenera mobilis Clavibacter michiganensis (0.68 *), Mg2+ (0.70 *),
Mo (0.69 *), Br (0.77 **), WS (0.65 *)
Sphingomonas oligophenolica Calothrix parietina (0.75 *), Thiomonas thermosulfata
(0.79 **), Streptococcus bovis (0.84 **), Acinetobacter lwoffii (0.64 *), Johnsonella ignava (0.77 **), Erwinia mallotivora
(0.66 *), Rathayibacter tritici (0.71 *), Sr (0.65 *)
Arthrospira fusiformisPseudomonas plecoglossicida (0.85 **), Pseudomonas entomophila (0.93 **), Chryseobacterium hispanicum (0.90 **), Pseudomonas putida (0.73 *), Acinetobacter ursingii (0.77 **), Enterobacter aerogenes (0.87 **), Enterobacter cloacae (0.86 **)Chryseobacterium hispanicum (0.90 **), Ba (0.82 **)
Chryseobacterium hispanicumPseudomonas entomophila (0.75 **), Arthrospira fusiformis (0.90 **), Acinetobacter johnsonii (0.67 *), Acinetobacter ursingii (0.89**), Enterobacter aerogenes (0.93 **), Enterobacter cloacae (0.93 **), Pb (0.65 *), P (0.64 *) Arthrospira fusiformis (0.90 **), Ba (0.79 **), Cr (0.70 *)
Pseudomonas putidaPseudomonas plecoglossicida (0.93 **), Pseudomonas entomophila (0.85 **), Arthrospira fusiformis (0.73 *), Enterobacter hormaechei (0.79 **), Enterobacter amnigenus (0.68 *)
Rhodococcus ruberHyphomicrobium zavarzinii (0.93 **)Hyphomicrobium zavarzinii (0.90 **), RH (0.74 *)
Bacillus badiusSphingomonas melonis (0.71 *), Na+ (0.85 **), Mg2+ (0.78 **), Cl (0.84 **), Al (0.86 **),Si(0.86 **), Ti(0.83 **), Br (0.67 *), WS (0.72 *)
Bacillus aryabhattai Bacillus megaterium (0.83 **)
Publisher’s Note: MDPI stays neutral with regard to jurisdictional claims in published maps and institutional affiliations.

