Article

Concentration and Physical Characteristics of Black Carbon in Winter Snow of Beijing in 2015

1
Beijing Weather Modification Office, Beijing 100089, China
2
Beijing Key Laboratory of Cloud, Precipitation and Atmospheric Water Resources, Beijing 100089, China
3
Field Experiment Base of Cloud and Precipitation Research in North China, China Meteorological Administration, Beijing 101299, China
*
Author to whom correspondence should be addressed.
Submission received: 16 May 2021 / Revised: 15 June 2021 / Accepted: 22 June 2021 / Published: 25 June 2021

Abstract

:
In Beijing, the probability of snowfall is decreasing as a result of global warming. At the same time, Beijing has suffered severe air pollution. In this paper, the concentration and particle size characteristics of BC (Black Carbon) in snow during the winter of 2015 in Beijing were analyzed by the SP2 method. The average concentration of BC in snow meltwater in Beijing is 82 ng/mL, with a minimum value of 62.9 ng/mL and a maximum of 210.6 ng/mL. The BC particle size in snow and ice in the Beijing area is mostly concentrated in the range of 70–400 nm. After log-normal, the BC particle size above 600 nm is still small, which should be closely related to the nature of the local BC emission source. The concentration of BC in snow is highly susceptible to meteorological conditions and local pollution levels. When Beijing is under the control of the east wind or the southeast wind, aerosols in the urban areas can easily accumulate in the northwestern mountains and then settle or participate in the snowfall process, resulting in an increase in BC aerosol accumulation in the snow, thus further changing the optical properties of snow in the Beijing area.

1. Introduction

Black carbon (BC) aerosol mainly comes from incomplete combustion, which is the main absorption aerosol in the atmosphere. It is one of the most important factors influencing the uncertainty in global climate change assessment, and it is considered as a major contributor to global warming after carbon dioxide (CO2) and methane (CH4) at a global scale [1,2,3,4,5,6]. BC aerosol can affect solar radiation through direct effects, generate radiative forcing, and heat the atmosphere [7,8]. It can also serve as ice nuclei participating in increasing or decreasing precipitation [9,10,11,12]. When the BC particles settle to the snow and ice surface of the glaciers, the surface albedo of snow and ice will be reduced, and the melting process of snow and ice will be accelerated, thus impacting runoff and water resources [13,14,15,16]. BC not only has impacts on climate change, but it also has recently emerged as a significant contributor to human health. Many studies have found that the associations of adverse health effects with BC were stronger than with fine particulates (PM2.5) and inhalable particulates (PM10) [17,18,19].
Robust estimates of BC effects on snowpack evolution require accurate and reliable data of BC content in snow [20,21,22]. Warren [21] pointed out that due to the complexity of the snow and ice environment, satellite remote sensing inversion often cannot provide accurate data of BC content on the surface of snow and ice. Even if the albedo could be measured perfectly from satellite, its attribution would be ambiguous due to the vertical variation of snow grain size, absorbing aerosol in the atmosphere above the snow, and especially due to subpixel heterogeneity of the thin and patchy snow cover of the Arctic and many other treeless regions, highlighting the importance of ground-based measurements.
Due to the relatively low content level of BC in snow and ice, the requirements for a sample collection are high. Compared with the method of direct observation of the atmosphere, the method of observation and analysis of BC in snow is much more complicated. Several measurements of BC particles have been conducted using mostly filter and/or optical methods [23,24,25,26,27]. At present, there are mainly three methods for analyzing BC in snow samples. The first is the thermo-optical method. In this method, a quartz filter is used to filter the melted snow sample, and the BC and organic carbon on the filter are then heated at high temperature to generate carbon dioxide. The transmittance of the filter is monitored to distinguish between BC and organic carbon, and BC and organic carbon concentrations are calculated by measuring the carbon dioxide content [28,29,30,31,32,33,34]. The second method is using an Integrating Sphere/Integrating Sandwich Spectrophotometer (ISSW). Membrane filtration is also used in this method. The light of a specific wavelength is emitted by a multi-wavelength light emitting diode, passing through a filter sample. The degree of light attenuation is measured, and then an absorption curve is established; the concentration of BC is thus manifested by the light absorption intensity [35,36,37,38,39].
However, significant errors are inevitable in both of the above methods. The error of the thermo-optical method originates from the efficiency of filtration, which means that it is not easy to distinguish between BC and OC in the analysis. Moreover, BC cannot be directly and accurately quantified in the ISSW method, which is based on many assumptions (numerical), and is susceptible to light-absorbing organic carbon (brown carbon), dust, and especially iron oxides, with relatively low sensitivity [40,41,42,43].
The third method is the Single Particle Soot Photometer (SP2) method, which has been developed in recent years. For the first time, in 2007, McConnell et al. [44] used SP2 to test BC concentration in snow-ice samples. In contrast to the two above-mentioned methods, SP2 directly measures BC particles, with a detection efficiency of more than 90%, effectively eliminating the interference of sample filtration, OC, carbonate, and other factors [45,46,47,48]. Two types of error affect the SP2 results: first, the systematic error resulting in mean bias between the extrapolated and actual peak heights when sufficient statistics are available; second, the random error that reflects the range of possible extrapolated values relative to the actual ones for individual detections [49,50,51,52]. The systematic error can be estimated via a polynomial fit to the extrapolated results for data for which the actual values are known, and random error is the most relevant when only small collections of saturated particle data are available [52]. Lim et al. [48] compared the advantages and disadvantages between the SP2 and OC/EC Analyzer of thermo-optical methods in the analysis of BC in snow/ice samples. In view of the extremely high sensitivity and accuracy of SP2 in BC measurements, this method has received much attention in the field of analysis of BC in snow-ice samples. In recent years, the development, optimization, and comparison of SP2-related testing methods have emerged in the literature [49,50,51,52]. Therefore, the SP2 Black Carbon analysis method is preferred to measure BC aerosol in snow.
China has the largest share of global BC emissions, which amounts to a quarter of global and half of Asian emissions, due to its high consumption of fossil energy [3,4,53,54]. Beijing, which is the capital of China and the most important megacity located in the northern part of NCP, has also suffered from severe air quality in recent years due to its large local fossil fuel consumption [55,56,57], and BC particles are one of the most important anthropogenic aerosols there. Serving as one of the global super cities, Beijing provides a natural and artificial mixed polluted laboratory [58,59]. In Beijing, the capital of China, the probability of snowfall is decreasing as a result of global warming [60]. At the same time, Beijing has suffered from severe air pollution. Previous studies show that Beijing is an abundant laboratory of BC [40,42,53,54,55,56]. There is little research on the mechanism of man-made pollutants, including BC aerosol, and the influence they have on snowfall. In particular, the characteristics of size distribution and sources of BC during snowfall in a megacity in China are even rarer. In this paper, the concentration and particle size characteristics of BC in snow during the winter of 2015 in Beijing were analyzed by SP2 method, which was designed to provide reference for correctly assessing the effect of BC aerosol on a natural snowpack.

2. Data and Methods

2.1. Sampling Area and Time

The observation location in this article was in Yanqing County, Beijing (40.311° N, 115.47° E), with an average altitude of 928 m. The observation date is 19–21 November 2015. According to the original plan, the samples were to be collected from 4 different points (each point is no more than 2 km apart) to reduce the error caused by single point. On the 20th to 21st, due to road conditions, only 2 points were selected for collection. The samples collected were fresh snow that fell on the ground that day (Table 1).

2.2. Sample Analysis

The BC analysis system used in this study is comprised of three parts (Figure 1): Peristaltic Pump, Ultrasonic Atomizer, and Single Particle Soot Photometer (SP2, DMT Inc., Longmont, CO, USA). The Peristaltic Pump absorbs samples with a relatively stable speed (about 0.5–0.6 mL/min), and the Ultrasonic Atomizer atomizes aqueous solution into droplets of about 10 μm. These droplets containing particulate matter flow through a pipeline of 140 °C and are then vaporized, with the particulate matter inside the droplets released into the carrier gas. The water vapor is then condensed through cooling pipelines of 3 °C. In the end, the relatively dry carrier gas with particulate matter flows out of the atomizer into the SP2 for testing.
Based on previous methods [41,45,48,58], this study took the actual situation of Beijing snow-ice samples into consideration and added the following experimental procedures: (1) Measuring the velocity of the Peristaltic Pump. The velocity of the Peristaltic Pump will decrease gradually in the sample testing process due to aging, and the velocity change is considered in the process of data processing. (2) A certain concentration of the PSL particle with a size of 200 μm is absorbed by the Peristaltic Pump before the sample is measured, and the atomization efficiency is calculated by the ratio of the concentration of the particle quantity measured by SP2 and the total quantity. (3) Using the method of BC Save Only to collect data, without recording the scatter signal. A huge amount of data brought by scatter particle signal can be avoided, and the ratio of mixed black carbon can still be determined by scatter signal. (4) Measuring the ultra-pure water background and the 10 ppb Aquadag standard sample to evaluate the long-term stability of the instrument. In this study, the change in black carbon concentration in the snow and ice sample contained in the sample bottles of low base Polyethylene Terephthalate (PET) in different pretreatment modes (static, stirring, and ultrasonic) was tested, and the effect of using PET sample bottles to contain snow and ice sample with black carbon was evaluated. Lim et al. [48] found that the ratio of surface/volume (S/V) of sample bottles influenced the storage of black carbon samples. The smaller the S/V value is, the possibility of the sample adsorbing on the bottle surface decreases, and the recovery rate increases [48]. In this study, the PET sample bottle has a smooth interior surface with a smaller S/V ratio, which is more suitable for the short-term storage of black carbon sample compared with the PP bottle. (5) Data collection. The amount of black carbon particles collected is determined by the concentration of the sample, usually around 5000–40,000. (6) After the sample testing is finished, the BCSC mode is restored, the PSL standard sample is re-measured, and the change in atomization efficiency is monitored. (7) Pump speed, atomization efficiency, sample number, data number and other information is substituted into the Ice Core module of Paul Scherrer Institute (PSI) software, and the mass concentration of black carbon in the sample can be obtained as a result.

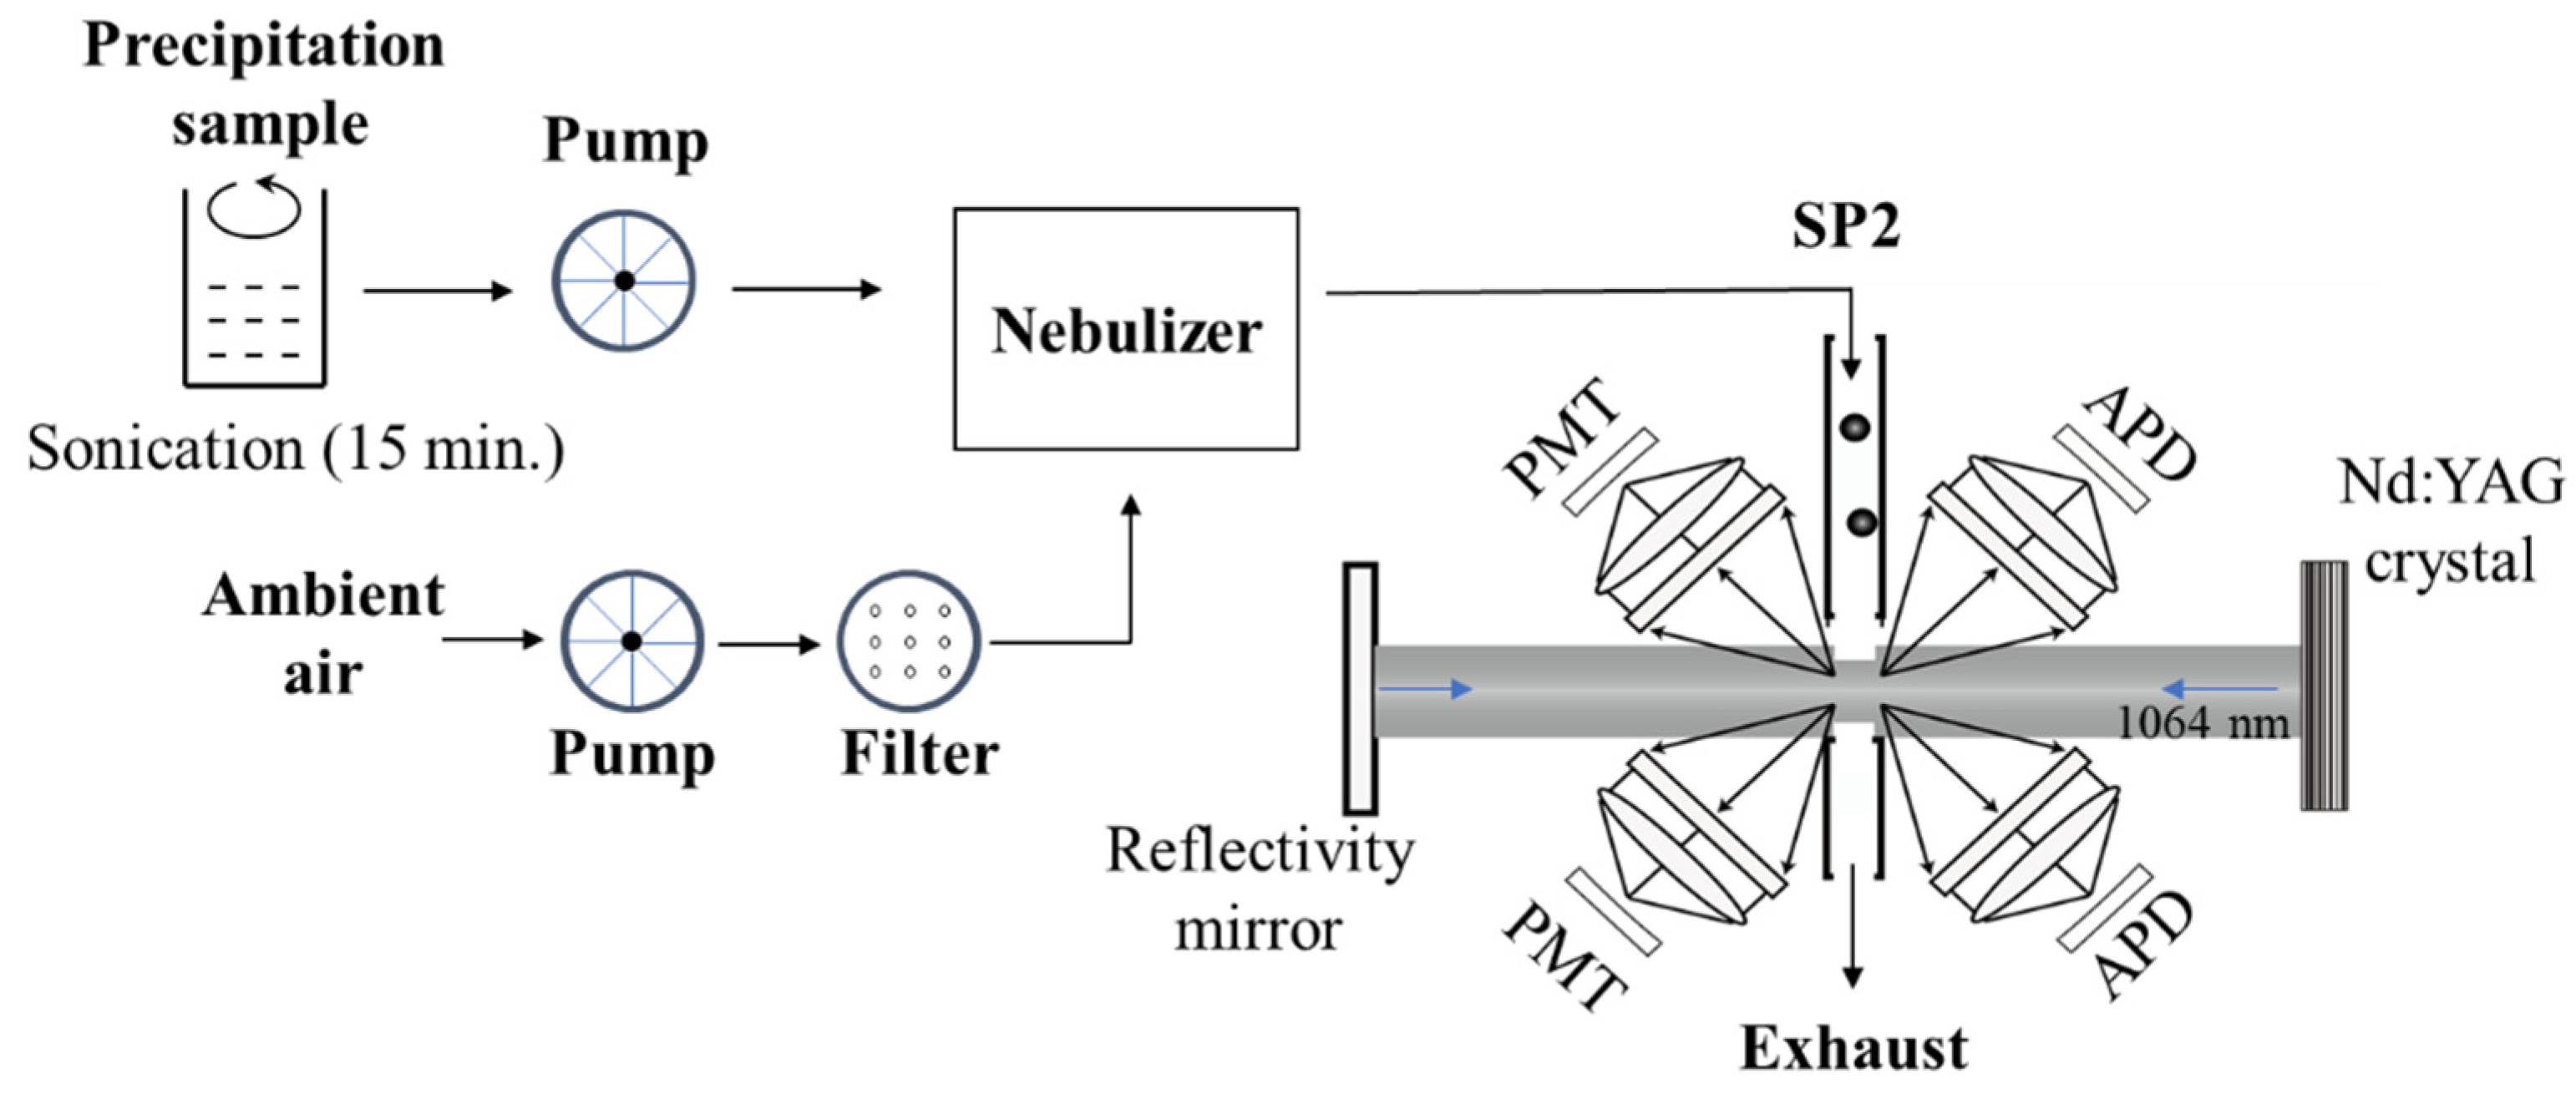
2.3. Single Particle Soot Photometer (SP2)

The BC aerosol was observed using an SP2. SP2 infers the diameter, mass, and white-hot temperature of a single aerosol particle by using light scattering, absorption, and emission and designs a sampling particle size range of 0.04 to 0.8 μm. The instrument structure is described in detail in [50,51,52]. In simple terms, the particles in the vertical direction enter the SP2 laser cavity one by one. When the laser beam (λ = 1064 nm) in the horizontal direction in the cavity is heated to generate an optical signal, the signal will be detected by detectors in four different positions. If the particles are non-light-absorbing particles, the scattered signal is to be detected by two optical scattering lenses. If the particles are aerosol particles wrapped in BC, the laser will first burn off the outer cladding and emit a scattering signal, and then continue heating until the internal BC vaporizes under light absorption and emits an incandescent light signal. The incandescent light signal is to be detected by two other optical filters in different wavelength bands (broad band ranging from 350 to 800 nm, narrow band ranging from 630 to 800 nm). The intensity peak of the incandescent light signal is in direct proportion to the BC content. According to this proportion, the mass of BC is calculated from the single-particle incandescence signal intensity, and then the BC number concentration and mass concentration are obtained based on the mass and quantity of BC detected in the unit time. Quality assurance and quality control (QA/QC) primarily included the routine maintenance and calibration of instruments. According to the standard procedure, the inlet flow, removing the noise peaks and particle size for SP2, was calibrated at the beginning and middle as well as the end of the campaign. More detailed information about the BC analysis protocol is provided in Schwarz et al. [51,52].

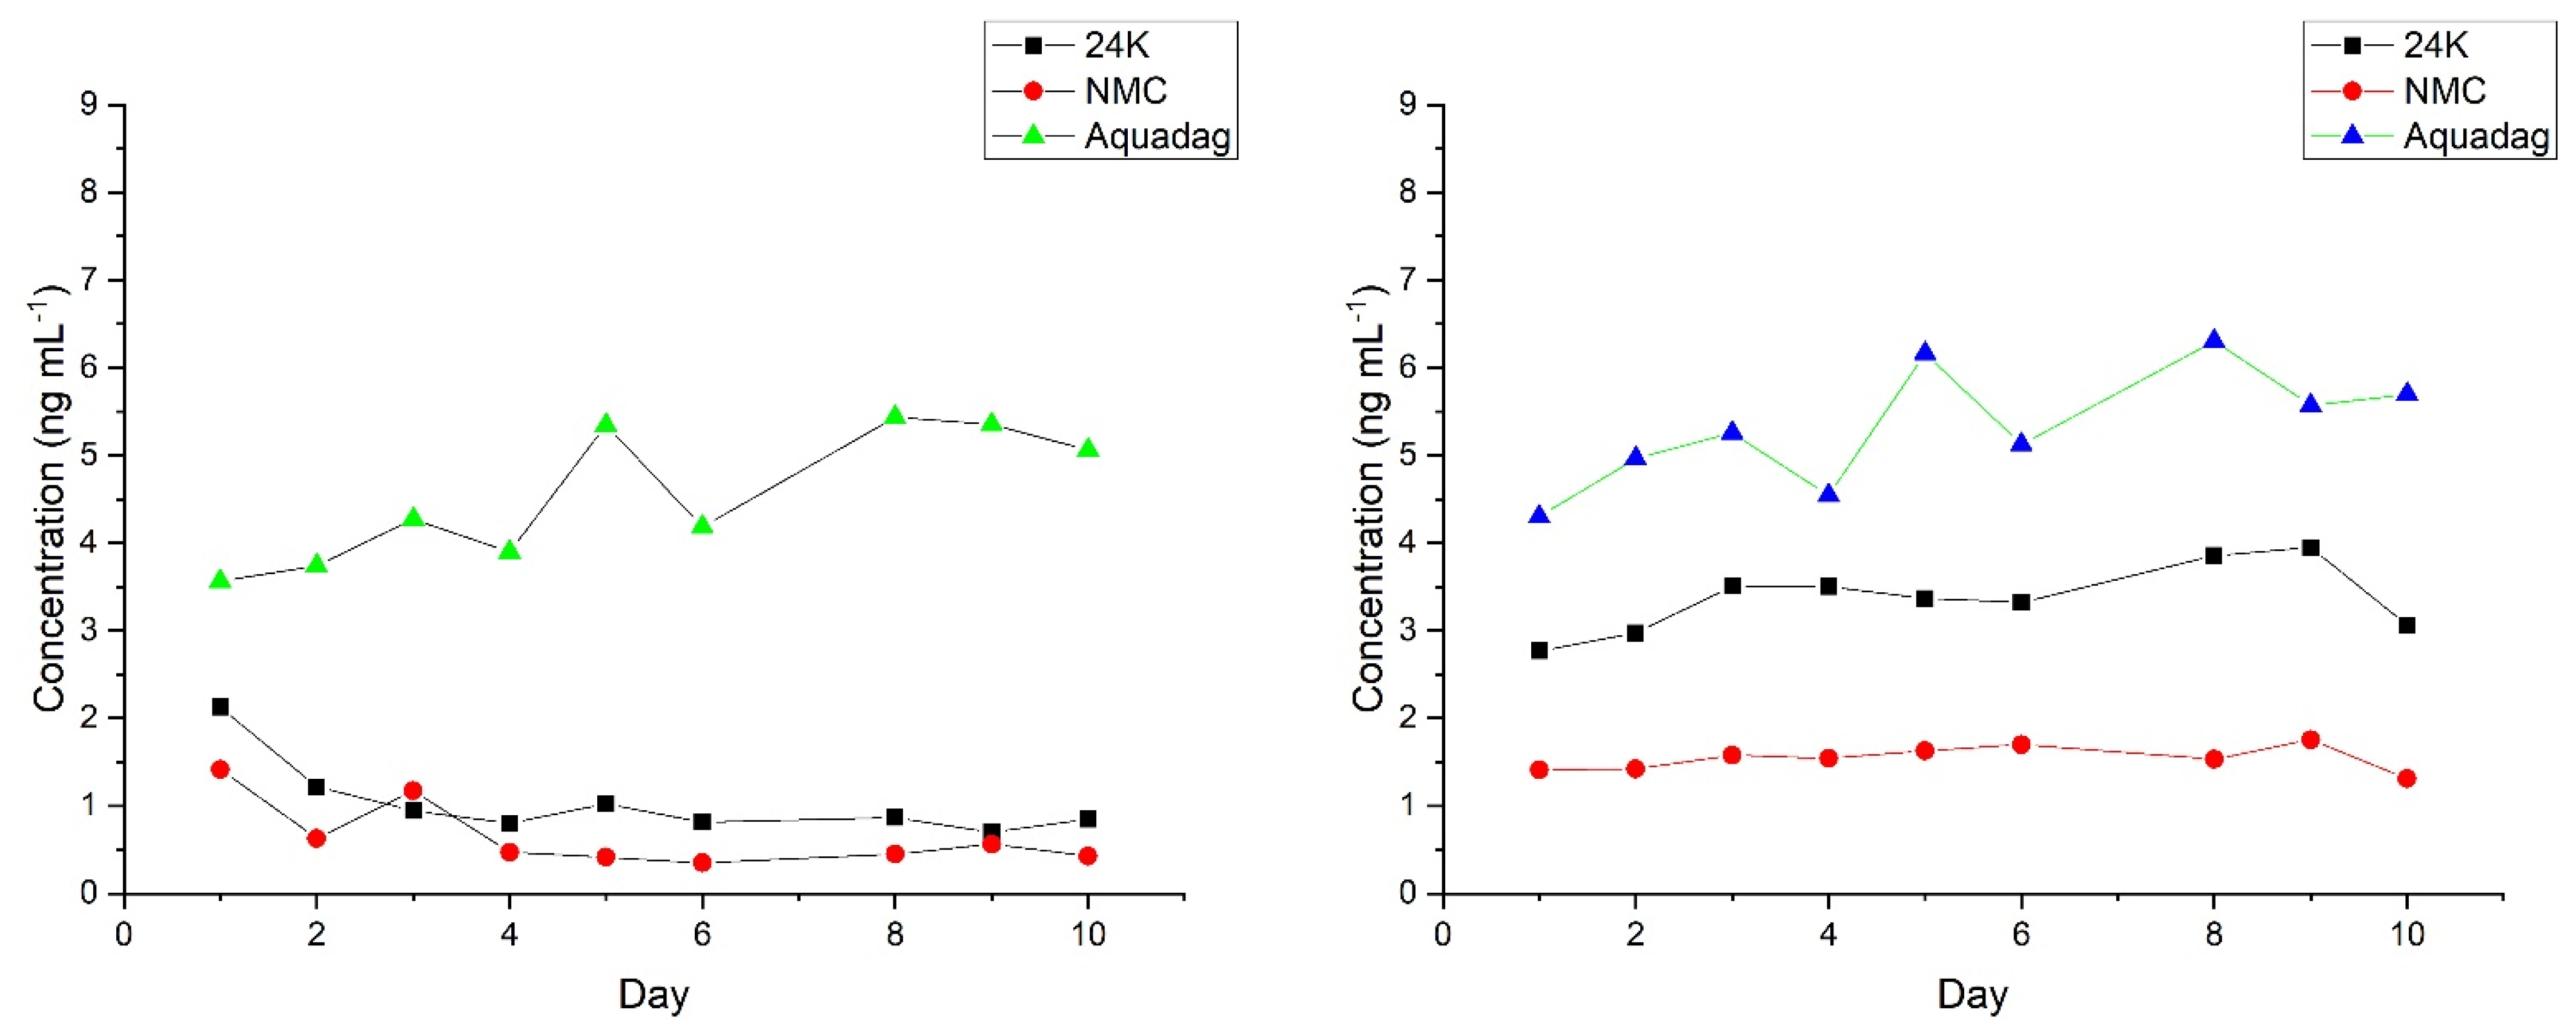
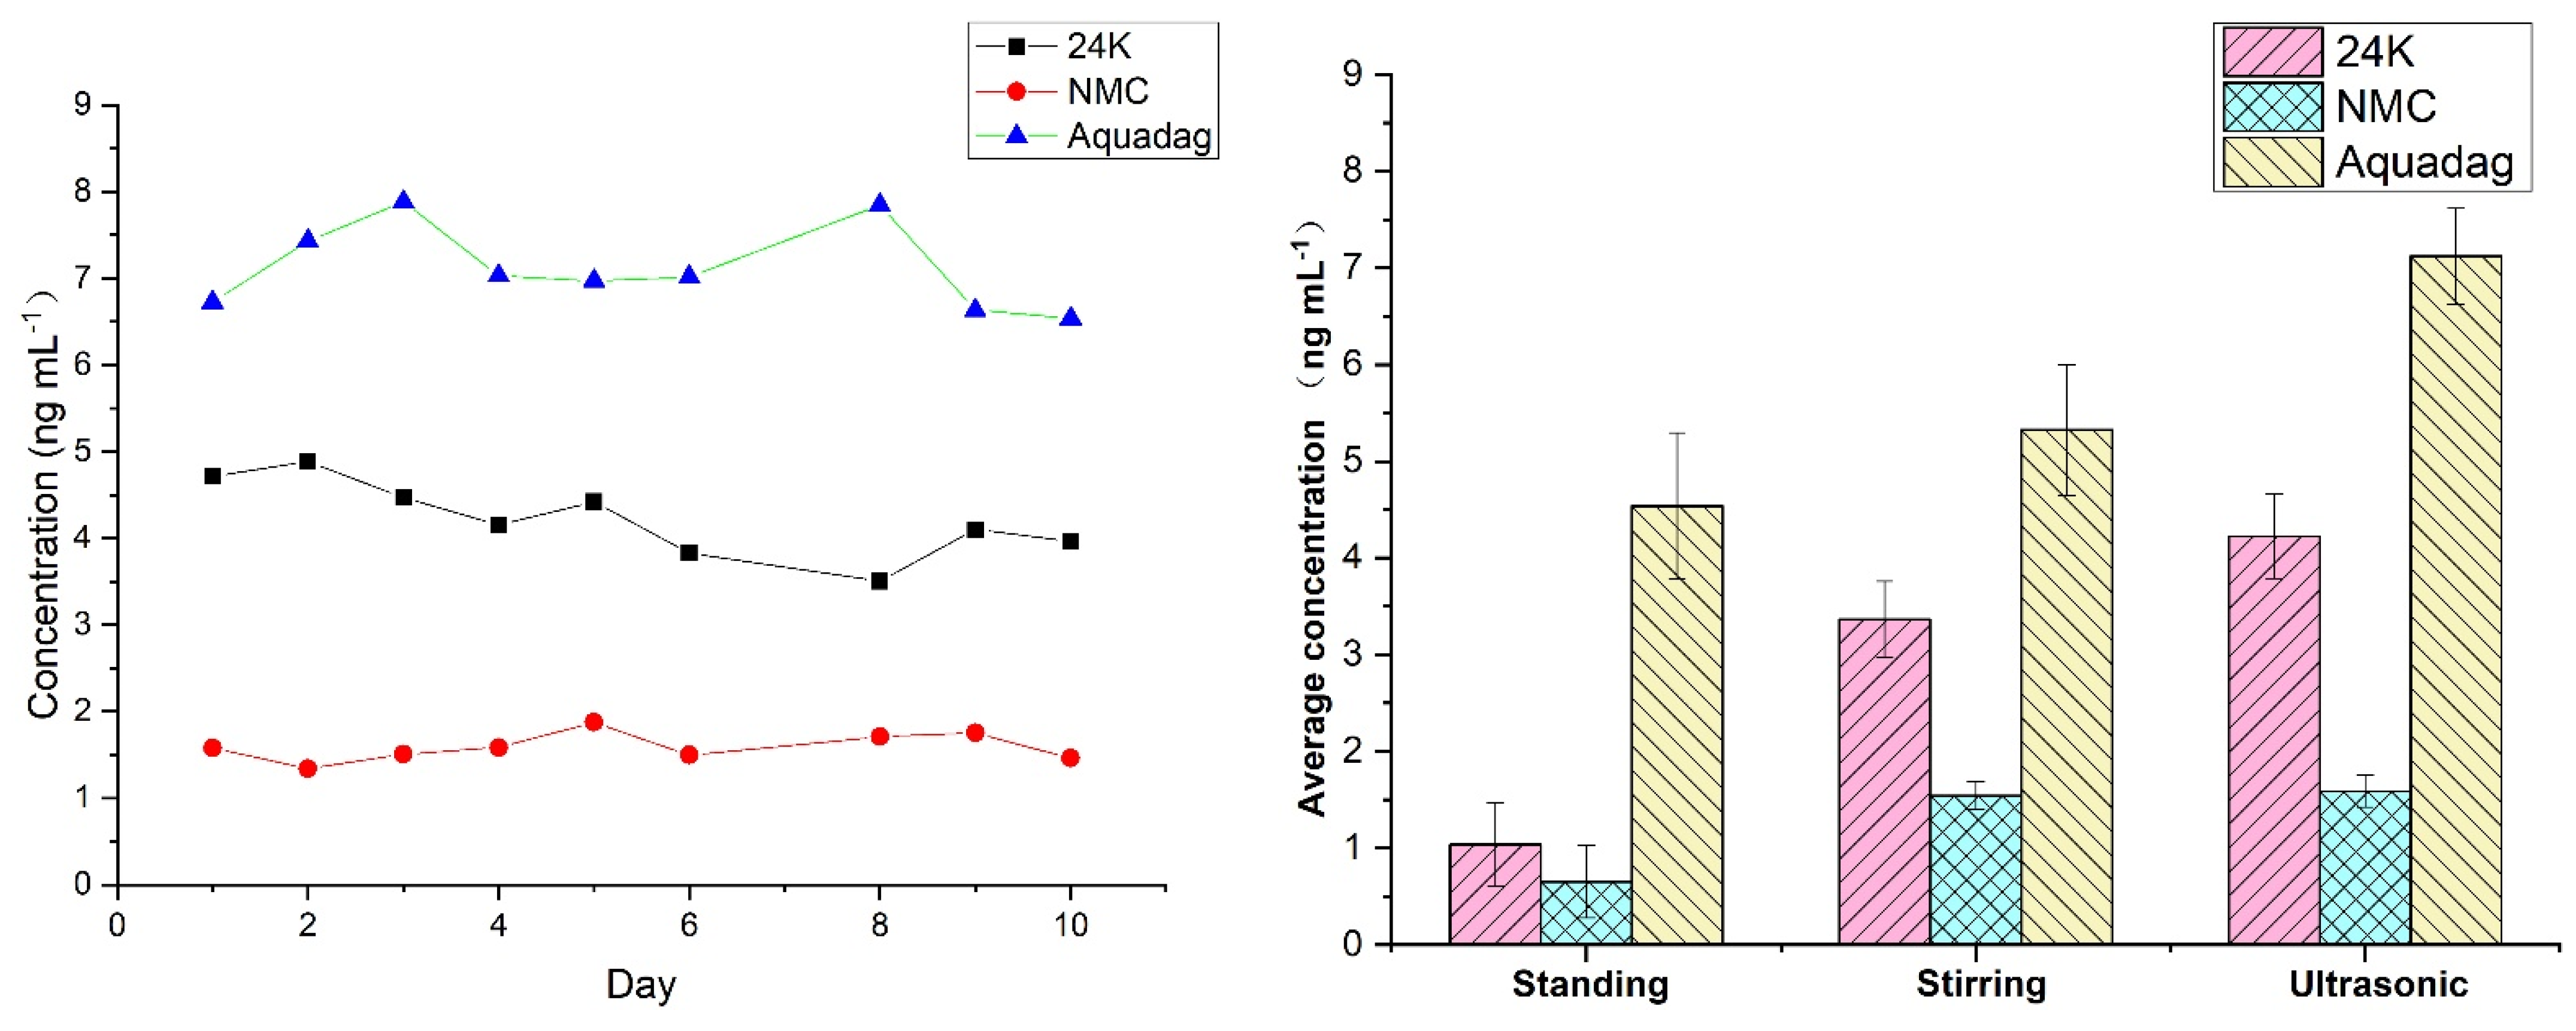
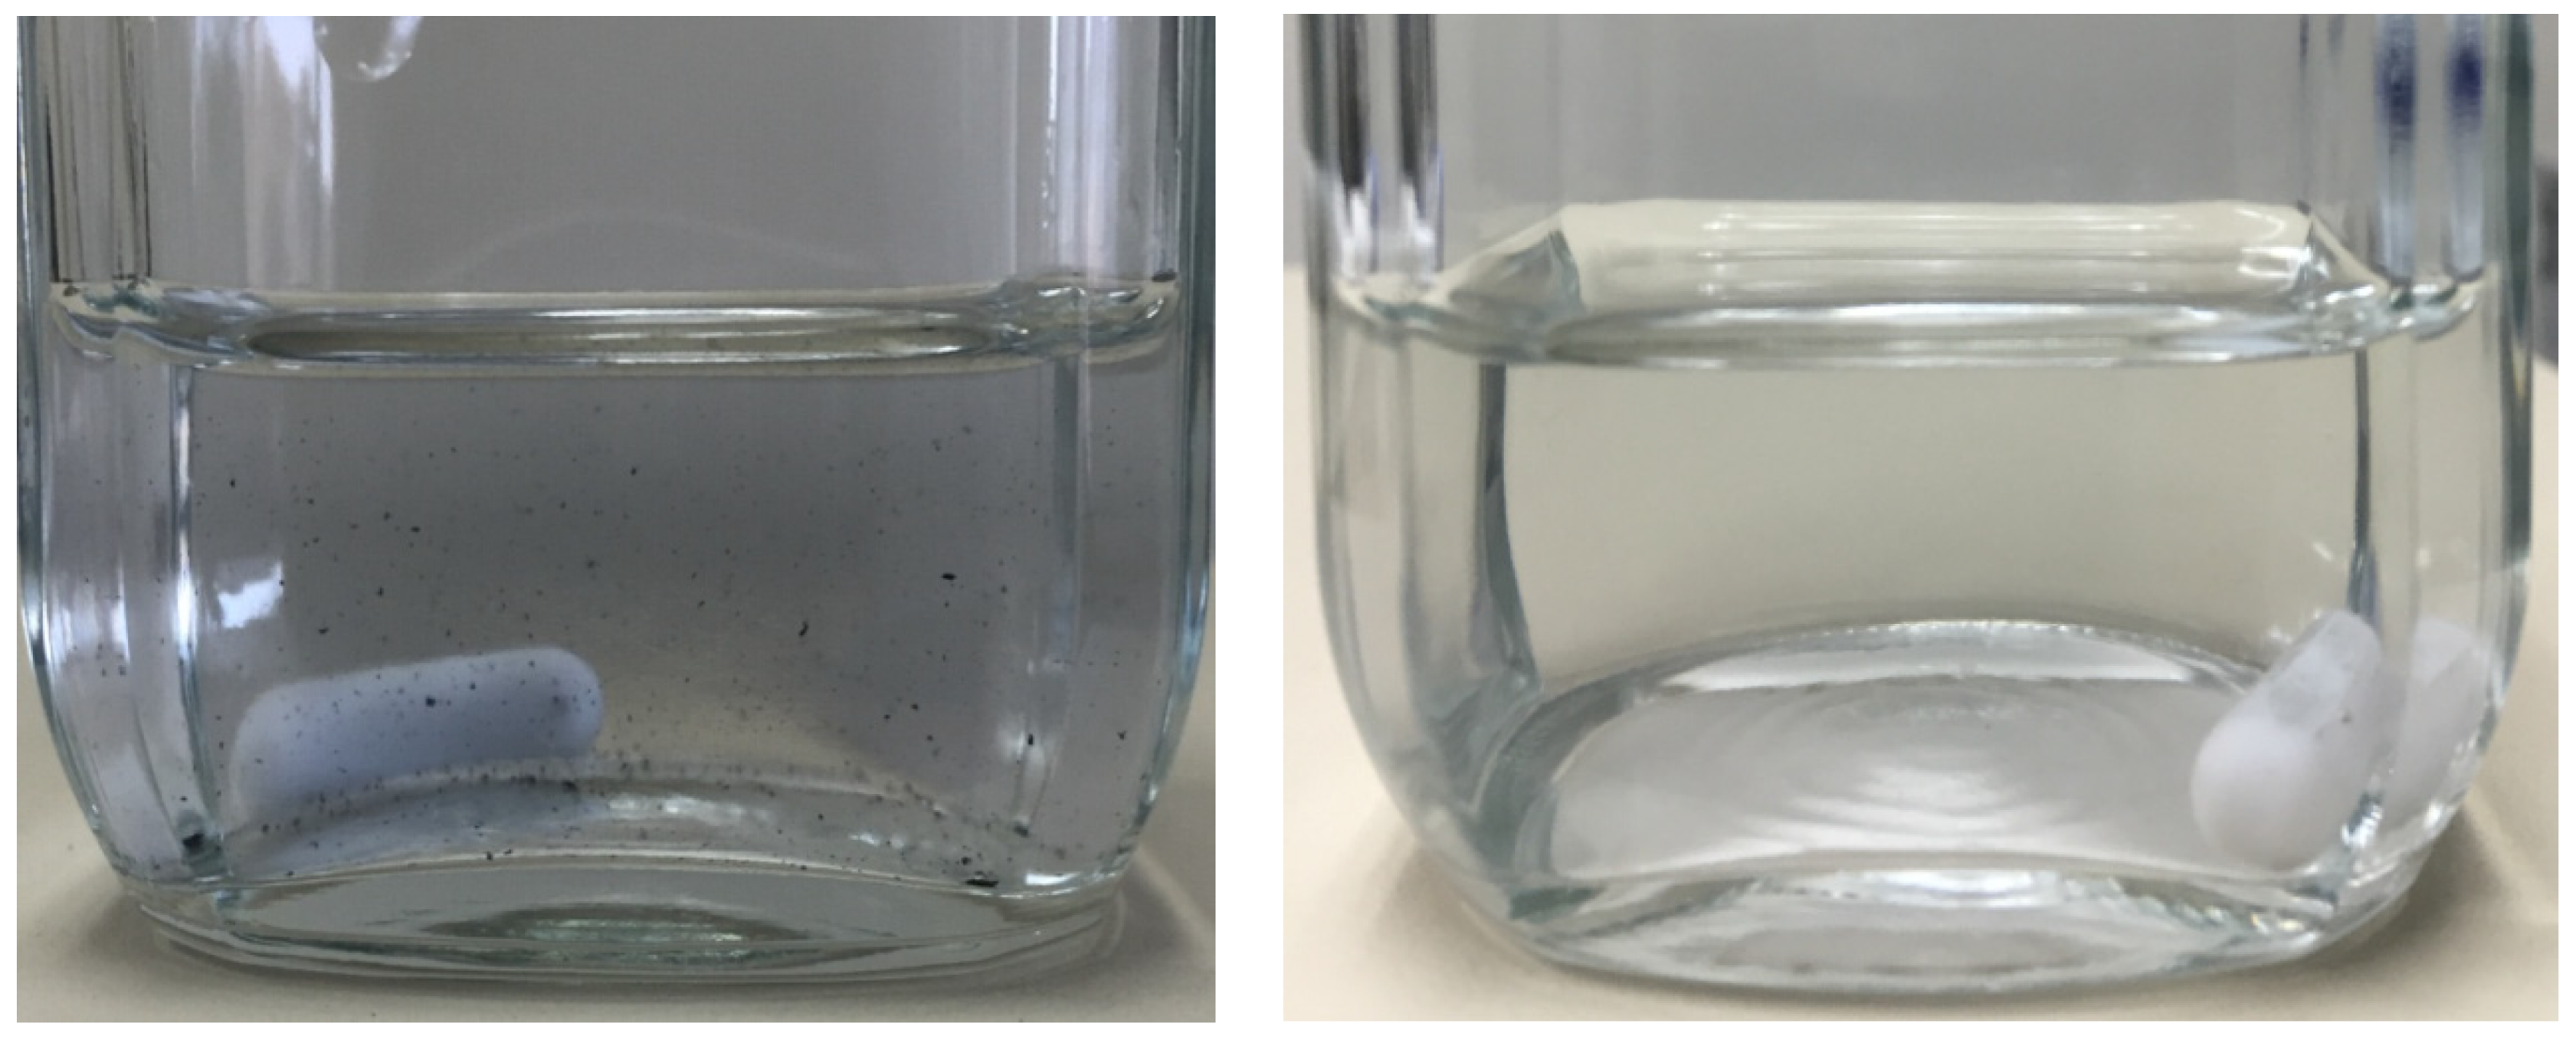
2.4. Effects of Different Treatment Methods on Measurement

Although the measured values are relatively stable in both stirring and ultrasonic pretreatments, it can be seen from Figure 2 that the average measurement of black carbon in three samples when using the ultrasonic method is significantly higher than that in static and stirring methods, which shows a better recovery rate. This was followed by a retest of the black carbon concentration contained in PET sample bottles for a long time. It was found that after one month’s cold storage, the measured value can still reach more than 70% of the initial value, proving the effect is better than the PP bottle. Therefore, PET plastic bottles can be used for temporary storage of black carbon samples. Their study found that stirring after ultrasonication has little effect on the measurement result. If the sample is stirred while being injected, the stability of measurement is affected, and a considerable amount of coarse scatter particles are agitated during the stirring process. This easily contaminates the transducer and the atomization chamber of the CETAC ultrasonic atomizer, resulting in a decrease in the atomization efficiency and an increase in the measurement background. Therefore, this study only used ultrasound to inject samples. The importance of ultrasound is not only reflected in the preinjection treatment, but also at the time of sample separation, especially for samples that have undergone a freeze–thawing process. It is clearly shown in Figure 3 the striking difference of BC concentrations between the snow sample being sonicated for 15 min and that without (PP bottles subjected to freeze–thawing and stored for a long period of time). Although the changing trend of concentration is still consistent, concentrations are different. All samples of this study that involve sampling were subjected to sonication before that. A detailed introduction can be found in [61].

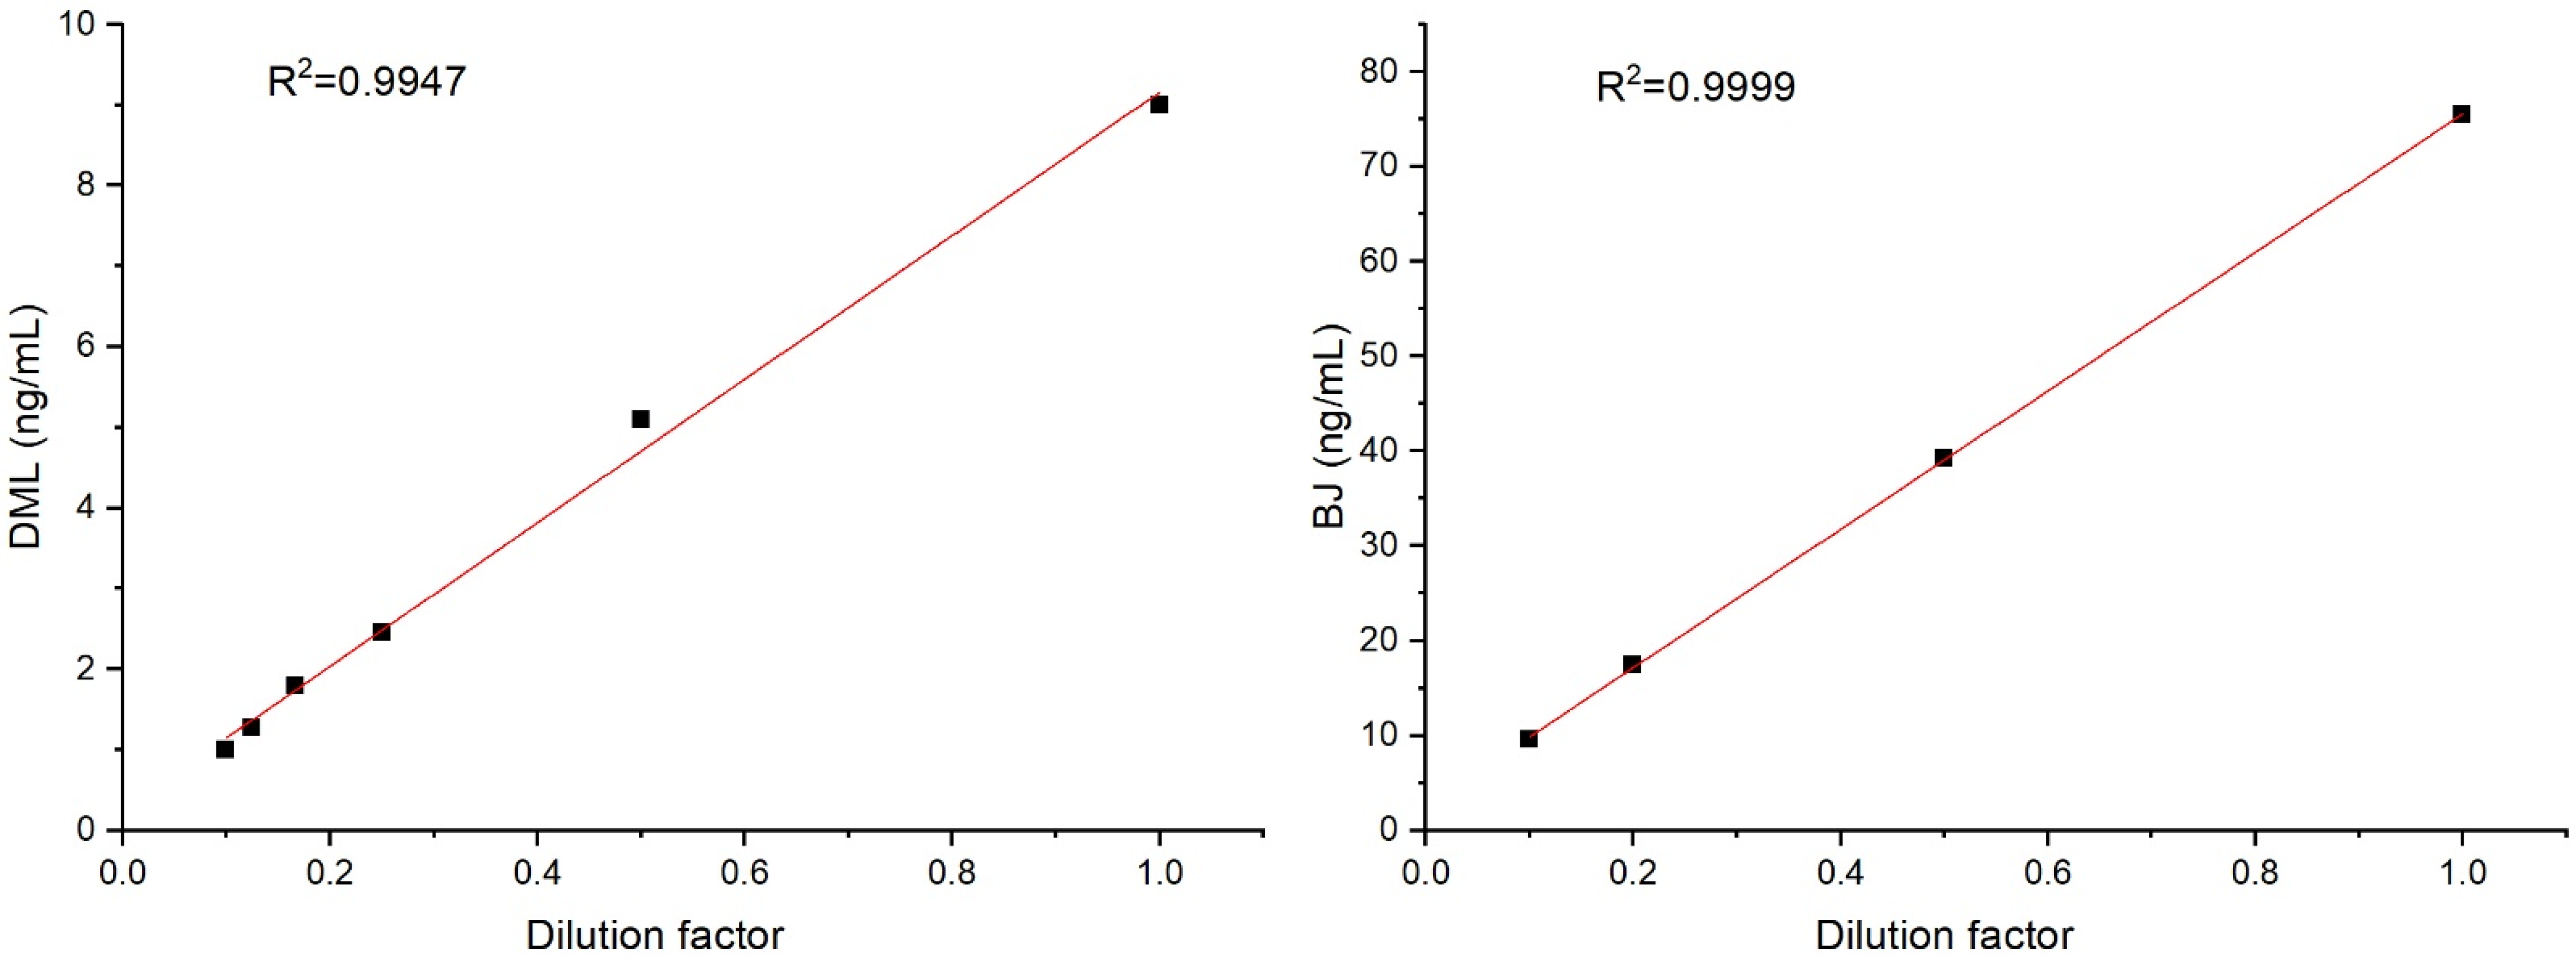
2.5. The Effect of Sample Dilution on Measuring Results

Although the sample was snow-ice from the comparatively clean Tibetan Plateau, many suspended particles could still be found in the dissolved samples when the contamination layer was involved. During the experiment, it was found that the injection of some samples with more suspended particles would lead to the decrease in the injection flow rate of SP2 (usually 120 mL/min) to about 20–30 (which could be a self-protection mechanism of SP2, avoiding chambers being polluted by particles with high flow-rate and density, unconfirmed by the manufacturer) and the rundown in laser power (YAG Power). In some snow/ice samples, the SP2 scatter window counted 7000–8000 particles cm−3. However, when the scatter signal was greater than 2000, the signal did not change in proportion to the actual sample concentration according to the experiment. In this study, these samples were measured by means of diluted injection and the effect of dilution on the black carbon measuring results was evaluated.
Kaspari et al. [62] also mentioned that samples need to be diluted when black carbon measures >10 ng/mL. A snow-ice sample from the Demura Glacier and a Beijing snowfall sample were diluted and measured repeatedly. As can be seen in Figure 4, the two samples exhibited a linear relation (R2 > 0.99) at a dilution ratio of 2–10 times, unaffected by the high concentration of scattering particles. This indicates the measuring result of concentration after the dilution test was reliable while black carbon was in the range of 1–80 ng mL−1.

3. Results and Discussion

3.1. Mass Concentration of BC in Snow

As can be seen from Figure 5, the average concentration of BC in snow meltwater on 19th–21st was 82 ng/mL; the minimum of 62.9 ng/mL was on the 19th, and the maximum of 210.6 ng/mL was on the 21st. From the day-to-day changes in concentration, the average concentration at the four collection points on the 19th was 71.1 ng/mL and the deviation was no more than 10%. On the 20th, the average BC concentration in the snow at the two collection points dropped to 16.3 ng/mL. However, on the 21st, the BC concentration increased to 210.6 ng/mL, and the average concentration in the two collection points was 180 ng/mL, which was 11 times the average BC concentration in the snow on the 20th. Early studies found that human activities have a correlation with the changes in black carbon concentrations in ice cores. Especially after the industrial era, there are many records that the black carbon emitted by human activities contributed to BC in ice cores. The study of black carbon content in snow and ice has found that local human activities have a significant impact. Beijing, the capital of China, is also a megacity. The amount of BC emitted by human activities is huge, especially in the winter heating season where the concentration of BC in the snow is closely related to the BC transmission of local pollution emissions.

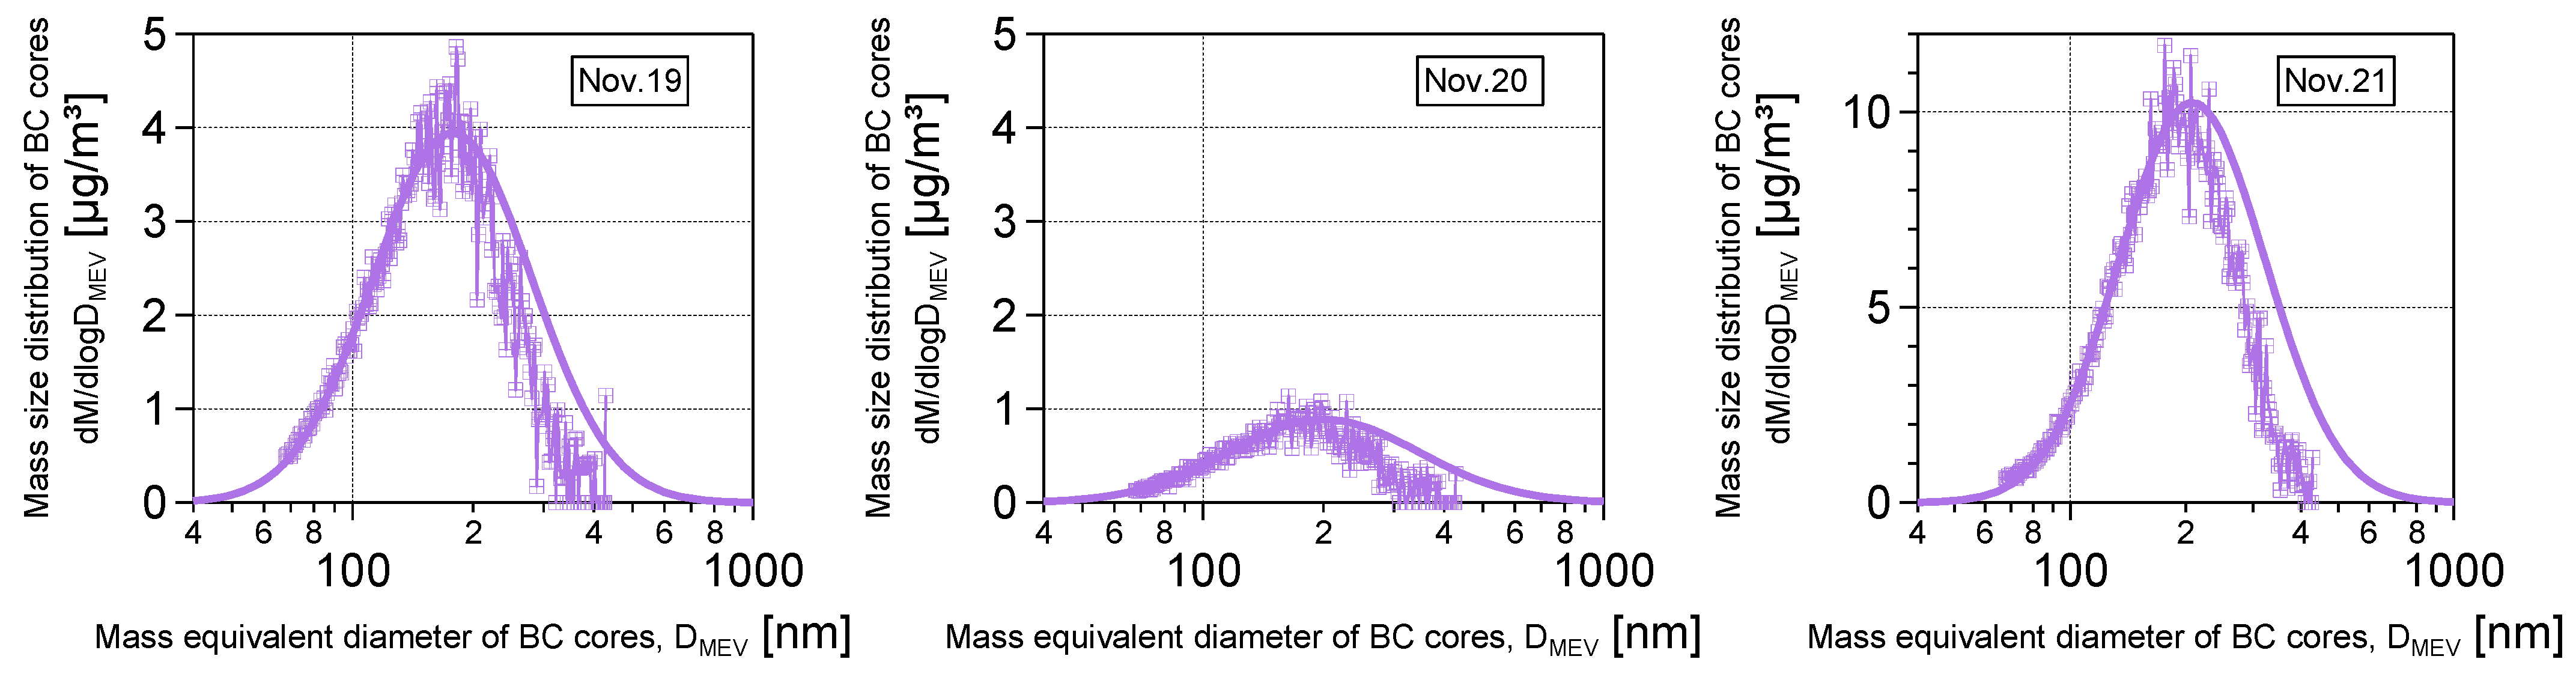
3.2. Size Distribution of BC in Snow

The absorption characteristics of BC are not only closely related to the way of mixing with other aerosol components [63,64] and snow grains [65,66], they are also affected by the particle size distribution characteristics [67]. Schwarz et al. [68] used SP2 to observe the BC particle size in snow and found that it was larger than that in the atmosphere, and then obtained accurate MAC information in the snow. Moreover, the current climate model study [69] cannot accurately calculate the MAC due to the inability to obtain reasonable information about the particle size of BC in snow and ice, which in turn affects BC’s radiative forcing. This study has found that the BC particle size in snow and ice in Beijing is mostly 70–400 nm (Figure 6). While after log-normal, similar to the US and Shenzhen in China [15,70], the BC particles with size above 600 nm are still rare, which should be closely related to the nature of the local BC emission source. In addition, judging from the changing trend of peak BC particle size, particles increased from 180 to 210 nm from the 19th to 21st, and the spectrum of particles above 200 nm began to widen. This indicates that BC particles on the 21st were more aged and blended more fully with those in snow and ice (Figure 6).

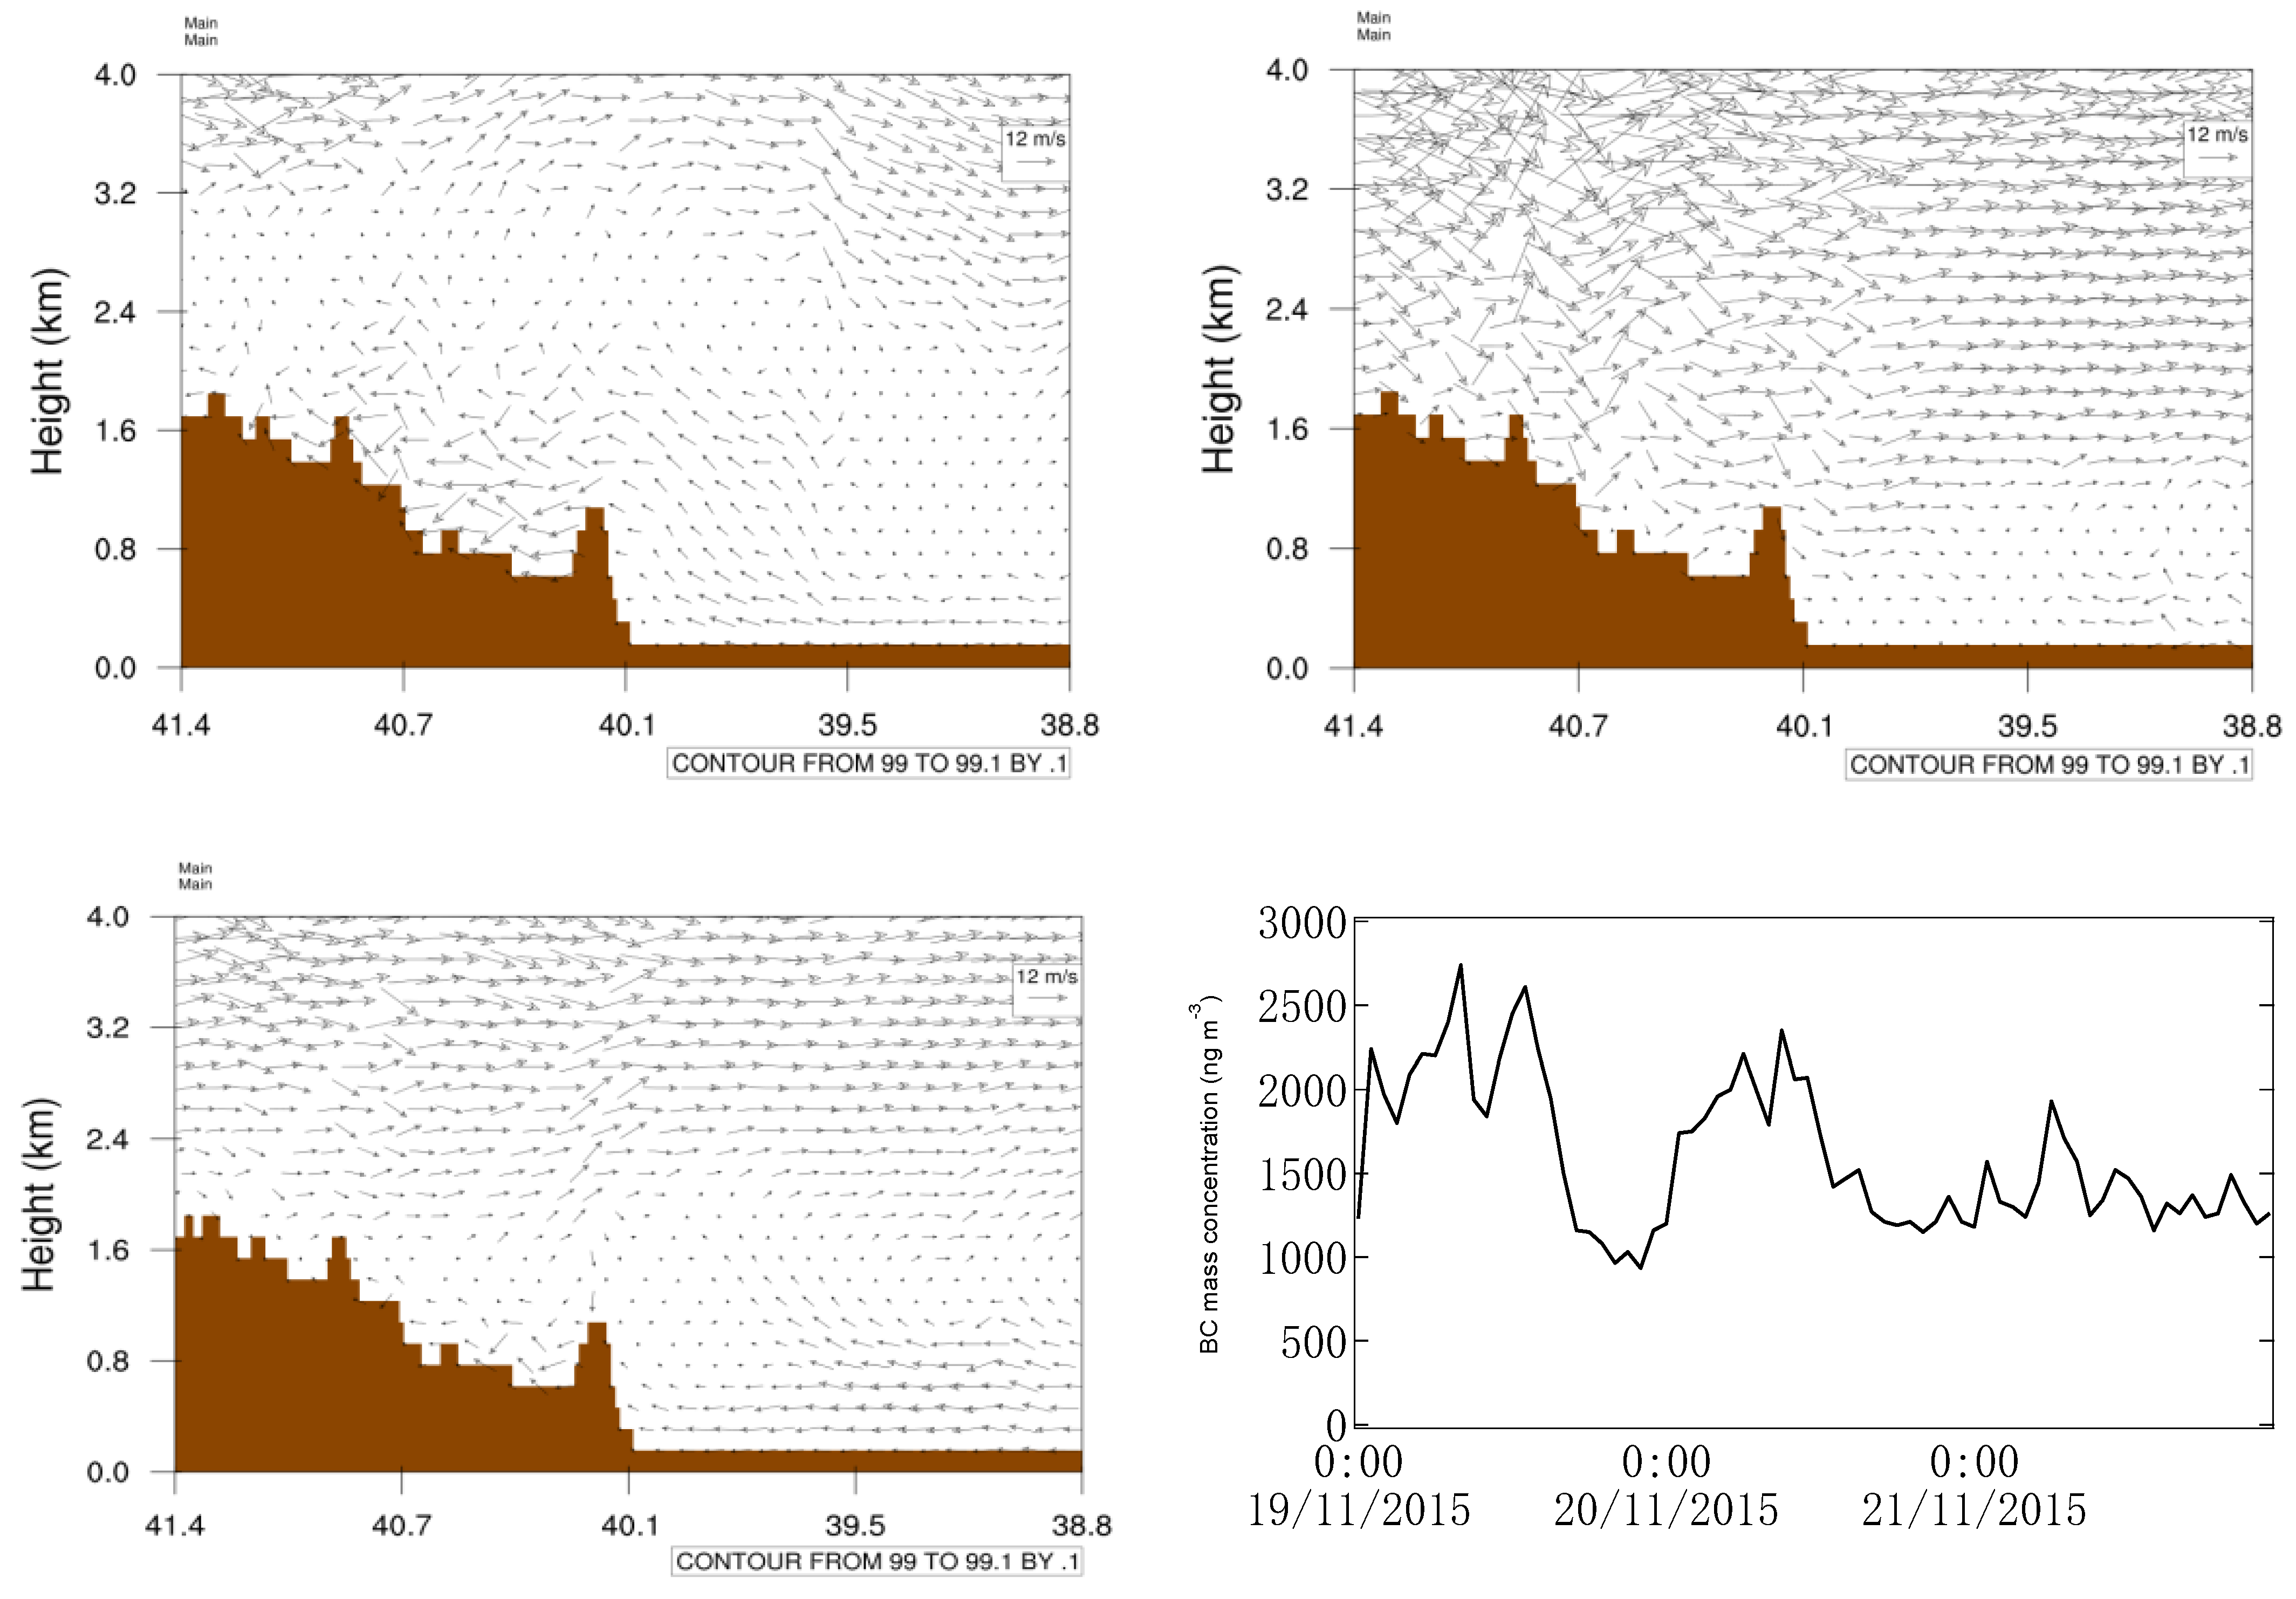
3.3. Meteorological Effects on Day-to-Day Variation in BC Concentration in Snow

In order to confirm the reason of sudden increase in BC concentration, we used the WRF weather background field and the closest (10 km away) wind profile radar from an observation station dating from 19–22 November 2015 (Figure 7). On the 19th, the Eurasian middle-high latitude areas were two-slot and one-ridge. The Lake Baikal area was in the low vortex before the high-pressure ridge and in the wide transverse trough area, with the ground controlled by cold high pressure. In the western part of the mid-layer in the bottom of the trough, ranging from 500 to 700 hPa in north China, there is short-wave trough activity, and the low-level cold air activity is frequent. In the joint influence of the low-level front, shear line, ground inverse trough, and east wind, the observation site underwent a wide range of rain and snow. From the day of the 19th to the noon of the 20th, sleet turned into light snow. From 08:00 of the 19th to 20:00 of the 20th, there was a short-wave trough transit at high altitude. The 850 hPa was affected by the shear line where the cold and warm air meet, the ground was at the bottom of the high pressure, and the cold air in the northeast was slowly pressed down to the south, so the lower layer has a better vertical upward movement and vapor conditions, with the specific humidity of 925 hPa exceeding 3 g/kg. At 08:00 on the 19th, the ENE wind was 6 m/s and the humidity was 92% near Yanjiaping Village. During the day, the cold air permeating from the northeast gradually turned into a southeast wind (Figure 7). At 20:00, it changed to south wind about 4 m/s, and the humidity maintained at 92% (Figure 7). On the morning of the 20th, the cold air weakened, the south windspeed decreased to 1–2 m/s, the humidity remained at 90%, and the snowfall gradually stopped.
As can be seen from the analysis of weather conditions above, from the 19th to the 21st, the observation points had been under the control of the east wind or southeast wind, and the aerosols in urban areas can easily accumulate at observation points along with the east wind or southeast wind. We could see that the BC particles in urban areas showed a degressive trend from the 19th to the 21st. East wind significantly diluted urban aerosol pollution, and while the BC concentration in snow of the observation area had increased from the 19th to the 21st, it especially surged on the 21st (Figure 7). This showed that urban aerosols had gradually accumulated in observation areas in the northwestern mountains under the meteorological conditions. During this process, we did not include how BC and snow are mixed, whether being settled by snow or participating in snow formation as ice nuclei.

4. Conclusions

This study abandoned the method of calculating the atomization efficiency by directly using the yield of CETAC liquid waste and used polystyrene (PSL) standard particles to calculate the actual atomization efficiency of the atomizer. The study shows that the BC recovery rate is the highest under the ultrasonic mode, because the large particles produced by the condensation of black carbon during the storage process are broken by the ultrasonic wave and can finally be atomized and detected by the SP2 successfully. The average concentration of BC in snow in Beijing is 82 ng/mL, with a minimum value of 62.9 ng/mL and a maximum of 210.6 ng/mL. The BC particle size in snow and ice in the Beijing area is mostly concentrated in the range of 70–400 nm. After log-normal, the BC particle size above 600 nm is still small, which should be closely related to the nature of the local BC emission source. The concentration of BC in snow is highly susceptible to meteorological conditions and local pollution levels. When Beijing is under the control of the east wind or the southeast wind, aerosols in the urban areas can easily accumulate in the northwestern mountains and then settle or participate in the snowfall process, resulting in an increase in BC aerosol accumulation in the snow, thus further changing the optical properties of snow in the Beijing area.

Author Contributions

Conceptualization, D.Z. and D.D.; data curation, D.Z., J.S. and W.Z.; formal analysis, D.Z., Y.D. and W.X.; software, F.W.; writing—original draft, D.Z.; writing—review and editing, D.Z. All authors have read and agreed to the published version of the manuscript.

Funding

This research was funded by the National Key Research and Development Program of China, grant number 2016YFA0602001.

Institutional Review Board Statement

Not applicable.

Informed Consent Statement

Not applicable.

Data Availability Statement

The ground observation data are available from the authors upon request.

Conflicts of Interest

The authors declare no conflict of interest.

References

  1. Fujitani, Y.; Fushimi, A.; Saitoh, K.; Sato, K.; Takami, A.; Kondo, Y.; Tanabe, K.; Kobayashi, S. Mid carbon (C6+-C29+) in refractory black carbon aerosols is a potential tracer of open burning of rice straw: Insights from atmospheric observation and emission source studies. Atmos. Environ. 2020, 238, 117729. [Google Scholar] [CrossRef]
  2. Shen, L.; Wang, H.; Kong, X.; Yin, Y.; Chen, K.; Chen, J. Characterization of black carbon aerosol at the summit of Mount Tai (1534 m) in central east China: Temporal variation, source appointment and transport. Atmos. Environ. 2021, 246, 118152. [Google Scholar] [CrossRef]
  3. Tan, Y.; Zhao, D.; Wang, H.; Zhu, B.; Bai, D.; Liu, A.; Shi, S.; Dai, Q. Impact of Black Carbon on Surface Ozone in the Yangtze River Delta from 2015 to 2018. Atmosphere 2021, 12, 626. [Google Scholar] [CrossRef]
  4. Bond, T.C.; Streets, D.; Yarber, K.F.; Nelson, S.M.; Woo, J.; Klimont, Z. A technology-based global inventory of black and organic carbon emissions from combustion. J. Geophys. Res. Space Phys. 2004, 109, 109. [Google Scholar] [CrossRef] [Green Version]
  5. Tan, Y.; Wang, H.; Shi, S.; Shen, L.; Zhang, C.; Zhu, B.; Guo, S.; Wu, Z.; Song, Z.; Yin, Y.; et al. Annual variations of black carbon over the Yangtze River Delta from 2015 to 2018. J. Environ. Sci. 2020, 96, 72–84. [Google Scholar] [CrossRef] [PubMed]
  6. Myhre, G.; Shindell, D.; Bréon, F.-M.; Collins, W.; Fuglestvedt, J.; Huang, J.; Koch, D.; Lamarque, J.-F.; Lee, D.; Mendoza, B.; et al. Anthropogenic and Natural Radiative Forcing. In Climate Change 2013: The Physical Science Basis. Contribution of Working Group I to the Fifth Assessment Report of the Intergovernmental Panel on Climate Change; Stocker, T.F., Qin, D., Plattner, G.-K., Tignor, M., Allen, S.K., Boschung, J., Nauels, A., Xia, Y., Bex, V., Midgley, P.M., Eds.; Cambridge University Press: Cambridge, UK; New York, NY, USA, 2013. [Google Scholar]
  7. Lohmann, U.; Feichter, J. Can the direct and semi-direct aerosol effect compete with the indirect effect on a global scale? Geophys. Res. Lett. 2001, 28, 159–161. [Google Scholar] [CrossRef]
  8. Ramanathan, V.; Carmichael, G. Global and regional climate changes due to black carbon. Nat. Geosci. 2008, 1, 221–227. [Google Scholar] [CrossRef]
  9. Hoose, C.; Kristjánsson, J.; Burrows, S. How important is biological ice nucleation in clouds on a global scale? Environ. Res. Lett. 2010, 5, 024009. [Google Scholar] [CrossRef]
  10. Twohy, C.H.; DeMott, P.J.; Pratt, K.A.; Subramanian, R.; Kok, G.L.; Murphy, S.M.; Lersch, T.; Heymsfield, A.J.; Wang, Z.; Prather, K.A.; et al. Relationships of Biomass-Burning Aerosols to Ice in Orographic Wave Clouds. J. Atmospheric Sci. 2010, 67, 2437–2450. [Google Scholar] [CrossRef]
  11. Gallavardin, S.J.; Froyd, K.D.; Lohmann, U.; Moehler, O.; Murphy, D.M.; Cziczo, D.J. Single particle laser mass spectrometry applied to differential ice nucleation experiments at the AIDA chamber. Aerosol Sci. Technol. 2008, 42, 773–791. [Google Scholar] [CrossRef]
  12. Penner, J.E.; Zhou, C.; Liu, X. Can cirrus cloud seeding be used for geoengineering? Geophys. Res. Lett. 2015, 42, 8775–8782. [Google Scholar] [CrossRef] [Green Version]
  13. Hadley, O.L.; Kirchstetter, T.W. Black-carbon reduction of snow albedo. Nat. Clim. Chang. 2012, 2, 437–440. [Google Scholar] [CrossRef]
  14. Hegg, D.A.; Warren, S.G.; Grenfell, T.C.; Doherty, S.J.; Larson, T.V.; Clarke, A.D. Source Attribution of Black Carbon in Arctic Snow. Environ. Sci. Technol. 2009, 43, 4016–4021. [Google Scholar] [CrossRef] [Green Version]
  15. Schwarz, J.P.; Gao, R.S.; Perring, A.; Spackman, J.R.; Fahey, D.W. Black carbon aerosol size in snow. Sci. Rep. 2013, 3, 1356. [Google Scholar] [CrossRef]
  16. Kang, S.; Zhang, Y.; Qian, Y.; Wang, H. A review of black carbon in snow and ice and its impact on the cryosphere. Earth-Sci. Rev. 2020, 210, 103346. [Google Scholar] [CrossRef]
  17. Pani, S.K.; Wang, S.-H.; Lin, N.-H.; Chantara, S.; Lee, C.-T.; Thepnuan, D. Black carbon over an urban atmosphere in northern peninsular Southeast Asia: Characteristics, source apportionment, and associated health risks. Environ. Pollut. 2020, 259, 113871. [Google Scholar] [CrossRef]
  18. Janssen, N.A.; Hoek, G.; Simic-Lawson, M.; Fischer, P.; Van Bree, L.; ten Brink, H.; Keuken, M.; Atkinson, R.W.; Anderson, H.R.; Brunekreef, B.; et al. Black Carbon as an Additional Indicator of the Adverse Health Effects of Airborne Particles Compared with PM10and PM2.5. Environ. Health Perspect. 2011, 119, 1691–1699. [Google Scholar] [CrossRef] [PubMed] [Green Version]
  19. Lin, W.; Dai, J.; Liu, R.; Zhai, Y.; Yue, D.; Hu, Q. Integrated assessment of health risk and climate effects of black carbon in the Pearl River Delta region, China. Environ. Res. 2019, 176, 108522. [Google Scholar] [CrossRef] [PubMed]
  20. He, C.; Flanner, M.G.; Chen, F.; Barlage, M.; Liou, K.N.; Kang, S.; Ming, J.; Qian, Y. Black carbon-induced snow albedo reduction over the Tibetan Plateau: Uncertainties from snow grain shape and aerosol–snow mixing state based on an updated SNICAR model. Atmos. Chem. Phys. 2018, 18, 11507–11527. [Google Scholar] [CrossRef] [Green Version]
  21. Warren, S.G. Can black carbon in snow be detected by remote sensing? J. Geophys. Res. Atmos. 2013, 118, 779–786. [Google Scholar] [CrossRef] [Green Version]
  22. Skiles, S.M.; Painter, T. Daily evolution in dust and black carbon content, snow grain size, and snow albedo during snowmelt, Rocky Mountains, Colorado. J. Glaciol. 2017, 63, 118–132. [Google Scholar] [CrossRef] [Green Version]
  23. Shen, L.; Wang, H.; Kong, X.; Zhang, C.; Shi, S.; Zhu, B. Characterization of black carbon aerosol in the Yangtze River Delta, China: Seasonal variation and source apportionment. Atmos. Pollut. Res. 2021, 12, 195–209. [Google Scholar] [CrossRef]
  24. Yan, B.; Kennedy, D.; Miller, R.L.; Cowin, J.P.; Jung, K.-H.; Perzanowski, M.; Balletta, M.; Perera, F.P.; Kinney, P.L.; Chillrud, S.N. Validating a nondestructive optical method for apportioning colored particulate matter into black carbon and additional components. Atmospheric Environ. 2011, 45, 7478–7486. [Google Scholar] [CrossRef] [PubMed] [Green Version]
  25. Allen, G.A.; Lawrence, J.; Koutrakis, P. Field validation of a semi-continuous method for aerosol black carbon (aethalometer) and temporal patterns of summertime hourly black carbon measurements in southwestern PA. Atmos. Environ. 1999, 33, 817–823. [Google Scholar] [CrossRef]
  26. Guo, B.; Wang, Y.; Zhang, X.; Che, H.; Ming, J.; Yi, Z. Long-Term Variation of Black Carbon Aerosol in China Based on Revised Aethalometer Monitoring Data. Atmosphere 2020, 11, 684. [Google Scholar] [CrossRef]
  27. Zhang, Y.; Kang, S.; Li, C.; Gao, T.; Cong, Z.; Sprenger, M.; Liu, Y.; Li, X.; Guo, J.; Sillanpää, M.; et al. Characteristics of black carbon in snow from Laohugou No. 12 glacier on the northern Tibetan Plateau. Sci. Total. Environ. 2017, 607, 1237–1249. [Google Scholar] [CrossRef]
  28. Cao, G.; Zhang, X.-Y.; Zheng, F. Inventory of black carbon and organic carbon emissions from China. Atmospheric Environ. 2006, 40, 6516–6527. [Google Scholar] [CrossRef]
  29. Torres, A.; Bond, T.C.; Lehmann, C.M.B.; Subramanian, R.; Hadley, O.L. Measuring Organic Carbon and Black Carbon in Rainwater: Evaluation of Methods. Aerosol Sci. Technol. 2014, 48, 239–250. [Google Scholar] [CrossRef]
  30. Shen, L.; Hao, F.; Gao, M.; Wang, H.; Zhu, B.; Gao, J.; Cheng, Y.; Xie, F. Real-time geochemistry of urban aerosol during a heavy dust episode by single-particle aerosol mass spectrometer: Spatio-temporal variability, mixing state and spectral distribution. Particuology 2020, 53, 197–207. [Google Scholar] [CrossRef]
  31. Lapierre, J.F.; Guillemette, F.; Berggren, M.; Del Giorgio, A. Increases in terrestrially derived carbon stimulate organic carbon processing and CO2 emissions in boreal aquatic ecosystems. Nat. Commun. 2013, 4, 1–7. [Google Scholar] [CrossRef] [PubMed]
  32. Wang, H.; Miao, Q.; Shen, L.; Yang, Q.; Wu, Y.; Wei, H. Air pollutant variations in Suzhou during the 2019 novel coronavirus (COVID-19) lockdown of 2020: High time-resolution measurements of aerosol chemical compositions and source apportionment. Environ. Pollut. 2021, 271, 116298. [Google Scholar] [CrossRef] [PubMed]
  33. Xu, B.; Cao, J.; Hansen, J.; Yao, T.; Joswia, D.R.; Wang, N.; Wu, G.; Wang, M.; Zhao, H.; Yang, W.; et al. Black soot and the survival of Tibetan glaciers. Proc. Natl. Acad. Sci. USA 2009, 106, 22114–22118. [Google Scholar] [CrossRef] [Green Version]
  34. Wang, H.; Liu, A.; Zhen, Z.; Yin, Y.; Li, B.; Li, Y.; Chen, K.; Xu, J. Vertical Structures of Meteorological Elements and Black Carbon at Mt. Tianshan Using an Unmanned Aerial Vehicle System. Remote Sens. 2021, 13, 1267. [Google Scholar] [CrossRef]
  35. Doherty, S.J.; Warren, S.G.; Grenfell, T.C.; Clarke, A.D.; Brandt, R.E. Light-absorbing impurities in Arctic snow. Atmos. Chem. Phys. Discuss. 2010, 10, 11647–11680. [Google Scholar] [CrossRef] [Green Version]
  36. Pan, X.L.; Kanaya, Y.; Wang, Z.F.; Liu, Y.; Pochanart Akimoto, H.; Sun, Y.L.; Dong, H.B.; Li, J.; Irie, H.; Takigawa, M. Correlation of black carbon aerosol and carbon monoxide in the high-altitude environment of Mt. Huang in Eastern China. Atmos. Chem. Phys. 2011, 11, 9735–9747. [Google Scholar] [CrossRef] [Green Version]
  37. Grenfell, T.C.; Doherty, S.J.; Clarke, A.D.; Warren, S.G. Light absorption from particulate impurities in snow and ice determined by spectrophotometric analysis of filters. Appl. Opt. 2011, 50, 2037–2048. [Google Scholar] [CrossRef] [PubMed]
  38. Dumont, M.; Brun, E.; Picard, G.; Michou, M.; Libois, Q.; Petit, J.-R.; Geyer, M.; Morin, S.; Josse, B. Contribution of light-absorbing impurities in snow to Greenland’s darkening since 2009. Nat. Geosci. 2014, 7, 509–512. [Google Scholar] [CrossRef]
  39. Niu, H.; Kang, S.; Zhang, Y.; Shi, X.; Shi, X.; Wang, S.; Li, G.; Yan, X.; Pu, T.; He, Y. Distribution of light-absorbing impurities in snow of glacier on Mt. Yulong, southeastern Tibetan Plateau. Atmos. Res. 2017, 197, 474–484. [Google Scholar] [CrossRef]
  40. Zhou, Y.; Wang, X.; Wu, X.; Cong, Z.; Wu, G.; Ji, M. Quantifying Light Absorption of Iron Oxides and Carbonaceous Aerosol in Seasonal Snow across Northern China. Atmosphere 2017, 8, 63. [Google Scholar] [CrossRef] [Green Version]
  41. Schwarz, J.; Doherty, S.J.; Li, F.; Ruggiero, S.T.; Tanner, C.E.; Perring, A.E.; Gao, R.S.; Fahey, D.W. Assessing recent measurement techniques for quantifying black carbon concentration in snow. Atmos. Meas. Tech. Discuss. 2012, 5, 3771–3795. [Google Scholar]
  42. Wang, X.; Doherty, S.J.; Huang, J. Black carbon and other light-absorbing impurities in snow across Northern China. J. Geophys. Res. Atmos. 2013, 118, 1471–1492. [Google Scholar] [CrossRef]
  43. Dang, C.; Hegg, D.A. Quantifying light absorption by organic carbon in Western North American snow by serial chemical extractions. J. Geophys. Res. Atmos. 2014, 119, 10–24. [Google Scholar] [CrossRef]
  44. McConnell, J.R.; Edwards, R.; Kok, G.L.; Flanner, M.G.; Zender, C.; Saltzman, E.S.; Banta, J.R.; Pasteris, D.R.; Carter, M.M.; Kahl, J.D.W. 20th-Century Industrial Black Carbon Emissions Altered Arctic Climate Forcing. Science 2007, 317, 1381–1384. [Google Scholar] [CrossRef] [Green Version]
  45. Schwarz, J.P.; Spackman, J.R.; Gao, R.S.; Perring, A.; Cross, E.; Onasch, T.B.; Ahern, A.; Wrobel, W.; Davidovits, P.; Olfert, J.; et al. The Detection Efficiency of the Single Particle Soot Photometer. Aerosol Sci. Technol. 2010, 44, 612–628. [Google Scholar] [CrossRef]
  46. Laborde, M.; Mertes, P.; Zieger, P.; Dommen, J.; Baltensperger, U.; Gysel, M. Sensitivity of the Single Particle Soot Photometer to different black carbon types. Atmos. Meas. Tech. 2012, 5, 1031–1043. [Google Scholar] [CrossRef] [Green Version]
  47. Wendl, I.A.; Menking, J.A.; Färber, R.; Gysel, M.; Kaspari, S.D.; Laborde, M.J.G.; Schwikowski, M. Optimized method for black carbon analysis in ice and snow using the Single Particle Soot Photometer. Atmos. Meas. Tech. 2014, 7, 2667–2681. [Google Scholar] [CrossRef] [Green Version]
  48. Lim, S.; Faïn, X.; Zanatta, M.; Cozic, J.; Jaffrezo, J.-L.; Ginot, P.; Laj, P. Refractory black carbon mass concentrations in snow and ice: Method evaluation and inter-comparison with elemental carbon measurement. Atmos. Meas. Tech. 2014, 7, 3307–3324. [Google Scholar] [CrossRef] [Green Version]
  49. Adachi, K.; Moteki, N.; Kondo, Y.; Igarashi, Y. Mixing states of light-absorbing particles measured using a transmission electron microscope and a single-particle soot photometer in Tokyo, Japan. J. Geophys. Res. Atmos. 2016, 121, 9153–9164. [Google Scholar] [CrossRef] [Green Version]
  50. Corbin, J.C.; Gysel-Beer, M. Detection of tar brown carbon with a single particle soot photometer (SP2). Atmos. Chem. Phys. Discuss. 2019, 19, 15673–15690. [Google Scholar] [CrossRef] [Green Version]
  51. Schwarz, J.; Perring, A.; Markovic, M.; Gao, R.; Ohata, S.; Langridge, J.; Law, D.; McLaughlin, R.; Fahey, D. Technique and theoretical approach for quantifying the hygroscopicity of black-carbon-containing aerosol using a single particle soot photometer. J. Aerosol Sci. 2015, 81, 110–126. [Google Scholar] [CrossRef]
  52. Schwarz, J.P. Extrapolation of single particle soot photometer incandescent signal data. Aerosol Sci. Technol. 2019, 53, 911–920. [Google Scholar] [CrossRef]
  53. Streets, D.G.; Gupta, S.; Waldhoff, S.T.; Wang, M.Q.; Bond, T.C.; Yiyun, B. Black carbon emissions in China. Atmos. Environ. 2001, 35, 4281–4296. [Google Scholar] [CrossRef]
  54. Wang, R.; Tao, S.; Wang, W.; Liu, J.; Shen, H.; Shen, G.; Wang, B.; Liu, X.; Li, W.; Huang, Y.; et al. Black Carbon Emissions in China from 1949 to 2050. Environ. Sci. Technol. 2012, 46, 7595–7603. [Google Scholar] [CrossRef] [PubMed]
  55. Liu, S.; Xia, X.; Zhai, Y.; Wang, R.; Liu, T.; Zhang, S. Black carbon (BC) in urban and surrounding rural soils of Beijing, China: Spatial distribution and relationship with polycyclic aromatic hydrocarbons (PAHs). Chemosphere 2011, 82, 223–228. [Google Scholar] [CrossRef]
  56. Chen, Y.; Schleicher, N.; Fricker, M.; Cen, K.; Liu, X.-L.; Kaminski, U.; Yu, Y.; Wu, X.-F.; Norra, S. Long-term variation of black carbon and PM2.5 in Beijing, China with respect to meteorological conditions and governmental measures. Environ. Pollut. 2016, 212, 269–278. [Google Scholar] [CrossRef]
  57. Shen, L.; Wang, H.; Cheng, M.; Ji, D.; Liu, Z.; Wang, L.; Gao, W.; Yang, Y.; Huang, W.; Zhang, R.; et al. Chemical composition, water content and size distribution of aerosols during different development stages of regional haze episodes over the North China Plain. Atmos. Environ. 2021, 245, 118020. [Google Scholar] [CrossRef]
  58. Hu, Z.; Kang, S.; He, X.; Yan, F.; Zhang, Y.; Chen, P.; Li, X.; Gao, S.; Li, C. Carbonaceous matter in glacier at the head-waters of the Yangtze River: Concentration, sources and fractionation during the melting process. J. Environ. Sci. 2020, 87, 389–397. [Google Scholar] [CrossRef]
  59. Huang, X.; Wang, Z.; Ding, A. Impact of aerosol-PBL interaction on haze pollution: Multiyear observational evidences in North China. Geophys. Res. Lett. 2018, 45, 8596–8603. [Google Scholar] [CrossRef] [Green Version]
  60. Sun, J.; Wang, H.; Yuan, W.; Chen, H. Spatial-temporal features of intense snowfall events in China and their possible change. J. Geophys. Res. Space Phys. 2010, 115. [Google Scholar] [CrossRef]
  61. Gao, S.; Xu, B.; Wang, M.; Li, J.; Liu, D.; Zhao, D. Measuring black carbon in snow and ice in the Tibetan Plateau by single particle soot photometer. J. Glaciol. Geocryol. 2020, 42, 1–7. [Google Scholar]
  62. Kaspari, S.; Painter, T.H.; Gysel, M.; Skiles, S.M.; Schwikowski, M. Seasonal and elevational variations of black car-bon and dust in snow and ice in the Solu-Khumbu, Nepal and estimated radiative forcings. Atmos. Chem. Phys. 2014, 14, 8089–8103. [Google Scholar] [CrossRef]
  63. Jacobson, M.Z. Strong radiative heating due to the mixing state of black carbon in atmospheric aerosols. Nat. Cell Biol. 2001, 409, 695–697. [Google Scholar] [CrossRef] [PubMed]
  64. He, C.; Liou, K.-N.; Takano, Y.; Zhang, R.; Zamora, M.L.; Yang, P.; Li, Q.; Leung, L.R. Variation of the radiative properties during black carbon aging: Theoretical and experimental intercomparison. Atmos. Chem. Phys. Discuss. 2015, 15, 11967–11980. [Google Scholar] [CrossRef] [Green Version]
  65. Flanner, M.G.; Liu, X.; Zhou, C.; Penner, J.; Jiao, C. Enhanced solar energy absorption by internally-mixed black carbon in snow grains. Atmos. Chem. Phys. Discuss. 2012, 12, 4699–4721. [Google Scholar] [CrossRef] [Green Version]
  66. He, C.; Takano, Y.; Liou, K.-N.; Yang, P.; Li, Q.; Chen, F. Impact of Snow Grain Shape and Black Carbon–Snow Internal Mixing on Snow Optical Properties: Parameterizations for Climate Models. J. Clim. 2017, 30, 10019–10036. [Google Scholar] [CrossRef]
  67. He, C.; Liou, K.; Takano, Y. Resolving Size Distribution of Black Carbon Internally Mixed With Snow: Impact on Snow Optical Properties and Albedo. Geophys. Res. Lett. 2018, 45, 2697–2705. [Google Scholar] [CrossRef]
  68. Schwarz, J.P.; Doherty, S.J.; Li, F.; Ruggiero, S.T.; Tanner, C.; Perring, A.; Gao, R.S.; Fahey, D.W. Assessing Single Particle Soot Photometer and Integrating Sphere/Integrating Sandwich Spectrophotometer measurement techniques for quantifying black carbon concentration in snow. Atmos. Meas. Tech. 2012, 5, 2581–2592. [Google Scholar] [CrossRef] [Green Version]
  69. Flanner, M.G.; Zender, C.S.; Randerson, J.T.; Rasch, P.J. Present-day climate forcing and response from black carbon in snow. J. Geophys. Res. Atmos. 2007, 112, D11202. [Google Scholar] [CrossRef] [Green Version]
  70. Huang, H.; Zhu, H.; Gan, W.; Chen, X.; Yang, X. Occurrence of nitrogenous and carbonaceous disinfection byproducts in drinking water distributed in Shenzhen, China. Chemosphere 2017, 188, 257–264. [Google Scholar] [CrossRef]
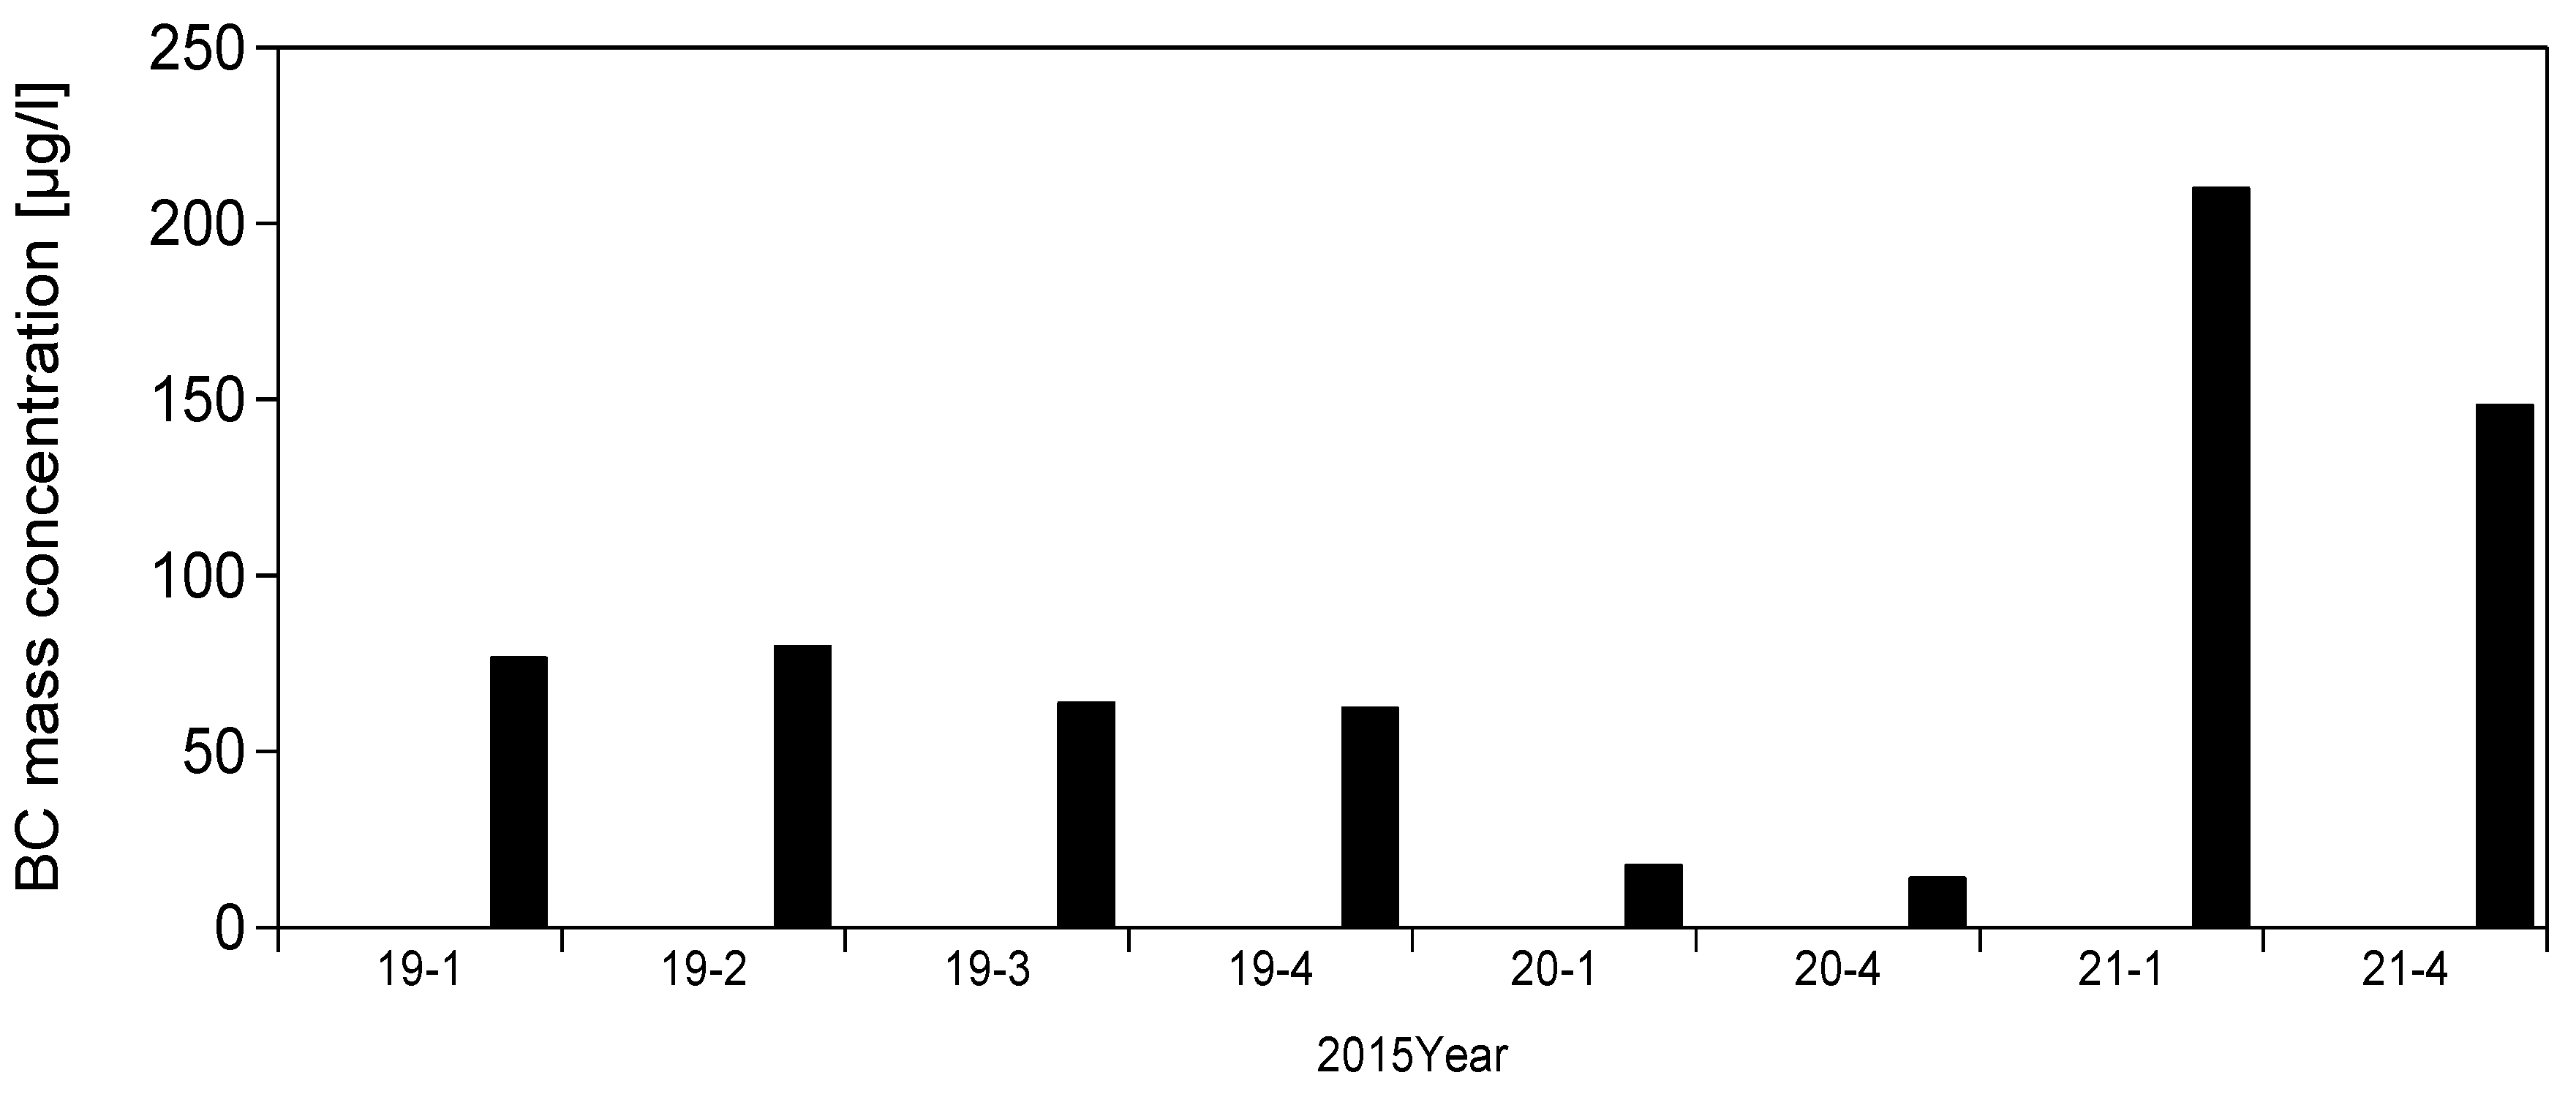
Figure 1. Single particle soot photometer analysis system for testing snow samples.
Atmosphere 12 00816 g001
Figure 2. Change in black carbon concentration in static, stirring, and ultrasonic methods and concentration comparison in three treatment methods.
Atmosphere 12 00816 g002aAtmosphere 12 00816 g002b
Figure 3. Aquadag samples of presonication (left) and post-sonication (right) after long-term placement.
Atmosphere 12 00816 g003
Figure 4. Effect of dilution on black carbon measurement.
Atmosphere 12 00816 g004
Figure 5. The mass concentration of BC in snow.
Atmosphere 12 00816 g005
Figure 6. Size distribution of BC in snow.
Atmosphere 12 00816 g006
Figure 7. Mass concentration time series of BC in Beijing urban area on the 19th to 21st.
Atmosphere 12 00816 g007
Table 1. Summary of BC concentration and actual concentration.
No.No. of SamplesConcentration
(ng/mL)
Actual Concentration
(ng/mL)
Weather
119-115.399576.9975Light snow
219-216.057680.288Light snow
319-312.851964.2595Light snow
419-412.572462.862Light snow
520-13.6376318.18815Moderate snow
620-42.8943814.4719Moderate snow
721-142.1161210.5805Heavy snow
821-429.7629148.8145Heavy snow
Publisher’s Note: MDPI stays neutral with regard to jurisdictional claims in published maps and institutional affiliations.

