
Impacts of Non-Local versus Local Moisture Sources on a Heavy (and Deadly) Rain Event in Israel

 , , and
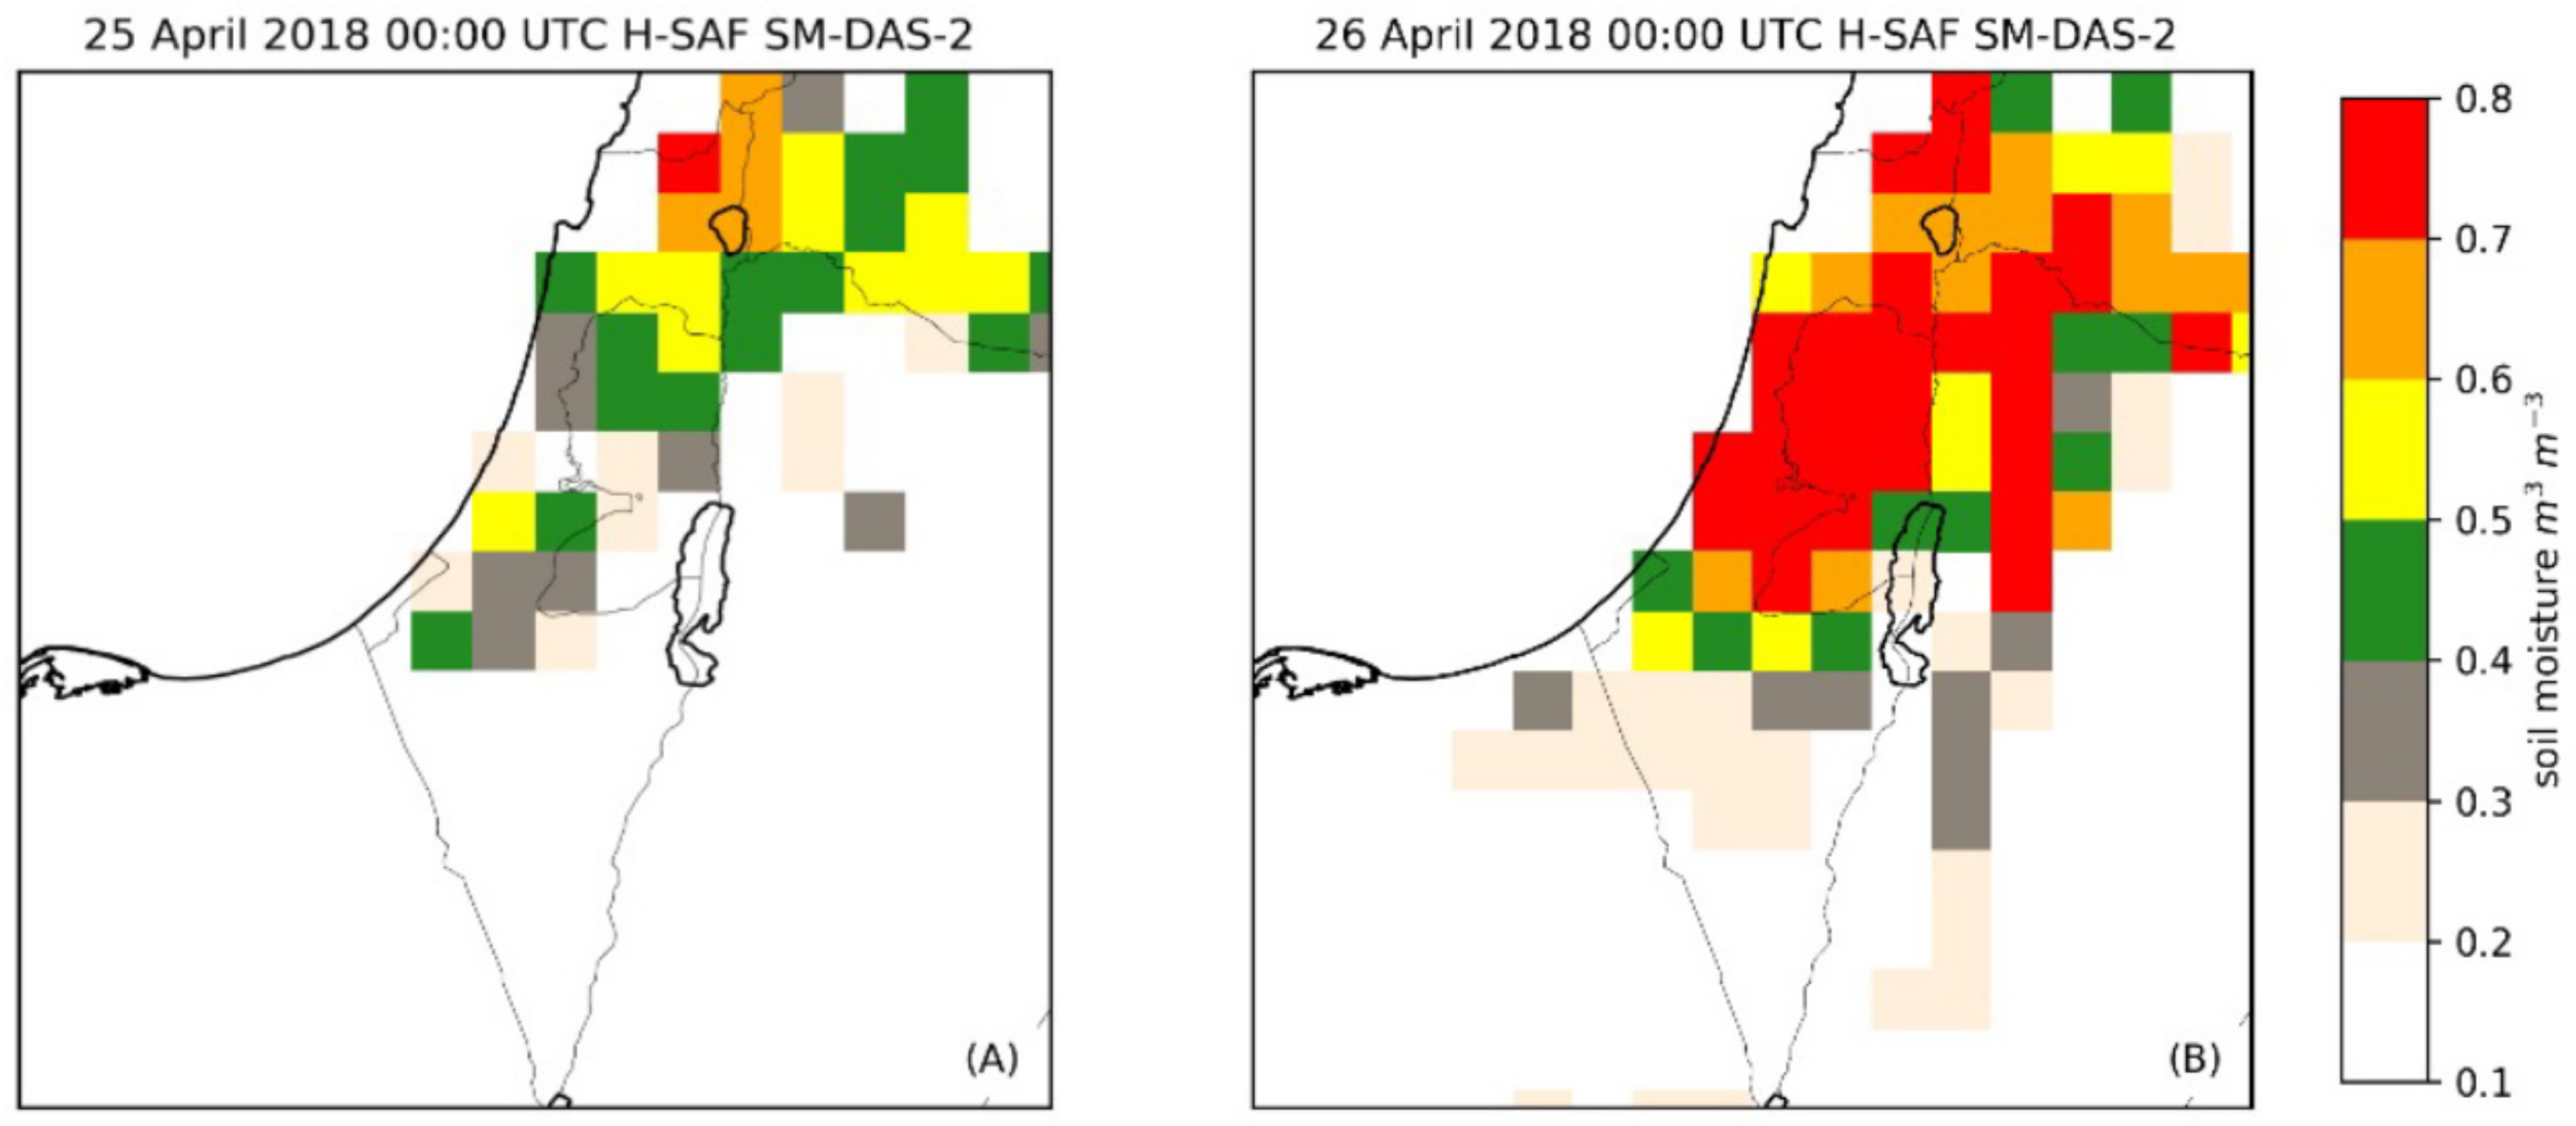
Abstract
:1. Introduction
2. Observations
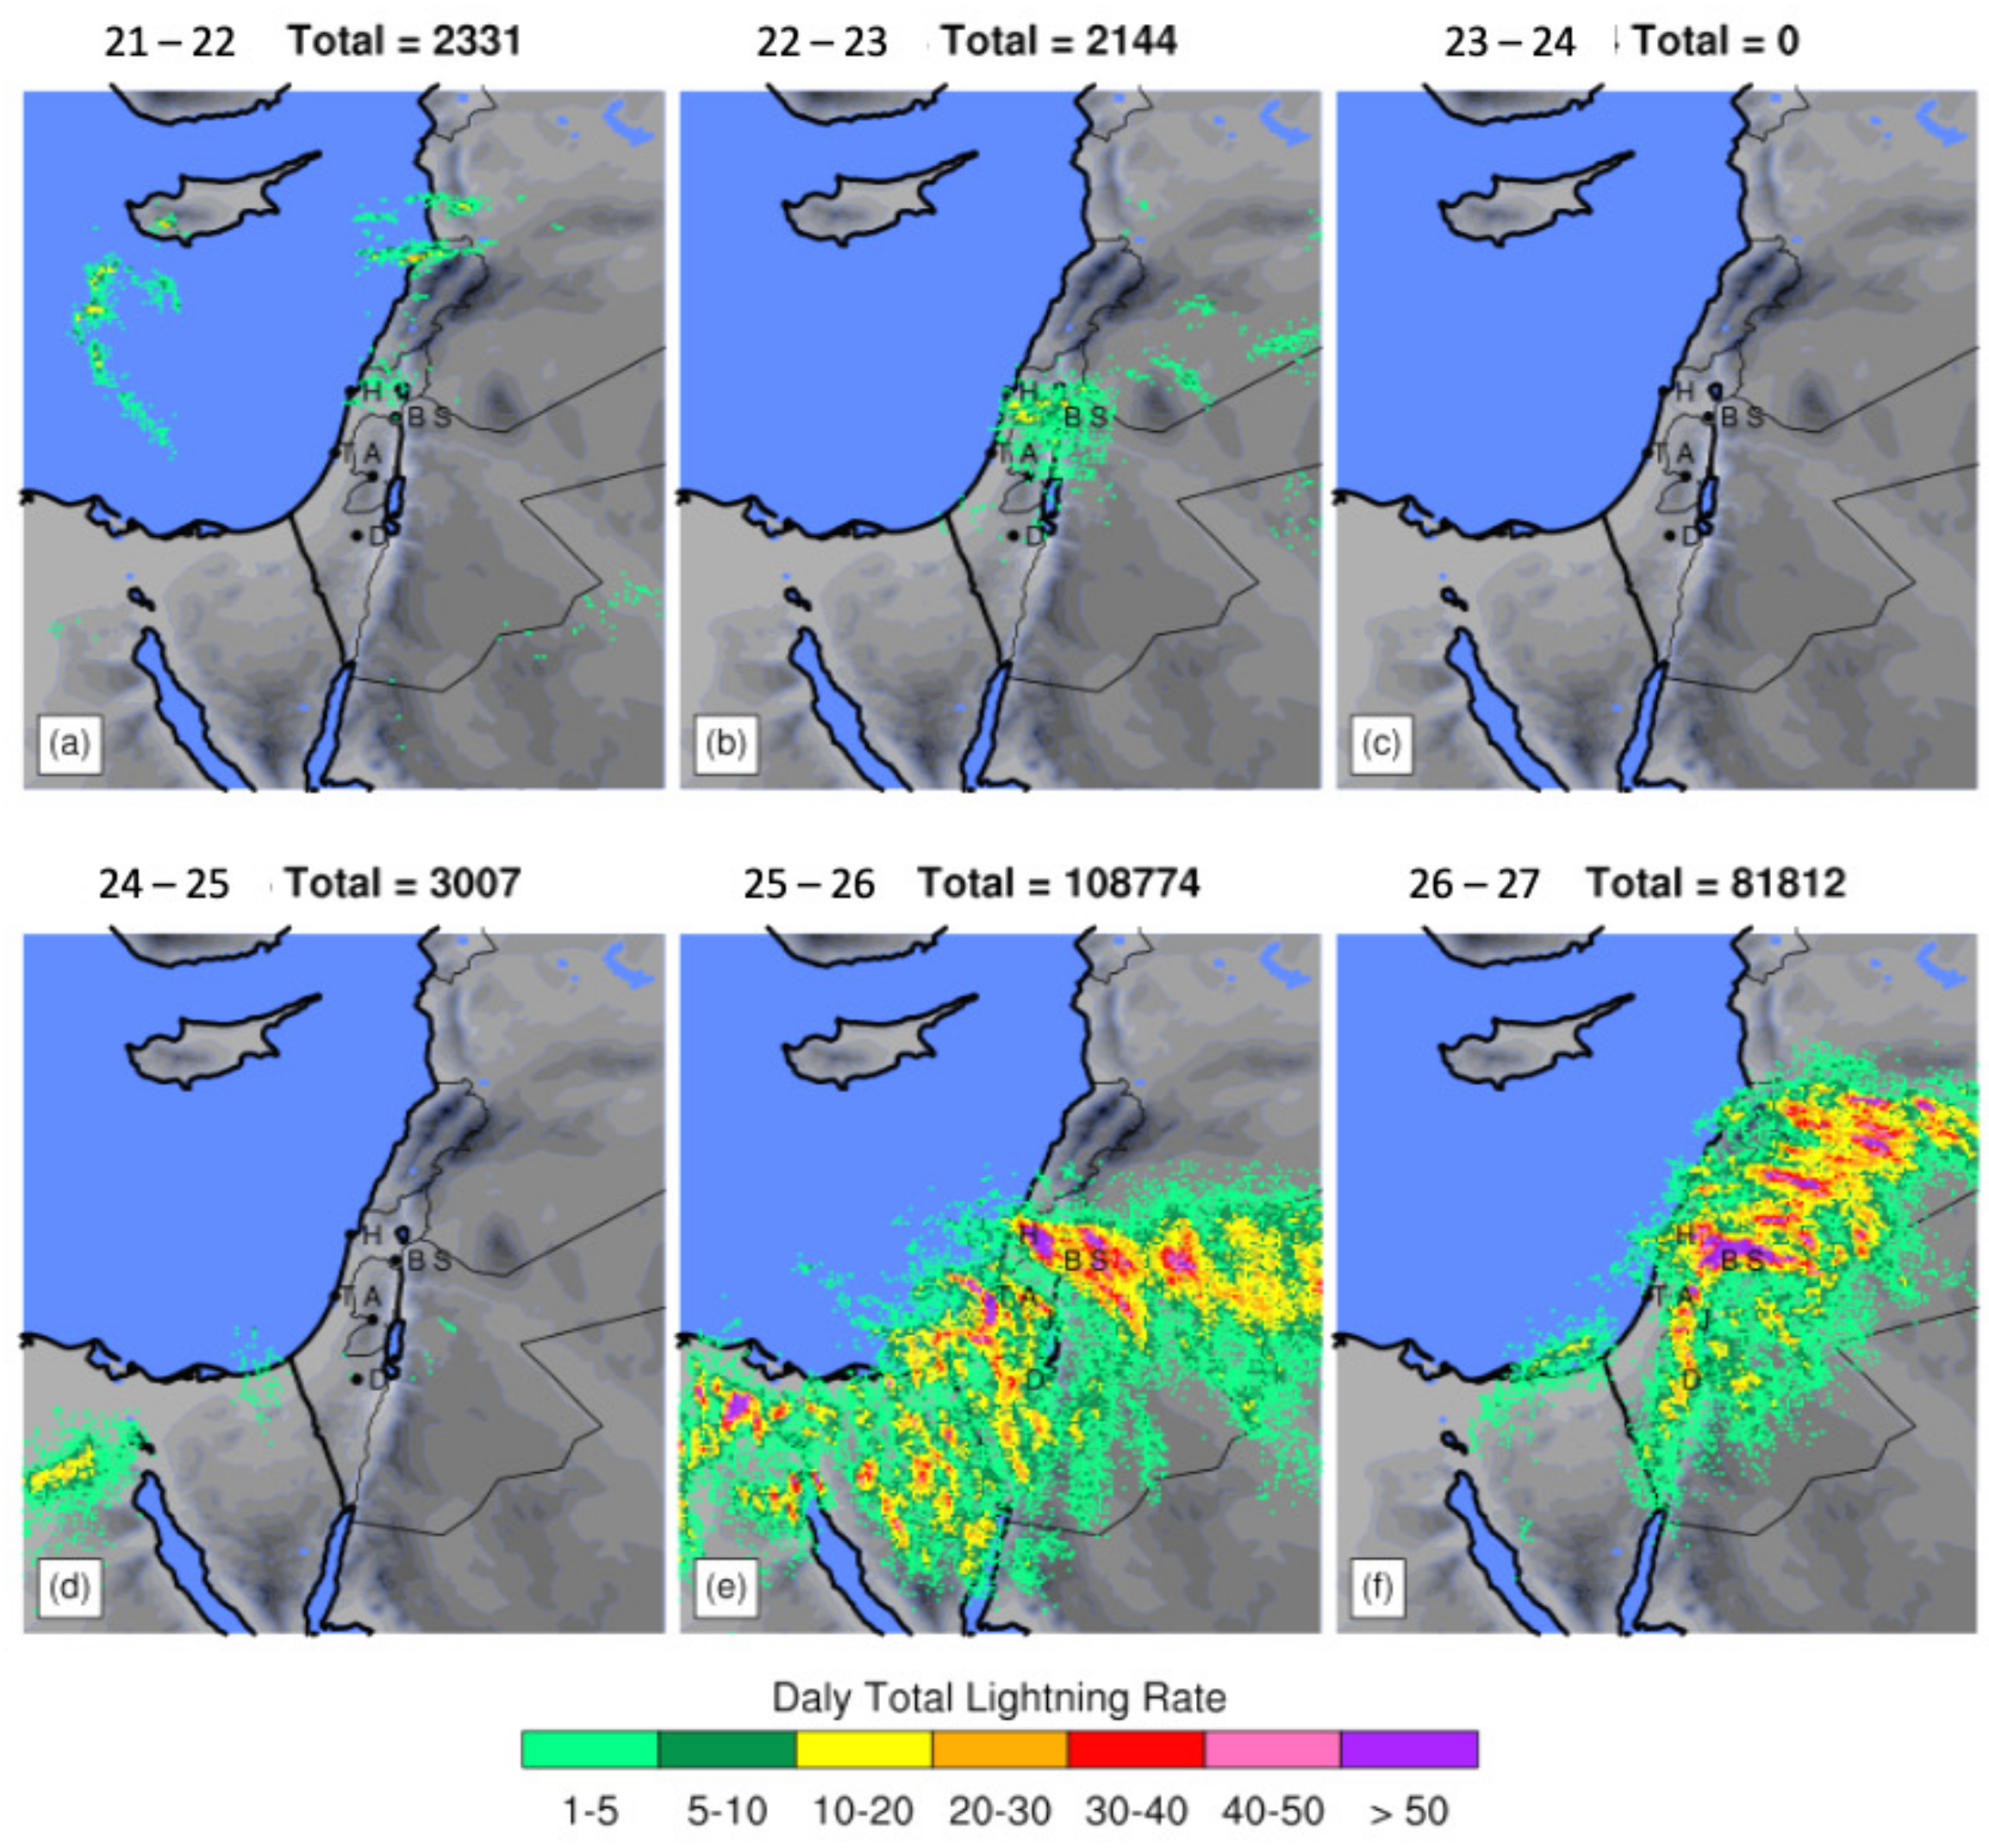
2.1. Lightning Data
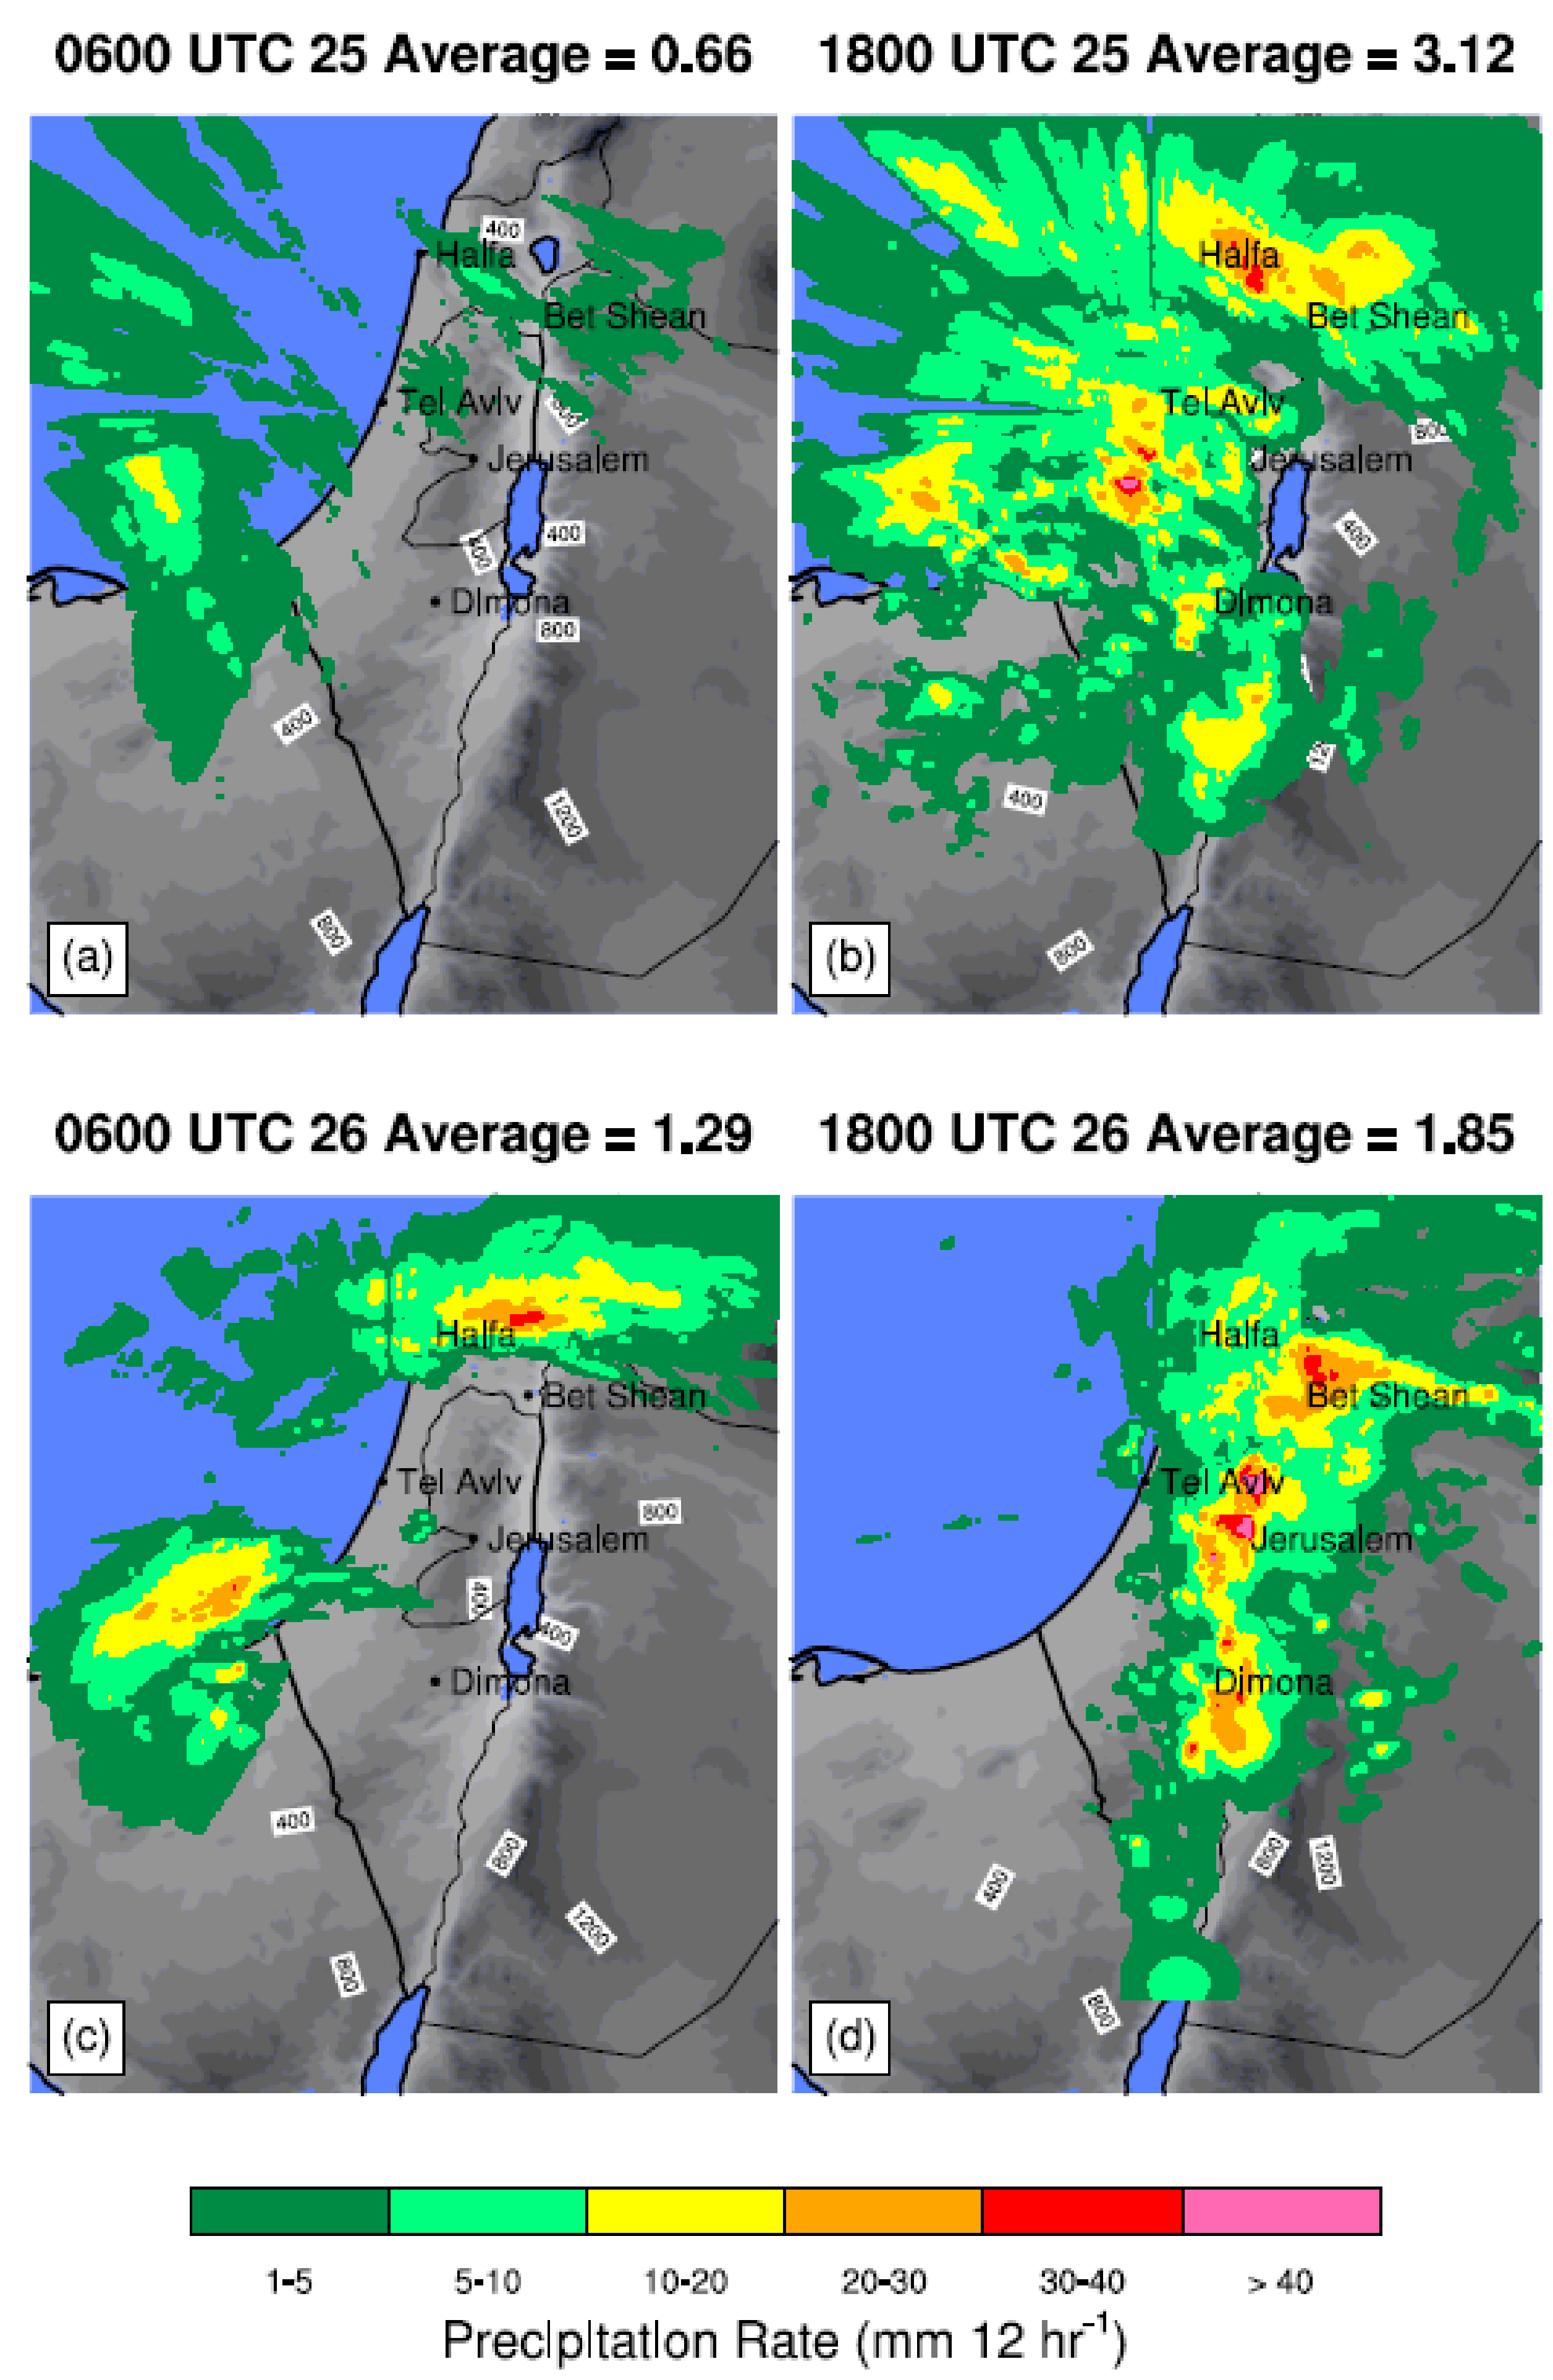
2.2. Observed Precipitation
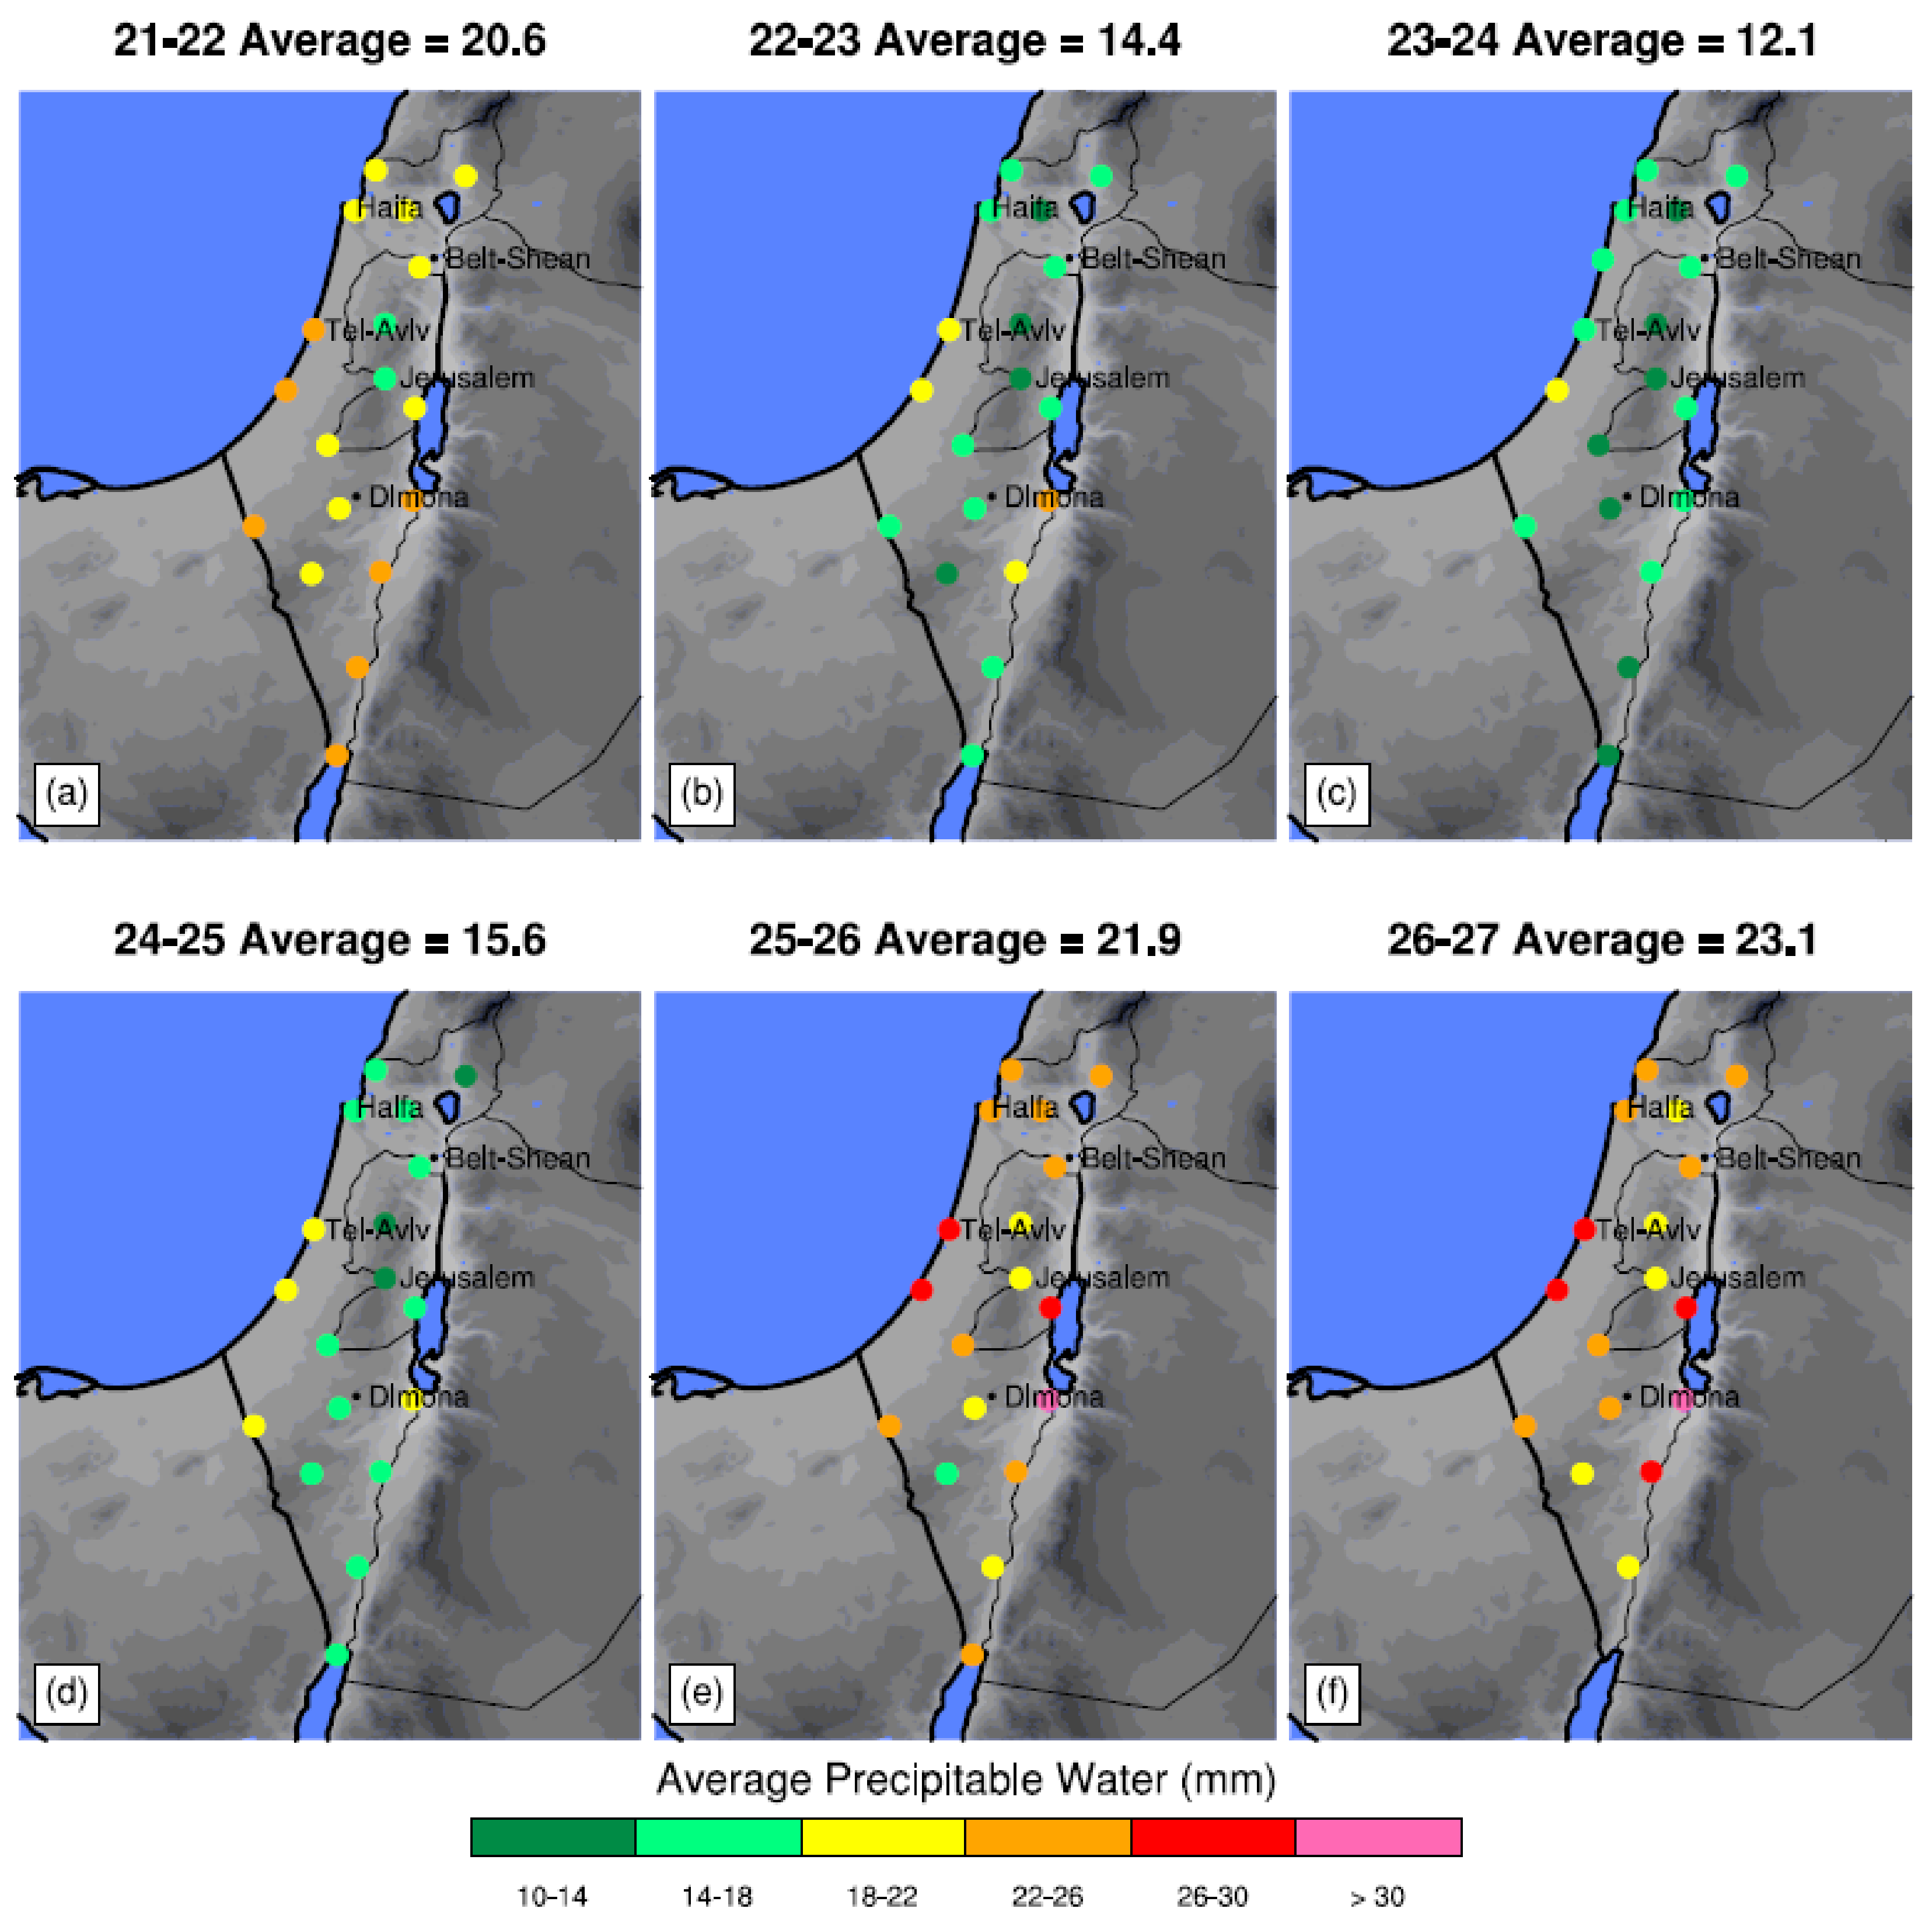
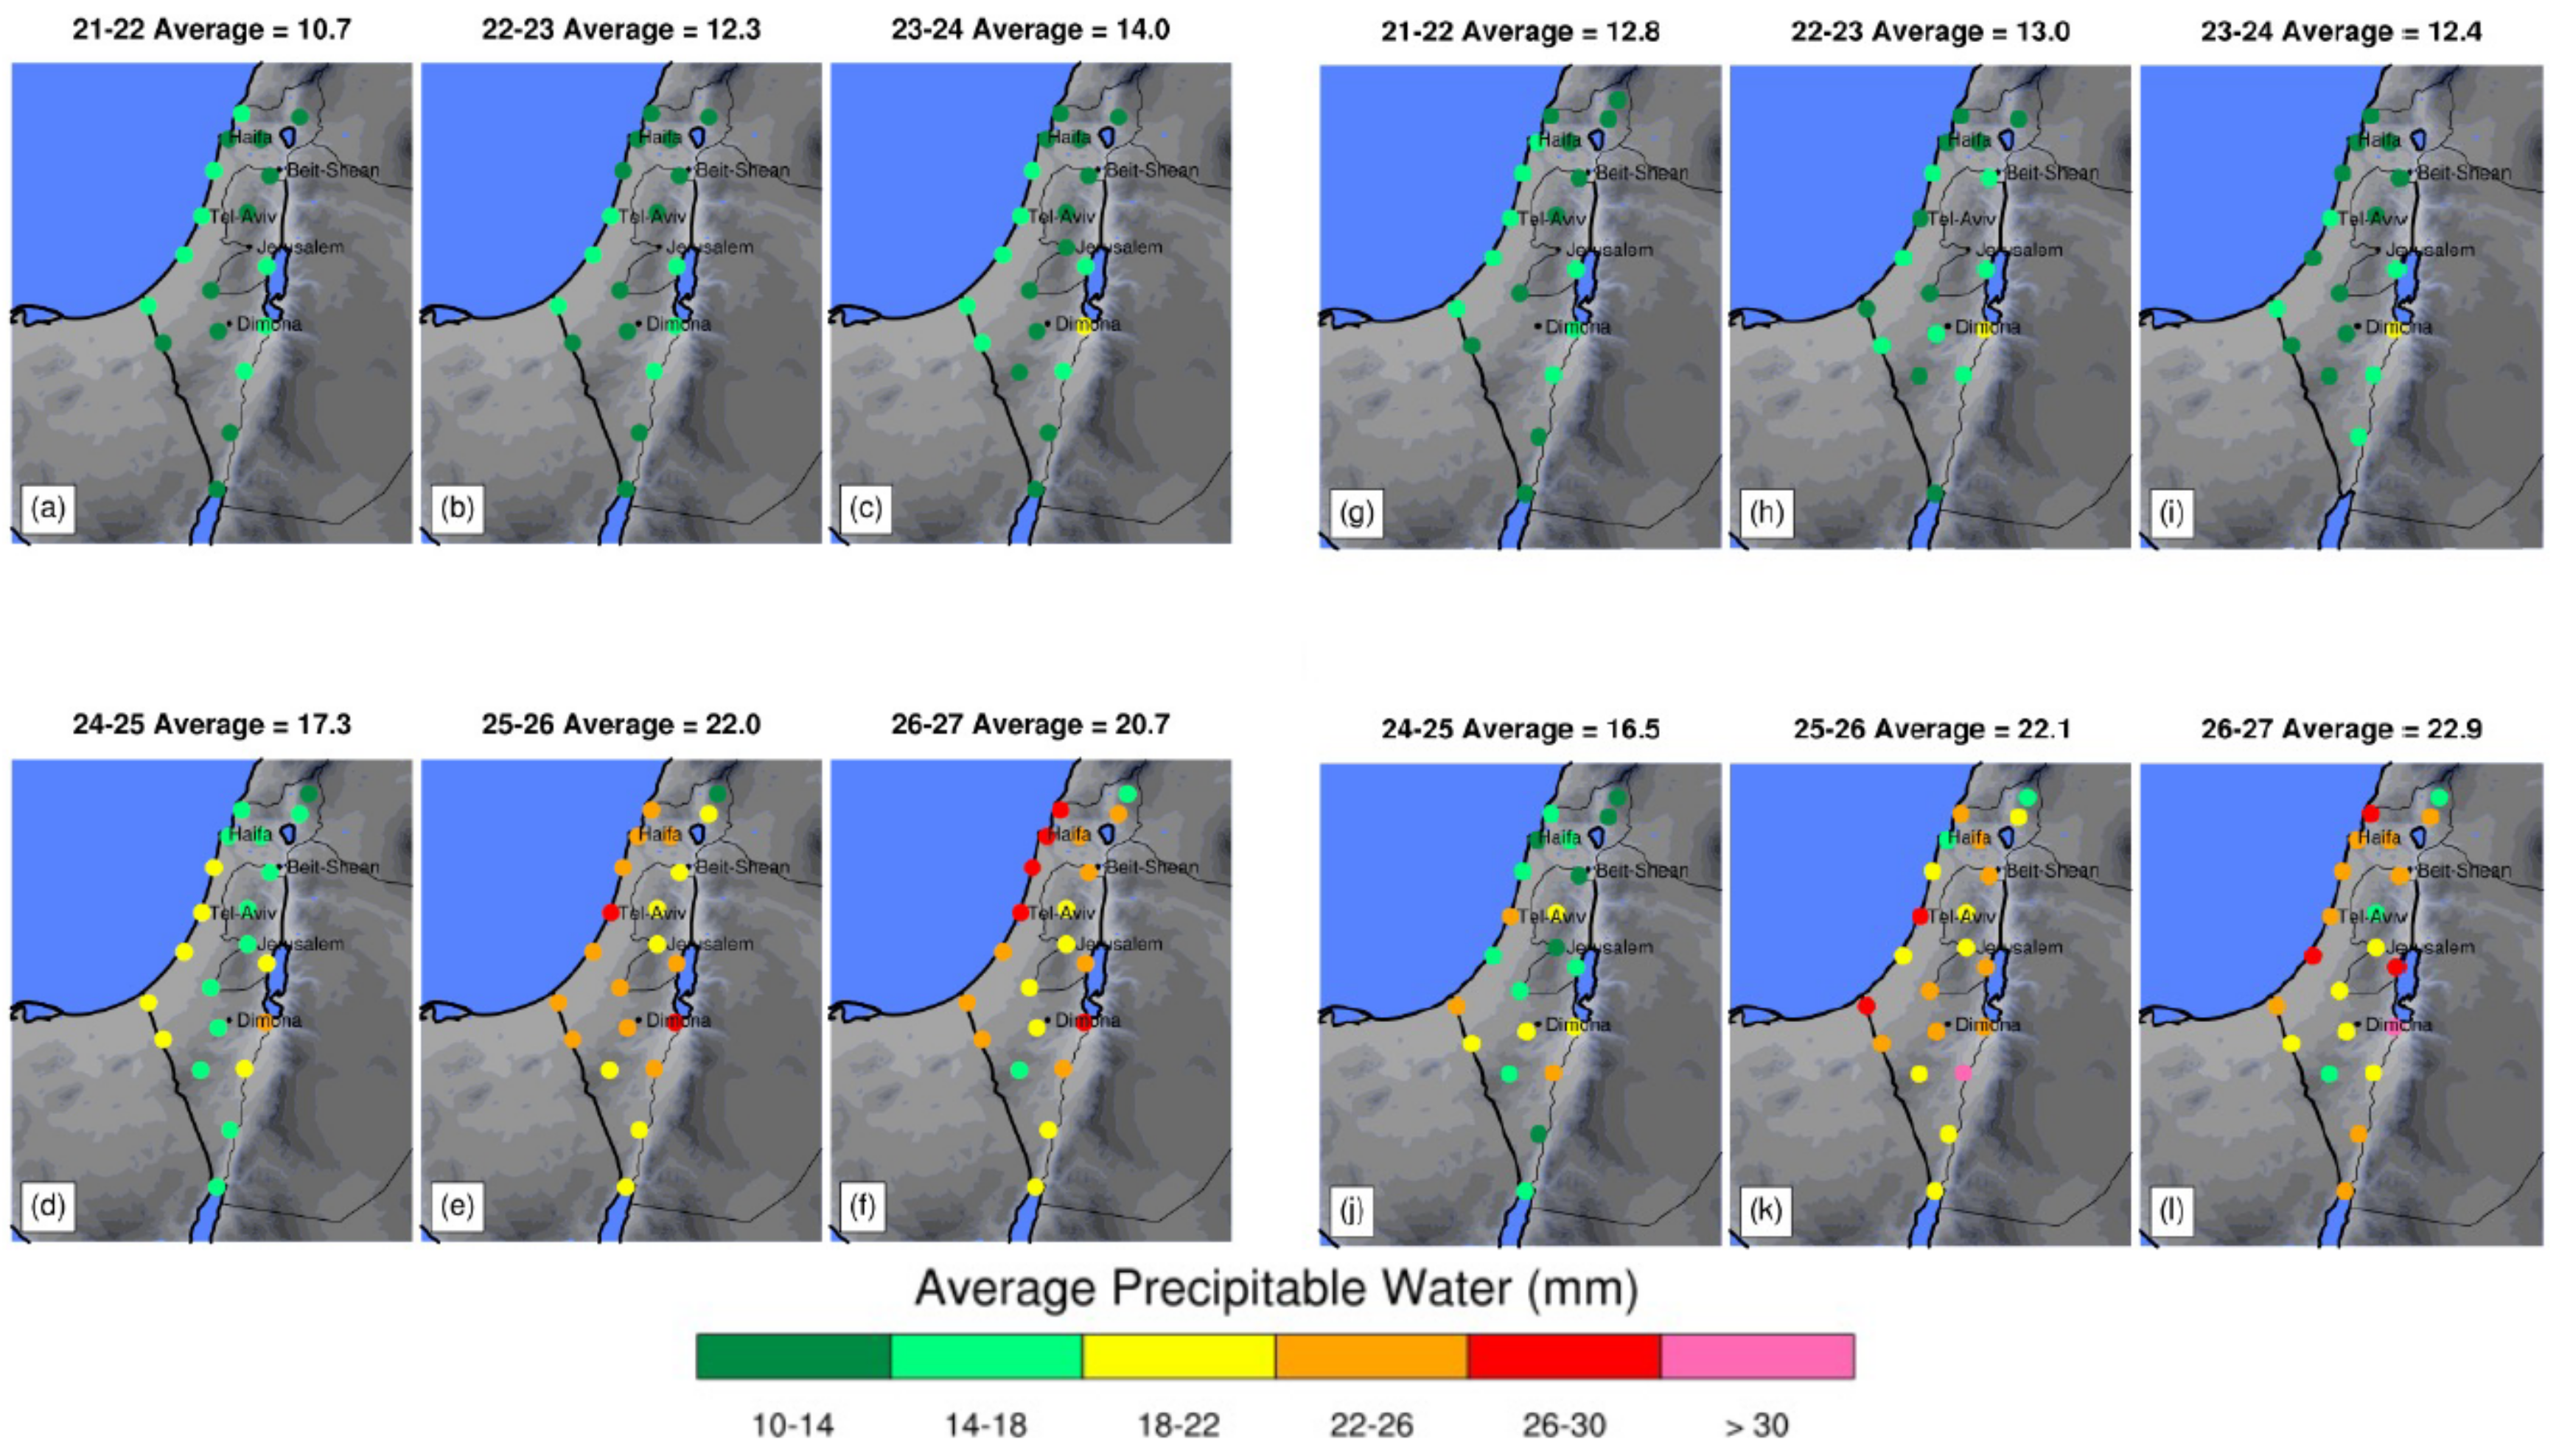
2.3. Estimation of Precipitable Water Vapor (PWV)
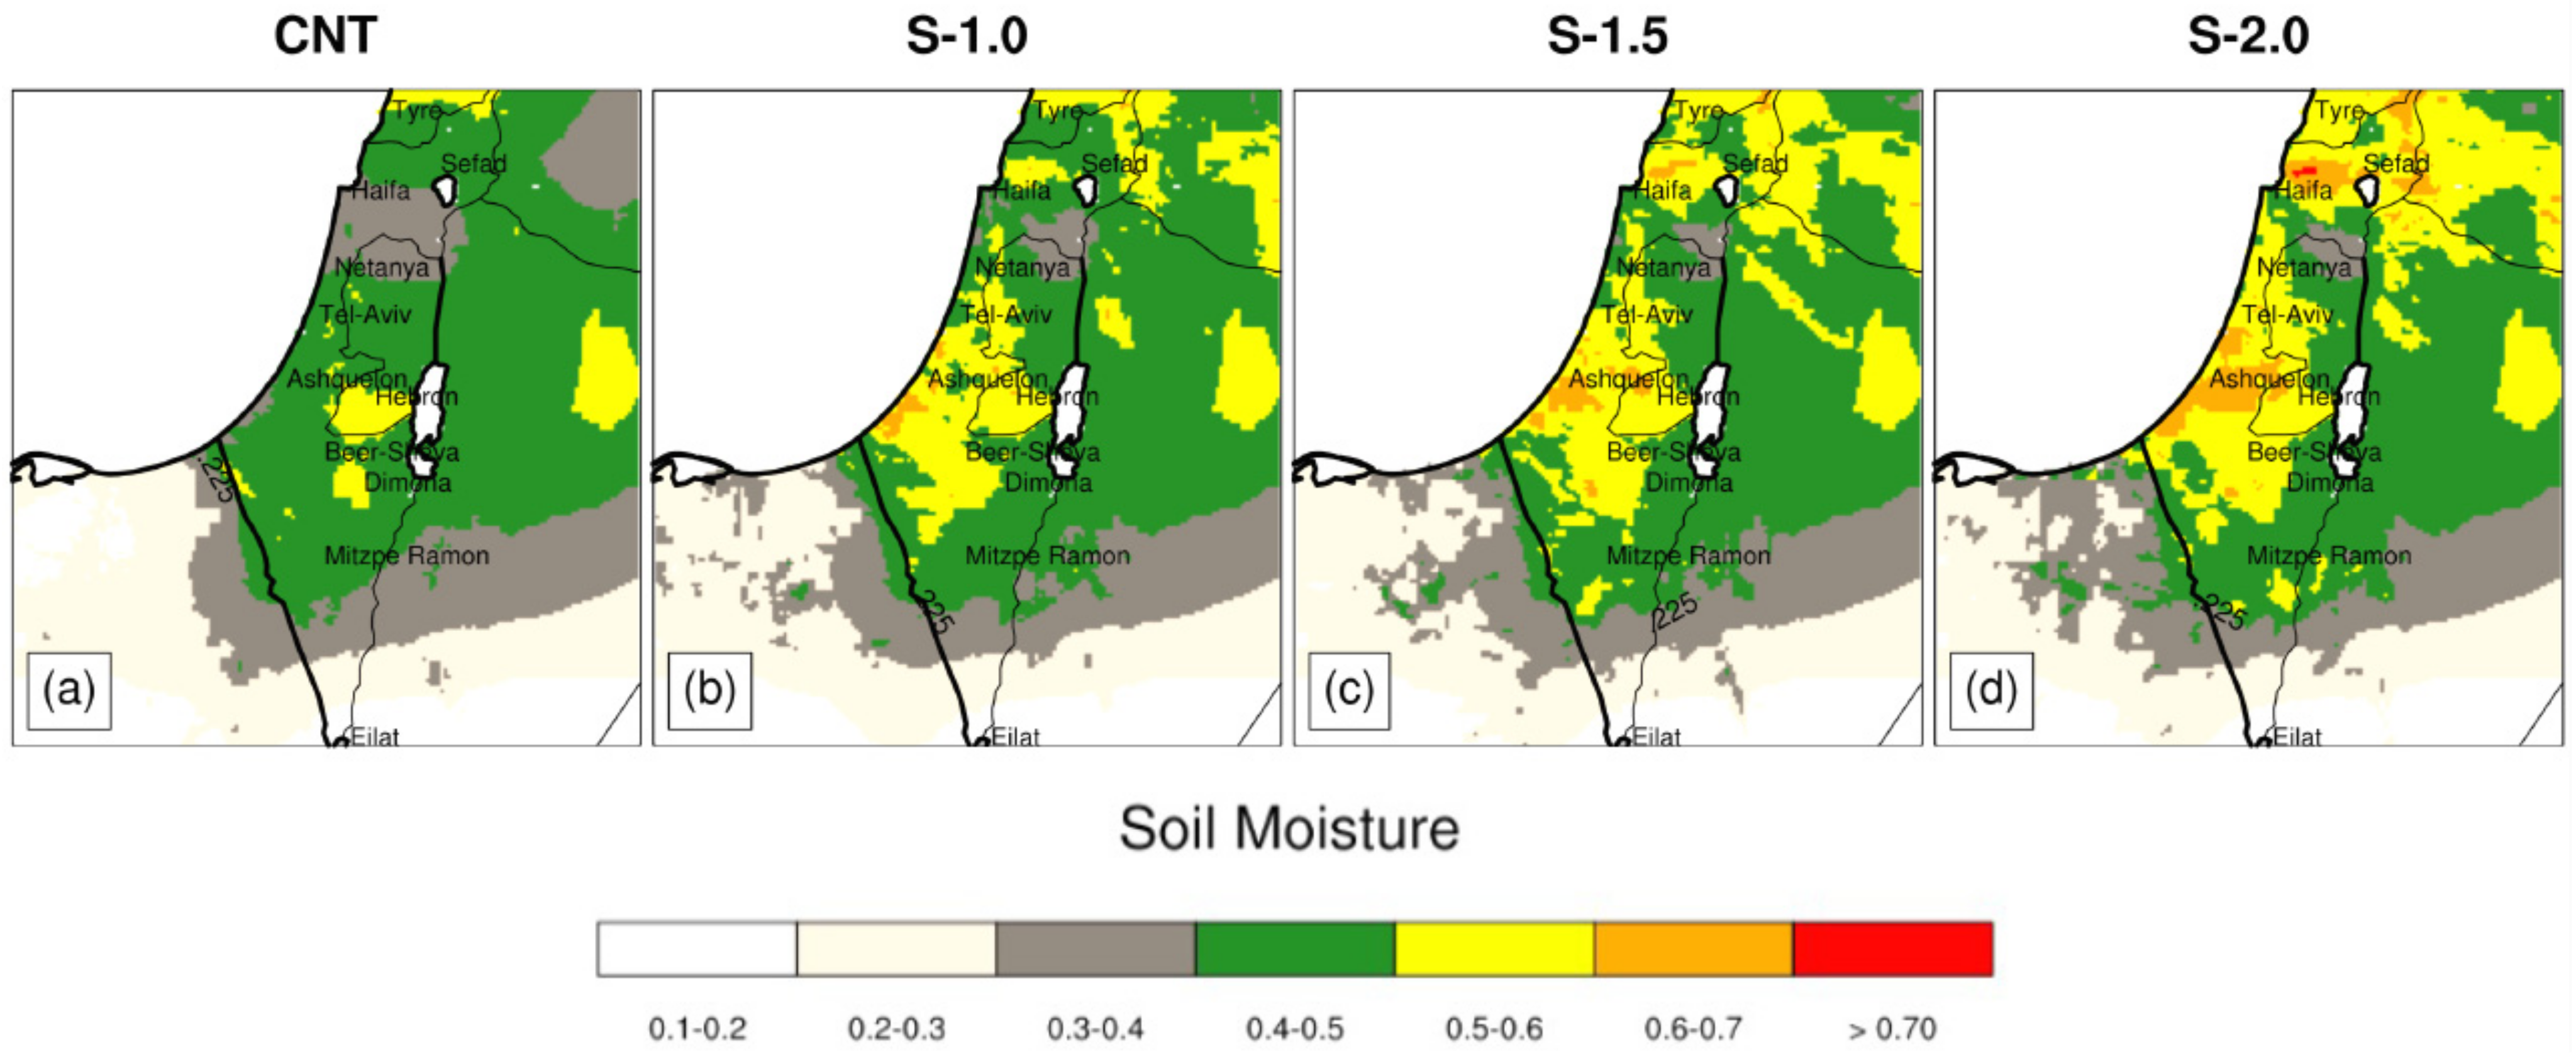
2.4. Soil Moisture
3. Model Description
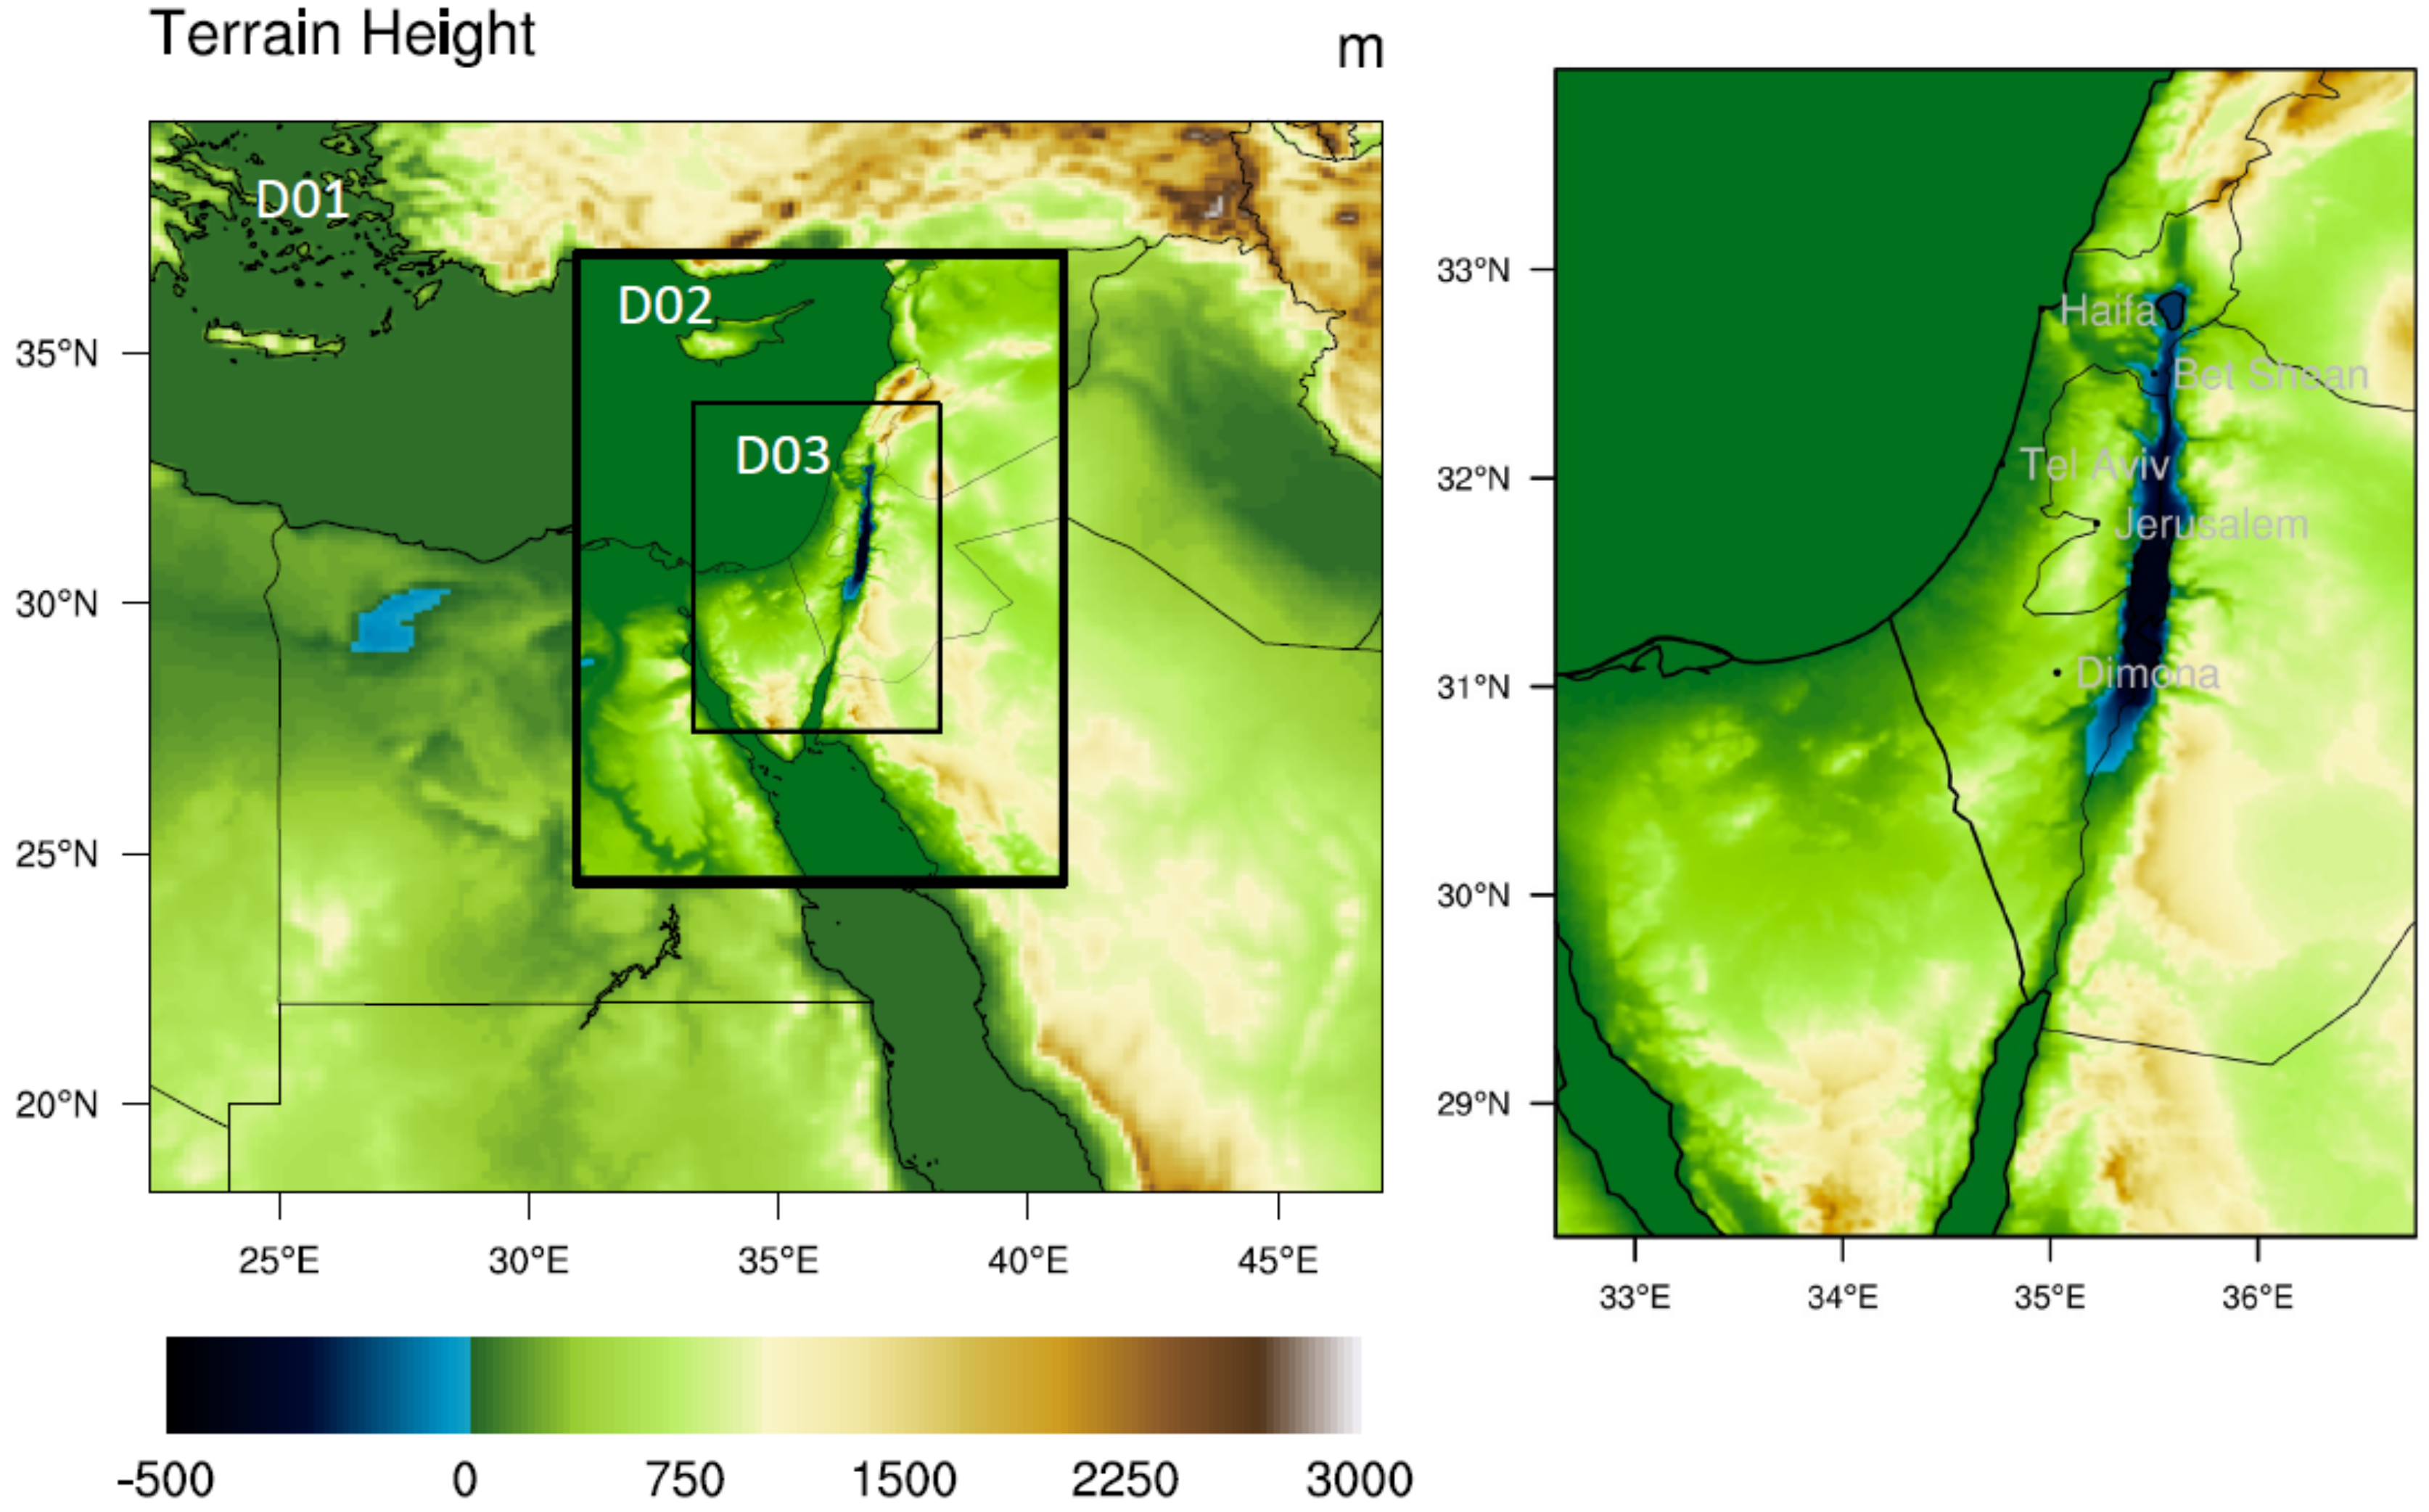
3.1. Domain
3.2. Aerosol Concentrations
3.3. Soil Moisture Initialization
3.4. Forecast Lightning
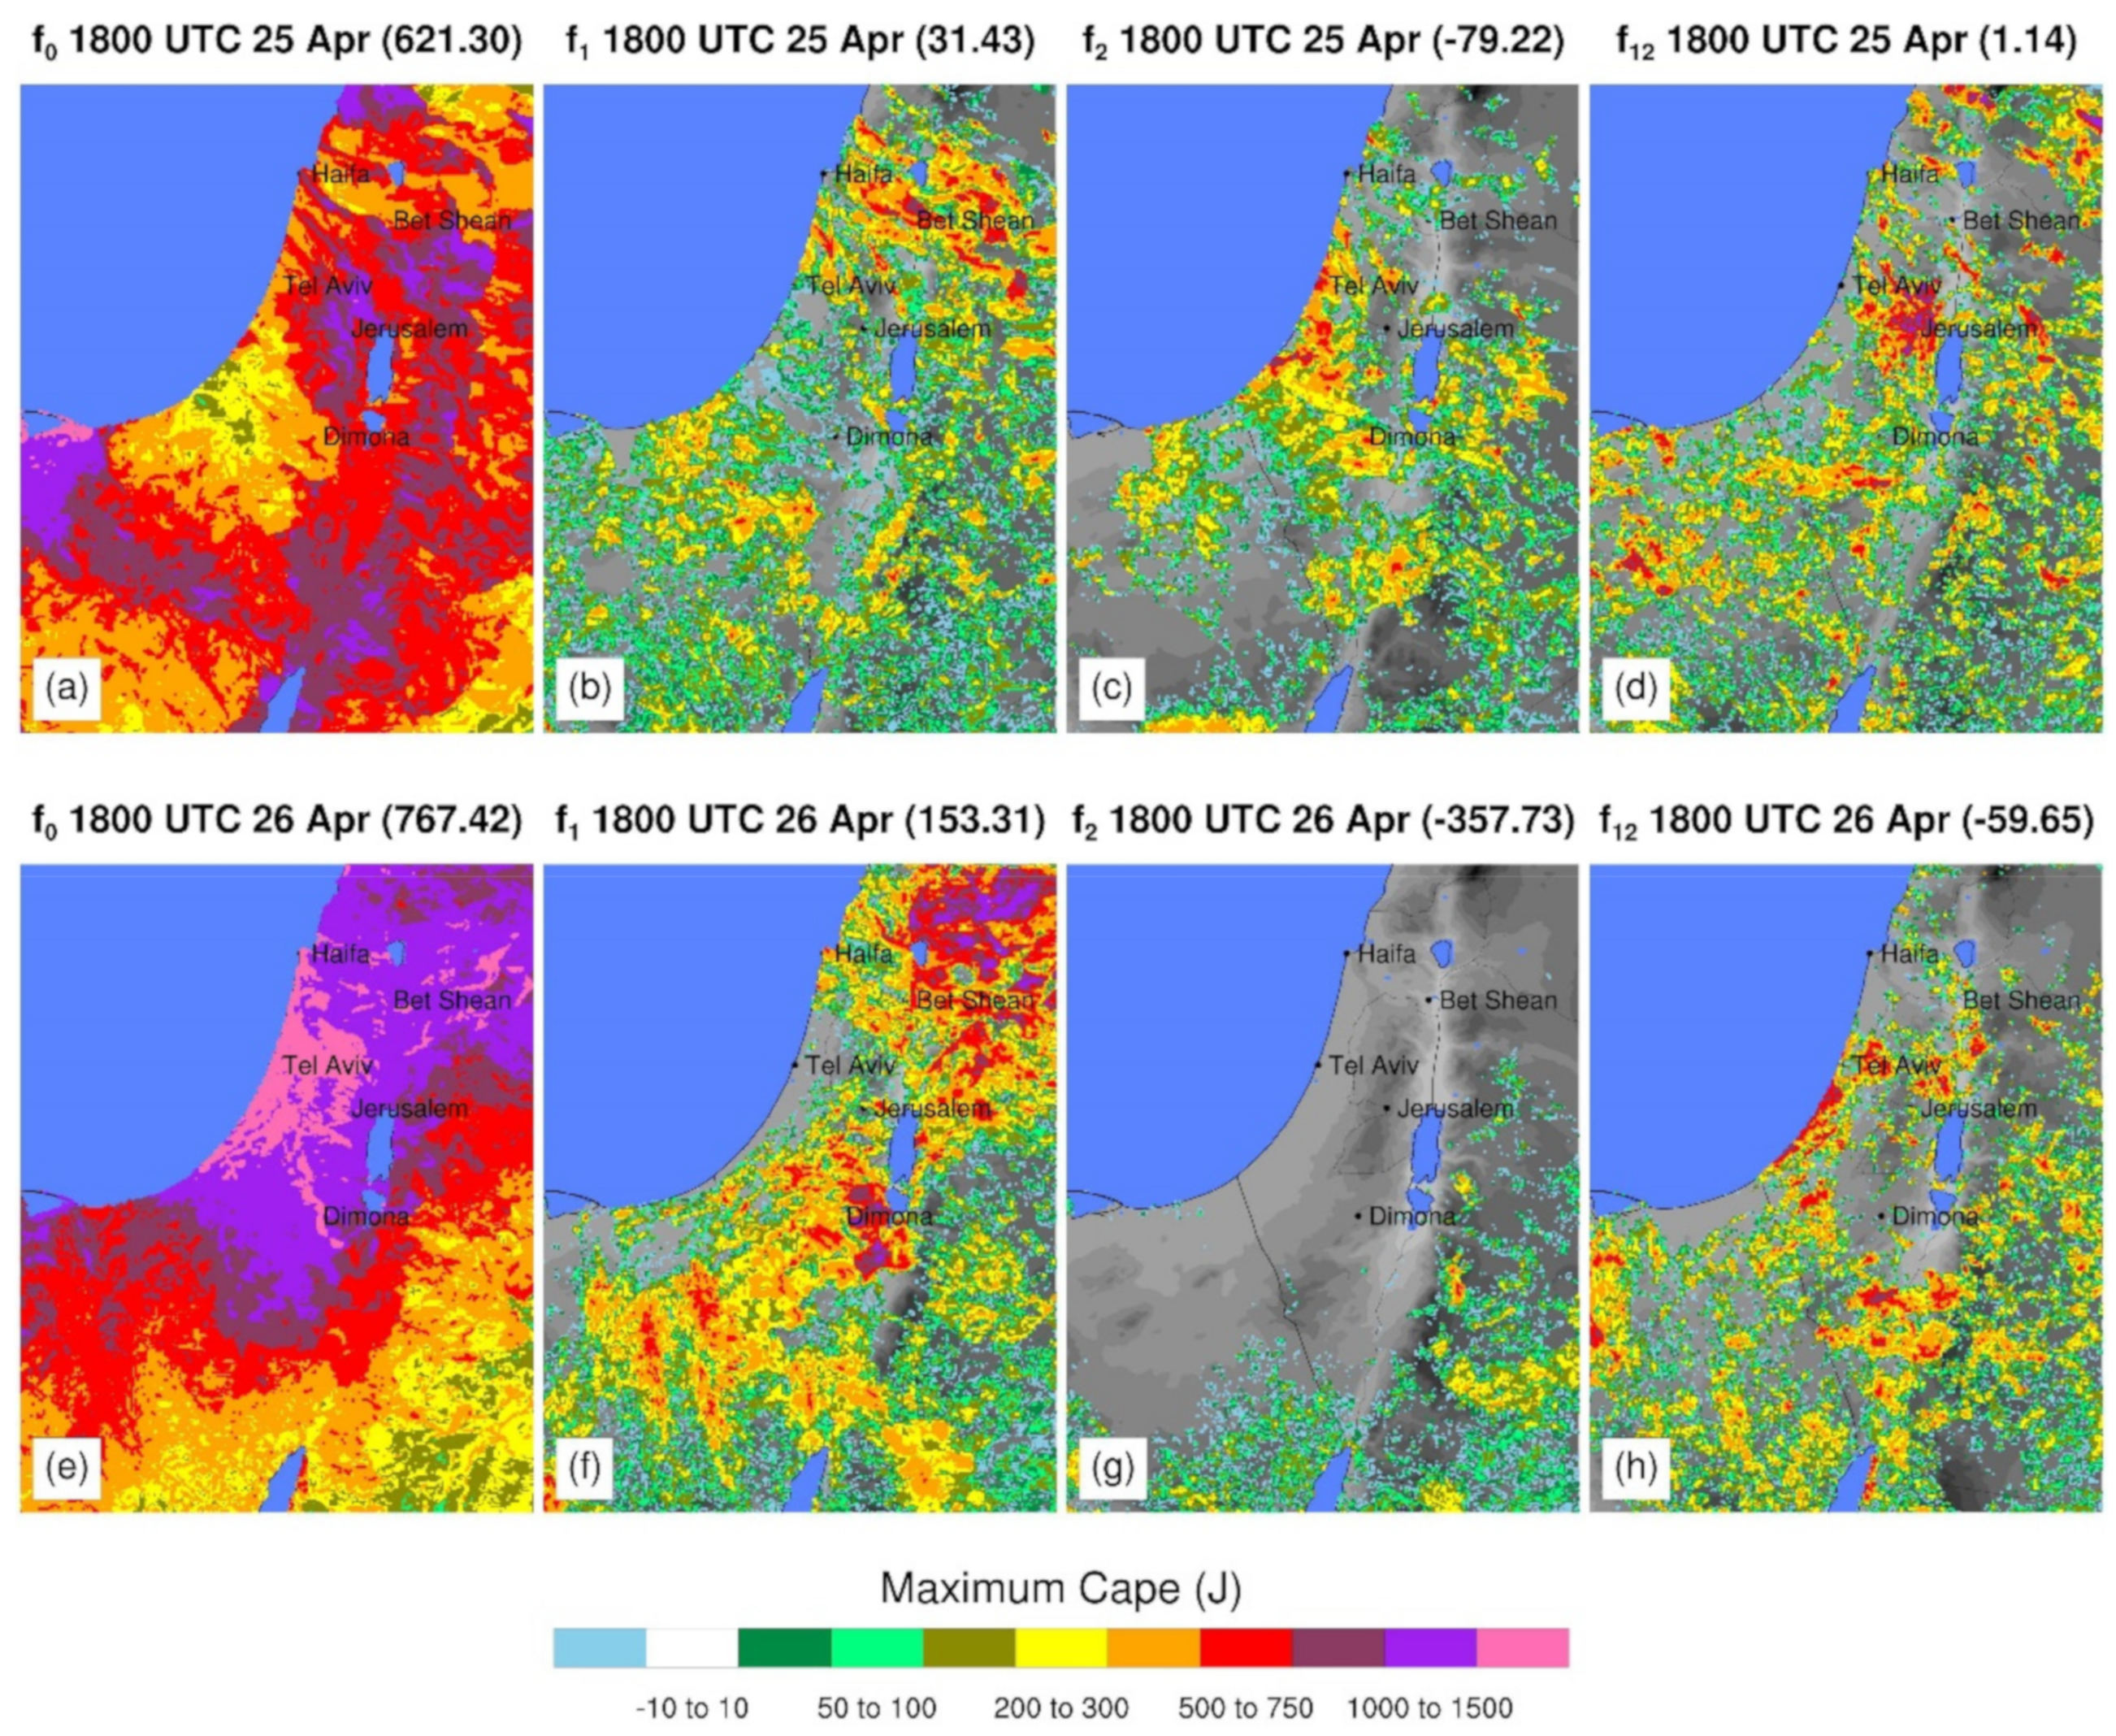
3.5. Factor Separation
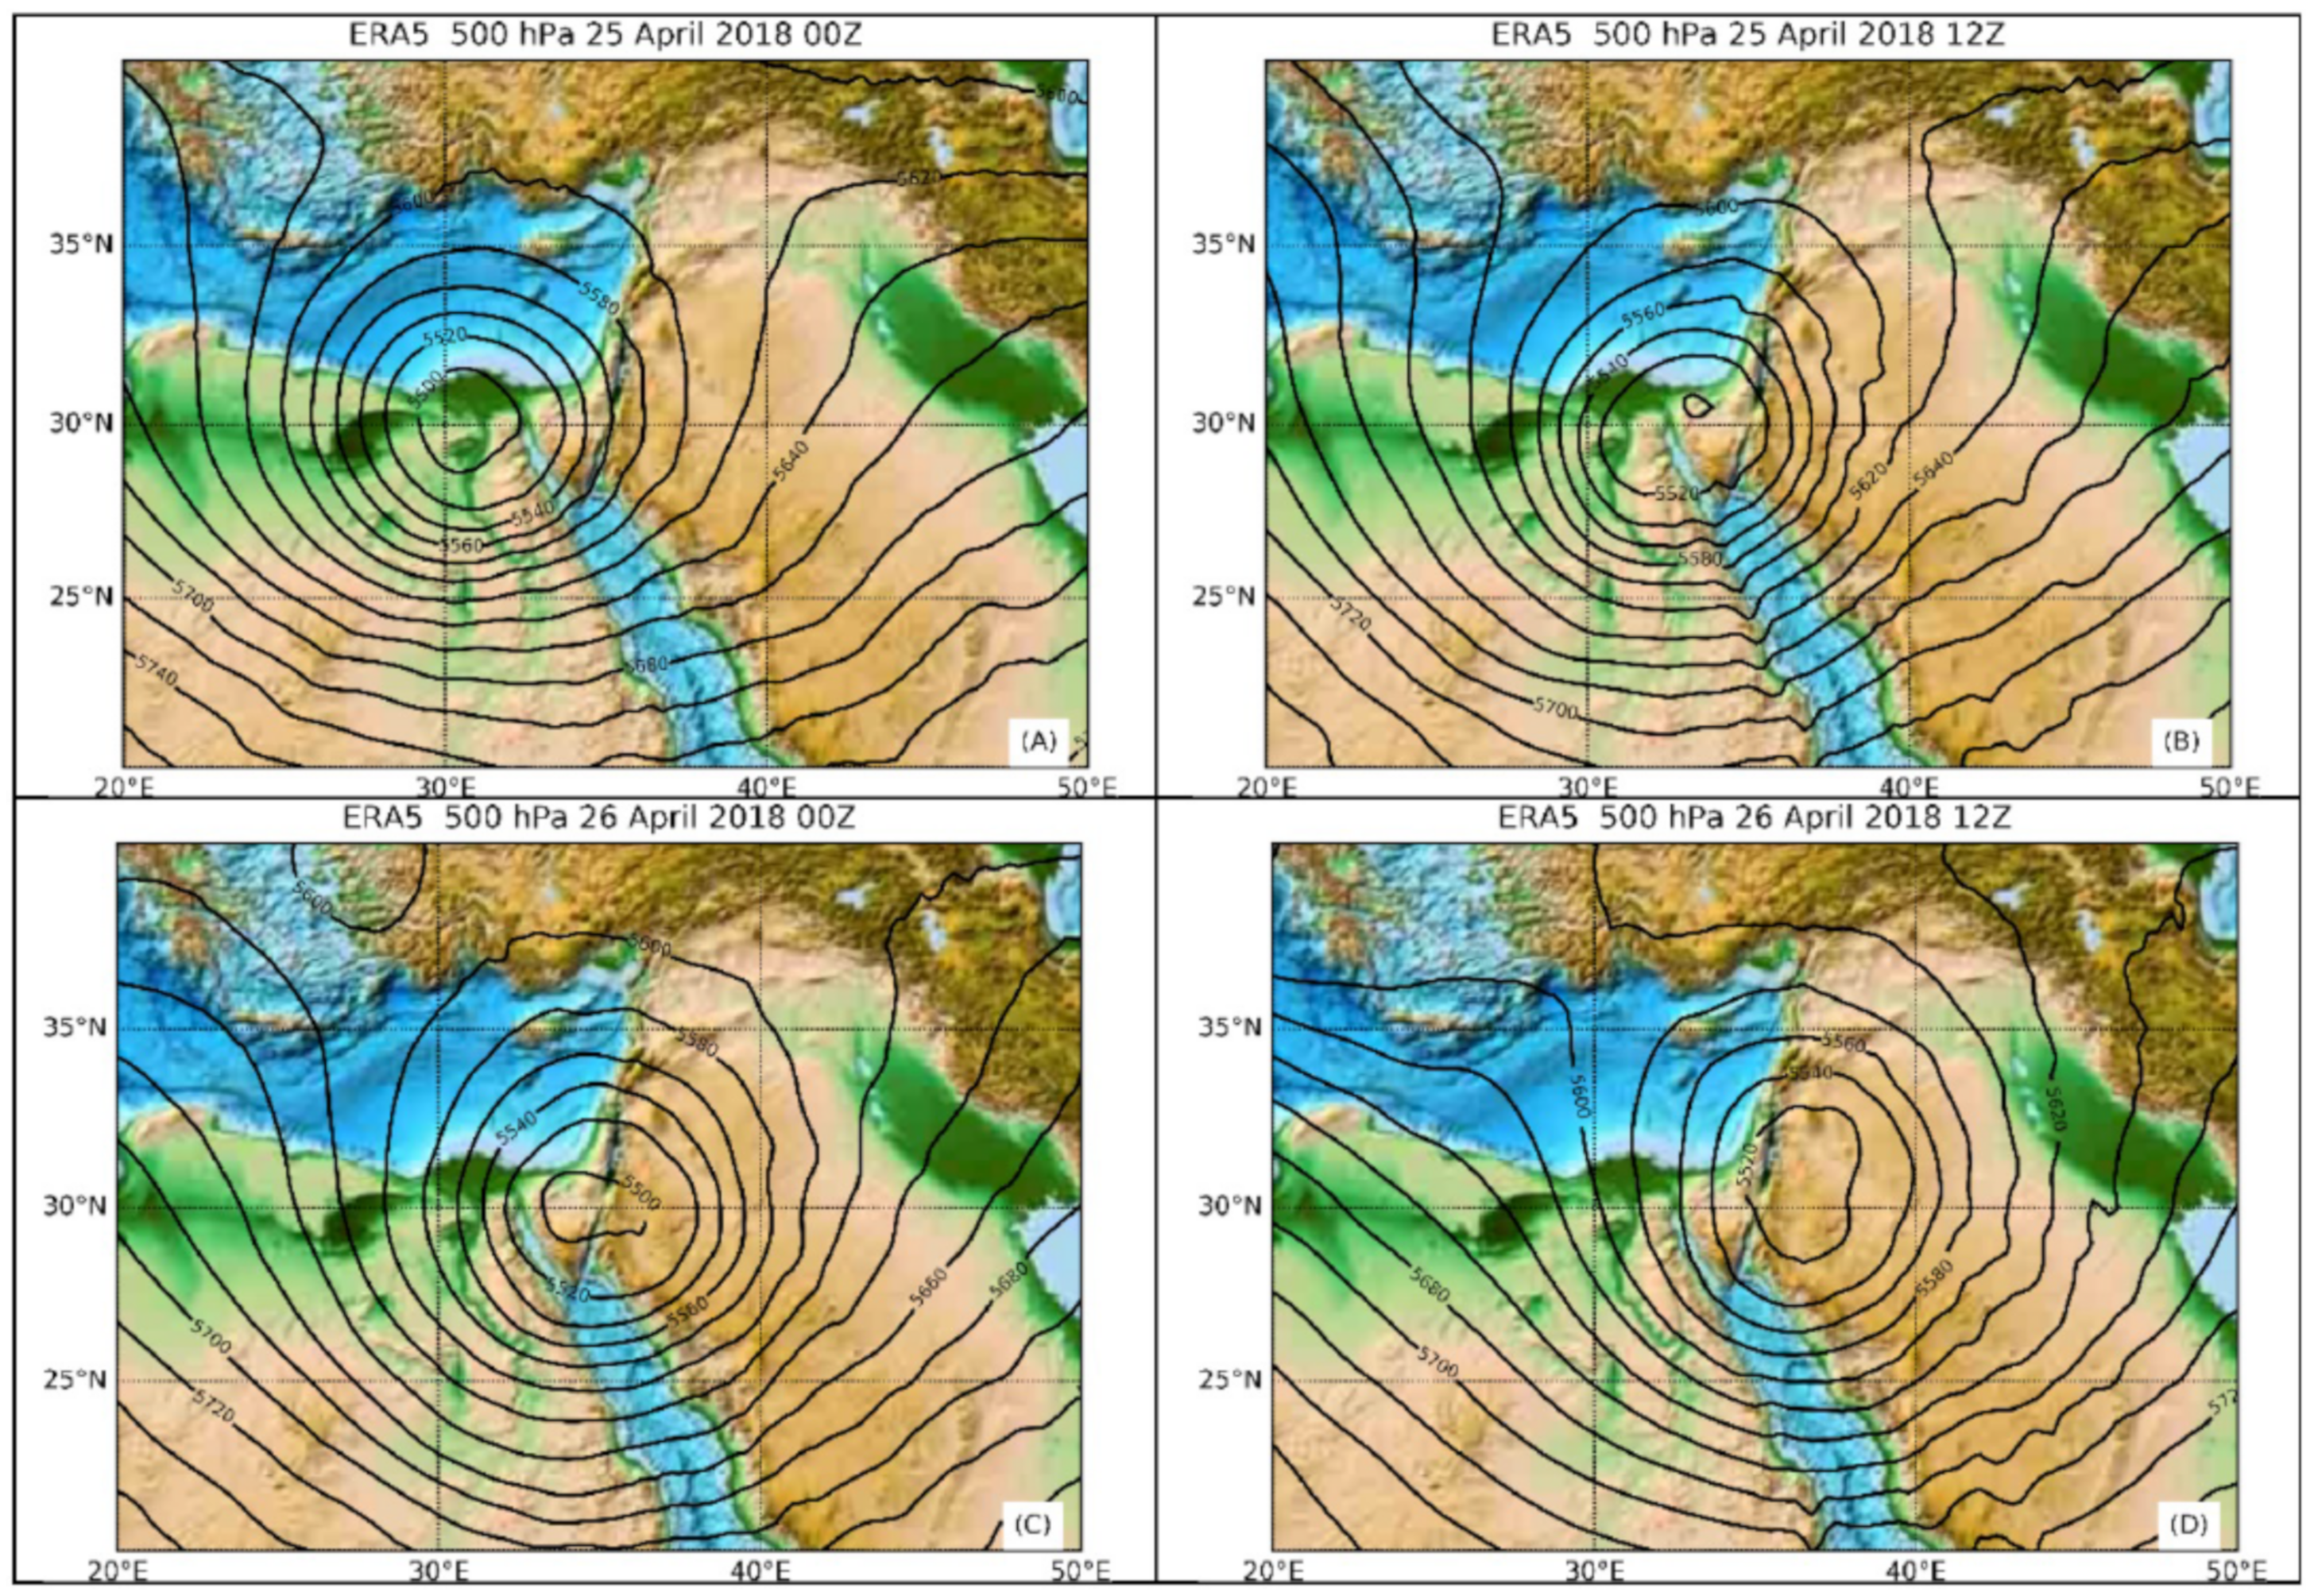
4. Results
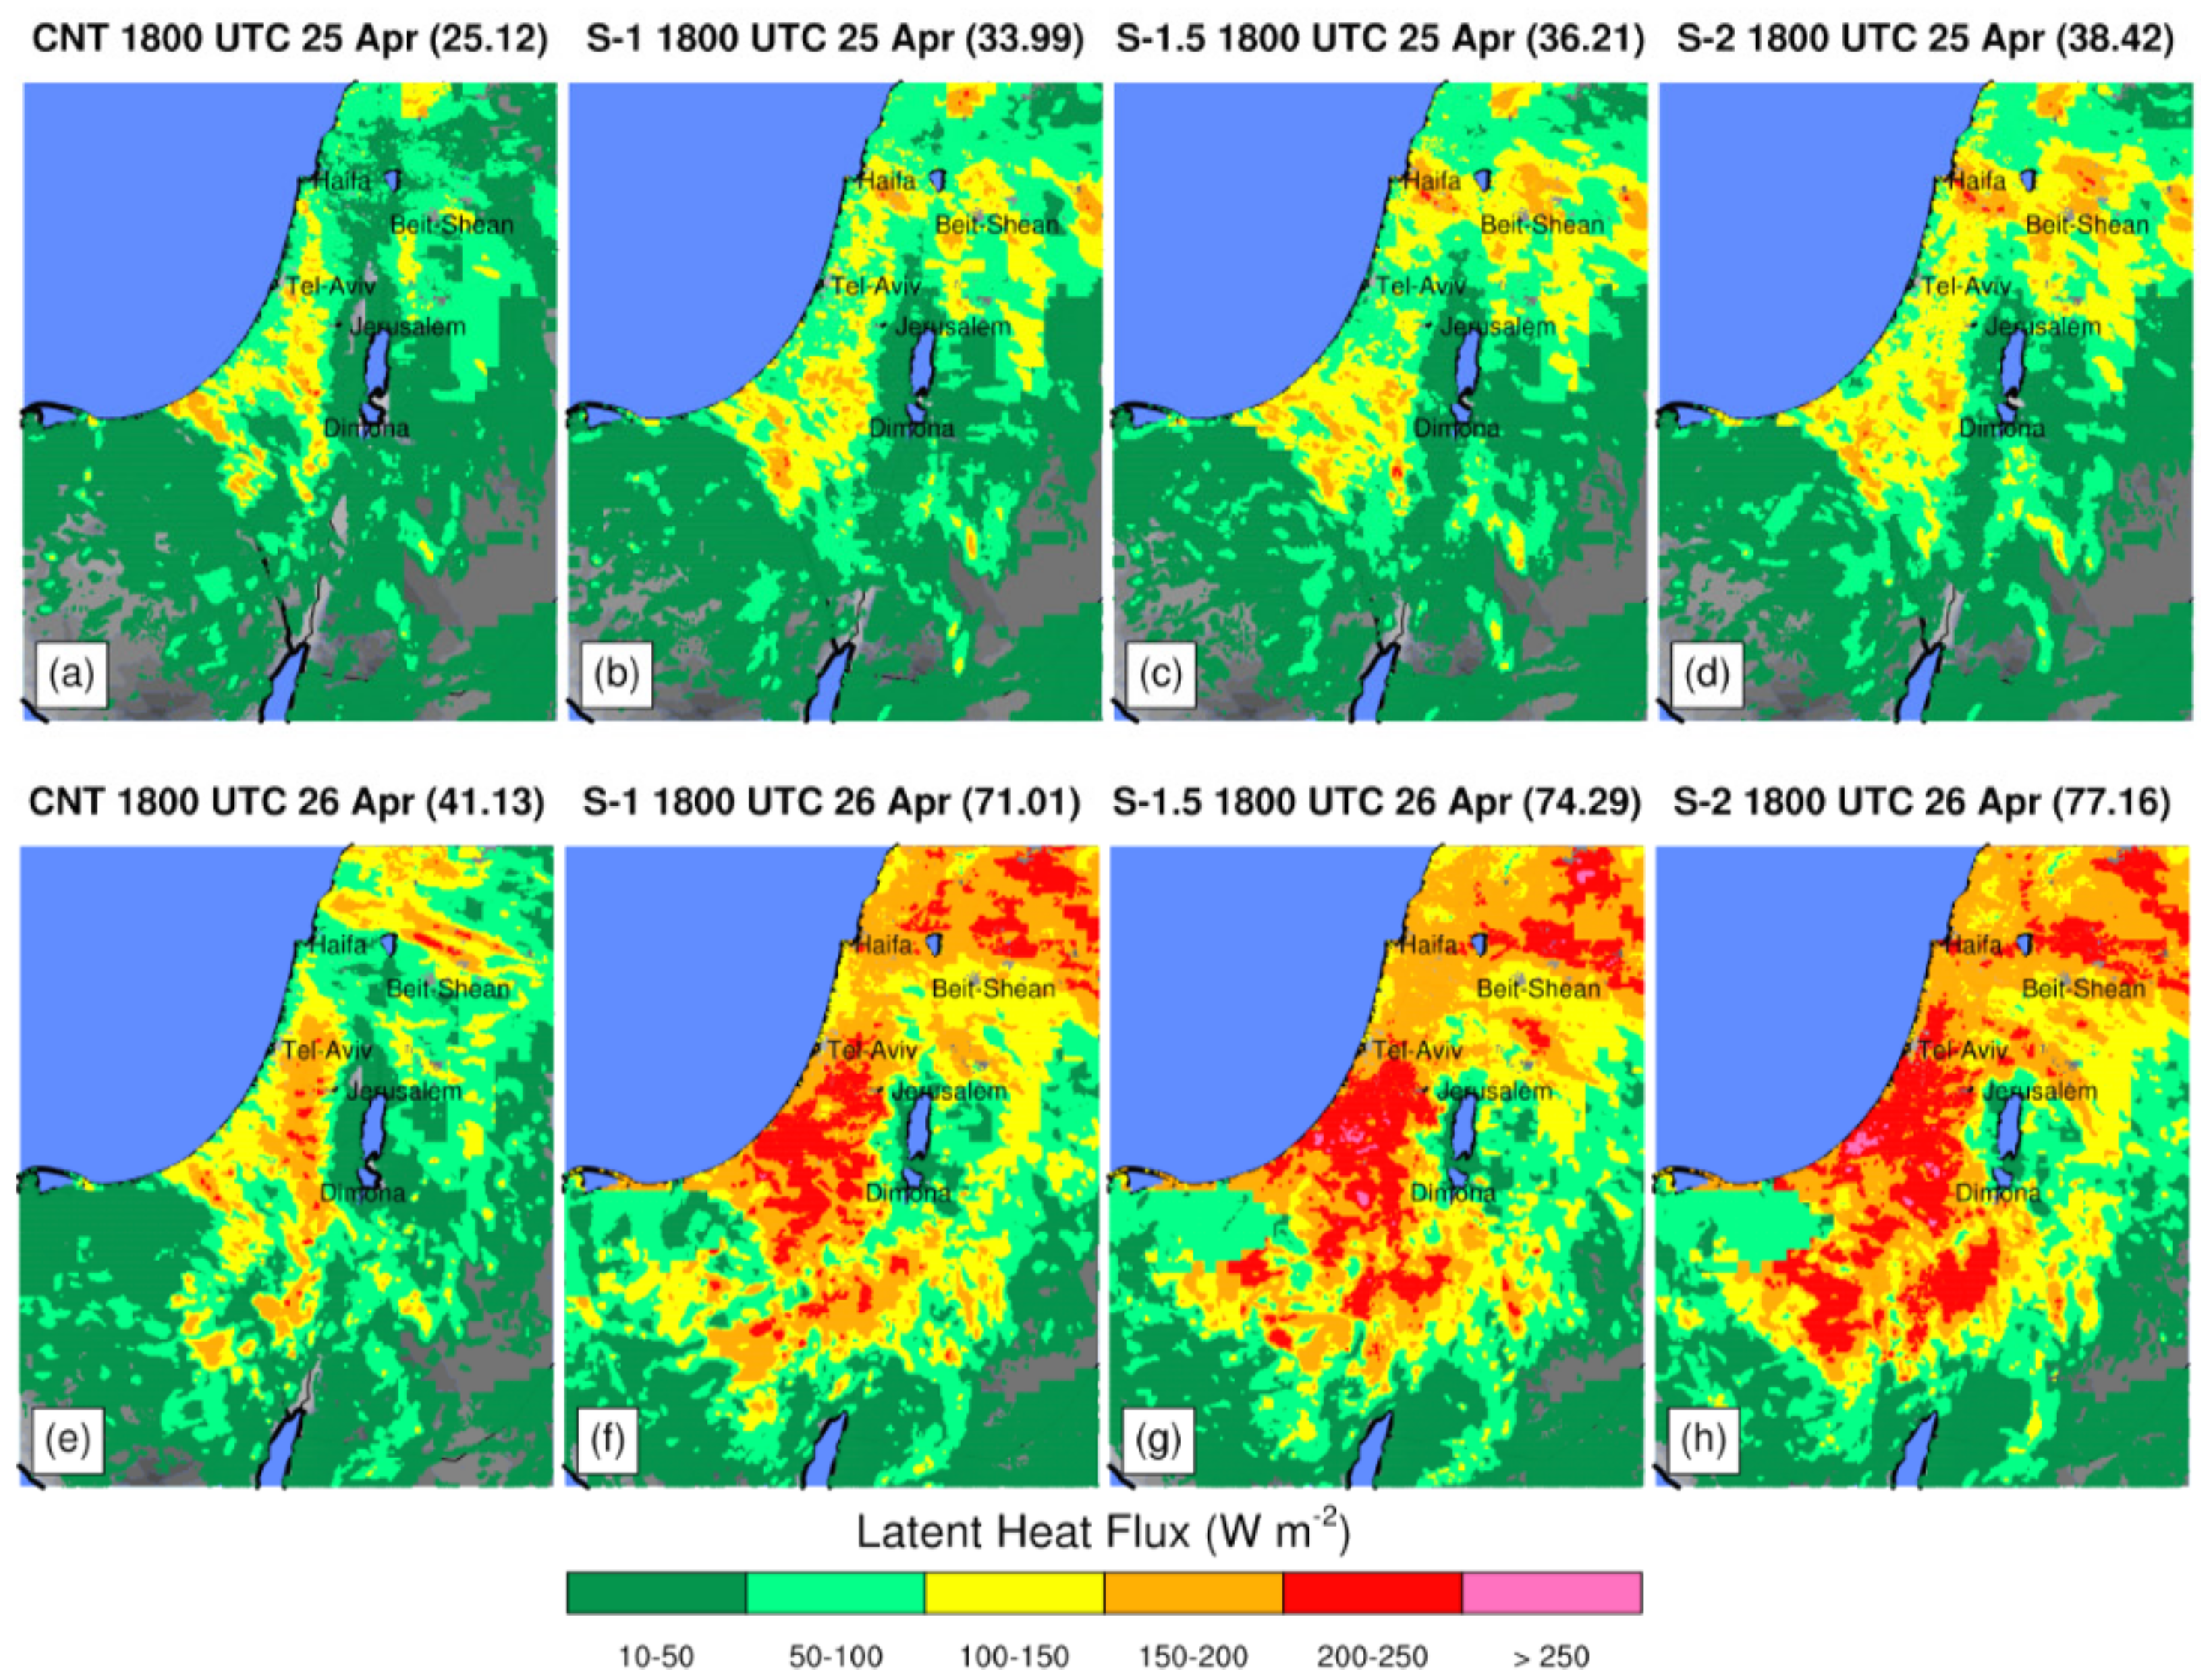
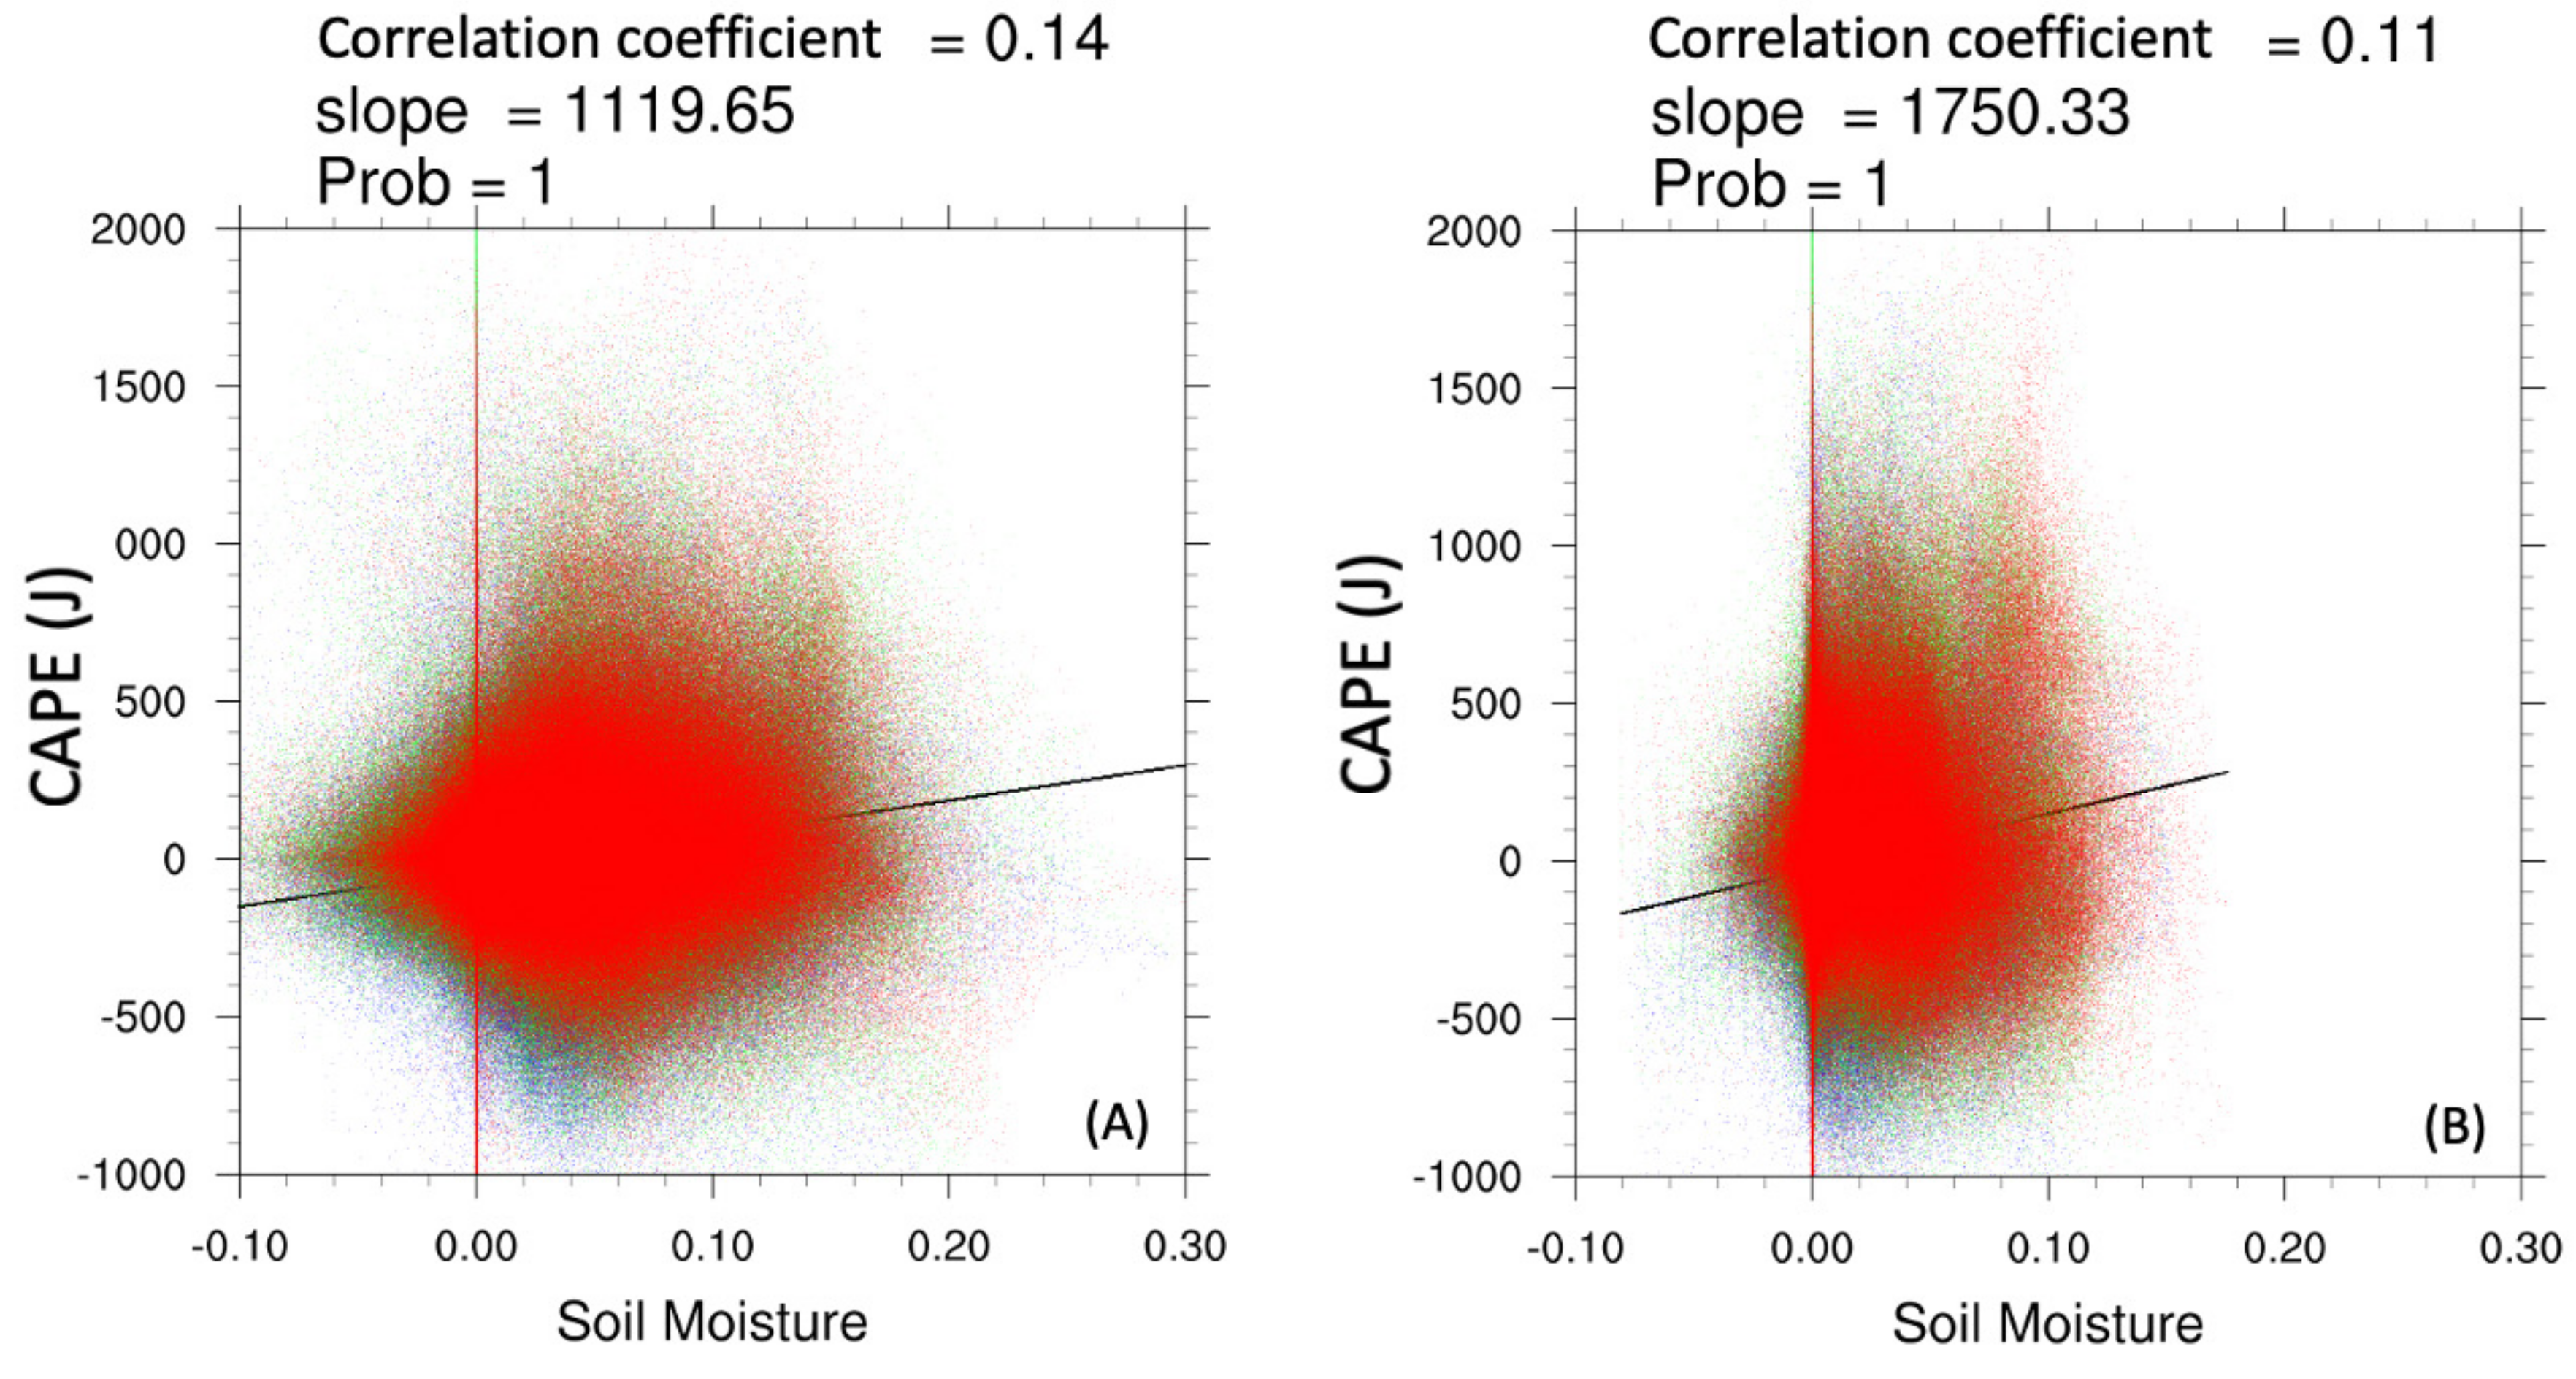
4.1. Impact of Soil Moisture
4.2. Local Versus Non-Local Moisture Impacts
4.2.1. CAPE
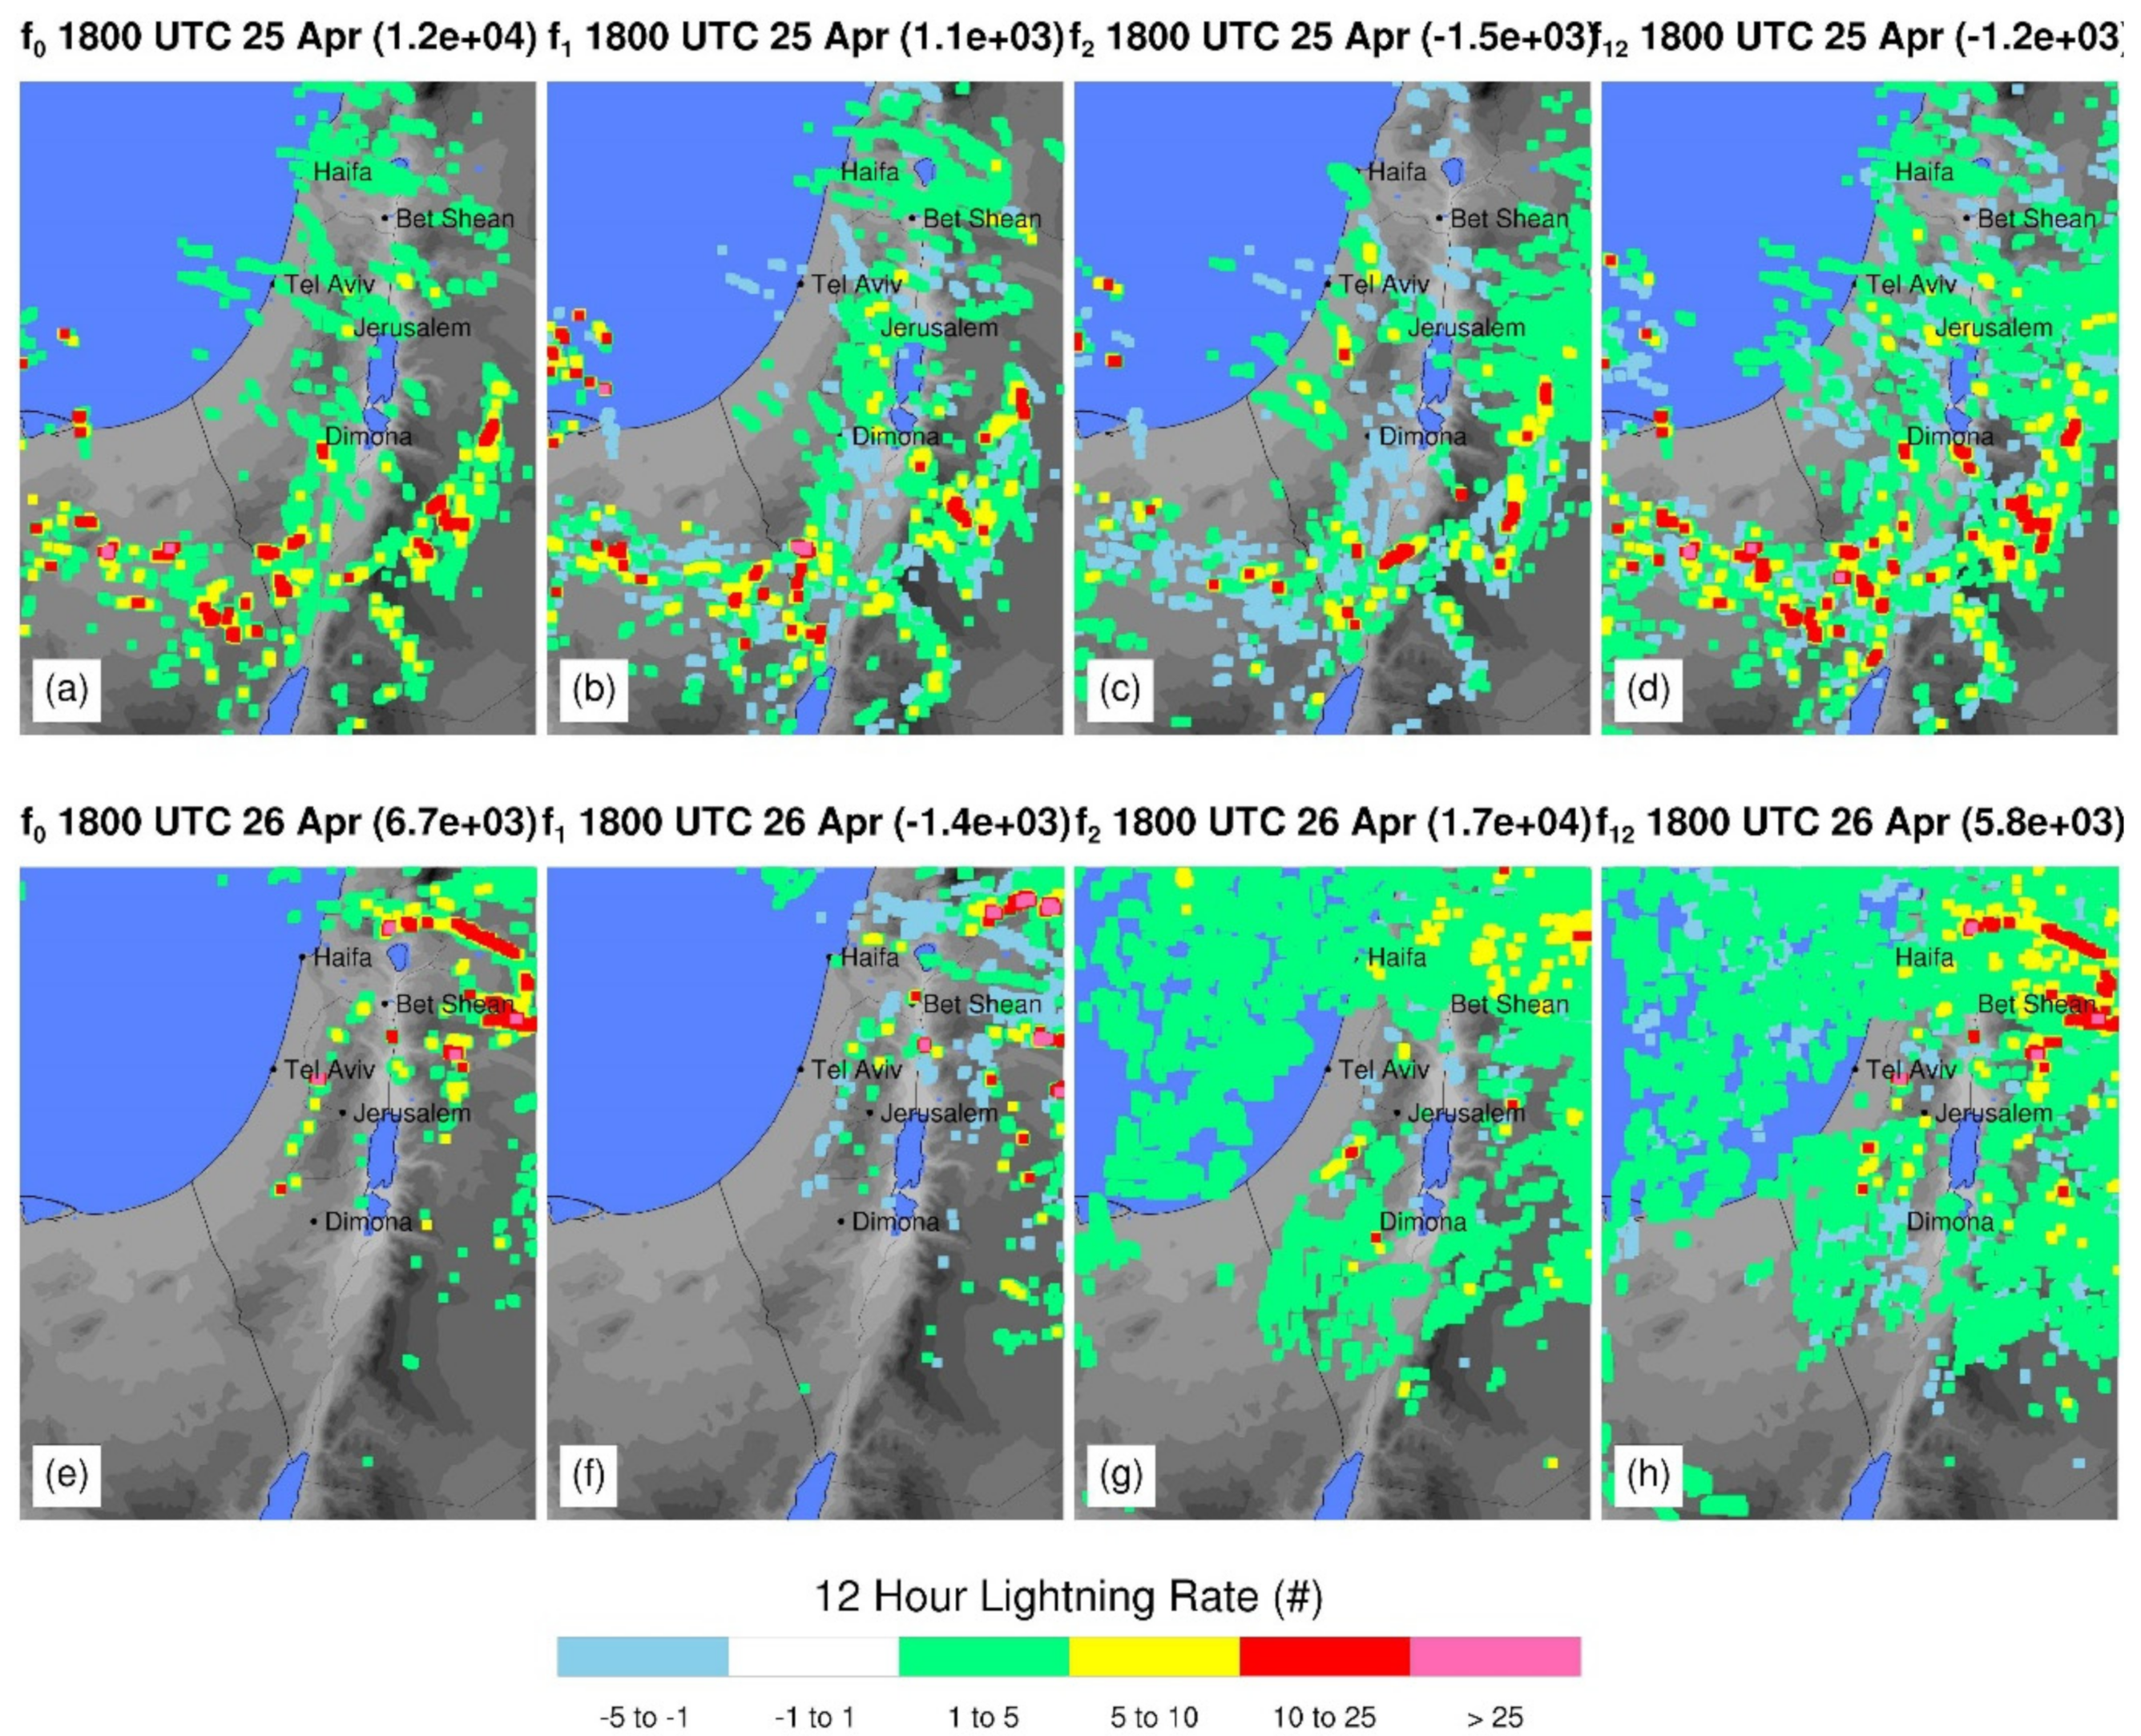
4.2.2. Lightning
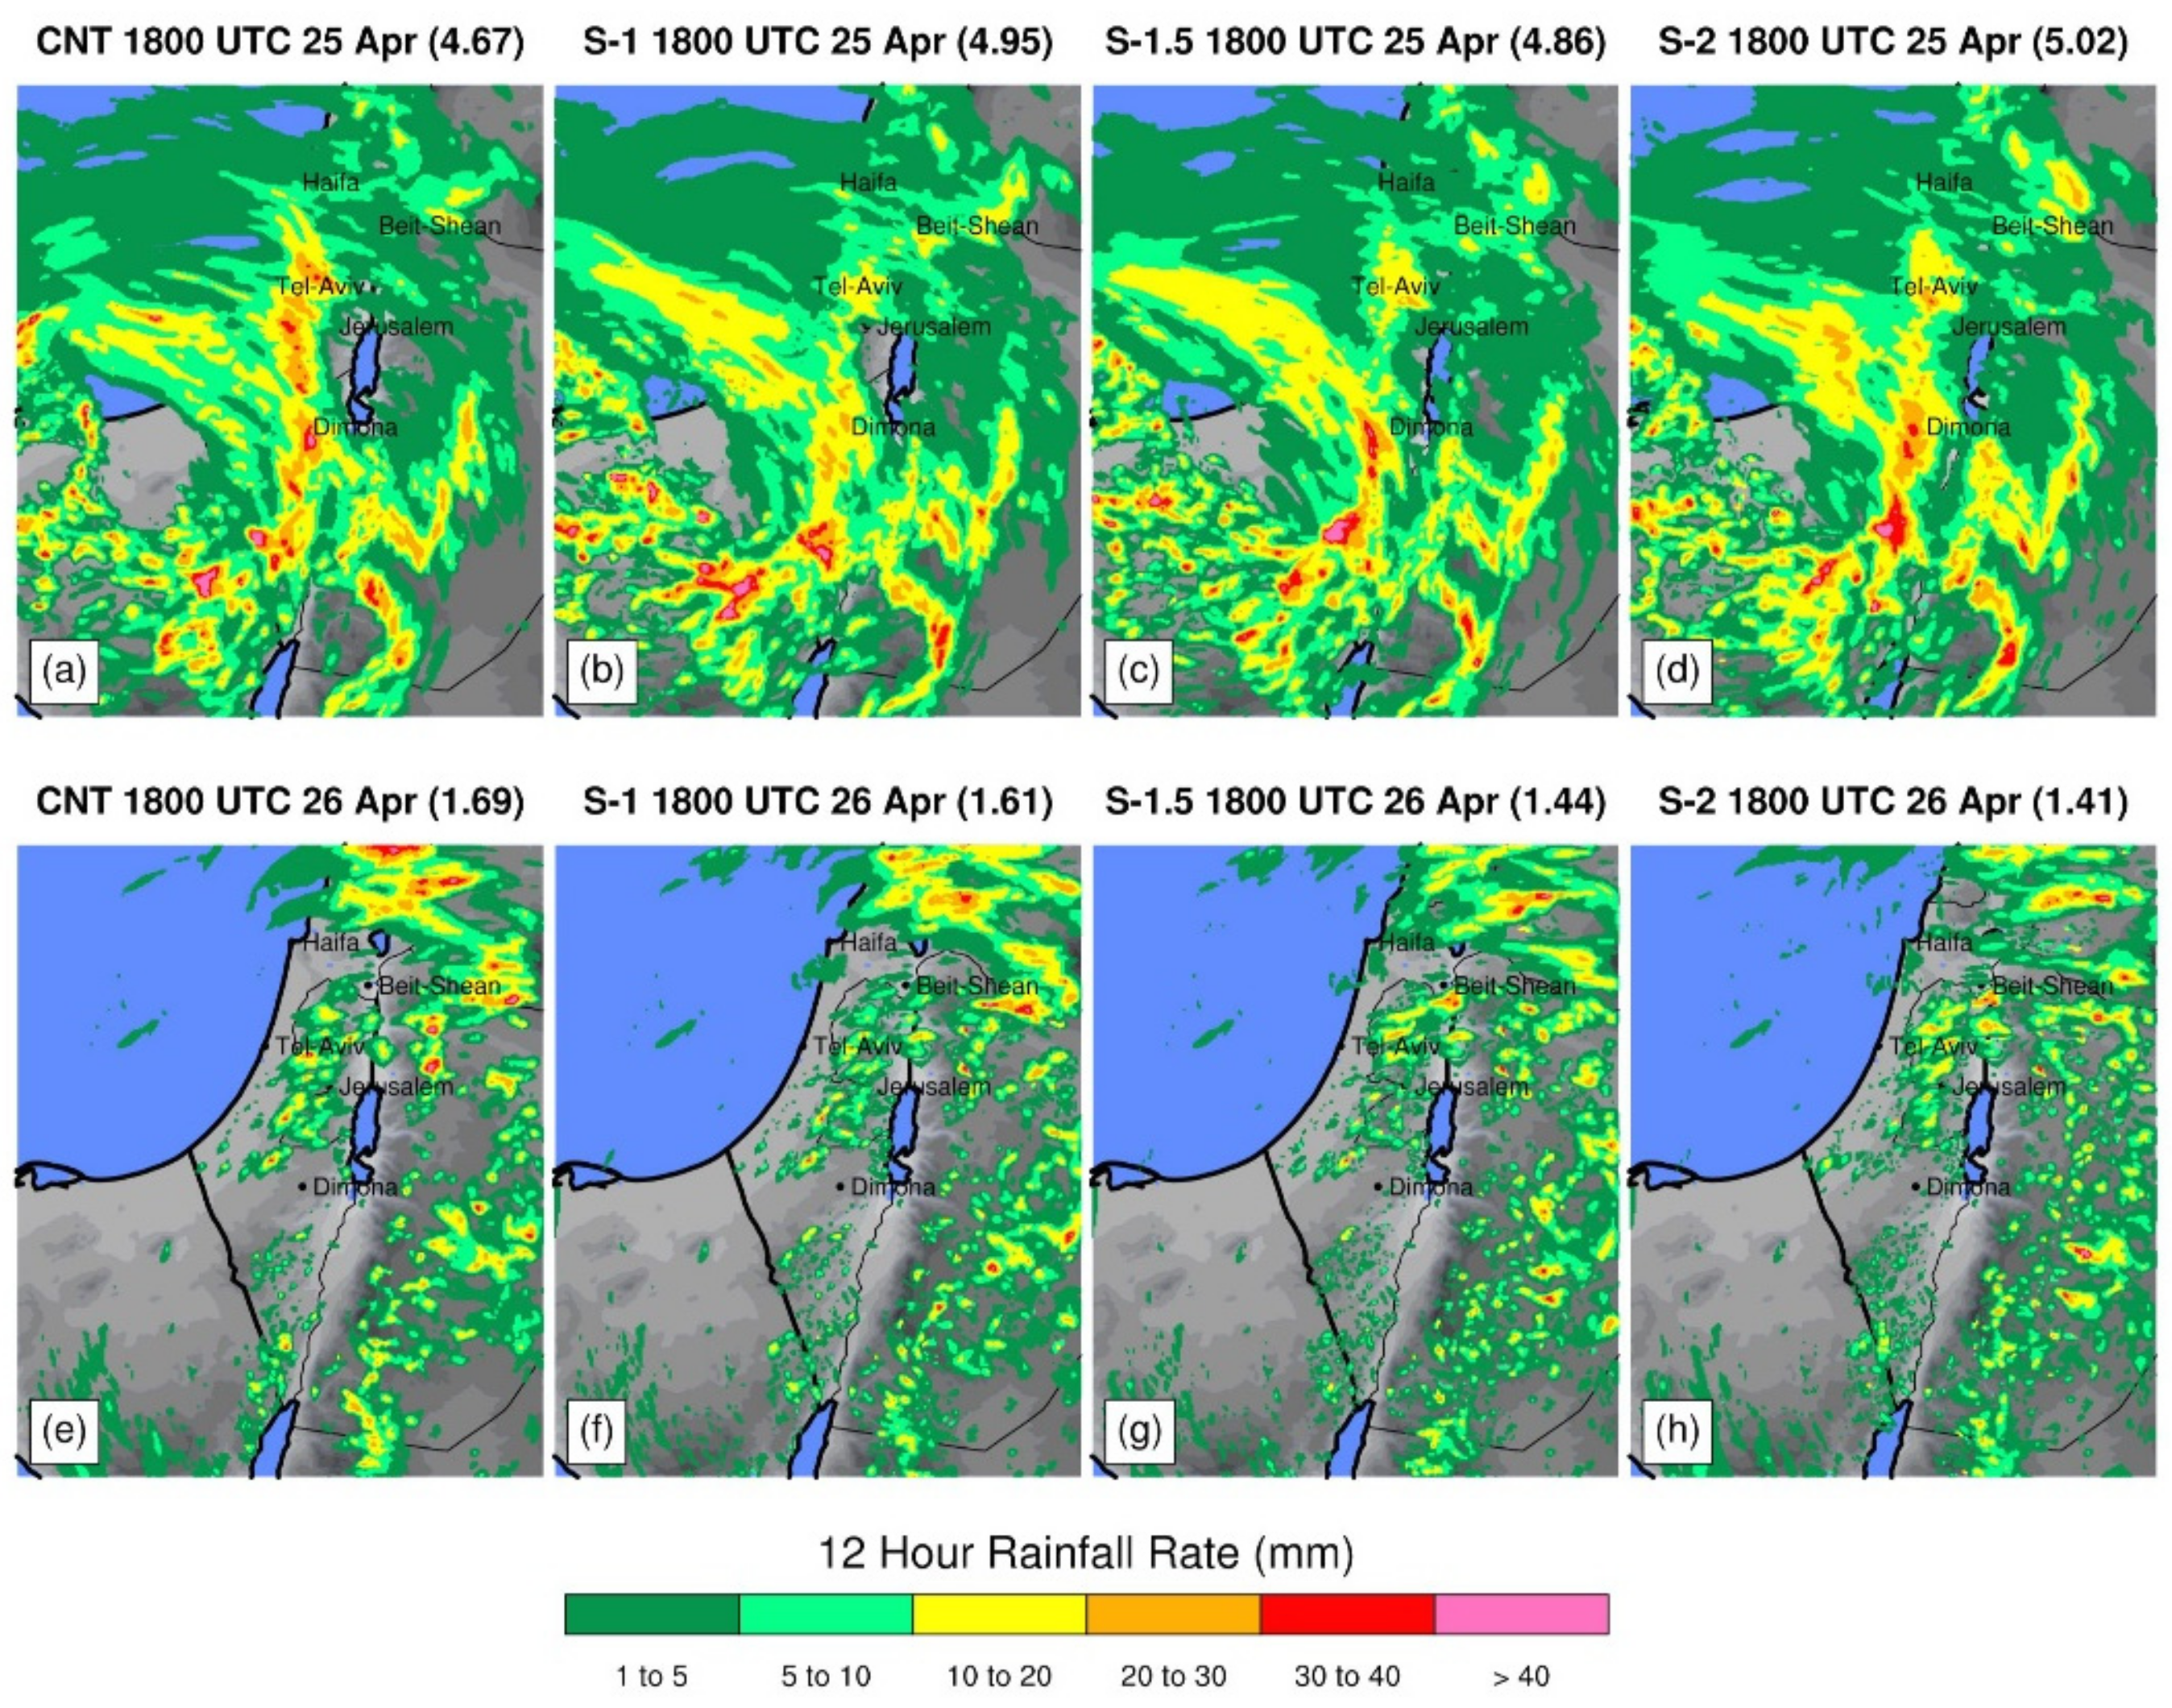
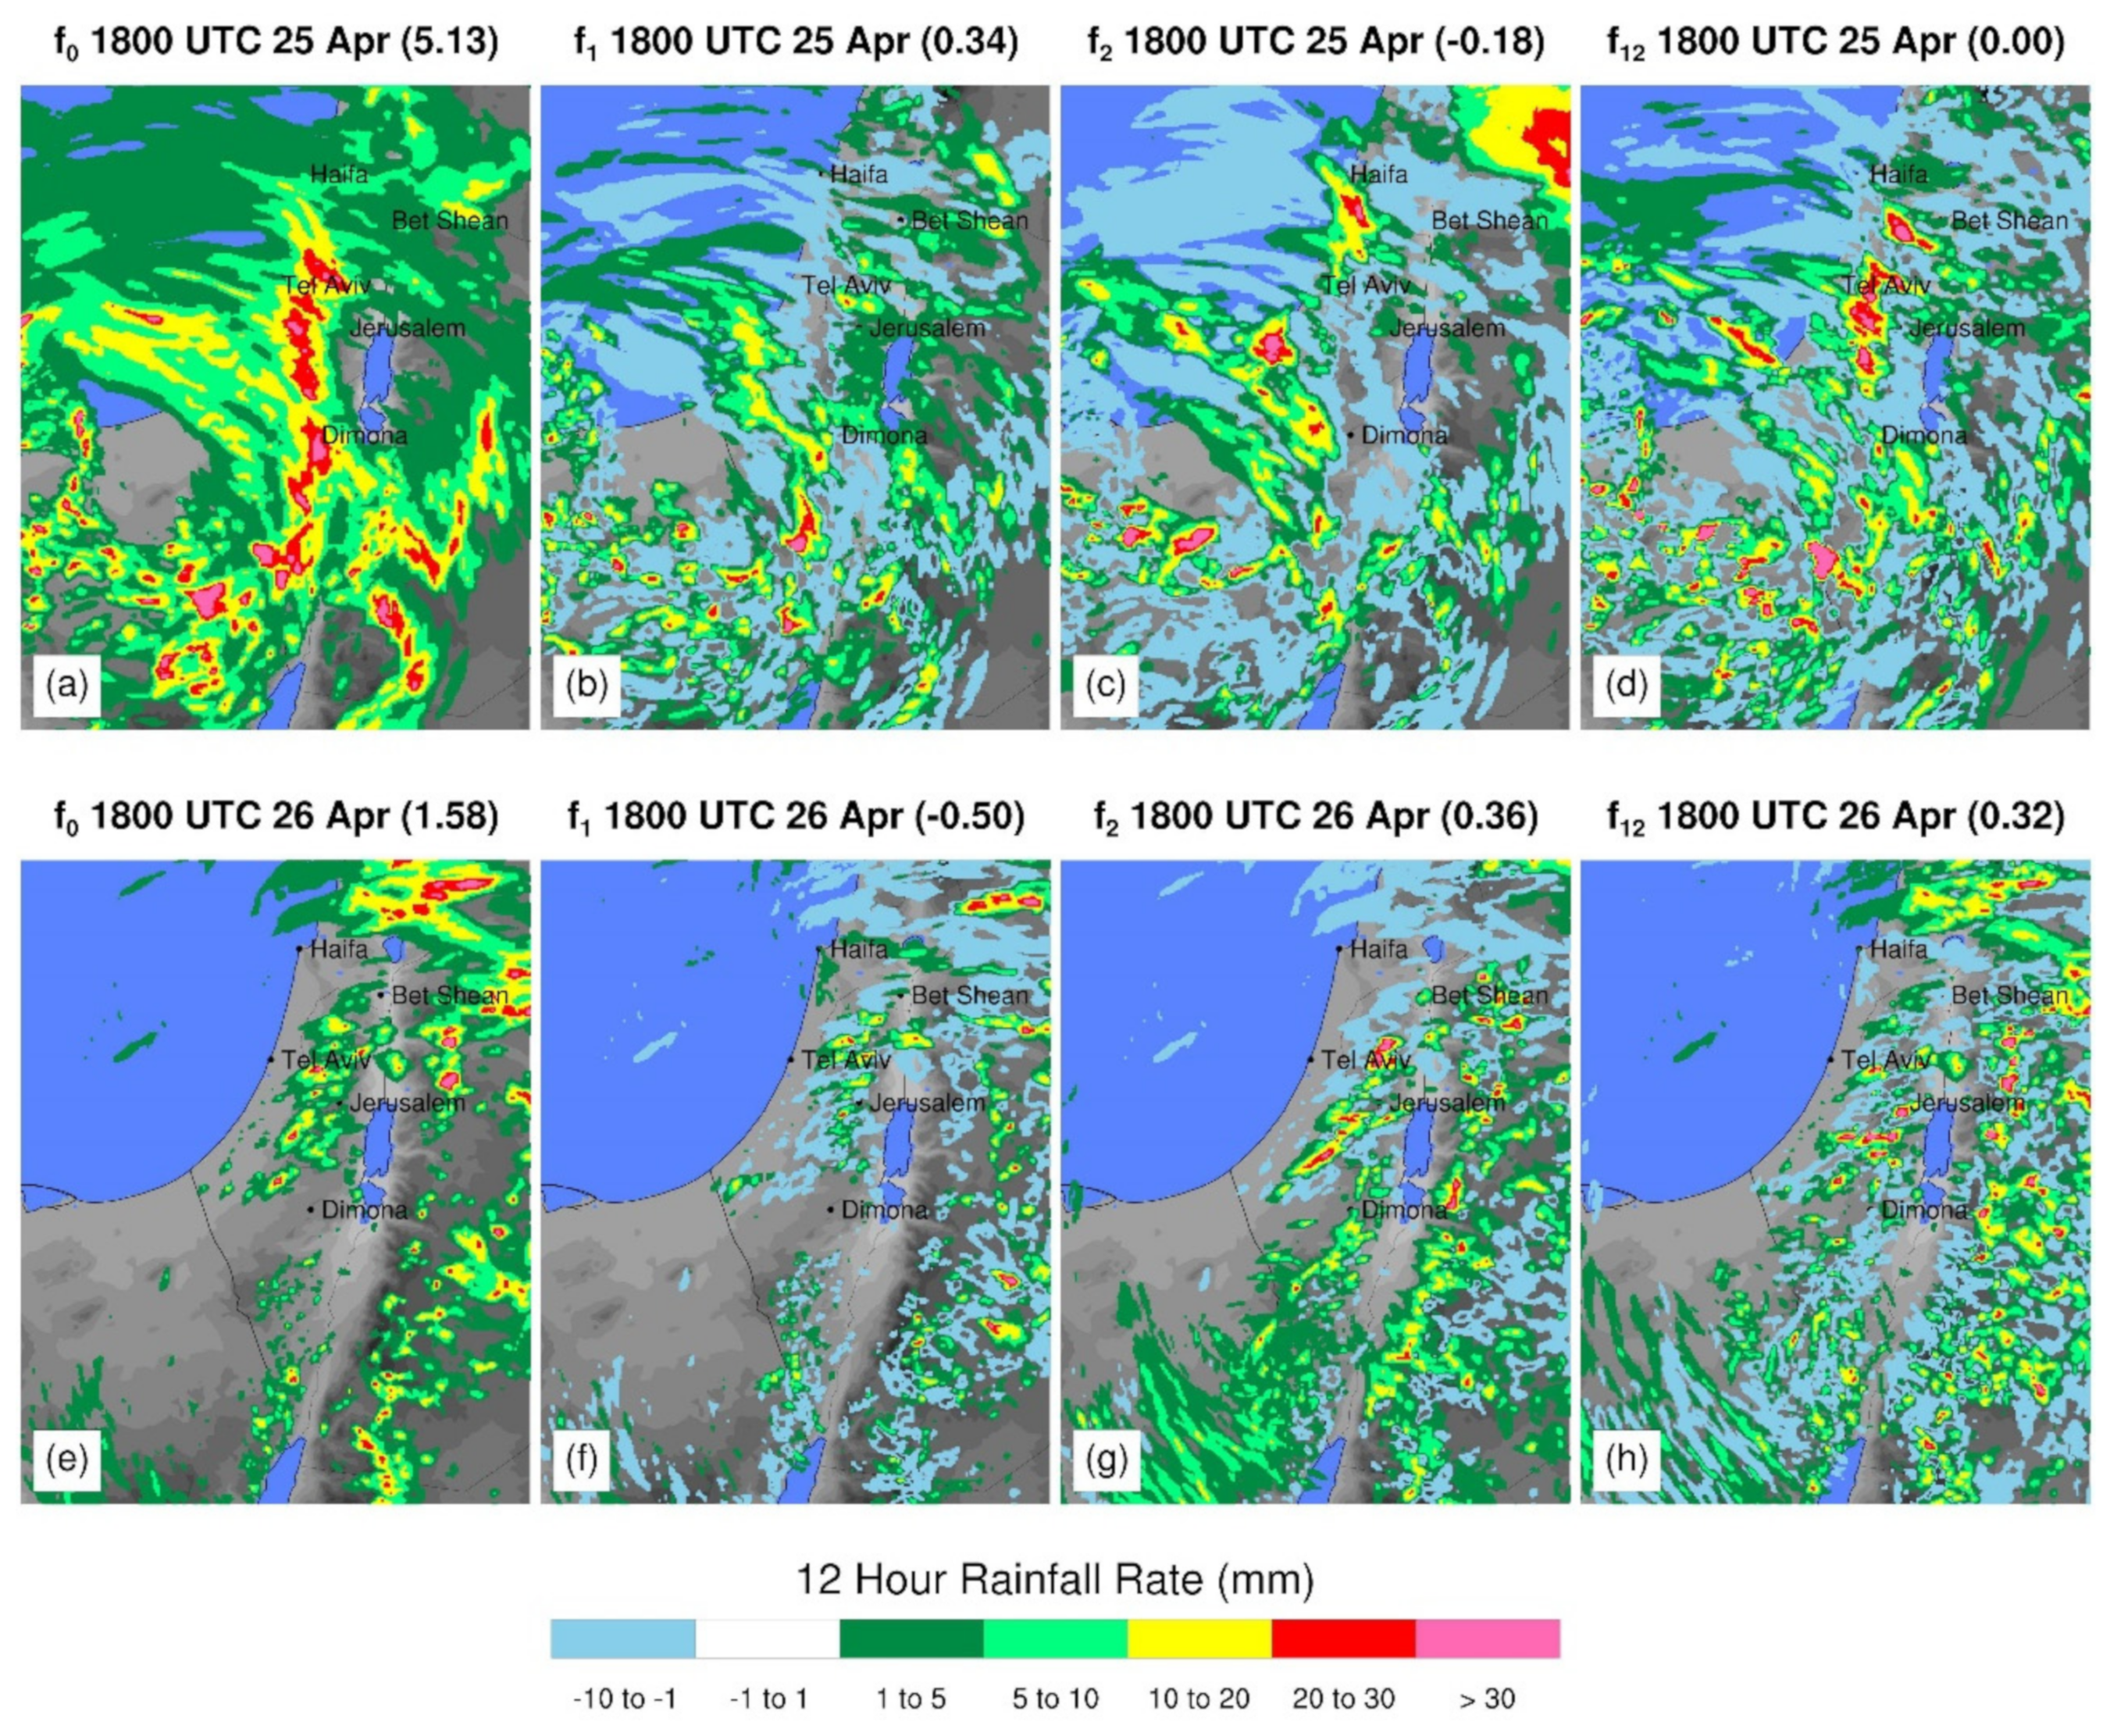
4.2.3. Precipitation
5. Conclusions
Author Contributions
Funding
Institutional Review Board Statement
Informed Consent Statement
Data Availability Statement
Acknowledgments
Conflicts of Interest
References
- Ford, T.W.; Rapp, A.D.; Quiring, S.M. Does Afternoon Precipitation Occur Preferentially over Dry or Wet Soils in Oklahoma? J. Hydrometeorol. 2015, 16, 874–888. [Google Scholar] [CrossRef]
- Guzmán, A.G.; Torrez, W.C. Daily Rainfall Probabilities: Conditional upon Prior Occurrence and Amount of Rain. J. Appl. Meteorol. Climatol. 1985, 24, 1009–1014. [Google Scholar] [CrossRef] [Green Version]
- Rinat, Y.; Marra, F.; Armon, M.; Metzger, A.; Levi, Y.; Khain, A.; Vadislavsky, E.; Rosensaft, M.; Morin, E. Hydrometeorological analysis and forecasting of a 3 d flash-flood-triggering desert rainstorm. Nat. Hazards Earth Syst. Sci. 2021, 21, 917–939. [Google Scholar] [CrossRef]
- Shalev, S.; Saaroni, H.; Izsak, T.; Yair, Y.; Ziv, B. The spatio-temporal distribution of lightning over Israel and the neighboring area and its relation to regional synoptic systems. Nat. Hazards Earth Syst. Sci. 2011, 11, 2125–2135. [Google Scholar] [CrossRef] [Green Version]
- Dayan, U.; Lensky, I.M.; Ziv, B. Atmospheric Conditions Leading to an Exceptional Fatal Flash Flood in the Negev Desert, Israel. Nat. Hazards Earth Syst. Sci. Discuss. 2020, 21, 1583–1597. [Google Scholar] [CrossRef]
- Muñoz, C.; Schultz, D.; Vaughan, G. A midlatitude climatology and interannual variability of 200- and 500-hPa cut-off lows. J. Clim. 2020, 33, 2201–2222. [Google Scholar] [CrossRef] [Green Version]
- Reichle, R.H.; Koster, R.D.; Dong, J.; Berg, A.A. Global Soil Moisture from Satellite Observations, Land Surface Models, and Ground Data: Implications for Data Assimilation. J. Hydrometeorol. 2004, 5, 430–442. [Google Scholar] [CrossRef]
- Quiring, S.M.; Ford, T.W.; Wang, J.K.; Khong, A.; Harris, E.; Lindgren, T.; Goldberg, D.W.; Li, Z. The North American Soil Moisture Database: Development and Applications. Bull. Am. Met. Soc. 2016, 97, 1441–1459. [Google Scholar] [CrossRef]
- Ford, T.W.; Quiring, S.M.; Zhao, C.; Leasor, Z.T.; Landry, C. Triple Collocation Evaluation of In Situ Soil Moisture Observations from 1200+ Stations as part of the U.S. National Soil Moisture Network. J. Hydrometeorol. 2020, 21, 2537–2549. [Google Scholar] [CrossRef]
- Chen, F.; Crow, W.T.; Ryu, D. Dual Forcing and State Correction via Soil Moisture Assimilation for Improved Rainfall–Runoff Modeling. J. Hydrometeorol. 2014, 15, 1832–1848. [Google Scholar] [CrossRef]
- Bui, V.; Chang, L.; Heckman, S. A Performance Study of Earth Networks Total Lighting Network (ENTLN) and Worldwide Lightning Location Network (WWLLN). In Proceedings of the International Conference on Computational Science and Computational Intelligence (CSCI), Las Vegas, NV, USA, 7–9 December 2015; pp. 386–391. [Google Scholar] [CrossRef]
- Fierro, A.O.; Mansell, E.R.; Ziegler, C.L.; MacGorman, D.R. Application of a lightning data assimilation technique in the WRF-ARW model at cloud-resolving scales for the Tornado Outbreak of 24 May 2011. Mon. Weather Rev. 2012, 140, 2609–2627. [Google Scholar] [CrossRef]
- Marshall, J.S.; Palmer, W.M. The distribution of raindrops with size. J. Meteor 1948, 5, 165–166. [Google Scholar] [CrossRef]
- Haiden, T.; Kann, A.; Wittmann, C.; Pistotnik, G.; Bica, B.; Gruber, C. The Integrated Nowcasting through Comprehensive Analysis (INCA) system and its validation over the Eastern Alpine region. Weather Forecast. 2011, 26, 166–183. [Google Scholar] [CrossRef]
- Bar-Sever, Y.E. Real-Time GNSS Positioning with JPL’s new GIPSYx Software. In Proceedings of the AGU Fall Meeting Abstracts 2016, San Francisco, CA, USA, 13–16 December 2016; p. G44A-04. [Google Scholar]
- Duan, J.; Bevis, M.; Fang, P.; Bock, Y.; Chiswell, S.; Businger, S.; Rockend, C.; Solheimd, F.; van Hoved, T.; Ware, R.; et al. GPS Meteorology: Direct Estimation of the Absolute Value of Precipitable Water. J. Appl. Meteorol. 1996, 35, 830–838. [Google Scholar] [CrossRef] [Green Version]
- Webb, F.; Zumberge, J. An Introduction to GIPSY/OASIS-II; JPL Publication D-11088; Jet Propulsion Laboratory: Pasadena, CA, USA, 1993. [Google Scholar]
- Davis, J.; Herring, T.; Shapiro, I.; Rogers, A.; Elgered, G. Geodesy by radio interferometry: Effects of atmospheric modeling errors on estimates of baseline length. Radio Sci. 1985, 20, 1593–1607. [Google Scholar] [CrossRef]
- Böhm, J.; Niell, A.; Tregoning, P.; Schuh, H. Global Mapping Function (GMF): A new empirical mapping function based on numerical weather model data. Geophys. Res. Lett. 2006, 33. [Google Scholar] [CrossRef] [Green Version]
- Reuveni, Y.; Kedar, S.; Owen, S.E.; Moore, A.W.; Webb, F.H.I. Improving sub-daily strain estimates using GPS measurements. Geophys. Res. Lett. 2012, 39. [Google Scholar] [CrossRef]
- Reuveni, Y.; Kedar, S.; Moore, A.W.; Webb, F. Analyzing slip events along the Cascadia margin using an improved subdaily GPS analysis strategy. Geophys. J. Int. 2014, 198, 1269–1278. [Google Scholar]
- Reuveni, Y.; Bock, Y.; Tong, X.; Moore, A.W. Calibrating interferometric synthetic aperture radar (InSAR) images with regional GPS network atmosphere models. Geophys. J. Int. 2015, 202, 2106–2119. [Google Scholar] [CrossRef] [Green Version]
- Ziskin Ziv, S.; Yair, Y.; Alpert, P.; Uzan, L.; Reuveni, Y. The diurnal variability of precipitable water vapor derived from tropospheric path delays over the eastern Mediterranean. Atmos. Res. 2021, 249, 105307. [Google Scholar] [CrossRef]
- Ziskin Ziv, S.; Alpert, P.; Reuveni, Y. Long term variability and trends of precipitable water vapor derived from GPS tropospheric path delays over the Eastern Mediterranean. Int. J. Climatol. 2021. [Google Scholar] [CrossRef]
- Brocca, L.; Crow, W.T.; Ciabatta, L.; Massari, C.; De Rosnay, P.; Enenkel, M.; Hahn, S.; Amarnath, G.; Camici, S.; Tarpanelli, A.; et al. A review of the applications of ASCAT soil moisture products. IEEE J. Sel. Top. Appl. Earth Obs. Remote Sens. 2017, 10, 2285–2306. [Google Scholar] [CrossRef]
- Bartalis, Z.; Wagner, W.; Naeimi, V.; Hasenauer, S.; Scipal, K.; Bonekamp, H.; Figa, J.; Anderson, C. Initial soil moisture retrievals from the METOP-A Advanced Scatterometer (ASCAT). Geophys. Res. Lett. 2007, 34, 20. [Google Scholar] [CrossRef] [Green Version]
- Lynn, B.H.; Yair, Y.; Shpund, J.; Levi, Y.; Qie, X.; Khain, A. Using factor separation to elucidate the respective contributions of desert dust and urban pollution to the 4 January 2020 Tel Aviv lightning and flash flood disaster. J. Geophys. Res. Atmos. 2020, 125, e2020JD033520. [Google Scholar] [CrossRef]
- Skamarock, W.C.; Klemp, J.B.; Dudhia, J.; Gill, D.O.; Barker, D.; Duda, M.G.; Huang, X.-y.; Wang, W.; Powers, J.G. A Description of the Advanced Research WRF Version 3; (No. NCAR/TN-475+STR); University Corporation for Atmospheric Research: Boulder, CO, USA, 2008. [Google Scholar] [CrossRef]
- Kain, J.S. The Kain–Fritsch convective parameterization: An update. J. Appl. Meteorol. 2004, 43, 170–181. [Google Scholar] [CrossRef] [Green Version]
- Thompson, G.; Eidhammer, T. A Study of Aerosol Impacts on Clouds and Precipitation Development in a Large Winter Cyclone. J. Atmos. Sci. 2014, 71, 3636–3658. Available online: https://journals.ametsoc.org/view/journals/atsc/71/10/jas-d-13-0305.1.xml (accessed on 21 March 2021). [CrossRef]
- Bowden, J.H.; Otte, T.L.; Nolte, C.G.; Otte, M.J. Examining interior grid nudging techniques using two-way nesting in the WRF model for regional climate modeling. J. Clim. 2012, 25, 2805–2823. [Google Scholar] [CrossRef]
- Levin, Z.; Ganor, E.; Gladstein, V. The Effects of Desert Particles Coated with Sulfate on Rain Formation in the Eastern Mediterranean. J. Appl. Meteorol. 1996, 35, 1511–1523. [Google Scholar] [CrossRef] [Green Version]
- Shpund, J.; Khain, A.; Lynn, B.; Fan, J.; Han, B.; Ryzhkov, A.; Snyder, J.; Dudhia, J.; Gill, D. Simulating a mesoscale convective system using WRF with a new spectral bin microphysics: 1: Hail vs Graupel. J. Geophys. Res. Atmos. 2019, 124, 14072–14101. [Google Scholar] [CrossRef]
- Lu, Y.; Steele-Dunne, S.C.; De Lannoy, G.J.M. Improving Soil Moisture and Surface Turbulent Heat Flux Estimates by Assimilation of SMAP Brightness Temperatures or Soil Moisture Retrievals and GOES Land Surface Temperature Retrievals. J. Hydrometeorol. 2020, 21, 183–203. [Google Scholar] [CrossRef]
- Niu, G.Y.; Yang, Z.L.; Mitchell, K.E.; Chen, F.; Ek, M.B.; Barlage, M.; Kumar, A.; Manning, K.; Niyogi, D.; Rosero, E.; et al. The community Noah land surface model with multiparameterization options (Noah-MP): 1. Model description and evaluation with local-scale measurements. J. Geophys. Res. 2011, 116, D12109. [Google Scholar] [CrossRef] [Green Version]
- Lynn, B.H.; Yair, Y.; Price, C.; Kelman, G.; Clark, A.J. Predicting cloud-to-ground and intracloud lightning in weather forecast models. Weather Forecast. 2012, 27, 1470–1488. [Google Scholar] [CrossRef]
- Lynn, B.; Yair, Y. Prediction of lightning flash density with the WRF model. Adv. Geosci. 2010, 23, 11–16. [Google Scholar] [CrossRef] [Green Version]
- Yair, Y.; Lynn, B.; Price, C.; Kotroni, V.; Lagouvardos, K.; Morin, E.; Mugnai, A.; Llasat, M.D.C. Predicting the potential for lightning activity in Mediterranean storms based on the Weather Research and Forecasting (WRF) model dynamic and microphysical fields. J. Geophys. Res. 2010, 115, D04205. [Google Scholar] [CrossRef] [Green Version]
- Liu, Q.; Reichle, R.H.; Bindlish, R.; Cosh, M.H.; Crow, W.T.; de Jeu, R.; Gabrielle, J.; De Lannoy, M.; Huffman, G.J.; Jackson, T.J. The Contributions of Precipitation and Soil Moisture Observations to the Skill of Soil Moisture Estimates in a Land Data Assimilation System. J. Hydrometeorol. 2011, 12, 750–765. [Google Scholar] [CrossRef]
- Alpert, P.; Tzidulko, M.; Krichak, S.; Stein, U. A multi-stage evolution of an ALPEX cyclone. Tellus 1996, 48A, 209–220. [Google Scholar] [CrossRef]
- Alpert, P.; Sholokhman, T. (Eds.) Factor Separation in the Atmosphere, Applications and Future Prospects; Cambridge University Press: Cambridge, UK, 2011; p. 274. Available online: http://0-www-cambridge-org.brum.beds.ac.uk/catalogue/catalogue.asp?isbn=9780521191739 (accessed on 1 May 2021).
- Lynn, B.H.; Kelman, G.; Ellrod, G. An evaluation of the efficacy of using observed lightning to improve convective lightning forecasts. Weather Forecast. 2015, 30, 405–423. [Google Scholar] [CrossRef]
- Barton, E.J.; Taylor, C.M.; Klein, C.; Harris, P.P.; Meng, X. Observed Soil Moisture Impact on Strong Convection over Mountainous Tibetan Plateau. J. Hydrometeorol. 2021, 22, 561–572. [Google Scholar] [CrossRef]
- Alfieri, L.; Claps, P.; D’Odorico, P.; Laio, F.; Over, T.M. An Analysis of the Soil Moisture Feedback on Convective and Stratiform Precipitation. J. Hydrometeorol. 2008, 9, 280–291. [Google Scholar] [CrossRef] [Green Version]
- Grimm, A.M.; Pal, J.S.; Giorgi, F. Connection between Spring Conditions and Peak Summer Monsoon Rainfall in South America: Role of Soil Moisture, Surface Temperature, and Topography in Eastern Brazil. J. Clim. 2007, 20, 5929–5945. [Google Scholar] [CrossRef] [Green Version]
- De Vries, A.J.; Tyrlis, E.; Edry, D.; Krichak, S.O.; Steil, B.; Lelieveld, J. Extreme precipitation events in the Middle East: Dynamics of the Active Red Sea Trough. J. Geophys. Res. Atmos. 2013, 118, 7087–7108. [Google Scholar] [CrossRef]
- Shentsis, I.; Laronne, J.B.; Alpert, P. Red Sea Trough flood events in the Negev, Israel (1964–2007). Hydrol. Sci. J. 2012, 57, 42–51. [Google Scholar] [CrossRef]
- Belachsen, I.; Marra, F.; Peleg, N.; Morin, E. Convective rainfall in a dry climate: Relations with synoptic systems and flash-flood generation in the Dead Sea region. Hydrol. Earth Syst. Sci. 2017, 21, 5165–5180. [Google Scholar] [CrossRef] [Green Version]
- Yin, J.; Zhan, X.; Zheng, Y.; Liu, J.; Fang, L.; Hain, C.R. Enhancing Model Skill by Assimilating SMOPS Blended Soil Moisture Product into Noah Land Surface Model. J. Hydrometeorol. 2015, 16, 917–931. [Google Scholar] [CrossRef]


Publisher’s Note: MDPI stays neutral with regard to jurisdictional claims in published maps and institutional affiliations. |
© 2021 by the authors. Licensee MDPI, Basel, Switzerland. This article is an open access article distributed under the terms and conditions of the Creative Commons Attribution (CC BY) license (https://creativecommons.org/licenses/by/4.0/).
Share and Cite
Lynn, B.; Yair, Y.; Levi, Y.; Ziv, S.Z.; Reuveni, Y.; Khain, A. Impacts of Non-Local versus Local Moisture Sources on a Heavy (and Deadly) Rain Event in Israel. Atmosphere 2021, 12, 855. https://0-doi-org.brum.beds.ac.uk/10.3390/atmos12070855
Lynn B, Yair Y, Levi Y, Ziv SZ, Reuveni Y, Khain A. Impacts of Non-Local versus Local Moisture Sources on a Heavy (and Deadly) Rain Event in Israel. Atmosphere. 2021; 12(7):855. https://0-doi-org.brum.beds.ac.uk/10.3390/atmos12070855
Chicago/Turabian StyleLynn, Barry, Yoav Yair, Yoav Levi, Shlomi Ziskin Ziv, Yuval Reuveni, and Alexander Khain. 2021. "Impacts of Non-Local versus Local Moisture Sources on a Heavy (and Deadly) Rain Event in Israel" Atmosphere 12, no. 7: 855. https://0-doi-org.brum.beds.ac.uk/10.3390/atmos12070855