
A 7-Year Climatology of Warm-Sector Heavy Rainfall over South China during the Pre-Summer Months


1
National Meteorological Center, China Meteorological Administration, Beijing 100081, China
2
Department of Atmospheric and Oceanic Science, University of Maryland, College Park, MD 20742-2425, USA
*
Author to whom correspondence should be addressed.
Atmosphere 2021, 12(7), 914; https://0-doi-org.brum.beds.ac.uk/10.3390/atmos12070914
Submission received: 13 June 2021
/
Revised: 5 July 2021
/
Accepted: 8 July 2021
/
Published: 15 July 2021
(This article belongs to the Special Issue Improving the Understanding, Diagnostics, and Prediction of Precipitation)
Abstract
:In view of the limited predictability of heavy rainfall (HR) events and the limited understanding of the physical mechanisms governing the initiation and organization of the associated mesoscale convective systems (MCSs), a composite analysis of 58 HR events over the warm sector (i.e., far ahead of the surface cold front), referred to as WSHR events, over South China during the months of April to June 2008~2014 is performed in terms of precipitation, large-scale circulations, pre-storm environmental conditions, and MCS types. Results show that the large-scale circulations of the WSHR events can be categorized into pre-frontal, southwesterly warm and moist ascending airflow, and low-level vortex types, with higher frequency occurrences of the former two types. Their pre-storm environments are characterized by a deep moist layer with >50 mm column-integrated precipitable water, high convective available potential energy with the equivalent potential temperature of ≥340 K at 850 hPa, weak vertical wind shear below 400 hPa, and a low-level jet near 925 hPa with weak warm advection, based on atmospheric parameter composite. Three classes of the corresponding MCSs, exhibiting peak convective activity in the afternoon and the early morning hours, can be identified as linear-shaped, a leading convective line adjoined with trailing stratiform rainfall, and comma-shaped, respectively. It is found that many linear-shaped MCSs in coastal regions are triggered by local topography, enhanced by sea breezes, whereas the latter two classes of MCSs experience isentropic lifting in the southwesterly warm and moist flows. They all develop in large-scale environments with favorable quasi-geostrophic forcing, albeit weak. Conceptual models are finally developed to facilitate our understanding and prediction of the WSHR events over South China.
1. Introduction
Previous studies have shown that more than 40% of annual rainfall in South China occurs during the pre-summer months (April to June) [1,2,3,4]. In contrast to relatively weak and broad rainfall occurring behind slowly moving surface cold fronts, many of the growing-season rainfall events over the region are heavy and highly localized, where heavy rainfall is defined herein as the daily rainfall amount of greater than 50 mm, following that defined by the China Meteorological Administration. They are typically generated in mesoscale convective systems (MCSs) that develop in the warm sector, i.e., far ahead of surface fronts, where southwesterly warm and moist flows prevail with weak thermal gradients. Hence, they have been often regarded as warm-sector heavy rainfall (WSHR) events, although some of them may be initiated near surface fronts and then propagate rapidly ahead [5,6,7,8].
Because of their high impacts on societal and economic activities, there has been considerable interest in studying WSHR events over South China during the past few decades. For example, high-resolution mesoscale observing networks were established in late 1990s in South China to monitor the development of heavy rainfall (HR) and other severe convective weather events. In addition, several field experiments were carried out, such as the South China Sea Monsoon Experiment (SCSMEX, 1996–2000) [9,10], Huanan Area Mesoscale Experiment (HUAMEX, 1998) [11,12] and the Southern China Monsoon Rainfall Experiment (SCMREX, 2014–2017) [13], to examine the development of HR-producing MCSs. A few climatological conceptual models were developed for some WSHR events, in which a quasi-stationary frontal system, formed in the southerly monsoonal air from the South China Sea (SCS)-Indochina Peninsula interacting with northerly cold air, provides a favorable condition for the generation of WSHR events over South China during the pre-summer months. After analyzing two high-impact WSHR events, Sun and Zhao [14,15,16], revealed the importance of surface heating, topography and sea breeze circulations in the associated HR-producing MCSs, which differ from those associated with dynamical forcing such as frontal lifting and upper-level troughs. Both observational and numerical modeling studies have shown the effects of topographical lifting on the development of HR-producing MCSs [17,18,19,20]. The importance of low-level jets (LLJs), and southwesterly moisture supply has also been considered in the growth and organization of HR-producing MCSs [21,22,23,24]. However, HR events are often associated with long-lived MCSs in weak southwesterly wind environments [25,26,27]. These rainfall events also exhibit significant diurnal variations [28,29], with high-frequency HR occurring during midnight to the early morning hours that are closely related to LLJs, pre-existing cool pool, orographic lifting and the planetary boundary layer (PBL) processes including urban heat island effects [30,31,32].
Although considerable progress has been made in understanding the development of WSHR events in South China, many scientific issues are still elusive. In particular, current operational (global and regional) numerical weather prediction (NWP) models still remain either hit or miss in predicting the timing and location of convective initiation and the development of WSHR-producing MCSs, thus showing little skill in the associated quantitative precipitation forecasts [13,33,34,35]. Unlike rainstorms under the influences of synoptic dynamic forcing [36], quasi-stationary fronts [37], shearlines or low-level vortices and southwesterly LLJ [38,39,40,41] are often the necessary but not sufficient conditions for determining the exact location, timing and amount of HR [42]. Therefore, it could be useful to apply the ingredient-based analysis of environmental conditions for WSHR-producing MCSs. Moreover, from the perspective of operational forecasts, it is desirable to examine climatologically the geographical and temporal distributions of HR in South China, develop conceptual models for the formation of different WSHR-producing MCSs under typical environmental conditions, and refine empirical WSHR forecast techniques.
On the other hand, HR amounts are closely related to the structures, organization and propagation of MCSs. In this regard, several three-dimensional morphological models of MCSs were developed, based on Doppler radar observations [43,44]. Doswell et al. [45] showed the relationship between localized rainfall, convective organization and movement by demonstrating that flash floods could be produced by passing through a series of convective elements aligned linearly, like an advancing train, the so-called echo-training process. Schumacher and Johnson [46] classify Two archetypes of heavy-rain-producing linear MCSs for multiple flash flood events in the Midwest of the United States: A line of training convective elements with an adjoint trailing stratiform region (TL/AS), and an area of back-building convection with a trailing stratiform region. Numerous HR events in South China and elsewhere in China were also found to be directly linked to multiple mesoscale echo- and rainband-training processes [47]. Recently, Liu et al. [48] classified three types of persistent HR events in South China, based on their correlations with geographical locations of the HR event occurrences.
Evidently, few statistical studies have been systematically performed to classify WSHR-producing MCSs during the pre-summer months in accordance with synoptic environments and topographic forcing in South China. Given our limited understanding of the large-scale conditions associated with WSHR and the morphologies of HR-producing MCSs during the pre-summer months over South China, the objectives of this study are to (i) document the spatiotemporal characteristics of WSHR and classify a few major types of WSHR events during the years of 2008–2014; (ii) identify the large-scale environmental conditions associated with the different types of WSHR events; and (iii) analyze the structures, organization and evolution of typical MCSs that produce the WSHR events.
The next section describes the data and methodologies used for this study. Section 3 presents the spatiotemporal characteristics of WSHR and describes the classification of major WSHR events, based on their large-scale flow patterns. Their associated environmental parameters, i.e., total precipitable water (PWAT), convective available potential energy (CAPE), and the level of free convection (LFC) are also shown. Section 4 presents some typical MCS morphologies using radar observations. A summary and concluding remarks are given in the final section.
2. Data Source and Methodology
In this study, observations from the conventional (2418) surface weather stations and upper-air network during the pre-summer months of 2008–2014, archived by the National Meteorological Center of the China Meteorological Administration (CMA/NMC), are used to describe the proximity of environmental conditions in which WSHR events occurred. The 6-hourly National Centers for Environmental Prediction (NCEP) Global Forecast System (GFS) 0.5° × 0.5° gridded model dataset is used to reveal the large-scale flows and the environmental conditions under which WSHR-producing MCSs develop.
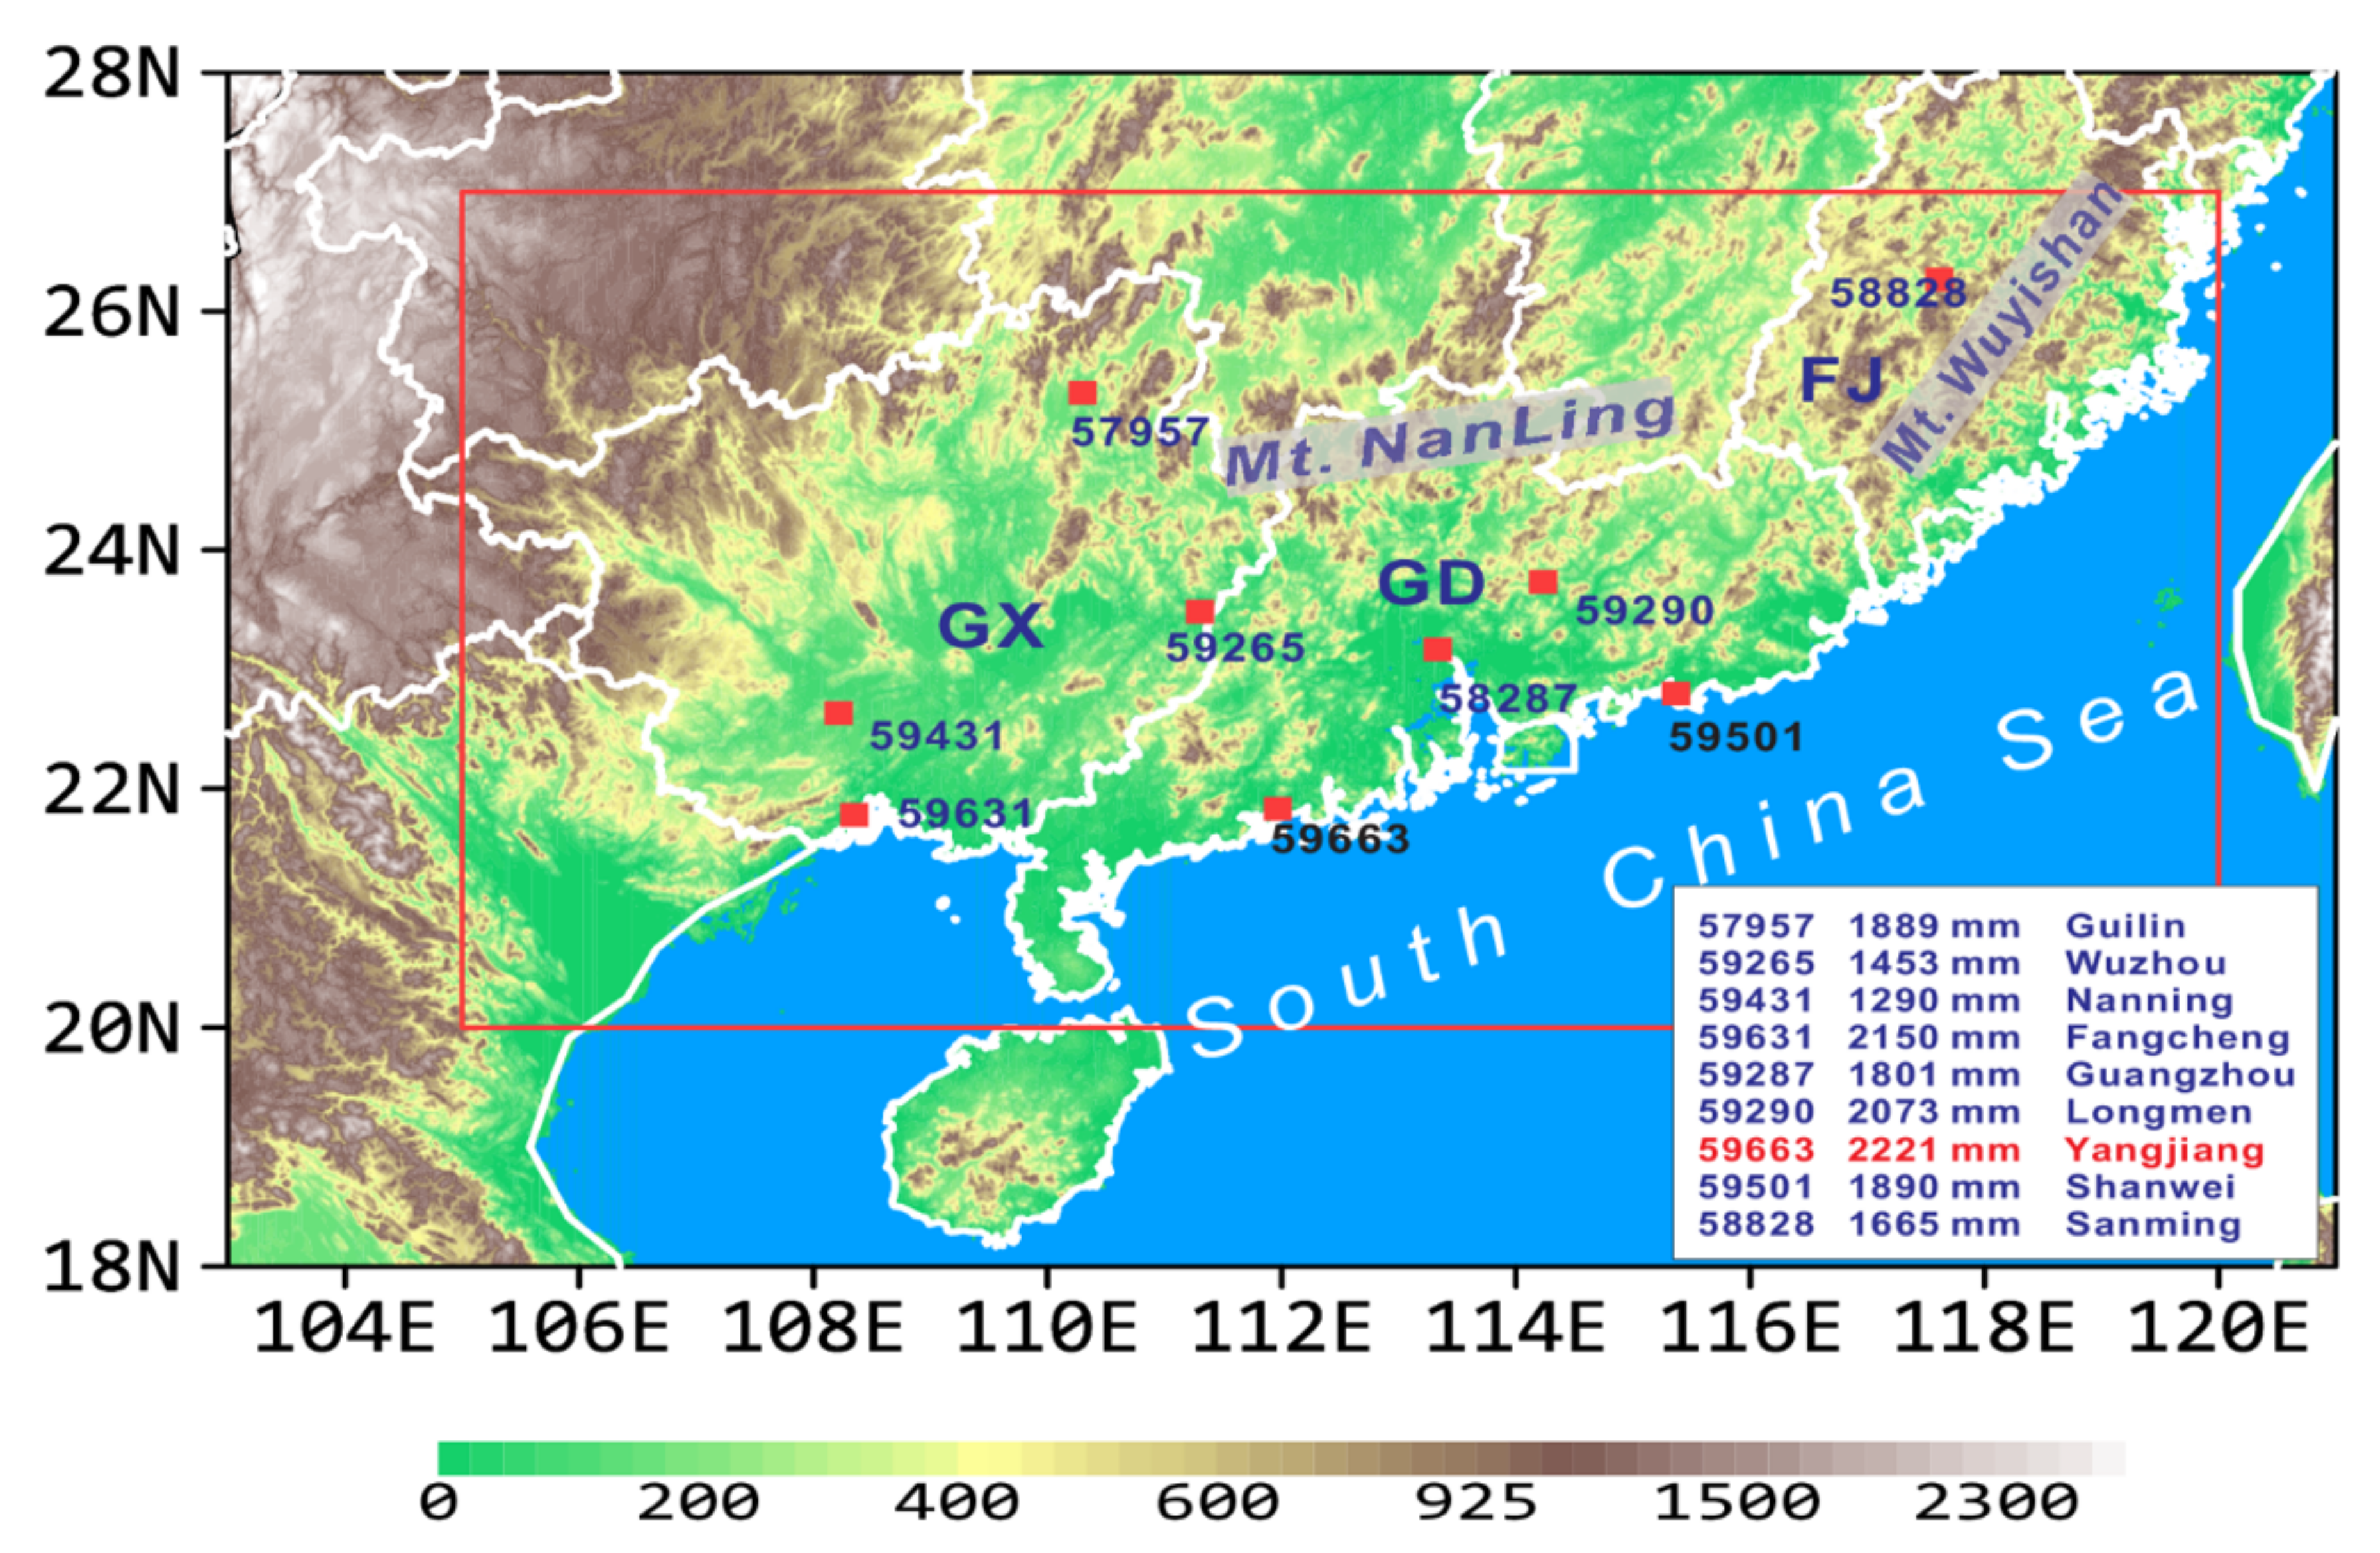
In general, South China is geographically referred to as the vast territory on the south of Mt. Nanling, including most portion of Guangxi (GX) Province, all of Guangdong (GD) and Hainan (HN) provinces, and part of Fujian (FJ) Province (see Figure 1). In this study, we focus on the area ranging within 20–27° N and 105–120° E, which includes almost all of South China, except for Hainan Province. The mean annual precipitation in South China, obtained from 16 climatological stations, is 1614 mm, according to Year 1981–2010 precipitation statistics, over 45% of which occurred during the pre-summer months [2]. For the present study, out of 16 national surface stations, nine received top annual rainfall amounts over South China, as highlighted with red dots in Figure 1. The top annual rainfall amounts ranged from 1453 mm at Wuzhou, GX (No. 59265) to 2221 mm at Yangjiang, GD (No. 59663).
A composite analysis and subjective classification of 58 WSHR events will be performed to develop conceptual models of different MCSs for various types of WSHR events, based on the given large-scale background flows. This approach has been used by Maddox et al. [49] to classify four categories of large-scale flow patterns that are favorable for the generation of flooding rainfall in the central and eastern United States, and by Tao [1], and Huang [2] to characterize various large-scale circulation features, such as surface fronts, LLJs, and low-level vortices, that are involved in the generation of WSHR events in South China. In this study, a surface front is defined as a warm/moist—cold/dry air boundary, accompanied with a height trough aloft. An LLJ is simply defined as the peak horizontal wind speed of at least 10 m s−1 below 850 hPa, though occurring mostly near 925 hPa, while a low-level vortex (LV) is just a closed circulation in the lowest 150 hPa. Given the weak-gradient environments in which the WSHR events took place, an objective classification scheme, e.g., through regional-scale vertical wind shear, CAPE, PWAT, and relative vorticity, could be developed to identify some unique dynamical and thermodynamic characteristics of the WSHR events.
3. Spatiotemporal Characteristics of WSHR and Large-Scale Mean Flows
In this section, we examine first the temporal distribution of WSHR events, and classify them into different categories, based on their common background characteristics. Then, the corresponding composite fields will be analyzed to gain insight into different characteristics in large-scale flows and energy supply, HR generation mechanisms, and their spatial distributions in South China.
3.1. Characteristic of WSHR
In this study, an HR event is defined when 24-h (i.e., between 0800–0800 BST: Beijing Standard Time = UTC + 8 h) accumulated precipitation at 3 and more adjacent (less than 200 km apart) or at five scattered (at least 300 km apart) national stations over South China equals to or exceeds 50 mm. Clearly, this definition will filter out HR events generated by local or random deep convection. Table 1 shows, on average, 37.7 HR days per year during the pre-summer months of 2008–2014, 65% of which take place after the onset of summer monsoon in East Asia. There are a total of 58 WSHR days or events (see Appendix A, Appendix B, Appendix C for their individual occurrence dates), which give 8.3 WSHR events per year or 22.0% of the total HR events during the pre-summer months of the 7-year period, and a total of 145 typical WSHR-producing MCSs move across South China. Higher-frequency WSHR events occur during the pre-summer months of 2008 and 2009, as compared to the lowest-frequency WSHR events in 2011.
Horizontal distribution of the mean daily rainfall amount from all 58 WSHR events over South China is displayed in Figure 2, showing the top five rainfall maxima, denoted as “C1”–“C5”, four of which are more than 100 mm day−1. They are located near surface stations in Guilin of GX; Yangjiang of GD, Shanwei of GD, and the Pearl River Estuary of GD, respectively. A single-day rainfall amount reaches 445.7 mm, named as the top one (C1) WSHR event, which occurs in Yunxiao of FJ, on 14 June 2008 as a result of a low-level vortex interacting with strong monsoonal flows. The top 1–10 WSHR maxima correspond more or less to climatological precipitation maxima.
3.2. Classification of WSHR Events
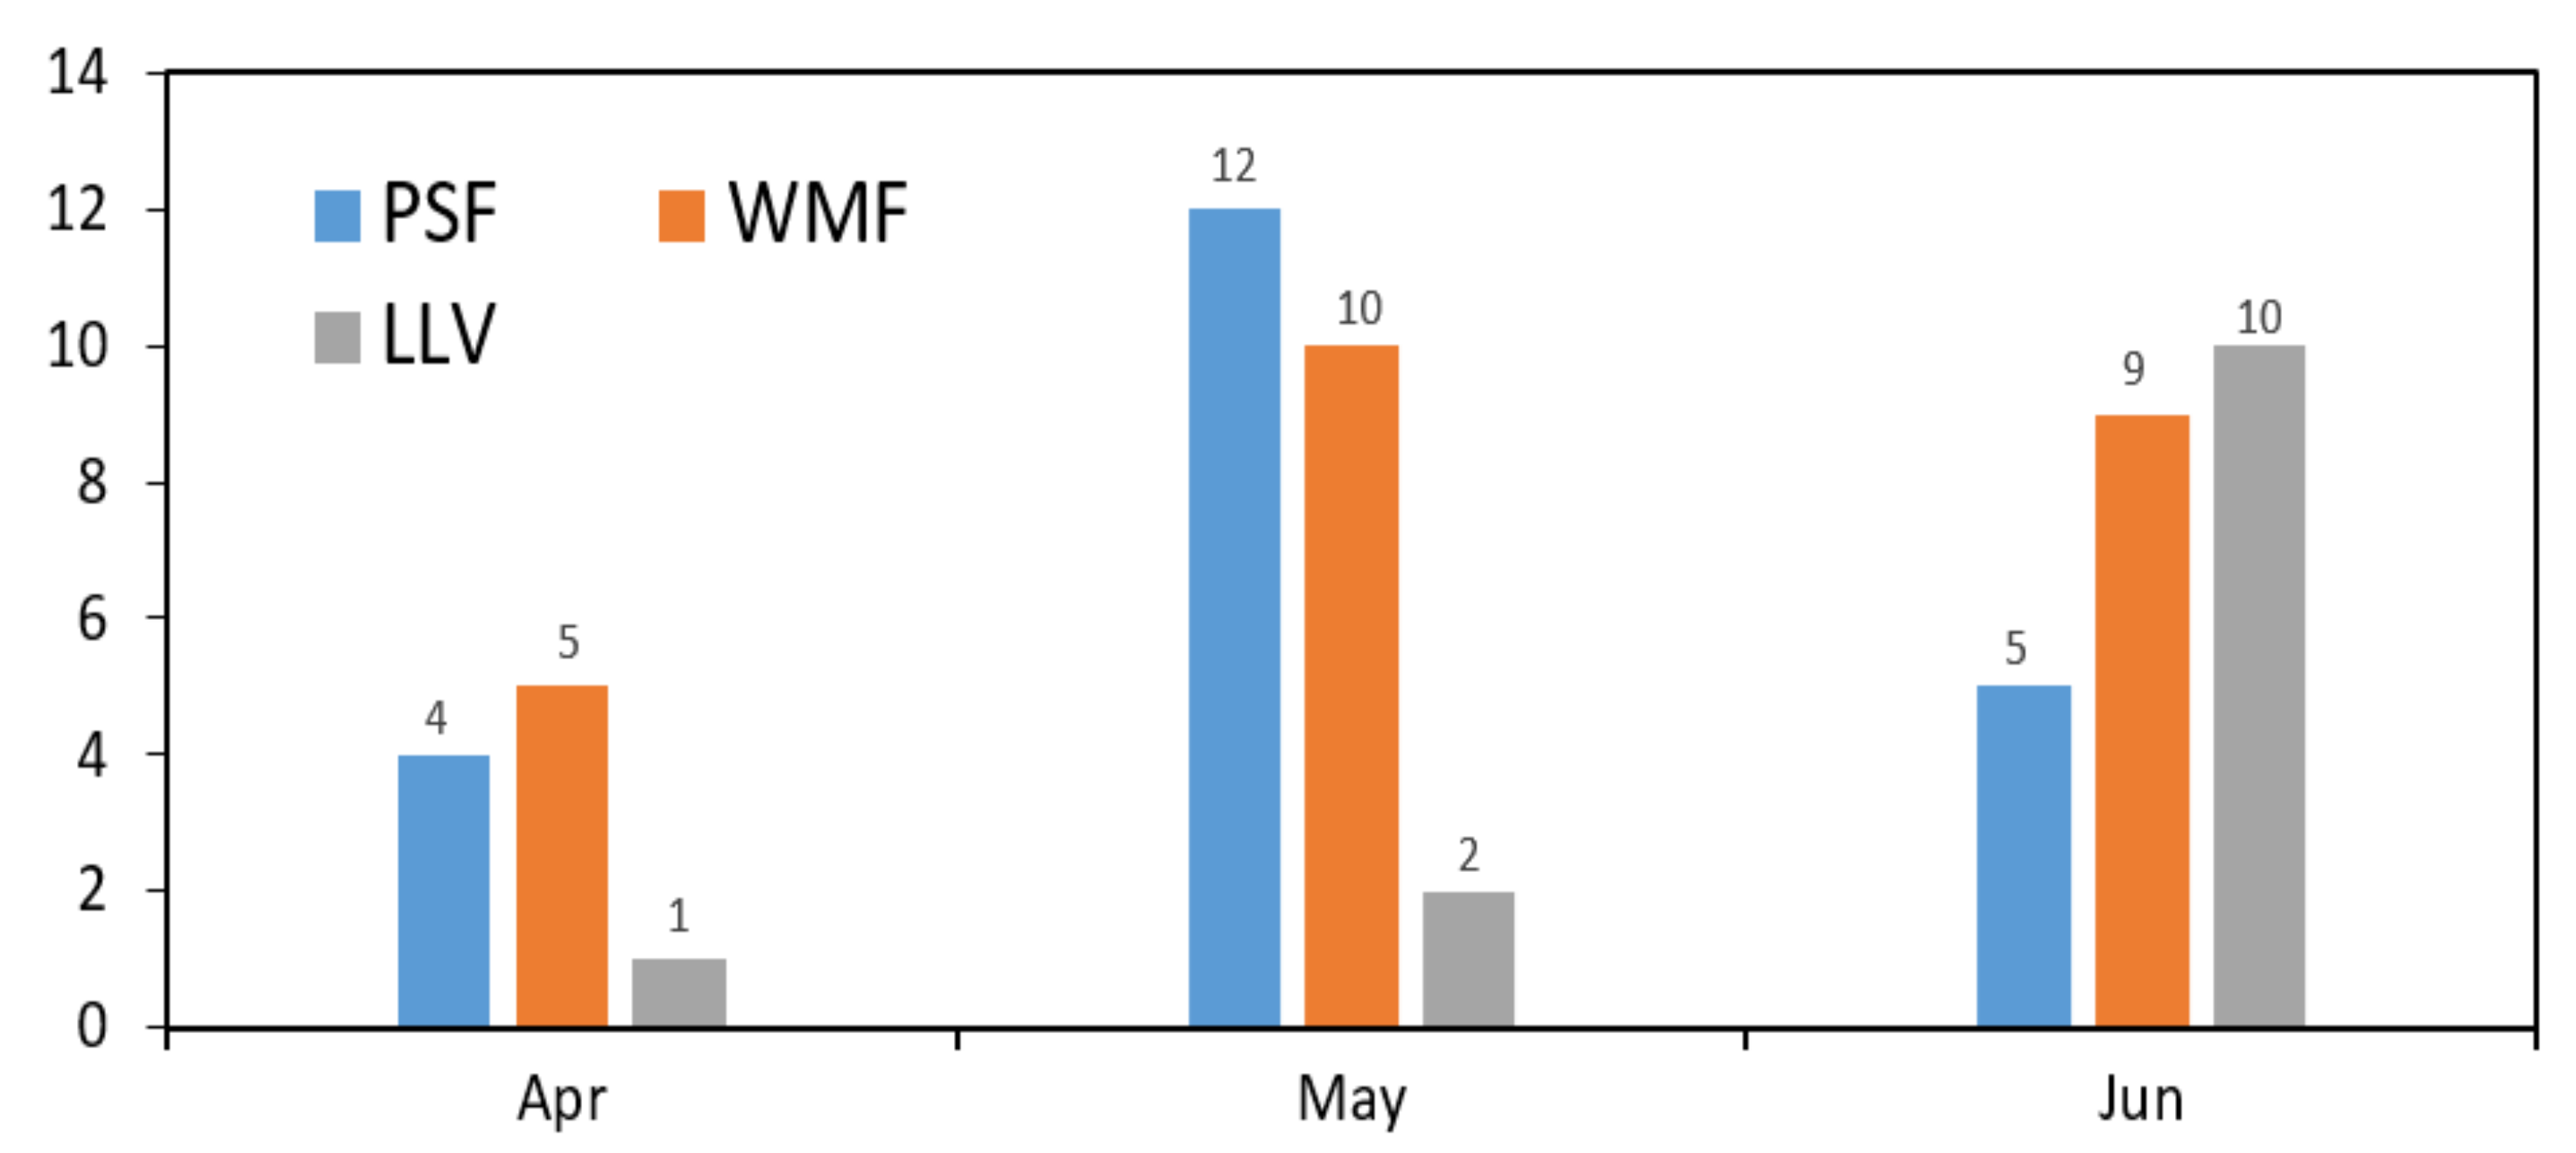
Based on the previous studies of HR-producing MCSs, it is convenient to use the surface front and low-level vortex as the two key weather system identifiers to classify the large-scale environments in which all the above WSHR events occur. The following three major types of flow configuration could be identified: (i) a pre-surface-frontal (PSF) type, (ii) a warm-moist airflow (WMF) type, and (iii) a low-level vortex (LLV) type. The remaining HR events appear to be more associated with typical frontal rainbelts, tropical cyclones or randomly generated local thunderstorms. Monthly distribution of each type of WSHR events is given in Figure 3, showing the least occurrences of (10) WSHR events in April and the frequent occurrences in May and June (24 in each month). The frequencies of the individual types of WSHR events appear to follow closely the seasonal transition from more surface frontal passages in April to more influences of southwesterly monsoonal flows in May and June. In particular, few LLV-type WSHR events could occur in April and May due to the presence of more baroclinicity on the lee side of the Tibet Plateau, but they become the dominant HR producer in June as more moist monsoonal air is processed. After describing briefly their general characteristics below, more detailed rainfall characteristics and mean environmental conditions associated with the three types of WSHR events are presented in subsections 3b-d that follow, respectively.
(i) The PSF type consists of 21 HR events (see Appendix A for their occurrence dates), accounting for 36.2% of the total WSHR events. It occurs in the moist southwesterly flows far ahead of a surface front (i.e., in a warm sector), and the associated WSHR belt is well separated from those rainbelts with much weak rainfall intensity along or behind the frontal zone.
(ii) The WMF type consists of 24 HR events (see Appendix B for their occurrence dates), accounting for 41.4% of the total WSHR events, which is of the highest frequency among the three types. Its large-scale flow pattern is dominated by a warm-moist southwesterly airstream with little evidence of a surface front, but experiencing northeastward isentropic lifting [50,51,52,53,54]. It is often accompanied by a southwesterly LLJ extending from the SCS, with some typical monsoonal rainfall characteristics.
(iii) The LLV type consists of 13 HR events (see Appendix C for their occurrence dates), accounting for 22.4% of the total WSHR events. An LLV is often generated on the lee side of the Yunnan-Guizhou Plateau and then moves eastward across GX, during which course HR takes place in its southern and eastern quadrants. This type of WSHR events tends to be a HR producer. One example is the record-breaking HR event of 13–15 June 2008, listed as the top one HR producer in Table 2, that is associated with a slow-moving LLV across GX with high-θe air masses fed by southwesterly monsoonal flows.
In addition to the above three-types of large-scale flow patterns, some WSHR events may be produced by the other types of MCSs, such as LLVs moving from the SCS that are similar to landfalling tropical depressions. Two such examples are the WSHR events of 5–6 June 2008 and 23–24 May 2009 leading to torrential rainfall over the coastal regions of South China. Nevertheless, few such WSHR events occur during the pre-summer months of 2008–2014, and so they will not be investigated herein.
3.3. Large-Scale Mean Flows of the WSHR Events
3.3.1. The PSF-Type Events
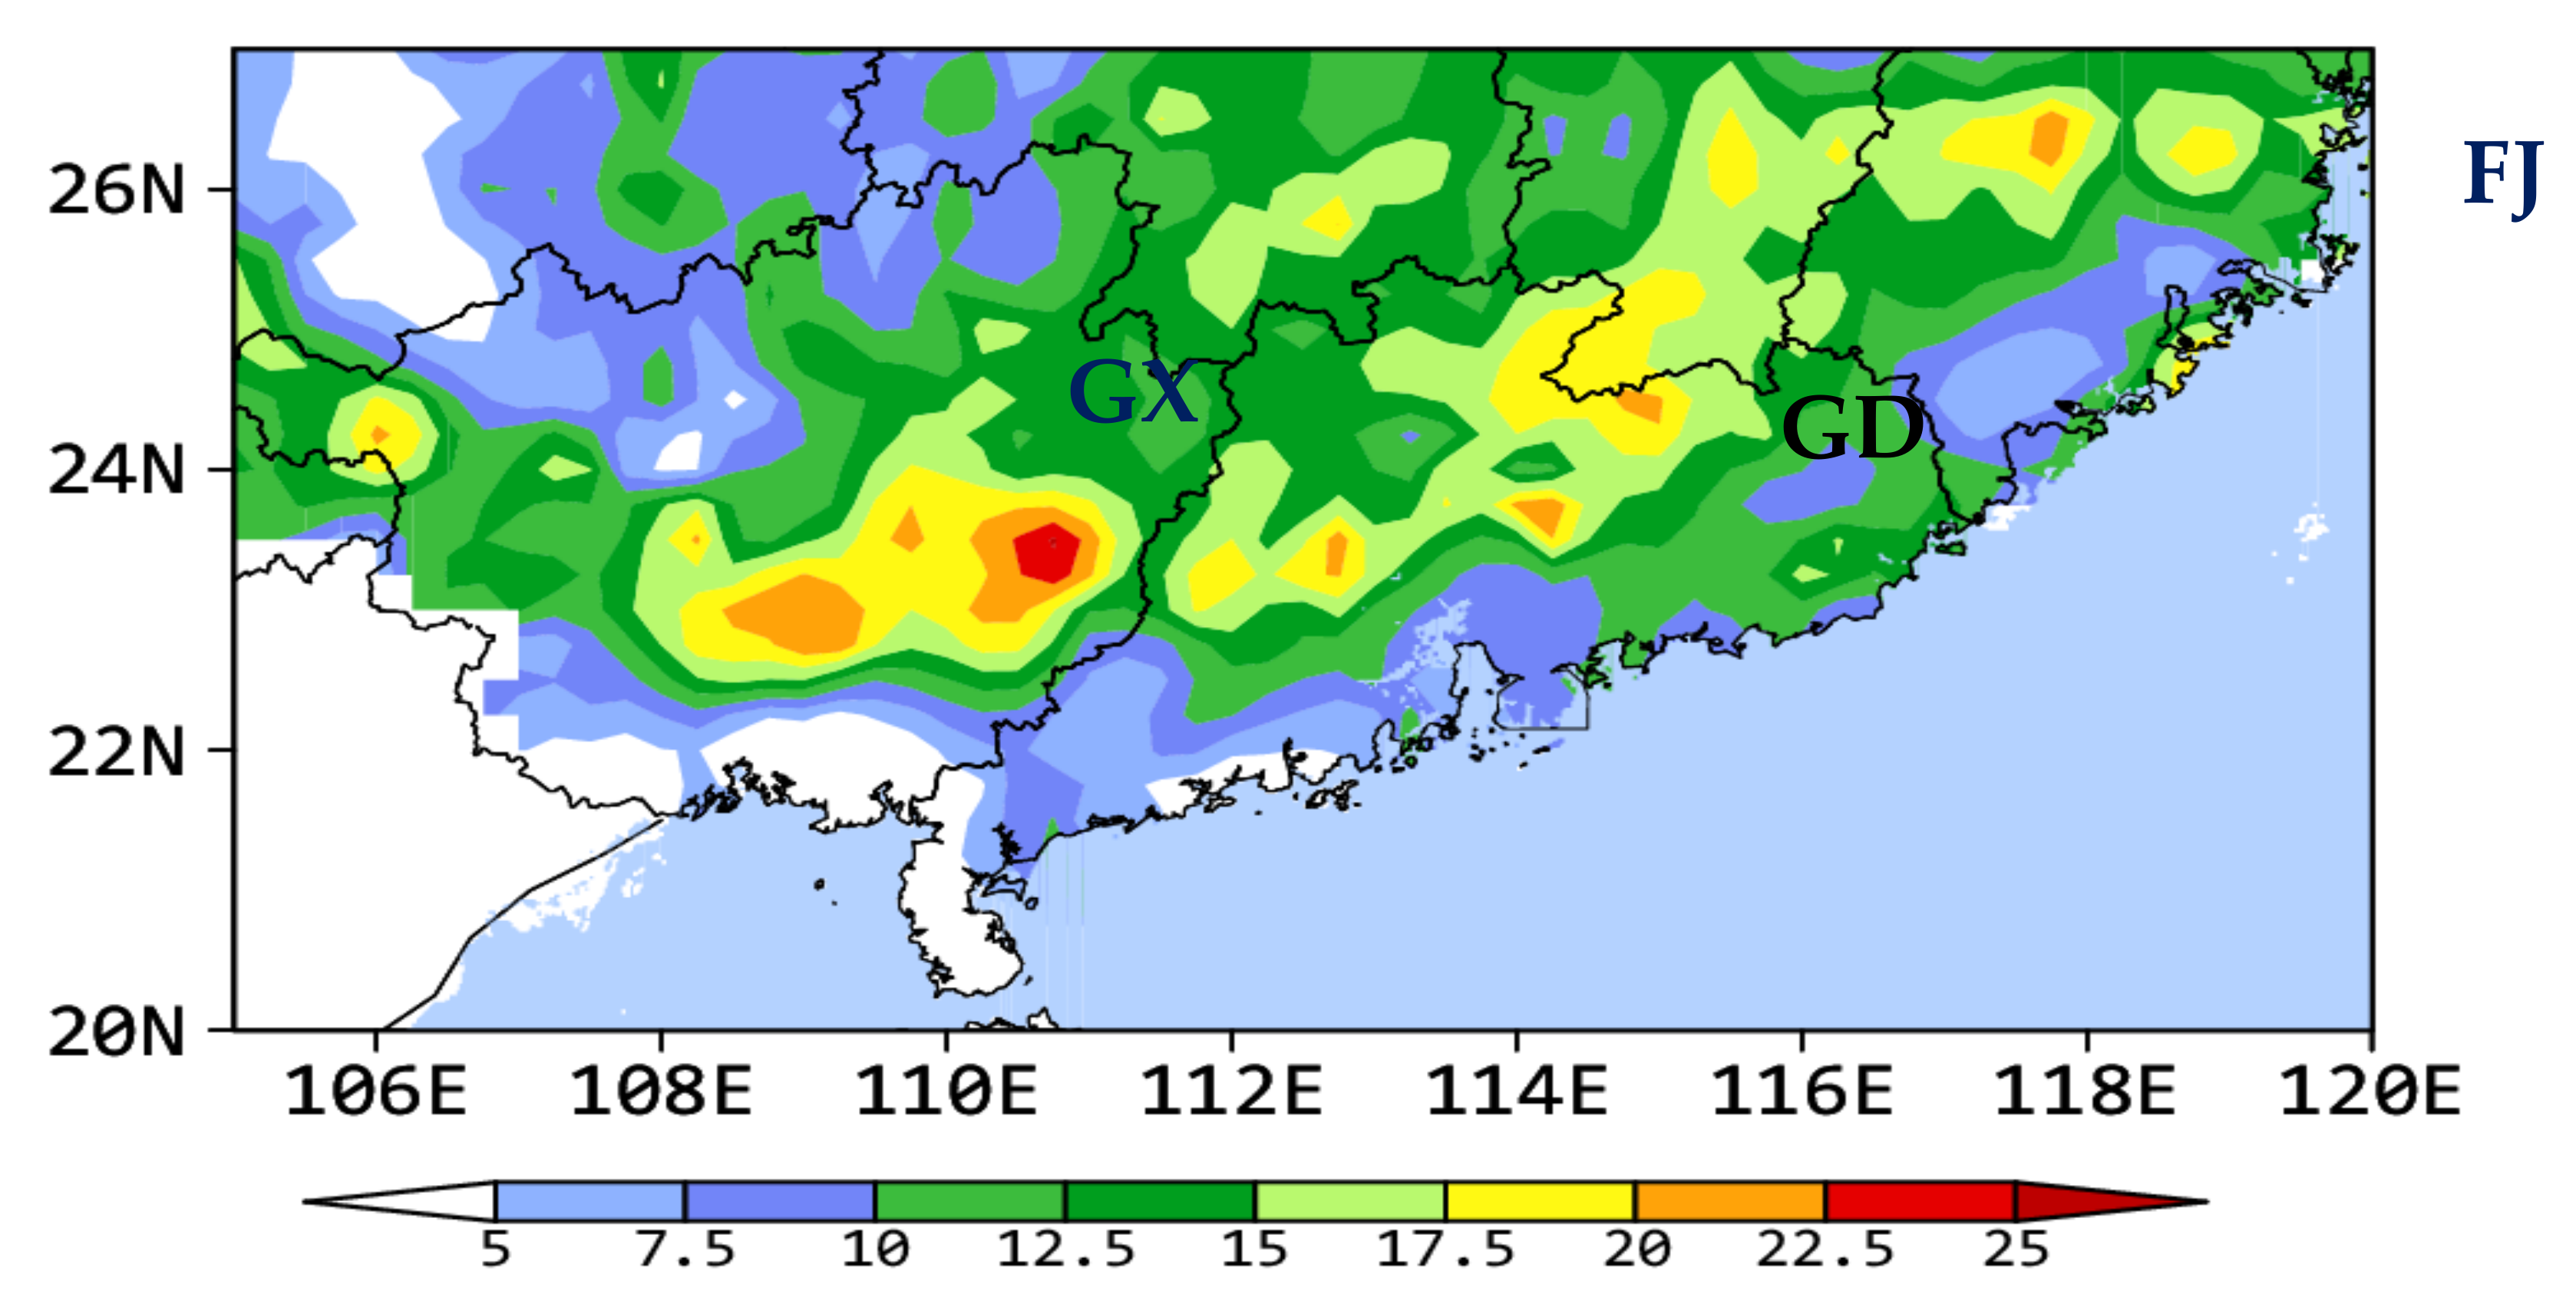
The relative contribution (%) of the PSF-type rainfall to the total WSHR amount during the pre-summer months of the study period is given in Figure 4, showing a narrow small-percentage (i.e., <12.5%) zone of about 80-km width along the southern coastal region, followed by an elongated high-percentage (i.e., >15%) belt of about 120-km width inland, and a secondary rainbelt (i.e., <20%) in the southern Hunan Province. Several distinct high percentage (i.e., >20%) maxima are located near Nanning (No. 59431) and Wuzhou (No. 59265) of GX, Longmen (No. 59290) of GD, and Sanming (No. 58828) of FJ, which coincide well with several top HR centers shown in Figure 2.
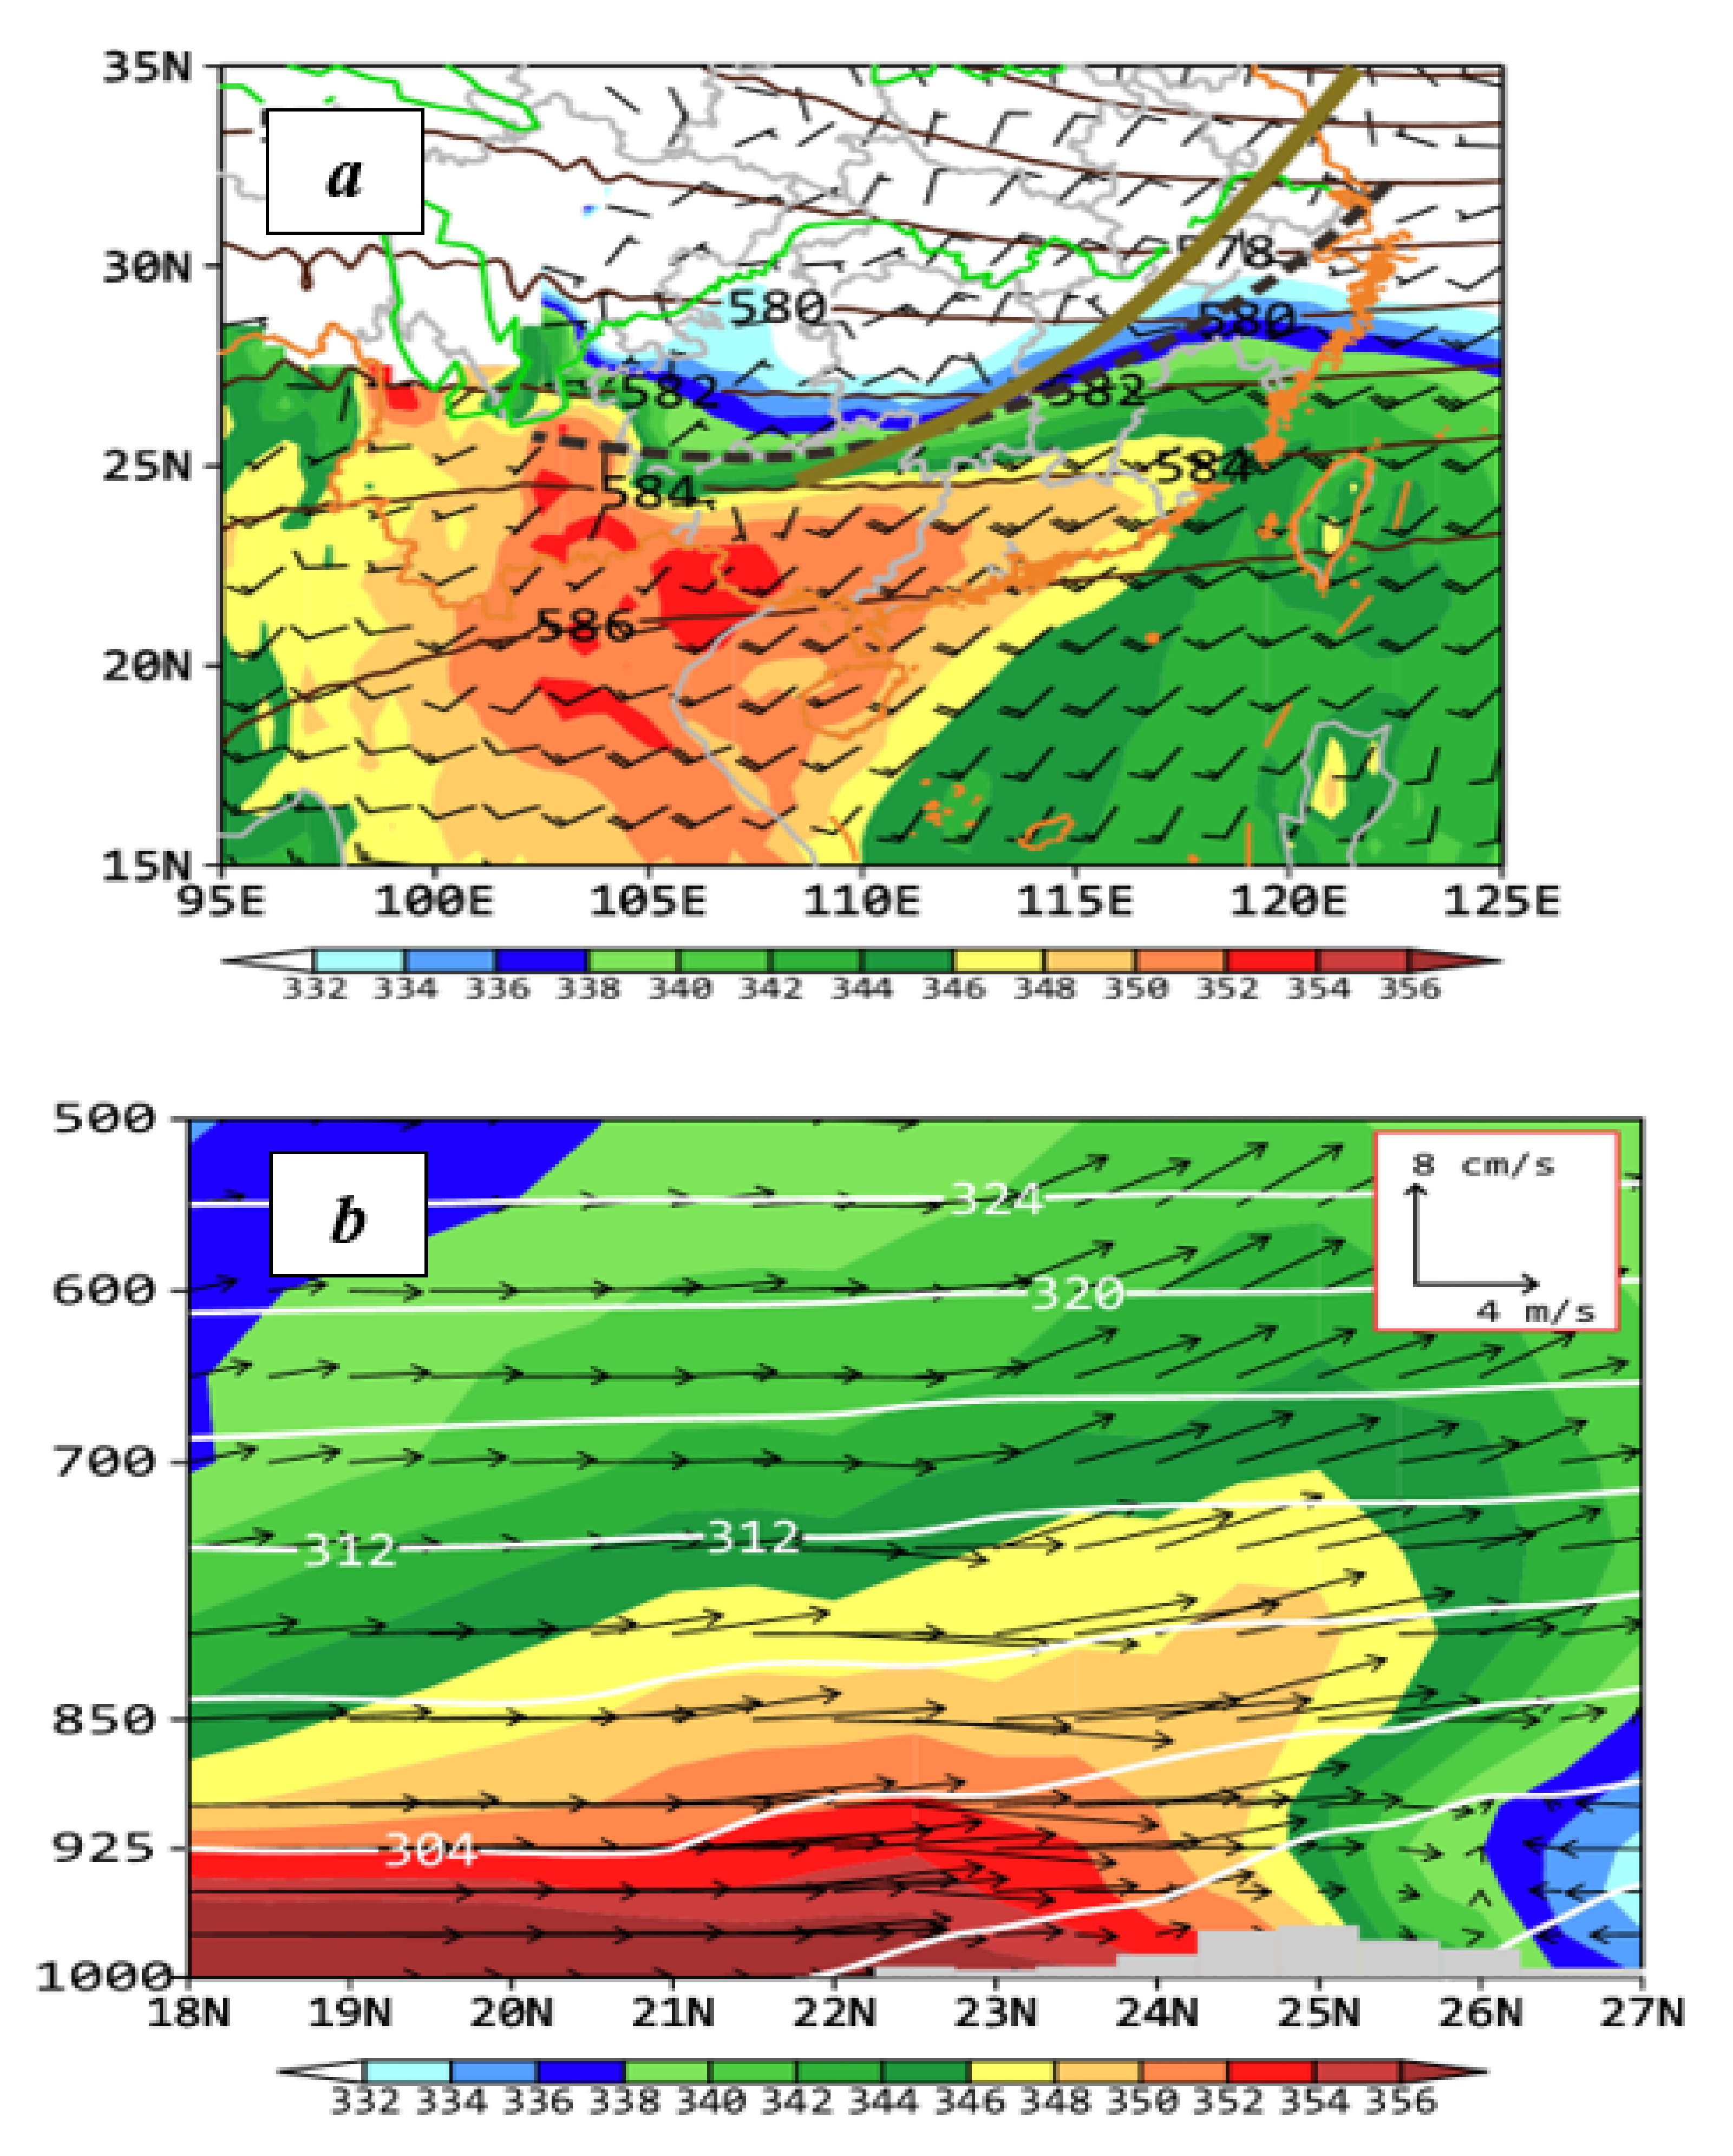
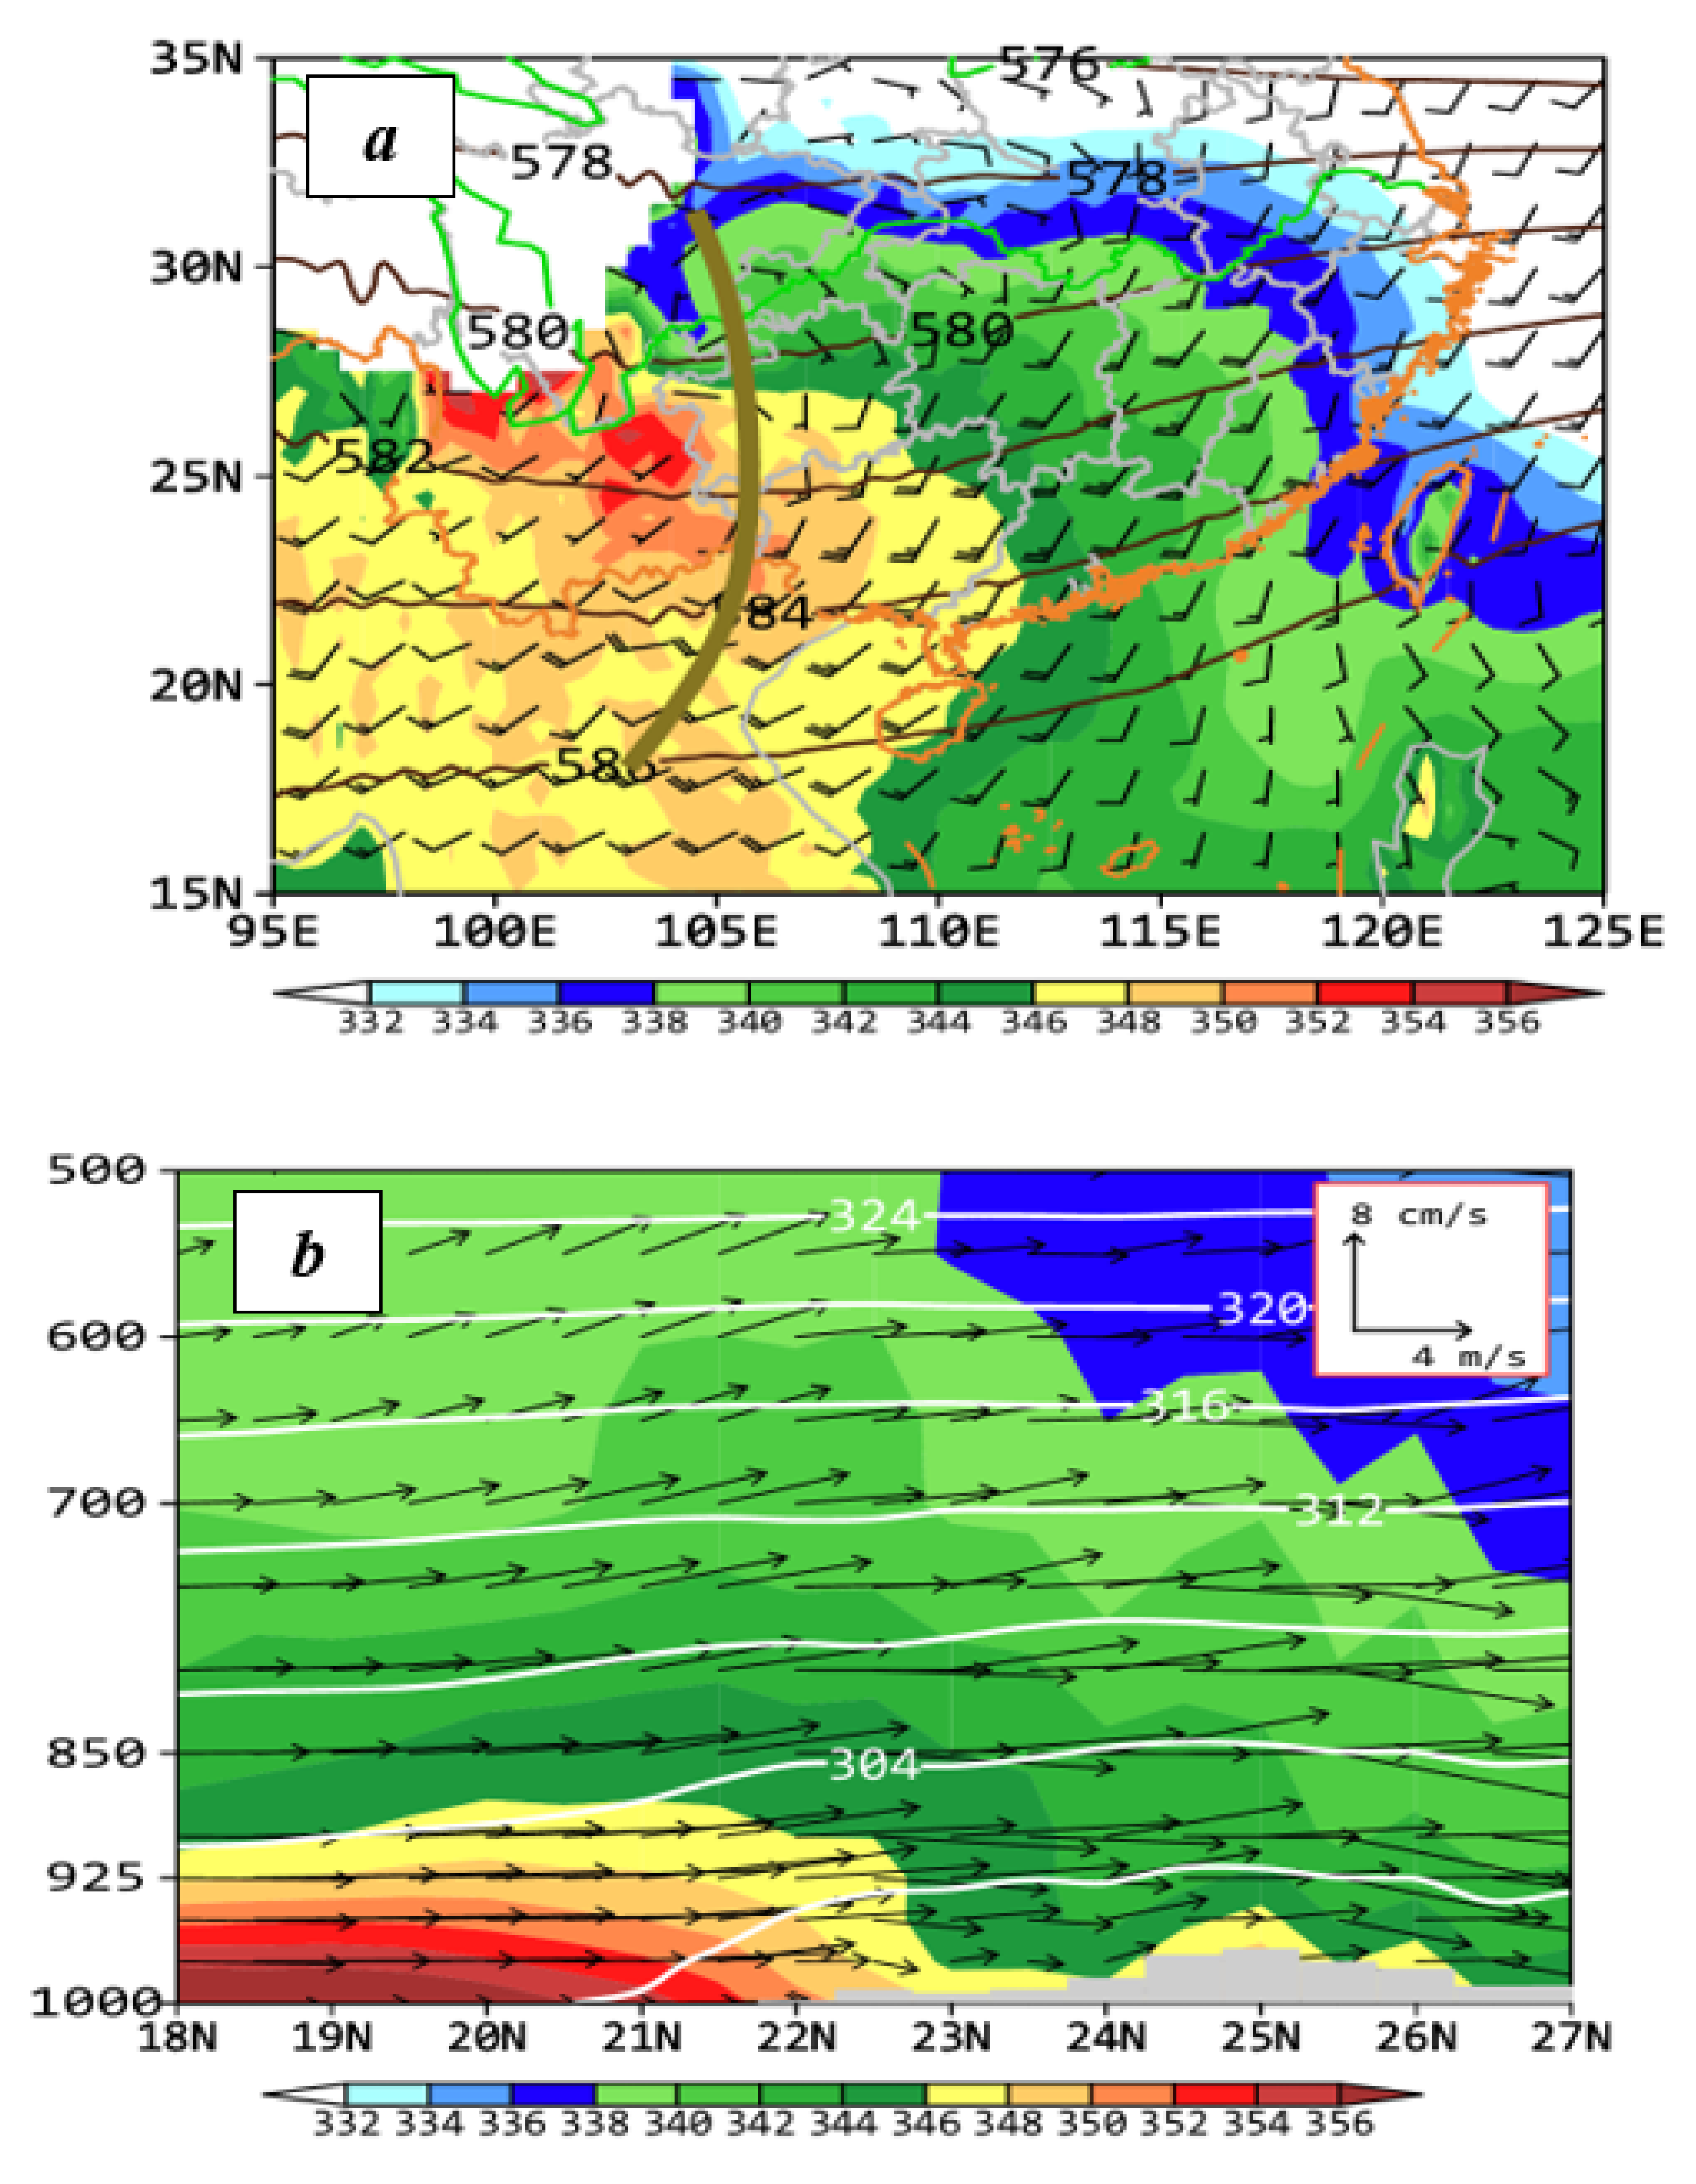
The composite 500-hPa height field for the PSF events is given in Figure 5a, showing a weak trough located to the north of 25 °N, offshore of East China, with northwesterly flows of cold and dry air. In contrast, South China, i.e., on the south of 25° N, is featured by a nearly zonal flow pattern. This is a typical circulation pattern during the pre-summer months in South China, in which a quasi-stationary front sustains between a dry-cold air mass from the midlatitudes and a warm-moist air mass from tropical oceans.
The composite 850-hPa wind field, also given in Figure 5a, shows a well-defined cold front, as characterized by an arc-shaped shearline, just approaching to Mt. Nanling, as the cold-dry airmass from aloft descends anticyclonically southwestward. The cold front becomes shallower and weaker to the southwest, due partly to the blocking effects of Mt. Nanling, and it moves slower (and even nearly quasi-stationary), after passing the mountains. Thus, its warm sector is prevailed by the southwesterly winds of 8~10 m s−1 with a high equivalent potential temperature (θe) tongue of greater than 344 K extending from Indochina Peninsula and the SCS. In addition, air masses of strong and weak-θe gradients are distributed over the northern and southern portion of South China, respectively, implying the presence of little thermal advection in the warm sector. Since WSHR occurs in the high-θe tongue region with high moisture content, its amount is much greater than that along the surface front. In particular, the continuous supply of high-θe air by the prevailing southwesterly flow provides not only the necessary moisture content for the WSHR production, but also helps maintain conditional instability, that is removed by deep convection, for the persistent convective overturning in the warm sector. In this regard, the low-level high-θe airstream could be considered as one of the most important thermodynamic forcing for producing WSHR events over South China.
A south-north vertical cross section of secondary circulation along 112° E (near Yangjiang) is given in Figure 5b, showing that more pronounced low-level isentropic lifting of about 10 cm s−1 occurs to the north of 24° N, which is more associated with the shallow cold frontal system. However, the PSF-type HR occurs in the 21–24° N range (cf. Figure 4 and Figure 5b), whose maxima are 100–150 km ahead of the cold front. A detailed analysis of a few PSF-type HR events reveals that their initial convective activity could be traced back to the leading edge of the surface front, and then its organization into MCSs leads to the occurrences of the PSF-type of WSHR events as they propagate rapidly eastward (not shown). Nevertheless, the vertical lapse rate of θe from the surface to 700 hPa on the south of 23° N indicates the presence of more significant convective instability than that on its north. Furthermore, given the presence of very humid air during this season in South China, the southwesterly airstream of high-θe (>354 K) airmass in the PBL would allow deep convection to be triggered along convectively generated outflow boundaries. Convective triggering along the cold outflow boundaries accounts partly for the eastward propagation of MCSs and explains the generation of an elongated HR belt of about 120-km width with a distance of about 80 km inland from the southern coastline (Figure 4).
3.3.2. The WMF-Type Events
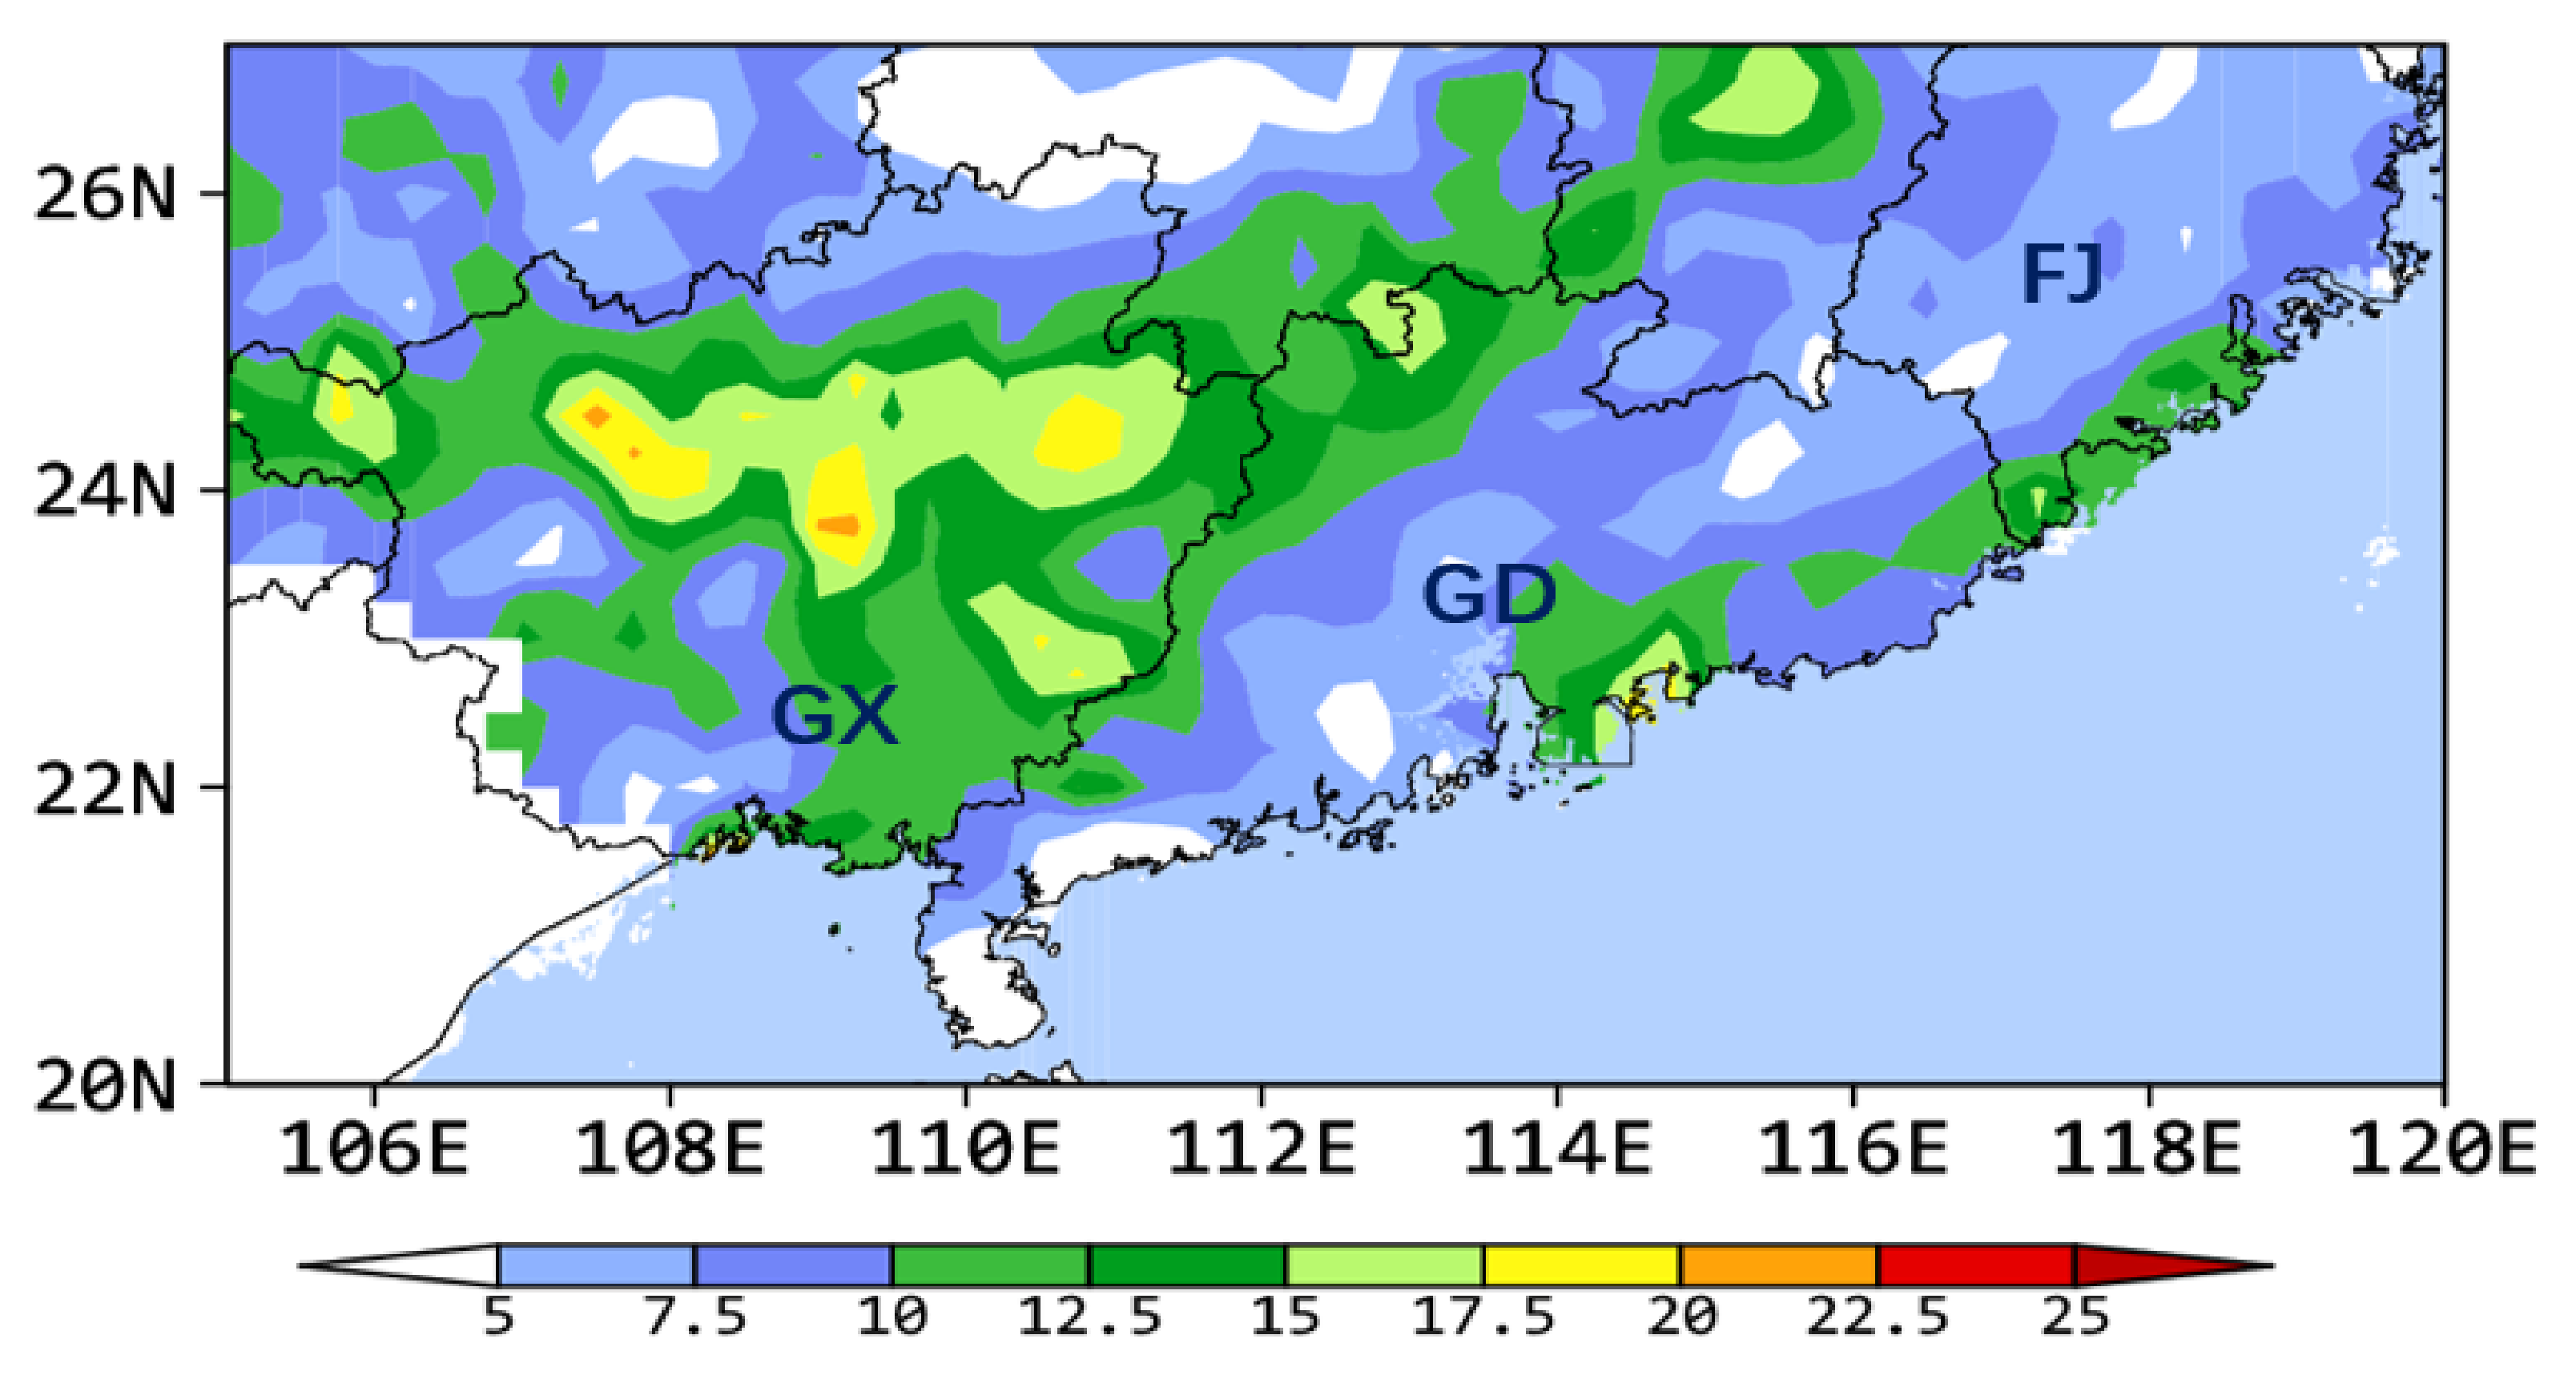
The WMF-type of WSHR events is of the highest frequency among the three classified types, as shown in Figure 3, and it is also more localized in the coastal region of South China (Figure 6). Hence, this type of WSHR events is distinct from the PSF-type events. Figure 6 exhibits three pronounced WMF-type of WSHR maxima: the most intense one at Yangjiang of GD (No. 59663), and then Shanwei of GD (No. 59501) and Fangcheng of GX (No. 59631) in this order, which are all located near the coastline with some hills, albeit less than 500 m altitude; they are also three of the top nine HR stations shown in Figure 1. This appears to indicate the possible roles of topographical forcing and sea breezes in generating the WSHR maxima. Of significance is that the WMF-type events account for more than 20% of the total pre-summer months rainfall amount in the Yangjiang area.
As compared to the PSF-type of WSHR events, the WMF-type composite height field at 500 hPa is characterized by a distinct short-wave trough with the lower-tropospheric warm advection on the lee side of the Tibet Plateau with southwesterly flows over South China (Figure 7a). This would facilitate quasi-geostrophic ascent that helps bring the moist southwesterly monsoonal air underneath to saturation, thereby preconditioning the large-scale environment for HR production. The 850-hPa composite fields show the presence of south-to-southwesterly winds of up to 10 m s−1 with θe > 340 K over a vast area on the south of the Yangtze River Basin, including South China. Unlike the PSF-type events, there is little evidence of a low-level shearline or a front-like zone. Thus, it is often hard to trace directly the initiation of MCSs associated with the WMF-type of WSHR events. An examination of Figure 1, Figure 6 and Figure 7a shows that the above-mentioned WSHR maxima coincide reasonably well with the land-ocean contrast and local topography. This indicates the importance of orographic lifting in triggering deep convection, and of the echo-training process in producing the subsequent HR. In addition, we may assume that convectively generated moist downdrafts, and old thermal boundaries from the previous dissipated MCSs as well as the surface heating could also provide favorable triggering of deep convection leading to the WSHR-producing MCSs.
A south–north vertical cross section through the Yangjiang station with the top HR amount reveals favorable isentropic uplifting of southwesterly flows below 850 hPa, in association with the above-mentioned quasi-geostrophic ascent, which is more pronounced across the coastline (Figure 7b). Unlike the PSF-type events that take place in an environment with a deep-layer high-θe air over a wide area in the warm sector, the horizontal extent and depth of high-θe air associated with the WMF-type events are much limited to the west of 110° E and the south of 22° N (cf. Figure 5a,b and Figure 7a,b). This different three-dimensional distribution of high-θe air appears to explain why the latter exhibits more localized HR compared to more widespread HR in the former (cf. Figure 4 and Figure 6).
3.3.3. The LLV-Type Events
Figure 8 shows more zonally distributed high-percentage rainfall associated with the LLV-type WSHR events, covering a zonal belt of 50–80 km width with several high-percentage rainfall maxima across GX around 24° N. This rainbelt is located to the north of the high-percentage rainbelt associated with the PSF-type events and on the southern side of Mt. Nanling (cf. Figure 4 and Figure 8). A composite wind and θe analysis shows clearly the presence of an elliptic-shaped LLV with θe > 348 K at 850 hPa around 24° N, with a corresponding mesotrough at 500 hPa that is more pronounced than that associated with the PSF- and WMF-type events (cf. Figure 5a, Figure 7a and Figure 9a). An analysis of several LLV cases indicates that the LLVs are usually formed on the lee side of the Yunnan-Guizhou Plateau in close association with the passage of midlevel troughs [3,52,54], and HR begins to develop as they move into GX’s northwestern border (Figure 8). The high-percentage rainbelt just corresponds to the paths of LLVs that are collocated with the midlevel trough (cf. Figure 8 and Figure 9a). Note that the LLVs under study differ from southwest vortices discussed by Kuo et al. [55], and Li et al. [56], which are more topographically related to their origins over the Sichuan Basin. Because of the conservative property of cyclonic vorticity in the presence of weak vertical wind shear, the associated MCSs are longer lived than those associated with the other two-type HR events. Normally, it takes 2–3 days for them to move across GX and GD due to the presence of weak-gradient flows, especially in June. Such slow movements allow the MCSs to drop more rainwater along their paths, thus often producing HR and regional flash floods over South China.
As compared to the other two types of WSHR events, the predictability of the LLV-type events by NWP models appears to be superior due again to the conservative property of LLVs [54,57]. LLVs are typically of 300–400 km in diameter, and more evident below 700 hPa, even in the composite fields (Figure 9a). HR usually occurs in the eastern semicircle of LLVs, where is also the favorable region for isentropic uplifting from the potential vorticity viewpoint, given westerly vertical wind shears in the pre-storm environments. This can also be seen from Figure 9b, showing isentropic ascent of high-θe air into the LLV region. When interacting with a warm-moist airstream in the PBL, deep convection can form successively at the southern to southeastern periphery of LLVs. The resulting latent heat release would in turn help enhance the intensity of LLVs. The three-dimensional extent of high-θe air is greater than that associated with the PSF-type events (cf. Figure 5 and Figure 9). In addition, the topographical lifting of the high-θe air over Mt. Yunkai and Mt. Yunwu near the GD-GX border appears to be more pronounced in the LLV-type events than that in the other two types, due to their developments over different geographical locations. This can be seen from the sloping terrain shown in Figure 5b, Figure 7b and Figure 9b.
4. Environmental Thermodynamical Parameters
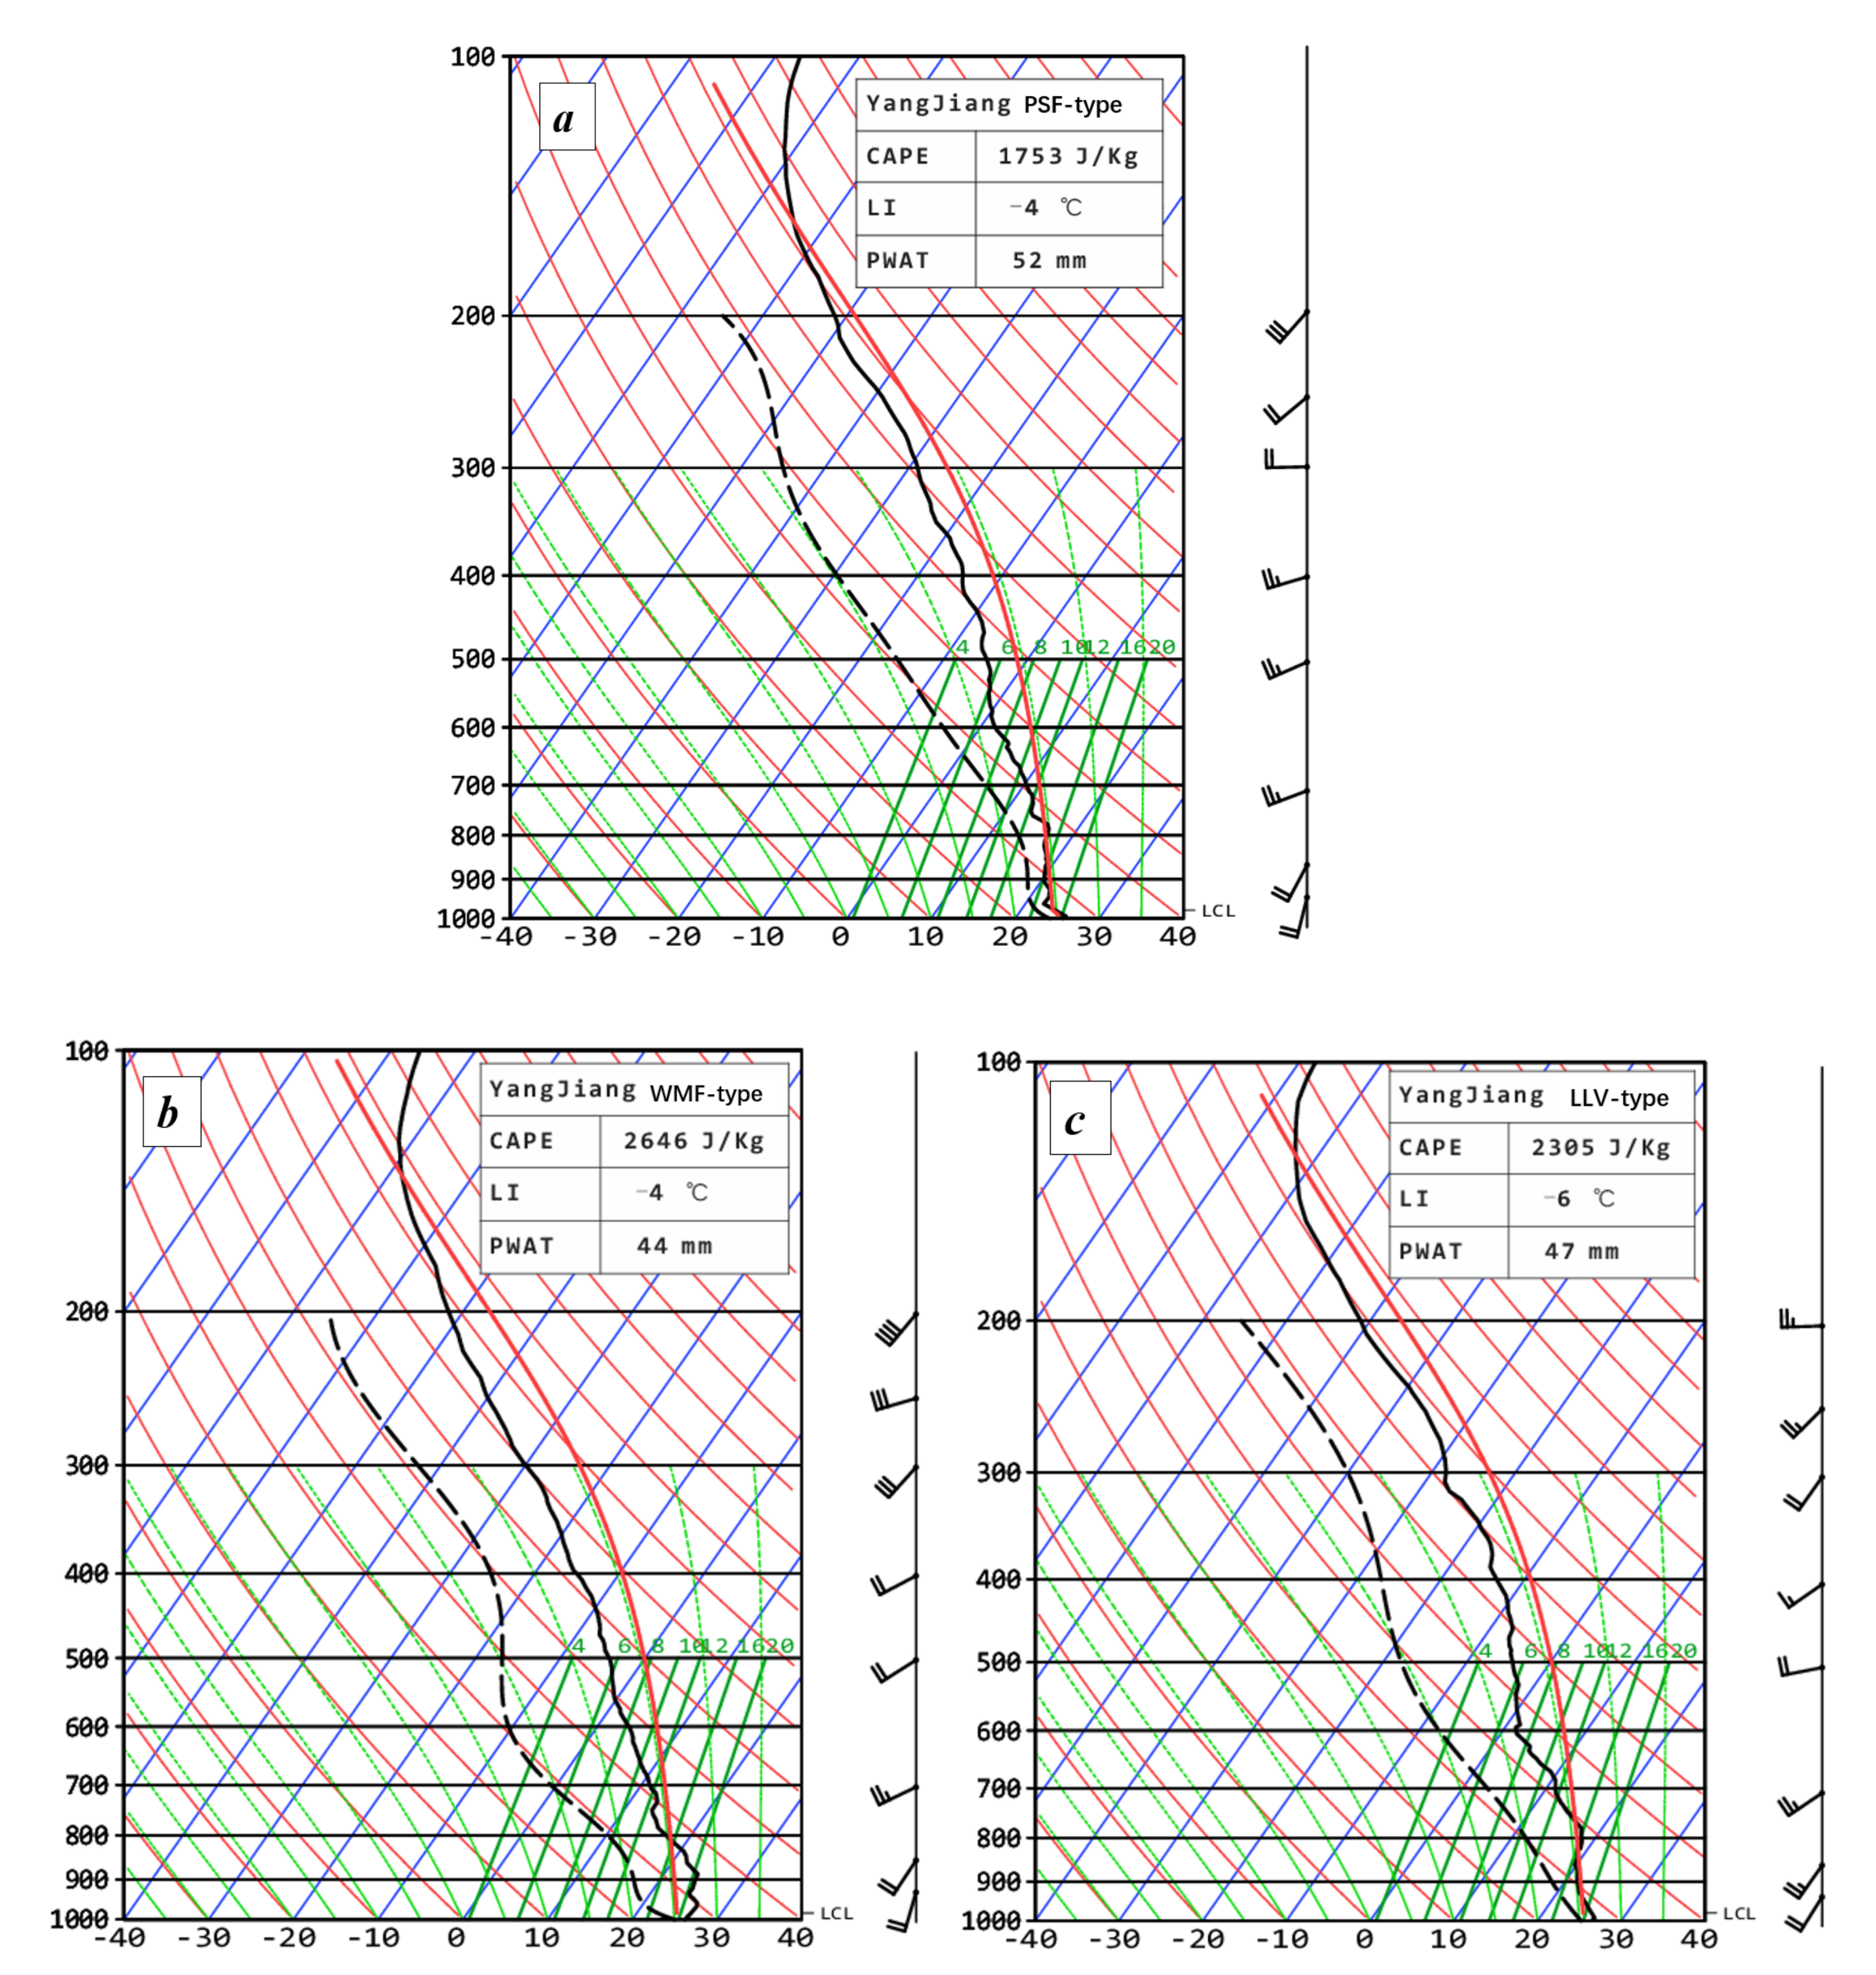
After seeing different statistical characteristics of rainfall and large-scale flows associated with the three types of WSHR events, it is desirable to examine their corresponding pre-storm environmental thermodynamical parameters in terms of stability, PWAT and CAPE [58,59,60]. Accurate characterizing the pre-storm environmental soundings is often limited due partly to lacking observations in pre-storm environments with respect to approaching MCSs, and partly to the coarse spatial and temporal resolutions of conventional observations. Given the general weak-gradient warm sector environments in which the MCSs of interest develop, soundings at the Yangjiang station taken at 0800 BST, ahead of approaching MCSs are synthesized in Figure 10 for each type of WSHR events. We acknowledge that this approach of using single-station soundings may be more biased somewhat for those HR events occurring far from Yangjiang, e.g., the LLV-type WSHR events. However, composite single-station soundings are shown in Figure 10 to reveal some common features in pre-storm environmental parameters as described below.
- The level of free convection (LFC) appears in the lowest 50 hPa, with the lifted index (LI) of less than −4 °C and CAPE ranging between 1753 and 2646 J kg−1. All these indicate the presence of pronounced conditional instability, relatively easy triggering of deep convection in the PBL, and pronounced updrafts in MCSs.
- A deep moist layer is present below 700 hPa with relative humidity (RH) of greater than 85%, and the melting (i.e., 0 °C) level and the tropopause located near 550 and 150 hPa, respectively. They imply the availability of considerable moisture for HR production, and higher precipitation efficiency with more dominant warm cloud microphysics processes.
- A warm, moist airflow of 8–10 m s−1 is evident below 850 hPa, with little vertical wind shear from the PBL top to 400 hPa, and slight cyclonic rotation in wind vectors above. They suggest the presence of sustained supply of high-θe air for continued convective overturning, and the existence of little thermal advection below 400 hPa but weak cold advection above.
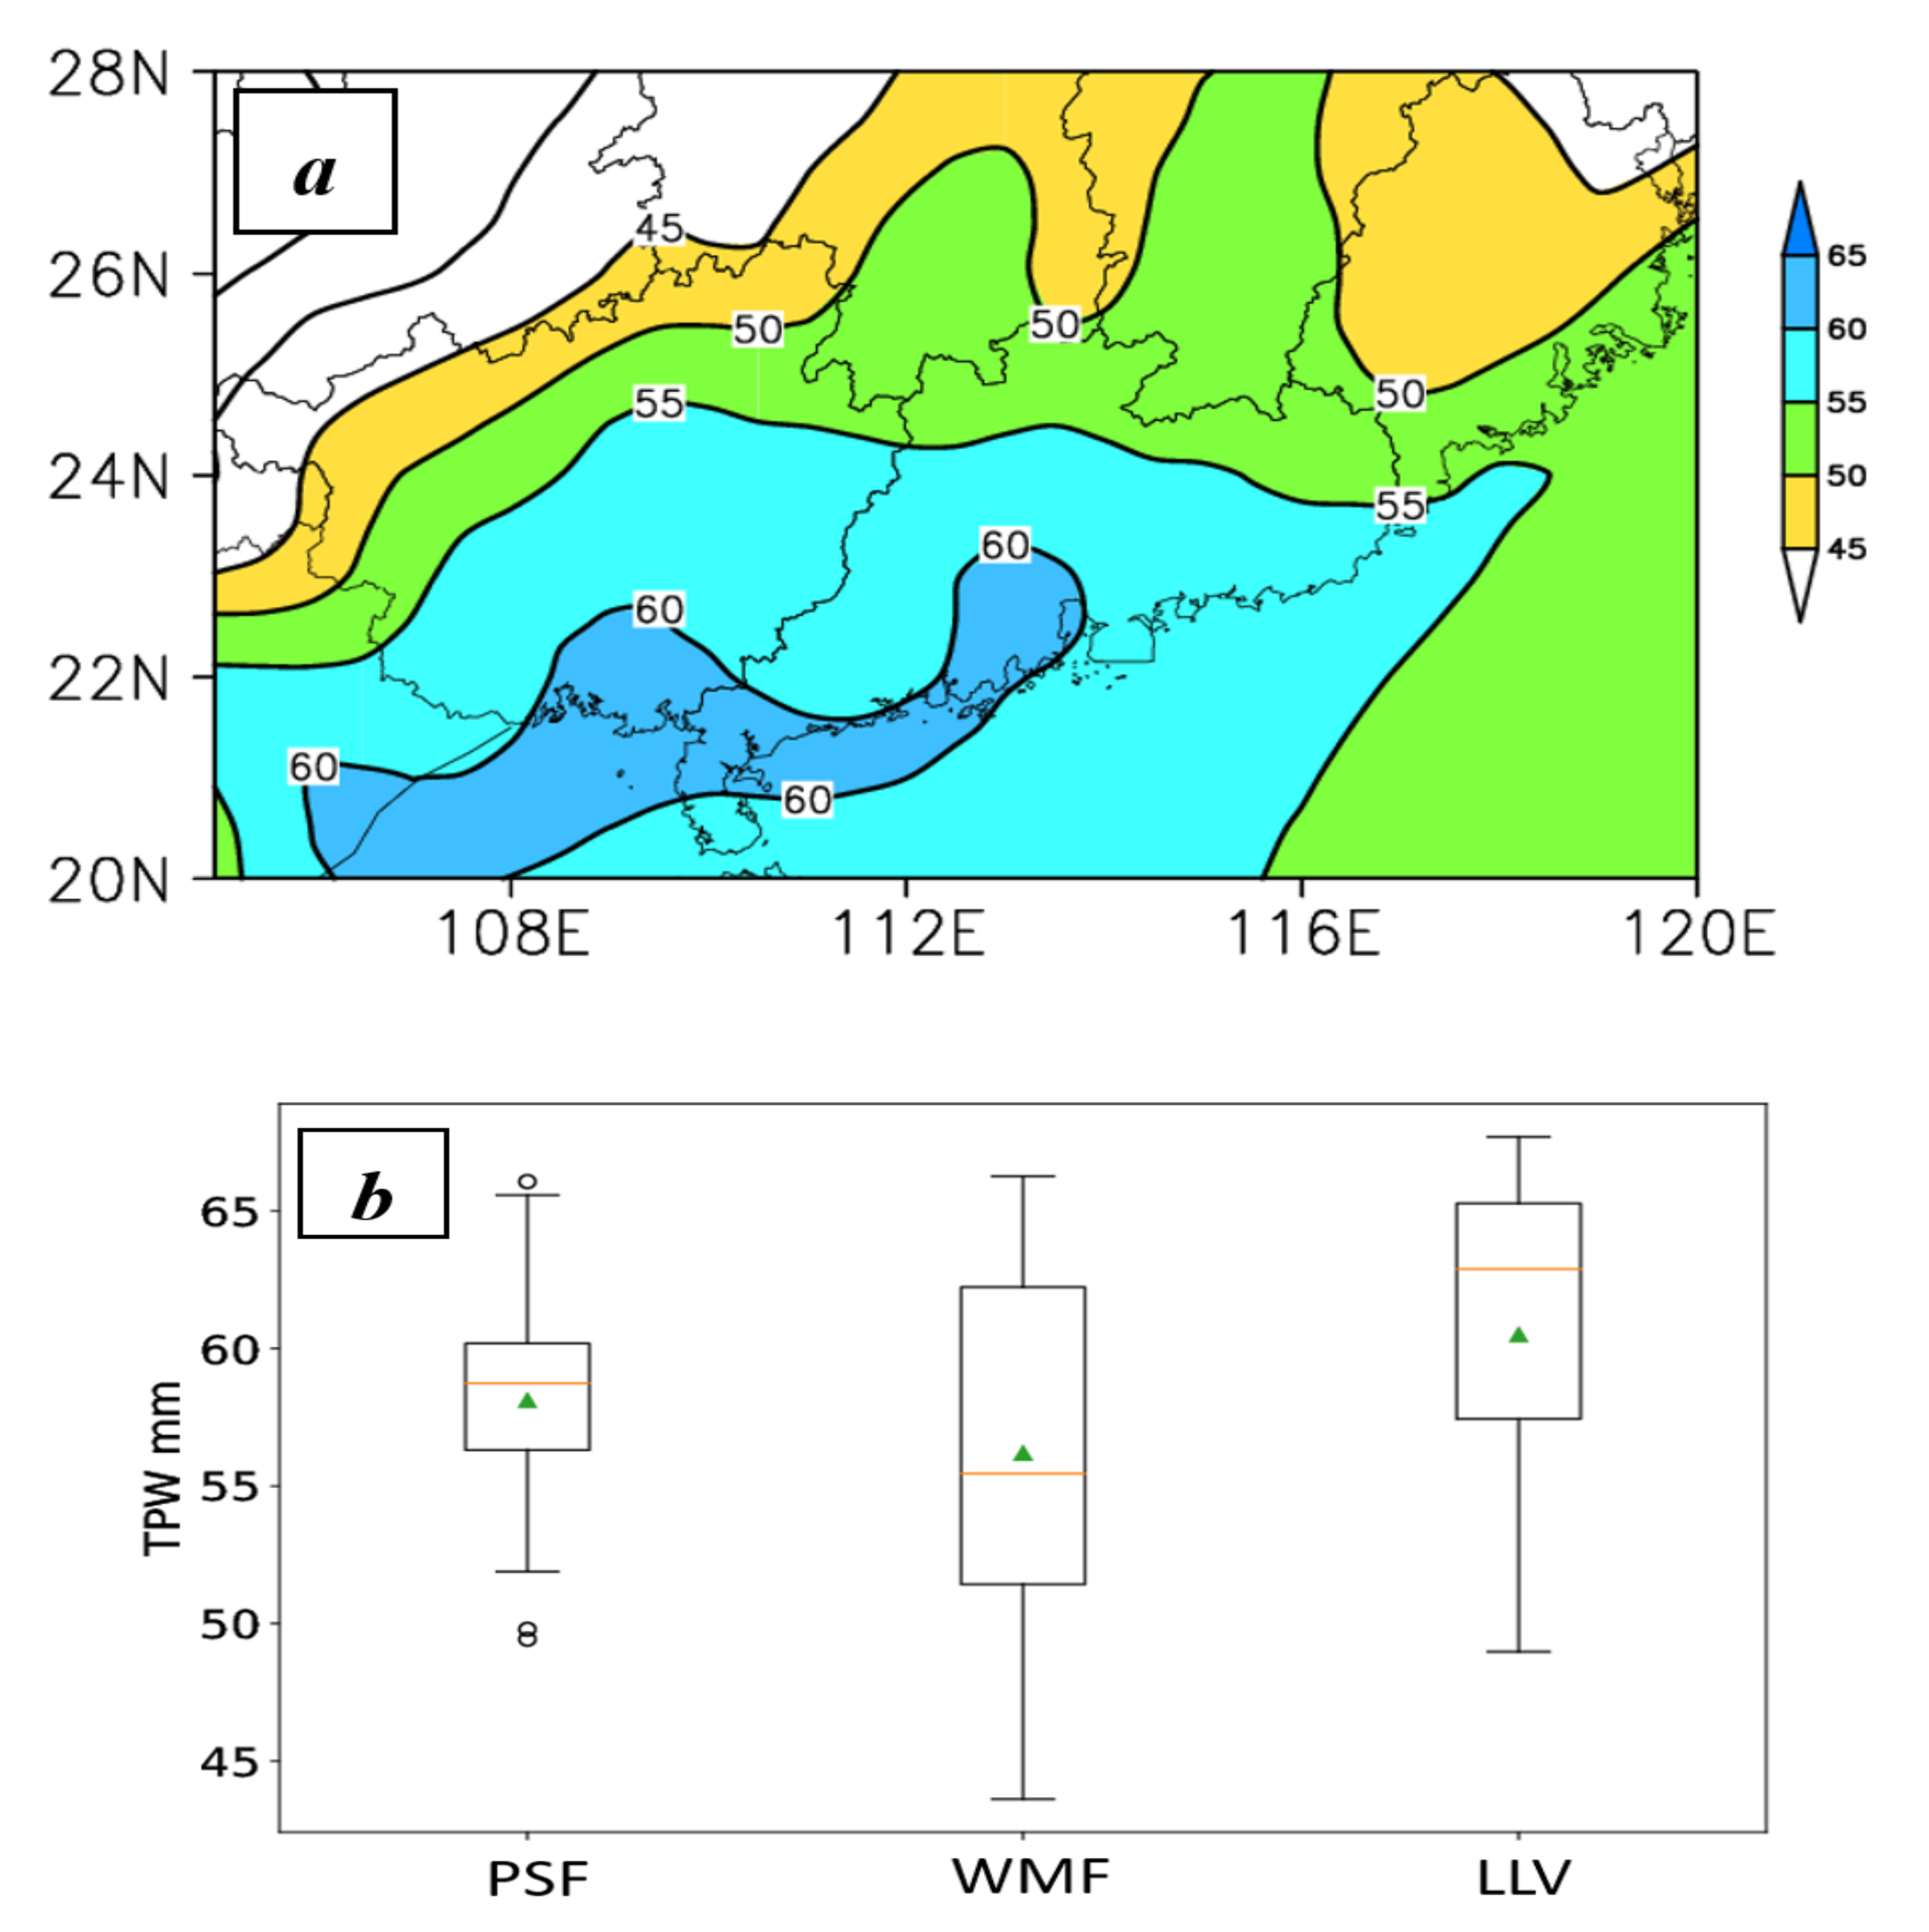
Figure 11 shows that the composite PWAT is generally higher than 50 mm over South China, with the peak value of 60 mm over the coastal regions. This is more or less consistent with the generation of more rainfall with several HR maxima in the regions (cf. Figure 2 and Figure 11). The box and whisker plots of PWAT, obtained in the coastal regions, show that the peak value of more than 65 mm appears in all the three types of WSHR events, with the minimized 45 mm for the WMF-type WSHR events. In general, the percentiles between 25–75% probability distribution in the WMF-type events show relatively wider spreads, with a minimum PWAT value of 44 mm, compared to the other two types. On average, one may take the PWAT of 50–55 mm as the typical value for most WSHR events in South China, which is much higher than 40 mm for the flash flood events occurring in the United States [49].
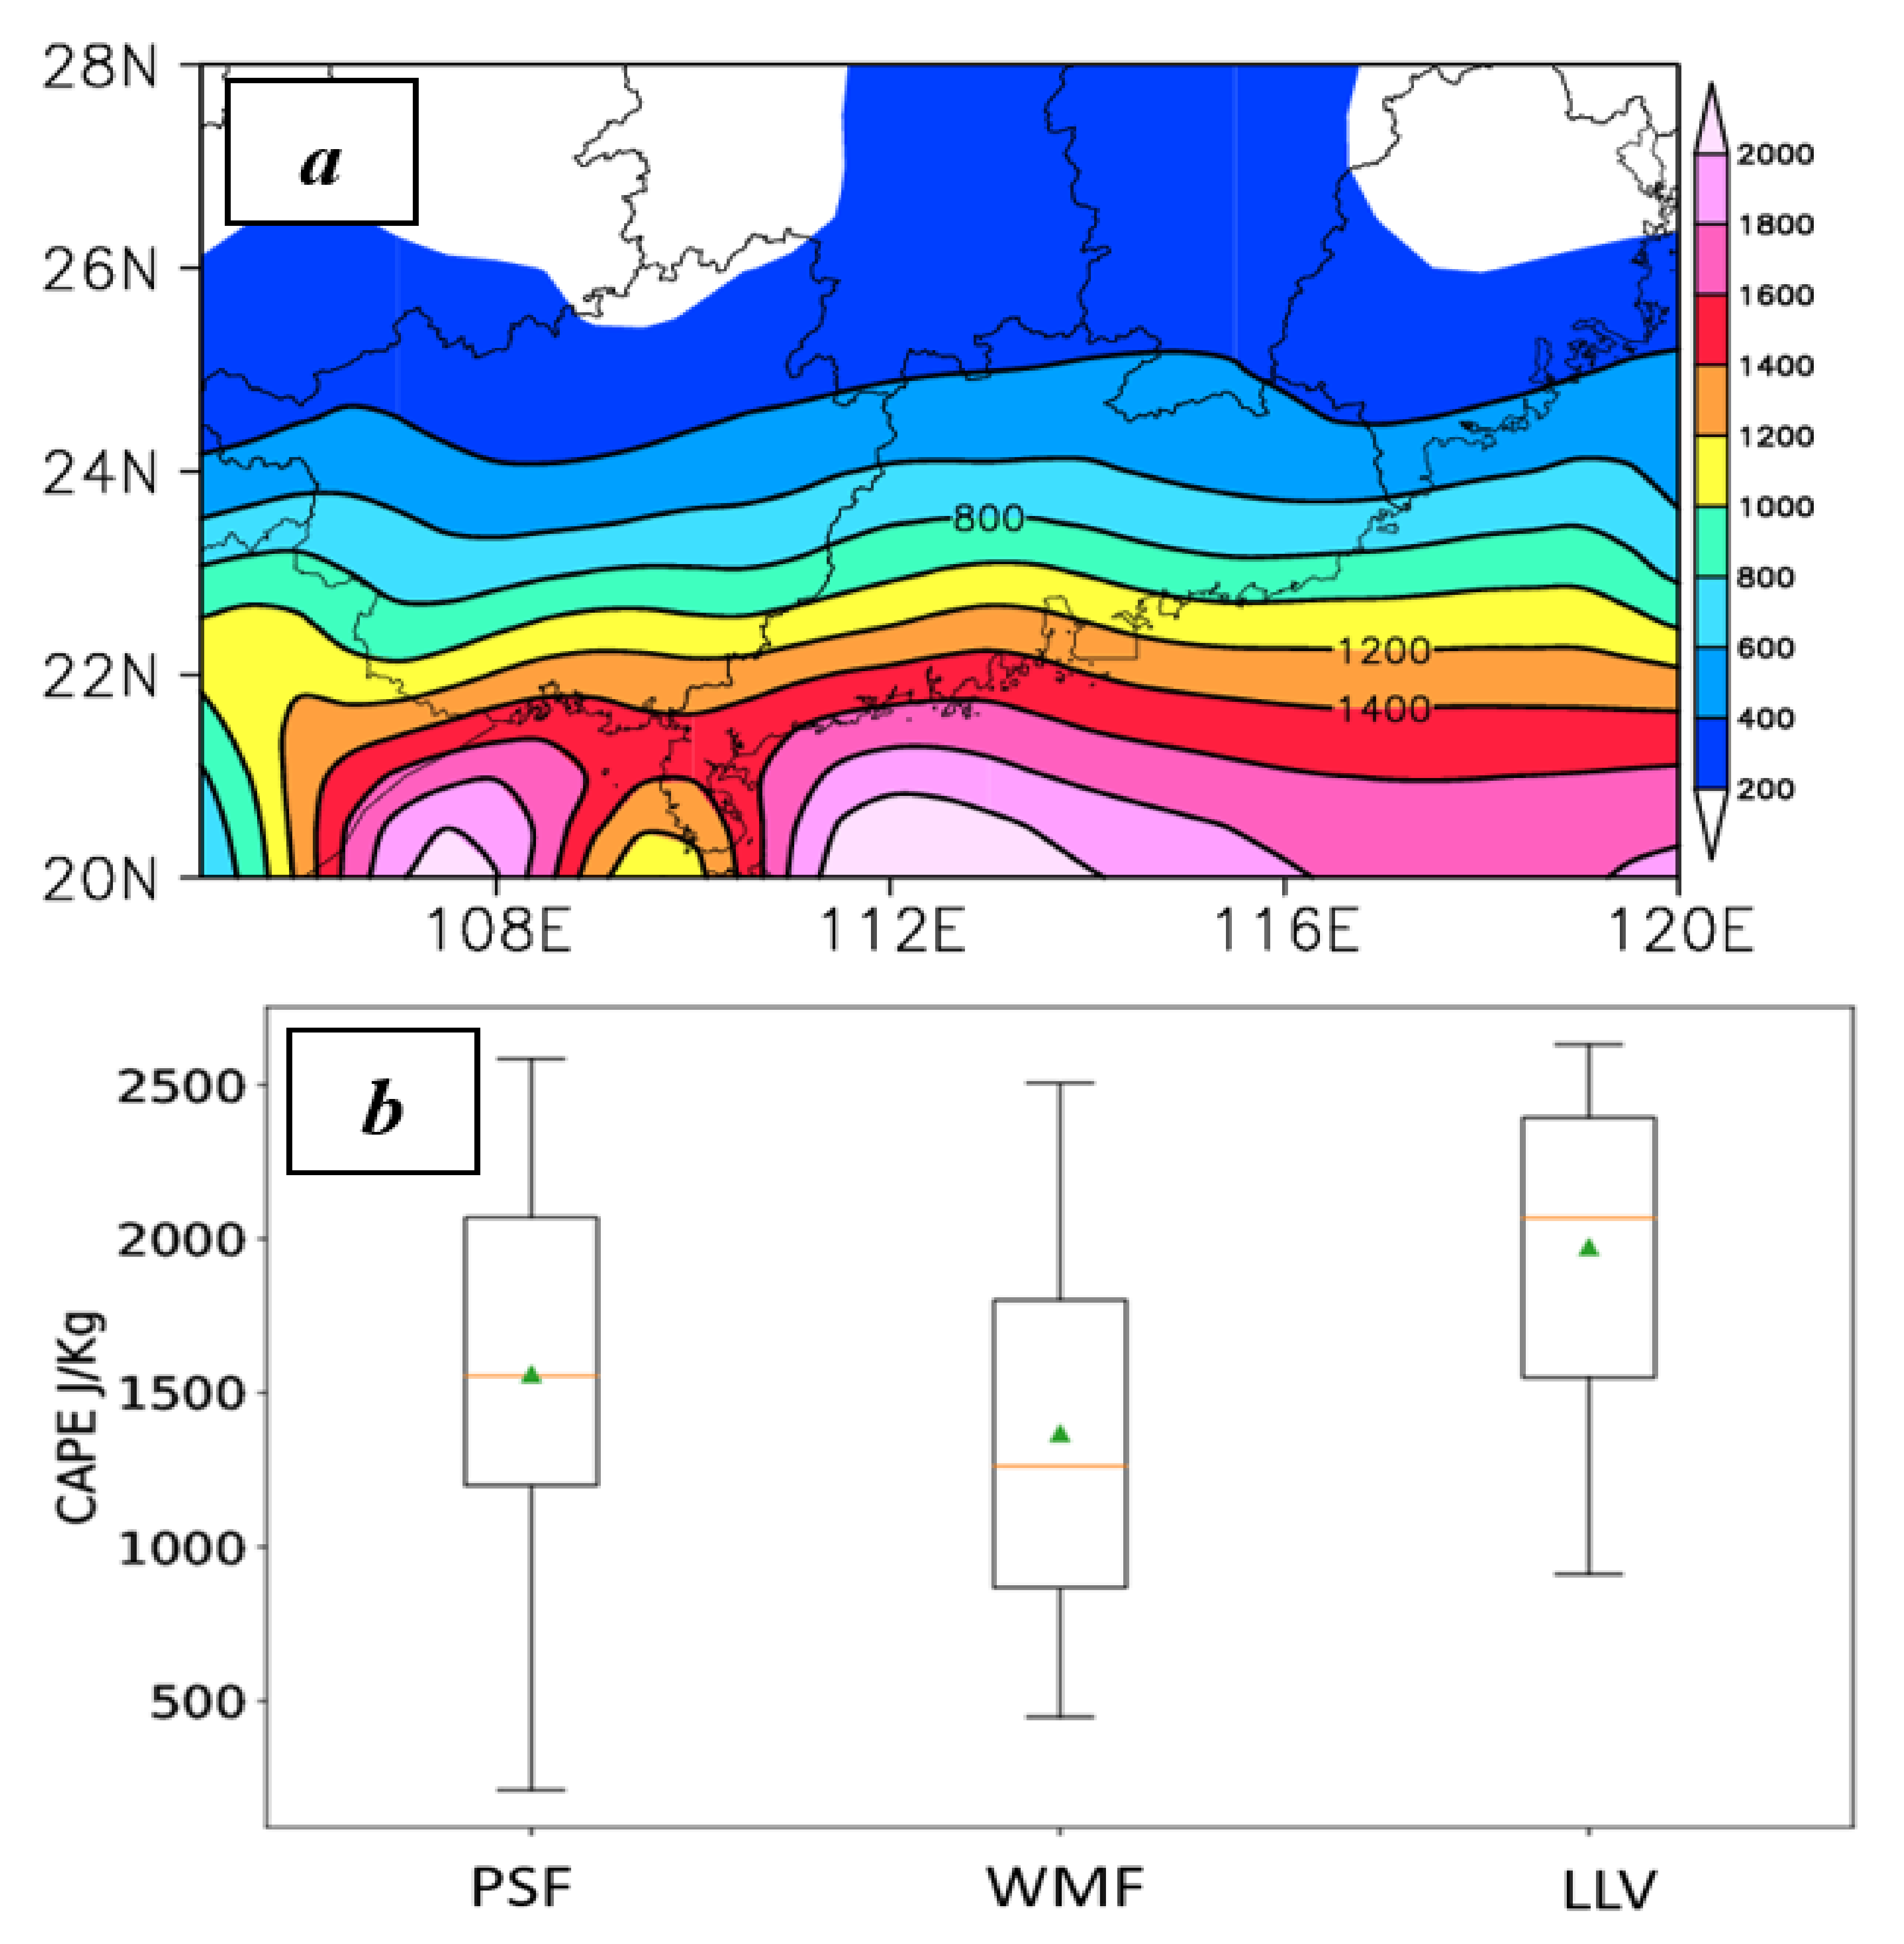
Figure 12a shows the distribution of the composite CAPE at 1400 BST, when the daily major convective outbreaks occur. We see that CAPE decreases northward, which is more or less consistent with the distribution of the low-level moisture field. Nevertheless, the magnitudes of 500–1500 J kg−1 can be seen over South China, indicating the general existence of convective instability during early afternoon hours. The box and whisker plots of CAPE show the presence of CAPE beyond 2500 J kg−1 in all the three types of WSHR events (Figure 12b). The percentiles between 25 and 75% occur mainly in the range of 1000–2000 J kg−1, with the peak CAPE median number for the LLV-type events.
5. Representative Radar Echo Characteristics of WSHR-Producing MCSs
Since all the WSHR events are produced by MCSs, it is of interest to examine if different types of WSHR events classified in Section 3 correspond to different types of MCSs. This can be achieved by analyzing the organizational characteristics of all the MCSs occurring over South China during the pre-summer months in the context of radar echo morphologies. Radar observations have been used to characterize the rainfall structure and intensity of various types of MCSs [25,43,47]. Using radar observations, Schumacher and Johnson [61] documented two types of MCSs that are responsible for HR events in the United States: training line/adjoining stratiform (TL/AS), and back-building/quasi-stationary (BB).
After carefully analyzing all the WSHR events in South China, based on their radar echo morphologies, the following three major types of MCSs are identified: (a) linear-shaped, echo and band training, (b) TL/AS-like organization, and (c) a spirally shaped MCS, i.e., with mesoscale rainbands adjoined with a slowly moving mesovortex or LLV. A total of 145 MCSs are analyzed subjectively from the 58 WSHR events (Table 3). It is found that nearly half of the MCSs can be characterized with echo- and band-training or quasi-stationary linear echoes, and 31.7% of them have the similar form of TL/AS organization with long lifecycles and large spatial extent. The comma-shaped MCSs have temporal and spatial scales that are large and smaller than the linear-shaped echoes and TL/AS MCSs, respectively. Randomly formed afternoon convection, sea-breeze convection and the other less-organized MCSs have also been found to produce some localized HR events, but they are not examined in this study. These different types of WSHR-producing MCSs just reflect the presence of variable and complicated mesoscale convective processes involved in the generation of WSHR events in South China. In the next three subsections, some representative cases for the above three major types of MCSs are presented, respectively.
5.1. Linear-Shaped MCSs
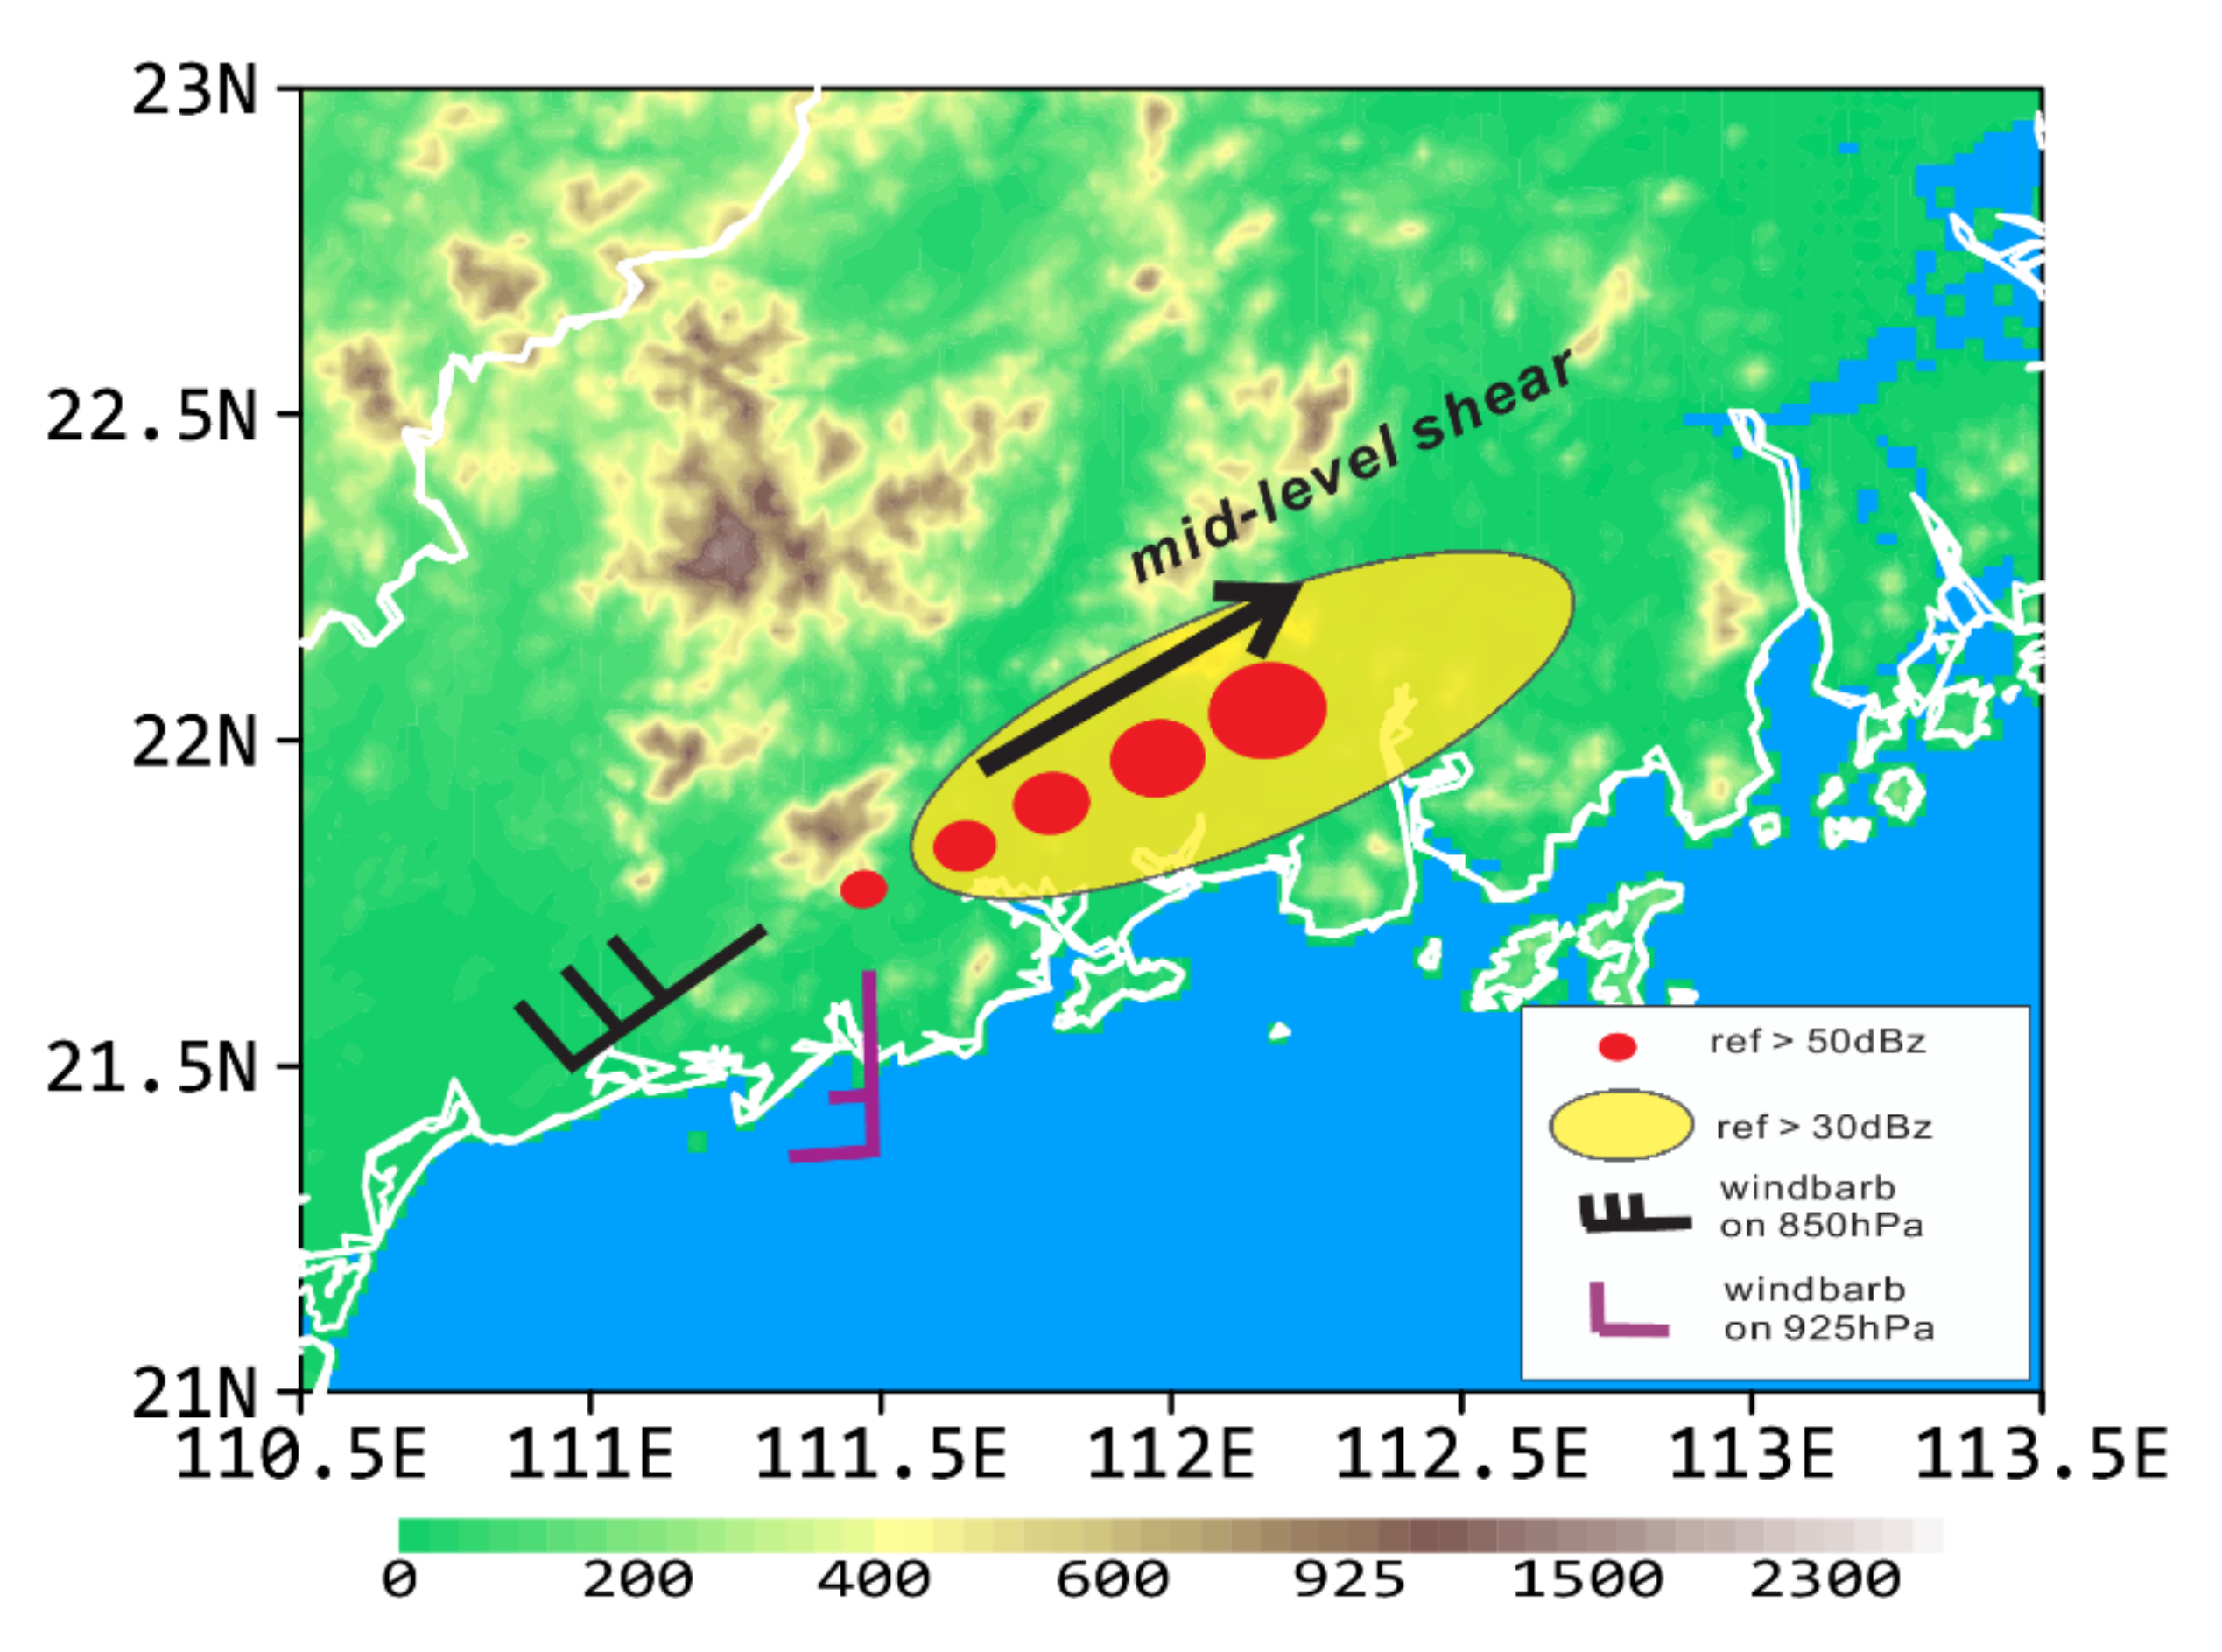
Linearly shaped MCSs are the primary type of MCSs leading to WSHR events in South China. HR is generated when a series of convective cells repeatedly forms upstream of their predecessors (i.e., back building) and then moves along the same linear path, i.e., the echo-training. Samples of such MCSs are shown in composite radar mosaic in Figure 13, showing that convective cells are successively initiated in the coastal region and then they move northeastward along the coastline, leading to a mesoscale rainbelt of about 100~200 km with HR in a few hours. The organizational process of echo training cannot fully be attributed to the back-building effect due to the presence of weak downdrafts in deep moist environments. The best documented echo-training process in South China is related to local topographic features, e.g., near Yangjiang [13], where convective initiation occurs as a result of topographical lifting, and the subsequent growth and downstream propagation of convective cells along the same path account for the HR production near Yangjiang. Figure 14 illustrates a schematic of how such linear-shaped MCSs develop in South China.
A further analysis of the composite radar echoes indicates a higher frequency of linear-shaped MCSs near the stations of Fangcheng, Yangjiang and Shanwei along the southern coast of South China (see Figure 1 for their locations), where isolated topography plays an important role in convective initiation. The latter two stations coincide with the climatological rainfall maxima in WSHR events, as discussed in Section 2. Since these rainfall maxima are all close to the coastline, we may expect the sea breeze induced convergence to contribute to the initiation and subsequent organization of the associated linear MCSs, as mentioned before.
5.2. TL/AS MCSs
The TL/AS type of MCSs, as described by Schumacher and Johnson [61], is the No. 2 contributor of the WSHR events in South China. Figure 15 shows the TL/AS type of MCSs but with the following three different configurations: (i) a southwest-northeast elongated MCS moving northeastward with the sustained leading convective line generating HR along GD’s coastal regions and a near-symmetric stratiform region to the north (Figure 15a); and (ii) an MCS followed by another MCS along the mean flows moving southeastward with successive newborn convective cells building at the end of their leading lines (Figure 15b). The MCS in Figure 15a, and the MCSs in Figure 15b are associated with the PSF- and WMF-type of WSHR events, respectively.
Hodographs in the pre-storm environment, as given in Figure 13 and Figure 15, exhibit clockwise rotation in the lower troposphere (but above the PBL), implying the presence of weak warm advection in the southwesterly monsoonal flows ahead of the midlevel troughs shown in Figure 5a, Figure 7a and Figure 9a. In both types of MCSs, the weak midlevel vertical shear sampled in pre-storm environments is in agreement with the composite wind profiles at Yangjiang station (Figure 10). However, the low-level (weak) warm advection and midlevel vertical shear are more prominent for the TL/AS type of than those of linear-shaped MCSs. The presence of warm advection plus the quasi-geostrophic lifting ahead of the trough, albeit on the order of magnitude of a few cm s−1, and sustained moisture supply in the PBL ensure the preconditioning of convectively favorable environments. Developing into organized MCSs will depend on their interaction, e.g., with local topography, convectively generated cold outflows, and a favorable larger-scale environment such as an LLJ and an ample moisture source.
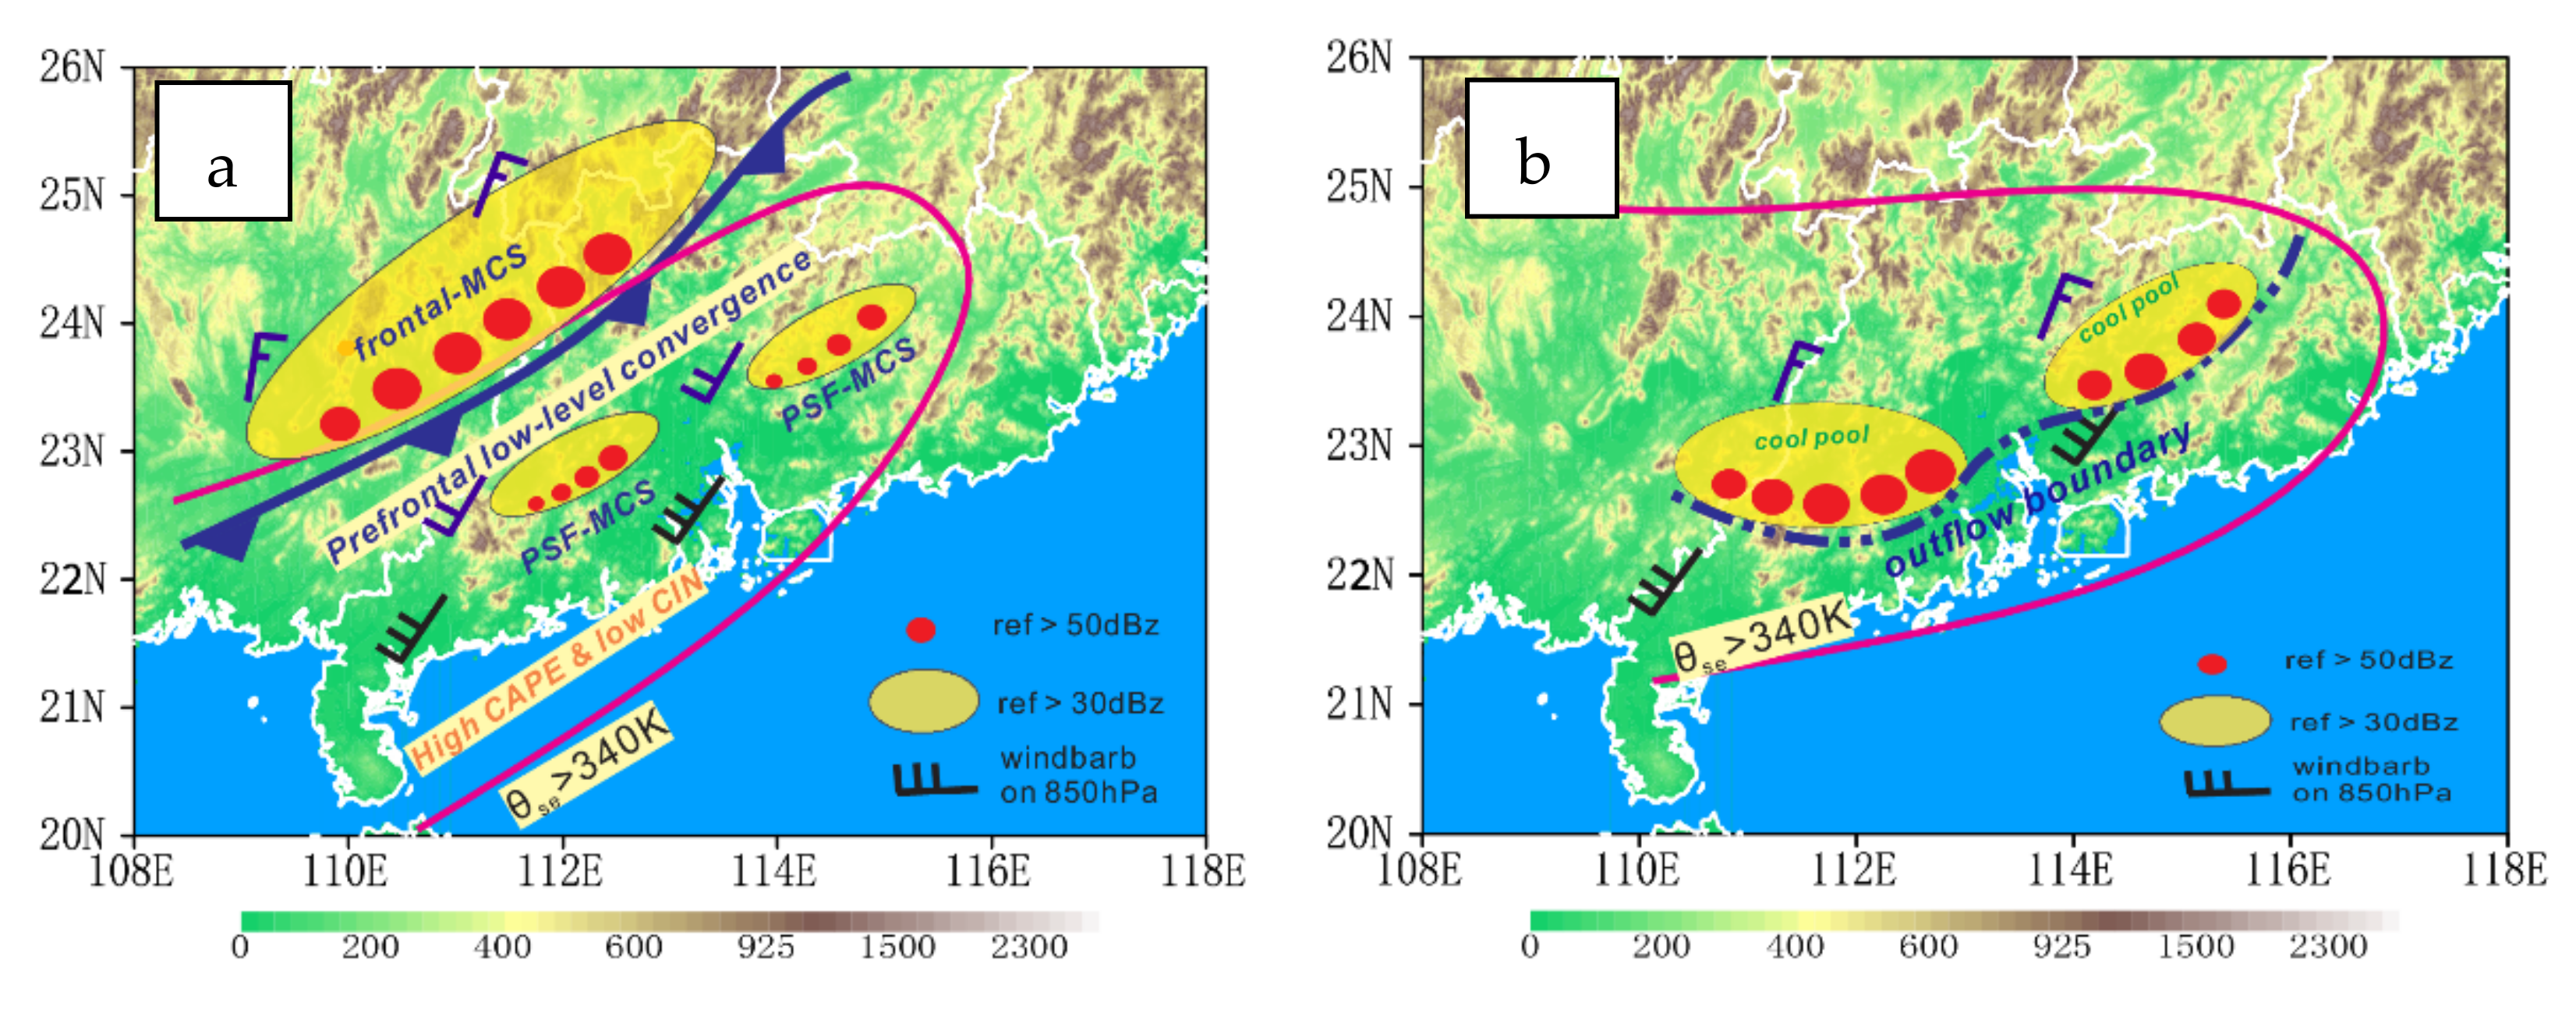
The above features are summarized by a conceptual model for a PSF-type WSHR event in Figure 16. Given the presence of a slow-moving, weak surface front in South China, as shown in Figure 5b, an MCS initiated in the warm sector due to topographic lifting and prefrontal low-level convergence would grow more rapidly than a frontal MCS, leading to a PSF-type WSHR event. The warm sector is often characterized with ample moisture content and conditional instability, and prevailing southwesterly flows with high CAPE, low CIN and θe> 340 K in a deep-moist environment.
5.3. Comma-Shaped MCSs
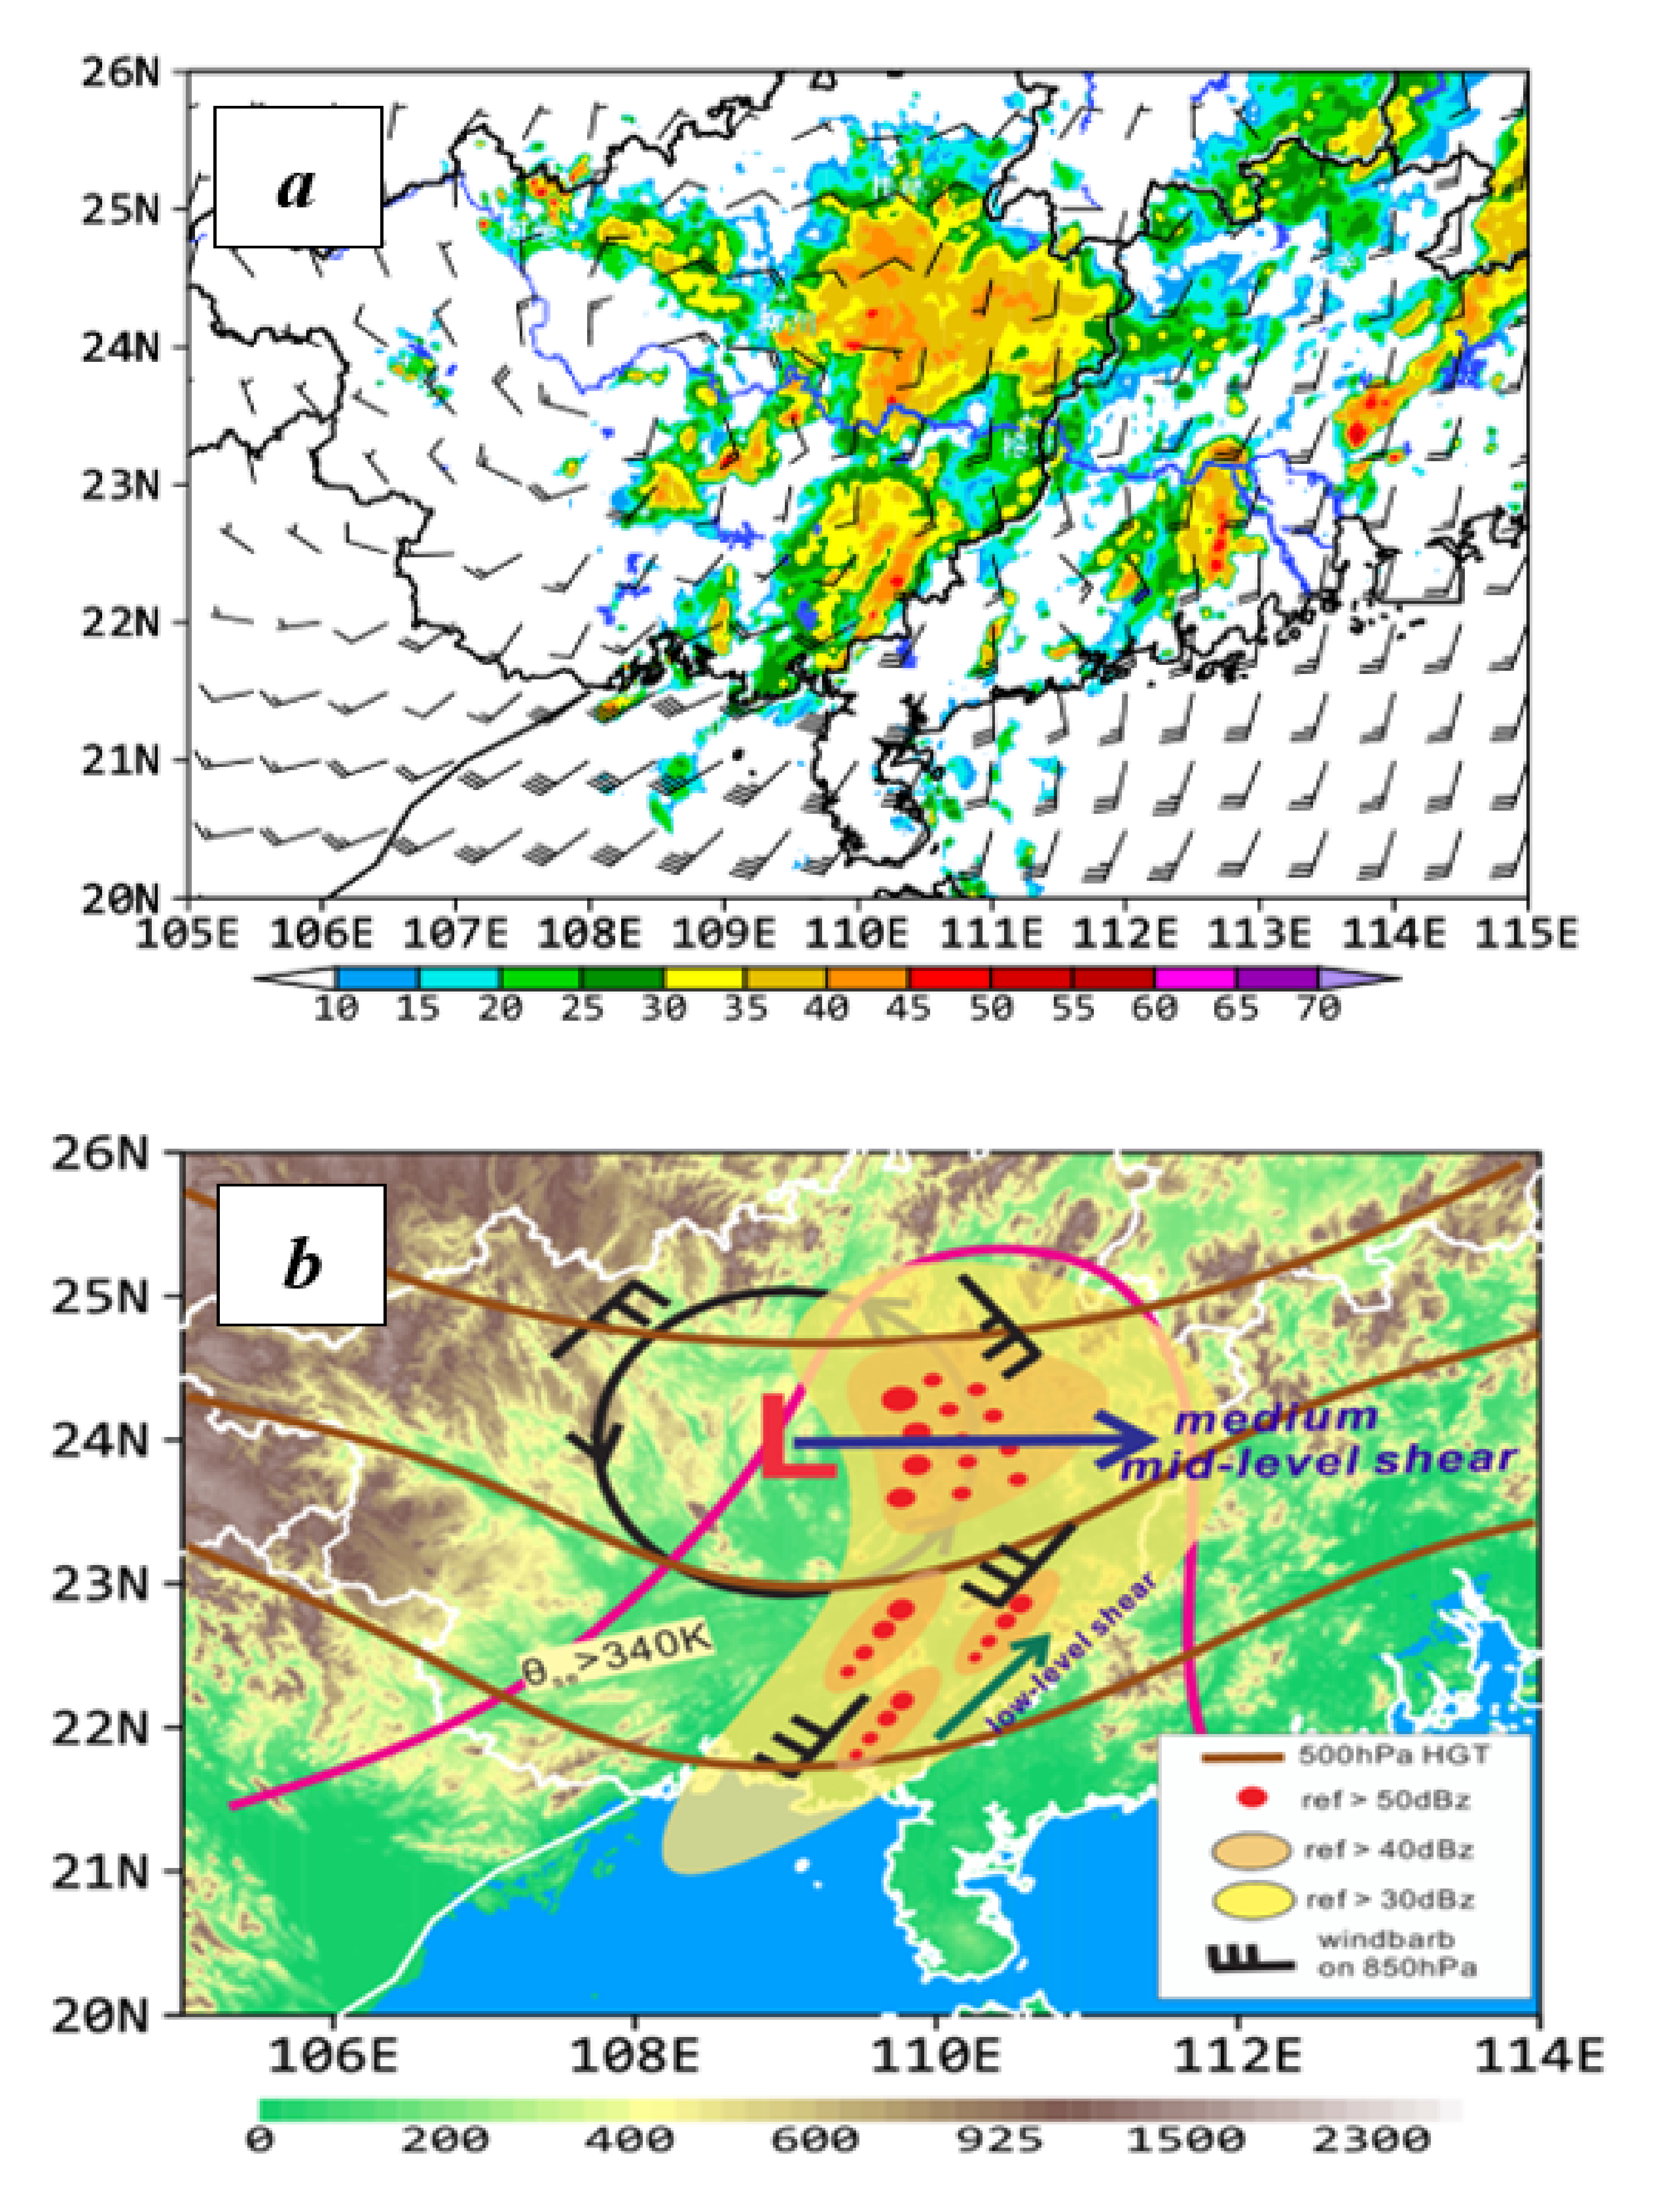
In the LLV-type of WSHR events, HR is usually produced by slow-moving MCSs comprising of a series of convective cells with a large area of trailing stratiform clouds in the eastern semicircle of a low-level vortex. Figure 17a shows such an MCS with radar echoes of more than 30 dBz covering the foreside of a low-level vortex. Given the favorable pre-storm environmental conditions, HR results from the long-lived MCS having several rainbelts due to the inertial stability of the mesovortex, in which the MCS is embedded [35,52,53,54]. Although the hourly rainfall rate is generally weaker than the other two types of MCSs described in the preceding two subsections, the long-lived lifecycle and the slow-moving nature of the low-level vortex are conducive for HR production. Furthermore, the associated multiple rainbands distributed along an LLJ could sustain for hours, leading to large rainfall accumulation. The MCSs of 23 June 2012 is an example in which rainbands are triggered by local topography, and they grow in coverage and rainfall intensity in a convectively unstable environment, and become organized by a low-level mesovortex and an LLJ (Figure 9). A conceptual model, given in Figure 17b, shows the presence of moist southwesterly flows with weak westerly vertical wind shear, and favorable upward motion in the eastern semicircle of a low-level vortex that facilitate the initiation of deep convection in the southeastern quadrant of high-θe flows, and the subsequent upscale growth into an MCS. Sustained rainfall occurs as long as moisture supply continues, leading to the generation of large rainfall totals over South China despite its weak rainfall rates.
6. Summary and Concluding Remarks
In this study, a composite analysis of 58 WSHR events occurring in South China during the pre-summer months of 2008~2014 is performed in the context of precipitation, large-scale circulations, pre-storm environmental conditions, and the morphological characteristics of the associated HR-producing MCSs, using the NCEP reanalysis, conventional surface and upper-air observations as well as radar observations. Some major results are summarized as follows.
- Results show that the large-scale circulations governing the development of the 58 WSHR events can be categorized into the following three types: PSF, WMF, and LLV, with higher-frequency occurrences for the former two types. Although the LLV-type WSHR events occur less frequently, they are often the HR producers influencing much larger areas due to the inertial stability or long life cycle of their associated mesoscale vortical flows.
- A statistical analysis of HR-producing pre-storm environments indicates that PWAT of more than 50 mm, and θe at 850 hPa of higher than 340 K can be used as the necessary conditions to predict the possible development of WSHR events over South China. A composite analysis of pre-storm soundings shows that most WSHR events occur in an environment with a deep moist layer, pronounced CAPE, weak vertical wind shear below 400 hPa, and an LLJ near 925 hPa with weak warm advection in the lower troposphere.
- Radar echo analyses indicate that the three different types of WSHR events correspond well to the following three organizational modes of HR-producing MCSs: linear-shaped, a leading convective line adjoined with trailing stratiform, and comma-shaped with a low-level vortex. Many line-shaped MCSs over the coastal regions appear to be triggered by land-sea contrasts that are enhanced by sea breezes in South China, whereas the latter two classes of MCSs tend to experience isentropic lifting in the southwesterly warm and moist flows. They all develop in large-scale environments with favorable quasi-geostrophic forcing, including (weak) warm advection in the lower troposphere.
In conclusion, we may state that the WSHR events over South China tend to develop in the following three types of large-scale flows with convectively favorable conditions: pre-frontal, ascending southwesterly flows, and low-level vortical flows, and that the corresponding HR-producing MCSs exhibit mainly linearly shaped, comma-shaped, and a leading convective line with a trailing stratiform region. In particular, the classification of several types of WSHR events and the categorization of the corresponding MCSs appear to add some new understanding of flow configurations and storm morphologies associated with those pre-summer WSHR events. It should be mentioned, however, that due to lacking high-resolution observations, it is not possible to examine herein how deep convection under the influences of the above three different types of flow regimes is triggered and then organized into HR-producing MCSs with the above three different morphologies. In this regard, high-resolution numerical simulations should be performed to explore the roles of various processes, such as topography, surface heating and land-surface conditions, and cold outflow boundaries in convective initiation, and verify conceptual models that are developed herein just through limited coarse-resolution observations.
Author Contributions
Writing, T.C.; Supervision, D.-L.Z. All authors have read and agreed to the published version of the manuscript.
Funding
This work was supported by the National (Key) Basic Research and Development Program of China (2017YFC150210 and 2019YFC1510400), and the Development Foundation of the Chinese Academy of Meteorological Sciences (2020KJ022).
Institutional Review Board Statement
This study was approved and guided by the Ethics Committee of the National Meteorological Center, China Meteorological Administration.
Informed Consent Statement
Informed consent was obtained from all subjects involved in the study.
Acknowledgments
This work was completed during the first author’s one-year visitation to the Department of Atmospheric and Oceanic Science, University of Maryland.
Conflicts of Interest
The authors declare no conflict of interest.
Appendix A. A List of the Occurrence Dates (Date/Month/Year) of the 21 PSF-Type of WSHR Events Identified in This Study
12/04/2008 04/05/2008 28/05/2008 29/05/2008 24/04/2009 03/06/2009 09/06/2009 06/05/2010 09/05/2010 28/05/2010 09/06/2010 14/06/2010 15/06/2010 18/04/2012 12/08/2012 29/04/2013 15/05/2013 16/05/2013 19/05/2013 20/05/2013 11/05/2014
Appendix B. As in Appendix A but for the 24 WMF-Type of WSHR Events
05/05/2008 30/05/2008 07/06/2008 08/06/2008 15/04/2009 07/06/2009 08/06/2009 27/06/2009 28/06/2009 08/06/2010 06/05/2011 07/05/2011 08/05/2011 28/06/2011 29/06/2011 03/05/2012 03/04/2013 04/04/2013 28/04/2013 07/05/2013 08/05/2013 07/05/2014 08/05/2014 09/05/2014
Appendix C. As in Appendix A but for the 13 LLV-Type of WSHR Events
11/06/2008 12/06/2008 13/06/2008 27/06/2008 28/06/2008 19/05/2009 31/05/2010 12/05/2012 21/06/2012 19/04/2012 22/06/2012 04/06/2014 05/06/2014
References
- Tao, S. Heavy Rainstorms in China; Science Press: Beijing, China, 1980; p. 225. (In Chinese) [Google Scholar]
- Huang, S. The Presummer Heavy Rainfall over South. China; Guangdong Science and Technology Press: Guangzhou, China, 1986; p. 243. (In Chinese) [Google Scholar]
- Ding, Y.H. Summer monsoon rainfalls in China. J. Meteorol. Soc. Jpn. 1992, 70, 373–396. [Google Scholar] [CrossRef] [Green Version]
- Ding, Y.H. Monsoons over China; Kluwer Academic: Beijing, China, 1994; p. 419. [Google Scholar]
- Nozumi, Y.; Arakawa, H. Prefrontal rain bands located in the warm sector of subtropical cyclones over the ocean. J. Geophys. Res. Space Phys. 1968, 73, 487–492. [Google Scholar] [CrossRef]
- Moore, J.T.; Glass, F.H.; Graves, C.E.; Rochette, S.M.; Singer, M.J. The environment of warm-season elevated thunderstorms associated with heavy rainfall over the central United States. Weather Forecast. 2003, 18, 861–878. [Google Scholar] [CrossRef] [Green Version]
- Xia, R.; Zhao, S.; Sun, J. A study of circumstances of meso-β-scale systems of strong heavy rainfall in warm sector ahead of fronts in South China. Chin. J. Atmos. Sci. 2005, 6, 988–1008. (In Chinese) [Google Scholar]
- Zhong, L.; Mu, R.; Zhang, D.-L.; Zhao, P.; Zhang, Z.; Wang, N. An observational analysis of warm-sector rainfall characteristics associated with the 21 July 2012 Beijing extreme rainfall event. J. Geophys. Res. Atmos. 2015, 120, 3274–3291. [Google Scholar] [CrossRef]
- Ding, Y.H.; Cao, Q.; Zhang, Y.; Gan, Z.; Zhang, X. The South China Sea monsoon experiment (SCSMEX) implementation plan. Adv. Atmos. Sci. 1997, 14, 255–270. [Google Scholar]
- Lau, K.M.; Ding, Y.; Wang, J.T.; Johnson, R.; Keenan, T.; Cifelli, R.; Gerlach, J.; Thiele, O.; Rickenbach, T.; Tsay, S.-C.; et al. A report of the field operations and early results of the South China Sea Monsoon Experiment (SCSMEX). Bull. Amer. Meteorol. Soc. 2000, 81, 1261–1270. [Google Scholar] [CrossRef] [Green Version]
- Zhou, X.; Xue, J.; Tao, Z. Experiment of Heavy Rainfall in South China during Pre-Rainy Season (HUAMEX), 1998; China Meteor. Press: Beijing, China, 2003; p. 220. [Google Scholar]
- Zhang, R.; Ni, Y.; Liu, L.; Luo, Y.; Wang, Y. South China Heavy Rainfall Experiments (SCHeREX). J. Meteorol. Soc. Jpn. 2011, 89, 153–166. [Google Scholar] [CrossRef] [Green Version]
- Luo, Y.; Zhang, R.; Wan, Q.; Wang, B.; Wong, W.K.; Hu, Z.; Jou, B.J.; Lin, Y.; Johnson, R.H.; Chang, C.P.; et al. The Southern China Monsoon Rainfall Experiment (SCMREX). Bull. Amer. Meteorol. Soc. 2017, 98, 999–1013. [Google Scholar] [CrossRef]
- Sun, J.; Zhao, S. A diagnosis and simulation study of a strong heavy rainfall in South China. Chin. J. Atmos. Sci. 2000, 24, 382–391. (In Chinese) [Google Scholar]
- Sun, J.; Zhao, S. A study of mesoscale convective systems and its environmental fields during the June 1994 record heavy rainfall of South China. Part I. A numerical simulation study of meso-convective system inducing heavy rainfall. Chin. J. Atmos. Sci. 2002, 26, 541–557. (In Chinese) [Google Scholar]
- Sun, J.; Zhao, S. A study of mesoscale convective systems and its environmental fields during the June 1994 record heavy rainfall in South China. Part II. Effect of physical processes, initial environmental fields and topography on meso-convective system. Chin. J. Atmos. Sci. 2002, 26, 633–646. (In Chinese) [Google Scholar]
- Maddox, R.A.; Chappell, C.F.; Hoxit, L.R. Synoptic and meso-α scale aspects of flash flood events1. Bull. Amer. Meteorol. Soc. 1979, 60, 115–123. [Google Scholar] [CrossRef] [Green Version]
- Wang, C.-C.; Chen, G.T.-J.; Chen, T.-C.; Tsuboki, K. A numerical study on the effects of Taiwan topography on a convective line during the Mei-Yu season. Mon. Weather Rev. 2005, 133, 3217–3242. [Google Scholar] [CrossRef]
- Xu, W.; Zipser, E.J.; Chen, Y.L.; Liu, C.; Liou, Y.C.; Lee, W.C.; Jong-Dao Jou, B. An orography-associated extreme rainfall event during TiMREX: Initiation, storm evolution, and maintenance. Mon. Weather Rev. 2012, 140, 2555–2574. [Google Scholar] [CrossRef] [Green Version]
- Geerts, B.; Parsons, D.; Ziegler, C.L.; Weckwerth, T.M.; Biggerstaff, M.I.; Clark, R.D.; Coniglio, M.C.; Demoz, B.B.; Ferrare, R.A.; Gallus, W.A., Jr.; et al. The 2015 Plains Elevated Convection at Night (PECAN) field project. Bull. Amer. Meteorol. Soc. 2017, 98, 767–786. [Google Scholar] [CrossRef]
- Zhang, D.-L.; Fritsch, J.M. Numerical simulation of the meso-scale structure and evolution of the 1977 Johnstown flood. Part I: Model description and verification. J. Atmos. Sci. 1986, 43, 1913–1943. [Google Scholar] [CrossRef] [Green Version]
- Chou, L.C.; Chang, C.-P.; Williams, R.T. A numerical simulation of the Mei-Yu front and the associated low-level jet. Mon. Weather Rev. 1990, 118, 1408–1428. [Google Scholar] [CrossRef] [Green Version]
- Chen, S.J.; Kuo, Y.-H.; Wang, W.; Tao, Z.Y.; Cui, B. A modeling case study of heavy rainstorms along the Mei-Yu front. Mon. Weather Rev. 1998, 126, 2330–2351. [Google Scholar] [CrossRef]
- Chen, G.T.J.; Wang, C.C.; Lin, L.F. A diagnostic study of a retreating Mei-Yu front and the accompanying low-level jet formation and intensification. Mon. Weather Rev. 2006, 134, 874–896. [Google Scholar] [CrossRef]
- Luo, Y.; Gong, Y.; Zhang, D.-L. Initiation and organizational modes of an extreme-rain-producing mesoscale convective system along a Mei-Yu front in east China. Mon. Weather Rev. 2014, 142, 203–221. [Google Scholar] [CrossRef] [Green Version]
- Wu, M.; Luo, Y. Mesoscale observational analysis of lifting mechanism of a warm-sector convective system producing the maximal daily precipitation in China mainland during pre-summer rainy season of 2015. J. Meteorol. Res. 2016, 30, 719–736. [Google Scholar] [CrossRef]
- Liu, X.; Luo, Y.; Guan, Z.; Zhang, D.-L. An extreme rainfall event in coastal South China during SCMREX-2014: Formation and roles of Rainband and Echo trainings. J. Geophys. Res. Atmos. 2018, 123, 9256–9278. [Google Scholar] [CrossRef] [Green Version]
- Yu, R.; Zhou, T.; Xiong, A.; Zhu, Y.; Li, J. Diurnal variations of summer precipitation over contiguous China. Geophys. Res. Lett. 2007, 34, L01704. [Google Scholar] [CrossRef] [Green Version]
- Jiang, Z.; Zhang, D.-L.; Xia, R.; Qian, T. Diurnal variations of presummer rainfall over southern China. J. Climatol. 2017, 30, 755–773. [Google Scholar] [CrossRef]
- Huang, S.; Li, Z.; Liang, B.; Bao, C. Mechanism and Prediction of Pre-Rainy Season Heavy Rain Fall in South China; Collected Papers of Pre-Rainy Season Heavy Rainfall in South China; Beijing China Meteorological Press: Beijing, China, 1981; pp. 1–8. (In Chinese) [Google Scholar]
- Wang, C.-C.; Chen, G.T.-J.; Huang, S.-Y. Remote trigger of deep convection by cold outflow over the Taiwan Strait in the Mei-Yu season: A modeling study of the 8 June 2007 case. Mon. Weather Rev. 2011, 139, 2854–2875. [Google Scholar] [CrossRef]
- Yin, J.; Zhang, D.-L.; Luo, Y.; Ma, R. On the extreme rainfall event of 7 May 2017 over the coastal city of Guangzhou. Part I: Impacts of urbanization and orography. Mon. Weather Rev. 2020, 148, 955–979. [Google Scholar] [CrossRef]
- Davis, R.S. Flash Flood Forecast and Detection Methods. In Severe Convective Storms; American Meteorological Society: Boston, MA, USA, 2001; Volume 50, pp. 481–525. [Google Scholar]
- Fritsch, J.M.; Kane, R.J.; Chelius, C.R. The contribution of mesoscale convective weather systems to the warm-season precipitation in the United States. J. Appl. Meteor. Climatol. 1986, 25, 1333–1345. [Google Scholar] [CrossRef] [Green Version]
- Fritsch, J.M.; Murphy, J.D.; Kain, J.S. Warm core vortex amplification over land. J. Atmos. Sci. 1994, 51, 1780–1807. [Google Scholar] [CrossRef]
- Maddox, R.A. Mesoscale convective complexes. Bull. Amer. Meteorol. Soc. 1980, 61, 1374–1387. [Google Scholar] [CrossRef]
- Chen, G.T.J. Observational aspects of the Mei-Yu phenomena in subtropical China. J. Meteorol. Soc. Jpn. 1983, 61, 306–312. [Google Scholar] [CrossRef] [Green Version]
- Tao, S.; Chen, L. A review of recent research on the East Asian summer monsoon in China. In Monsoon Meteorology; Chang, C.P., Krishnamurti, T.N., Eds.; Oxford University Press: London, UK, 1987; pp. 60–92. [Google Scholar]
- Yao, X.; Ma, J.; Zhang, D.-L.; Yan, L. A 33-yr Meiyu-season climatology of shear lines over the Yangtze-Huai River Basin in Eastern China. J. Appl. Meteorol. Climatol. 2020, 59, 1125–1137. [Google Scholar] [CrossRef] [Green Version]
- Chen, G.T.J.; Yu, C.C. Study of low-level jet and extremely heavy rainfall over northern Taiwan in the Mei-Yu season. Mon. Weather Rev. 1988, 116, 884–891. [Google Scholar] [CrossRef] [Green Version]
- Wang, C.-C.; Hsu, J.C.-S.; Chen, G.T.-J.; Lee, D.-I. A study of two propagating heavy-rainfall episodes near Taiwan during SoWMEX/TiMREX IOP-8 in June 2008. Part I: Synoptic evolution, episode propagation, and model control simulation. Mon. Weather Rev. 2014, 142, 2619–2643. [Google Scholar] [CrossRef]
- Lin, P.F.; Chang, P.L.; Jou, B.J.; Wilson, J.W.; Roberts, R.D. Warm season afternoon thunderstorm characteristics under weak synoptic-scale forcing over Taiwan Island. Weather Forecast. 2011, 26, 44–60. [Google Scholar] [CrossRef] [Green Version]
- Bluestein, H.B.; Jain, M.H. Formation of mesoscale lines of precipitation: Severe squall lines in Oklahoma during the spring. J. Atmos. Sci. 1985, 42, 1711–1732. [Google Scholar] [CrossRef]
- Parker, M.D.; Johnson, R.H. Organizational modes of midlatitude mesoscale convective systems. Mon. Weather Rev. 2000, 128, 3413–3436. [Google Scholar] [CrossRef]
- Doswell, C.A., III; Brooks, H.E.; Maddox, R.A. Flash-flood forecasting: An ingredients-based methodology. Weather Forecast. 1996, 11, 360–381. [Google Scholar] [CrossRef]
- Schumacher, R.S.; Johnson, R.H. Organization and environmental properties of extreme-rain-producing mesoscale convective systems. Mon. Weather Rev. 2005, 133, 961–976. [Google Scholar] [CrossRef]
- Luo, Y.; Qian, W.; Zhang, R.; Zhang, D.-L. Gridded hourly precipitation analysis from high-density rain-gauge network over the Yangtze-Huai Rivers Basin during the 2007 Meiyu season and comparison with CMORPH. J. Hydrometeor. 2013, 14, 1243–1258. [Google Scholar] [CrossRef] [Green Version]
- Liu, R.; Sun, J.; Wei, J.; Fu, S. Classification of persistent heavy rainfall events over South China and associated moisture source analysis. J. Meteorol. Res. 2016, 30, 678–693. [Google Scholar] [CrossRef]
- Maddox, R.A.; Canova, F.; Hoxit, L.R. Meteorological characteristics of flash flood events over the western United States. Mon. Weather Rev. 1980, 108, 1866–1877. [Google Scholar] [CrossRef]
- Raymond, D.J.; Jiang, H. A theory for long-lived mesoscale convective systems. J. Atmos. Sci. 1990, 47, 3067–3077. [Google Scholar] [CrossRef] [Green Version]
- Zhang, M.; Zhang, D.-L. Sub-kilometer simulation of a torrential-rain-producing mesoscale convective system in East China. Part I: Model verification and convective organization. Mon. Weather Rev. 2012, 140, 184–201. [Google Scholar] [CrossRef] [Green Version]
- Shu, Y.; Sun, J.; Pan, Y. Characteristics of mesoscale vortices over China in 2015. J. Meteorol. Res. 2017, 31, 1149–1160. [Google Scholar] [CrossRef]
- Chen, T.; Zhang, F.H.; Duan, Y.H. A study of relationship between a southwest vortex and the mesoscale convective systems during the severe “6.12” rainstorm event in Guangxi province. Acta Meteorol. Sin. 2011, 69, 472–485. (In Chinese) [Google Scholar]
- Zhang, D.-L.; Fritsch, J.M. Numerical simulation of the meso-β scale structure and evolution of the 1977 Johnstown flood. Part II: Inertially stable warm-core vortex and the mesoscale convective complex. J. Atmos. Sci. 1987, 44, 2593–2612. [Google Scholar] [CrossRef] [Green Version]
- Kuo, Y.-H.; Cheng, L.; Bao, J.-W. Numerical simulation of the 1981 Sichuan flood. Part I: Evolution of a mesoscale southwest vortex. Mon. Weather Rev. 1988, 116, 2481–2504. [Google Scholar] [CrossRef] [Green Version]
- Li, J.; Du, J.; Zhang, D.-L.; Cui, C.; Liao, Y. Ensemble-based analysis and sensitivity of mesoscale forecasts of a vortex over southwest China. Q. J. R. Meteorol. Soc. 2014, 140, 766–782. [Google Scholar] [CrossRef]
- Zhang, D.-L.; Fritsch, J.M. A numerical investigation of a convectively generated, inertially stable, extratropical warm-core mesovortex over land. Part I: Structure and evolution. Mon. Weather Rev. 1988, 116, 2660–2687. [Google Scholar] [CrossRef] [Green Version]
- Tian, F.; Zheng, Y.; Zhang, T.; Zhang, X.; Mao, D.; Sun, J.; Zhao, S. Statistical characteristics of environmental parameters for warm season short-duration heavy rainfall over central and eastern China. J. Meteorol. Res. 2015, 29, 370–384. [Google Scholar] [CrossRef]
- Xia, R.; Zhang, D.-L.; Zhang, C.; Wang, Y. Synoptic control of convective rainfall rates and cloud-to-ground lightning frequencies in warm-season mesoscale convective systems over North China. Mon. Weather Rev. 2018, 146, 813–831. [Google Scholar] [CrossRef]
- Wang, H.; Luo, Y.; Jou, B.J.D. Initiation, maintenance, and properties of convection in an extreme rainfall event during SCMREX: Observational analysis. J. Geophys. Res. Atmos. 2014, 119, 13206–13232. [Google Scholar] [CrossRef]
- Schumacher, R.S.; Johnson, R.H. Characteristics of U.S. extreme rain events during 1999–2003. Weather Forecast. 2006, 21, 69–85. [Google Scholar] [CrossRef] [Green Version]
Figure 1.
Distribution of topography (shaded, m) and some related national surface stations (red dots with identifications) over South China. The inner red frame denotes the region of interest (20–27° N, 105–120° E) for the present study. The top nine annual precipitation stations (with their identifiers) averaged during 1981–2010 are given with their corresponding amounts listed in the bottom right box. Letters, “GX”, “GD”, and “FJ” denote the province of Guangxi, Guangdong and Fujian, respectively, similarly for the rest of figures.

Figure 2.
Horizontal distribution of the mean daily precipitation amount composite (shaded, mm) from the 58 WSHR events over South China during the pre-summer months of 2008–2014. Symbols, “C1”–“C10”, denote the top 10 daily rainfall maxima, which are also listed in Table 2.
Figure 2.
Horizontal distribution of the mean daily precipitation amount composite (shaded, mm) from the 58 WSHR events over South China during the pre-summer months of 2008–2014. Symbols, “C1”–“C10”, denote the top 10 daily rainfall maxima, which are also listed in Table 2.

Figure 3.
Monthly number distribution of the three major types (i.e., PSF, WMF, and LLV) of the 58 WSHR events over South China during the pre-summer months of 2008–2014.
Figure 3.
Monthly number distribution of the three major types (i.e., PSF, WMF, and LLV) of the 58 WSHR events over South China during the pre-summer months of 2008–2014.

Figure 4.
The percentage (%, shadings) of the 21 PSF-type WSHR events with respect to the total WSHR amount during the pre-summer months of 2008–2014.
Figure 4.
The percentage (%, shadings) of the 21 PSF-type WSHR events with respect to the total WSHR amount during the pre-summer months of 2008–2014.

Figure 5.
Composite analysis of the 21 PSF-type WSHR events from the NCEP’s 0800 BST GFS data: (a) Geostrophic height (contoured at 20-m intervals) at 500 hPa, horizontal wind barbs (a full barb is 4 m s−1) and equivalent potential temperature (shaded, θe, K ) at 850 hPa; and (b) South-north vertical cross section of potential temperature (contoured at 4-K intervals) and θe (shaded), superimposed with in-plane flow vectors, along 112° E (near Yangjiang with the top HR amount) during the pre-summer months of 2008–2014. Dashed lines and the green thick line in (a) denote a shearline and roughly a trough axis, respectively. Grey shadings in (b) denote topography.

Figure 6.
As in Figure 4, except for the 24 WMF-type WSHR events.
Figure 6.
As in Figure 4, except for the 24 WMF-type WSHR events.

Figure 7.
(a,b) As in Figure 5a,b, respectively, except for the 24 WMF-type WSHR events.
Figure 7.
(a,b) As in Figure 5a,b, respectively, except for the 24 WMF-type WSHR events.

Figure 8.
As in Figure 4, except for the 13 LLV-type WSHR events.
Figure 8.
As in Figure 4, except for the 13 LLV-type WSHR events.

Figure 9.
As in Figure 5a,b,respectively, except for the 13 LLV-type WSHR events, with (b) along 108 °E through roughly the LLV core region indicated in (a) and the HR region indicated in Figure 8.

Figure 10.
Composite Skew-T/Log P diagrams for the (a) PSF-, (b) WMF-, and (c) LLV-type WSHR events, which are taken at the Yangjiang station at 0800 BST that are far ahead of the approaching MCSs in both the location and timing. A full barb is 4 m s−1.
Figure 10.
Composite Skew-T/Log P diagrams for the (a) PSF-, (b) WMF-, and (c) LLV-type WSHR events, which are taken at the Yangjiang station at 0800 BST that are far ahead of the approaching MCSs in both the location and timing. A full barb is 4 m s−1.

Figure 11.
(a) Distribution of the daily (at 0800 BST) mean PWAT (mm) that is averaged for the 58 WSHR events under study; and (b) the box-whisker plots of the PWAT distribution, taken at the Yangjiang Station, for each type of WSHR events.
Figure 11.
(a) Distribution of the daily (at 0800 BST) mean PWAT (mm) that is averaged for the 58 WSHR events under study; and (b) the box-whisker plots of the PWAT distribution, taken at the Yangjiang Station, for each type of WSHR events.

Figure 12.
(a) As in Figure 11a,b, respectively, except for the mean CAPE in (b) from the 1400 BST soundings.
Figure 12.
(a) As in Figure 11a,b, respectively, except for the mean CAPE in (b) from the 1400 BST soundings.

Figure 13.
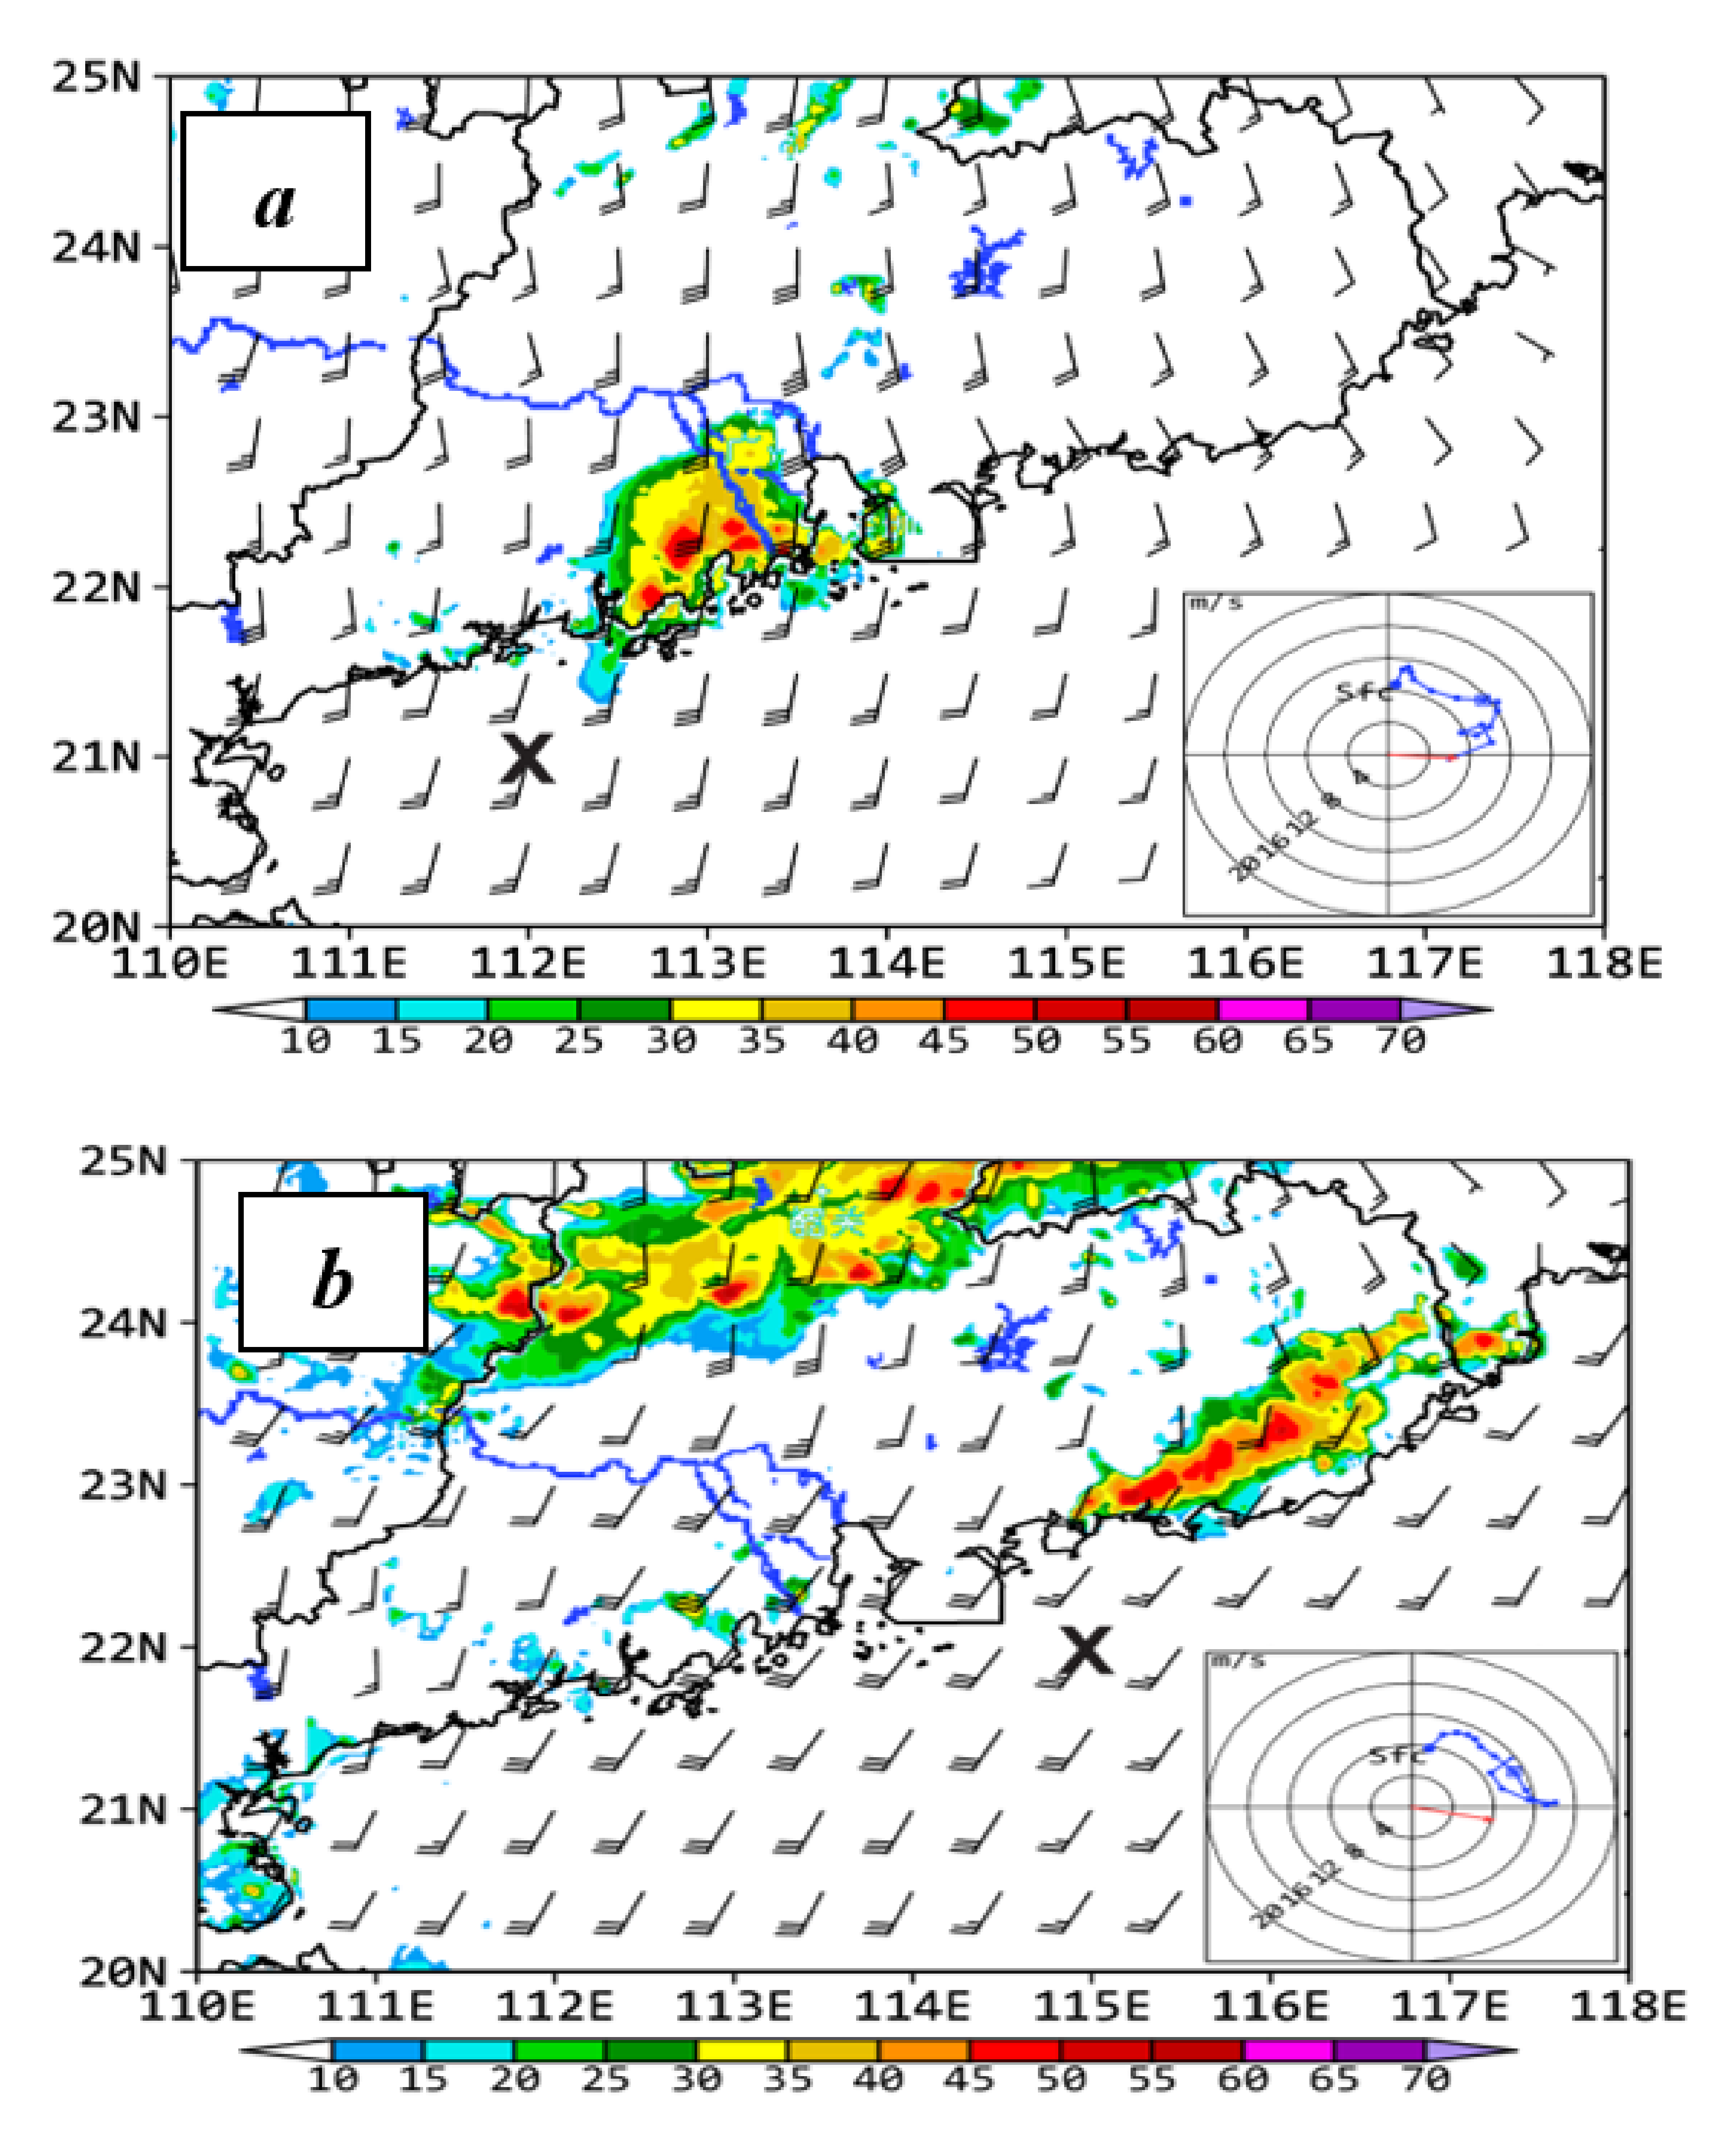
The NCEP GFS analysis of horizontal winds (a full barb is 4 m s−1) at 925 hPa and the composite radar reflectivity (RR, shadings) mosaic at z = 1 km for the linear-shaped MCSs with hodographs taken at ‘×’, and a bold arrow showing the moving direction of convective cells: (a) horizontal winds at 0800 BST, and RR at 0600 BST 26 May 2013; (b) horizontal winds at 2000 BST, and RR at 2340 BST 26 May 2013.
Figure 13.
The NCEP GFS analysis of horizontal winds (a full barb is 4 m s−1) at 925 hPa and the composite radar reflectivity (RR, shadings) mosaic at z = 1 km for the linear-shaped MCSs with hodographs taken at ‘×’, and a bold arrow showing the moving direction of convective cells: (a) horizontal winds at 0800 BST, and RR at 0600 BST 26 May 2013; (b) horizontal winds at 2000 BST, and RR at 2340 BST 26 May 2013.

Figure 14.
A conceptual model for the linear-shaped MCSs with background topography of South China.

Figure 15.
As in Figure 13, but the TL/AS type of MCSs: (a) horizontal winds (HW) at 925 hPa at 0800 BST and the composite radar reflectivity (RR) at z =1 km at 0450 BST 22 May 2013; (b) horizontal winds at 925 hPa at 0800 BST and RR at z = 1 km at 0900 BST 16 May 2013.
Figure 15.
As in Figure 13, but the TL/AS type of MCSs: (a) horizontal winds (HW) at 925 hPa at 0800 BST and the composite radar reflectivity (RR) at z =1 km at 0450 BST 22 May 2013; (b) horizontal winds at 925 hPa at 0800 BST and RR at z = 1 km at 0900 BST 16 May 2013.

Figure 16.
A conceptual model for a typical PSF-type WSHR event with the development of TL/AS MCSs, (a) T = T0, (b) T = T0 + 6 h.
Figure 16.
A conceptual model for a typical PSF-type WSHR event with the development of TL/AS MCSs, (a) T = T0, (b) T = T0 + 6 h.

Figure 17.
As in Figure 13 but for the comma-shaped MCSs: (a) horizontal winds at 925 hPa at 1400 BST and the composite radar reflectivity at z = 1 km at 1240 BST 23 Jun 2012; and (b) A conceptual model for the LLV-type WSHR event, with thick arrows in black and green denoting the mid-level and low-level environmental vertical wind shear, respectively.


Table 1.
The number of HR versus WSHR days, and the ratio of HR days to WSHR days over South China during the pre-summer months of 2008–2014.
Table 1.
The number of HR versus WSHR days, and the ratio of HR days to WSHR days over South China during the pre-summer months of 2008–2014.
| Year | 2008 | 2009 | 2010 | 2011 | 2012 | 2013 | 2014 | Mean |
|---|---|---|---|---|---|---|---|---|
| HR days | 40 | 25 | 40 | 32 | 46 | 40 | 41 | 37.7 |
| WSHR days | 14 | 9 | 8 | 5 | 6 | 10 | 6 | 8.3 |
| Ratio | 35% | 36% | 20% | 15.6% | 13.0% | 25% | 14.6% | 22.0% |
Table 2.
The locations (and station numbers), dates (day/month/year), amounts (mm), and classified weather types of the top ten daily-averaged WSHR events during the pre-summer months of 2008–2014 (also see Figure 2).
Table 2.
The locations (and station numbers), dates (day/month/year), amounts (mm), and classified weather types of the top ten daily-averaged WSHR events during the pre-summer months of 2008–2014 (also see Figure 2).
| Index | Station ID/Name | Date | Amount(mm) | Type |
|---|---|---|---|---|
| C1 | 59322/Yunxiao | 13 June 2008 | 445.7 | LLV |
| C2 | 59290/Longmen | 14 June 2008 | 327.0 | PSF |
| C3 | 59087/Fogang | 15 May 2013 | 292.4 | WMF |
| C4 | 59663/Yangjiang | 28 June 2011 | 256.5 | WMF |
| C5 | 59094/Wongyuan | 6 May 2010 | 240.1 | PSF |
| C6 | 59254/Guiping | 12 May 2012 | 237.2 | LLV |
| C7 | 59500/Haifeng | 21 June 2012 | 226.4 | WMF |
| C8 | 59501/Shanwei | 7 June 2008 | 216.9 | WMF |
| C9 | 59664/Dianbai | 5 May 2008 | 209.8 | WMF |
| C10 | 59069/Zhaoping | 22 June 2012 | 206.9 | LLV |
Table 3.
The number, percentage (%), mean lifespan (hours) and mean maximum length scale (km) of three MCS types associated with the 58 WSHR events.
Table 3.
The number, percentage (%), mean lifespan (hours) and mean maximum length scale (km) of three MCS types associated with the 58 WSHR events.
| MCS Type | Number | Ratio (%) | Mean Life Span (h) | Mean Maximum Length Scale (km) |
|---|---|---|---|---|
| Linear-shaped | 71 | 48.9 | 3.2 | 175 |
| TL/AS-like | 46 | 31.7 | 5.2 | 315 |
| Comma-shaped | 28 | 19.3 | 3.7 | 225 |
Publisher’s Note: MDPI stays neutral with regard to jurisdictional claims in published maps and institutional affiliations. |
© 2021 by the authors. Licensee MDPI, Basel, Switzerland. This article is an open access article distributed under the terms and conditions of the Creative Commons Attribution (CC BY) license (https://creativecommons.org/licenses/by/4.0/).
Share and Cite
MDPI and ACS Style
Chen, T.; Zhang, D.-L. A 7-Year Climatology of Warm-Sector Heavy Rainfall over South China during the Pre-Summer Months. Atmosphere 2021, 12, 914. https://0-doi-org.brum.beds.ac.uk/10.3390/atmos12070914
AMA Style
Chen T, Zhang D-L. A 7-Year Climatology of Warm-Sector Heavy Rainfall over South China during the Pre-Summer Months. Atmosphere. 2021; 12(7):914. https://0-doi-org.brum.beds.ac.uk/10.3390/atmos12070914
Chicago/Turabian StyleChen, Tao, and Da-Lin Zhang. 2021. "A 7-Year Climatology of Warm-Sector Heavy Rainfall over South China during the Pre-Summer Months" Atmosphere 12, no. 7: 914. https://0-doi-org.brum.beds.ac.uk/10.3390/atmos12070914
Note that from the first issue of 2016, this journal uses article numbers instead of page numbers. See further details here.