Article

Characteristics of Enhanced Heatwaves over Tanzania and Scenario Projection in the 21st Century

1
Institute of Environment and Sustainable Development in Agriculture, Chinese Academy of Agricultural Sciences, Beijing 100081, China
2
State Key Laboratory of Water Environment Simulation, School of Environment, Beijing Normal University, Beijing 100875, China
*
Author to whom correspondence should be addressed.
Submission received: 25 June 2021 / Revised: 26 July 2021 / Accepted: 27 July 2021 / Published: 11 August 2021
(This article belongs to the Section Biometeorology)

Abstract

:
Extreme hot temperature is dangerous to the bioeconomy, and would worsen with time. Ambient heatwaves accompanied by unusual droughts are major threats to poverty eradication in Tanzania. Due to sparsity of observation data and proper heatwave detection metrics, there has been a paucity of knowledge about heatwave events in Tanzania. In this study, the Heatwave Magnitude Index daily (HWMId) was adopted to quantitatively analyze heatwave characteristics throughout Tanzania at mid-21st century (2041–2070) and end of 21st century (2071–2100), relative to the reference period (1983–2012) using the CHIRTS-daily quasi-global high-resolution temperature dataset and climate simulations from a multi-modal ensemble of median scenarios (RCP4.5, from CORDEX-Africa). The results showed that moderate to super-extreme heatwaves occurred in Tanzania between 1983 and 2012, particularly in 1999, when ultra-extreme heatwaves (HWMId > 32) occurred in the Lake Victoria basin. It is projected that by mid-21st century, the upper category of HWMId would be hotter and longer, and would occur routinely in Tanzania. The spatial extent of all of the HWMId categories is projected to range from 34% to 73% by the end of the 21st century with a duration of 8 to 35 days, compared to 1 to 5 days during the reference period. These findings will contribute to increasing public awareness of the need for adaptation.

1. Introduction

Global climate change is modifying hazard levels and exacerbating disaster risks [1,2]. From 1951 to 2012, global temperatures rose at a rate of 0.12 °C per decade, resulting in more severe extreme events such as droughts, floods and heatwaves [3]. Previous studies established that, depending on the location, a shift in mean temperature led to a non-linear change in the frequency, intensity and scale of destructive heatwaves globally [4,5,6,7]. The Centre for Research on Epidemiology of Disasters has reported fatal heatwave episodes in recent decades worldwide [8]. In the United States, heatwaves are considered the deadliest weather category, which increased in frequency by 0.6 times per decade from 1961 to 2010 [9]. Heatwaves are classified as the most dangerous natural hazard in Australia, accounting for over 55% of all weather-related deaths [10]. In 2009, intense heatwaves in Australia caused nearly 500 registered deaths [11]. While the 2003 European summer heatwaves took over 70,000 lives [12], about 55,000 deaths were recorded in 2010 in Russian due to summer heatwaves [13]. Lethal heatwaves in 2013 engulfed parts of China, particularly in Shanghai, where a 141-year temperature record was exceeded as daily temperatures rose over 38 °C for 16 consecutive days [14]. In 2015, about 1300 heat-related deaths were recorded in Pakistan [15]. India and many other parts of Asia have experienced destructive heatwave events in recent decades [16,17,18,19,20,21].
Centrally located in the equatorial tropics, Africa is often described as the world’s ‘hottest’ continent [22] with the lowest natural temperature variability [23]. However, fatalities associated with catastrophic heatwaves that occur in Africa are not being well reported, and the threshold that results in heat-related excess mortality is poorly understood [24]. According to the most updated global disaster reports from EM-DAT, only eight heatwave events occurred in the entire continent of Africa from 1900 to 2021, located in Egypt (3) and South Africa, Sudan, Nigeria, Algeria, and Morocco (1 each), resulting in 291 deaths (Egypt, 164; South Africa, 11; Sudan, 16; Nigeria, 60; and Algeria, 40) [25]. This low number of heatwave events recorded for Africa is inconsistent with an understanding of this continent as a ‘’hotspot’’ of extreme heatwave events. It is therefore necessary to check the recorded data and determine the true occurrence of heatwaves in Africa. Although no African country is among the top ten countries with the most heatwaves in the EM-DAT reports (Table 1), several studies have found deadly heatwaves in many areas of the continent. From 2006 to 2015, the frequency (spatial coverage) of extreme heatwaves increased to 24.5 observations per year compared to 12.3 per year (1981 to 2005) [26]. A total of 71 lethal heatwave events were recorded in South Africa between 1983 and 2012 [27], and ambient heatwaves in 2015 caused 110 deaths in Egypt as temperature soared above 47 °C [28]. Many other studies in other parts of Africa have reported lethal heatwaves in recent decades [29,30,31,32,33,34,35,36]. These extraordinary heatwaves have not only been associated with high morbidity and mortality in Africa [6,37,38,39,40], but also have had dramatic impacts on agro-ecosystems as temperatures rise above critical physiological thresholds [41,42,43,44]. However, heatwaves are often considered “normal’’ events in Africa [45], partly because Africa is a tropical continent and temperatures are already near the upper threshold for human comfort [1]. In addition, unusual heatwaves in most parts of Africa typically coincide with widespread droughts, thus obscuring the unique dangers of heatwave events.
Tanzania is about 65% arid and semi-arid [46]. With a largely hot and arid climate, the country experiences high temperatures, particularly in the dry season when humidity is often relatively low [47]. According to the Tanzania National Adaptation Plan of Action, destructive heatwaves accompanied by a precipitation deficit are major threats to poverty eradication [48], thus hampering Tanzania’s vision for 2025 [49,50]. In-depth analysis of heatwave episodes is crucial for awareness raising and long-term development planning. However, studies in Tanzania tend to focus more on droughts and floods with less attention given to quantitative analysis of heatwaves across the country [39,51]. Heat-related studies have only focused on Dar es Salaam, a city located along the coast with a warm-humid climate [47]. For example, qualitative analysis of reported excessive heatwaves in Dar es Salaam [45,47] attributed high temperatures to urban design patterns. Most recently, [51] reported excessive heat-related injuries to gold mine workers in the Mara region of Tanzania using qualitative data. The paucity of heatwave information in the country [52,53] is attributed to lack of high-quality baseline data [54,55] and thermal heatwave evolution metrics [33,37,56]. Analysis of heatwave events using high-resolution dataset across Tanzania is critical for heat adaptation planning.
A major challenge in heatwave evaluation is the lack of a standard definition of ‘heatwaves’. Definitions vary regarding the length of the heatwave, the type of metrics adopted, the threshold, and whether humidity is taken into account [9]. Among the most recent heatwave-evaluation indices developed [5,57,58,59,60,61,62,63,64,65], the percentile-based Warm Spell Duration Index (WSDI), adopted by the Expert Team on Climate Change Detection and Indices (ETCCDI) [66], is considered the most robust index for heatwave evaluation, because it was specifically developed to detect heatwaves [67]. However, the IPCC 4th assessment report identified limitations with this index, as it is calculated for individual seasons and years, thus dividing heatwaves that extend across two different seasons [64,68]. The WSDI also does not take into account the intensity of the heatwave; thus, heatwaves of the same duration are assumed to have the same severity (intensity) [67]. The Excess Heat Factor (EHF) [69] is a recent heatwave metric that quantifies heatwave intensity and duration relative to human health. For this study, we adopted the most up-to-date heatwave index, the Heatwave Magnitude Index daily (HWMId) [70], which is able to integrate heatwave intensity and duration into a single numerical value (magnitude). HWMId is the most comprehensive heatwave-detection tool available, particularly for hot-arid parts of Africa where extreme heatwaves mainly occur during the dry seasons. The index is particularly relevant for Tanzania, where most of the radiant heatwaves occur during the months when humidity is relatively low. As reported by [47], heatwaves in Tanzania largely occur from October to March, during the dry season. This index has been used widely in Africa for impact assessment [33,34,71]. In this paper, the CHIRTS high-resolution satellite remotely sensed and station-blended temperature dataset was employed to detect heatwaves occurrence during the reference period and to examine their patterns and magnitudes in the 21st century in Tanzania using high-resolution multi-median RCP scenarios (RCP4.5). Section 2 provides a detailed description of the data and methodology adopted in the study. Section 3 presents the results, and Section 4 describes the main conclusions, providing a comprehensive discussion of the key findings of the study.

2. Materials and Methods

2.1. Study Area

Tanzania is a tropical country located 50 km south of the equator. The climate varies substantially across regions, influenced by complex relief features [72]. Temperatures vary with the geographic location and altitude and are usually higher during the dry seasons between October and March [46] and are coolest during the months of June and July. The migration of the Inter-Tropical Convergence Zone (ITCZ) causes the Northern and Eastern regions of Tanzania to experience two distinct seasonal precipitation patterns (bimodal precipitation patterns), while the Southwestern, Central and Western parts of the country experience one precipitation season (unimodal precipitation patterns) [73,74].

2.2. Data Description

High-resolution (0.05°) grid-based time series of daily maximum temperatures were extracted from the newly available Climate Hazards Center Infrared Temperature with Stations (CHIRTSmax) Climate Data Record (CDR), developed by [55]. This freely available dataset from the Climate Hazards Center data portal (http://data.chc.ucsb.edu/products/CHIRTSdaily/, accessed on 28 July 2021) provides the most reliable and remotely updated temperature estimates for impact assessment, especially in data-sparse regions such as Africa. A detailed description of the development of the dataset can be found in the literature [55,75].
A high-resolution (0.44°) modelled daily temperature dataset for RCP4.5 was obtained from the RCMs with CORDEX activity for the period 1983–2005. Projections for 2041–2100 were developed using the most popular regional climate model, SMHI-RCA4, using 3 GCMs: CCma-CanESM2, NCC-NorESM1-M, and CNRM-CERFACS-CNRMCM5. A detailed description of this model can be found here [76,77]. These models have been widely used, particularly in Africa, for heatwave detection [33,34,71]. RCP4.5 is an intermediate scenario that reasonably represents the potential characteristics of future heatwave events in Tanzania. The high-resolution CHIRTS-daily data were interpolated to a 0.44° grid and used to validate the multi-modal dataset for future analysis.

2.3. Bias Correction

Bias correction is recommended to reduce the deviation in the climate model’s outputs and thus diminish uncertainties in the future climate projections [78]. This study adopted the bias correction spatial disaggregation (BCSD) method [79,80] to increase the accuracy of model outputs. The long-term monthly trend for the variable Tmax was first extracted from the GCM data.
x i j = x i j x i , t r e
where x′ij and xij are the de-trended value and raw value of GCM output on day j (Julian day of the year) of month i (month of the year), respectively. xi,tre is the long-term monthly trend for month i (e.g., the series of values for all Januaries during the period was taken to extract the trend for January). This was calculated for the baseline period and the future period. The cumulative distribution function (CDF) for the observation and for the historical GCM simulation were generated by pooling and sorting the corresponding source values (within 30 days around day j of the year). The CDF for the GCM simulation was then corrected using the CDF for the observations. The value of the GCM for any CDF quantile was translated to the corresponding value of the observation in the same CDF quantile. Assuming the CDF of the GCM simulation was stable across the baseline and future periods, the CDF for the simulation of future periods was corrected using the corresponding CDF for the observations. Thus, the bias in the statistical structure of the original GCM output was eliminated using this correction procedure. Finally, the previously extracted climate trend xi,tre was then added back to the adjusted GCM climate values.

2.4. Methodology

The heatwave magnitude index daily (HWMId) [70] was adopted to evaluate the features of the heatwaves during the reference period (1983–2012), mid-21st century (2041–2070) and end of the 21st century (2071–2100) across Tanzania. HWMId is an updated version of the heatwave magnitude index (HWMI) [67], which is defined as the maximum magnitude of heatwaves in a year, where a heatwave is defined as a period of at least three consecutive days with maximum temperatures above the daily threshold calculated for a 30-year reference period (1983–2012). The threshold is defined as the 90th percentile of the daily maximum temperatures centered on a 31-day window [26,70]. The heatwave magnitude is then calculated by simply summing up the magnitude of each day composing a heatwave, as described in [70]. A detailed description of the index can be found in [70,71].
Projected changes were calculated for each grid over the entire country to understand the broad spatio-temporal distribution of heatwave events at the middle and end of the 21st century (30 years each), while 32 years (1983–2014) was used as the reference period to calculate the index, as required by the R package. However, analysis of heatwave events for the observed period was extended to 2016, including the full data length of CHIRTS-daily, to more broadly evaluate heatwave events over the past few decades. Heatwaves during the years 2015 and 2016 are highlighted to demonstrate the most recent patterns of heatwave events relative to the reference period (1983–2012). To further examine the magnitudes of heatwaves that occurred in the observation period, the 10 years with the highest HWMId peak values were thoroughly investigated. The Mann–Kendall test was adopted to test the statistical significance of the trends over time. To identify and compare heatwave severity, the heatwave categorization chart used by [17,71] was adopted (Table 2). A land area ratio was calculated to demonstrate not only the severity of the inter-annual changes in the various HWMId categories (classes), but also the areal extent of the country that was impacted.

2.5. Ranking Method

The heatwave ranking method adopted by [70] was similarly used to select the 10 years with the most extreme heatwave events. The selection was based on the percentage of Tanzania’s area affected by the heatwave at different HWMId levels and the magnitude of the HWMId peak. For example, given two heatwaves, HW1 and HW2, HW1 would be greater than HW2 if the percent area across all HWMId levels is greater than that of HW2. However, due to high variability in the ranking across the HWMId levels, the selection was largely based on the HWMId peak value.

3. Results

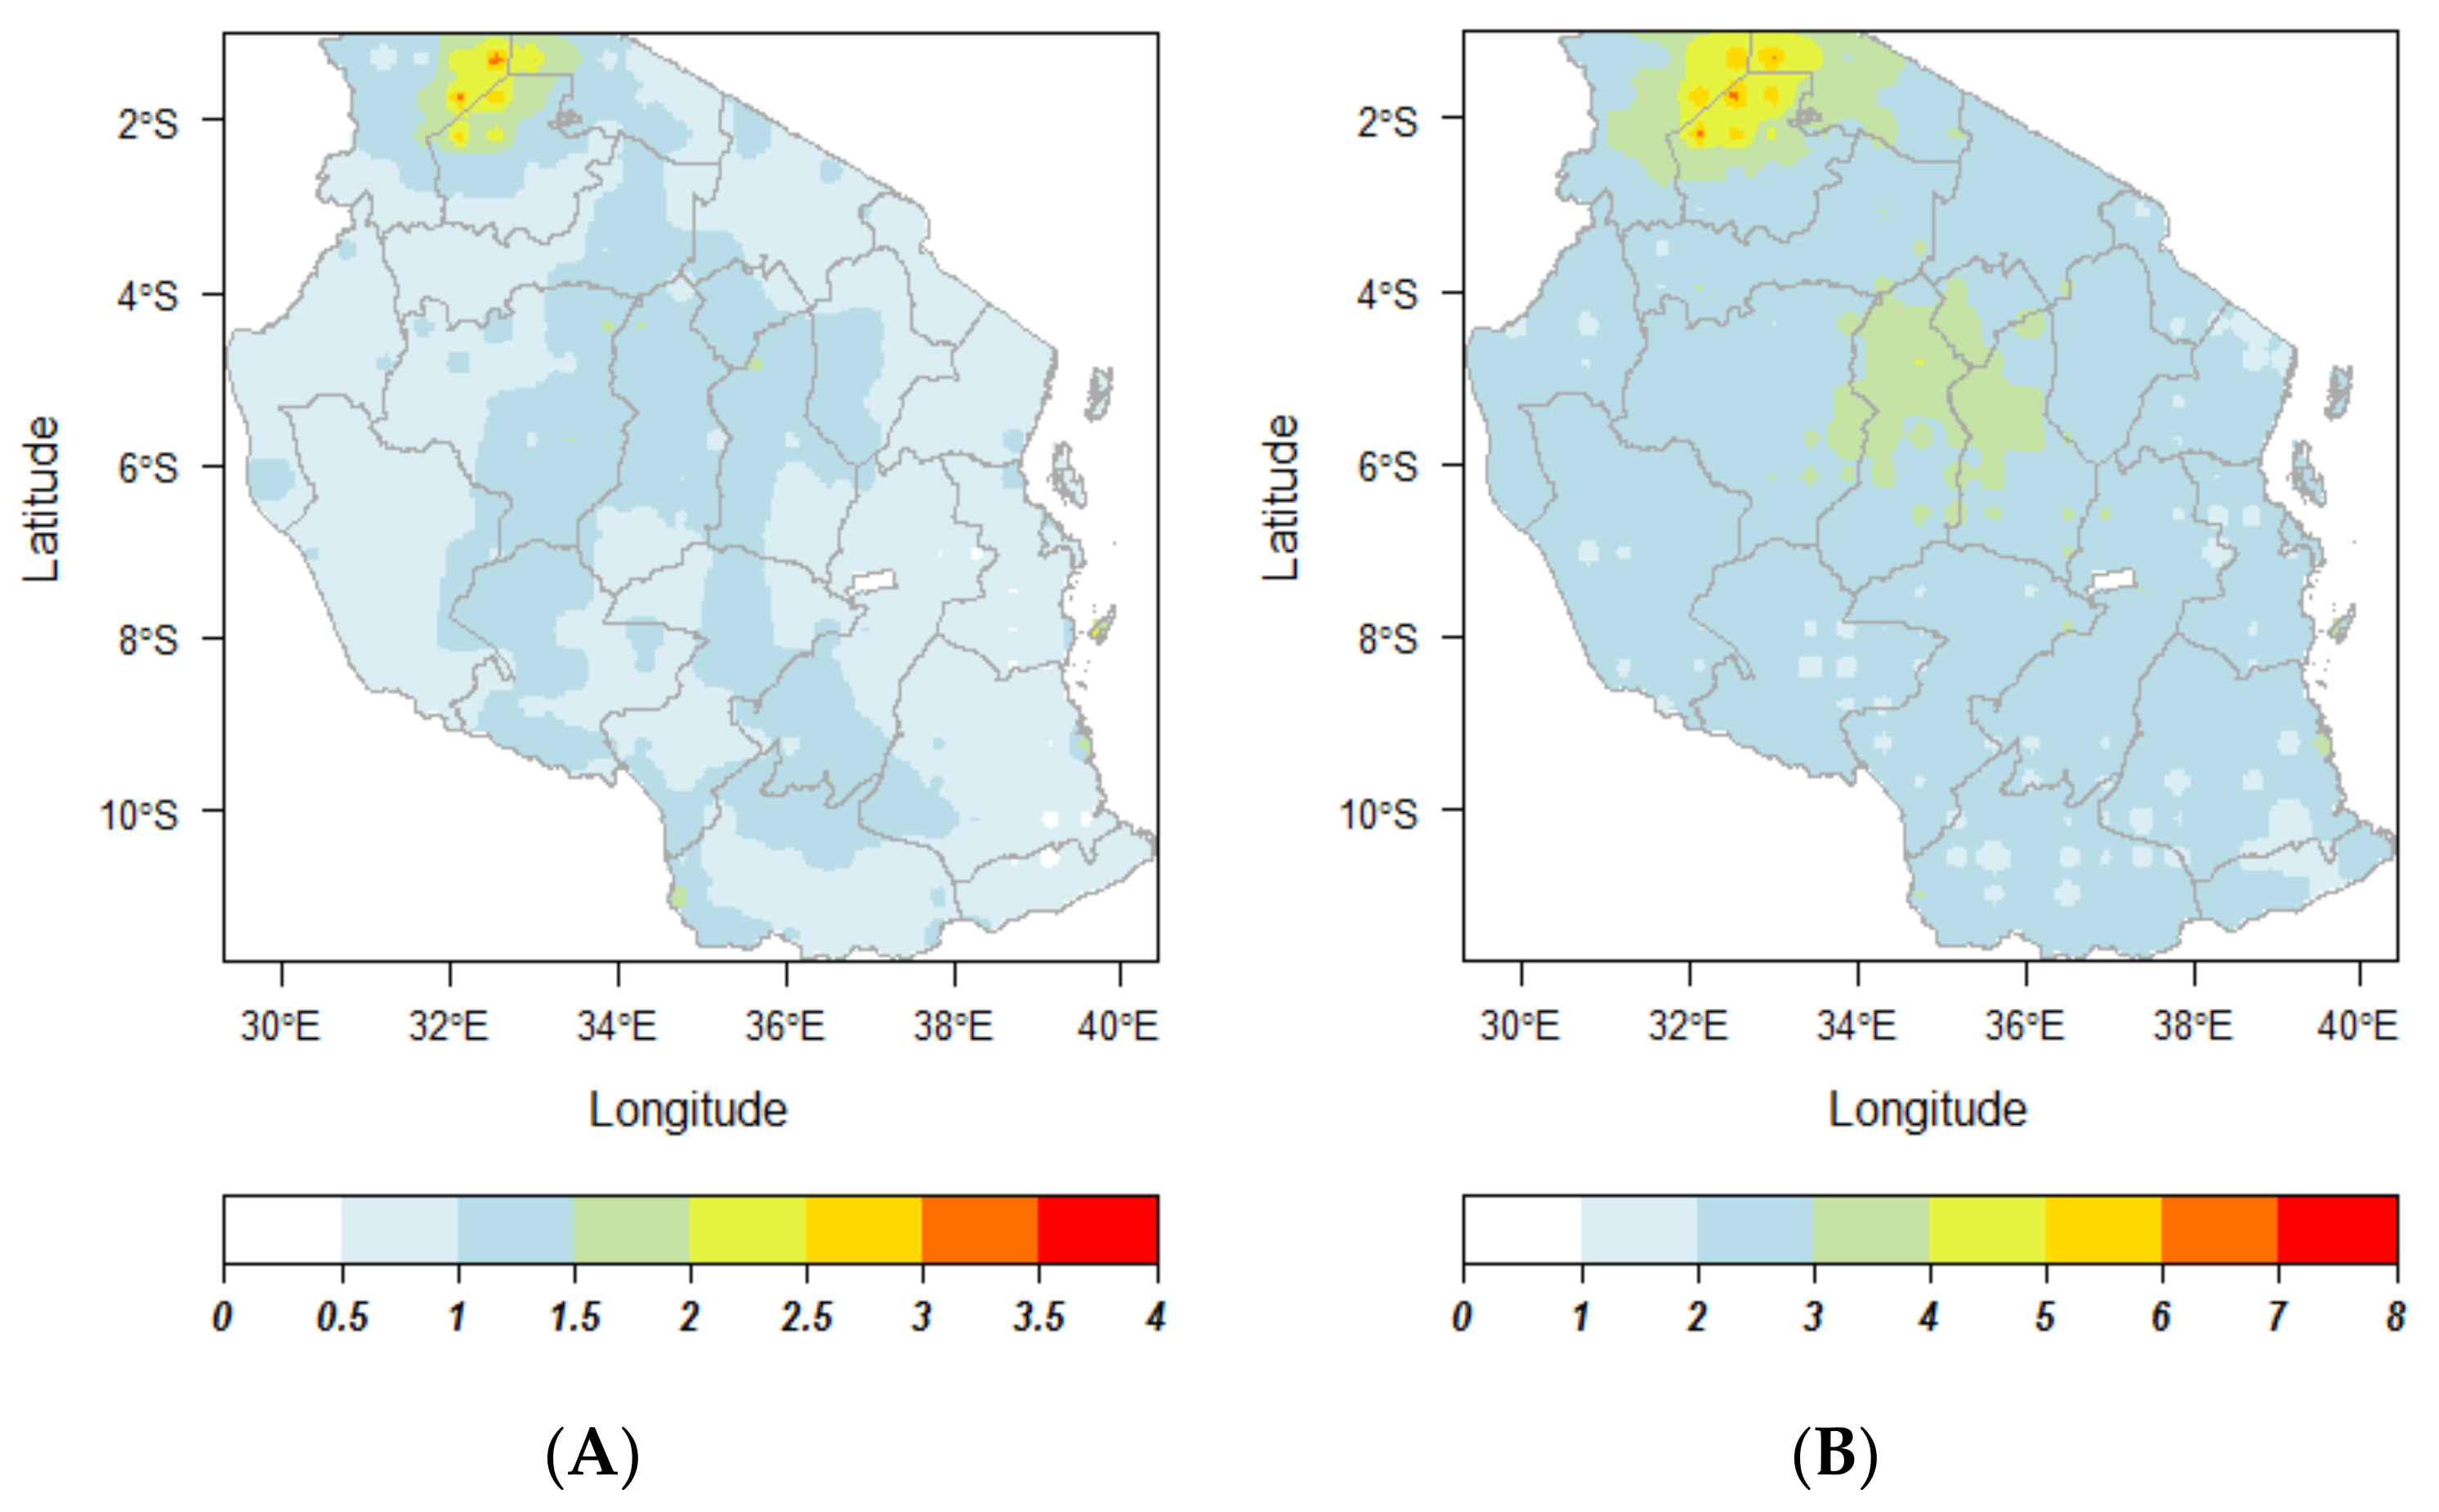
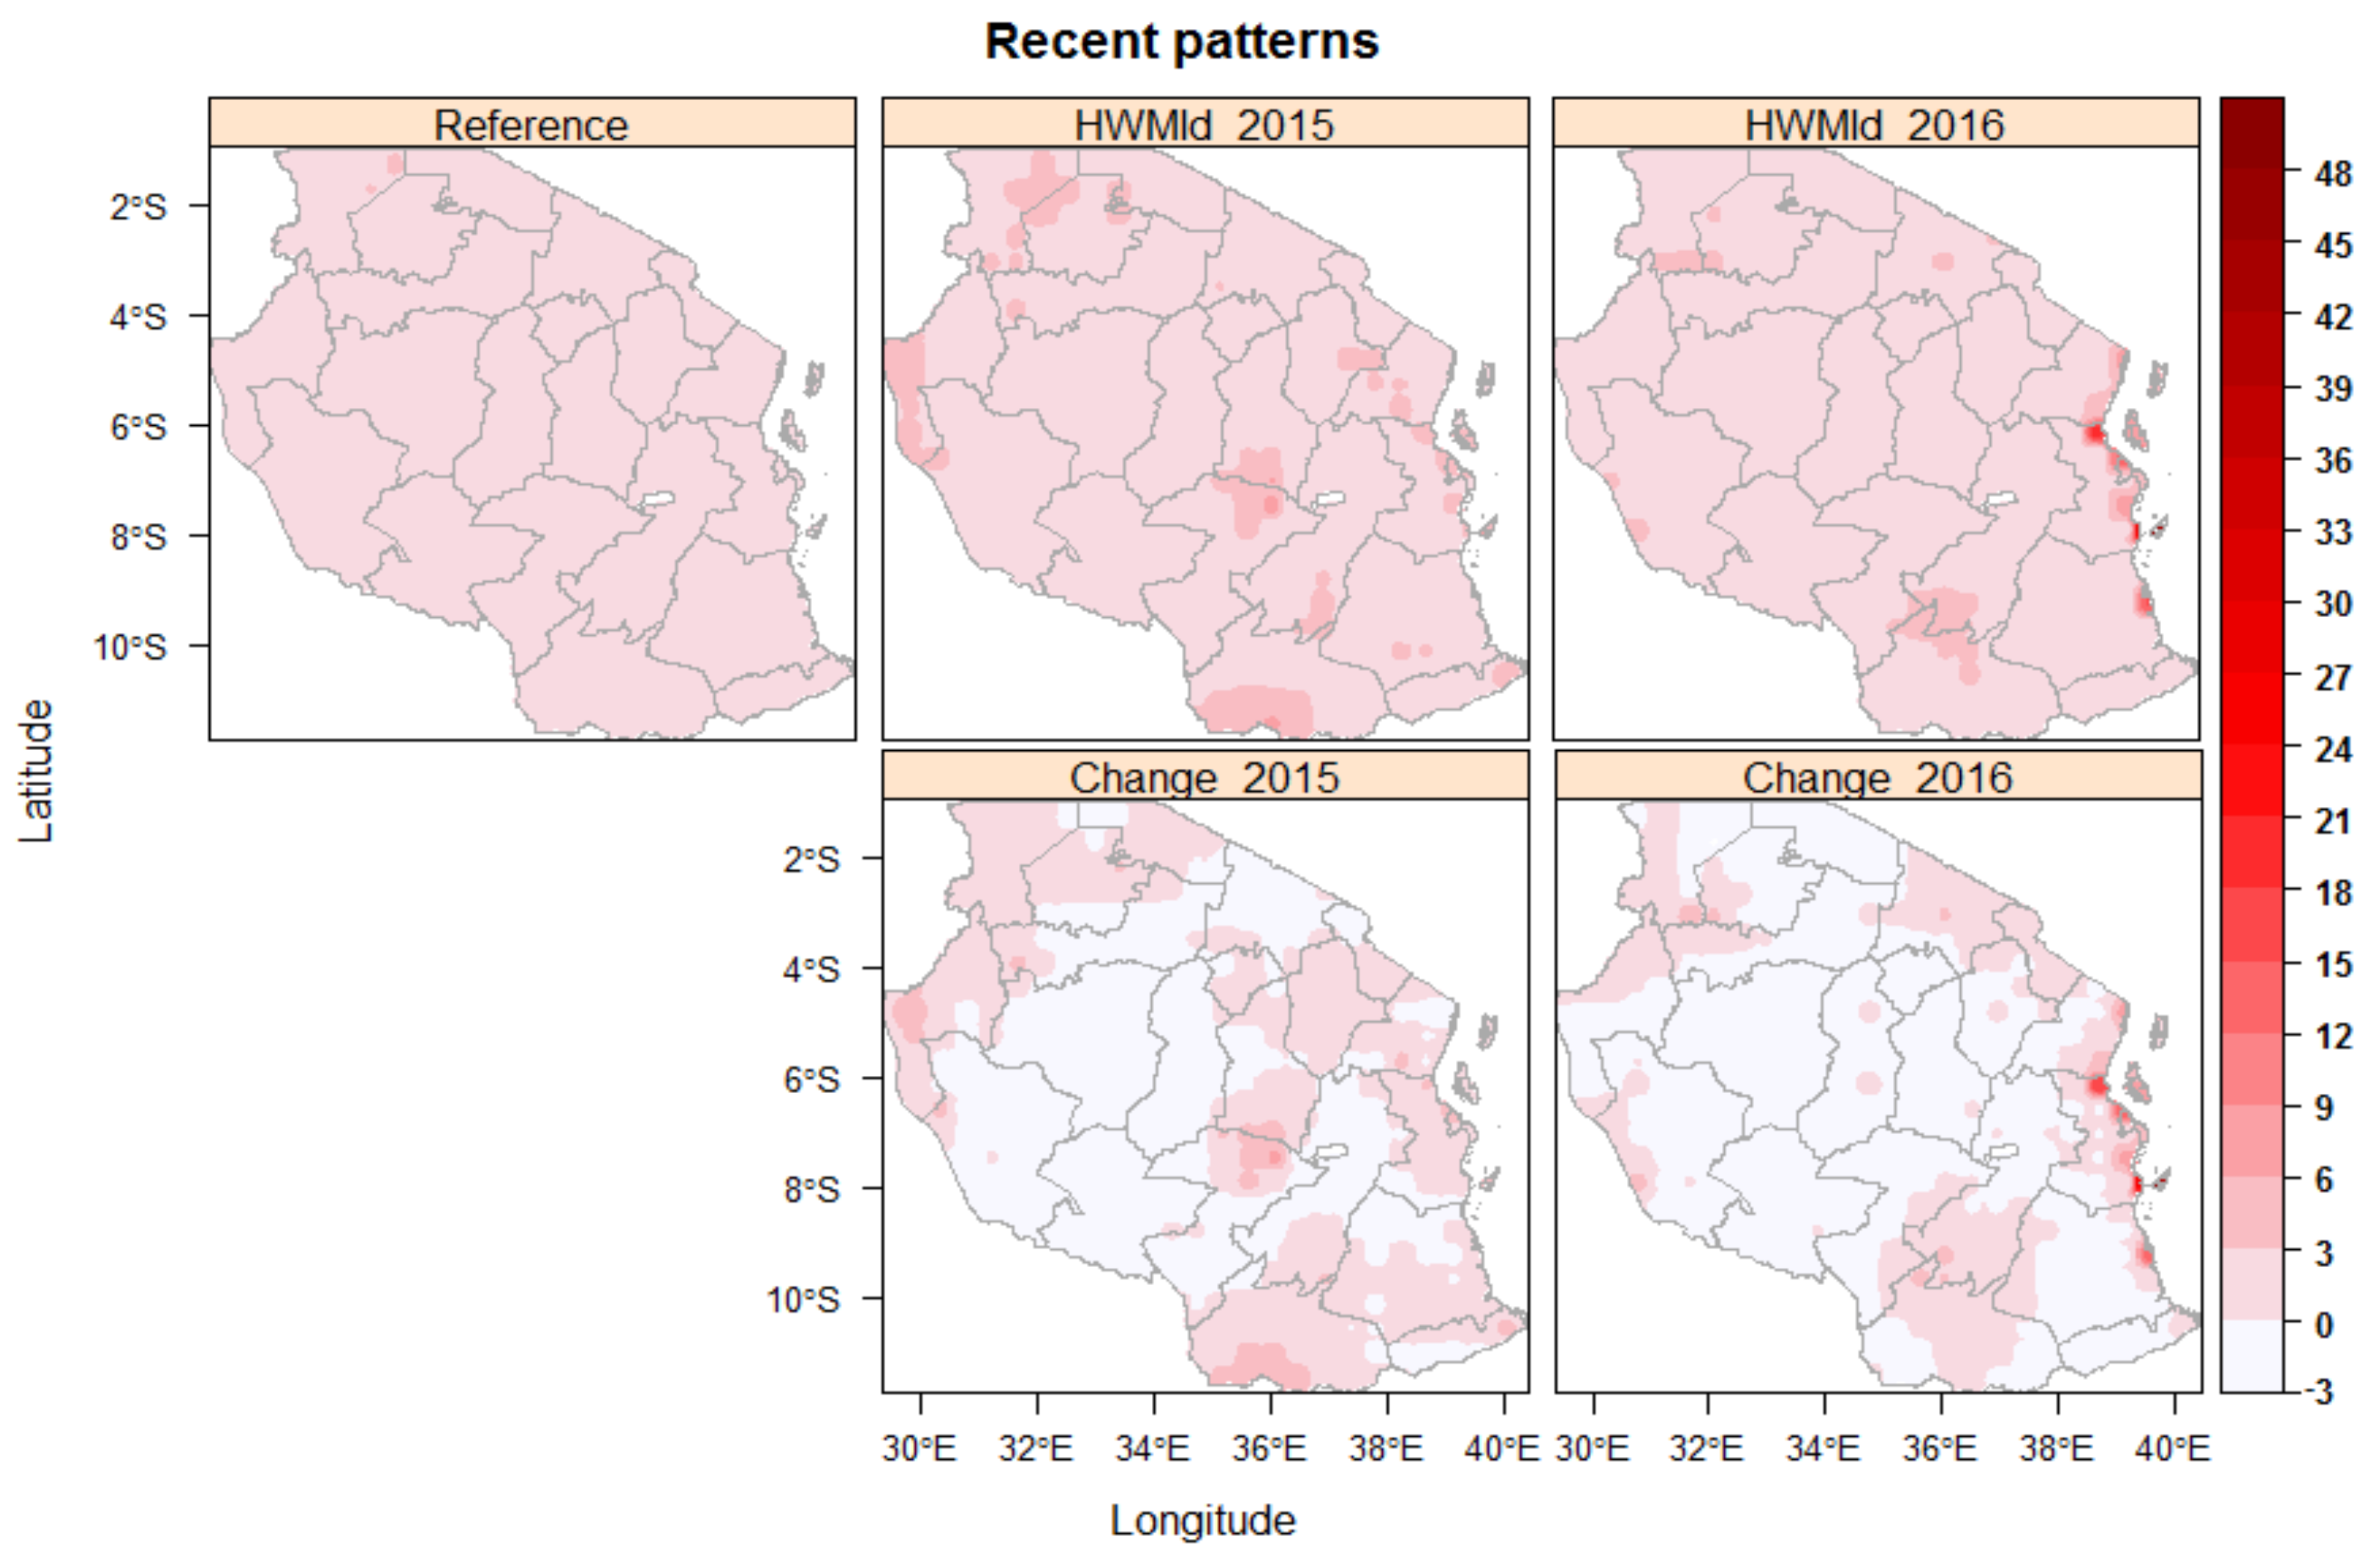
3.1. Heatwave Climatology

As shown in Figure 1A, heatwave events have occurred in portions of Tanzania in recent decades. Following the HWMId classification chart (Table 2), normal heatwaves (HWMId < 2) occurred in large areas of the country, while severe heatwave events (HWMId ≥ 3) occurred in Kagera, Mwanza, and parts of Mara in the Lake Victoria basin. Most areas of central Tanzania and the Lake Victoria basin were warmer than the outer areas of the country. The spatial patterns for heatwave duration (Figure 1B) are similar to the magnitude. The longest heatwave duration of over 6 days occurred in the Lake Victoria basin, which recorded the greatest heatwave HWMId peak value.
To examine the features of heatwaves in the recently observed period, the spatial distribution of the heatwave events (absolute values) and relative changes for 2015 and 2016 are presented in Figure 2. As clearly shown, greater heatwave magnitudes ranging from severe (HWMId > 3) to ultra-extreme (HWMId > 32) occurred in these years, particularly in 2016. The relative changes demonstrate a sharp spatial contrast when compared with the heatwave climatology; for example, in 2016, the magnitude reduced substantially in central Tanzania but increased greatly in Dar es Salaam (HWMId > 8) and parts of the eastern, southern and edges of western Tanzania, which were relatively colder during the reference period (1983–2012). The severity of the heatwave magnitude was more persistent along the coastal stretch (eastern Tanzania) and the edges of the country.
Temporal trends in the mean severity of heatwaves during the reference period were not statistically significant at the 5% level, although significant trends were detected in patchy areas that recorded higher heatwave magnitudes. The significance of HWMId for the reference period is therefore not reported here. However, the duration of heatwaves for the entire observed period (1983–2016) exhibited significant rising trends but with high variability, ranging from about 1 to 5 days (Figure 3). It can be seen that the year 1999 witnessed the most deadly heatwave magnitude during the observation period; however, the longest heatwave event of about 5 days occurred in the year 1997.
It is therefore clear that although the heatwave climatology for the reference period was rising marginally over time, the duration increased significantly in the affected areas. Since the reference period was relatively short, the 2 extra years (2015 and 2016) were reviewed for comparison with the heatwave climatology to identify spatial patterns in heatwaves in recent years. The relative changes in heatwave events in 2015 and 2016 demonstrate a sharp spatial contrast when compared with the reference heatwave climatology. Normal heatwaves that occurred in Kigoma, Katavi, and eastern Tanzania during the reference period became severe and extreme heatwaves in 2015/2016. Greater magnitude heatwaves appeared in various parts of the country, particularly in Dar es Salaam, eastern Tanzania, and the edges of the country.

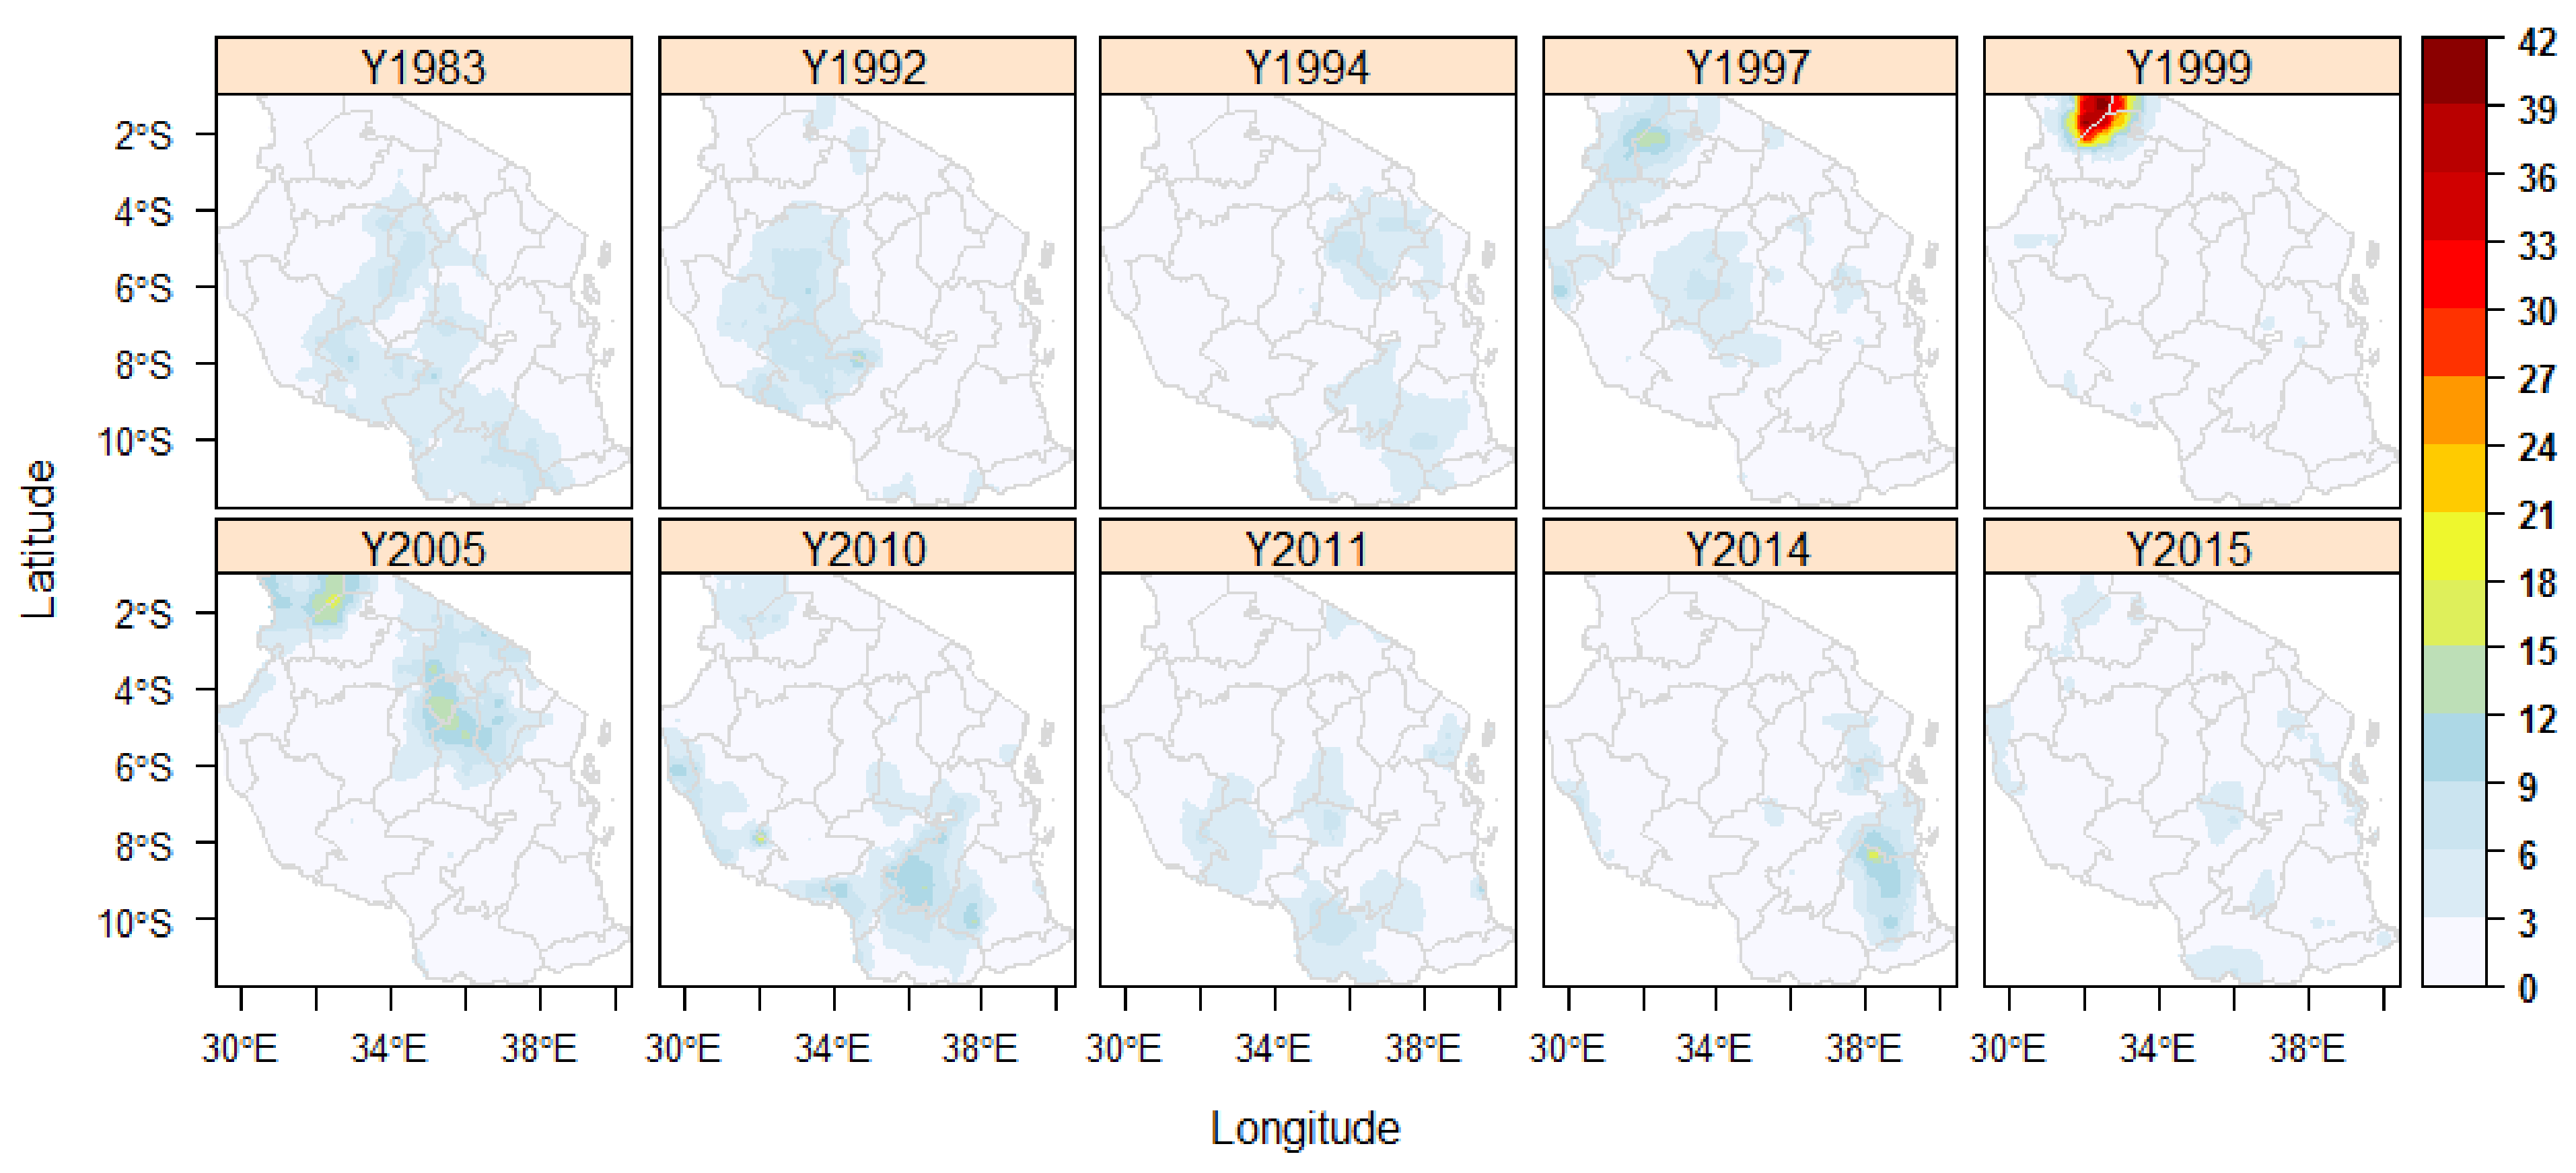
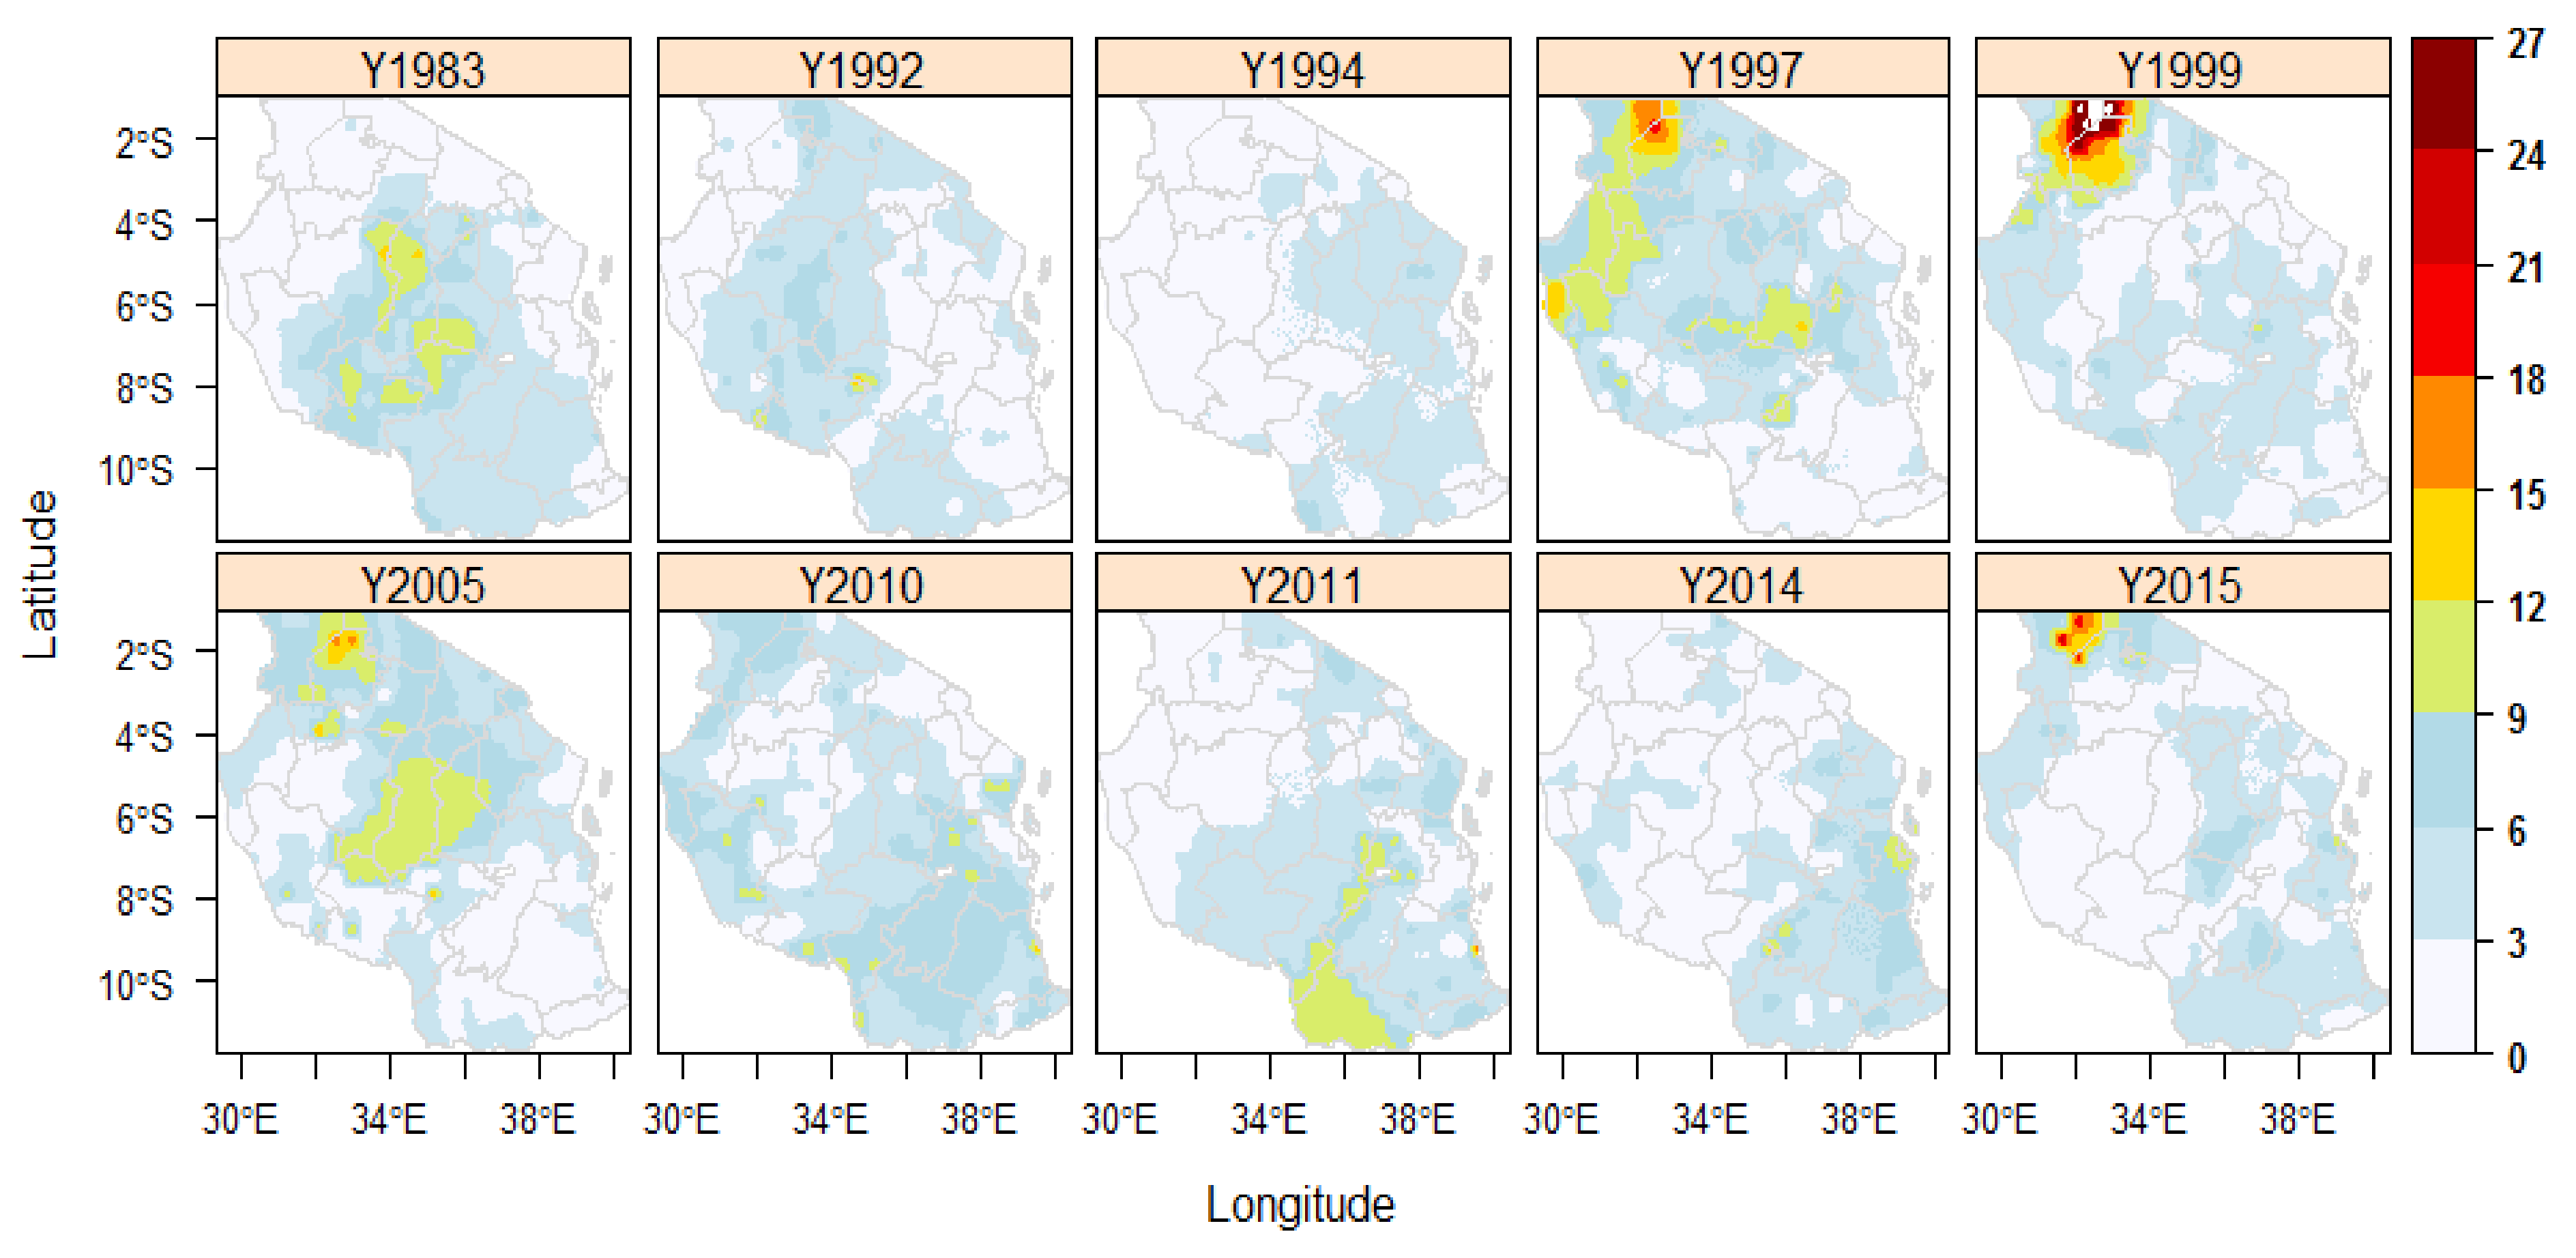
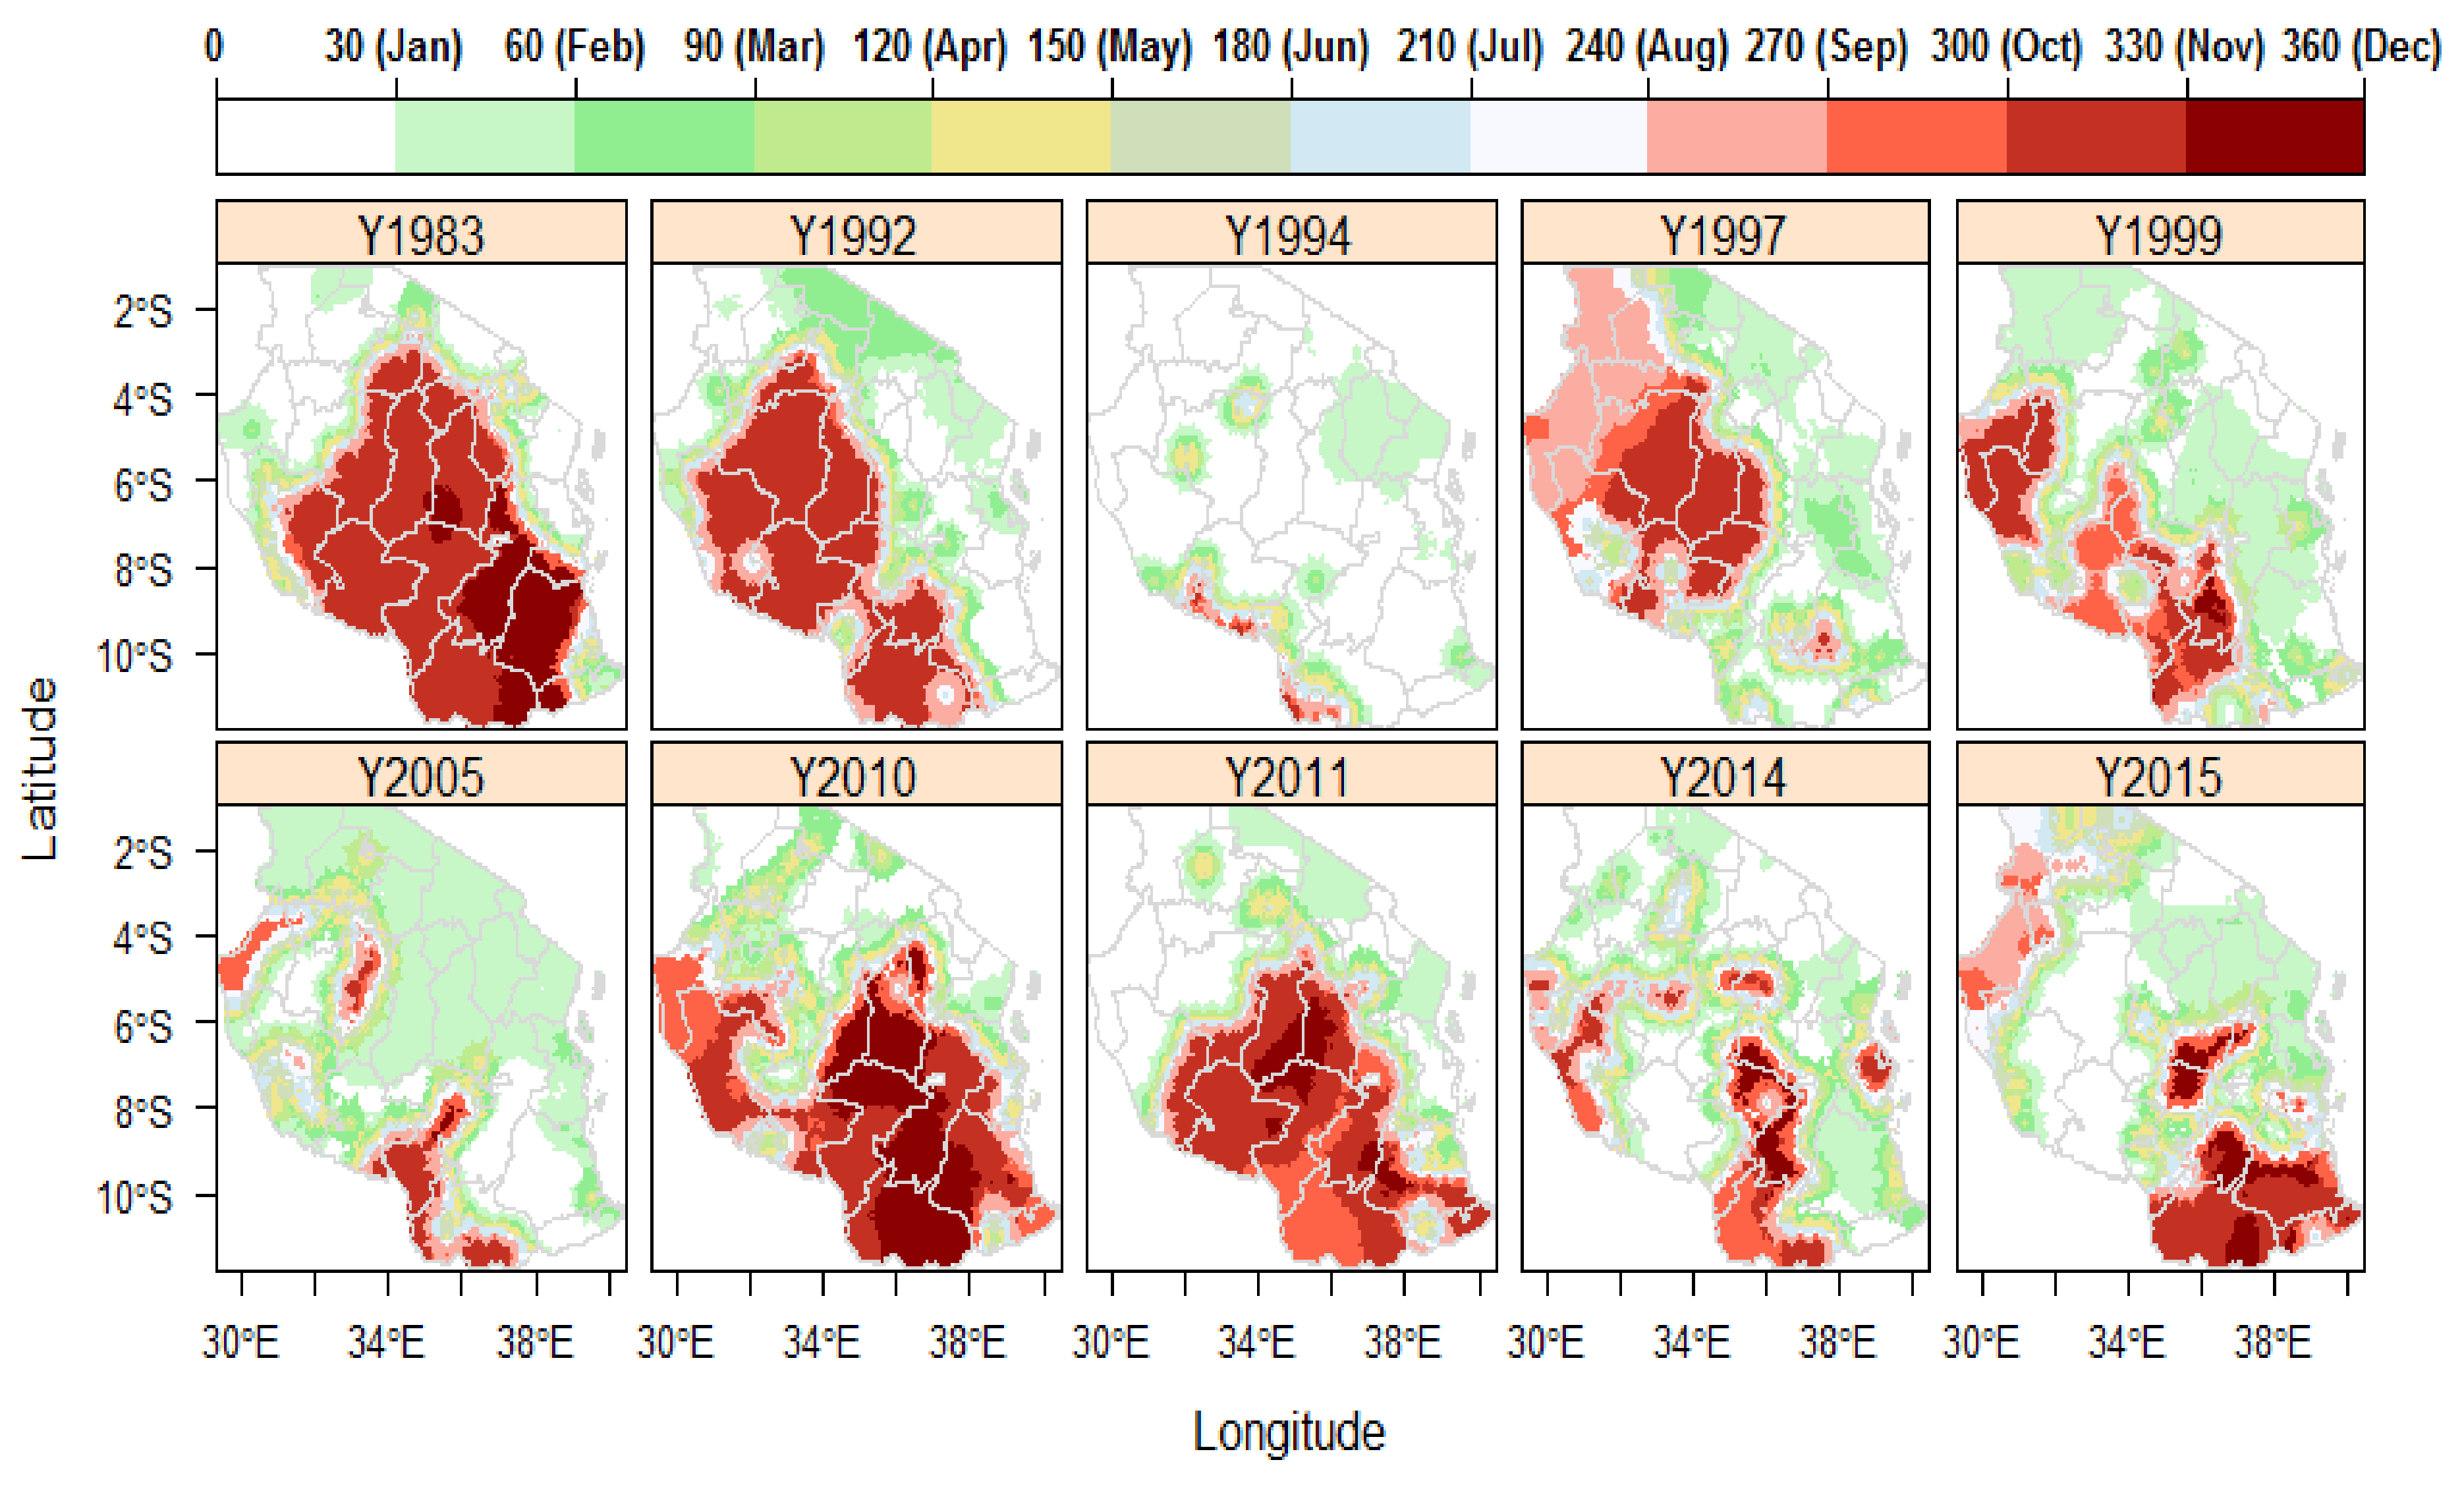
3.2. Top Ten Heatwave Events in Tanzania from 1983 to 2016

Heatwaves in Tanzania with the highest magnitude and spatial extent from 1983 to 2016 are presented in Figure 4 and Table 3. Extreme (HWMId ≥ 4) and very extreme (HWMId ≥ 8) heatwaves characterized these years (Figure 4). Noticeably, super-extreme heatwaves occurred in 1999, 2005, 2010 and 2014 (Table 3), and the most catastrophic heatwave event (ultra-extreme) occurred in 1999 around the Lake Victoria basin (Figure 4). The HWMId peak values for these years ranged from 7 to 41.58 days (Table 3).
The spatial extent of these lethal heatwaves affected at least 15% of the total land area of Tanzania in each of these years (Table 3). However, the percentage of land area affected decreased with the higher magnitude heatwaves. The heatwave duration had similar pattern to the HWMId. Parts of the Lake Victoria basin, which recorded the highest HWMId peak value in 1999, also experienced the longest duration (duration > 25 days) at a fine spatial scale (Figure 5). The starting date of the heatwave events mainly coincided with the dry season (October to March/April) (Figure 6). However, a few heatwave events occurred in the other months.
In summary, extreme heatwaves occurred during at least 10 of the 34 years of the observation period, and about 15% of the land area was affected in each of the years. Sever heatwave events were most persistent in parts of the Lake Victoria basin, which recorded the highest HWMId peak value of 42, in 1999. Most of the heatwave events occurred within the dry season.

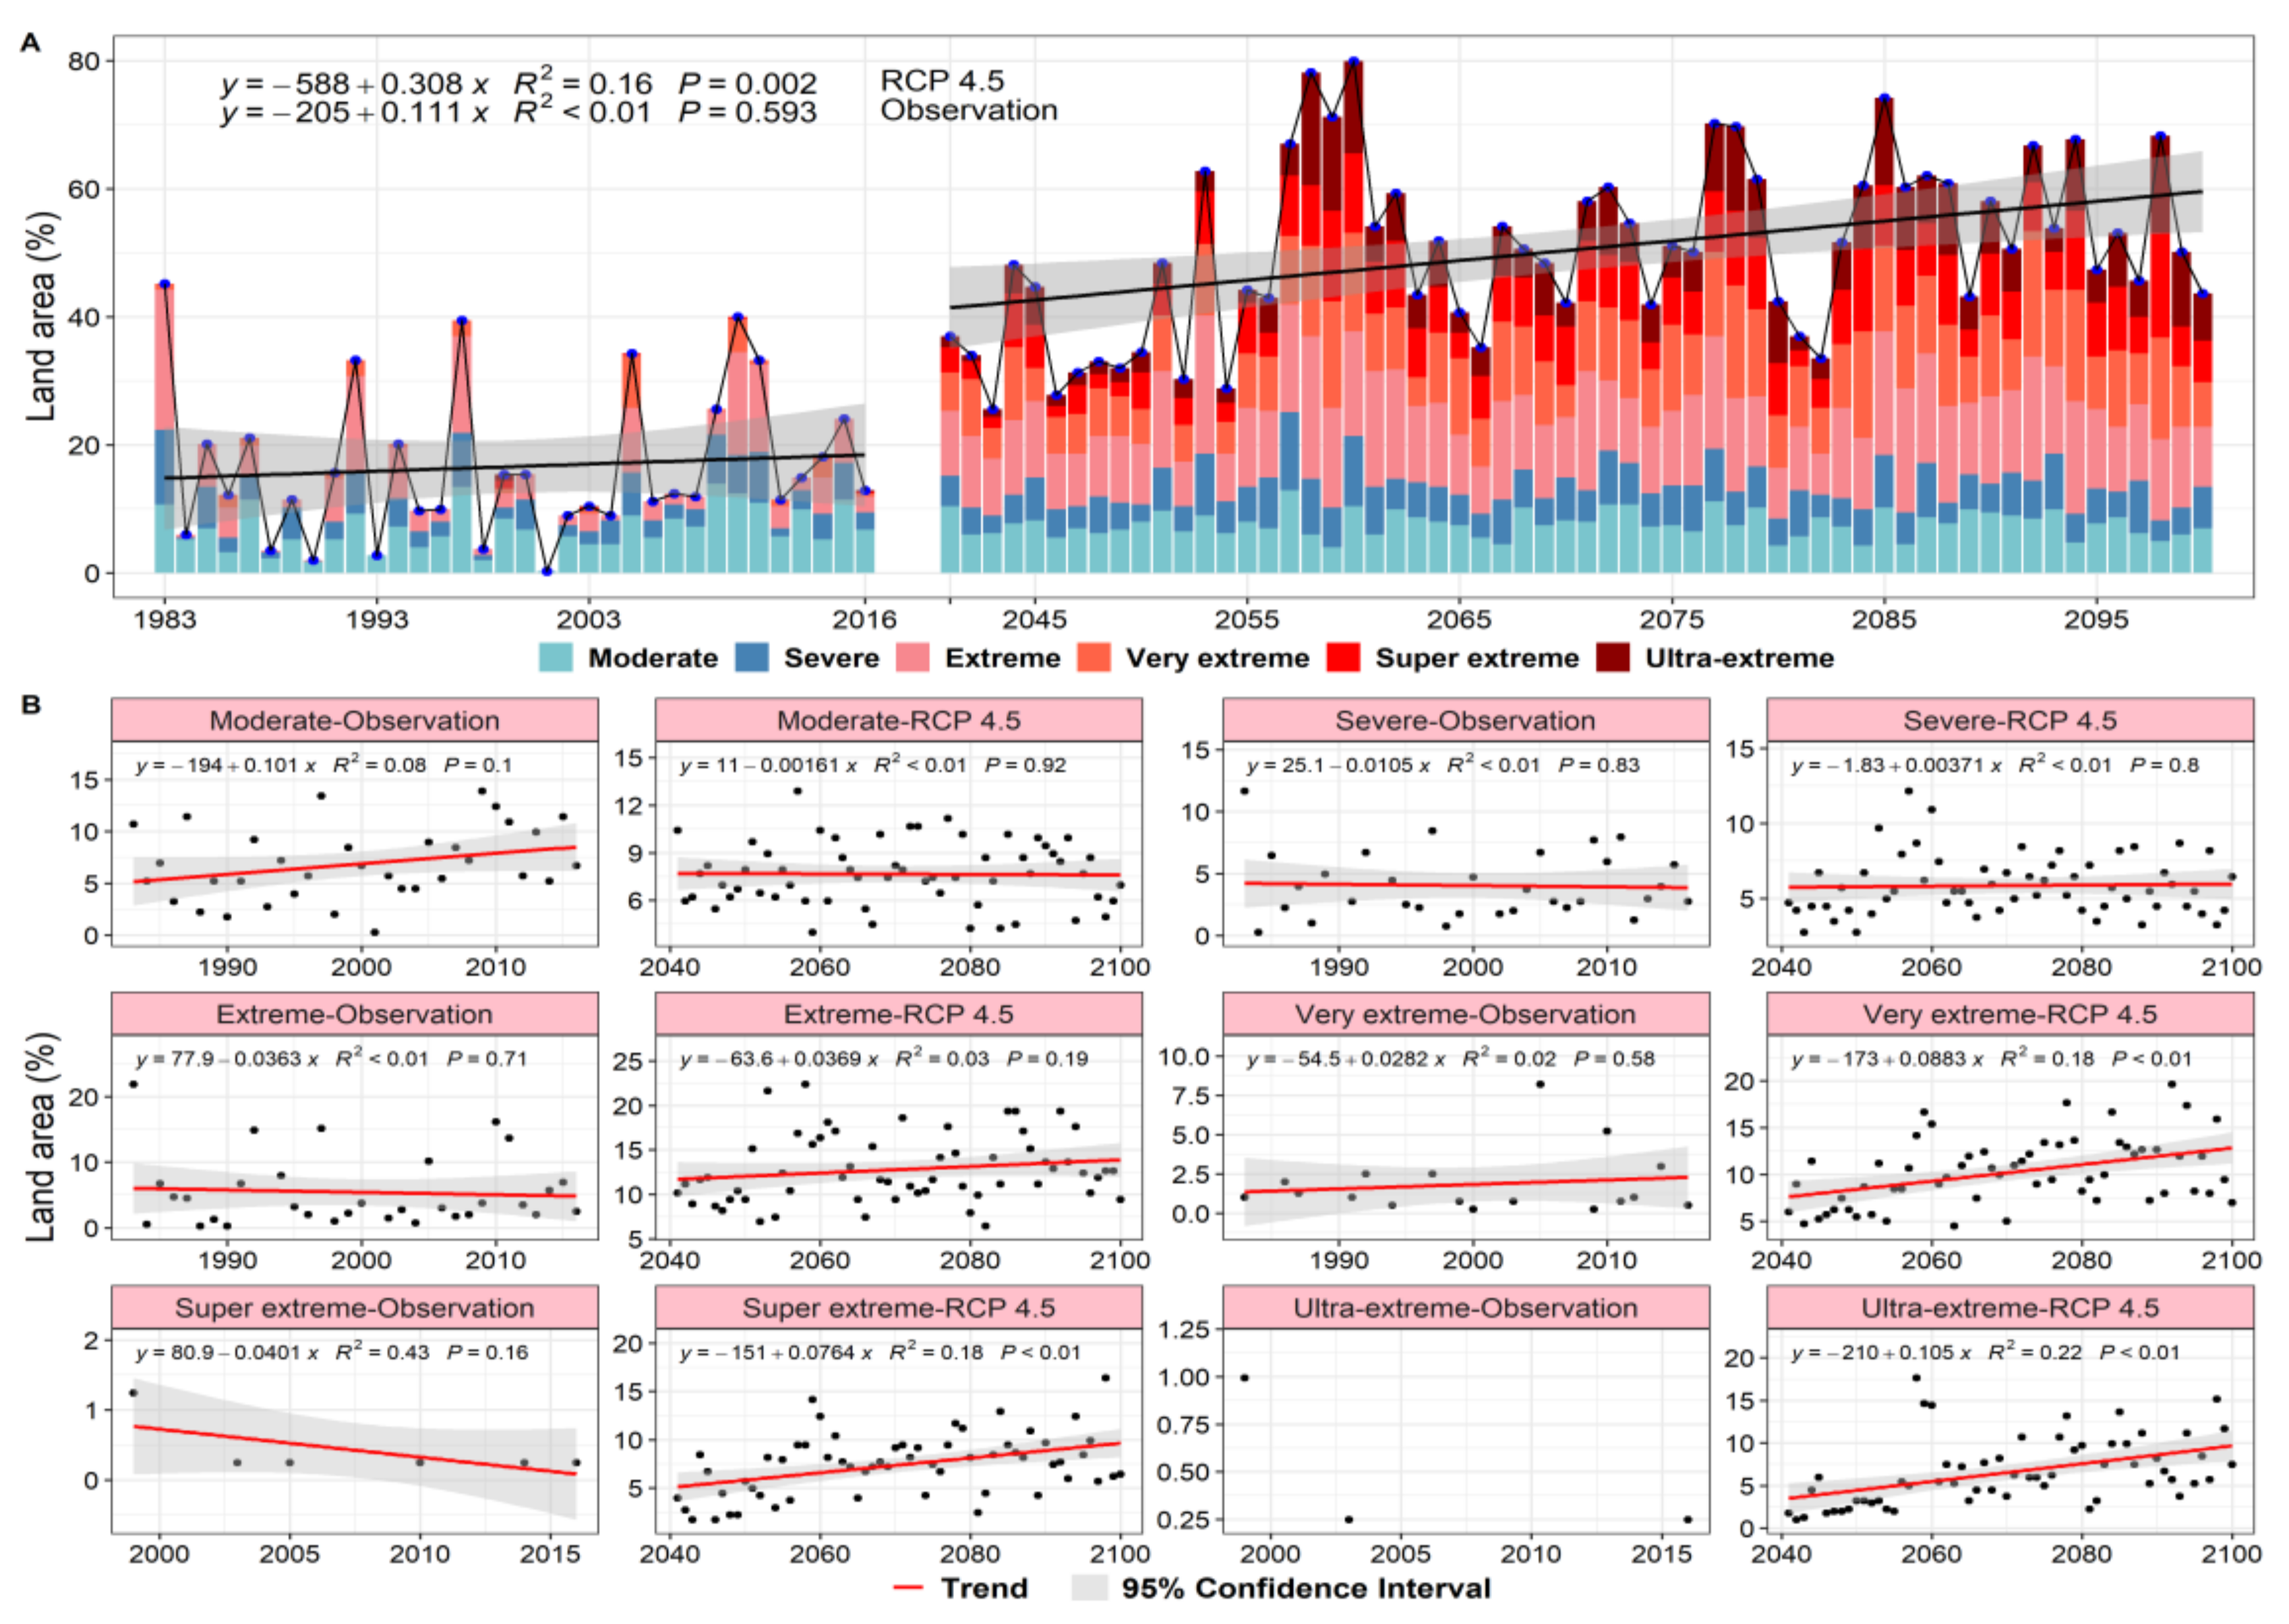
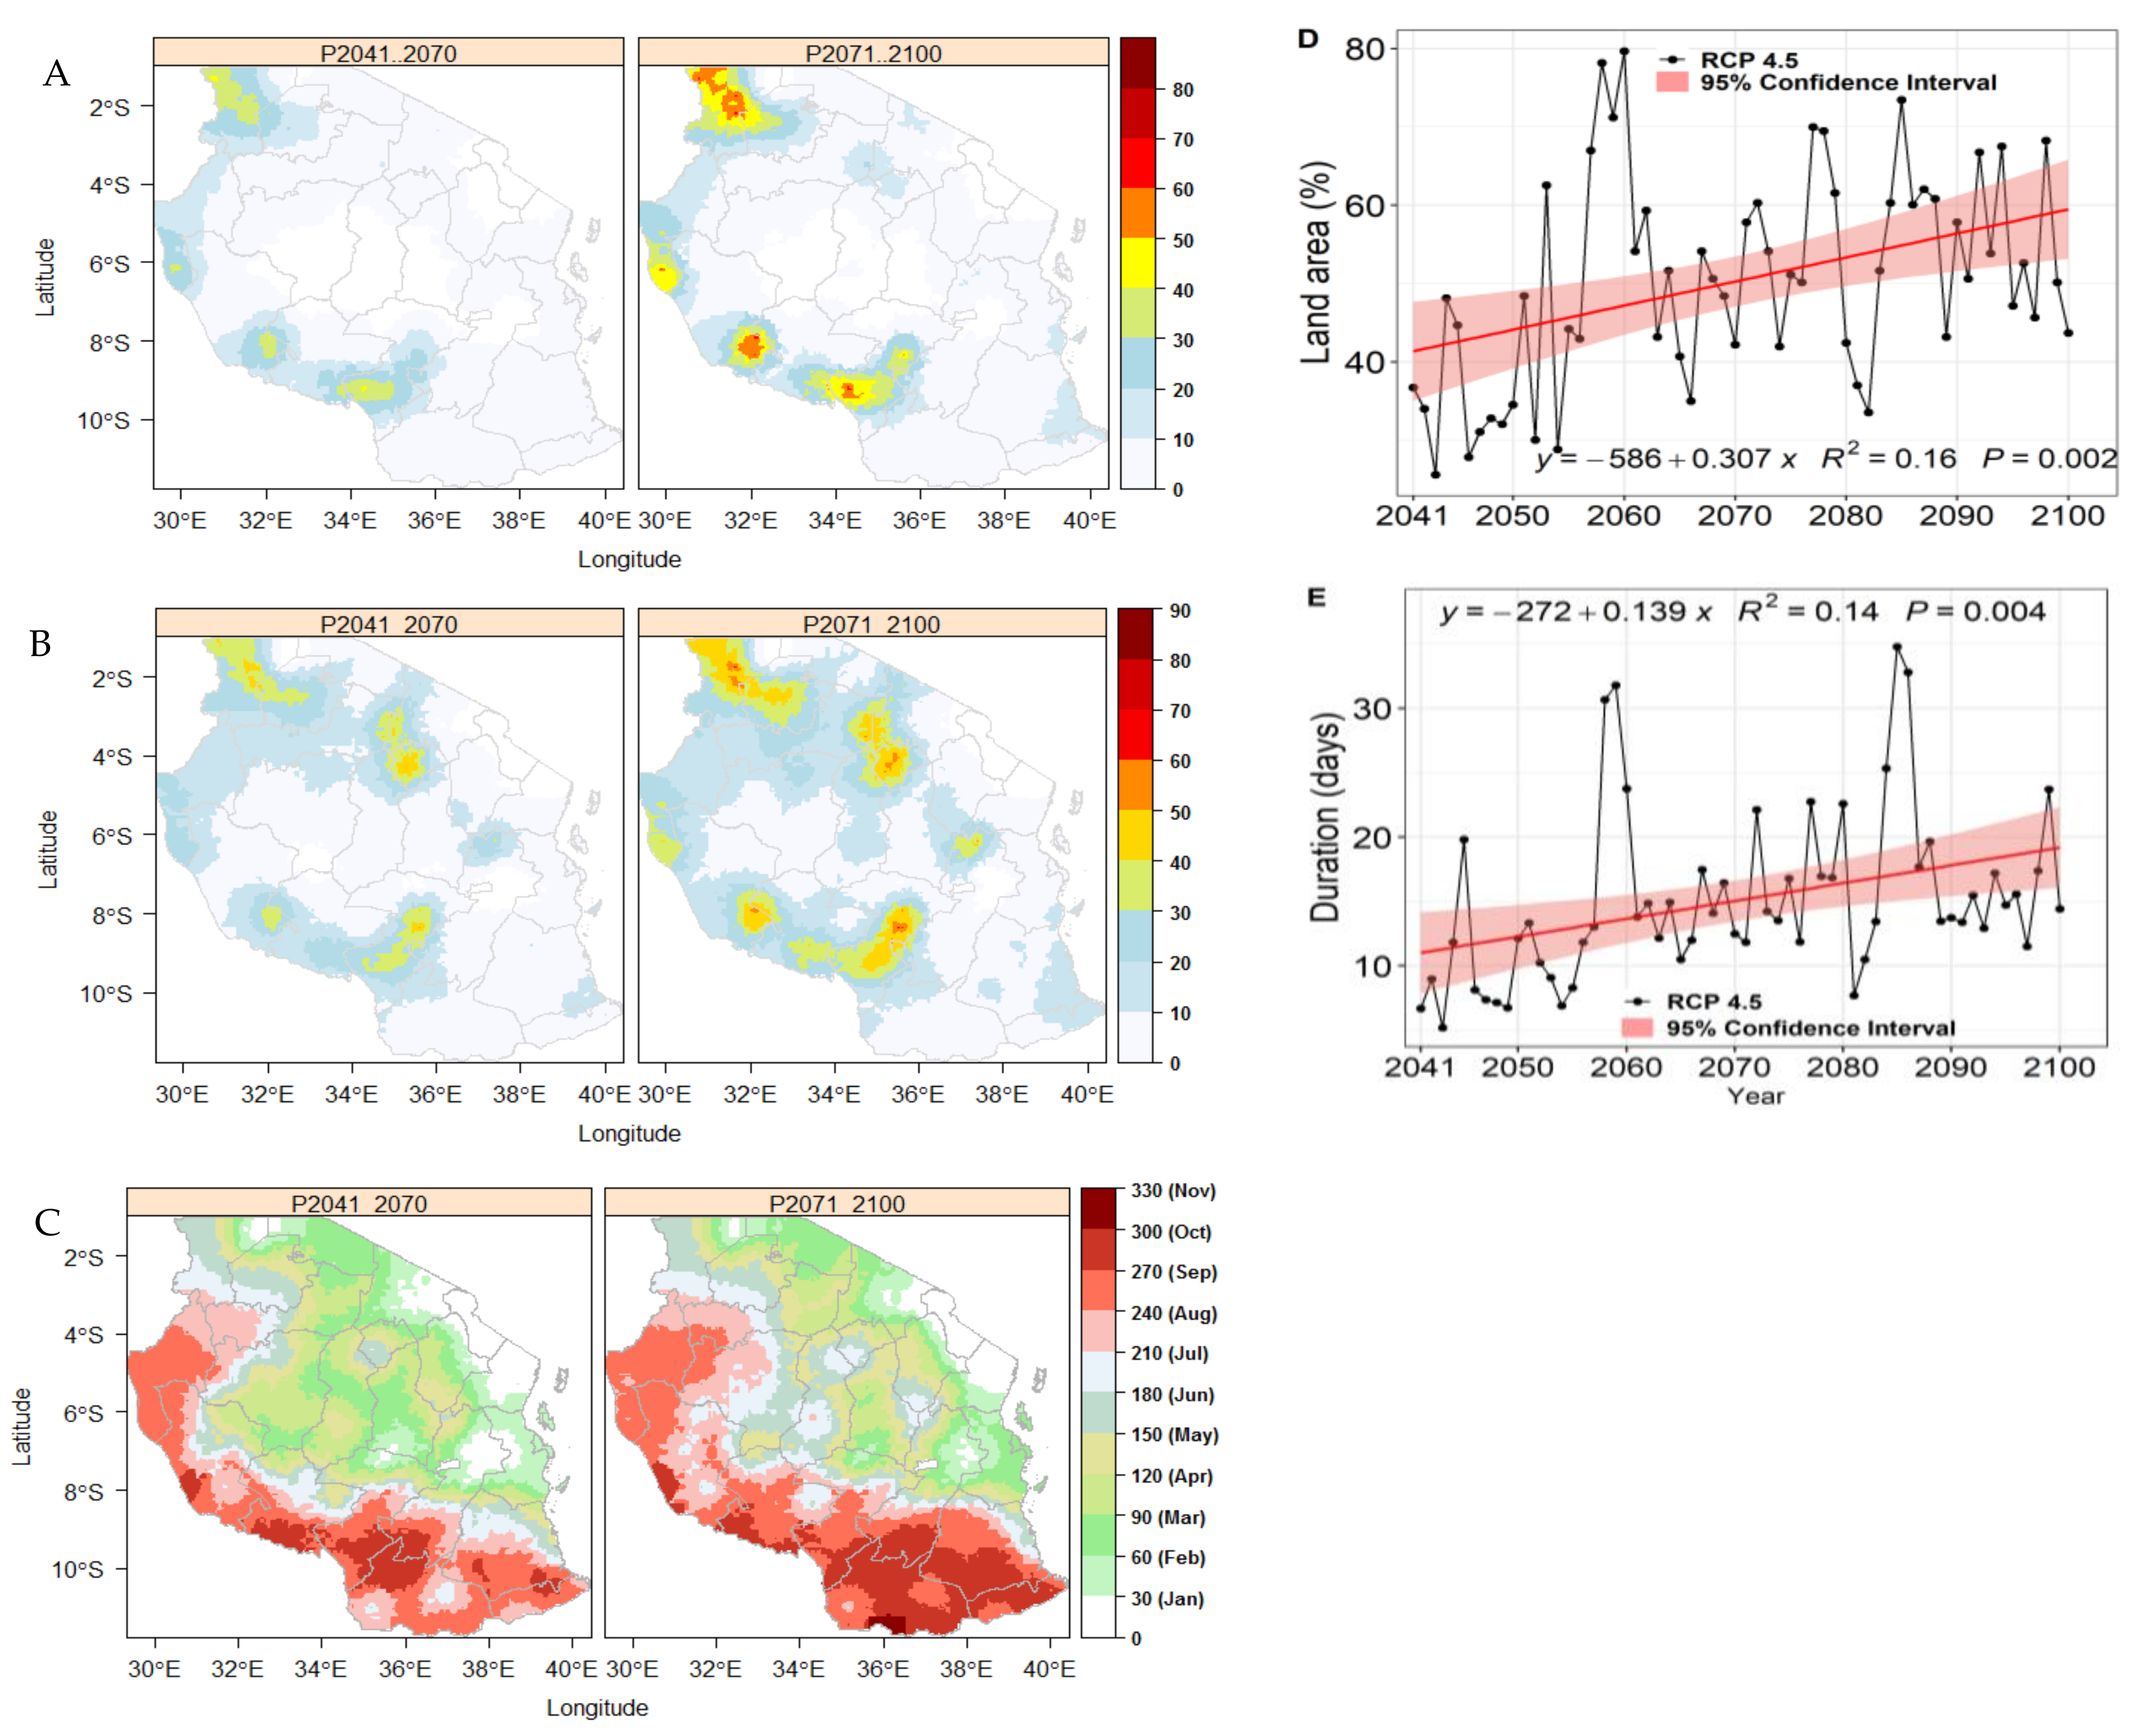
3.3. Spatio-Temporal Evolution of Heatwaves in the 21st Century

For the temporal scale analysis, normal heatwaves (HWMId < 2) were omitted to highlight the occurrence of harmful heatwaves in the 21st century. While the spatial extent of moderate and severe heatwaves may decrease substantially in the 21st century, the upper categories of HWMId (very extreme, super extreme and ultra-extreme heatwaves) are expected to increase rapidly (Figure 7A and the regression analysis in Figure 7B). The slopes of the linear regressions increase with increasing magnitude. The unusual extreme, very extreme and super extreme heatwaves that occurred during the observation period may intensify and be more widespread in the future climate. Higher-level heatwaves (upper categories of HWMId) are expected to be hotter and longer, and may become normal occurrences in Tanzania by mid-century (Figure 7A and Figure 8E). The spatial extent of all HWMId categories is expected to range from 34% to 73% by the end of the 21st century, with durations of 8 to 35 days relative to 1 to 5 days during the reference period (Figure 8D,E).
Our predictions show striking increases in heatwave magnitudes and a substantial expansion of spatial coverage in the 21st century across Tanzania (Figure 8). Most importantly, the heatwave distribution in the 21st century demonstrates a clear spatial contrast compared to the reference climatology. While normal heatwaves (HWMId < 2) occurred in Kigoma, Katavi and the edges of southwestern, western and eastern Tanzania during the reference period, very extreme and super-extreme heatwaves are expected to occur in these areas in the 21st century. The projected heatwave events appear to follow similar spatial patterns as witnessed in 2015 and 2016 (Figure 2). Areas that were relatively cool during the reference period are likely to warm faster during the 21st century. Ambient heatwaves reaching deadly magnitudes (HWMId > 60) are expected in Nbeya by the middle and end of the 21st century. One striking spatial feature is the predicted reduction in heatwaves in central Tanzania and parts of the mountainous areas located in the northeastern highlands.
Noticeably, much longer heatwave durations (>50 days) are anticipated in Nbeya, parts of the Lake Victoria basin and Lake Nyasa during the 21st century (Figure 8B). The starting dates for most predicted heatwaves are during the drier months in Tanzania (October–March), as was the case during the observation period.
Tanzania is therefore likely to experience destructive heatwaves with longer durations during the 21st century. Generally, lower-level heatwaves are expected to be less frequent, while higher-level heatwaves are likely to intensify and occur regularly in Tanzania by 2041. The spatial coverage of heatwaves is predicted to range from 34% to 73% by the end of the 21st century, with durations of 8 to 35 days.

4. Conclusions and Discussion

4.1. Key Findings

In the present study, a CHIRTS high-resolution satellite remotely sensed and station-blended temperature dataset, interpolated to 0.44°, was used to investigate the occurrence of heatwave events during the observation period and the 21st century over Tanzania, using high-resolution multi-modal ensemble of RCP4.5 from CORDEX-Africa. The study was designed to increase the scientific understanding of the magnitude and spatial patterns of heatwaves over Tanzania during the observation period and future climate conditions. The key findings of the study are summarized as follows:
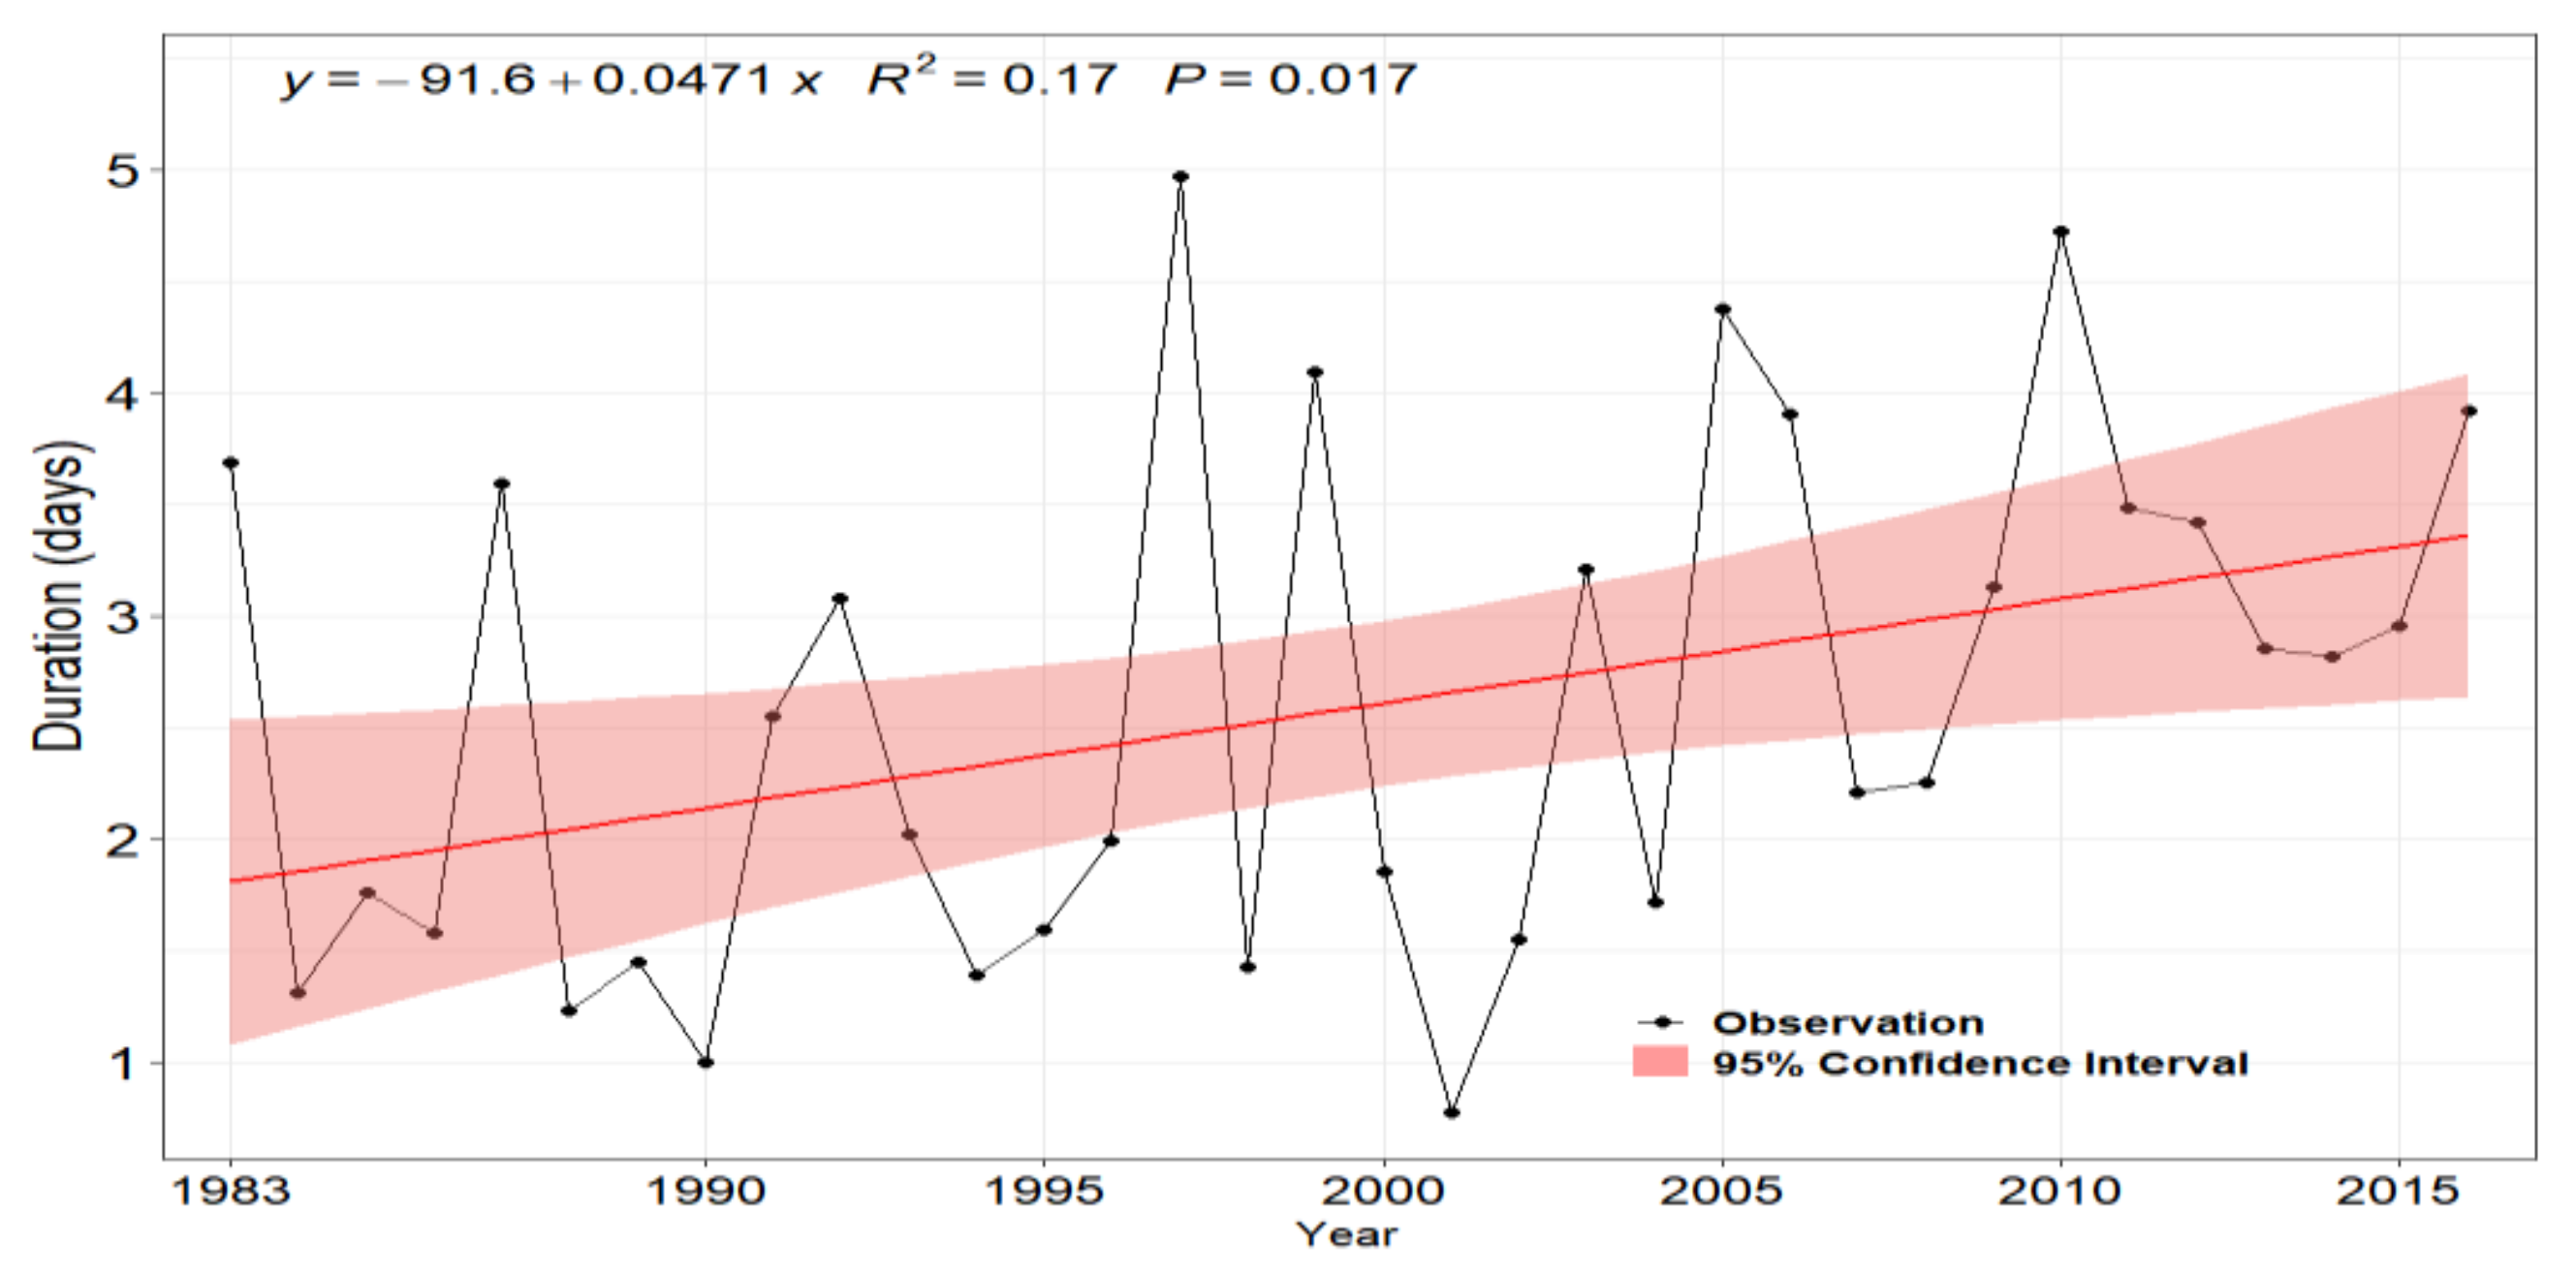
  • Heatwave events increased marginally with time in Tanzania between 1983 and 2016; however, harmful heatwaves including super-extreme and ultra-extreme heatwaves occurred in the country within this period. The highest HWMId peak value of 42 was recorded in 1999, and the duration for all HWMId categories ranged from 1 to 5 days. Extreme heatwaves (defined as 4 ≤ HWMId < 8) characterized the “top ten years” with the highest HWMId peak values; nearly 15% of the total land area of Tanzania was affected in each of these years.
  • The intensity and duration of heatwave events are predicted to increase more rapidly in the 21st century. The highest HWMId peak value may exceed 80, with a duration of 8 to 35 days by the end of the 21st century. While lower-level heatwaves are anticipated to decrease in number by mid-century (2041), higher-level heatwaves such as super-extreme and ultra-extreme heatwaves are expected to be hotter and longer, and occur regularly in Tanzania by 2041.
  • HWMId exhibits different spatial patterns in the 21st century. The heatwave magnitudes vary substantially depending on location. Whereas the mountainous areas of the northeastern highlands could experience cooler conditions, the Lake Victoria basin, parts of Lake Nyasa and the edges of southern, eastern and southwestern Tanzania are predicted to experience frequent lethal heatwaves during the 21st century.

4.2. Discussion of Key Findings

Contrary to the absence of heatwave records for Tanzania in the most updated international disaster database (EM-DAT), our re-evaluation of the data shows that Tanzania experienced moderate to ultra-extreme heatwave events between 1983 and 2016. Although the heatwave frequency and intensity rose only marginally, deadly heatwaves were detected in parts of the country. The HWMId was able to identify the heatwaves in Dar es Salaam, which have been widely reported by the general public and several qualitative studies [45,47]. However, the severity of the heatwaves in Dar es Salaam are lower than the HWMId recorded for other parts of the country in other years. While very extreme heatwaves (8 ≤ HWMId < 16) occurred in Dar es Salaam in 2016, super-extreme (16 ≤ HWMId < 32) and ultra-extreme (HWMId > 32) heatwave events occurred in Kalgera, Mara and other parts of the Lake Victoria basin, particularly in 1999. The excessive heatwaves widely reported in Dar es Salaam may have been amplified by urban design patterns, as suggested by [47]. Dar es Salaam is the fastest growing city in Africa with high exposure to heatwaves. The location of the city in close proximity to the Indian ocean could play a significant role in increasing humidity, increasing the intensity of heatwaves. Because heatwaves are felt more acutely in urban environments [53], other factors such as the high population in Dar es Salaam [81] and the densely-packed low-rise (single-story) buildings with many informal settlements [82] may also contribute to the extremely hot temperatures being experienced in Dar es Salaam. The rest of the country, which is generally hot-arid, experienced moderate to ultra-extreme heatwaves depending on the location. Interestingly, the heatwave events detected in the Mara region of Tanzania confirm a qualitative study carried out by [51] on gold miners within this region. In the study, alarming heat-related illnesses affecting about 69.9% of the ‘open cut’ gold miners were found. Thus, it appears that HWMId is able to detect the most critical heatwaves that occur in Tanzania. The starting date for most of these heatwaves ranges from October to March/April, which coincides with the dry season in Tanzania when humidity is relatively low. As earlier reported by [47], excessive heat occurs in Tanzania during the drier months (October–March).
Intense heatwave events characterized the ten years with the greatest HWMId peak values and spatial extent during the observation period. In particular, the years 1999, 2005, 2010, 2014 and 1997 had the highest HWMId peak values of 41.58, 16.99, 16.67, 15.9 and 14.9, respectively, while 1983 had the largest spatial extent of about 45% of the land area. Higher heatwave magnitudes appear to coincide with drought years in Tanzania, when humidity is often relatively low; for example, devastating droughts occurred throughout the entire East African region in 1983 [83,84]. Tanzania again endured severe droughts in 1999–2005 [85], and also in 2010 [86]. The unique dangers associated with extraordinary heatwaves are thus less apparent when higher-level heatwaves are coincident with droughts. Compared to the European summer’s highest HWMId of 24–36 [70], the highest HWMId recorded in Tanzania from 1983–2016 is 42 (in 1999). In Nigeria, the highest HWMId peak value of 32 was recorded in 1990 [34]. In a recent study by [71] in Kenya, the highest HWMId peak value of 22.64 was recorded in 2015. The harmful heatwaves recorded in Tanzania are likely to intensify as greenhouse gases continue to increase over time.
In contrast to the marginal rising trends in heatwave intensity and duration during reference period, Tanzania is likely to experience rapid intensification of heatwave events during the 21st century. Higher-level heatwaves are projected to be significantly more frequent, and may occur regularly in the affected areas by 2041. This finding agrees with [36], who projected that the unusual heatwaves experienced under past and present climates would intensify and occur on a regular basis in Africa by 2040. The number of very warm days are projected to increase by over 80% in some parts of Africa, especially in the drier months (JFM) [33]. In South Africa, the number of heatwave events is expected to rise sharply in the 21st century and could increase by 10 events over the baseline period (1983–2012) [27]. According to a report from the Tanzania Climate Risk Profile, the number of very hot days (days with daily maximum temperature of above 35 °C) is expected to rise sharply with high certainty during the 21st century. Using a multi-model median scenario (RCP6.0), the number of very hot days over the entire country is projected to increase by 6, 11 and 22 more days per year by 2030, 2050 and 2080, respectively; and could reach 100 days per year in some parts of the country [87]. The heatwave magnitudes presented in this study using multi-modal median scenarios (RCP4.5) therefore represent a reasonable likelihood prediction of heatwave features in the 21st century in Tanzania. Importantly, the likely increase in higher-level heatwaves in critical areas such as the Lake Victoria basin (where the Mara Gold Mine is located), and the southern and western regions of Tanzania require increased attention to heat-adaptation preparedness
A key observation is the contrast in predicted spatial patterns of heatwaves in the 21st century with those in the reference period (1983–2012). The extreme edges of southwestern and western parts of the country, which were cooler during the reference period, could warm more rapidly in the future climate. This was also noted by [88], who projected that the highest increase in maximum temperature (greater than 3.5 °C) would occur in the western, southwestern and eastern parts of Tanzania in the 21st century, relative to the 1971–2000 baseline. Generally, severe warming is expected in cooler areas, particularly in semi-arid regions [88,89,90]. In addition, while ultra-extreme heatwave events are predicted to occur in the Lake Victoria basin, parts of Lake Nyasa and the edges of the southern, eastern and southwestern parts of Tanzania, the northeastern highlands appear insulated from the projected heat hazard. The high mountains and thick vegetation cover could produce a cooler microclimate that mitigates heatwaves.
The rising intensity of heatwaves across Tanzania may not only result in morbidity and mortality crises [51], but may also have direct and spillover effects on the agricultural sector. Previous studies have reported dramatic impacts of intense heatwaves on crop production in Tanzania as temperatures soar above critical physiological thresholds [41,43]. The 2003 European heatwaves and the 2010 Russian heatwaves, which, on average, were described as extreme heatwaves (using HWMI) [13], had serious impacts on crop production; for example, crop production in Russia dropped by 25–30% due to severe wilting [91], and primary productivity decreased sharply by 30% in Europe as a result of the ambient heat [92]. In Tanzania, critical national projects such as the Southern Agricultural Growth Corridor of Tanzania (SAGCOT) and the Central Corridor of Tanzania, which are mainly located in the southern, central and south-western parts of the country, are at risk of lethal heatwaves under future climate conditions. The rapid increase in deadly heatwaves in these food-producing corridors may result in food security challenges in the future. Adopting heat-resilient crop production technologies is crucial to adapt to future heat risk.
Although an ensemble of moderate scenarios was adopted in this study, just one RCM was driven with GCMs; the uncertainty in the results due to intermodal variability could be reduced if more runs were added to the matrix. Moreover, bias correction was limited to 23 years rather than 30 years, because the CHIRTS-daily reference dataset extends from 1983 to 2016, while the observational record from CORDEX ranges from 1951 to 2005. There could be some changes in the results for the tail end of the century if the entire dataset was bias-corrected. Future work could focus on hot and humid Dar es Salaam by considering humidity as part of the metrics. Finally, a larger intermodal matrix involving comprehensive RCP scenarios could be considered for the analysis.

Author Contributions

Conceptualization, A.G. and M.A.; methodology, A.G. and M.A.; software, A.G., M.A. and R.X.S.T.; formal analysis, A.G; resources, Y.X.; data curation, A.G., L.Z. and T.D.; writing—original draft preparation, A.G.; resources, Y.X.; supervision, Y.X. All authors have read and agreed to the published version of the manuscript.

Funding

This research was funded by UK GCRF project of Development Corridors Partnership (Subcontract number: CON 2395-CAAS-19-7557, Advancing Capacity on Climate-resilient Development Corridors in East Africa).

Data Availability Statement

The data that support the findings of this study are openly available on: Climate Hazards Center data portal. https://0-doi-org.brum.beds.ac.uk/10.15780/G2008H.CORDEX-Africa data portal. http://wcrp-cordex.ipsl.jussieu.fr/, accessed on 28 July 2021.

Acknowledgments

We are grateful to our research team in CAAS and all DCP members in UK and Tanzania. Thanks to all the anonymous reviewers.

Conflicts of Interest

The authors declare no conflict of interest.

References

  1. Sherwood, S.C.; Huber, M. An adaptability limit to climate change due to heat stress. Proc. Natl. Acad. Sci. USA 2010, 107, 9552–9555. [Google Scholar] [CrossRef] [Green Version]
  2. FAO. Rapid Agriculture Needs Assessment in Response to the ‘El-Niño’ Effects in the United Republic of Tanzania; Food and Agriculture Organization of the United Nations: Rome, Italy, 2016. [Google Scholar]
  3. IPCC. Climate Change 2014: Synthesis Report. Contribution of Working Groups I, II and III to the Fifth Assessment Report of the Intergovernmental Panel on Climate Change; Core Writing Team, Pachauri, R.K., Meyer, L.A., Eds.; IPCC: Geneva, Switzerland, 2014; p. 151. [Google Scholar]
  4. Coumou, D.; Rahmstorf, S. A decade of weather extremes. Nat. Clim. Chang. 2012, 2, 491–496. [Google Scholar] [CrossRef]
  5. Meehl, G.A. More Intense, More Frequent, and Longer Lasting Heat Waves in the 21st Century. Science 2004, 305, 994–997. [Google Scholar] [CrossRef] [Green Version]
  6. Glaser, J.; Lemery, J.; Rajagopalan, B.; Diaz, H.F.; García-Trabanino, R.; Taduri, G.; Madero, M.; Amarasinghe, M.; Abraham, G.; Anutrakulchai, S.; et al. Climate Change and the Emergent Epidemic of CKD from Heat Stress in Rural Communities: The Case for Heat Stress Nephropathy. Clin. J. Am. Soc. Nephrol. 2016, 11, 1472–1483. [Google Scholar] [CrossRef] [PubMed] [Green Version]
  7. Mora, C.; Dousset, B.; Caldwell, I.R.; Powell, F.E.; Geronimo, R.C.; Bielecki, C.R.; Counsell, C.W.W.; Dietrich, B.S.; Johnston, E.T.; Louis, L.; et al. Global risk of deadly heat. Nat. Clim. Chang. 2017, 7, 501–506. [Google Scholar] [CrossRef]
  8. CRED. Economic Losses, Poverty and Disasters 1998–2017; Centre for Research on the Epidemiology of Disasters (CRED): Brussels, Belgium; UNISDR: Geneva, Switzerland, 2017. [Google Scholar]
  9. Habeeb, D.; Vargo, J.; Stone, B. Rising heat wave trends in large US cities. Nat. Hazards 2015, 76, 1651–1665. [Google Scholar] [CrossRef]
  10. Zander, K.; Botzen, W.J.W.; Oppermann, E.; Kjellstrom, T.; Garnett, S.T. Heat stress causes substantial labour productivity loss in Australia. Nat. Clim. Chang. 2015, 5, 647–651. [Google Scholar] [CrossRef]
  11. Nairn, J.; Fawcett, R. Defining Heatwaves: Heatwave Defined as a Heat-Impact Event Servicing All Community and Business Sectors in Australia; Technical Report no. 060; The Centre for Australian Weather and Climate Research: Melbourne, VIC, Australia, 2013. [Google Scholar]
  12. Robine, J.-M.; Cheung, S.L.K.; Le Roy, S.; Van Oyen, H.; Griffiths, C.; Michel, J.-P.; Herrmann, F. Death toll exceeded 70,000 in Europe during the summer of 2003. Comptes Rendus Biol. 2008, 331, 171–178. [Google Scholar] [CrossRef]
  13. Hoag, H. Russian summer tops ’universal’ heatwave index. Nature 2014. [Google Scholar] [CrossRef]
  14. Sun, X.; Sun, Q.; Yang, M.; Zhou, X.; Li, X.; Yu, A.; Geng, F.; Guo, Y. Effects of temperature and heat waves on emergency department visits and ambulance dispatches in Pudong New Area, China: A time series analysis. Environ. Health 2014, 13, 76. [Google Scholar] [CrossRef] [Green Version]
  15. Saeed, F.; Salik, K.M.; Ishfaq, S. Climate Induced Rural-to-Urban Migration in Pakistan’ Pathways to Resilience in Semi-Arid Economies (PRISE) Working Paper. 2015. Available online: http://prise.odi.org/research/climateinduced-rural-to-urban-migration-in-pakistan/ (accessed on 28 July 2021).
  16. Rohini, P.; Rajeevan, M.; Srivastava, A.K. On the Variability and Increasing Trends of Heat Waves over India. Sci. Rep. 2016, 6, 26153. [Google Scholar] [CrossRef] [Green Version]
  17. Chakraborty, D.; Sehgal, V.K.; Dhakar, R.; Ray, M.; Das, D.K. Spatio-temporal trend in heat waves over India and its impact assessment on wheat crop. Theor. Appl. Climatol. 2019, 138, 1925–1937. [Google Scholar] [CrossRef]
  18. Pai, D.S.; Nair, S.A.; Ramanathan, A.N. Long term climatology and trends of heat waves over India during the recent 50 years (1961–2010). Mausam 2012, 64, 585–604. [Google Scholar]
  19. Saeed, F.; Almazroui, M.; Islam, N.; Khan, M.S. Intensification of future heat waves in Pakistan: A study using CORDEX regional climate models ensemble. Nat. Hazards 2017, 87, 1635–1647. [Google Scholar] [CrossRef]
  20. Alahmad, B.; Shakarchi, A.F.; Khraishah, H.; Alseaidan, M.; Gasana, J.; Al-Hemoud, A.; Koutrakis, P.; Fox, M.A. Extreme temperatures and mortality in Kuwait: Who is vulnerable? Sci. Total Environ. 2020, 732, 139289. [Google Scholar] [CrossRef]
  21. Wang, S.S.; Kim, H.; Coumou, D.; Yoon, J.; Zhao, L.; Gillies, R.R. Consecutive extreme flooding and heat wave in Japan: Are they becoming a norm? Atmos. Sci. Lett. 2019, 20, 2–5. [Google Scholar] [CrossRef] [Green Version]
  22. Mohammed, S.; Zhao, J.; Fang, S. Impacts of climate change on net primary productivity in Africa continent from 2001 to 2010. Int. J. Sci. Environ. Technol. 2018, 7, 365–381. [Google Scholar]
  23. Herold, N.; Alexander, L.; Green, D.; Donat, M. Greater increases in temperature extremes in low versus high income countries. Environ. Res. Lett. 2017, 12, 034007. [Google Scholar] [CrossRef] [Green Version]
  24. Harrington, L.J.; Otto, F.E.L. Reconciling theory with the reality of African heatwaves. Nat. Clim. Chang. 2020, 10, 796–798. [Google Scholar] [CrossRef]
  25. EM-DAT. The International Disaster Database. Available online: https://public.emdat.be/mapping (accessed on 25 March 2021).
  26. Ceccherini, G.; Russo, S.; Ameztoy, I.; Marchese, A.F.; Carmona-Moreno, C. Heat waves in Africa 1981–2015, observations and reanalysis. Nat. Hazards Earth Syst. Sci. 2017, 17, 115–125. [Google Scholar] [CrossRef] [Green Version]
  27. Mbokodo, I.; Bopape, M.-J.; Chikoore, H.; Engelbrecht, F.; Nethengwe, N. Heatwaves in the Future Warmer Climate of South Africa. Atmosphere 2020, 11, 712. [Google Scholar] [CrossRef]
  28. Ahram Online: Egypt’s Heatwave Death Toll Reaches 110. Thursday 20 August 2015. Available online: https://english.ahram.org.eg/NewsContent/1/0/138329/Egypt/Egypts-heatwave-death-toll-reaches--.aspx (accessed on 28 July 2021).
  29. Hafez, Y.Y.; Almazroui, M. Study of the relationship between African ITCZ variability and an extreme heat wave on Egypt in summer 2015. Arab. J. Geosci. 2016, 9, 476. [Google Scholar] [CrossRef]
  30. Vizy, E.K.; Cook, K.H. Mid-Twenty-First-Century Changes in Extreme Events over Northern and Tropical Africa. J. Clim. 2012, 25, 5748–5767. [Google Scholar] [CrossRef]
  31. Fontaine, B.; Janicot, S.; Monerie, P.-A. Recent changes in air temperature, heat waves occurrences, and atmospheric circulation in Northern Africa. J. Geophys. Res. Atmos. 2013, 118, 8536–8552. [Google Scholar] [CrossRef]
  32. Garland, R.M.; Matooane, M.; Engelbrecht, F.A.; Bopape, M.-J.; Landman, W.A.; Naidoo, M.; Van Der Merwe, J.; Wright, C.Y. Regional Projections of Extreme Apparent Temperature Days in Africa and the Related Potential Risk to Human Health. Int. J. Environ. Res. Public Health 2015, 12, 12577–12604. [Google Scholar] [CrossRef]
  33. Dosio, A. Projection of temperature and heat waves for Africa with an ensemble of CORDEX Regional Climate Models. Clim. Dyn. 2017, 49, 493–519. [Google Scholar] [CrossRef] [Green Version]
  34. Ragatoa, D.S.; Ogunjobi, K.O.; Klutse, N.A.B.; Okhimamhe, A.A.; Eichie, J.O. A change comparison of heat wave aspects in climatic zones of Nigeria. Environ. Earth Sci. 2019, 78, 1–16. [Google Scholar] [CrossRef]
  35. Naik, M.; Abiodun, B.J. Projected changes in drought characteristics over the Western Cape, South Africa. Meteorol. Appl. 2020, 27, 1–14. [Google Scholar] [CrossRef] [Green Version]
  36. Russo, S.; Marchese, A.F.; Sillmann, J.; Immé, G. When will unusual heat waves become normal in a warming Africa? Environ. Res. Lett. 2016, 11, 054016. [Google Scholar] [CrossRef]
  37. Gasparrini, A.; Guo, Y.; Hashizume, M.; Lavigne, E.; Zanobetti, A.; Schwartz, J.; Tobías, A.; Tong, S.; Rocklöv, J.; Forsberg, B.; et al. Mortality risk attributable to high and low ambient temperature: A multicountry observational study. Lancet 2015, 386, 369–375. [Google Scholar] [CrossRef]
  38. Prenatal Exposure to Heat Waves and Child Health in Sub-Saharan Africa. Available online: https://www.iza.org/publications/dp/14424/prenatal-exposure-to-heat-waves-and-child-health-in-sub-saharan-africa (accessed on 28 July 2021).
  39. Green, H.; Bailey, J.; Schwarz, L.; Vanos, J.; Ebi, K.; Benmarhnia, T. Impact of heat on mortality and morbidity in low and middle income countries: A review of the epidemiological evidence and considerations for future research. Environ. Res. 2019, 171, 80–91. [Google Scholar] [CrossRef] [PubMed]
  40. Ahmadalipour, A.; Moradkhani, H. Escalating heat-stress mortality risk due to global warming in the Middle East and North Africa (MENA). Environ. Int. 2018, 117, 215–225. [Google Scholar] [CrossRef]
  41. Challinor, A.J.; Koehler, A.-K.; Ramirez-Villegas, J.; Whitfield, S.; Das, B. Current warming will reduce yields unless maize breeding and seed systems adapt immediately. Nat. Clim. Chang. 2016, 6, 954–958. [Google Scholar] [CrossRef]
  42. Battisti, D.S.; Rosamond, L.N. Historical warnings of future food insecurity with unprecedented seasonal Heat. Science 2009, 323, 240–245. [Google Scholar] [CrossRef] [Green Version]
  43. Rowhani, P.; Lobell, D.; Linderman, M.; Ramankutty, N. Climate variability and crop production in Tanzania. Agric. For. Meteorol. 2011, 151, 449–460. [Google Scholar] [CrossRef]
  44. Gourdji, S.M.; Sibley, A.M.; Lobell, D. Global crop exposure to critical high temperatures in the reproductive period: Historical trends and future projections. Environ. Res. Lett. 2013, 8, 024041. [Google Scholar] [CrossRef]
  45. Pasquini, L.; van Aardenne, L.; Godsmark, C.N.; Lee, J.; Jack, C. Emerging climate change-related public health challenges in Africa: A case study of the heat-health vulnerability of informal settlement residents in Dar es Salaam, Tanzania. Sci. Total Environ. 2020, 747, 141355. [Google Scholar] [CrossRef]
  46. Shemdoe, R.S. Tracking effective indigenous adaptation strategies on impacts of climate variability on food security and health of subsistence farmers in Tanzania. Afr. Portal 2011, 4, 34. [Google Scholar]
  47. Ndetto, E.L.; Matzarakis, A. Assessment of human thermal perception in the hot-humid climate of Dar es Salaam, Tanzania. Int. J. Biometeorol. 2016, 61, 69–85. [Google Scholar] [CrossRef]
  48. National Adaptation Programme of Action (NAPA). Available online: https://unfccc.int/resource/docs/napa/moz01.pdf (accessed on 28 July 2021).
  49. National Climate Change Strategy. Available online: https://www.nccs.gov.sg/media/publications/national-climate-change-strategy (accessed on 28 July 2021).
  50. Chang’A, L.B.; Kijazi, A.L.; Luhunga, P.M.; Ng’Ongolo, H.K.; Mtongor, H.I. Spatial and Temporal Analysis of Rainfall and Temperature Extreme Indices in Tanzania. Atmos. Clim. Sci. 2017, 7, 525–539. [Google Scholar] [CrossRef] [Green Version]
  51. Meshi, E.; Kishinhi, S.S.; Mamuya, S.H.; Rusibamayila, M.G. Thermal Exposure and Heat Illness Symptoms among Workers in Mara Gold Mine, Tanzania. Ann. Glob. Health 2018, 84, 360–368. [Google Scholar] [CrossRef] [Green Version]
  52. Gebrechorkos, S.H.; Hülsmann, S.; Bernhofer, C. Changes in temperature and precipitation extremes in Ethiopia, Kenya, and Tanzania. Int. J. Climatol. 2019, 39, 18–30. [Google Scholar] [CrossRef] [Green Version]
  53. Filho, W.L. Handbook of Climate Change Adaptation; Springer: Berlin/Heidelberg, Germany, 2015. [Google Scholar]
  54. Donat, M.; Alexander, L.; Yang, H.; Durre, I.; Vose, R.S.; Caesar, J. Global Land-Based Datasets for Monitoring Climatic Extremes. Bull. Am. Meteorol. Soc. 2013, 94, 997–1006. [Google Scholar] [CrossRef] [Green Version]
  55. Funk, C.; Peterson, P.; Peterson, S.; Shukla, S.; Davenport, F.; Michaelsen, J.; Knapp, K.R.; Landsfeld, M.; Husak, G.; Harrison, L. A High-resolution 1983–2016 tmax climate data record based on infrared temperatures and stations by the climate hazard center. J. Clim. 2019, 32, 5639–5658. [Google Scholar] [CrossRef]
  56. Yang, W.; Seager, R.; Cane, M.A.; Lyon, B. The Annual Cycle of East African Precipitation. J. Clim. 2015, 28, 2385–2404. [Google Scholar] [CrossRef] [Green Version]
  57. Schär, C.; Jendritzky, G. Climate change: Hot news from summer 2003. Nature 2004, 432, 559–560. [Google Scholar] [CrossRef]
  58. Alexander, L.V.; Zhang, X.; Peterson, T.C.; Caesar, J.; Gleason, B.; Tank, A.M.G.K.; Haylock, M.; Collins, D.; Trewin, B.; Rahimzadeh, F.; et al. Global observed changes in daily climate extremes of temperature and precipitation. J. Geophys. Res. Phys. 2006, 111, 1–22. [Google Scholar] [CrossRef] [Green Version]
  59. Klein Tank, A.M.G.; Zwiers, F.W.; Zhang, X. Guidelines on Analysis of Extremes in a Changing Climate in Support of Informed Decisions for Adaptation; World Meteorological Organization: Geneva, Switzerland, 2009. [Google Scholar]
  60. Sen, S.R. The impact of the positive Indian Ocean dipole on Zimbabwe droughts tropical climate is understood to be dominated by. Int. J. Climatol. 2008, 28, 2011–2029. [Google Scholar] [CrossRef]
  61. Seneviratne, S.; Donat, M.; Mueller, B.; Alexander, L. No pause in the increase of hot temperature extremes. Nat. Clim. Chang. 2014, 4, 161–163. [Google Scholar] [CrossRef]
  62. Tao, H.; Fraedrich, K.; Menz, C.; Zhai, J. Trends in extreme temperature indices in the Poyang Lake Basin, China. Stoch. Environ. Res. Risk Assess. 2014, 28, 1543–1553. [Google Scholar] [CrossRef]
  63. Orlowsky, B.; Seneviratne, S.I. Global changes in extreme events: Regional and seasonal dimension. Clim. Chang. 2011, 110, 669–696. [Google Scholar] [CrossRef] [Green Version]
  64. Russo, S.; Sterl, A. Global changes in indices describing moderate temperature extremes from the daily output of a climate model. J. Geophys. Res. Space Phys. 2011, 116, 1–12. [Google Scholar] [CrossRef]
  65. Sillmann, J.; Kharin, V.V.; Zwiers, F.W.; Zhang, X.; Bronaugh, D. Climate extremes indices in the CMIP5 multimodel ensemble: Part 2. Future climate projections. J. Geophys. Res. Atmos. 2013, 118, 2473–2493. [Google Scholar] [CrossRef]
  66. ETCCDI Climate Change Indices. Available online: http://etccdi.pacificclimate.org/list_27_indices.shtml (accessed on 25 December 2020).
  67. Russo, S.; Dosio, A.; Graversen, R.G.; Sillmann, J.; Carrao, H.; Dunbar, M.B.; Singleton, A.; Montagna, P.; Barbola, P.; Vogt, J. Magnitude of extreme heat waves in present climate and their projection in a warming world. J. Geophys. Res. Atmos. 2014, 119, 500–512. [Google Scholar] [CrossRef] [Green Version]
  68. IPCC. Managing the Risks of Extreme Events and Disasters to Advance Climate Change Adaptation. In A Special Report of Working Groups I and II of the Intergovernmental Panel on Climate Change; Field, C.B., Barros, V., Stocker, T.F., Dahe, Q., Eds.; Cambridge University Press: Cambridge, UK; New York, NY, USA, 2012; p. 52. [Google Scholar]
  69. Nairn, J.R.; Fawcett, R.J.B. The Excess Heat Factor: A Metric for Heatwave Intensity and Its Use in Classifying Heatwave Severity. Int. J. Environ. Res. Public Health 2014, 12, 227–253. [Google Scholar] [CrossRef] [Green Version]
  70. Russo, S.; Sillmann, J.; Fischer, E.M. Top ten European heatwaves since 1950 and their occurrence in the coming decades. Environ. Res. Lett. 2015, 10, 124003. [Google Scholar] [CrossRef]
  71. Amou, M.; Gyilbag, A.; Demelash, T.; Xu, Y. Heatwaves in Kenya 1987–2016: Facts from CHIRTS High Resolution Satellite Remotely Sensed and Station Blended Temperature Dataset. Atmosphere 2020, 12, 37. [Google Scholar] [CrossRef]
  72. Borhara, K.; Pokharel, B.; Bean, B.; Deng, L.; Wang, S.Y.S. On Tanzania’s precipitation climatology, variability, and future projection. Climate 2020, 8, 34. [Google Scholar] [CrossRef] [Green Version]
  73. Kijazi, A.L.; Reason, C.J.C. Analysis of the 2006 floods over northern Tanzania. Int. J. Climatol. 2009, 29, 955–970. [Google Scholar] [CrossRef]
  74. Chang’a, L.B.; Yanda, P.Z.; Ngana, J. Spatial and temporal analysis of recent climatological data in Tanzania. J. Geogr. Reg. Plan. 2010, 3, 44–65. [Google Scholar]
  75. Verdin, A.; Funk, C.; Peterson, P.; Landsfeld, M.; Tuholske, C.; Grace, K. Development and validation of the CHIRTS-daily quasi-global high-resolution daily temperature data set. Sci. Data 2020, 7, 1–14. [Google Scholar] [CrossRef]
  76. Arora, V.K.; Scinocca, J.F.; Boer, G.J.; Christian, J.R.; Denman, K.L.; Flato, G.M.; Kharin, V.V.; Lee, W.; Merryfield, W.J. Carbon emission limits required to satisfy future representative concentration pathways of greenhouse gases. Geophys. Res. Lett. 2011, 38, 3–8. [Google Scholar] [CrossRef]
  77. Bentsen, M.; Bethke, I.; Debernard, J.B.; Iversen, T.; Kirkev, A.; Seland, Ø.; Drange, H.; Roelandt, C.; Seierstad, I.A.; Hoos, C.; et al. The Norwegian Earth System Model, NorESM1-M—Part 1: Description and basic evaluation of the physical climate. Geosci. Model Dev. 2013, 6, 687–720. [Google Scholar] [CrossRef] [Green Version]
  78. Teutschbein, C.; Seibert, J. Regional Climate Models for Hydrological Impact Studies at the Catchment Scale: A Review of Recent Modeling Strategies. Geogr. Compass 2010, 4, 834–860. [Google Scholar] [CrossRef] [Green Version]
  79. Ning, L.; Riddle, E.E.; Bradley, R.S. Projected Changes in Climate Extremes over the Northeastern United States. J. Clim. 2015, 28, 3289–3310. [Google Scholar] [CrossRef] [Green Version]
  80. Werner, A.T.; Cannon, A. Hydrologic extremes—An intercomparison of multiple gridded statistical downscaling methods. Hydrol. Earth Syst. Sci. 2016, 20, 1483–1508. [Google Scholar] [CrossRef] [Green Version]
  81. Ndetto, E.L.; Matzarakis, A. Basic analysis of climate and urban bioclimate of Dar es Salaam, Tanzania. Theor. Appl. Clim. 2013, 114, 213–226. [Google Scholar] [CrossRef]
  82. Ndetto, E.L.; Matzarakis, A. Urban atmospheric environment and human biometeorological studies in Dar es Salaam, Tanzania. Air Qual. Atmos. Health 2014, 8, 175–191. [Google Scholar] [CrossRef]
  83. Masih, I.; Maskey, S.; Mussá, F.E.F.; Trambauer, P. A review of droughts on the African continent: A geospatial and long-term perspective. Hydrol. Earth Syst. Sci. 2014, 18, 3635–3649. [Google Scholar] [CrossRef] [Green Version]
  84. Vicente-Serrano, S.M.; Beguería, S.; Gimeno, L.; Eklundh, L.; Giuliani, G.; Weston, D.; El Kenawy, A.; López-Moreno, J.; Nieto, R.; Ayenew, T.; et al. Challenges for drought mitigation in Africa: The potential use of geospatial data and drought information systems. Appl. Geogr. 2012, 34, 471–476. [Google Scholar] [CrossRef] [Green Version]
  85. Kijazi, A.; Reason, C. Analysis of the 1998 to 2005 drought over the northeastern highlands of Tanzania. Clim. Res. 2009, 38, 209–223. [Google Scholar] [CrossRef] [Green Version]
  86. Drought Conditions and Management Strategies in Tanzania. Available online: https://www.droughtmanagement.info/literature/UNW-DPC_NDMP_Country_Report_Tanzania_2014.pdf (accessed on 28 July 2021).
  87. Tomalka, J.; Lange, S.; Röhrig, F.; Gornott, C. Climate Risk Profile: Tanzania Summary. Federal Ministry for Economic Cooperation and Development (BMZ). 2020. Available online: https://www.climate.gov/news-features/blogs/beyond-data/climate-change-rule-thumb-cold-things-warming-faster-warm-things (accessed on 28 July 2021).
  88. Luhunga, P.M.; Kijazi, A.L.; Chang’A, L.; Kondowe, A.; Ng’Ongolo, H.; Mtongori, H. Climate Change Projections for Tanzania Based on High-Resolution Regional Climate Models from the Coordinated Regional Climate Downscaling Experiment (CORDEX)-Africa. Front. Environ. Sci. 2018, 6, 1–20. [Google Scholar] [CrossRef] [Green Version]
  89. Arndt, D. Climate Change Rule of Thumb: Cold “Things” Warming Faster than Warm Things. 2015. Available online: https://www.climate.gov/print/806251 (accessed on 28 July 2021).
  90. Huang, J.; Guan, X.; Ji, F. Enhanced cold-season warming in semi-arid regions. Atmos. Chem. Phys. Discuss. 2012, 12, 5391–5398. [Google Scholar] [CrossRef] [Green Version]
  91. Barriopedro, D.; Fischer, E.M.; Luterbacher, J.; Trigo, R.M.; García-Herrera, R. The Hot Summer of 2010: Redrawing the Temperature Record Map of Europe. Science 2011, 332, 220–224. [Google Scholar] [CrossRef] [Green Version]
  92. Ciais, P.; Reichstein, M.; Viovy, N.; Granier, A.; Ogée, J.; Allard, V.; Aubinet, M.; Buchmann, N.; Bernhofer, C.; Carrara, A.; et al. Europe-wide reduction in primary productivity caused by the heat and drought in 2003. Nature 2005, 437, 529–533. [Google Scholar] [CrossRef] [PubMed]
Figure 1. Heatwave climatology over Tanzania, from 1983 to 2012: (A) heatwave magnitude index daily (HWMId) and (B) heatwave duration (HWD).
Atmosphere 12 01026 g001
Figure 2. Recent patterns of heatwave events: spatial distribution of absolute values for 2015 and 2016 (top layer) and their changes (bottom layer) relative to the reference period (upper left).
Atmosphere 12 01026 g002
Figure 3. Duration of heatwave events that occurred in the observation period (1983–2016) over Tanzania.
Atmosphere 12 01026 g003
Figure 4. Spatial distribution of top 10 heatwaves in Tanzania, from 1983 to 2016.
Atmosphere 12 01026 g004
Figure 5. Duration of heatwave events of Figure 4.
Atmosphere 12 01026 g005
Figure 6. Starting date of heatwave events of Figure 4.
Atmosphere 12 01026 g006
Figure 7. Temporal evolution of land area ratio, expressed in percentages: (A) trends of the land area ratio, (B) regression analysis of the various heatwave categories that occurred in Tanzania from 1983–2100.
Atmosphere 12 01026 g007
Figure 8. Projected changes of heatwave events in the 21st century (A) with their corresponding duration (B) and starting dates (C) averaged over Tanzania. Graph (D) represents the land area ratio (E) shows trends of the heatwave events that occurred in Figure 8A.
Atmosphere 12 01026 g008
Table 1. Occurrences of heatwave disasters in the most affected countries over the globe from 1900 to 2021 as reported in the Emergency Events Database (EM-DAT).
CountryOccurrences of Heatwave DisastersTotal Deaths
India2812,343
USA244801
Japan151040
Pakistan152936
Belgium84701
France827,517
Romania8138
Australia7509
China6206
Italy620,118
Adopted from EM-DAT (https://public.emdat.be/mapping, accessed on 28 July 2021).
Table 2. Classification of Heatwave Magnitude Index daily (HWMId).
Heatwave CategoryRangeDescription
Normal1 ≤ HWMId < 2Grid points exhibit at least one heatwave with magnitude, HWMI ≥ 1 in the study period. Heatwaves under this category are relatively harmless
Moderate2 ≤ HWMId < 3At least one heatwave with HWMI ≥ 2 is detected.
Severe3 ≤ HWMId < 4At least one heatwave with HWMI ≥ 3 is detected
Extreme4 ≤ HWMId < 8At least one heatwave with HWMI ≥ 4 is detected
Very extreme8 ≤ HWMId < 16At least one heatwave with HWMI ≥ 8 is detected
Super extreme16 ≤ HWMId < 32HWMI ≥ 16
Ultra-extremeHWMId ≥ 32HWMI ≥ 32
The last two categories (Super extreme and Ultra-extreme) are exceptional heatwaves (higher level heatwaves), added to detect the most drastic heatwave events [70].
Table 3. The top most excessive heatwave events in the observed climate (1983–2016) averaged over Tanzania.
YearHwmid PeakLand Area Affected (%)Land Area Ratio (%) of Heatwave Categories
ModerateSevereExtremeVery ExtremeSuper ExtremeUltra-Extreme
19839.7445.110.711.722.81.0
199213.8333.29.26.914.92.5
19948.2820.18.27.213.70.5
199714.9139.413.48.415.92.7
199941.5815.48.41.72.20.71.21.0
200516.9934.29.46.510.48.20.3
201016.6739.912.26.216.15.20.3
201110.2933.210.97.913.70.7
201415.914.95.24.05.73.00.3
2015724.111.45.77.0
Publisher’s Note: MDPI stays neutral with regard to jurisdictional claims in published maps and institutional affiliations.

