
Mediterranean-Scale Drought: Regional Datasets for Exceptional Meteorological Drought Events during 1975–2019


Abstract
:1. Introduction
1.1. Climate Change and the Growing Risk of Drought Hazard
1.2. Drought, Climate Change and the Mediterranean Context
2. Data and Methods
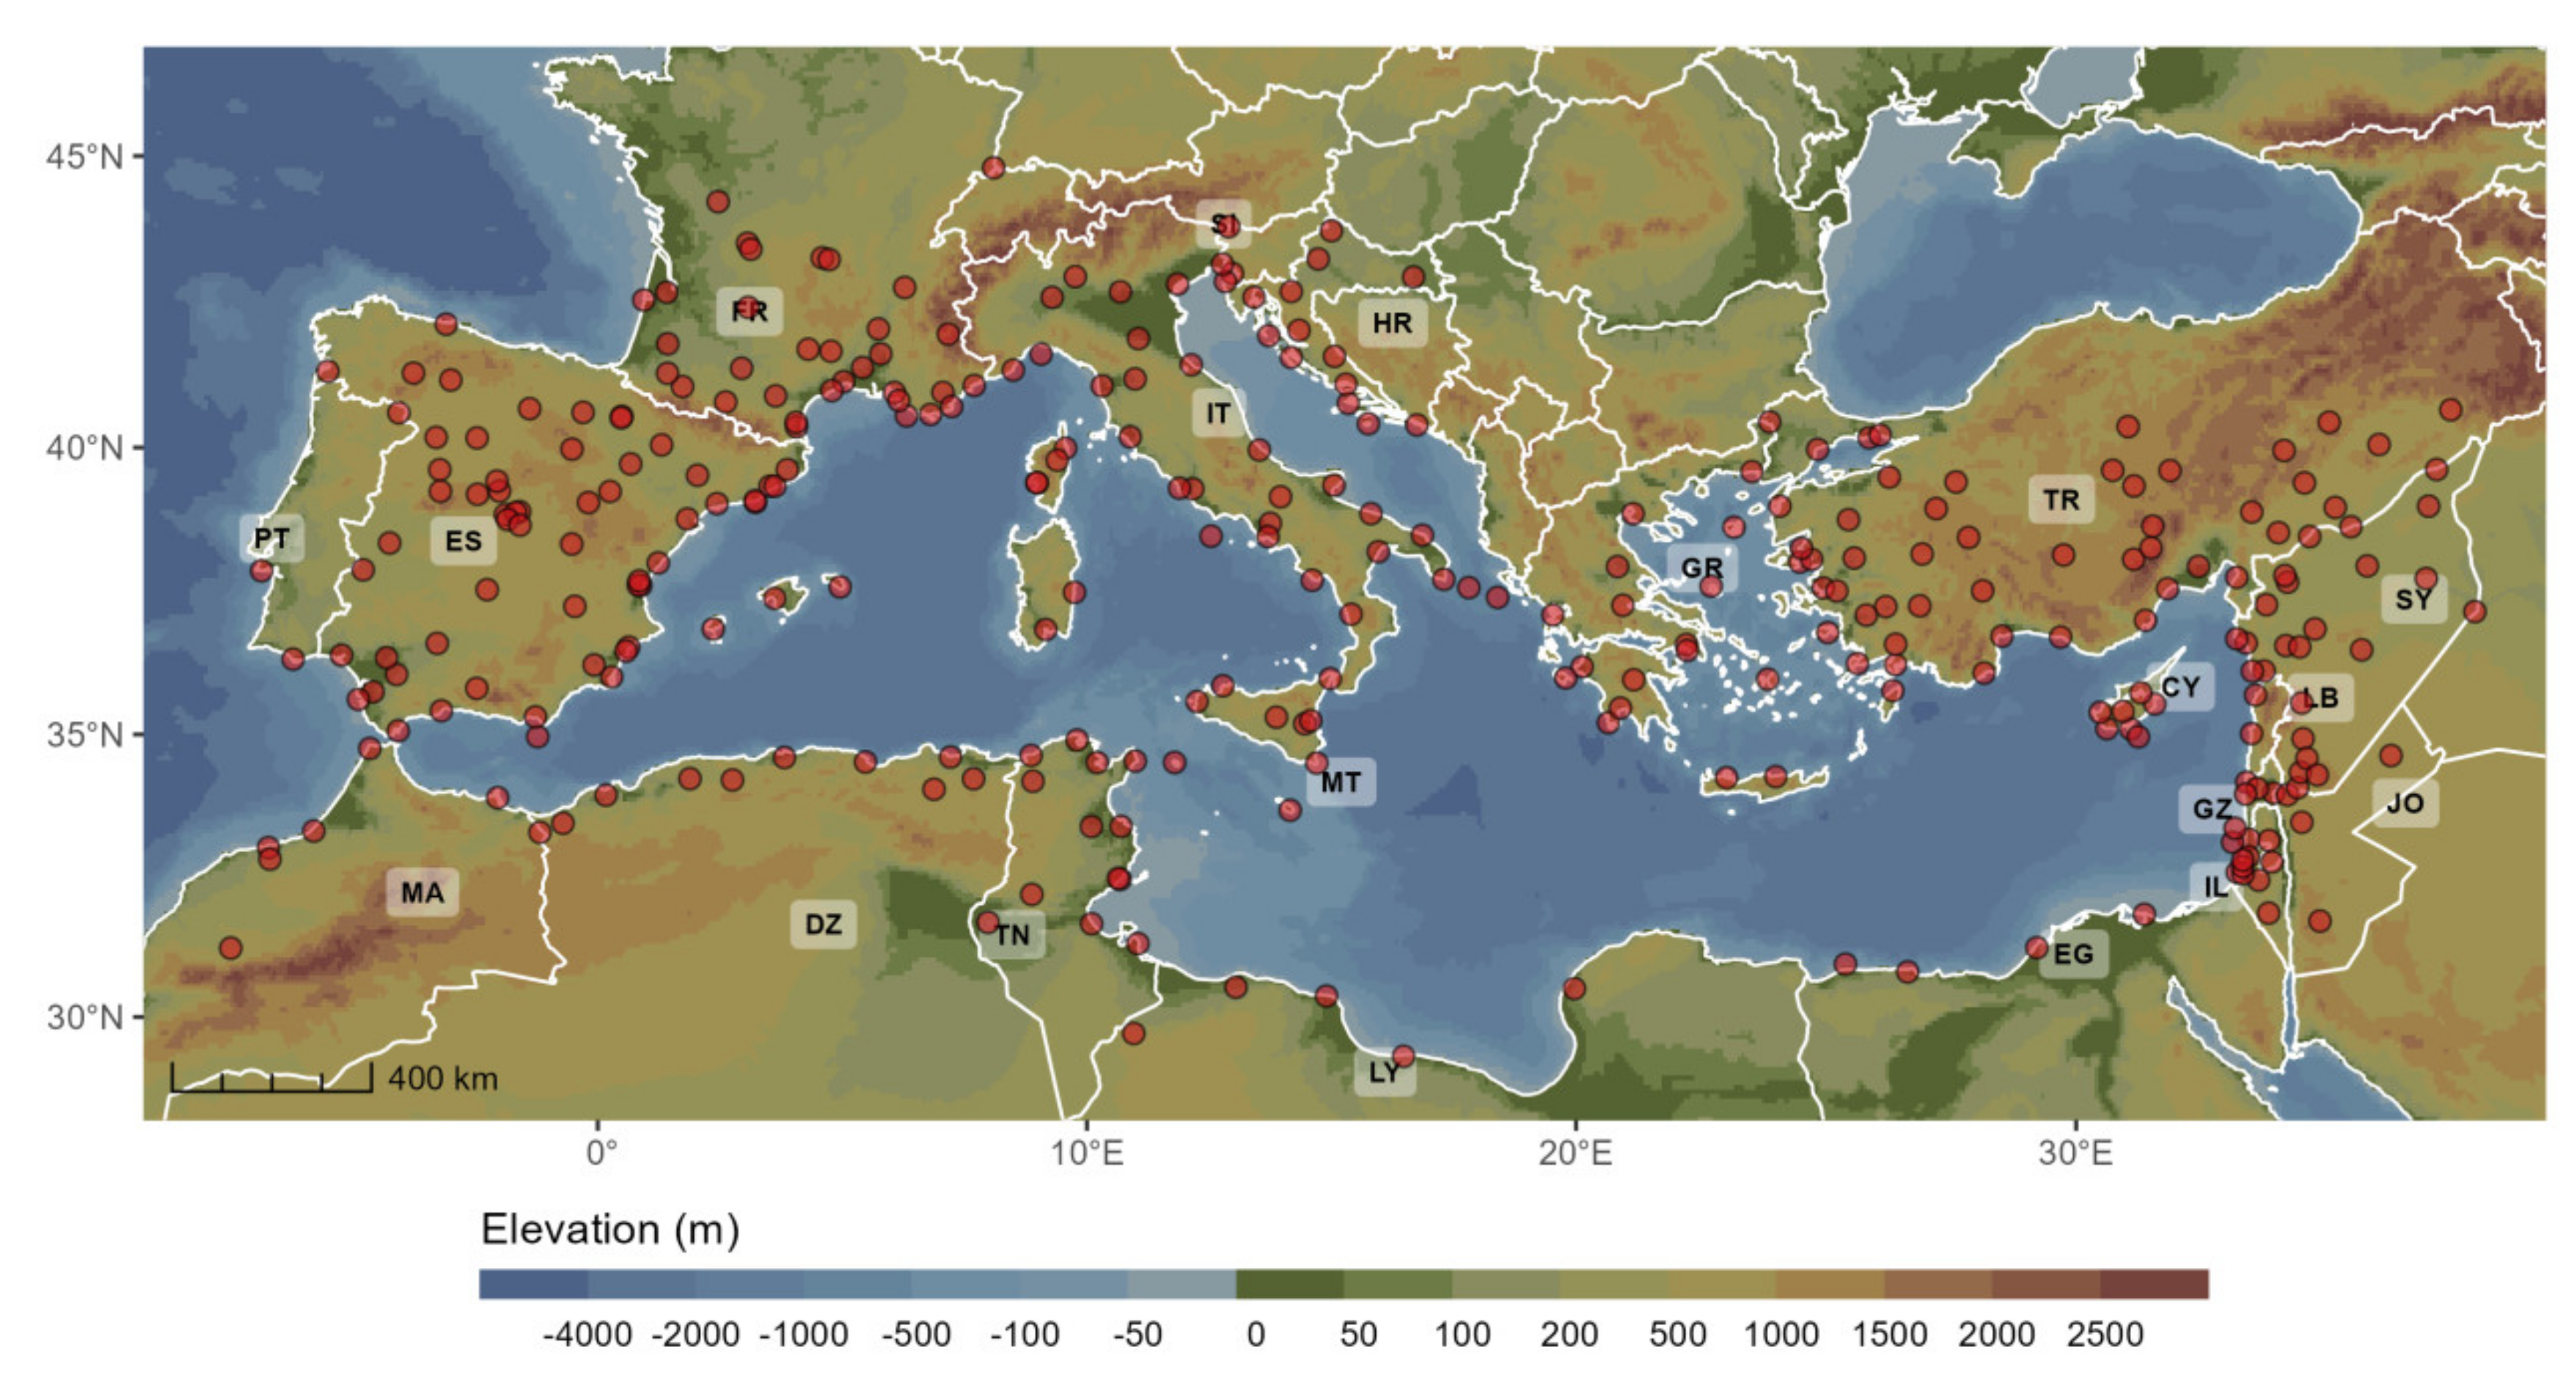
2.1. Study Area and Data
2.2. Selection of Drought Indicators: The SPI, SPEI and RDI
2.3. Drought Concepts and Characterisation, a Multivariate Perspective for a New Combined Index
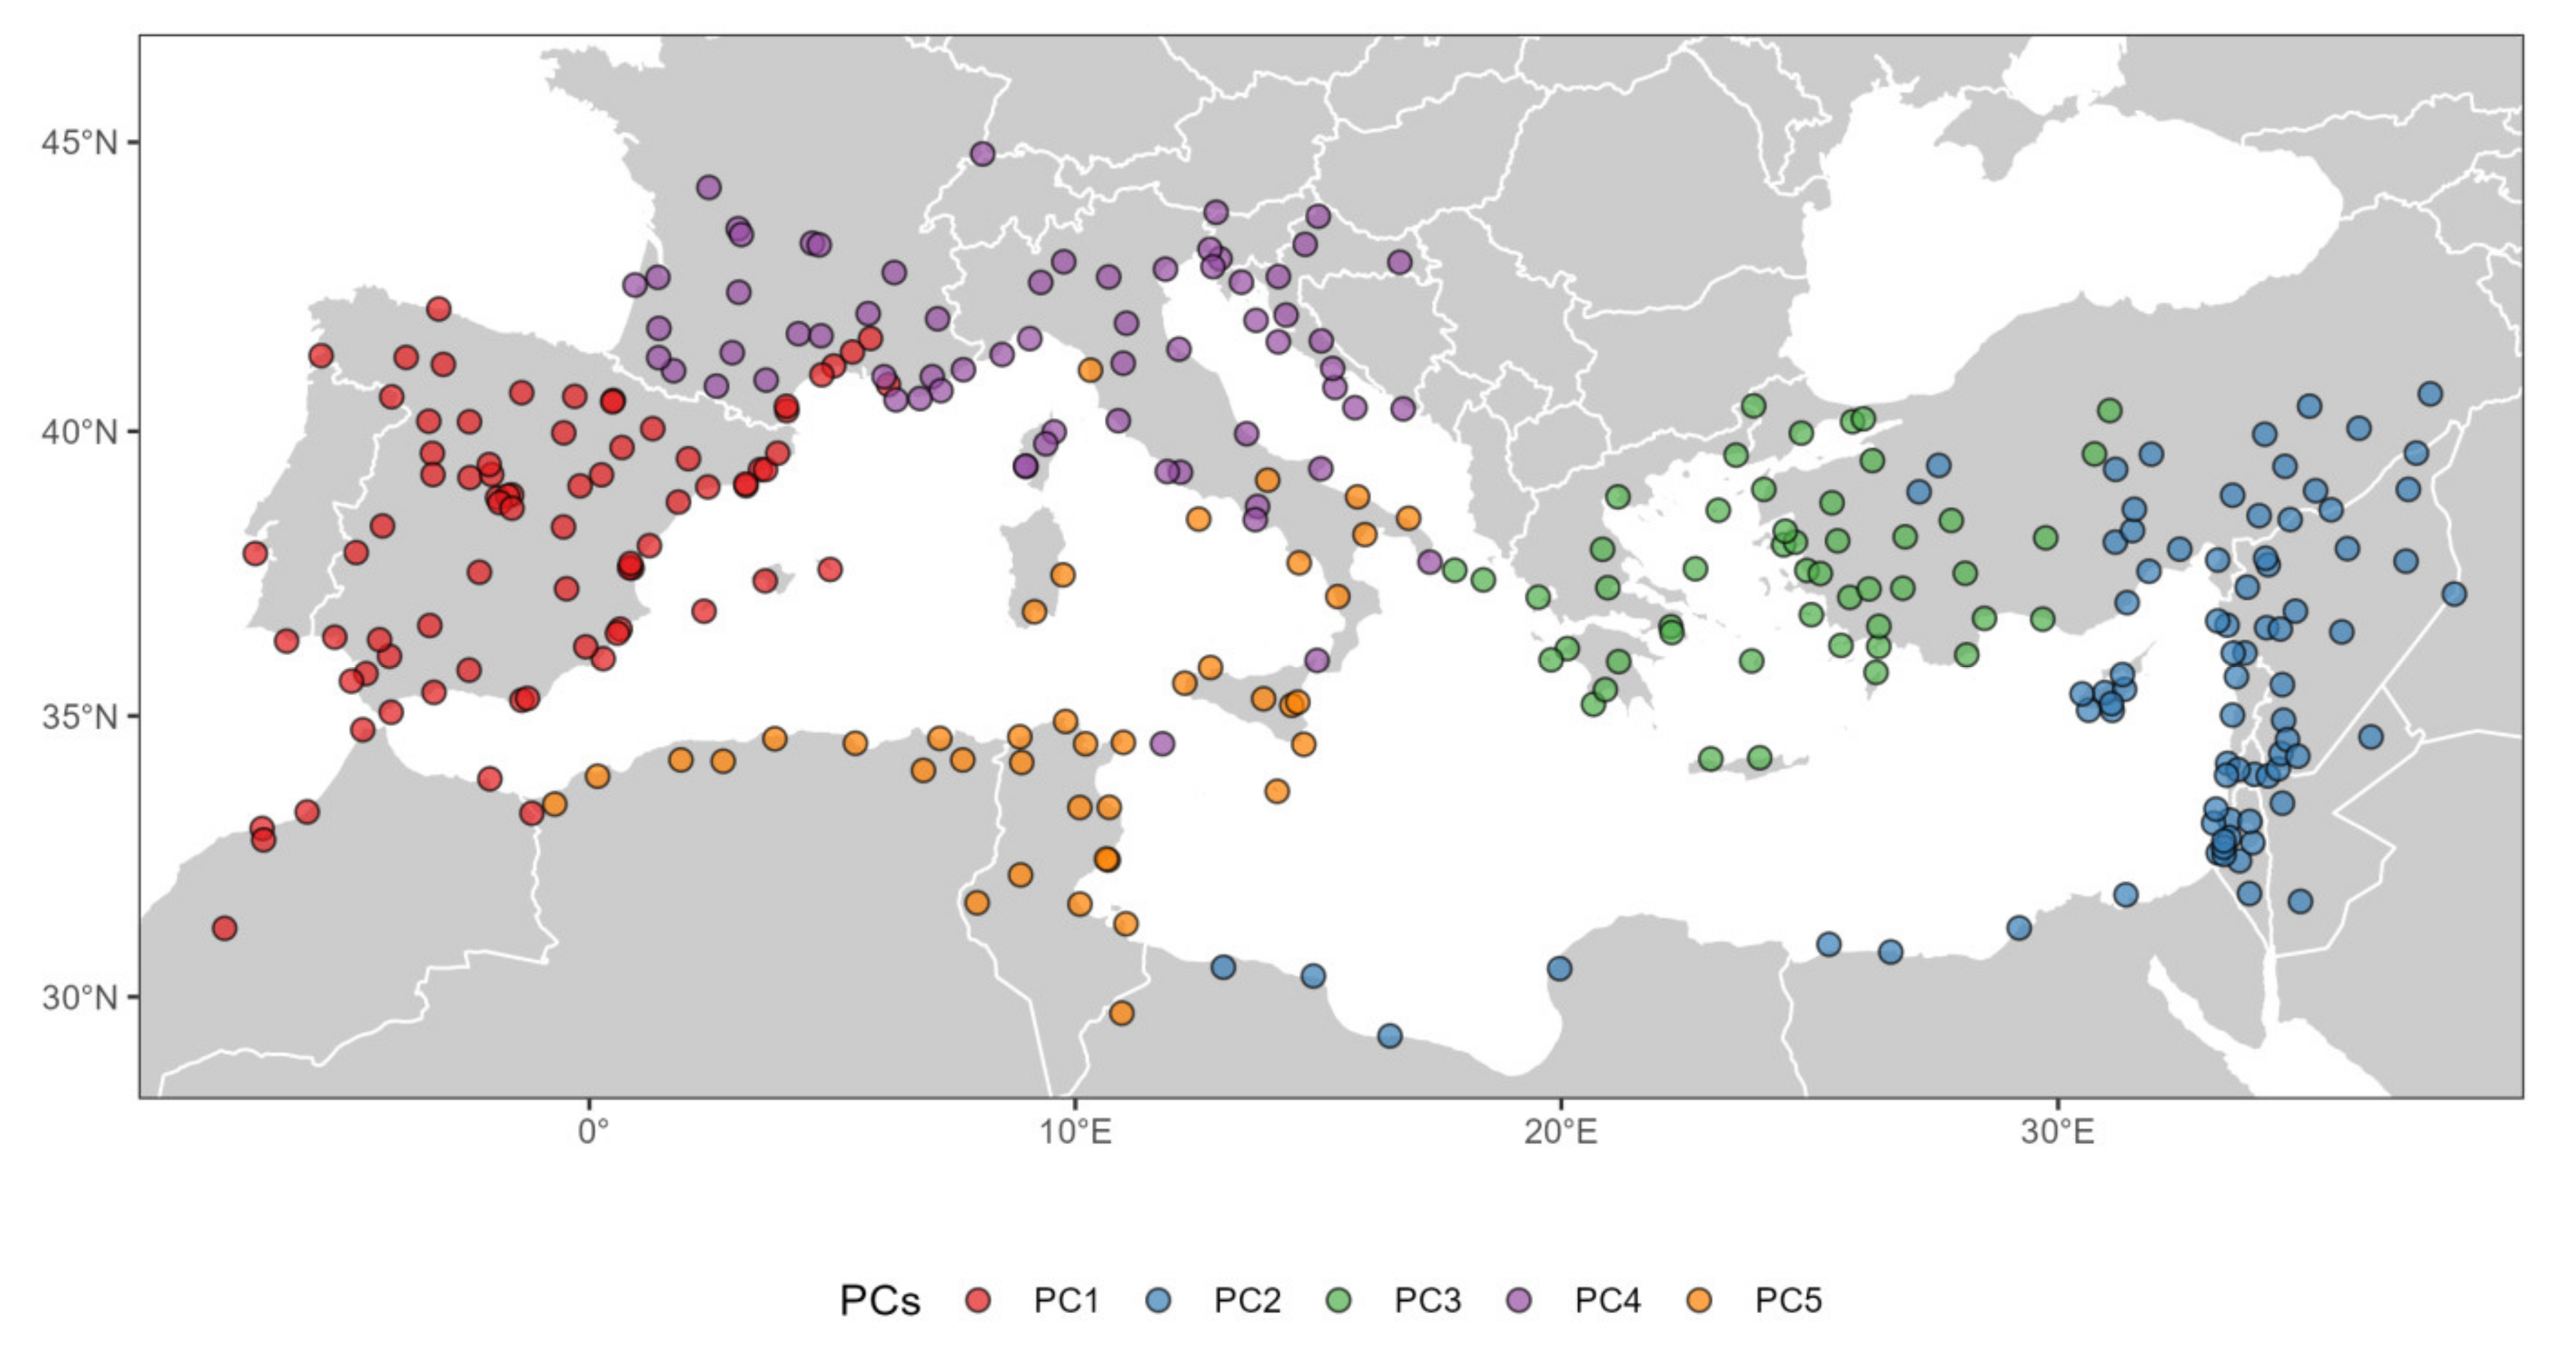
2.4. Principal Component Analysis (PCA)
2.5. Definition of the Constructed Meteorological Drought Event Database
2.6. Developing a New System for Classifying the Drought Events According to Three Different Attributes
2.7. Atmospheric Circulation–Drought Conditions Analyses
3. Results and Discussion
3.1. Loading Patterns of SPI-12, RDI-12, SPEI-12 and DXI-12 Derived from PCA
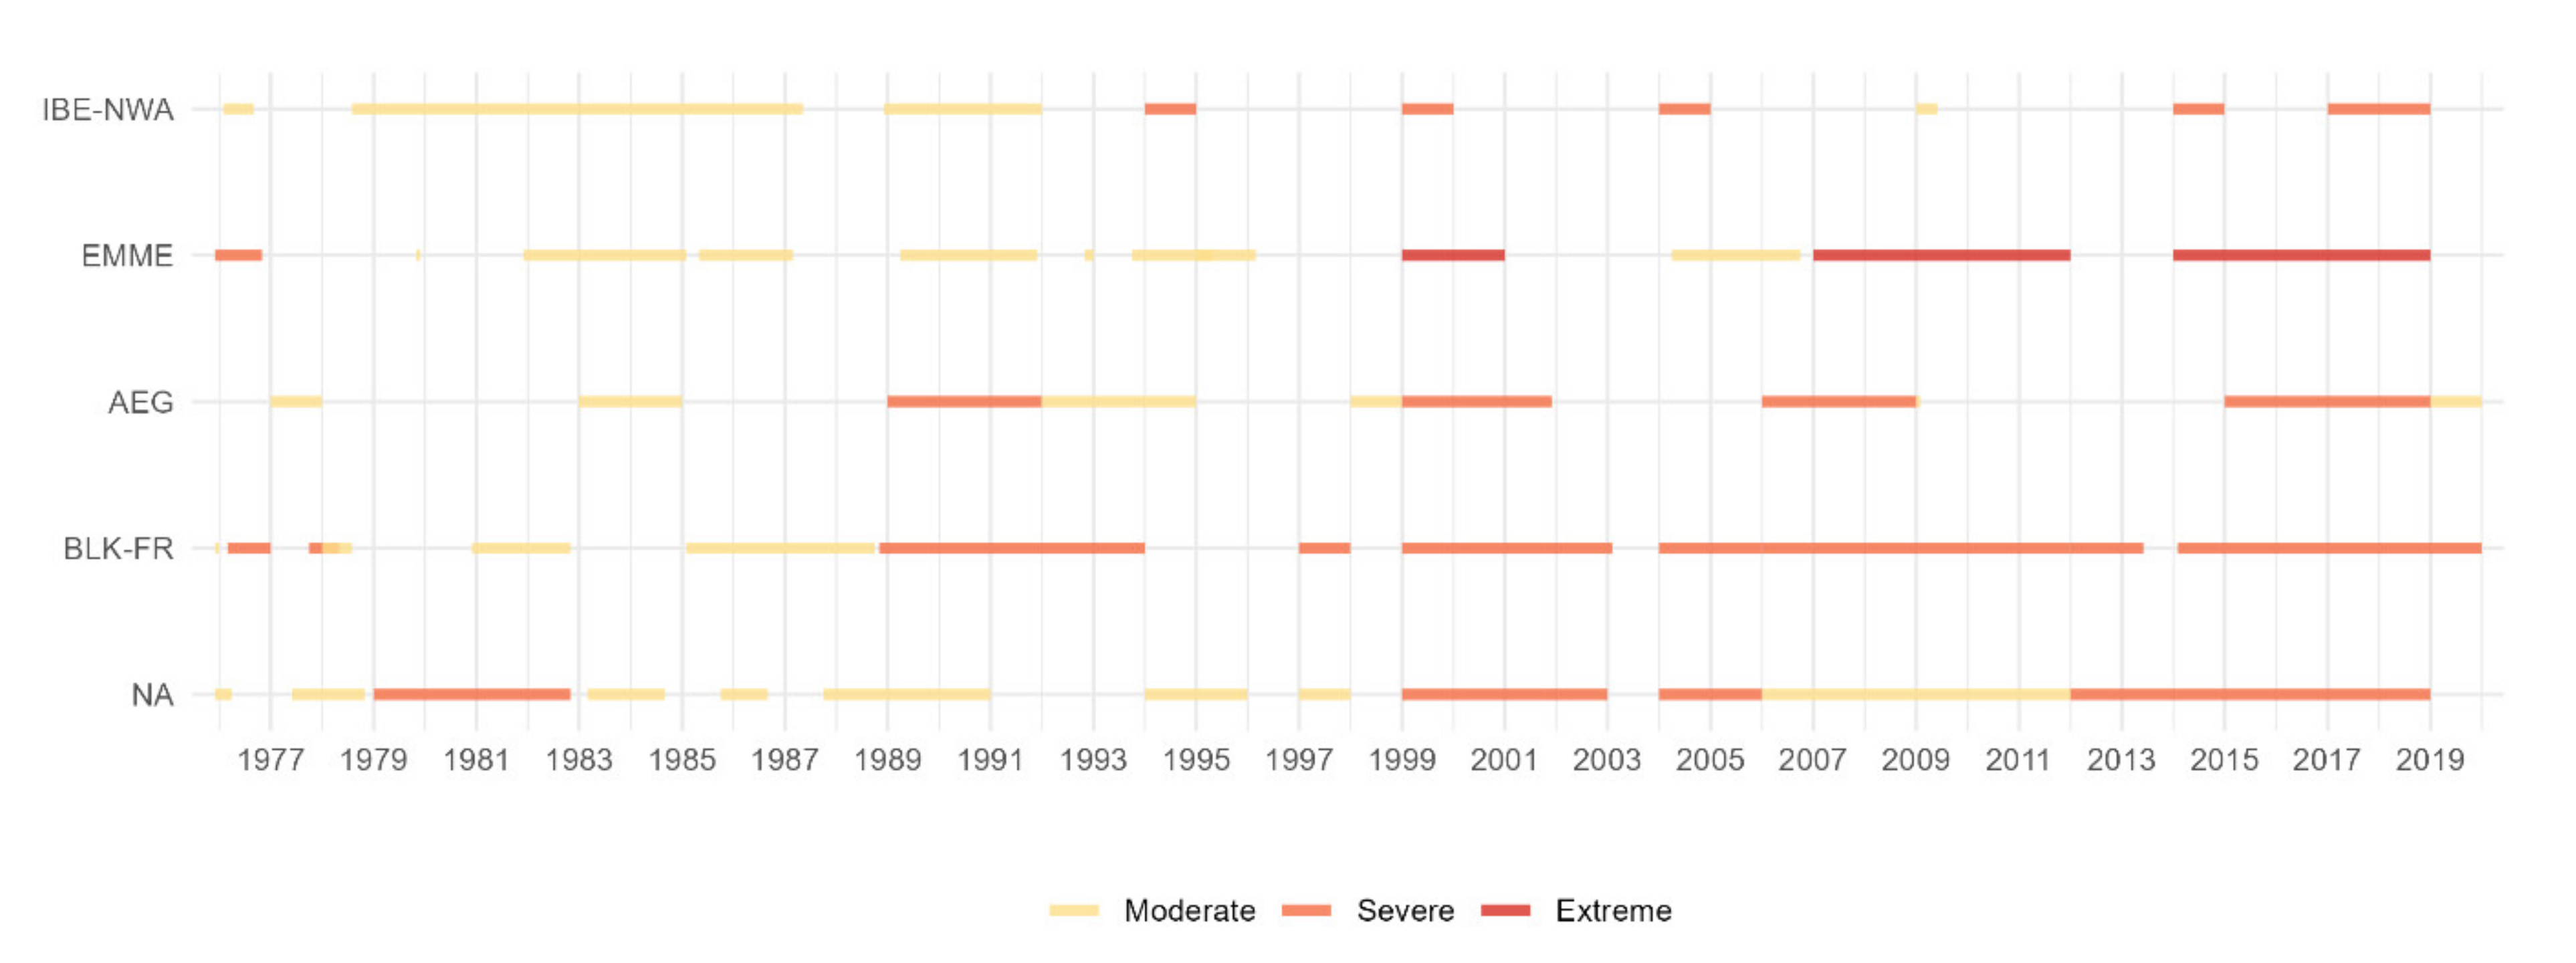
3.2. Meteorological Drought Events Identified by DXI-12 and Their Characteristics at Country and Subregional Scales
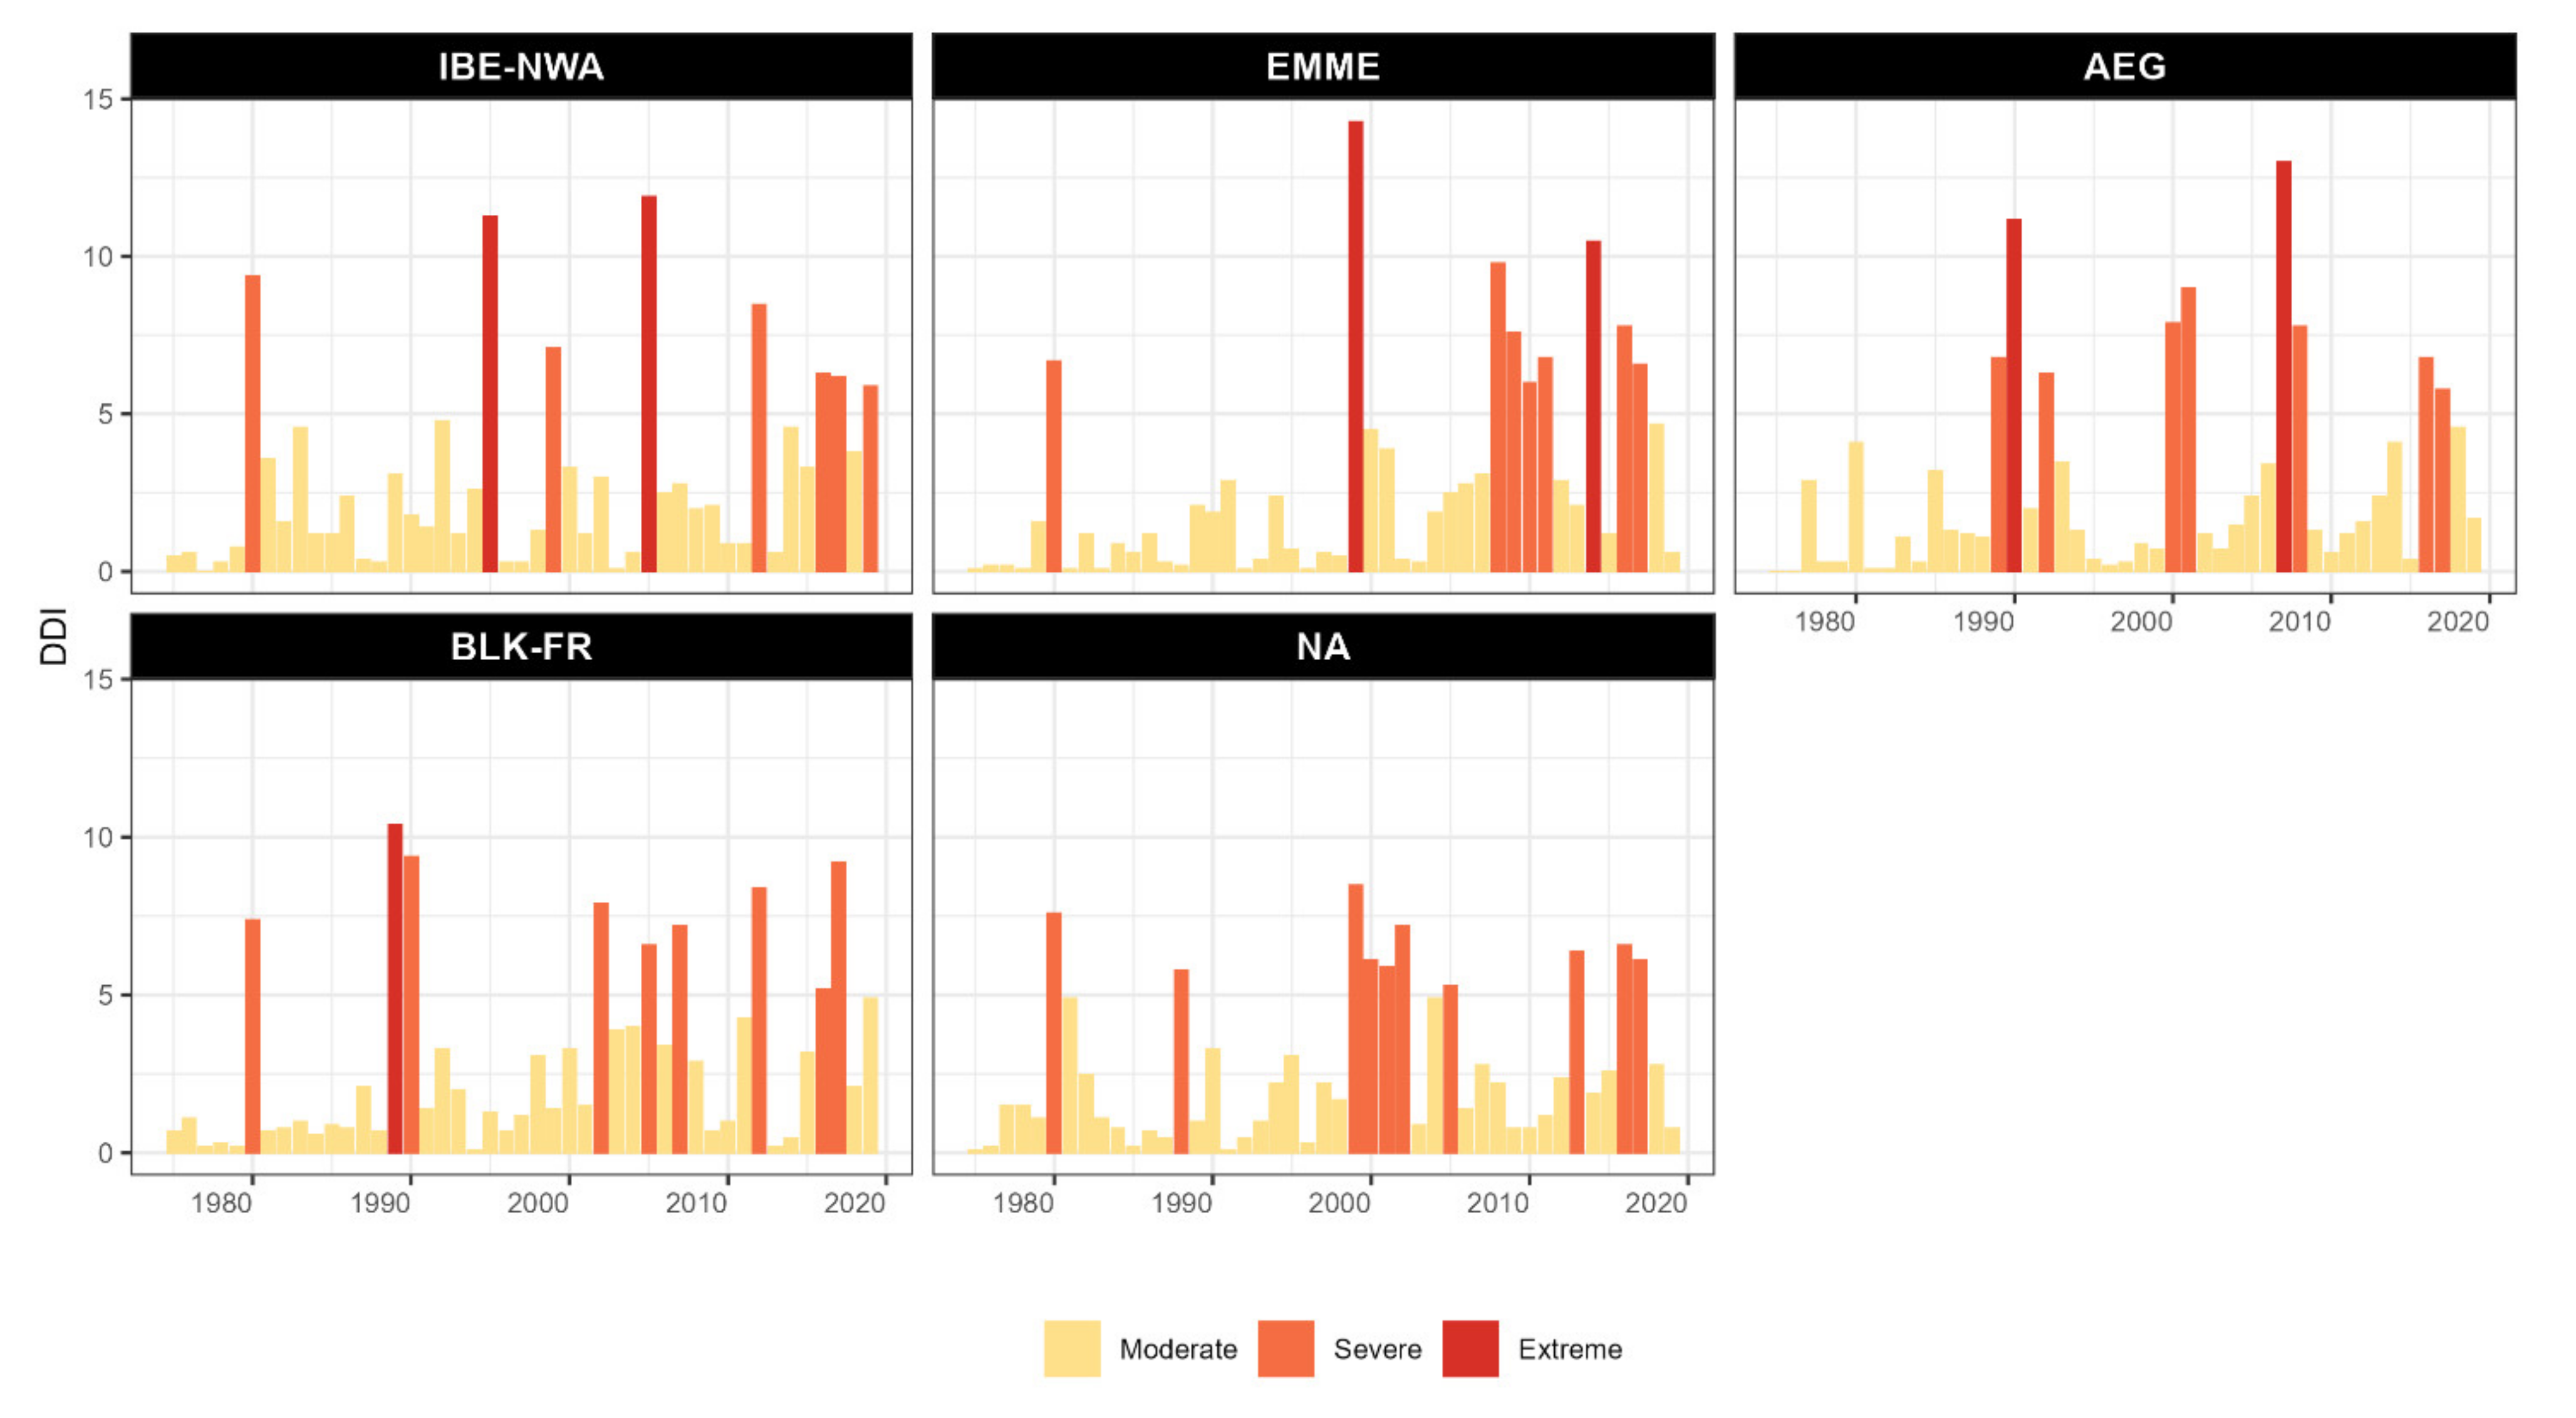
3.3. Three-Dimensional Identification and Characterisation of Meteorological Drought Events at Subregional and Regional Scales
3.4. Evaluation of Different Drought Events Parameters during Two Subperiods
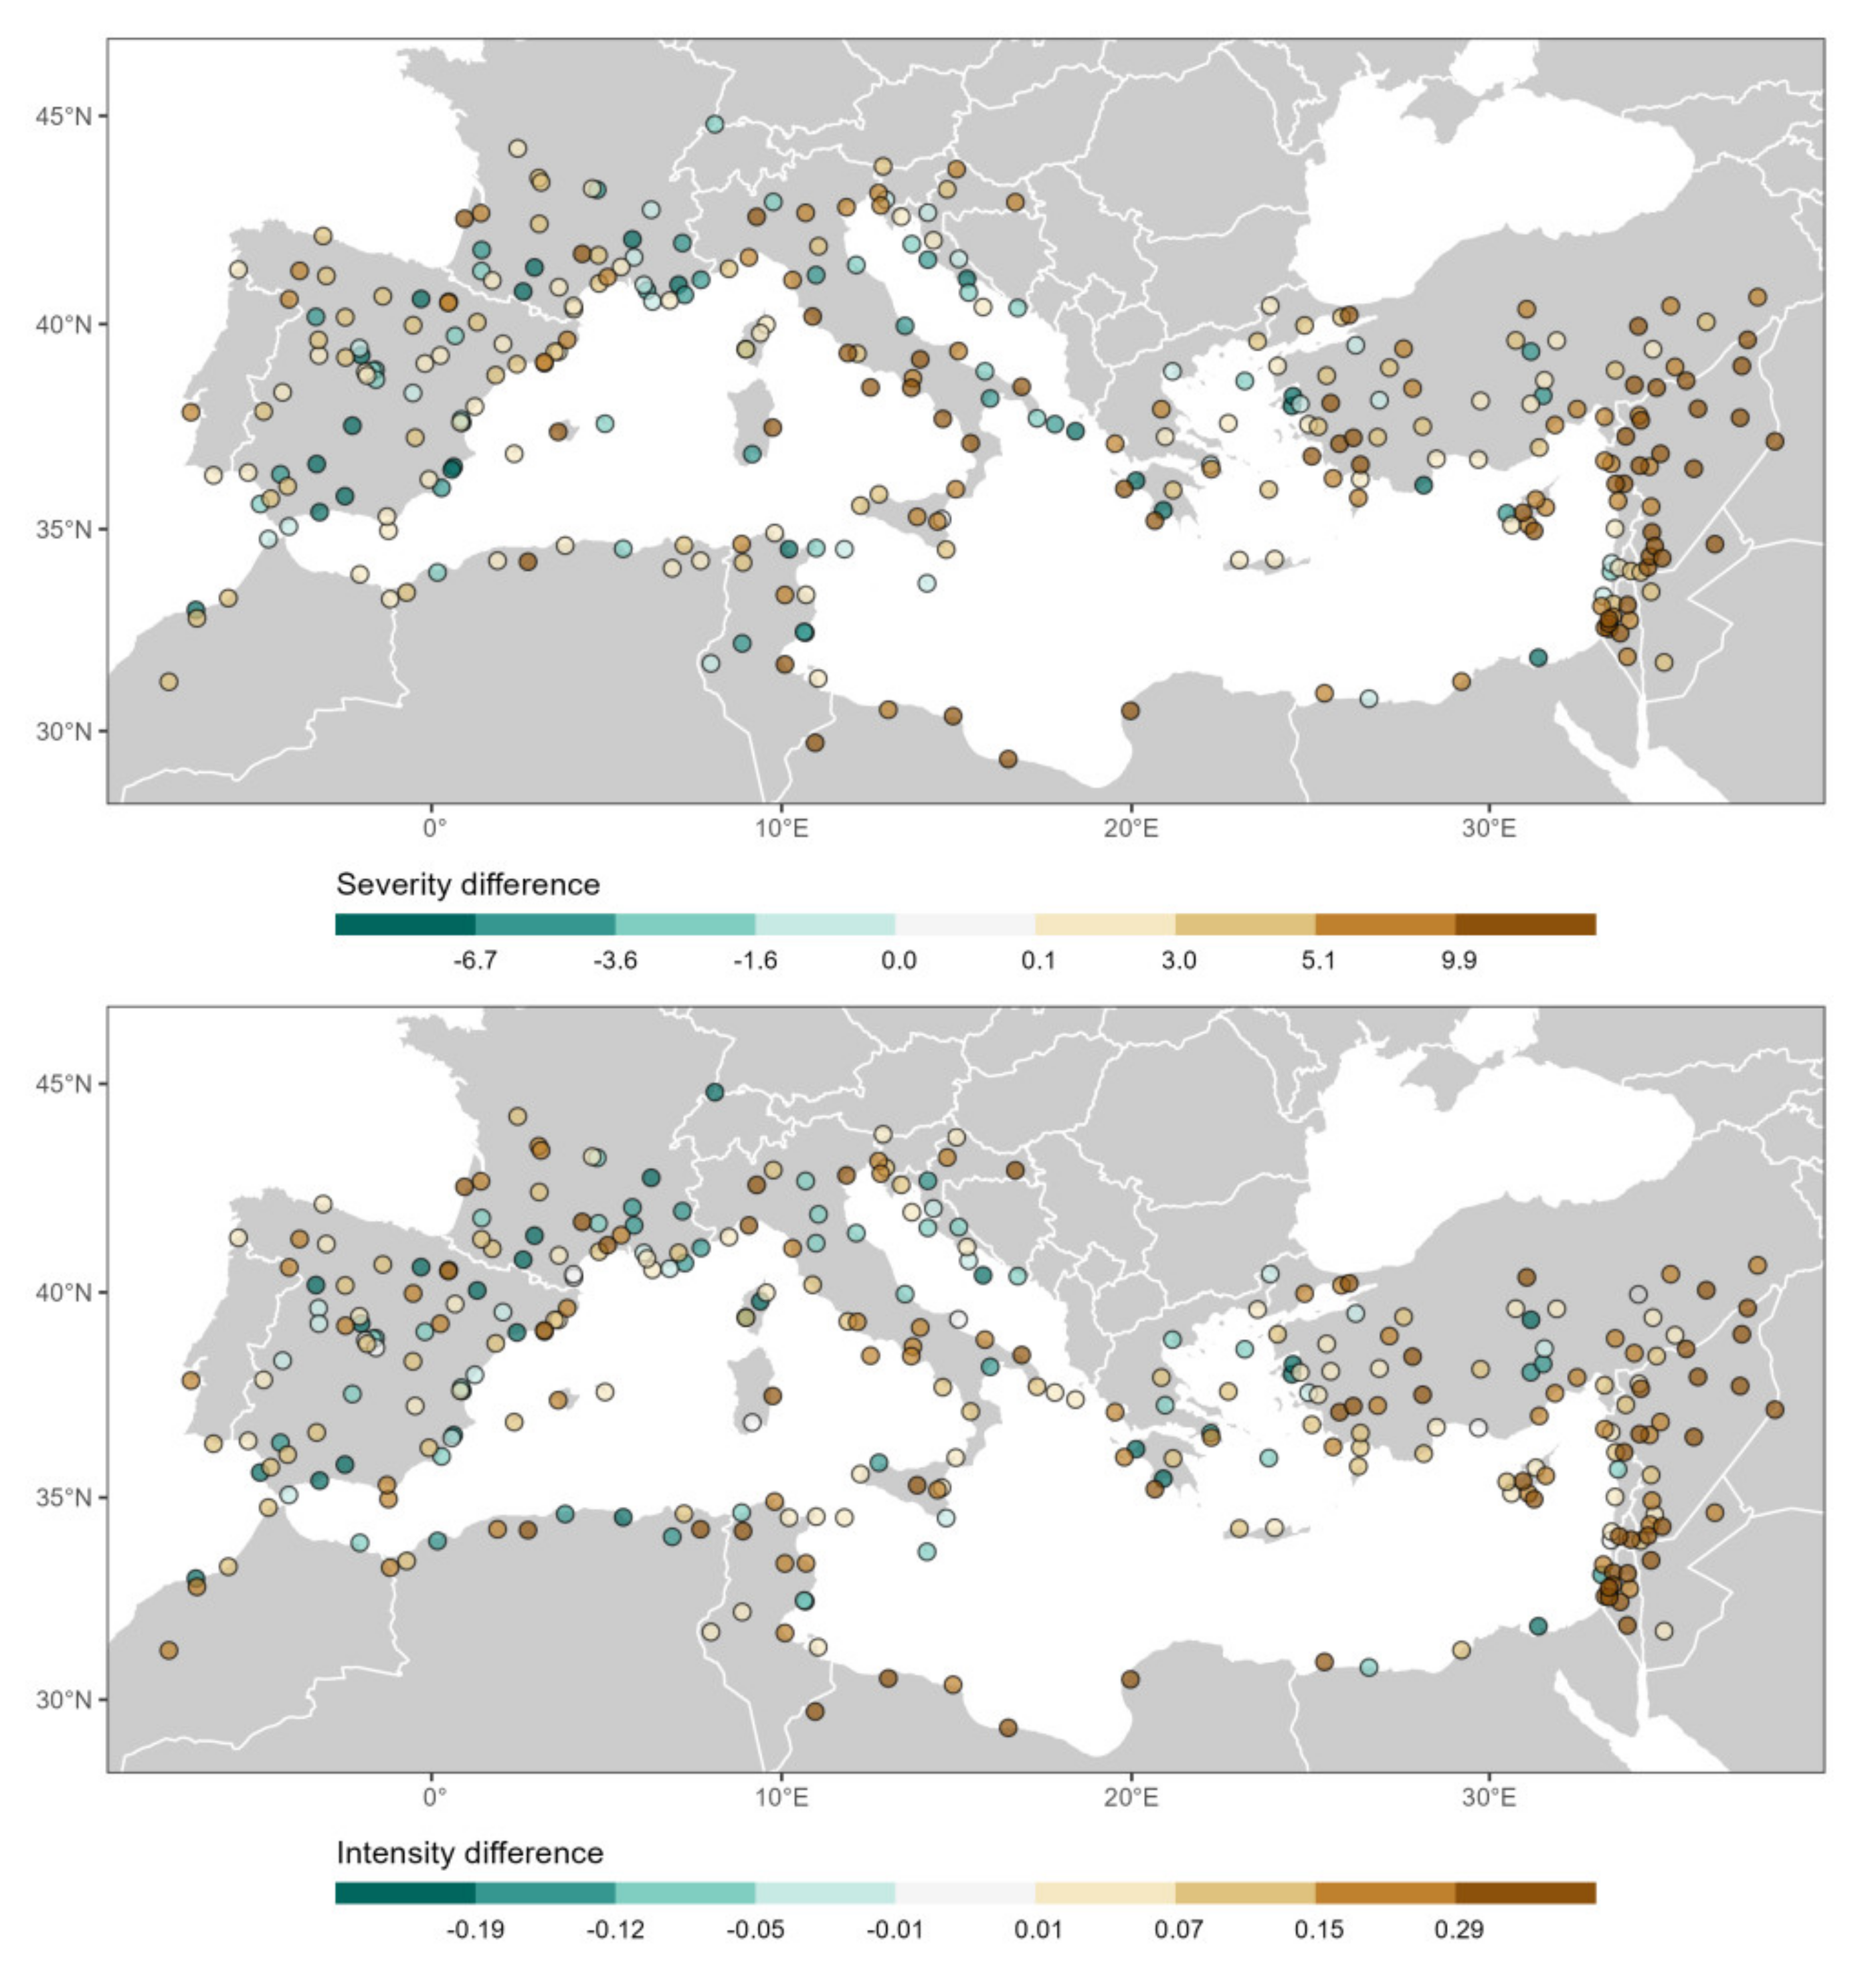
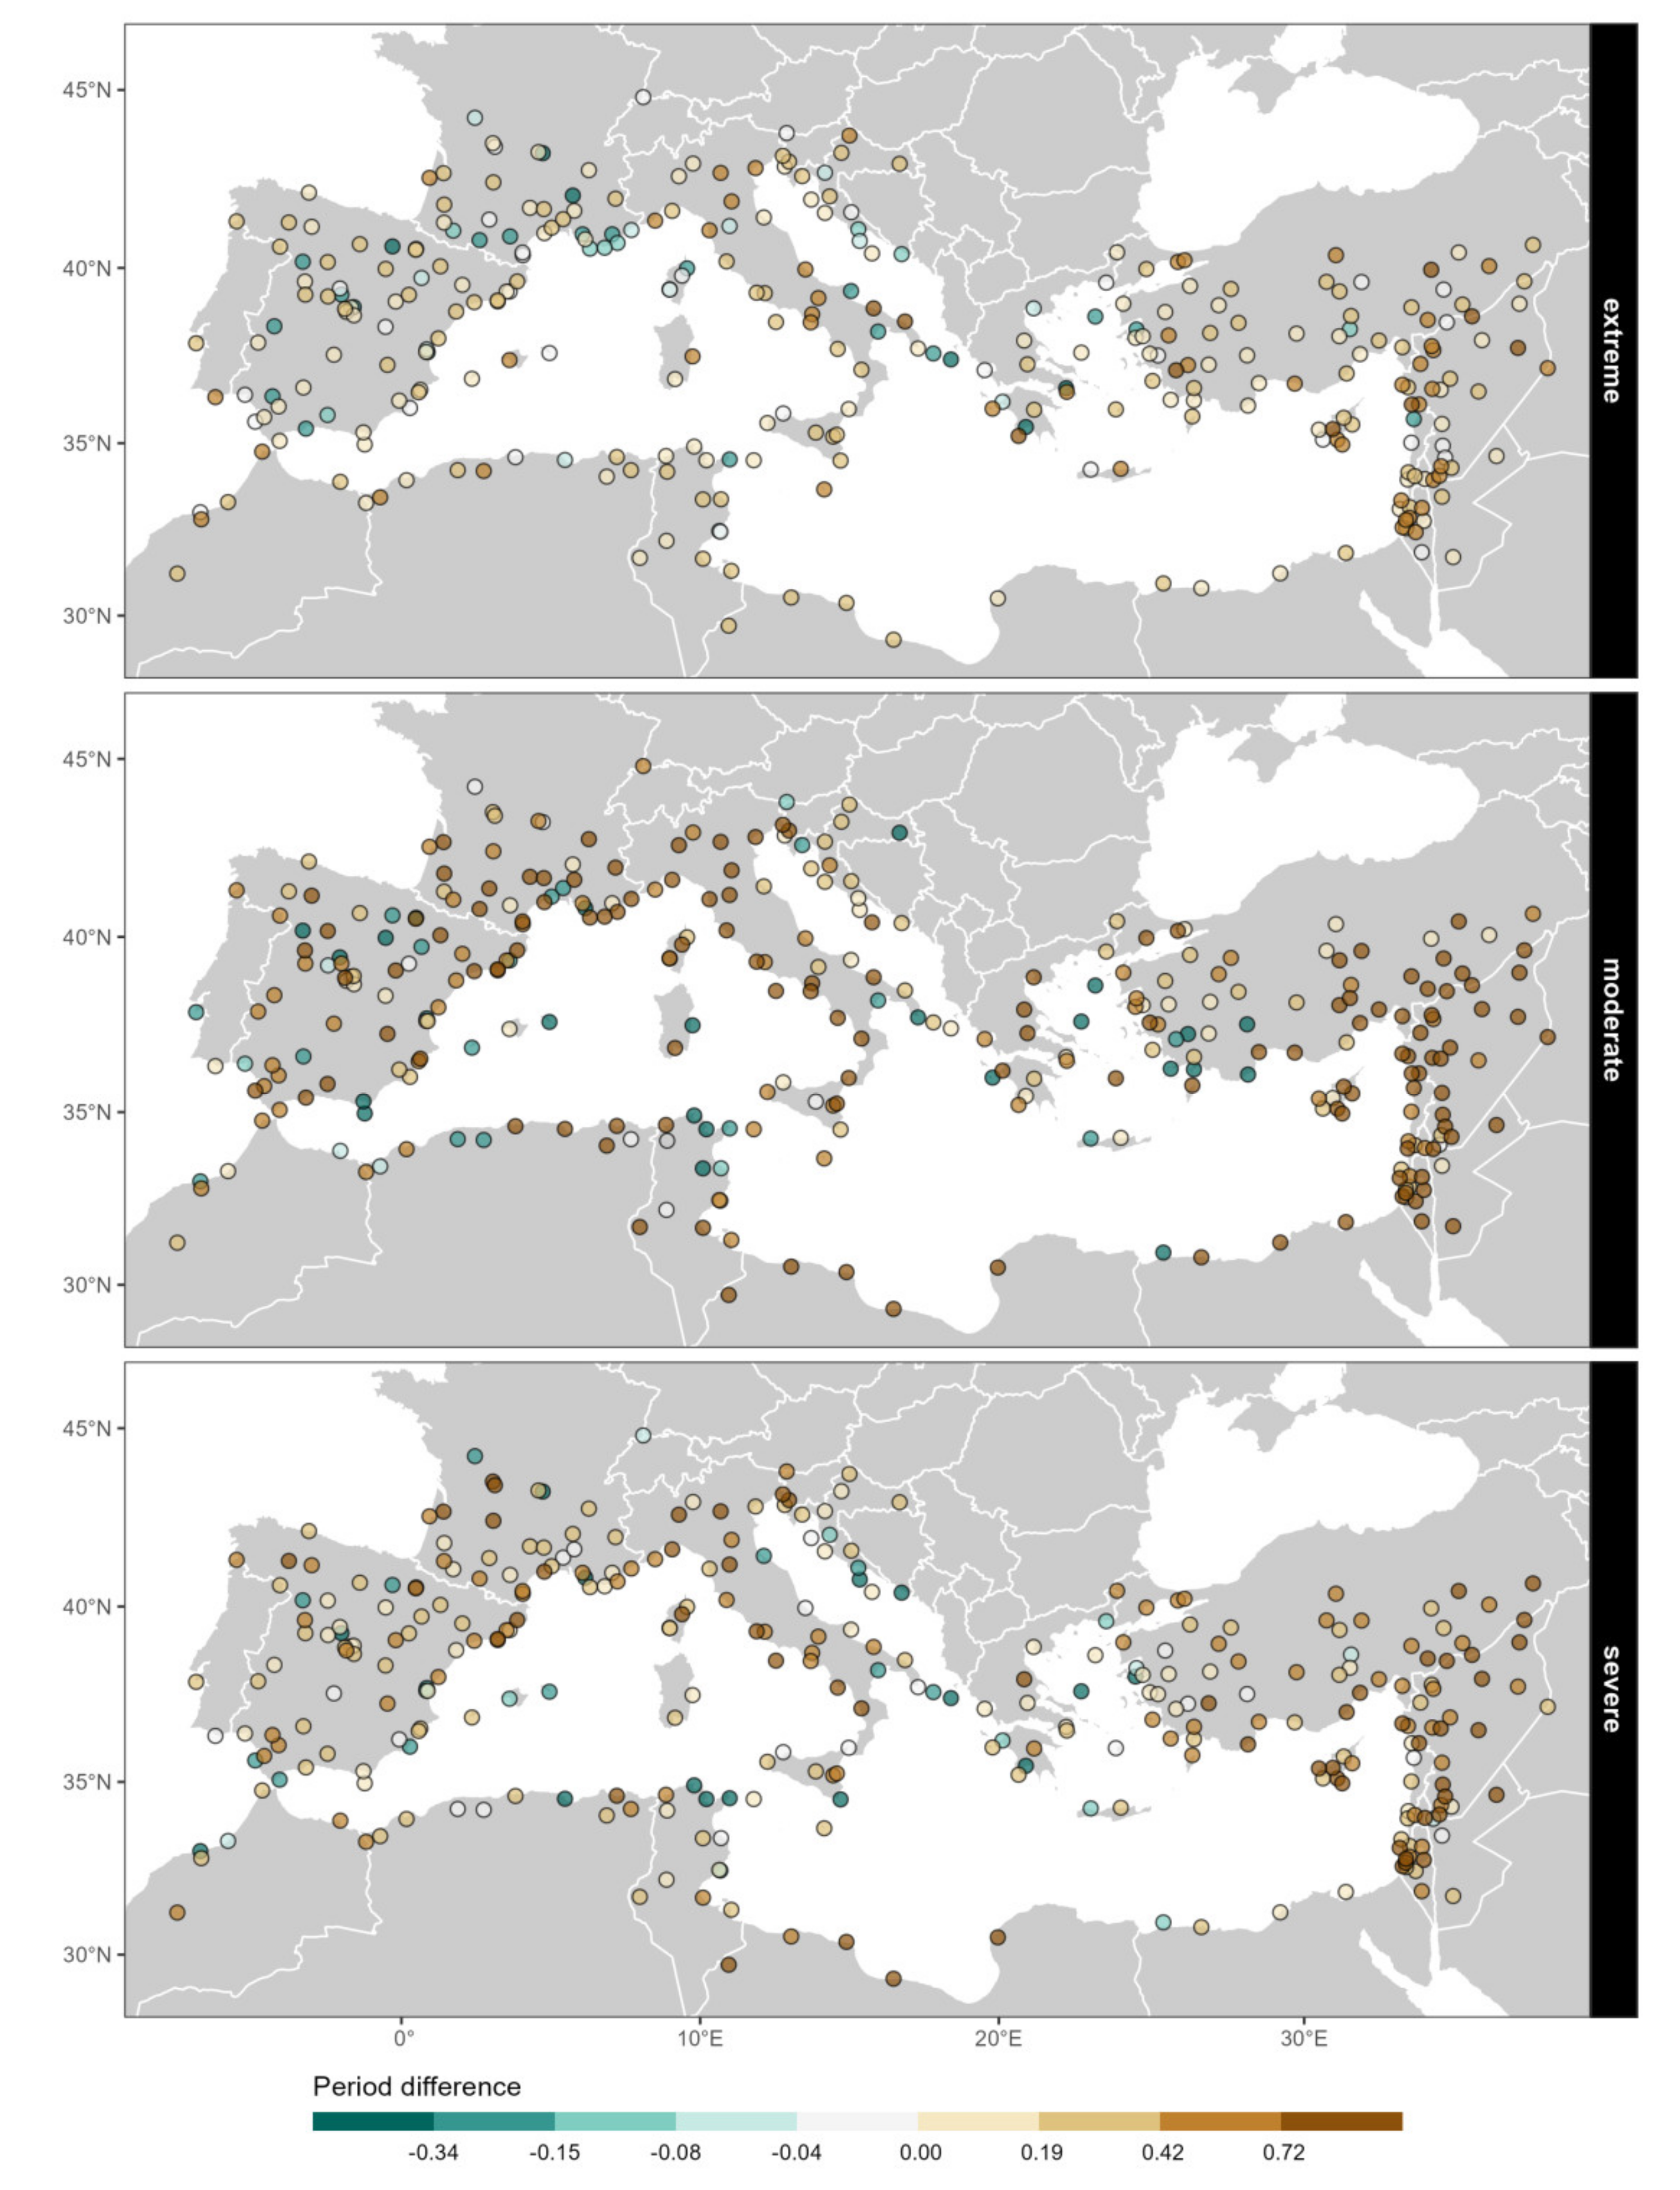
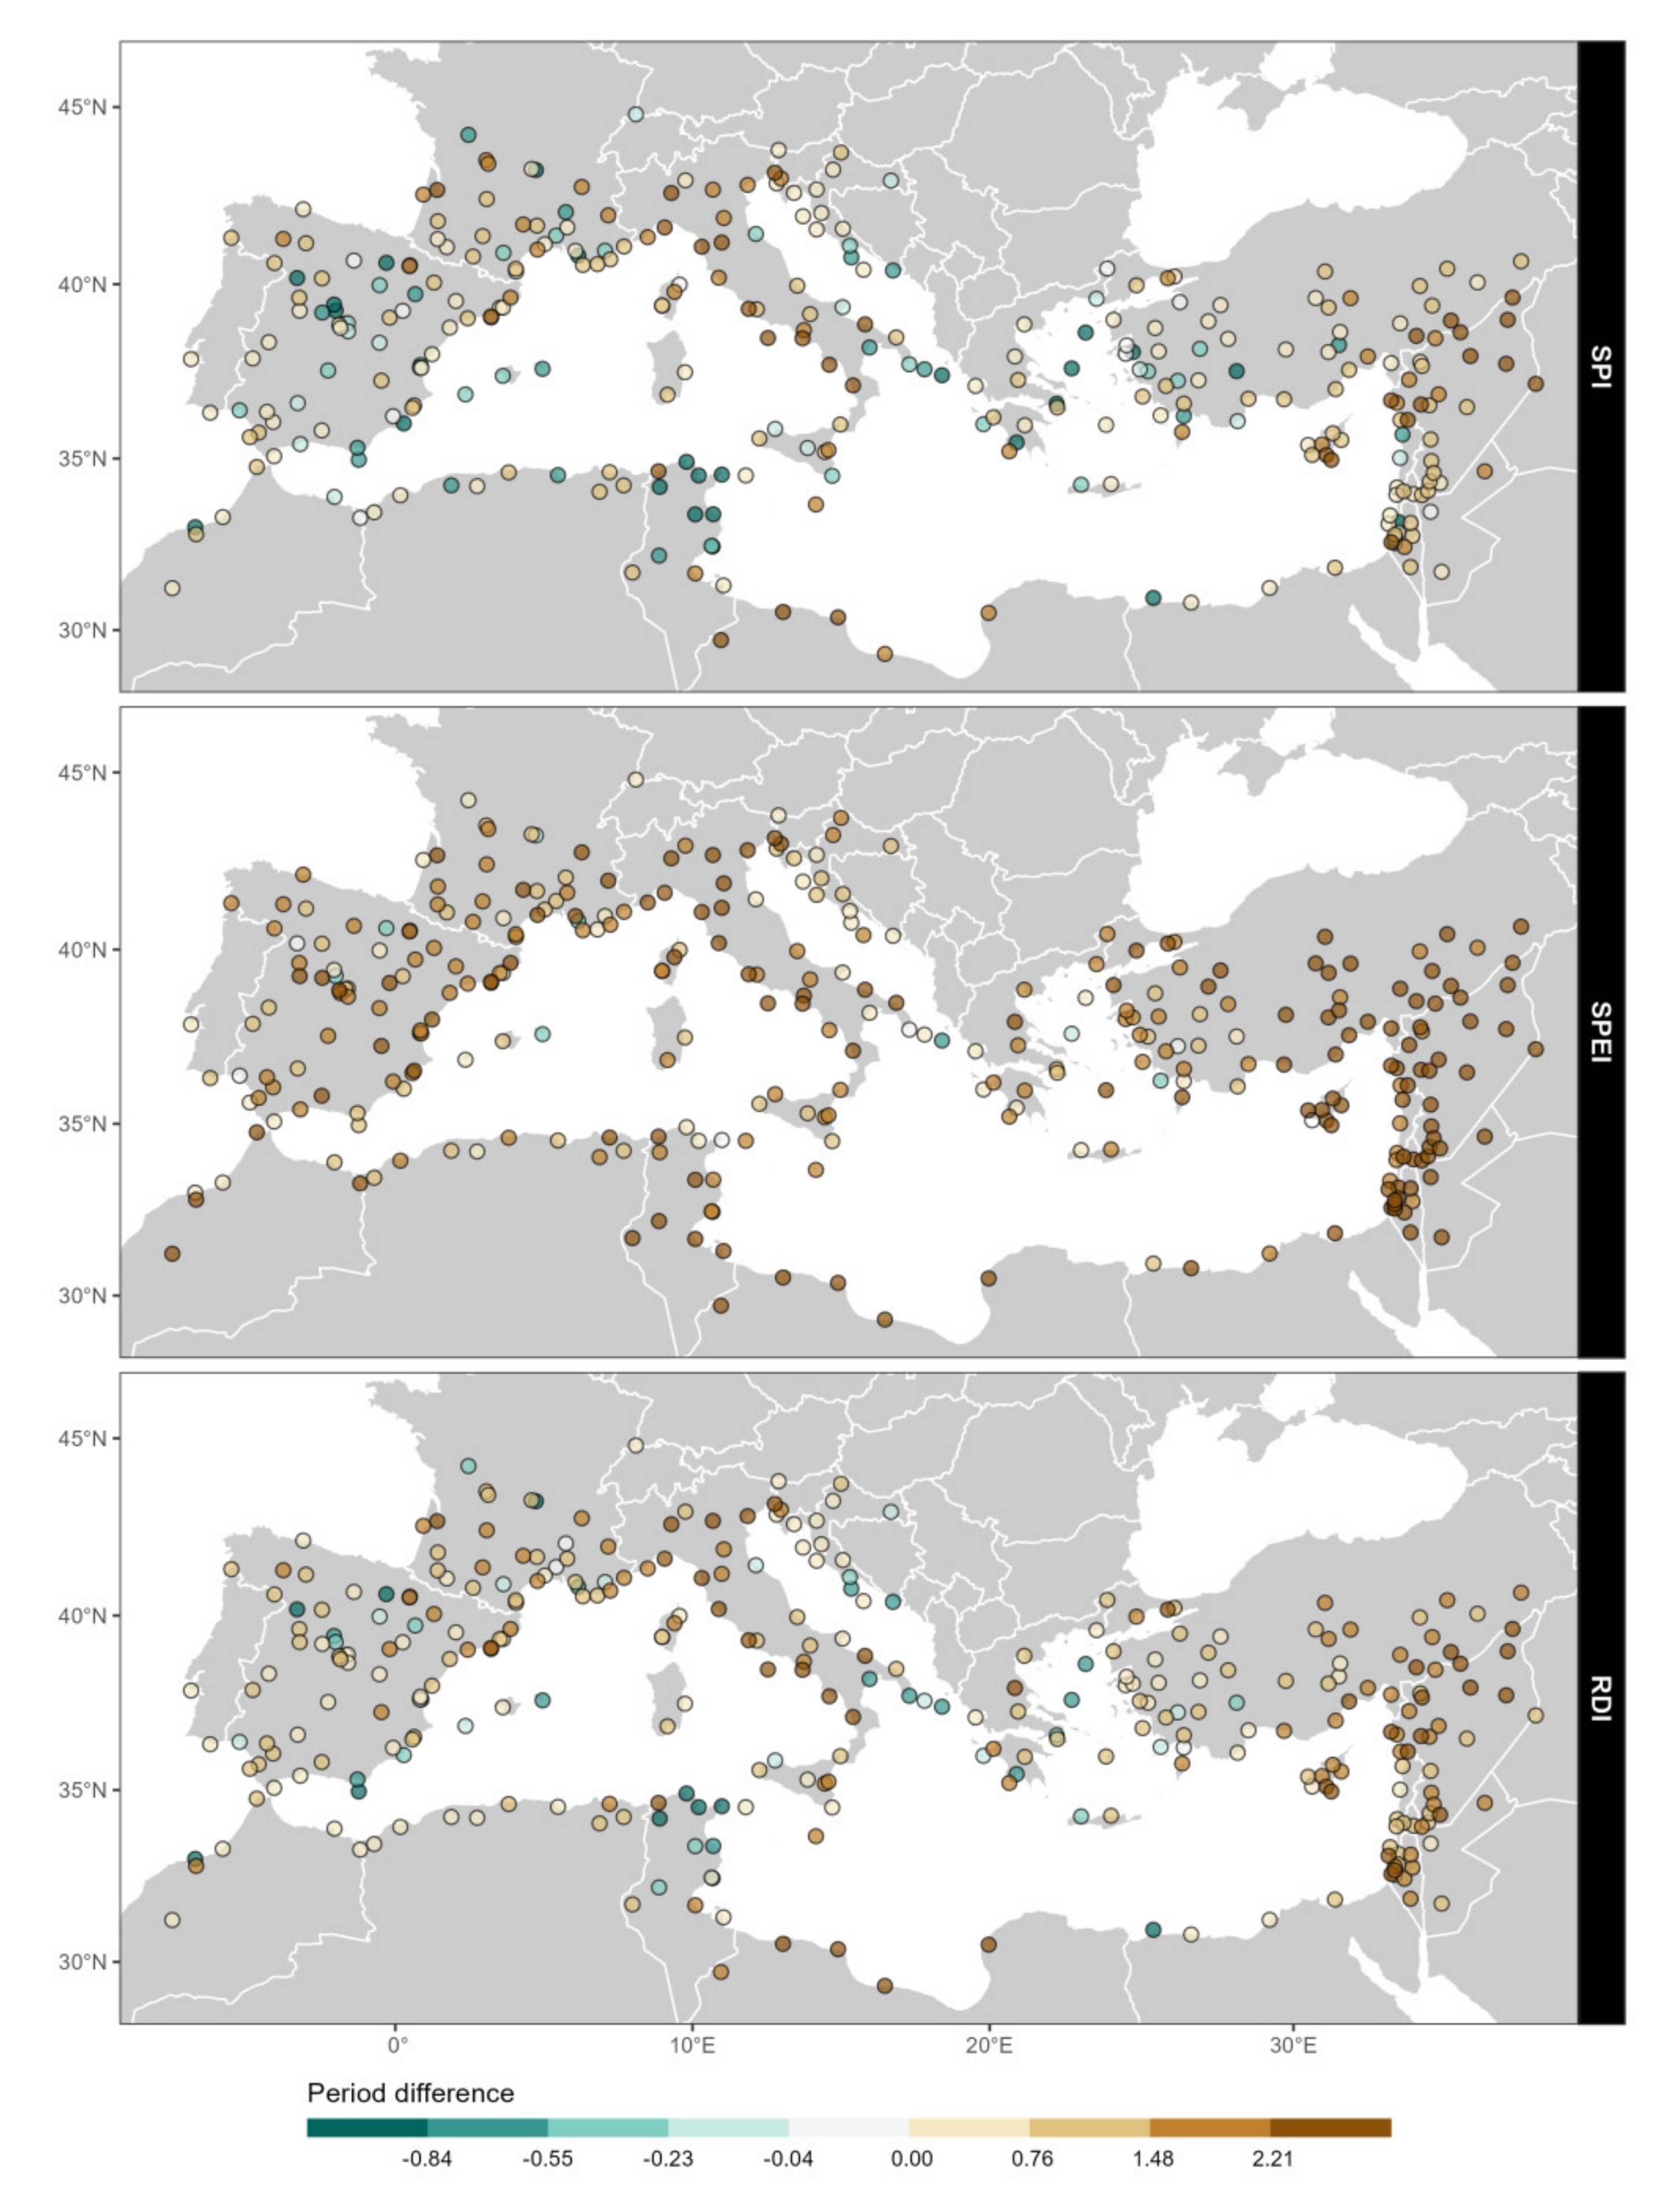
3.4.1. Change in Severity, Intensity and Frequency of Drought Events between 1975–1996 and 1997–2019
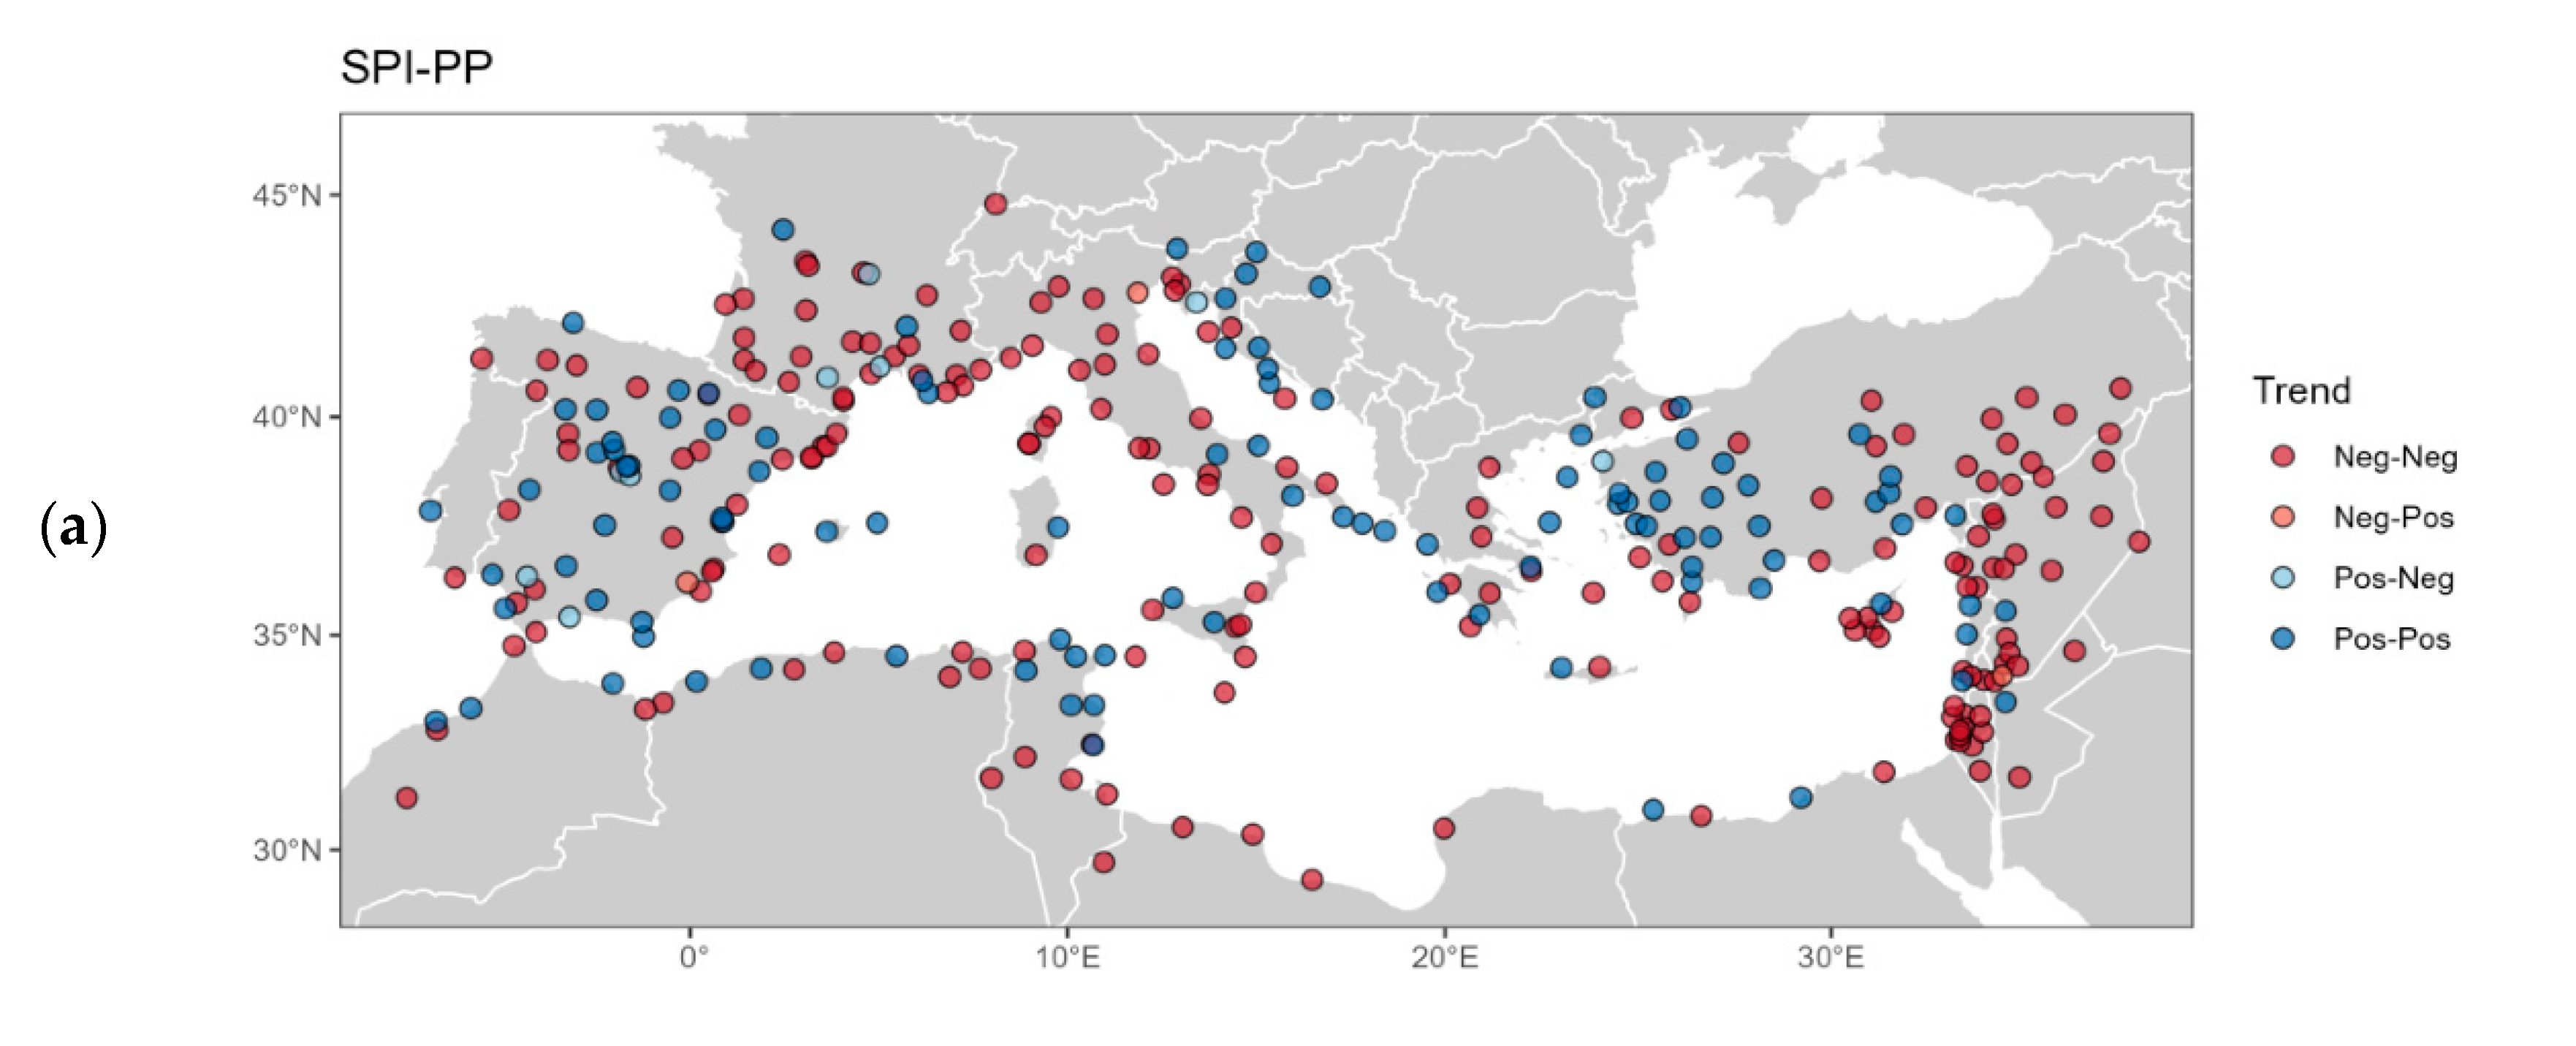
3.4.2. Change in Precipitation (PP) and Potential Evapotranspiration (PET) between 1975–1996 and 1997–2019
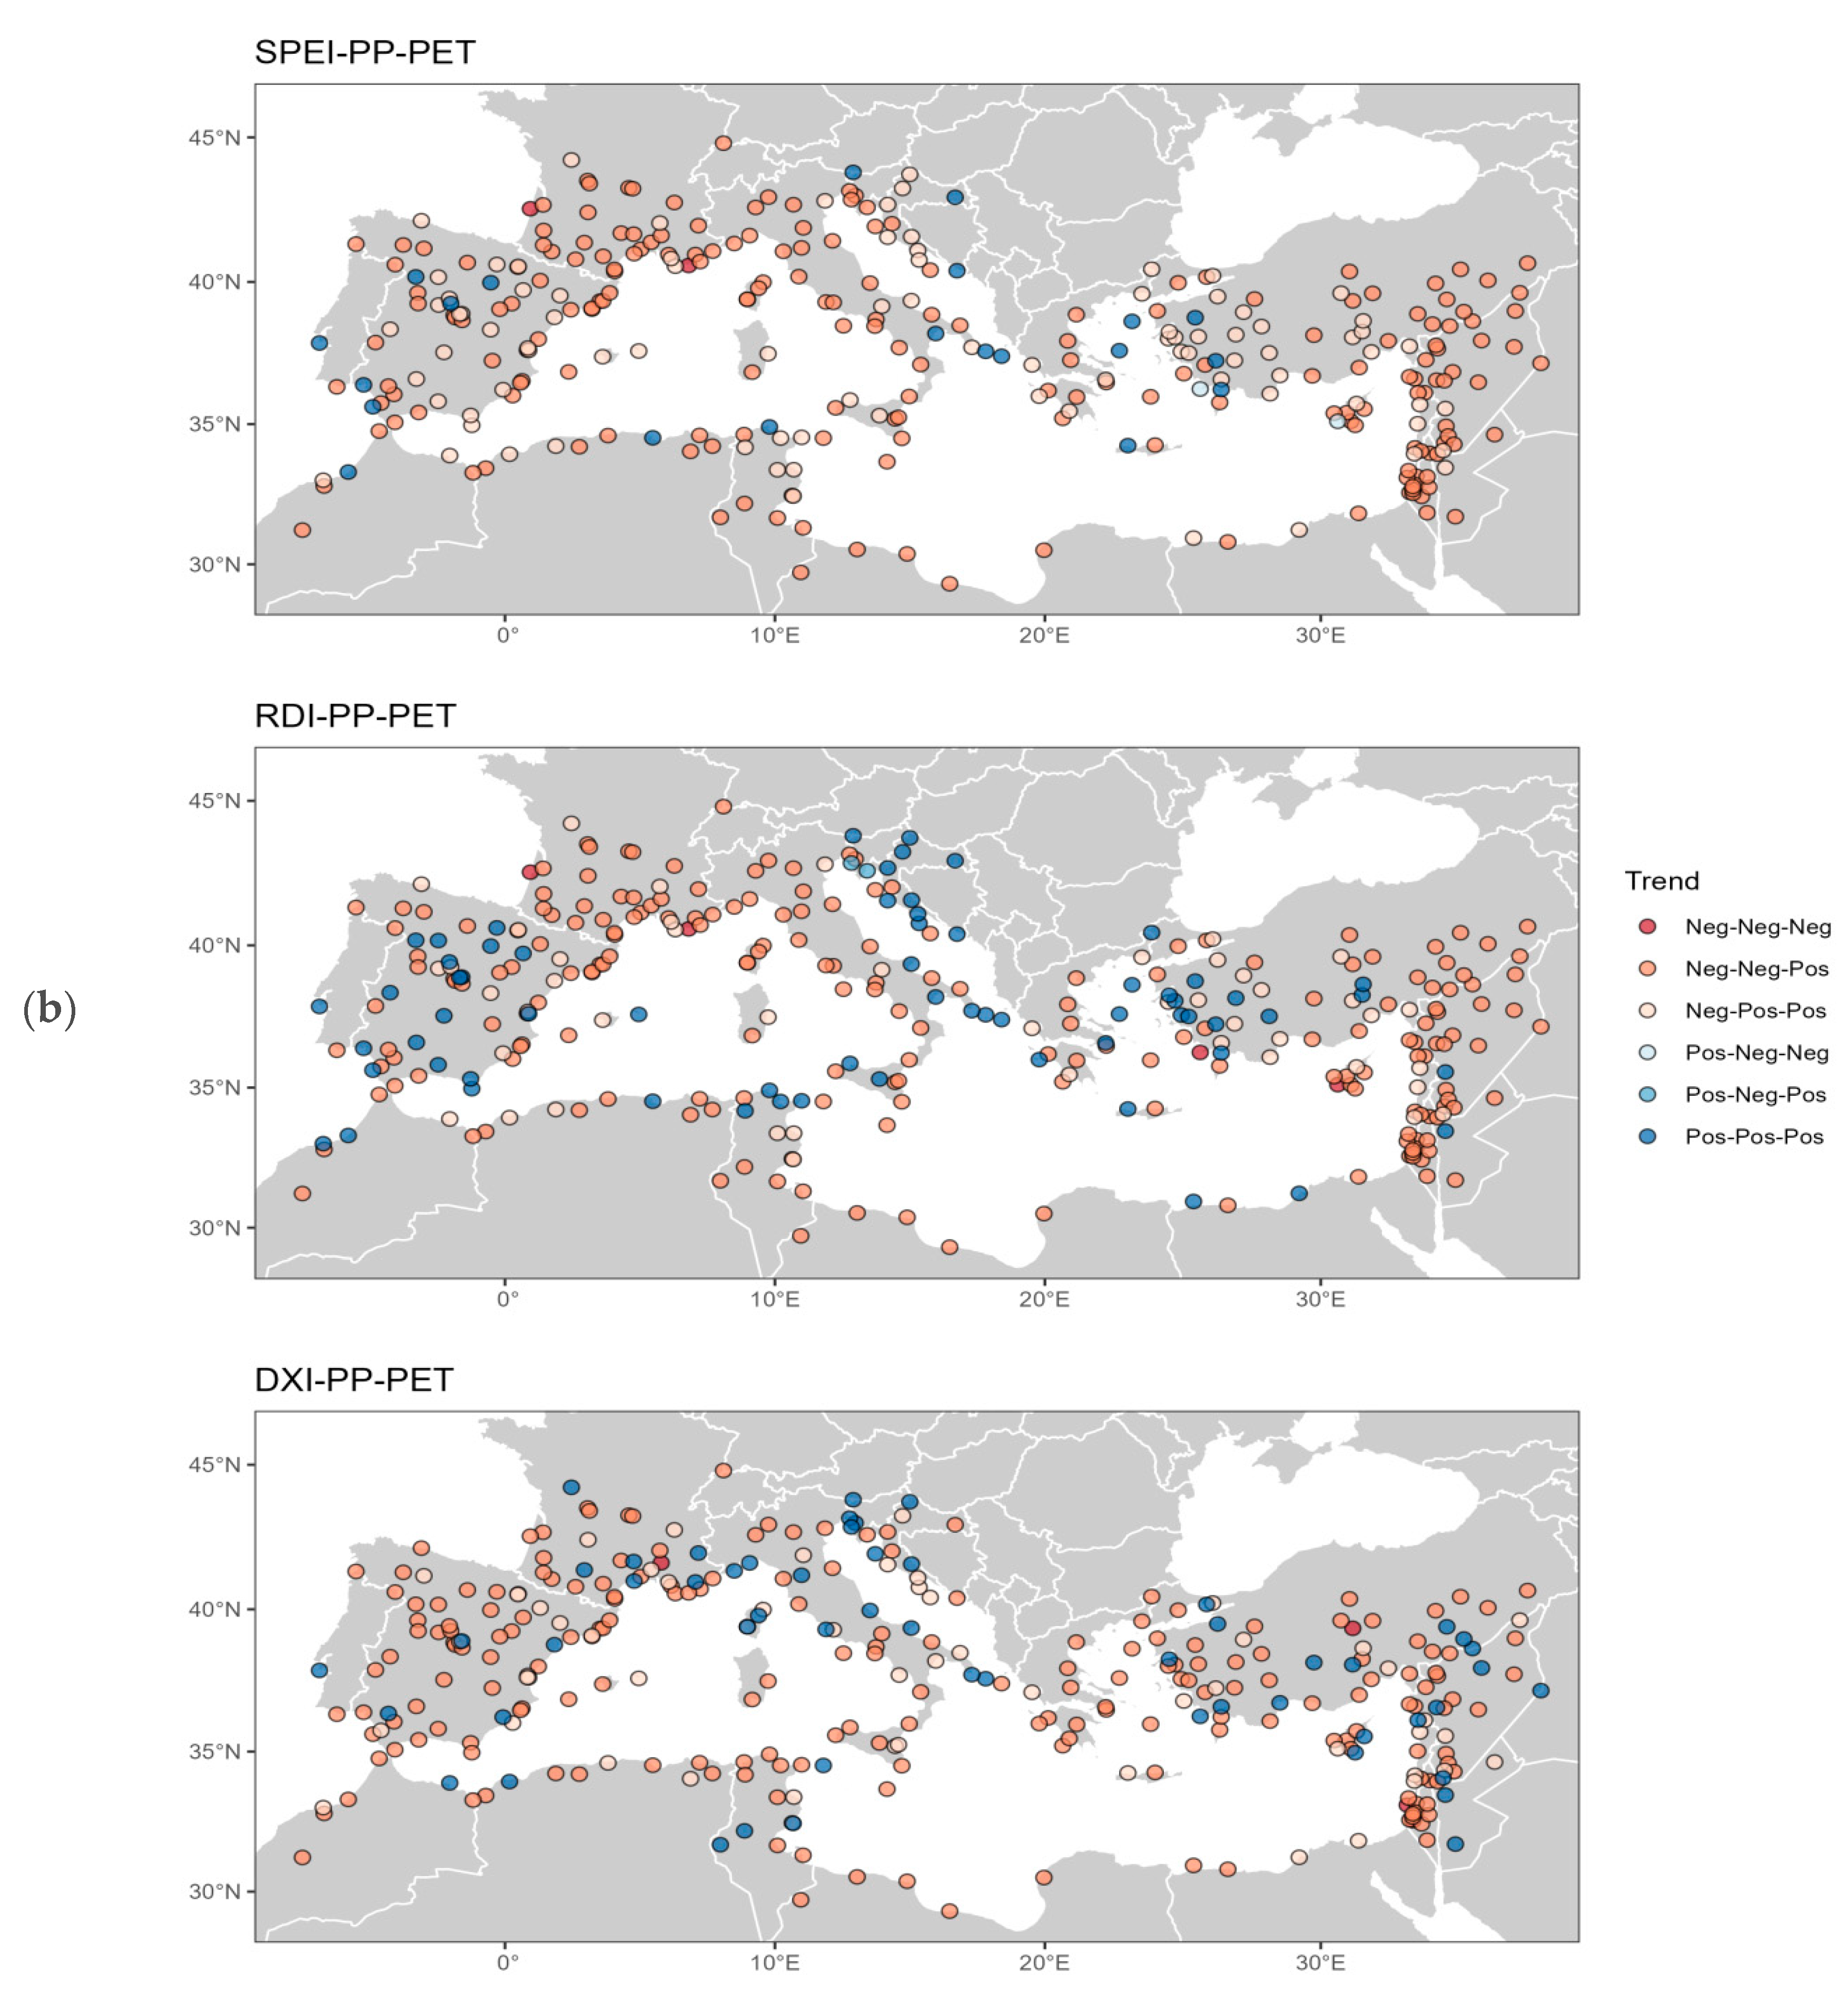
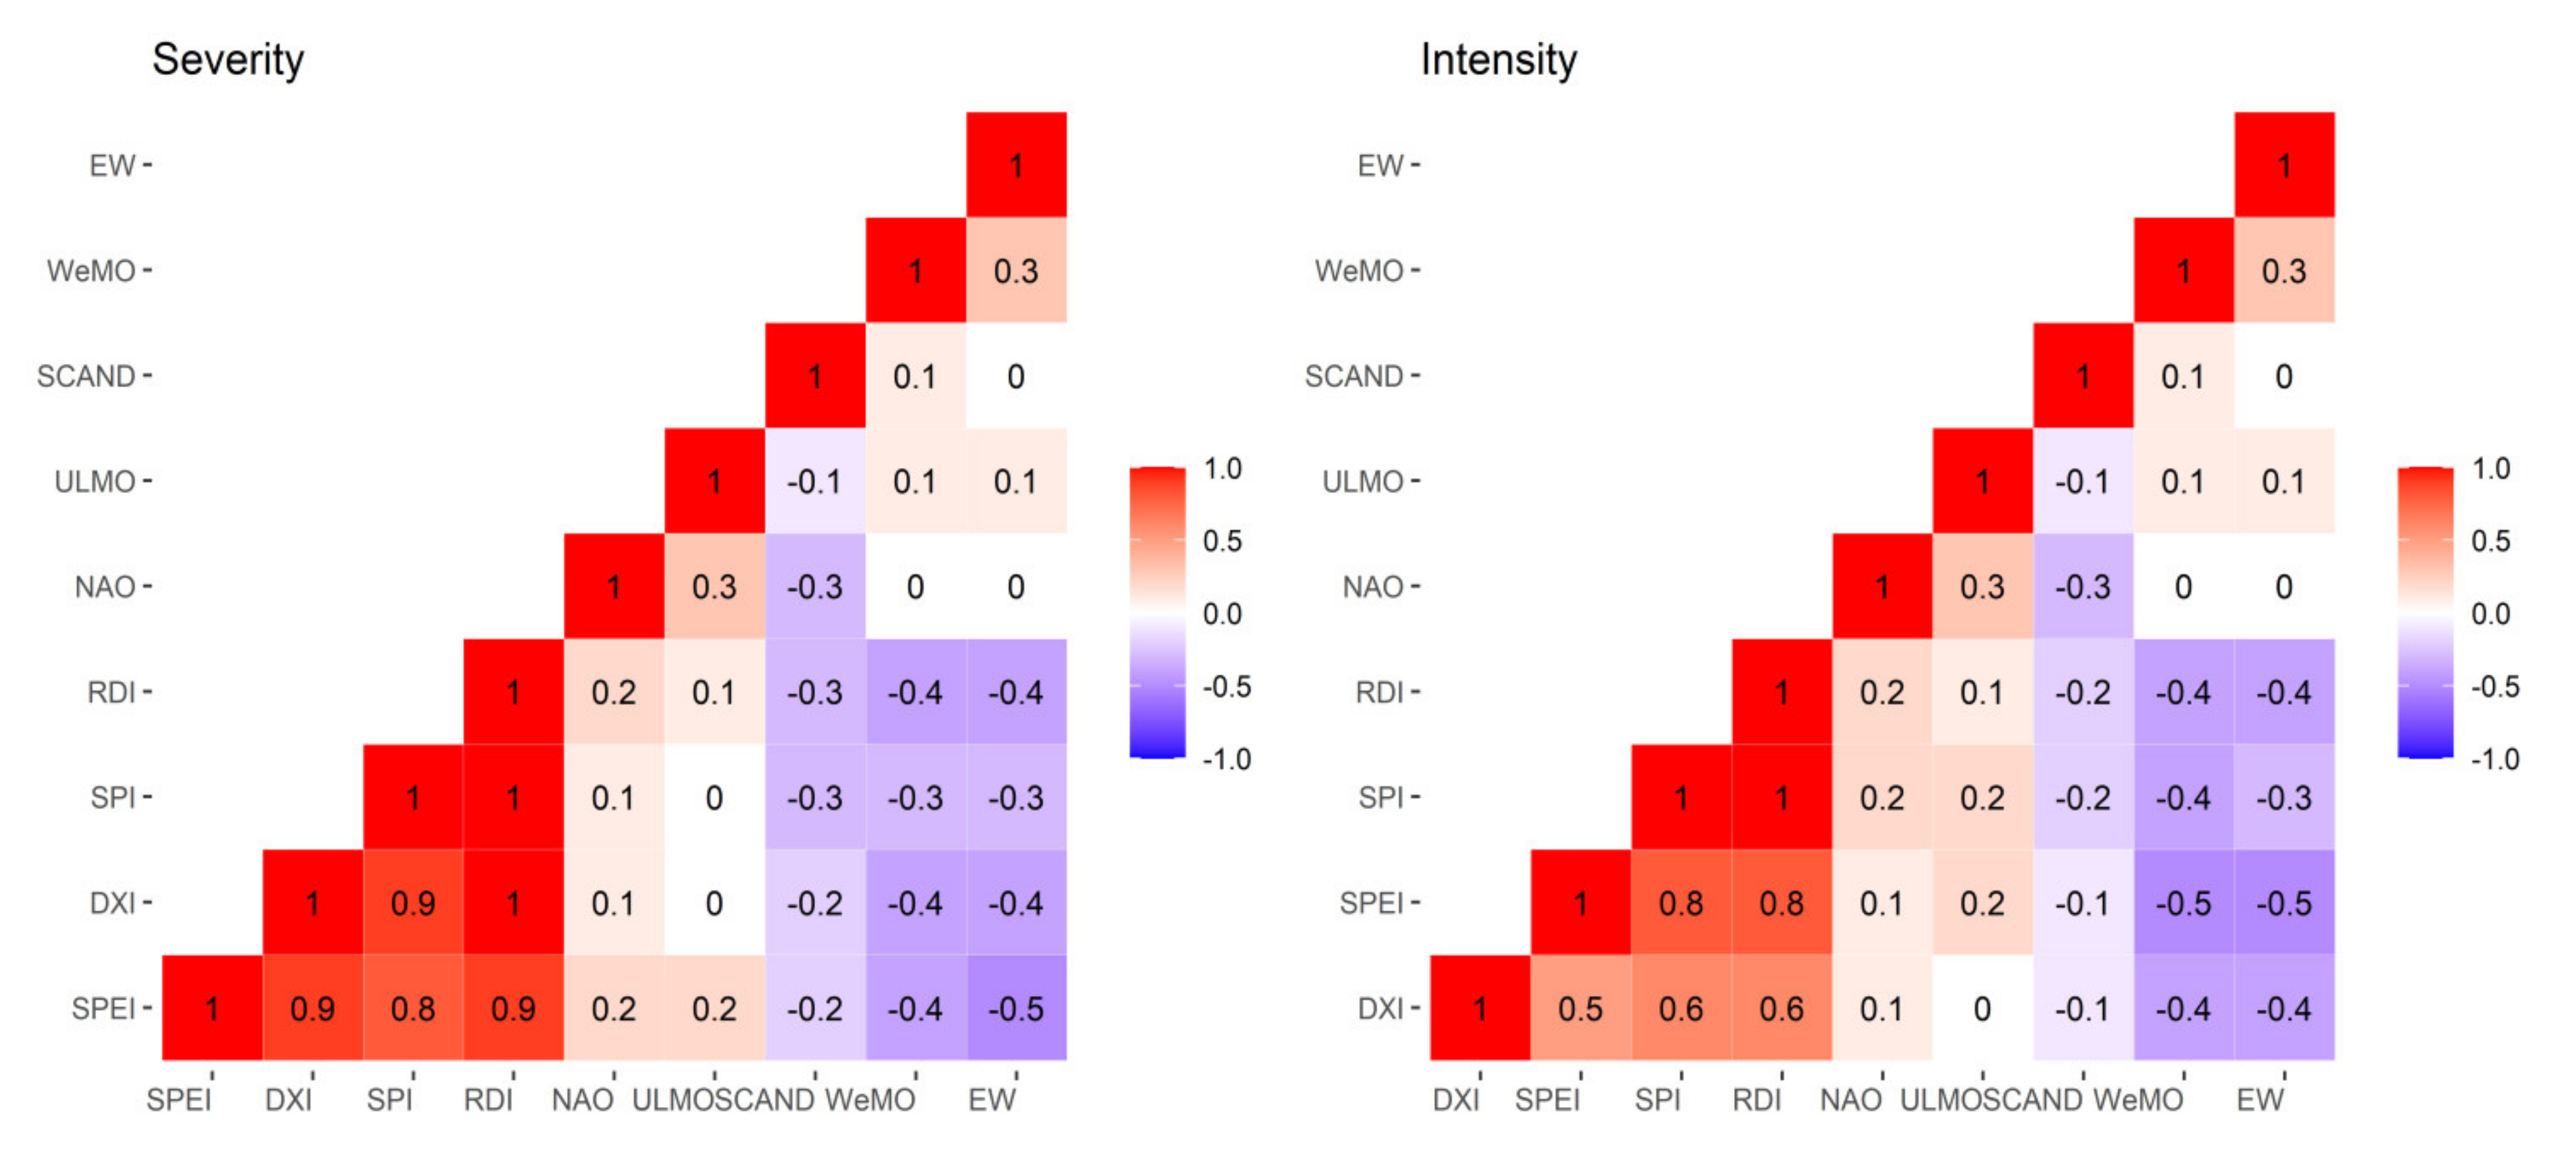
3.5. Drought Dynamics, Large Scale Atmospheric Controls of Widespread Drought Events over the MED
4. Conclusions
Author Contributions
Funding
Institutional Review Board Statement
Informed Consent Statement
Data Availability Statement
Acknowledgments
Conflicts of Interest
Appendix A

| ID | Long | Lat | Mean | Med | Max | Min | Sk | Ku | CV% | LCL | UCL |
|---|---|---|---|---|---|---|---|---|---|---|---|
| ST01 | 7.48 | 36.50 | 656.4 | 622.4 | 1126.6 | 61.7 | −0.2 | 2.9 | 26.3 | 606.0 | 706.9 |
| ST02 | 1.20 | 36.12 | 384.2 | 400.1 | 618.0 | 61.7 | −0.2 | 0.0 | 30.4 | 350.0 | 418.3 |
| ST03 | 3.25 | 36.68 | 604.2 | 606.6 | 884.9 | 269.0 | 0.0 | −0.8 | 26.6 | 557.2 | 651.1 |
| ST04 | 2.14 | 36.18 | 729.1 | 726.9 | 1069.6 | 61.7 | −0.6 | 0.6 | 29.5 | 666.3 | 791.9 |
| ST05 | −0.60 | 35.63 | 338.6 | 324.5 | 546.5 | 61.7 | −0.2 | 0.3 | 28.7 | 310.2 | 366.9 |
| ST06 | 18.08 | 42.65 | 1120.3 | 1051.3 | 1911.6 | 726.1 | 0.9 | 0.5 | 24.2 | 1041.2 | 1199.4 |
| ST07 | 15.36 | 44.55 | 1404.3 | 1367.6 | 2552.5 | 683.3 | 1.1 | 5.1 | 20.5 | 1320.0 | 1488.6 |
| ST08 | 16.45 | 43.16 | 736.9 | 711.9 | 1257.8 | 383.7 | 0.7 | 0.8 | 24.8 | 683.5 | 790.2 |
| ST09 | 16.20 | 44.03 | 1031.8 | 1007.4 | 1450.2 | 494.3 | 0.0 | −0.3 | 20.1 | 971.1 | 1092.5 |
| ST10 | 16.90 | 42.76 | 637.7 | 639.1 | 967.9 | 368.0 | 0.0 | −0.4 | 23.2 | 594.4 | 681.0 |
| ST11 | 15.23 | 45.26 | 1549.5 | 1489.7 | 2244.1 | 1103.2 | 0.5 | 0.7 | 14.7 | 1482.8 | 1616.1 |
| ST12 | 18.38 | 45.32 | 679.5 | 654.6 | 1010.7 | 317.0 | 0.2 | 0.1 | 21.7 | 636.5 | 722.5 |
| ST13 | 14.27 | 45.20 | 1574.7 | 1565.4 | 2105.2 | 991.4 | 0.0 | −0.7 | 18.2 | 1490.8 | 1658.6 |
| ST14 | 16.43 | 43.51 | 803.1 | 767.7 | 1203.7 | 486.6 | 0.1 | −0.7 | 22.1 | 751.2 | 855.0 |
| ST15 | 16.38 | 46.30 | 849.3 | 858.9 | 1310.9 | 481.2 | 0.4 | 1.4 | 18.4 | 803.7 | 895.0 |
| ST16 | 15.12 | 44.07 | 895.9 | 907.1 | 1359.7 | 508.8 | 0.1 | −0.2 | 20.6 | 841.8 | 949.9 |
| ST17 | 15.98 | 45.81 | 879.0 | 864.0 | 1229.6 | 520.8 | 0.0 | 0.6 | 15.5 | 839.2 | 918.8 |
| ST18 | 14.59 | 44.49 | 1983.9 | 1977.7 | 2629.5 | 1302.1 | −0.2 | −0.5 | 15.8 | 1892.5 | 2075.4 |
| ST19 | 32.98 | 34.58 | 362.5 | 344.2 | 650.7 | 61.7 | 0.3 | −0.2 | 35.9 | 324.4 | 400.5 |
| ST20 | 32.92 | 34.93 | 839.2 | 899.4 | 1400.8 | 22.0 | −0.5 | 0.1 | 35.4 | 752.5 | 926.0 |
| ST21 | 33.36 | 34.88 | 335.4 | 310.8 | 663.0 | 160.7 | 0.9 | 0.3 | 37.3 | 298.9 | 371.9 |
| ST22 | 33.00 | 34.70 | 401.7 | 383.4 | 703.1 | 164.6 | 0.4 | −0.3 | 32.6 | 363.4 | 439.9 |
| ST23 | 33.40 | 35.15 | 315.6 | 304.1 | 571.1 | 133.5 | 0.4 | −0.2 | 32.8 | 285.4 | 345.8 |
| ST24 | 32.48 | 34.71 | 431.8 | 414.5 | 814.8 | 189.9 | 0.6 | 0.8 | 29.3 | 394.8 | 468.7 |
| ST25 | 32.43 | 35.03 | 448.5 | 446.4 | 814.8 | 189.9 | 0.7 | 1.0 | 28.3 | 411.5 | 485.6 |
| ST26 | 29.95 | 31.20 | 195.5 | 186.6 | 516.1 | 24.5 | 1.1 | 1.8 | 49.3 | 167.3 | 223.6 |
| ST27 | 27.21 | 31.33 | 141.3 | 134.1 | 286.2 | 28.7 | 0.7 | 0.5 | 37.1 | 126.0 | 156.6 |
| ST28 | 32.29 | 31.26 | 85.1 | 61.0 | 423.4 | 6.9 | 3.1 | 11.0 | 94.6 | 61.6 | 108.6 |
| ST29 | 8.80 | 41.91 | 646.4 | 648.8 | 925.8 | 373.8 | −0.1 | −1.1 | 24.6 | 599.8 | 692.9 |
| ST30 | 1.40 | 43.64 | 642.4 | 627.9 | 1010.0 | 423.2 | 0.6 | 0.1 | 22.0 | 601.2 | 683.7 |
| ST31 | 9.48 | 42.55 | 807.8 | 773.2 | 1375.2 | 550.8 | 0.8 | 0.3 | 23.2 | 753.1 | 862.6 |
| ST32 | 1.20 | 45.90 | 1020.8 | 1006.5 | 1448.5 | 721.2 | 0.4 | 0.8 | 14.1 | 978.6 | 1063.0 |
| ST33 | −1.46 | 35.01 | 345.8 | 339.0 | 723.0 | 139.0 | 0.8 | 1.8 | 32.3 | 313.1 | 378.5 |
| ST34 | 9.28 | 42.33 | 766.4 | 726.9 | 1171.3 | 453.3 | 0.3 | −0.9 | 24.6 | 711.5 | 821.4 |
| ST35 | 6.43 | 43.50 | 666.1 | 681.2 | 1027.3 | 397.3 | 0.2 | −0.5 | 24.6 | 618.2 | 714.1 |
| ST36 | 5.56 | 43.04 | 644.0 | 589.8 | 1115.4 | 304.1 | 0.5 | −0.1 | 30.8 | 586.0 | 701.9 |
| ST37 | 3.16 | 45.78 | 578.2 | 572.6 | 825.8 | 353.4 | 0.2 | −0.4 | 19.5 | 545.3 | 611.1 |
| ST38 | 6.50 | 44.56 | 673.8 | 668.5 | 944.7 | 267.2 | −0.4 | 0.0 | 22.6 | 629.4 | 718.2 |
| ST39 | 1.40 | 44.75 | 834.5 | 809.0 | 1047.5 | 544.6 | −0.1 | −0.6 | 15.3 | 797.2 | 871.9 |
| ST40 | 5.33 | 45.36 | 926.5 | 929.1 | 1412.5 | 499.9 | 0.2 | 0.3 | 20.5 | 871.1 | 981.9 |
| ST41 | 12.61 | 44.03 | 659.5 | 610.4 | 1097.3 | 312.9 | 0.4 | −0.6 | 31.4 | 598.9 | 720.0 |
| ST42 | 5.23 | 43.45 | 514.8 | 515.1 | 839.0 | 259.9 | 0.2 | −0.7 | 29.1 | 471.0 | 558.6 |
| ST43 | −0.70 | 44.83 | 910.3 | 922.2 | 1230.6 | 560.6 | −0.1 | −0.8 | 20.2 | 856.5 | 964.2 |
| ST44 | 3.01 | 44.11 | 725.5 | 716.6 | 1034.2 | 438.0 | 0.3 | −0.4 | 19.2 | 684.9 | 766.2 |
| ST45 | 3.58 | 44.11 | 1880.7 | 1801.6 | 3527.4 | 919.9 | 0.9 | 0.8 | 29.1 | 1720.8 | 2040.6 |
| ST46 | −0.50 | 43.91 | 952.0 | 917.2 | 1665.0 | 708.7 | 1.6 | 4.6 | 18.5 | 900.4 | 1003.6 |
| ST47 | 4.73 | 44.58 | 915.0 | 895.2 | 1583.0 | 512.1 | 0.6 | 0.5 | 25.1 | 847.8 | 982.1 |
| ST48 | 3.96 | 43.58 | 641.2 | 609.8 | 1148.4 | 310.8 | 0.6 | 0.1 | 29.0 | 586.7 | 695.6 |
| ST49 | 7.20 | 43.65 | 767.9 | 787.4 | 1254.0 | 265.9 | −0.1 | −0.5 | 29.6 | 701.5 | 834.4 |
| ST50 | 4.40 | 43.86 | 734.5 | 720.0 | 1173.9 | 329.2 | 0.3 | −0.4 | 27.1 | 676.4 | 792.6 |
| ST51 | 4.83 | 44.13 | 701.2 | 676.9 | 1303.8 | 253.2 | 0.7 | 1.3 | 27.7 | 644.3 | 758.0 |
| ST52 | 2.89 | 42.69 | 550.7 | 509.0 | 1009.1 | 299.5 | 0.9 | 0.3 | 29.2 | 503.7 | 597.6 |
| ST53 | 14.91 | 37.41 | 571.0 | 509.3 | 1338.6 | 197.8 | 1.1 | 0.7 | 49.2 | 488.8 | 653.1 |
| ST54 | 3.68 | 43.40 | 541.0 | 521.2 | 978.1 | 249.5 | 0.5 | −0.3 | 34.3 | 486.8 | 595.2 |
| ST55 | 1.10 | 43.00 | 988.3 | 965.6 | 1329.8 | 648.6 | 0.3 | −0.1 | 15.2 | 944.4 | 1032.2 |
| ST56 | 5.35 | 43.31 | 604.3 | 593.1 | 1128.3 | 302.0 | 0.8 | 0.6 | 31.4 | 549.0 | 659.7 |
| ST57 | 0.00 | 43.18 | 1072.5 | 1033.8 | 1423.4 | 735.3 | 0.2 | −1.1 | 16.9 | 1019.6 | 1125.4 |
| ST58 | −7.66 | 33.56 | 388.4 | 378.0 | 992.0 | 148.5 | 1.7 | 6.2 | 36.6 | 346.9 | 429.9 |
| ST59 | 3.34 | 45.76 | 546.5 | 525.3 | 865.4 | 180.3 | 0.1 | 0.3 | 25.4 | 505.9 | 587.2 |
| ST60 | 7.51 | 47.60 | 786.5 | 740.4 | 1436.6 | 467.3 | 1.2 | 2.1 | 25.2 | 728.6 | 844.5 |
| ST61 | 2.87 | 42.77 | 541.8 | 517.1 | 883.7 | 293.1 | 0.6 | −0.7 | 29.0 | 495.9 | 587.7 |
| ST62 | −1.25 | 44.63 | 785.3 | 771.9 | 1115.8 | 440.2 | −0.1 | 0.1 | 19.2 | 741.4 | 829.3 |
| ST63 | 6.66 | 43.25 | 764.4 | 789.9 | 1254.0 | 289.6 | 0.0 | −0.4 | 29.2 | 699.1 | 829.6 |
| ST64 | −0.41 | 43.38 | 1072.5 | 1045.2 | 1554.7 | 738.1 | 0.5 | −0.4 | 17.6 | 1017.3 | 1127.8 |
| ST65 | 15.28 | 40.01 | 676.4 | 659.9 | 1205.2 | 344.4 | 0.4 | −0.2 | 30.6 | 613.8 | 739.0 |
| ST66 | 6.15 | 43.09 | 685.0 | 663.7 | 1699.3 | 286.8 | 1.5 | 4.1 | 38.0 | 608.9 | 761.1 |
| ST67 | 1.30 | 45.80 | 1020.8 | 1006.5 | 1448.5 | 721.2 | 0.4 | 0.8 | 14.1 | 978.6 | 1063.0 |
| ST68 | 8.79 | 41.92 | 678.4 | 668.4 | 1076.7 | 369.8 | 0.3 | −0.4 | 27.3 | 624.3 | 732.4 |
| ST69 | 6.61 | 36.28 | 515.0 | 486.0 | 868.2 | 253.3 | 0.6 | 0.2 | 28.0 | 472.8 | 557.2 |
| ST70 | 0.31 | 46.58 | 694.3 | 684.0 | 906.0 | 470.2 | −0.1 | −0.4 | 15.4 | 663.1 | 725.6 |
| ST71 | 2.31 | 43.21 | 590.6 | 576.1 | 1176.3 | 327.2 | 1.3 | 4.4 | 24.9 | 547.7 | 633.5 |
| ST72 | −5.35 | 36.15 | 759.6 | 751.3 | 1886.0 | 307.9 | 1.7 | 4.3 | 41.6 | 667.4 | 851.9 |
| ST73 | 20.77 | 38.92 | 906.2 | 909.3 | 1616.7 | 438.9 | 0.6 | 1.5 | 23.6 | 843.7 | 968.7 |
| ST74 | 25.91 | 40.85 | 520.3 | 500.0 | 891.7 | 324.2 | 0.7 | 0.0 | 27.4 | 478.7 | 561.9 |
| ST75 | 21.28 | 37.91 | 812.3 | 786.4 | 1331.5 | 402.8 | 0.4 | 0.1 | 25.9 | 750.9 | 873.8 |
| ST76 | 23.70 | 38.00 | 410.2 | 412.0 | 908.2 | 150.6 | 1.2 | 5.2 | 29.9 | 374.4 | 446.0 |
| ST77 | 28.08 | 36.40 | 689.0 | 666.0 | 1328.4 | 294.1 | 0.9 | 0.9 | 33.5 | 621.6 | 756.4 |
| ST78 | 24.48 | 38.96 | 472.3 | 446.5 | 1142.6 | 150.1 | 1.2 | 2.4 | 40.7 | 416.1 | 528.6 |
| ST79 | 23.70 | 37.89 | 348.6 | 359.2 | 571.5 | 10.9 | −0.5 | 0.4 | 33.4 | 314.6 | 382.5 |
| ST80 | 25.18 | 35.33 | 467.3 | 477.2 | 714.6 | 272.8 | 0.0 | −0.7 | 23.0 | 435.8 | 498.8 |
| ST81 | 18.91 | 39.61 | 1026.1 | 1015.7 | 1561.9 | 624.6 | 0.5 | 0.4 | 21.0 | 963.1 | 1089.1 |
| ST82 | 22.41 | 39.61 | 428.0 | 430.3 | 704.3 | 227.6 | 0.3 | 1.1 | 21.7 | 400.9 | 455.0 |
| ST83 | 21.70 | 36.83 | 628.4 | 629.1 | 1017.3 | 68.6 | −0.5 | 0.7 | 32.5 | 568.7 | 688.1 |
| ST84 | 26.60 | 39.06 | 621.3 | 650.0 | 927.6 | 240.5 | −0.3 | −0.2 | 25.8 | 574.4 | 668.2 |
| ST85 | 25.38 | 37.10 | 368.0 | 351.0 | 698.7 | 178.0 | 0.7 | 0.2 | 33.6 | 331.9 | 404.1 |
| ST86 | 26.91 | 37.70 | 679.6 | 660.7 | 1042.4 | 374.7 | 0.2 | −0.6 | 25.1 | 629.7 | 729.6 |
| ST87 | 24.11 | 35.48 | 644.8 | 634.2 | 1099.0 | 262.2 | 0.4 | −0.6 | 30.8 | 586.8 | 702.8 |
| ST88 | 22.96 | 40.51 | 429.2 | 419.1 | 754.1 | 210.0 | 0.5 | 0.9 | 24.6 | 398.3 | 460.0 |
| ST89 | 22.40 | 37.53 | 728.5 | 696.7 | 1334.5 | 359.9 | 0.6 | 1.0 | 26.2 | 672.7 | 784.3 |
| ST90 | 34.39 | 31.49 | 486.9 | 445.8 | 1020.2 | 180.2 | 1.0 | 0.5 | 41.3 | 428.2 | 545.6 |
| ST91 | 35.58 | 32.65 | 379.1 | 375.9 | 759.9 | 154.9 | 0.6 | 1.3 | 30.8 | 344.9 | 413.2 |
| ST92 | 34.78 | 31.23 | 189.5 | 179.7 | 346.7 | 64.7 | 0.4 | −0.6 | 39.1 | 167.9 | 211.2 |
| ST93 | 34.81 | 32.00 | 525.4 | 505.8 | 1104.8 | 233.0 | 1.1 | 2.4 | 31.3 | 477.3 | 573.4 |
| ST94 | 35.09 | 33.00 | 614.6 | 616.6 | 934.9 | 355.3 | 0.1 | −0.5 | 22.8 | 573.7 | 655.5 |
| ST95 | 34.70 | 31.70 | 536.8 | 487.2 | 991.9 | 195.5 | 0.6 | 0.1 | 32.4 | 485.9 | 587.7 |
| ST96 | 35.27 | 32.83 | 465.1 | 475.0 | 894.1 | 159.6 | 0.3 | 0.9 | 31.1 | 422.9 | 507.4 |
| ST97 | 35.15 | 31.47 | 666.4 | 679.7 | 982.7 | 295.0 | −0.1 | −0.8 | 27.3 | 613.1 | 719.6 |
| ST98 | 35.21 | 31.86 | 525.9 | 508.1 | 934.3 | 223.0 | 0.4 | 0.2 | 30.1 | 479.7 | 572.1 |
| ST99 | 34.50 | 31.43 | 490.1 | 476.5 | 902.5 | 187.3 | 0.5 | 0.2 | 32.2 | 444.1 | 536.2 |
| ST100 | 34.53 | 31.56 | 533.1 | 525.3 | 1175.2 | 199.9 | 1.1 | 2.2 | 34.9 | 478.8 | 587.5 |
| ST101 | 34.80 | 30.60 | 76.4 | 73.5 | 158.4 | 19.8 | 0.5 | −0.5 | 51.1 | 65.0 | 87.9 |
| ST102 | 34.46 | 32.04 | 524.3 | 495.2 | 1175.2 | 190.2 | 1.2 | 2.3 | 35.8 | 469.4 | 579.2 |
| ST103 | 16.13 | 39.34 | 452.2 | 428.2 | 975.9 | 126.0 | 0.5 | 0.4 | 40.1 | 399.3 | 505.2 |
| ST104 | 16.78 | 41.13 | 516.9 | 544.1 | 779.0 | 178.3 | −0.3 | −0.4 | 28.5 | 473.8 | 559.9 |
| ST105 | 9.70 | 45.66 | 1035.4 | 1019.2 | 1697.0 | 405.9 | 0.1 | −0.8 | 31.2 | 941.1 | 1129.7 |
| ST106 | 11.30 | 44.53 | 738.5 | 749.0 | 1091.4 | 430.6 | 0.1 | −0.7 | 22.2 | 690.7 | 786.4 |
| ST107 | 17.95 | 40.65 | 576.0 | 621.0 | 946.8 | 109.9 | −0.5 | 0.2 | 32.3 | 521.7 | 630.3 |
| ST108 | 9.05 | 39.25 | 417.9 | 422.8 | 836.7 | 164.1 | 0.7 | 0.8 | 35.6 | 374.4 | 461.3 |
| ST109 | 14.65 | 41.56 | 676.3 | 663.7 | 1356.9 | 248.4 | 0.8 | 1.1 | 35.0 | 607.2 | 745.4 |
| ST110 | 9.71 | 39.93 | 397.4 | 372.2 | 846.0 | 43.1 | 0.5 | 0.5 | 39.8 | 351.1 | 443.6 |
| ST111 | 8.16 | 43.95 | 659.7 | 673.4 | 1115.1 | 295.9 | 0.0 | 0.1 | 27.3 | 607.1 | 712.3 |
| ST112 | 15.05 | 37.46 | 566.8 | 462.4 | 1338.6 | 224.3 | 1.0 | 0.3 | 52.0 | 480.7 | 653.0 |
| ST113 | 15.13 | 36.68 | 567.2 | 543.8 | 1247.7 | 174.2 | 0.6 | 0.3 | 43.8 | 494.5 | 639.8 |
| ST114 | 11.20 | 43.80 | 871.1 | 824.0 | 1518.0 | 580.8 | 1.1 | 1.5 | 22.5 | 813.8 | 928.5 |
| ST115 | 8.85 | 44.25 | 1204.8 | 1244.8 | 2174.4 | 367.2 | 0.3 | 0.3 | 32.6 | 1090.1 | 1319.4 |
| ST116 | 11.06 | 42.75 | 640.3 | 612.9 | 1145.0 | 196.4 | 0.2 | 0.0 | 33.3 | 578.0 | 702.7 |
| ST117 | 15.55 | 38.20 | 899.6 | 879.3 | 1738.2 | 463.3 | 0.8 | 1.7 | 27.9 | 826.2 | 973.0 |
| ST118 | 9.11 | 45.28 | 936.1 | 908.8 | 1462.6 | 501.0 | 0.2 | −0.4 | 24.7 | 868.6 | 1003.6 |
| ST119 | 15.95 | 41.70 | 589.4 | 554.7 | 875.9 | 287.5 | 0.4 | 0.2 | 19.9 | 555.1 | 623.6 |
| ST120 | 19.55 | 39.37 | 1020.1 | 1011.0 | 1635.8 | 624.6 | 0.7 | 0.7 | 21.7 | 955.4 | 1084.8 |
| ST121 | 13.10 | 38.18 | 956.7 | 666.8 | 4206.7 | 227.3 | 2.4 | 5.2 | 92.7 | 697.6 | 1215.8 |
| ST122 | 11.96 | 36.81 | 672.1 | 570.0 | 1724.2 | 61.7 | 1.3 | 1.6 | 51.9 | 570.1 | 774.0 |
| ST123 | 14.20 | 42.43 | 668.0 | 685.5 | 960.0 | 240.0 | −0.6 | 1.2 | 20.2 | 628.6 | 707.3 |
| ST124 | 10.38 | 43.68 | 937.0 | 920.2 | 1764.8 | 487.7 | 1.0 | 1.3 | 29.6 | 855.8 | 1018.2 |
| ST125 | 12.95 | 40.91 | 645.5 | 635.6 | 1223.5 | 278.4 | 0.3 | −0.5 | 34.3 | 580.8 | 710.3 |
| ST126 | 12.55 | 41.78 | 842.6 | 765.9 | 2531.0 | 321.9 | 2.7 | 11.0 | 42.6 | 737.6 | 947.5 |
| ST127 | 18.35 | 39.81 | 533.5 | 527.3 | 1019.3 | 61.7 | 0.6 | 0.8 | 37.3 | 475.3 | 591.7 |
| ST128 | 14.37 | 41.09 | 635.8 | 644.7 | 1350.0 | 68.8 | 0.1 | 1.0 | 38.2 | 564.8 | 706.8 |
| ST129 | 12.50 | 37.91 | 578.3 | 454.4 | 1695.2 | 223.7 | 1.9 | 3.8 | 56.8 | 482.4 | 674.2 |
| ST130 | 25.25 | 39.93 | 516.3 | 482.3 | 971.2 | 211.8 | 0.5 | 0.1 | 32.9 | 466.6 | 565.9 |
| ST131 | 13.75 | 45.65 | 912.5 | 900.8 | 1382.6 | 484.9 | 0.1 | −0.3 | 22.6 | 852.3 | 972.6 |
| ST132 | 12.33 | 45.50 | 800.8 | 776.7 | 1946.5 | 61.7 | 1.1 | 2.5 | 42.3 | 701.9 | 899.7 |
| ST133 | 10.86 | 45.38 | 793.5 | 808.4 | 1177.9 | 294.5 | −0.2 | 0.3 | 23.3 | 739.0 | 848.0 |
| ST134 | 14.30 | 40.85 | 939.2 | 840.0 | 2117.6 | 257.6 | 1.0 | 1.4 | 38.2 | 834.3 | 1044.2 |
| ST135 | −8.63 | 42.23 | 1748.7 | 1808.2 | 2381.5 | 967.7 | −0.3 | −0.6 | 20.9 | 1642.1 | 1855.2 |
| ST136 | −0.80 | 37.78 | 289.7 | 290.1 | 628.1 | 105.4 | 0.7 | 0.4 | 41.0 | 255.0 | 324.4 |
| ST137 | −3.78 | 40.38 | 427.4 | 440.7 | 628.1 | 250.4 | 0.1 | −0.8 | 23.1 | 398.6 | 456.3 |
| ST138 | −3.46 | 40.48 | 372.9 | 367.3 | 529.3 | 192.0 | 0.0 | −0.6 | 22.3 | 348.6 | 397.2 |
| ST139 | 35.98 | 31.98 | 269.9 | 227.0 | 603.3 | 101.3 | 1.0 | 0.3 | 49.1 | 231.2 | 308.6 |
| ST140 | 35.85 | 32.54 | 425.2 | 429.0 | 778.2 | 104.7 | 0.1 | 0.1 | 31.9 | 385.6 | 464.8 |
| ST141 | 38.20 | 32.56 | 80.3 | 78.0 | 250.0 | 7.8 | 1.4 | 3.2 | 59.0 | 66.5 | 94.2 |
| ST142 | 35.48 | 33.81 | 716.8 | 717.5 | 1099.5 | 352.0 | 0.0 | −0.8 | 24.9 | 664.6 | 768.9 |
| ST143 | 35.80 | 34.45 | 763.0 | 785.7 | 1355.6 | 396.1 | 0.4 | 0.1 | 28.1 | 700.3 | 825.7 |
| ST144 | 20.26 | 32.10 | 265.1 | 243.6 | 591.6 | 55.3 | 1.2 | 1.6 | 41.3 | 233.1 | 297.0 |
| ST145 | 15.05 | 32.41 | 246.7 | 235.2 | 455.2 | 89.3 | 0.3 | −0.8 | 40.7 | 217.3 | 276.0 |
| ST146 | 10.98 | 31.86 | 135.0 | 124.5 | 570.0 | 22.5 | 2.3 | 7.3 | 76.8 | 104.7 | 165.3 |
| ST147 | 8.75 | 36.95 | 1237.3 | 1162.5 | 2364.5 | 654.0 | 1.1 | 1.4 | 29.2 | 1131.7 | 1342.9 |
| ST148 | 16.58 | 31.20 | 176.5 | 176.0 | 380.0 | 42.9 | 0.8 | 0.6 | 44.2 | 153.7 | 199.4 |
| ST149 | 13.15 | 32.66 | 276.6 | 275.0 | 574.4 | 52.3 | 0.5 | −0.2 | 45.2 | 240.0 | 313.1 |
| ST150 | 14.48 | 35.85 | 587.5 | 554.6 | 1361.7 | 133.9 | 0.8 | 2.3 | 37.5 | 523.1 | 651.9 |
| ST151 | −8.03 | 31.61 | 220.2 | 208.5 | 509.0 | 61.7 | 0.8 | 0.9 | 41.9 | 193.2 | 247.1 |
| ST152 | −7.58 | 33.36 | 290.3 | 268.5 | 707.9 | 61.7 | 1.0 | 1.3 | 47.7 | 249.9 | 330.8 |
| ST153 | −1.93 | 34.78 | 267.9 | 269.1 | 422.9 | 106.2 | −0.1 | −0.4 | 27.8 | 246.1 | 289.6 |
| ST154 | −6.77 | 34.04 | 491.0 | 494.3 | 1209.1 | 61.7 | 1.3 | 2.7 | 44.5 | 427.2 | 554.8 |
| ST155 | −5.90 | 35.73 | 626.9 | 590.4 | 1643.6 | 61.7 | 1.2 | 3.7 | 42.6 | 548.7 | 705.0 |
| ST156 | −6.73 | 41.80 | 743.8 | 742.1 | 1243.1 | 435.5 | 0.5 | −0.6 | 28.4 | 682.2 | 805.5 |
| ST157 | −7.96 | 37.01 | 484.5 | 465.6 | 1157.0 | 173.0 | 1.5 | 2.9 | 39.7 | 428.3 | 540.6 |
| ST158 | −9.09 | 38.43 | 762.5 | 775.4 | 1591.0 | 416.0 | 0.8 | 1.2 | 32.7 | 689.7 | 835.4 |
| ST159 | 13.56 | 45.51 | 917.5 | 940.3 | 1462.4 | 61.7 | −0.8 | 2.7 | 26.4 | 846.8 | 988.3 |
| ST160 | 13.71 | 46.50 | 1516.5 | 1493.8 | 2083.3 | 1135.1 | 0.3 | −0.4 | 15.1 | 1449.5 | 1583.6 |
| ST161 | −2.50 | 36.80 | 194.0 | 198.5 | 551.5 | 64.9 | 1.9 | 7.1 | 42.3 | 170.0 | 218.0 |
| ST162 | −1.85 | 38.95 | 359.4 | 333.7 | 615.0 | 184.9 | 0.6 | −0.3 | 27.3 | 330.7 | 388.1 |
| ST163 | −0.50 | 38.36 | 310.4 | 282.7 | 653.1 | 108.9 | 1.1 | 0.9 | 39.2 | 274.8 | 345.9 |
| ST164 | −2.38 | 36.85 | 195.0 | 198.6 | 551.5 | 64.9 | 1.9 | 7.1 | 42.0 | 171.1 | 218.9 |
| ST165 | 2.38 | 41.57 | 749.8 | 709.9 | 1286.7 | 464.7 | 0.6 | −0.6 | 29.5 | 685.2 | 814.4 |
| ST166 | −0.55 | 38.28 | 288.6 | 258.1 | 739.0 | 114.0 | 1.6 | 3.0 | 45.2 | 250.5 | 326.7 |
| ST167 | −4.51 | 40.65 | 399.7 | 387.8 | 678.9 | 242.8 | 0.9 | 1.0 | 23.9 | 371.8 | 427.5 |
| ST168 | −6.81 | 38.88 | 450.3 | 444.1 | 774.3 | 228.8 | 0.7 | 0.2 | 29.8 | 411.1 | 489.6 |
| ST169 | 2.07 | 41.25 | 619.0 | 577.4 | 988.0 | 346.2 | 1.0 | 0.4 | 25.0 | 573.8 | 664.1 |
| ST170 | 2.06 | 41.28 | 579.5 | 541.1 | 1025.5 | 323.9 | 0.9 | 0.8 | 28.0 | 532.1 | 626.8 |
| ST171 | 25.96 | 31.71 | 129.0 | 119.3 | 421.6 | 13.5 | 1.6 | 3.3 | 64.5 | 104.7 | 153.3 |
| ST172 | −6.03 | 43.55 | 546.7 | 551.2 | 751.7 | 322.6 | −0.1 | 0.5 | 16.8 | 519.9 | 573.5 |
| ST173 | −6.33 | 39.46 | 530.9 | 515.6 | 958.7 | 287.9 | 0.5 | 0.2 | 28.6 | 486.6 | 575.3 |
| ST174 | −0.06 | 39.95 | 447.6 | 443.9 | 1024.9 | 218.8 | 1.3 | 4.0 | 32.8 | 404.7 | 490.4 |
| ST175 | −3.91 | 38.98 | 402.5 | 383.9 | 709.3 | 168.3 | 0.5 | 0.4 | 26.7 | 371.1 | 433.8 |
| ST176 | −4.83 | 37.85 | 559.3 | 527.4 | 1179.4 | 300.4 | 1.5 | 2.9 | 34.0 | 503.6 | 614.9 |
| ST177 | −2.13 | 40.06 | 502.5 | 488.3 | 734.1 | 266.2 | 0.2 | −0.8 | 23.0 | 468.8 | 536.3 |
| ST178 | −1.41 | 41.11 | 404.5 | 409.6 | 659.1 | 171.4 | 0.1 | 0.2 | 25.2 | 374.8 | 434.3 |
| ST179 | 2.50 | 41.58 | 639.2 | 578.9 | 1641.6 | 288.5 | 1.8 | 4.6 | 39.3 | 565.7 | 712.7 |
| ST180 | 2.76 | 41.90 | 707.9 | 686.8 | 1143.4 | 313.0 | 0.4 | −0.5 | 28.4 | 649.2 | 766.6 |
| ST181 | −3.78 | 37.18 | 368.1 | 349.1 | 687.7 | 186.5 | 0.8 | 0.6 | 29.7 | 336.2 | 400.0 |
| ST182 | 35.78 | 30.16 | 41.5 | 37.0 | 117.0 | 6.0 | 0.9 | 0.5 | 60.1 | 34.2 | 48.8 |
| ST183 | −6.91 | 37.28 | 502.1 | 475.3 | 1057.1 | 236.0 | 0.9 | 1.3 | 34.0 | 452.2 | 552.0 |
| ST184 | 1.38 | 38.88 | 420.7 | 411.0 | 878.2 | 196.8 | 1.0 | 1.8 | 32.2 | 381.2 | 460.2 |
| ST185 | −0.40 | 39.50 | 361.7 | 354.5 | 661.7 | 181.0 | 0.8 | 0.8 | 28.4 | 331.6 | 391.7 |
| ST186 | −6.06 | 36.75 | 564.4 | 550.2 | 1412.2 | 250.0 | 1.6 | 5.5 | 36.3 | 504.4 | 624.3 |
| ST187 | −0.33 | 42.08 | 491.1 | 497.7 | 691.0 | 277.4 | 0.0 | −0.4 | 19.1 | 463.6 | 518.6 |
| ST188 | −5.65 | 42.58 | 525.5 | 509.2 | 798.5 | 300.2 | 0.3 | −0.6 | 23.1 | 490.0 | 561.0 |
| ST189 | 0.62 | 41.62 | 346.7 | 324.8 | 516.9 | 180.1 | 0.3 | −0.9 | 25.2 | 321.1 | 372.2 |
| ST190 | −2.33 | 42.45 | 412.5 | 399.6 | 630.4 | 240.1 | 0.4 | −0.2 | 20.9 | 387.3 | 437.8 |
| ST191 | −3.55 | 40.45 | 375.7 | 368.4 | 567.1 | 213.5 | 0.2 | −0.8 | 24.7 | 348.7 | 402.8 |
| ST192 | −3.71 | 40.30 | 370.4 | 369.6 | 578.3 | 216.1 | 0.2 | −0.5 | 23.9 | 344.5 | 396.3 |
| ST193 | −3.40 | 40.24 | 423.7 | 413.9 | 609.2 | 251.7 | 0.1 | −0.9 | 22.9 | 395.4 | 452.1 |
| ST194 | −4.48 | 36.66 | 508.9 | 454.2 | 1207.0 | 204.0 | 1.7 | 3.1 | 43.6 | 444.1 | 573.7 |
| ST195 | −2.95 | 35.28 | 388.3 | 364.7 | 690.4 | 204.7 | 0.9 | 0.1 | 31.6 | 352.5 | 424.1 |
| ST196 | 4.23 | 39.86 | 556.4 | 568.7 | 780.5 | 275.2 | −0.2 | −0.7 | 22.8 | 519.3 | 593.5 |
| ST197 | −1.88 | 40.85 | 463.4 | 462.3 | 657.4 | 268.6 | 0.1 | −0.9 | 23.4 | 431.7 | 495.1 |
| ST198 | −5.61 | 37.15 | 545.6 | 545.2 | 1033.8 | 219.7 | 0.7 | 0.6 | 31.8 | 494.8 | 596.3 |
| ST199 | −1.23 | 37.95 | 291.3 | 292.5 | 547.0 | 115.2 | 0.3 | −0.4 | 33.7 | 262.6 | 319.9 |
| ST200 | −4.01 | 40.78 | 1293.1 | 1229.1 | 2011.0 | 805.7 | 0.4 | −0.7 | 22.7 | 1207.3 | 1378.9 |
| ST201 | 2.73 | 39.55 | 416.6 | 410.9 | 559.6 | 227.3 | −0.3 | −0.7 | 21.4 | 390.5 | 442.7 |
| ST202 | −1.38 | 42.49 | 720.2 | 736.7 | 1062.9 | 490.3 | 0.3 | −0.2 | 18.7 | 680.9 | 759.4 |
| ST203 | −6.58 | 42.56 | 657.9 | 671.6 | 952.3 | 376.7 | −0.1 | −0.9 | 21.1 | 617.3 | 698.5 |
| ST204 | 1.16 | 41.15 | 493.9 | 495.5 | 770.0 | 249.4 | 0.1 | −0.7 | 24.7 | 458.2 | 529.6 |
| ST205 | −6.35 | 36.56 | 518.1 | 493.2 | 1219.5 | 194.0 | 1.4 | 4.5 | 34.2 | 466.3 | 570.0 |
| ST206 | −5.50 | 40.95 | 367.8 | 363.6 | 547.0 | 219.4 | 0.1 | −0.7 | 21.0 | 345.2 | 390.3 |
| ST207 | −1.39 | 42.46 | 1204.8 | 1244.8 | 2174.4 | 367.2 | 0.3 | 0.3 | 32.6 | 1090.1 | 1319.4 |
| ST208 | −5.39 | 40.57 | 382.6 | 378.4 | 576.9 | 205.1 | 0.2 | −0.5 | 23.3 | 356.5 | 408.6 |
| ST209 | −4.11 | 40.95 | 457.1 | 448.9 | 812.2 | 288.2 | 1.0 | 2.0 | 22.2 | 427.4 | 486.7 |
| ST210 | −3.63 | 42.35 | 532.9 | 511.0 | 940.6 | 254.5 | 0.7 | −0.1 | 31.9 | 483.2 | 582.7 |
| ST211 | −2.46 | 41.76 | 518.8 | 502.5 | 859.6 | 344.8 | 1.0 | 1.7 | 19.7 | 489.0 | 548.7 |
| ST212 | 13.50 | 45.83 | 989.4 | 950.5 | 1481.7 | 513.6 | 0.4 | −0.4 | 22.7 | 923.8 | 1055.0 |
| ST213 | −5.90 | 37.41 | 349.9 | 365.2 | 543.0 | 159.6 | −0.2 | −0.3 | 24.5 | 324.8 | 375.0 |
| ST214 | 0.50 | 40.81 | 500.0 | 482.9 | 768.2 | 251.0 | 0.3 | 0.0 | 23.9 | 465.1 | 534.9 |
| ST215 | −0.46 | 39.50 | 436.0 | 405.3 | 1043.1 | 159.5 | 1.3 | 3.9 | 35.7 | 390.5 | 481.5 |
| ST216 | −4.76 | 41.65 | 432.4 | 426.6 | 698.7 | 205.5 | 0.2 | −0.1 | 23.7 | 402.5 | 462.3 |
| ST217 | −0.45 | 39.58 | 465.8 | 430.0 | 1043.1 | 184.0 | 1.0 | 1.5 | 37.4 | 414.9 | 516.8 |
| ST218 | 35.00 | 32.80 | 554.3 | 557.7 | 821.5 | 272.6 | −0.1 | −0.3 | 25.1 | 513.7 | 595.0 |
| ST219 | −5.73 | 41.51 | 381.1 | 378.9 | 578.3 | 219.7 | 0.1 | −1.0 | 24.4 | 353.9 | 408.2 |
| ST220 | −1.01 | 41.66 | 321.7 | 317.6 | 542.2 | 182.9 | 0.5 | 0.1 | 25.3 | 297.9 | 345.4 |
| ST221 | 40.91 | 34.41 | 120.2 | 118.8 | 272.9 | 9.2 | 0.5 | 0.5 | 46.3 | 103.4 | 137.1 |
| ST222 | 37.21 | 36.18 | 312.2 | 317.5 | 499.3 | 109.3 | −0.2 | 0.0 | 30.4 | 283.5 | 341.0 |
| ST223 | 37.47 | 35.21 | 191.1 | 178.5 | 420.8 | 47.5 | 1.0 | 1.4 | 39.3 | 168.4 | 213.8 |
| ST224 | 36.51 | 33.41 | 120.0 | 119.1 | 272.9 | 9.2 | 0.4 | 0.4 | 46.3 | 103.8 | 136.2 |
| ST225 | 36.10 | 32.60 | 271.1 | 221.9 | 825.3 | 56.3 | 1.8 | 3.7 | 61.5 | 221.9 | 320.4 |
| ST226 | 40.15 | 35.31 | 134.6 | 132.3 | 262.8 | 30.1 | 0.1 | −0.6 | 44.8 | 116.4 | 152.9 |
| ST227 | 36.61 | 35.93 | 490.8 | 489.7 | 722.5 | 215.1 | −0.1 | −0.6 | 27.3 | 450.2 | 531.3 |
| ST228 | 36.75 | 35.11 | 305.1 | 325.5 | 606.4 | 116.4 | 0.3 | 0.9 | 31.4 | 277.1 | 333.1 |
| ST229 | 40.75 | 36.50 | 240.6 | 233.8 | 477.6 | 80.5 | 0.5 | 0.1 | 38.5 | 212.6 | 268.6 |
| ST230 | 35.93 | 35.40 | 775.8 | 780.7 | 1191.5 | 329.2 | 0.1 | −0.7 | 28.9 | 710.2 | 841.3 |
| ST231 | 36.25 | 32.85 | 269.4 | 259.7 | 521.5 | 94.9 | 0.6 | 0.5 | 33.0 | 242.5 | 296.3 |
| ST232 | 38.00 | 36.81 | 298.6 | 283.0 | 545.0 | 164.9 | 0.8 | 0.5 | 29.9 | 271.7 | 325.6 |
| ST233 | 41.21 | 37.05 | 338.4 | 349.8 | 667.2 | 82.0 | 0.1 | −0.7 | 45.0 | 294.0 | 382.9 |
| ST234 | 36.47 | 33.05 | 163.0 | 154.5 | 393.3 | 49.1 | 0.7 | 0.8 | 46.4 | 140.1 | 185.8 |
| ST235 | 35.76 | 35.53 | 699.9 | 692.2 | 1104.6 | 362.6 | 0.2 | −1.1 | 29.2 | 640.2 | 759.7 |
| ST236 | 37.20 | 36.31 | 317.7 | 320.2 | 501.6 | 129.0 | −0.1 | 0.0 | 27.2 | 291.6 | 343.8 |
| ST237 | 36.71 | 34.03 | 139.2 | 122.6 | 465.6 | 34.0 | 2.1 | 4.2 | 67.9 | 110.7 | 167.8 |
| ST238 | 38.30 | 34.55 | 123.2 | 122.1 | 271.4 | 20.2 | 0.4 | 0.9 | 39.3 | 108.5 | 137.8 |
| ST239 | 39.01 | 35.93 | 170.4 | 176.5 | 369.7 | 41.7 | 0.3 | 0.1 | 41.4 | 149.1 | 191.8 |
| ST240 | 36.13 | 34.81 | 986.5 | 1019.4 | 1821.6 | 432.2 | 0.2 | −0.1 | 31.0 | 894.1 | 1078.9 |
| ST241 | 37.03 | 35.00 | 279.1 | 277.5 | 479.0 | 85.0 | 0.1 | 1.1 | 27.5 | 255.9 | 302.3 |
| ST242 | 36.58 | 32.70 | 300.7 | 296.8 | 486.3 | 109.2 | 0.2 | −0.5 | 30.2 | 273.2 | 328.1 |
| ST243 | 35.88 | 34.88 | 809.9 | 805.0 | 1378.6 | 365.4 | 0.2 | −0.4 | 30.2 | 735.9 | 884.0 |
| ST244 | 38.95 | 36.70 | 254.5 | 261.4 | 452.1 | 38.9 | −0.3 | 0.6 | 33.4 | 228.7 | 280.2 |
| ST245 | 8.81 | 34.41 | 197.1 | 143.1 | 800.4 | 21.1 | 1.9 | 4.5 | 77.3 | 152.6 | 241.6 |
| ST246 | 10.23 | 36.83 | 441.2 | 449.3 | 851.4 | 61.7 | 0.0 | −0.1 | 37.4 | 393.0 | 489.4 |
| ST247 | 10.10 | 33.88 | 179.0 | 135.6 | 659.4 | 31.6 | 1.8 | 3.9 | 69.6 | 142.6 | 215.5 |
| ST248 | 8.80 | 36.48 | 443.3 | 440.4 | 817.6 | 61.7 | 0.0 | −0.7 | 40.3 | 391.1 | 495.6 |
| ST249 | 10.10 | 35.66 | 283.2 | 278.9 | 587.0 | 61.7 | 0.5 | 0.1 | 40.7 | 249.6 | 316.9 |
| ST250 | 11.08 | 36.85 | 485.5 | 468.3 | 847.9 | 61.7 | 0.0 | −0.6 | 39.2 | 430.0 | 541.1 |
| ST251 | 10.75 | 35.66 | 336.3 | 311.2 | 687.8 | 61.7 | 0.5 | −0.5 | 47.1 | 290.0 | 382.7 |
| ST252 | 7.88 | 33.88 | 96.5 | 81.8 | 330.5 | 8.6 | 1.7 | 2.5 | 75.1 | 75.4 | 117.7 |
| ST253 | 9.78 | 37.24 | 563.6 | 561.6 | 1008.9 | 61.7 | −0.2 | −0.4 | 37.6 | 501.7 | 625.4 |
| ST254 | 10.72 | 34.69 | 199.7 | 190.5 | 499.9 | 46.0 | 0.9 | 1.8 | 46.3 | 172.7 | 226.7 |
| ST255 | 11.09 | 33.51 | 236.5 | 211.2 | 572.8 | 64.7 | 1.1 | 0.9 | 49.4 | 202.4 | 270.7 |
| ST256 | 35.41 | 37.00 | 684.2 | 645.2 | 1078.4 | 311.5 | 0.3 | −0.9 | 30.1 | 624.1 | 744.2 |
| ST257 | 30.53 | 38.75 | 422.4 | 437.0 | 680.0 | 270.4 | 0.7 | 2.0 | 19.2 | 398.6 | 446.1 |
| ST258 | 27.85 | 38.91 | 556.6 | 549.1 | 866.0 | 286.4 | 0.4 | −0.2 | 22.8 | 519.6 | 593.7 |
| ST259 | 32.00 | 36.55 | 1102.5 | 1072.0 | 1769.0 | 552.8 | 0.4 | −0.5 | 28.0 | 1012.3 | 1192.7 |
| ST260 | 22.40 | 38.90 | 513.6 | 520.4 | 932.9 | 229.7 | 0.4 | 0.5 | 28.2 | 471.2 | 556.0 |
| ST261 | 30.73 | 36.86 | 1074.3 | 1103.0 | 1890.0 | 288.5 | 0.2 | 0.2 | 30.3 | 979.2 | 1169.4 |
| ST262 | 27.85 | 37.85 | 609.5 | 634.0 | 948.0 | 134.4 | −0.4 | 0.2 | 28.7 | 558.4 | 660.7 |
| ST263 | 27.91 | 39.61 | 566.8 | 552.5 | 911.9 | 323.5 | 0.5 | 0.3 | 21.1 | 531.8 | 601.8 |
| ST264 | 16.88 | 40.43 | 481.8 | 481.0 | 850.1 | 170.0 | 0.2 | −0.5 | 32.7 | 435.7 | 527.9 |
| ST265 | 22.01 | 37.06 | 755.1 | 762.0 | 1116.0 | 322.1 | −0.4 | 0.4 | 21.3 | 708.0 | 802.2 |
| ST266 | 29.06 | 40.18 | 670.2 | 632.0 | 1181.1 | 460.0 | 1.5 | 4.5 | 19.1 | 632.8 | 707.6 |
| ST267 | 26.40 | 40.13 | 579.8 | 556.0 | 901.0 | 371.0 | 0.6 | −0.4 | 22.7 | 541.4 | 618.2 |
| ST268 | 28.32 | 37.92 | 691.6 | 686.3 | 1140.0 | 144.5 | −0.2 | 0.4 | 28.2 | 634.7 | 748.4 |
| ST269 | 29.08 | 37.78 | 565.8 | 559.0 | 830.7 | 327.8 | 0.3 | 0.0 | 21.3 | 530.6 | 601.0 |
| ST270 | 40.18 | 37.88 | 487.2 | 475.0 | 768.6 | 258.0 | 0.4 | −0.2 | 24.2 | 452.7 | 521.7 |
| ST271 | 26.56 | 41.66 | 593.5 | 566.0 | 963.2 | 388.1 | 0.9 | 0.5 | 22.9 | 553.9 | 633.1 |
| ST272 | 39.28 | 38.60 | 406.4 | 387.0 | 735.4 | 199.1 | 0.7 | 1.2 | 26.8 | 374.7 | 438.2 |
| ST273 | 34.05 | 37.50 | 306.4 | 300.0 | 473.4 | 138.0 | −0.1 | 0.6 | 21.8 | 286.8 | 325.9 |
| ST274 | 28.26 | 36.85 | 881.5 | 859.1 | 1823.1 | 416.5 | 1.2 | 3.0 | 30.2 | 803.7 | 959.4 |
| ST275 | 26.88 | 39.06 | 626.4 | 608.5 | 926.7 | 372.7 | 0.3 | −0.5 | 21.4 | 587.2 | 665.6 |
| ST276 | 30.56 | 39.78 | 388.4 | 380.2 | 630.2 | 196.9 | 0.6 | 0.7 | 24.3 | 360.8 | 416.0 |
| ST277 | 30.15 | 36.30 | 940.0 | 911.0 | 1556.0 | 365.0 | 0.4 | 0.2 | 27.3 | 865.0 | 1015.1 |
| ST278 | 37.36 | 37.08 | 531.7 | 517.0 | 992.0 | 237.5 | 0.5 | 0.4 | 28.9 | 486.9 | 576.6 |
| ST279 | 36.16 | 36.58 | 741.6 | 753.0 | 1010.0 | 492.0 | 0.2 | 0.0 | 16.3 | 706.3 | 776.9 |
| ST280 | 30.55 | 37.75 | 518.9 | 526.0 | 803.0 | 246.9 | −0.1 | −0.3 | 23.3 | 483.6 | 554.3 |
| ST281 | 28.81 | 40.96 | 662.8 | 615.7 | 1214.4 | 351.5 | 1.1 | 1.1 | 31.1 | 602.6 | 723.1 |
| ST282 | 27.01 | 38.51 | 698.4 | 683.0 | 1133.1 | 362.0 | 0.4 | −0.3 | 27.0 | 643.3 | 753.5 |
| ST283 | 34.50 | 37.60 | 337.9 | 329.2 | 467.0 | 183.0 | 0.1 | −0.5 | 21.1 | 317.0 | 358.7 |
| ST284 | 35.43 | 38.81 | 378.1 | 372.0 | 614.0 | 233.6 | 0.6 | 0.6 | 21.2 | 354.8 | 401.5 |
| ST285 | 34.16 | 39.15 | 372.8 | 363.0 | 497.0 | 240.0 | 0.0 | −0.9 | 18.5 | 352.7 | 393.0 |
| ST286 | 32.54 | 37.96 | 333.6 | 347.7 | 574.5 | 177.0 | 0.3 | 0.4 | 24.9 | 309.3 | 357.8 |
| ST287 | 29.96 | 39.41 | 552.7 | 538.0 | 851.1 | 328.7 | 0.3 | −0.1 | 20.4 | 519.7 | 585.6 |
| ST288 | 38.08 | 38.43 | 345.5 | 345.4 | 676.9 | 1.1 | −0.2 | 1.1 | 38.2 | 307.0 | 384.1 |
| ST289 | 28.36 | 37.21 | 1146.9 | 1158.0 | 1760.0 | 509.0 | 0.0 | 0.4 | 22.5 | 1071.5 | 1222.2 |
| ST290 | 34.68 | 37.96 | 343.0 | 341.0 | 475.0 | 205.0 | 0.0 | −0.2 | 19.1 | 323.9 | 362.1 |
| ST291 | 33.93 | 36.38 | 560.1 | 561.0 | 1007.0 | 299.0 | 0.4 | −0.4 | 30.7 | 509.8 | 610.4 |
| ST292 | 29.08 | 40.96 | 697.9 | 676.0 | 1047.2 | 432.0 | 0.2 | −0.5 | 21.7 | 653.6 | 742.2 |
| ST293 | 27.55 | 40.98 | 590.7 | 580.1 | 879.3 | 248.2 | 0.1 | 0.4 | 22.3 | 552.2 | 629.1 |
| ST294 | 26.70 | 39.30 | 642.3 | 661.1 | 972.1 | 306.0 | 0.0 | −0.4 | 24.3 | 596.7 | 687.9 |
| ST295 | 38.76 | 37.13 | 444.1 | 438.1 | 855.0 | 203.0 | 0.9 | 0.9 | 33.0 | 401.2 | 486.9 |
| ST296 | 29.40 | 38.68 | 542.6 | 534.7 | 876.2 | 346.3 | 0.6 | 1.0 | 19.3 | 512.0 | 573.3 |
| ST297 | 36.93 | 37.60 | 743.5 | 718.0 | 1416.6 | 443.1 | 1.3 | 2.5 | 25.7 | 687.6 | 799.4 |
| ST298 | 34.80 | 39.81 | 598.3 | 580.0 | 858.0 | 405.5 | 0.5 | −0.2 | 18.0 | 566.8 | 629.7 |
| ST299 | 27.43 | 37.03 | 684.8 | 673.3 | 1091.4 | 355.4 | 0.2 | −0.9 | 28.9 | 626.9 | 742.6 |
| ST300 | 42.00 | 37.93 | 695.2 | 694.0 | 1046.4 | 446.0 | 0.4 | −0.3 | 21.8 | 650.9 | 739.5 |
| ST301 | 34.57 | 31.67 | 464.7 | 433.1 | 823.9 | 165.7 | 0.5 | −0.2 | 35.1 | 417.1 | 512.3 |
| ST302 | 34.59 | 32.27 | 597.4 | 563.2 | 1106.9 | 252.1 | 0.9 | 1.7 | 30.4 | 544.4 | 650.5 |
| ST303 | 5.06 | 36.71 | 719.9 | 747.8 | 1084.7 | 307.5 | −0.3 | −0.4 | 25.6 | 665.9 | 773.8 |
| ST304 | 6.95 | 36.88 | 740.1 | 719.1 | 1148.9 | 491.6 | 0.3 | −0.4 | 21.3 | 694.1 | 786.0 |
| ST305 | 12.23 | 41.80 | 731.9 | 701.3 | 1234.9 | 345.5 | 0.3 | −0.4 | 30.1 | 667.6 | 796.2 |
| ST306 | 10.68 | 34.71 | 215.4 | 206.2 | 382.0 | 94.7 | 0.5 | −0.2 | 33.4 | 194.4 | 236.4 |
| ST307 | 27.30 | 38.40 | 709.0 | 706.3 | 1088.0 | 361.0 | 0.3 | −0.3 | 24.4 | 658.4 | 759.6 |
| ST308 | 34.60 | 36.80 | 631.6 | 590.8 | 1023.7 | 280.5 | 0.3 | −0.6 | 29.6 | 576.9 | 686.3 |
| ST309 | 34.53 | 38.76 | 422.6 | 417.4 | 589.0 | 287.2 | 0.2 | −0.4 | 16.6 | 402.1 | 443.2 |
| ST310 | 38.28 | 37.75 | 648.8 | 602.0 | 1171.0 | 350.2 | 1.0 | 0.6 | 29.1 | 593.6 | 704.0 |
| ST311 | 20.88 | 37.75 | 699.6 | 696.0 | 1325.0 | 0.0 | −0.6 | 1.4 | 37.3 | 623.3 | 775.9 |
| ST312 | 14.28 | 37.56 | 604.0 | 563.8 | 1631.0 | 269.6 | 2.0 | 6.1 | 40.9 | 531.9 | 676.1 |
| ID | Long | Lat | Mean | Med | Max | Min | Sk | Ku | CV% | LCL | UCL |
|---|---|---|---|---|---|---|---|---|---|---|---|
| ST01 | 7.48 | 36.50 | 17.7 | 17.8 | 18.6 | 16.6 | −0.6 | 0.3 | 2.7 | 17.6 | 17.8 |
| ST02 | 1.20 | 36.12 | 19.2 | 19.2 | 21.0 | 17.8 | 0.1 | −0.3 | 4.0 | 19.0 | 19.4 |
| ST03 | 3.25 | 36.68 | 17.5 | 17.8 | 18.8 | 14.5 | −1.2 | 1.9 | 4.9 | 17.3 | 17.8 |
| ST04 | 2.14 | 36.18 | 17.0 | 17.0 | 18.0 | 15.5 | −0.4 | −0.8 | 4.2 | 16.8 | 17.2 |
| ST05 | −0.60 | 35.63 | 17.8 | 17.9 | 18.6 | 16.4 | −0.5 | −0.8 | 3.6 | 17.6 | 18.0 |
| ST06 | 18.08 | 42.65 | 16.8 | 16.6 | 18.4 | 15.4 | 0.3 | −0.7 | 4.4 | 16.6 | 17.0 |
| ST07 | 15.36 | 44.55 | 9.3 | 9.2 | 11.3 | 7.5 | 0.1 | −0.7 | 9.9 | 9.0 | 9.6 |
| ST08 | 16.45 | 43.16 | 16.8 | 16.8 | 18.3 | 15.5 | 0.2 | −0.4 | 4.0 | 16.6 | 17.0 |
| ST09 | 16.20 | 44.03 | 13.3 | 13.2 | 15.2 | 12.0 | 0.3 | 0.3 | 4.9 | 13.2 | 13.5 |
| ST10 | 16.90 | 42.76 | 16.0 | 16.0 | 17.5 | 14.7 | 0.1 | −0.5 | 4.3 | 15.8 | 16.2 |
| ST11 | 15.23 | 45.26 | 10.5 | 10.5 | 12.5 | 8.7 | −0.1 | −0.8 | 9.0 | 10.3 | 10.8 |
| ST12 | 18.38 | 45.32 | 11.5 | 11.4 | 13.3 | 9.7 | 0.1 | −0.5 | 7.4 | 11.2 | 11.7 |
| ST13 | 14.27 | 45.20 | 14.3 | 14.3 | 16.0 | 12.7 | 0.1 | −0.9 | 5.8 | 14.1 | 14.6 |
| ST14 | 16.43 | 43.51 | 16.5 | 16.5 | 17.9 | 15.1 | 0.0 | −0.8 | 4.5 | 16.3 | 16.8 |
| ST15 | 16.38 | 46.30 | 10.8 | 10.6 | 12.5 | 9.0 | −0.1 | −0.8 | 8.7 | 10.5 | 11.0 |
| ST16 | 15.12 | 44.07 | 15.4 | 15.3 | 17.0 | 14.1 | 0.1 | −0.7 | 4.7 | 15.2 | 15.6 |
| ST17 | 15.98 | 45.81 | 13.0 | 13.1 | 15.7 | 10.3 | 0.1 | −1.1 | 10.6 | 12.6 | 13.4 |
| ST18 | 14.59 | 44.49 | 4.1 | 4.1 | 5.9 | 2.4 | −0.1 | −0.6 | 19.7 | 3.9 | 4.4 |
| ST19 | 32.98 | 34.58 | 19.8 | 19.7 | 21.1 | 18.7 | 0.2 | 0.0 | 2.7 | 19.6 | 19.9 |
| ST20 | 32.92 | 34.93 | 18.2 | 18.1 | 21.0 | 16.5 | 1.0 | 1.2 | 5.2 | 17.9 | 18.5 |
| ST21 | 33.36 | 34.88 | 19.8 | 19.9 | 21.4 | 18.3 | 0.0 | −0.6 | 3.8 | 19.6 | 20.0 |
| ST22 | 33.00 | 34.70 | 19.7 | 19.7 | 21.5 | 17.7 | 0.1 | −0.4 | 4.6 | 19.4 | 19.9 |
| ST23 | 33.40 | 35.15 | 19.5 | 19.2 | 21.4 | 17.8 | 0.4 | −0.5 | 4.4 | 19.2 | 19.7 |
| ST24 | 32.48 | 34.71 | 19.9 | 19.6 | 22.9 | 17.4 | 0.5 | −0.5 | 6.6 | 19.5 | 20.3 |
| ST25 | 32.43 | 35.03 | 18.7 | 18.8 | 20.5 | 16.6 | −0.3 | −0.6 | 4.7 | 18.4 | 18.9 |
| ST26 | 29.95 | 31.20 | 20.7 | 20.6 | 22.1 | 19.5 | 0.1 | −0.6 | 3.2 | 20.5 | 20.9 |
| ST27 | 27.21 | 31.33 | 20.0 | 20.0 | 21.1 | 19.3 | 0.4 | −0.3 | 2.5 | 19.9 | 20.2 |
| ST28 | 32.29 | 31.26 | 21.7 | 21.6 | 23.4 | 20.4 | 0.3 | −0.3 | 3.1 | 21.5 | 21.9 |
| ST29 | 8.80 | 41.91 | 15.5 | 15.7 | 17.1 | 13.9 | −0.2 | −0.3 | 4.6 | 15.3 | 15.7 |
| ST30 | 1.40 | 43.64 | 13.5 | 13.5 | 14.8 | 11.7 | −0.2 | −0.7 | 5.7 | 13.3 | 13.7 |
| ST31 | 9.48 | 42.55 | 16.1 | 16.0 | 17.1 | 14.8 | −0.2 | −0.4 | 3.5 | 15.9 | 16.2 |
| ST32 | 1.20 | 45.90 | 11.0 | 11.1 | 12.9 | 9.5 | 0.0 | −0.6 | 8.0 | 10.8 | 11.3 |
| ST33 | −1.46 | 35.01 | 17.5 | 17.6 | 18.5 | 16.0 | −0.7 | 0.3 | 3.1 | 17.4 | 17.7 |
| ST34 | 9.28 | 42.33 | 16.0 | 16.0 | 16.9 | 15.0 | −0.2 | −0.1 | 2.8 | 15.9 | 16.2 |
| ST35 | 6.43 | 43.50 | 12.6 | 12.5 | 13.7 | 11.2 | 0.0 | −0.9 | 5.3 | 12.4 | 12.8 |
| ST36 | 5.56 | 43.04 | 15.5 | 15.5 | 17.1 | 14.0 | 0.1 | −0.6 | 5.0 | 15.3 | 15.8 |
| ST37 | 3.16 | 45.78 | 11.7 | 11.7 | 13.5 | 10.0 | 0.0 | −0.8 | 7.5 | 11.5 | 12.0 |
| ST38 | 6.50 | 44.56 | 11.1 | 11.2 | 13.4 | 9.4 | 0.5 | 0.1 | 7.7 | 10.9 | 11.4 |
| ST39 | 1.40 | 44.75 | 12.8 | 12.7 | 14.1 | 11.2 | −0.1 | −0.8 | 5.9 | 12.5 | 13.0 |
| ST40 | 5.33 | 45.36 | 12.4 | 12.3 | 13.4 | 11.3 | 0.1 | −1.0 | 5.0 | 12.2 | 12.5 |
| ST41 | 12.61 | 44.03 | 14.0 | 14.0 | 15.6 | 12.5 | 0.0 | −0.6 | 5.1 | 13.8 | 14.2 |
| ST42 | 5.23 | 43.45 | 15.5 | 15.6 | 16.9 | 14.0 | −0.1 | −0.8 | 4.7 | 15.3 | 15.8 |
| ST43 | −0.70 | 44.83 | 13.8 | 13.8 | 15.1 | 12.2 | −0.2 | −1.0 | 5.9 | 13.6 | 14.0 |
| ST44 | 3.01 | 44.11 | 11.0 | 10.9 | 12.3 | 9.3 | 0.0 | −0.8 | 6.9 | 10.7 | 11.2 |
| ST45 | 3.58 | 44.11 | 5.3 | 5.3 | 6.6 | 3.8 | −0.2 | −0.8 | 14.4 | 5.1 | 5.5 |
| ST46 | −0.50 | 43.91 | 13.6 | 13.5 | 14.7 | 12.3 | −0.1 | −1.0 | 5.1 | 13.4 | 13.8 |
| ST47 | 4.73 | 44.58 | 13.9 | 13.9 | 15.4 | 12.3 | −0.1 | −0.7 | 5.7 | 13.6 | 14.1 |
| ST48 | 3.96 | 43.58 | 15.2 | 15.1 | 16.5 | 13.8 | −0.2 | −0.9 | 4.7 | 14.9 | 15.4 |
| ST49 | 7.20 | 43.65 | 16.1 | 16.1 | 17.2 | 14.8 | −0.2 | −0.8 | 3.8 | 15.9 | 16.2 |
| ST50 | 4.40 | 43.86 | 14.9 | 14.7 | 16.1 | 13.7 | 0.2 | −0.9 | 4.1 | 14.7 | 15.1 |
| ST51 | 4.83 | 44.13 | 14.2 | 14.2 | 15.1 | 12.9 | −0.3 | −0.8 | 4.3 | 14.0 | 14.4 |
| ST52 | 2.89 | 42.69 | 15.8 | 15.9 | 16.9 | 14.4 | −0.2 | −0.9 | 4.1 | 15.6 | 16.0 |
| ST53 | 14.91 | 37.41 | 17.5 | 17.4 | 18.8 | 16.5 | 0.6 | 0.2 | 3.0 | 17.4 | 17.7 |
| ST54 | 3.68 | 43.40 | 15.1 | 15.1 | 16.6 | 13.6 | −0.1 | −0.7 | 5.3 | 14.9 | 15.3 |
| ST55 | 1.10 | 43.00 | 12.4 | 12.3 | 13.4 | 11.3 | 0.1 | −1.0 | 5.0 | 12.2 | 12.5 |
| ST56 | 5.35 | 43.31 | 15.0 | 15.1 | 16.4 | 13.8 | −0.3 | −0.8 | 4.6 | 14.8 | 15.2 |
| ST57 | 0.00 | 43.18 | 12.6 | 12.5 | 13.8 | 11.3 | 0.1 | −0.9 | 4.9 | 12.4 | 12.8 |
| ST58 | −7.66 | 33.56 | 18.0 | 18.2 | 19.4 | 16.9 | 0.0 | −1.1 | 3.8 | 17.8 | 18.2 |
| ST59 | 3.34 | 45.76 | 11.7 | 11.7 | 12.9 | 10.1 | −0.1 | −0.9 | 6.5 | 11.4 | 11.9 |
| ST60 | 7.51 | 47.60 | 10.5 | 10.6 | 12.3 | 9.0 | 0.0 | −0.4 | 7.2 | 10.3 | 10.8 |
| ST61 | 2.87 | 42.77 | 15.7 | 15.8 | 16.7 | 14.4 | −0.3 | −0.9 | 3.8 | 15.5 | 15.9 |
| ST62 | −1.25 | 44.63 | 14.1 | 14.3 | 17.2 | 10.2 | −0.8 | 0.4 | 12.6 | 13.6 | 14.6 |
| ST63 | 6.66 | 43.25 | 15.7 | 15.8 | 17.1 | 14.4 | 0.0 | −0.7 | 4.4 | 15.5 | 15.9 |
| ST64 | −0.41 | 43.38 | 13.2 | 13.1 | 14.8 | 11.9 | 0.3 | −0.2 | 4.8 | 13.0 | 13.3 |
| ST65 | 15.28 | 40.01 | 17.0 | 17.1 | 18.7 | 15.6 | 0.3 | 0.3 | 4.0 | 16.8 | 17.2 |
| ST66 | 6.15 | 43.09 | 16.0 | 16.0 | 16.9 | 14.4 | −0.7 | 1.0 | 3.1 | 15.8 | 16.1 |
| ST67 | 1.30 | 45.80 | 11.2 | 11.0 | 12.4 | 10.0 | 0.2 | −1.0 | 6.1 | 11.0 | 11.4 |
| ST68 | 8.79 | 41.92 | 15.5 | 15.6 | 16.6 | 13.9 | −0.5 | −0.3 | 4.1 | 15.3 | 15.7 |
| ST69 | 6.61 | 36.28 | 15.4 | 15.5 | 16.4 | 13.3 | −0.8 | 0.3 | 4.8 | 15.2 | 15.6 |
| ST70 | 0.31 | 46.58 | 11.9 | 11.8 | 13.5 | 10.4 | 0.2 | −0.6 | 6.4 | 11.6 | 12.1 |
| ST71 | 2.31 | 43.21 | 13.8 | 14.0 | 14.9 | 12.3 | −0.3 | −0.8 | 4.9 | 13.6 | 14.0 |
| ST72 | −5.35 | 36.15 | 18.4 | 18.4 | 19.3 | 17.4 | −0.5 | 0.8 | 2.2 | 18.3 | 18.5 |
| ST73 | 20.77 | 38.92 | 17.2 | 17.1 | 18.6 | 16.3 | 0.3 | −0.7 | 3.3 | 17.1 | 17.4 |
| ST74 | 25.91 | 40.85 | 14.8 | 14.6 | 17.0 | 13.4 | 0.7 | −0.3 | 6.1 | 14.6 | 15.1 |
| ST75 | 21.28 | 37.91 | 16.9 | 16.8 | 18.0 | 16.0 | 0.1 | −1.0 | 3.3 | 16.8 | 17.1 |
| ST76 | 23.70 | 38.00 | 18.1 | 18.2 | 19.6 | 15.0 | −1.1 | 2.0 | 5.4 | 17.8 | 18.4 |
| ST77 | 28.08 | 36.40 | 19.3 | 19.3 | 20.7 | 17.4 | −0.3 | 0.9 | 3.3 | 19.1 | 19.5 |
| ST78 | 24.48 | 38.96 | 17.2 | 17.1 | 18.4 | 16.3 | 0.4 | −0.8 | 3.5 | 17.0 | 17.3 |
| ST79 | 23.70 | 37.89 | 18.4 | 18.5 | 19.8 | 14.2 | −2.5 | 8.4 | 5.6 | 18.1 | 18.7 |
| ST80 | 25.18 | 35.33 | 15.2 | 15.1 | 16.7 | 14.3 | 0.6 | −0.3 | 4.0 | 15.1 | 15.4 |
| ST81 | 18.91 | 39.61 | 17.3 | 17.1 | 18.8 | 16.0 | 0.3 | −0.6 | 4.1 | 17.0 | 17.5 |
| ST82 | 22.41 | 39.61 | 11.2 | 9.2 | 16.3 | 7.9 | 0.7 | −1.5 | 30.0 | 10.2 | 12.1 |
| ST83 | 21.70 | 36.83 | 18.0 | 18.0 | 18.8 | 17.3 | 0.1 | −0.6 | 2.2 | 17.9 | 18.1 |
| ST84 | 26.60 | 39.06 | 17.7 | 17.5 | 19.5 | 16.2 | 0.4 | −0.8 | 4.8 | 17.4 | 17.9 |
| ST85 | 25.38 | 37.10 | 18.5 | 18.4 | 20.5 | 17.3 | 0.6 | 0.2 | 3.6 | 18.3 | 18.7 |
| ST86 | 26.91 | 37.70 | 18.9 | 18.8 | 20.3 | 16.9 | −0.2 | −0.4 | 4.0 | 18.7 | 19.1 |
| ST87 | 24.11 | 35.48 | 18.4 | 18.4 | 19.5 | 17.4 | 0.2 | −0.4 | 2.7 | 18.2 | 18.5 |
| ST88 | 22.96 | 40.51 | 15.4 | 15.4 | 17.0 | 14.0 | 0.1 | −1.1 | 5.1 | 15.2 | 15.6 |
| ST89 | 22.40 | 37.53 | 13.7 | 13.7 | 16.5 | 11.9 | 0.9 | 0.4 | 7.7 | 13.4 | 14.0 |
| ST90 | 34.39 | 31.49 | 20.5 | 20.5 | 22.3 | 19.1 | 0.3 | −0.2 | 3.5 | 20.2 | 20.7 |
| ST91 | 35.58 | 32.65 | 19.2 | 19.1 | 21.7 | 17.7 | 0.6 | 0.4 | 4.7 | 18.9 | 19.5 |
| ST92 | 34.78 | 31.23 | 20.2 | 20.2 | 23.4 | 18.6 | 0.7 | 1.1 | 4.9 | 19.9 | 20.5 |
| ST93 | 34.81 | 32.00 | 19.2 | 19.1 | 21.7 | 17.7 | 0.6 | 0.4 | 4.7 | 18.9 | 19.5 |
| ST94 | 35.09 | 33.00 | 19.3 | 19.2 | 21.4 | 17.9 | 0.3 | 0.1 | 3.8 | 19.0 | 19.5 |
| ST95 | 34.70 | 31.70 | 20.1 | 20.1 | 22.1 | 18.7 | 0.2 | −0.3 | 3.8 | 19.9 | 20.3 |
| ST96 | 35.27 | 32.83 | 20.1 | 20.0 | 22.1 | 18.7 | 0.3 | 0.0 | 3.6 | 19.9 | 20.3 |
| ST97 | 35.15 | 31.47 | 17.4 | 17.5 | 19.5 | 15.3 | −0.3 | −0.3 | 5.4 | 17.1 | 17.6 |
| ST98 | 35.21 | 31.86 | 18.0 | 18.0 | 20.4 | 16.3 | 0.2 | 0.7 | 4.5 | 17.8 | 18.2 |
| ST99 | 34.50 | 31.43 | 20.3 | 20.3 | 22.3 | 18.9 | 0.3 | −0.2 | 3.8 | 20.1 | 20.5 |
| ST100 | 34.53 | 31.56 | 20.3 | 20.3 | 22.5 | 18.6 | 0.1 | −1.2 | 5.1 | 20.0 | 20.6 |
| ST101 | 34.80 | 30.60 | 19.2 | 19.1 | 21.3 | 17.9 | 0.4 | 0.6 | 3.6 | 19.0 | 19.4 |
| ST102 | 34.46 | 32.04 | 20.9 | 20.9 | 23.1 | 18.0 | 0.0 | −0.5 | 5.3 | 20.6 | 21.2 |
| ST103 | 16.13 | 39.34 | 16.0 | 15.7 | 18.4 | 14.2 | 0.6 | 0.0 | 5.8 | 15.7 | 16.2 |
| ST104 | 16.78 | 41.13 | 16.1 | 16.1 | 17.5 | 15.0 | 0.2 | −0.7 | 3.7 | 16.0 | 16.3 |
| ST105 | 9.70 | 45.66 | 13.2 | 13.2 | 15.0 | 11.5 | 0.1 | −0.7 | 6.8 | 12.9 | 13.4 |
| ST106 | 11.30 | 44.53 | 14.7 | 14.8 | 17.0 | 13.2 | 0.0 | −0.7 | 6.2 | 14.5 | 15.0 |
| ST107 | 17.95 | 40.65 | 17.1 | 17.1 | 18.1 | 15.7 | −0.3 | −0.7 | 3.8 | 16.9 | 17.3 |
| ST108 | 9.05 | 39.25 | 17.2 | 17.3 | 18.4 | 15.9 | −0.4 | −0.7 | 3.8 | 17.0 | 17.4 |
| ST109 | 14.65 | 41.56 | 12.5 | 12.6 | 14.2 | 10.6 | −0.5 | 0.1 | 6.1 | 12.3 | 12.7 |
| ST110 | 9.71 | 39.93 | 17.3 | 17.3 | 18.2 | 16.0 | −0.3 | −0.9 | 3.6 | 17.1 | 17.5 |
| ST111 | 8.16 | 43.95 | 15.6 | 15.5 | 16.8 | 14.1 | −0.1 | −0.9 | 4.6 | 15.4 | 15.8 |
| ST112 | 15.05 | 37.46 | 17.4 | 17.4 | 18.4 | 16.2 | −0.1 | −0.8 | 3.2 | 17.3 | 17.6 |
| ST113 | 15.13 | 36.68 | 18.7 | 18.9 | 20.4 | 17.2 | 0.1 | 0.2 | 3.8 | 18.5 | 18.9 |
| ST114 | 11.20 | 43.80 | 15.6 | 15.7 | 16.8 | 14.3 | −0.4 | −0.2 | 3.7 | 15.4 | 15.8 |
| ST115 | 8.85 | 44.25 | 16.1 | 16.3 | 17.4 | 14.8 | −0.3 | −1.0 | 4.4 | 15.9 | 16.3 |
| ST116 | 11.06 | 42.75 | 15.3 | 15.3 | 16.9 | 13.7 | −0.1 | −0.5 | 4.8 | 15.1 | 15.5 |
| ST117 | 15.55 | 38.20 | 18.9 | 18.9 | 19.7 | 17.8 | −0.8 | 0.2 | 2.4 | 18.7 | 19.0 |
| ST118 | 9.11 | 45.28 | 15.5 | 14.6 | 18.3 | 13.1 | 0.4 | −1.5 | 10.9 | 15.0 | 15.9 |
| ST119 | 15.95 | 41.70 | 12.0 | 12.1 | 13.8 | 10.5 | −0.1 | −0.1 | 6.3 | 11.8 | 12.3 |
| ST120 | 19.55 | 39.37 | 17.7 | 17.8 | 18.8 | 16.7 | 0.0 | −0.7 | 3.1 | 17.6 | 17.9 |
| ST121 | 13.10 | 38.18 | 18.8 | 18.8 | 19.6 | 17.8 | −0.4 | −0.1 | 2.1 | 18.7 | 18.9 |
| ST122 | 11.96 | 36.81 | 18.6 | 18.6 | 19.9 | 17.0 | −0.2 | −0.3 | 3.8 | 18.4 | 18.8 |
| ST123 | 14.20 | 42.43 | 15.1 | 15.2 | 16.1 | 13.7 | −0.4 | −0.8 | 4.4 | 14.9 | 15.3 |
| ST124 | 10.38 | 43.68 | 15.3 | 15.4 | 16.9 | 13.5 | −0.2 | −0.4 | 5.1 | 15.1 | 15.6 |
| ST125 | 12.95 | 40.91 | 16.8 | 16.8 | 18.2 | 15.3 | 0.0 | −0.6 | 4.0 | 16.6 | 17.0 |
| ST126 | 12.55 | 41.78 | 15.7 | 15.6 | 17.1 | 14.2 | −0.1 | −0.8 | 4.7 | 15.5 | 15.9 |
| ST127 | 18.35 | 39.81 | 17.1 | 17.1 | 18.3 | 15.8 | −0.1 | 0.1 | 3.0 | 16.9 | 17.2 |
| ST128 | 14.37 | 41.09 | 17.1 | 17.2 | 18.2 | 15.8 | −0.4 | −0.2 | 3.4 | 17.0 | 17.3 |
| ST129 | 12.50 | 37.91 | 17.9 | 18.0 | 18.7 | 16.5 | −0.8 | 0.9 | 2.6 | 17.8 | 18.1 |
| ST130 | 25.25 | 39.93 | 15.9 | 15.8 | 17.3 | 14.8 | 0.3 | −0.8 | 4.2 | 15.7 | 16.1 |
| ST131 | 13.75 | 45.65 | 15.1 | 15.2 | 16.4 | 13.4 | −0.2 | −0.7 | 4.8 | 14.9 | 15.3 |
| ST132 | 12.33 | 45.50 | 13.6 | 13.6 | 15.3 | 12.1 | 0.0 | −0.6 | 5.9 | 13.3 | 13.8 |
| ST133 | 10.86 | 45.38 | 13.5 | 13.4 | 15.3 | 11.7 | 0.1 | −0.9 | 6.8 | 13.3 | 13.8 |
| ST134 | 14.30 | 40.85 | 16.5 | 16.6 | 17.9 | 14.4 | −0.4 | −0.4 | 5.3 | 16.2 | 16.8 |
| ST135 | −8.63 | 42.23 | 14.1 | 14.0 | 15.3 | 13.0 | 0.3 | −0.9 | 4.6 | 13.9 | 14.3 |
| ST136 | −0.80 | 37.78 | 16.4 | 16.5 | 18.1 | 14.5 | −0.1 | −0.7 | 5.8 | 16.2 | 16.7 |
| ST137 | −3.78 | 40.38 | 15.0 | 15.0 | 16.6 | 13.5 | −0.1 | −0.5 | 5.2 | 14.7 | 15.2 |
| ST138 | −3.46 | 40.48 | 14.6 | 14.6 | 15.7 | 13.2 | −0.2 | −0.7 | 4.7 | 14.4 | 14.8 |
| ST139 | 35.98 | 31.98 | 17.7 | 17.7 | 20.1 | 16.0 | 0.3 | 0.6 | 4.5 | 17.5 | 18.0 |
| ST140 | 35.85 | 32.54 | 20.0 | 19.8 | 22.1 | 18.4 | 0.3 | 0.0 | 3.8 | 19.8 | 20.2 |
| ST141 | 38.20 | 32.56 | 19.4 | 19.4 | 22.0 | 16.4 | −0.2 | 2.0 | 4.9 | 19.1 | 19.6 |
| ST142 | 35.48 | 33.81 | 20.6 | 20.8 | 22.6 | 18.7 | −0.2 | −0.9 | 4.8 | 20.3 | 20.9 |
| ST143 | 35.80 | 34.45 | 18.5 | 18.6 | 21.2 | 16.5 | 0.3 | −0.6 | 6.5 | 18.2 | 18.9 |
| ST144 | 20.26 | 32.10 | 20.2 | 20.2 | 21.1 | 19.3 | 0.0 | −0.1 | 2.2 | 20.0 | 20.3 |
| ST145 | 15.05 | 32.41 | 20.6 | 20.6 | 21.8 | 19.4 | −0.1 | −0.8 | 2.9 | 20.4 | 20.7 |
| ST146 | 10.98 | 31.86 | 20.8 | 20.8 | 22.0 | 19.3 | −0.3 | −0.3 | 3.1 | 20.6 | 21.0 |
| ST147 | 8.75 | 36.95 | 18.3 | 18.5 | 20.0 | 16.7 | −0.1 | −0.8 | 4.8 | 18.0 | 18.6 |
| ST148 | 16.58 | 31.20 | 21.0 | 21.0 | 23.3 | 19.4 | 0.5 | 1.1 | 3.5 | 20.8 | 21.3 |
| ST149 | 13.15 | 32.66 | 20.6 | 20.6 | 21.9 | 19.3 | 0.0 | −0.8 | 3.4 | 20.4 | 20.8 |
| ST150 | 14.48 | 35.85 | 18.8 | 18.8 | 19.7 | 17.5 | −0.5 | −0.4 | 2.9 | 18.6 | 18.9 |
| ST151 | −8.03 | 31.61 | 20.0 | 20.0 | 21.5 | 18.1 | −0.4 | −0.1 | 3.6 | 19.8 | 20.2 |
| ST152 | −7.58 | 33.36 | 17.6 | 17.7 | 18.7 | 16.3 | −0.3 | −0.8 | 3.5 | 17.4 | 17.7 |
| ST153 | −1.93 | 34.78 | 17.0 | 17.0 | 18.6 | 15.4 | 0.0 | −0.8 | 5.0 | 16.7 | 17.2 |
| ST154 | −6.77 | 34.04 | 17.4 | 17.4 | 18.2 | 16.7 | 0.2 | −0.8 | 2.5 | 17.2 | 17.5 |
| ST155 | −5.90 | 35.73 | 17.9 | 17.9 | 19.0 | 16.9 | −0.1 | −0.6 | 2.9 | 17.8 | 18.1 |
| ST156 | −6.73 | 41.80 | 12.8 | 12.8 | 14.3 | 11.4 | 0.0 | −0.5 | 4.9 | 12.6 | 13.0 |
| ST157 | −7.96 | 37.01 | 17.8 | 17.9 | 18.9 | 15.8 | −0.6 | 1.2 | 3.6 | 17.6 | 18.0 |
| ST158 | −9.09 | 38.43 | 17.5 | 17.5 | 18.5 | 16.4 | 0.0 | −1.0 | 3.2 | 17.3 | 17.6 |
| ST159 | 13.56 | 45.51 | 13.6 | 13.7 | 14.9 | 11.2 | −0.8 | 1.8 | 5.1 | 13.4 | 13.8 |
| ST160 | 13.71 | 46.50 | 7.4 | 7.5 | 9.1 | 5.5 | −0.1 | −1.0 | 13.5 | 7.2 | 7.7 |
| ST161 | −2.50 | 36.80 | 19.0 | 19.1 | 20.0 | 17.7 | −0.6 | 0.1 | 2.8 | 18.9 | 19.2 |
| ST162 | −1.85 | 38.95 | 14.3 | 14.4 | 15.6 | 12.7 | −0.3 | −0.5 | 5.3 | 14.1 | 14.5 |
| ST163 | −0.50 | 38.36 | 18.3 | 18.4 | 19.2 | 17.1 | −0.3 | −0.9 | 3.2 | 18.1 | 18.4 |
| ST164 | −2.38 | 36.85 | 19.0 | 19.1 | 20.0 | 17.9 | −0.3 | −0.4 | 2.7 | 18.9 | 19.2 |
| ST165 | 2.38 | 41.57 | 14.6 | 14.7 | 15.9 | 13.2 | −0.1 | −0.3 | 4.2 | 14.4 | 14.7 |
| ST166 | −0.55 | 38.28 | 18.2 | 18.3 | 19.3 | 17.0 | −0.4 | 0.0 | 2.9 | 18.1 | 18.4 |
| ST167 | −4.51 | 40.65 | 11.1 | 11.2 | 12.9 | 9.2 | 0.0 | −0.8 | 8.3 | 10.8 | 11.3 |
| ST168 | −6.81 | 38.88 | 17.1 | 17.0 | 18.4 | 15.9 | 0.0 | −0.5 | 3.7 | 16.9 | 17.3 |
| ST169 | 2.07 | 41.25 | 15.8 | 15.9 | 16.7 | 14.4 | −0.4 | −0.8 | 4.0 | 15.6 | 16.0 |
| ST170 | 2.06 | 41.28 | 16.2 | 16.4 | 17.8 | 14.8 | −0.1 | −1.4 | 5.9 | 15.9 | 16.5 |
| ST171 | 25.96 | 31.71 | 17.0 | 16.9 | 18.9 | 15.5 | 0.4 | 0.2 | 4.3 | 16.7 | 17.2 |
| ST172 | −6.03 | 43.55 | 10.7 | 10.8 | 12.1 | 9.2 | −0.2 | −0.9 | 6.9 | 10.5 | 10.9 |
| ST173 | −6.33 | 39.46 | 16.4 | 16.3 | 17.7 | 15.0 | 0.0 | 0.2 | 3.5 | 16.2 | 16.6 |
| ST174 | −0.06 | 39.95 | 17.6 | 17.8 | 18.8 | 15.9 | −0.4 | −0.9 | 4.6 | 17.3 | 17.8 |
| ST175 | −3.91 | 38.98 | 15.5 | 15.7 | 17.0 | 13.0 | −0.8 | 0.3 | 6.3 | 15.2 | 15.8 |
| ST176 | −4.83 | 37.85 | 18.2 | 18.2 | 19.5 | 16.9 | −0.1 | −0.7 | 3.6 | 18.0 | 18.3 |
| ST177 | −2.13 | 40.06 | 13.2 | 13.2 | 15.0 | 11.7 | 0.2 | −0.7 | 6.6 | 13.0 | 13.5 |
| ST178 | −1.41 | 41.11 | 13.0 | 13.1 | 14.2 | 11.6 | −0.3 | −0.7 | 5.3 | 12.8 | 13.2 |
| ST179 | 2.50 | 41.58 | 15.6 | 16.0 | 17.4 | 13.2 | −0.4 | −0.9 | 7.2 | 15.3 | 15.9 |
| ST180 | 2.76 | 41.90 | 14.8 | 14.8 | 16.2 | 13.2 | −0.1 | −0.8 | 5.1 | 14.6 | 15.0 |
| ST181 | −3.78 | 37.18 | 15.5 | 15.4 | 17.5 | 14.2 | 0.5 | −0.3 | 5.0 | 15.3 | 15.7 |
| ST182 | 35.78 | 30.16 | 17.8 | 17.8 | 20.1 | 15.9 | 0.1 | 0.8 | 4.7 | 17.5 | 18.0 |
| ST183 | −6.91 | 37.28 | 18.3 | 18.3 | 19.2 | 17.1 | −0.3 | 0.4 | 2.3 | 18.2 | 18.4 |
| ST184 | 1.38 | 38.88 | 18.2 | 18.2 | 19.1 | 17.1 | −0.3 | −0.6 | 2.7 | 18.0 | 18.3 |
| ST185 | −0.40 | 39.50 | 15.6 | 15.6 | 16.9 | 14.2 | −0.2 | −0.5 | 4.1 | 15.4 | 15.8 |
| ST186 | −6.06 | 36.75 | 18.1 | 18.2 | 19.3 | 16.9 | −0.2 | −0.1 | 2.9 | 18.0 | 18.3 |
| ST187 | −0.33 | 42.08 | 14.1 | 14.2 | 15.6 | 12.9 | 0.0 | −0.7 | 5.0 | 13.9 | 14.3 |
| ST188 | −5.65 | 42.58 | 11.1 | 11.1 | 12.2 | 10.0 | 0.1 | −0.2 | 4.4 | 11.0 | 11.3 |
| ST189 | 0.62 | 41.62 | 15.1 | 15.1 | 16.3 | 13.9 | 0.0 | −0.8 | 4.1 | 15.0 | 15.3 |
| ST190 | −2.33 | 42.45 | 14.0 | 14.0 | 14.9 | 12.8 | −0.1 | −1.1 | 4.4 | 13.8 | 14.1 |
| ST191 | −3.55 | 40.45 | 14.6 | 14.5 | 16.0 | 12.9 | 0.2 | −0.4 | 5.0 | 14.4 | 14.8 |
| ST192 | −3.71 | 40.30 | 14.4 | 14.3 | 16.2 | 12.7 | 0.3 | −0.2 | 5.6 | 14.2 | 14.6 |
| ST193 | −3.40 | 40.24 | 15.1 | 15.1 | 16.7 | 13.7 | 0.1 | −0.4 | 4.9 | 14.9 | 15.3 |
| ST194 | −4.48 | 36.66 | 18.6 | 18.6 | 19.9 | 17.3 | −0.1 | −1.0 | 3.6 | 18.4 | 18.8 |
| ST195 | −2.95 | 35.28 | 19.0 | 19.0 | 19.9 | 17.9 | −0.1 | −0.9 | 2.7 | 18.8 | 19.1 |
| ST196 | 4.23 | 39.86 | 17.2 | 17.3 | 18.2 | 15.7 | −0.5 | −0.7 | 3.8 | 17.0 | 17.4 |
| ST197 | −1.88 | 40.85 | 10.6 | 10.6 | 11.7 | 9.3 | −0.1 | −0.9 | 6.2 | 10.4 | 10.8 |
| ST198 | −5.61 | 37.15 | 17.9 | 18.0 | 19.3 | 16.4 | −0.3 | −0.6 | 4.1 | 17.7 | 18.1 |
| ST199 | −1.23 | 37.95 | 18.3 | 18.3 | 19.4 | 17.1 | −0.1 | −0.4 | 3.3 | 18.1 | 18.5 |
| ST200 | −4.01 | 40.78 | 7.0 | 7.0 | 8.7 | 5.4 | 0.0 | −0.2 | 11.3 | 6.8 | 7.2 |
| ST201 | 2.73 | 39.55 | 16.6 | 16.7 | 17.9 | 15.1 | −0.4 | −0.8 | 4.5 | 16.4 | 16.8 |
| ST202 | −1.38 | 42.49 | 13.0 | 13.0 | 14.2 | 11.7 | 0.1 | −0.9 | 5.2 | 12.8 | 13.2 |
| ST203 | −6.58 | 42.56 | 13.1 | 13.0 | 14.5 | 12.2 | 0.2 | −1.0 | 4.8 | 12.9 | 13.3 |
| ST204 | 1.16 | 41.15 | 16.2 | 16.4 | 17.8 | 14.5 | −0.1 | −0.6 | 4.5 | 16.0 | 16.4 |
| ST205 | −6.35 | 36.56 | 18.1 | 18.2 | 19.3 | 16.9 | −0.3 | −0.2 | 3.0 | 18.0 | 18.3 |
| ST206 | −5.50 | 40.95 | 12.1 | 12.1 | 13.3 | 10.8 | −0.1 | −0.7 | 5.2 | 11.9 | 12.3 |
| ST207 | −1.39 | 42.46 | 12.9 | 12.9 | 14.2 | 11.4 | −0.1 | −0.8 | 5.6 | 12.7 | 13.1 |
| ST208 | −5.39 | 40.57 | 12.7 | 12.7 | 16.5 | 10.7 | 0.7 | 0.8 | 9.2 | 12.4 | 13.1 |
| ST209 | −4.11 | 40.95 | 12.3 | 12.3 | 13.7 | 11.0 | 0.0 | −0.8 | 5.8 | 12.1 | 12.5 |
| ST210 | −3.63 | 42.35 | 19.1 | 19.4 | 20.4 | 17.8 | −0.2 | −1.1 | 3.9 | 18.9 | 19.4 |
| ST211 | −2.46 | 41.76 | 11.1 | 11.1 | 12.4 | 9.9 | 0.0 | −1.0 | 5.9 | 10.9 | 11.3 |
| ST212 | 13.50 | 45.83 | 13.5 | 13.4 | 15.0 | 12.0 | 0.2 | −0.5 | 5.5 | 13.3 | 13.7 |
| ST213 | −5.90 | 37.41 | 15.9 | 15.8 | 17.4 | 14.5 | 0.1 | −0.6 | 4.7 | 15.7 | 16.1 |
| ST214 | 0.50 | 40.81 | 17.8 | 17.8 | 18.9 | 16.6 | −0.1 | −0.9 | 3.5 | 17.6 | 18.0 |
| ST215 | −0.46 | 39.50 | 17.6 | 17.6 | 18.9 | 16.3 | −0.2 | −0.9 | 3.7 | 17.4 | 17.8 |
| ST216 | −4.76 | 41.65 | 12.7 | 12.7 | 14.3 | 9.9 | −0.7 | 1.8 | 6.4 | 12.4 | 12.9 |
| ST217 | −0.45 | 39.58 | 18.3 | 18.4 | 19.5 | 17.0 | −0.3 | −0.9 | 3.5 | 18.1 | 18.5 |
| ST218 | 35.00 | 32.80 | 19.8 | 19.9 | 21.7 | 18.3 | 0.2 | −0.9 | 4.7 | 19.5 | 20.1 |
| ST219 | −5.73 | 41.51 | 13.2 | 13.1 | 14.7 | 12.0 | 0.1 | −0.9 | 5.3 | 13.0 | 13.4 |
| ST220 | −1.01 | 41.66 | 15.6 | 15.5 | 17.0 | 14.2 | 0.0 | −0.8 | 4.7 | 15.4 | 15.8 |
| ST221 | 40.91 | 34.41 | 20.7 | 20.7 | 22.2 | 19.1 | −0.2 | −0.9 | 4.1 | 20.5 | 21.0 |
| ST222 | 37.21 | 36.18 | 17.8 | 17.9 | 19.5 | 16.3 | −0.1 | 0.3 | 3.6 | 17.7 | 18.0 |
| ST223 | 37.47 | 35.21 | 18.2 | 18.3 | 19.5 | 16.5 | −0.3 | −0.1 | 4.0 | 18.0 | 18.4 |
| ST224 | 36.51 | 33.41 | 17.2 | 17.4 | 19.3 | 15.2 | −0.1 | −0.4 | 5.3 | 16.9 | 17.4 |
| ST225 | 36.10 | 32.60 | 17.7 | 17.7 | 19.9 | 16.3 | 0.4 | 1.3 | 3.9 | 17.5 | 17.9 |
| ST226 | 40.15 | 35.31 | 20.4 | 20.4 | 22.3 | 18.6 | 0.0 | 0.6 | 3.6 | 20.2 | 20.6 |
| ST227 | 36.61 | 35.93 | 17.7 | 17.9 | 19.2 | 16.1 | −0.4 | 0.0 | 3.8 | 17.5 | 17.9 |
| ST228 | 36.75 | 35.11 | 18.4 | 18.5 | 21.0 | 16.0 | 0.1 | −0.5 | 6.0 | 18.0 | 18.7 |
| ST229 | 40.75 | 36.50 | 19.0 | 18.8 | 22.5 | 16.6 | 0.6 | −0.3 | 7.3 | 18.6 | 19.4 |
| ST230 | 35.93 | 35.40 | 19.2 | 19.2 | 20.6 | 17.7 | −0.1 | 0.5 | 2.8 | 19.1 | 19.4 |
| ST231 | 36.25 | 32.85 | 17.3 | 17.5 | 19.8 | 15.6 | 0.2 | −0.2 | 5.2 | 17.1 | 17.6 |
| ST232 | 38.00 | 36.81 | 17.8 | 17.9 | 19.8 | 15.9 | −0.2 | 0.0 | 4.4 | 17.6 | 18.1 |
| ST233 | 41.21 | 37.05 | 19.5 | 19.4 | 21.6 | 17.3 | 0.3 | −0.3 | 5.2 | 19.2 | 19.8 |
| ST234 | 36.47 | 33.05 | 16.3 | 16.3 | 19.1 | 14.5 | 0.4 | −0.1 | 6.5 | 16.0 | 16.6 |
| ST235 | 35.76 | 35.53 | 19.8 | 19.7 | 21.5 | 18.1 | 0.3 | 0.2 | 3.5 | 19.6 | 20.0 |
| ST236 | 37.20 | 36.31 | 17.1 | 17.1 | 19.6 | 15.0 | 0.3 | −0.2 | 5.8 | 16.8 | 17.4 |
| ST237 | 36.71 | 34.03 | 13.7 | 13.8 | 16.1 | 12.2 | 0.4 | 0.5 | 6.2 | 13.5 | 14.0 |
| ST238 | 38.30 | 34.55 | 19.4 | 19.3 | 21.2 | 17.8 | 0.2 | 0.2 | 3.7 | 19.1 | 19.6 |
| ST239 | 39.01 | 35.93 | 19.0 | 19.0 | 21.2 | 17.0 | 0.1 | −0.4 | 4.9 | 18.7 | 19.3 |
| ST240 | 36.13 | 34.81 | 18.7 | 18.7 | 20.2 | 17.1 | 0.0 | 0.3 | 3.3 | 18.5 | 18.9 |
| ST241 | 37.03 | 35.00 | 17.7 | 17.4 | 20.8 | 15.5 | 0.6 | −0.3 | 7.1 | 17.3 | 18.1 |
| ST242 | 36.58 | 32.70 | 16.2 | 16.1 | 17.6 | 14.7 | −0.3 | 0.0 | 4.2 | 16.0 | 16.4 |
| ST243 | 35.88 | 34.88 | 19.9 | 19.8 | 22.1 | 18.4 | 0.6 | 0.3 | 3.9 | 19.7 | 20.2 |
| ST244 | 38.95 | 36.70 | 17.5 | 17.6 | 20.9 | 15.4 | 0.7 | 1.3 | 6.0 | 17.2 | 17.9 |
| ST245 | 8.81 | 34.41 | 19.9 | 19.9 | 21.8 | 17.8 | 0.0 | 0.3 | 4.4 | 19.7 | 20.2 |
| ST246 | 10.23 | 36.83 | 19.0 | 19.1 | 20.1 | 17.2 | −0.6 | −0.7 | 4.1 | 18.8 | 19.2 |
| ST247 | 10.10 | 33.88 | 20.3 | 20.2 | 21.5 | 18.7 | 0.1 | −0.2 | 3.3 | 20.1 | 20.5 |
| ST248 | 8.80 | 36.48 | 18.6 | 18.7 | 21.1 | 16.4 | 0.0 | 0.2 | 5.3 | 18.3 | 18.9 |
| ST249 | 10.10 | 35.66 | 20.2 | 20.2 | 21.8 | 18.1 | −0.2 | −1.1 | 4.7 | 20.0 | 20.5 |
| ST250 | 11.08 | 36.85 | 18.8 | 18.9 | 19.7 | 17.1 | −0.9 | 0.0 | 3.6 | 18.6 | 19.0 |
| ST251 | 10.75 | 35.66 | 19.6 | 19.6 | 20.8 | 18.0 | −0.3 | −0.7 | 3.4 | 19.4 | 19.8 |
| ST252 | 7.88 | 33.88 | 22.2 | 22.3 | 23.4 | 20.7 | −0.2 | −0.2 | 2.8 | 22.0 | 22.4 |
| ST253 | 9.78 | 37.24 | 18.3 | 18.4 | 19.7 | 16.8 | 0.1 | −0.4 | 3.9 | 18.1 | 18.5 |
| ST254 | 10.72 | 34.69 | 19.6 | 19.7 | 20.7 | 18.0 | −0.5 | −0.6 | 3.3 | 19.4 | 19.8 |
| ST255 | 11.09 | 33.51 | 20.7 | 20.8 | 21.8 | 19.1 | −0.3 | −1.0 | 3.6 | 20.4 | 20.9 |
| ST256 | 35.41 | 37.00 | 18.8 | 18.8 | 20.3 | 17.3 | −0.1 | −0.3 | 3.5 | 18.6 | 19.0 |
| ST257 | 30.53 | 38.75 | 11.5 | 11.4 | 13.9 | 9.4 | 0.3 | 0.6 | 7.4 | 11.2 | 11.7 |
| ST258 | 27.85 | 38.91 | 16.5 | 16.3 | 19.4 | 14.5 | 0.8 | 0.7 | 6.0 | 16.2 | 16.8 |
| ST259 | 32.00 | 36.55 | 20.0 | 19.5 | 22.8 | 18.3 | 0.6 | −0.9 | 6.4 | 19.6 | 20.3 |
| ST260 | 22.40 | 38.90 | 16.6 | 16.7 | 18.4 | 15.4 | 0.4 | −0.2 | 4.2 | 16.4 | 16.8 |
| ST261 | 30.73 | 36.86 | 18.6 | 18.7 | 20.3 | 17.3 | 0.1 | −1.1 | 4.3 | 18.4 | 18.9 |
| ST262 | 27.85 | 37.85 | 17.9 | 18.0 | 19.2 | 16.4 | 0.0 | −0.9 | 4.1 | 17.7 | 18.1 |
| ST263 | 27.91 | 39.61 | 14.6 | 14.7 | 15.8 | 13.2 | −0.4 | −0.3 | 4.3 | 14.4 | 14.8 |
| ST264 | 16.88 | 40.43 | 16.3 | 16.3 | 19.3 | 13.0 | −0.5 | 0.8 | 8.0 | 15.9 | 16.7 |
| ST265 | 22.01 | 37.06 | 17.6 | 17.7 | 18.8 | 16.6 | 0.1 | −0.8 | 2.9 | 17.5 | 17.8 |
| ST266 | 29.06 | 40.18 | 15.1 | 15.0 | 17.4 | 13.6 | 0.5 | 0.2 | 5.5 | 14.9 | 15.4 |
| ST267 | 26.40 | 40.13 | 15.3 | 15.1 | 17.0 | 14.0 | 0.4 | −0.8 | 4.9 | 15.0 | 15.5 |
| ST268 | 28.32 | 37.92 | 17.6 | 17.6 | 18.6 | 16.6 | 0.0 | −0.4 | 2.8 | 17.5 | 17.8 |
| ST269 | 29.08 | 37.78 | 16.9 | 16.9 | 18.6 | 15.1 | −0.1 | −0.8 | 5.1 | 16.6 | 17.1 |
| ST270 | 40.18 | 37.88 | 15.8 | 15.9 | 17.7 | 13.2 | −0.5 | 2.2 | 5.0 | 15.6 | 16.1 |
| ST271 | 26.56 | 41.66 | 14.0 | 13.8 | 16.8 | 12.7 | 0.8 | 0.8 | 6.3 | 13.7 | 14.2 |
| ST272 | 39.28 | 38.60 | 13.1 | 13.3 | 15.7 | 10.2 | −0.2 | 1.0 | 8.2 | 12.8 | 13.4 |
| ST273 | 34.05 | 37.50 | 12.6 | 12.0 | 16.7 | 9.3 | 0.7 | 0.0 | 13.2 | 12.1 | 13.0 |
| ST274 | 28.26 | 36.85 | 19.4 | 19.3 | 21.9 | 17.6 | 0.6 | 1.2 | 4.3 | 19.2 | 19.7 |
| ST275 | 26.88 | 39.06 | 17.1 | 16.8 | 19.2 | 15.6 | 1.0 | 0.3 | 5.6 | 16.8 | 17.3 |
| ST276 | 30.56 | 39.78 | 10.9 | 10.9 | 12.7 | 9.1 | 0.2 | −0.5 | 7.6 | 10.7 | 11.2 |
| ST277 | 30.15 | 36.30 | 19.7 | 19.3 | 23.3 | 17.9 | 1.0 | 0.1 | 7.1 | 19.3 | 20.1 |
| ST278 | 37.36 | 37.08 | 15.8 | 15.9 | 17.4 | 14.1 | −0.3 | −0.4 | 5.1 | 15.6 | 16.0 |
| ST279 | 36.16 | 36.58 | 20.4 | 20.3 | 22.1 | 18.8 | 0.3 | 0.1 | 3.6 | 20.2 | 20.6 |
| ST280 | 30.55 | 37.75 | 12.3 | 12.3 | 13.9 | 10.6 | −0.1 | 0.1 | 6.2 | 12.0 | 12.5 |
| ST281 | 28.81 | 40.96 | 15.4 | 15.3 | 16.8 | 14.1 | 0.2 | −1.0 | 4.8 | 15.2 | 15.6 |
| ST282 | 27.01 | 38.51 | 18.0 | 18.0 | 19.6 | 15.5 | −0.5 | 1.0 | 4.6 | 17.8 | 18.2 |
| ST283 | 34.50 | 37.60 | 11.0 | 11.0 | 14.1 | 8.9 | 0.2 | −0.6 | 11.4 | 10.7 | 11.4 |
| ST284 | 35.43 | 38.81 | 10.5 | 10.5 | 12.9 | 7.7 | 0.0 | 0.7 | 9.9 | 10.2 | 10.8 |
| ST285 | 34.16 | 39.15 | 11.4 | 11.4 | 13.9 | 7.7 | −0.6 | 2.2 | 9.8 | 11.1 | 11.8 |
| ST286 | 32.54 | 37.96 | 11.7 | 11.8 | 14.2 | 9.5 | 0.3 | 0.8 | 7.7 | 11.5 | 12.0 |
| ST287 | 29.96 | 39.41 | 11.7 | 11.2 | 15.4 | 9.3 | 0.9 | 0.1 | 12.0 | 11.3 | 12.1 |
| ST288 | 38.08 | 38.43 | 13.6 | 13.6 | 15.5 | 11.5 | −0.3 | 1.1 | 5.5 | 13.4 | 13.9 |
| ST289 | 28.36 | 37.21 | 15.2 | 15.2 | 16.3 | 13.9 | −0.1 | −0.5 | 3.9 | 15.0 | 15.3 |
| ST290 | 34.68 | 37.96 | 11.5 | 11.5 | 13.9 | 8.7 | −0.1 | 1.3 | 8.1 | 11.3 | 11.8 |
| ST291 | 33.93 | 36.38 | 20.2 | 19.8 | 23.3 | 18.1 | 0.7 | −0.5 | 6.5 | 19.8 | 20.6 |
| ST292 | 29.08 | 40.96 | 14.8 | 14.6 | 16.8 | 13.4 | 0.6 | −0.7 | 6.4 | 14.6 | 15.1 |
| ST293 | 27.55 | 40.98 | 14.1 | 14.0 | 15.6 | 12.9 | 0.1 | −1.0 | 5.2 | 13.9 | 14.4 |
| ST294 | 26.70 | 39.30 | 17.1 | 16.9 | 19.2 | 15.7 | 0.4 | −0.9 | 5.5 | 16.9 | 17.4 |
| ST295 | 38.76 | 37.13 | 18.7 | 18.6 | 20.5 | 16.7 | −0.2 | 0.1 | 4.3 | 18.4 | 18.9 |
| ST296 | 29.40 | 38.68 | 12.6 | 12.5 | 14.2 | 10.8 | 0.2 | −0.1 | 5.8 | 12.3 | 12.8 |
| ST297 | 36.93 | 37.60 | 17.0 | 17.0 | 18.9 | 15.2 | 0.0 | −0.4 | 4.8 | 16.8 | 17.2 |
| ST298 | 34.80 | 39.81 | 9.7 | 9.7 | 11.8 | 7.8 | 0.1 | −0.3 | 8.9 | 9.4 | 9.9 |
| ST299 | 27.43 | 37.03 | 18.6 | 18.8 | 20.1 | 15.8 | −0.8 | 1.3 | 4.5 | 18.3 | 18.8 |
| ST300 | 42.00 | 37.93 | 18.6 | 18.8 | 20.1 | 15.8 | −0.8 | 1.3 | 4.5 | 18.3 | 18.8 |
| ST301 | 34.57 | 31.67 | 20.1 | 20.1 | 22.1 | 18.7 | 0.2 | −0.2 | 3.7 | 19.9 | 20.3 |
| ST302 | 34.59 | 32.27 | 19.9 | 19.7 | 22.0 | 18.6 | 0.4 | −0.1 | 3.8 | 19.7 | 20.1 |
| ST303 | 5.06 | 36.71 | 17.7 | 17.8 | 18.6 | 16.3 | −0.7 | −0.4 | 3.4 | 17.5 | 17.9 |
| ST304 | 6.95 | 36.88 | 18.4 | 18.6 | 19.6 | 16.8 | −0.6 | −0.5 | 3.9 | 18.2 | 18.7 |
| ST305 | 12.23 | 41.80 | 15.9 | 15.9 | 16.8 | 15.0 | 0.1 | −0.6 | 3.0 | 15.7 | 16.0 |
| ST306 | 10.68 | 34.71 | 19.5 | 19.7 | 20.6 | 17.9 | −0.6 | −0.5 | 3.6 | 19.3 | 19.7 |
| ST307 | 27.30 | 38.40 | 17.9 | 18.0 | 19.6 | 14.9 | −0.9 | 1.7 | 5.4 | 17.6 | 18.2 |
| ST308 | 34.60 | 36.80 | 19.6 | 19.8 | 21.5 | 18.0 | 0.0 | −1.0 | 4.7 | 19.3 | 19.9 |
| ST309 | 34.53 | 38.76 | 10.9 | 10.8 | 14.0 | 9.1 | 0.8 | 1.7 | 8.5 | 10.7 | 11.2 |
| ST310 | 38.28 | 37.75 | 17.1 | 17.1 | 19.3 | 14.3 | −0.2 | 0.8 | 5.7 | 16.8 | 17.4 |
| ST311 | 20.88 | 37.75 | 18.0 | 18.1 | 19.5 | 12.3 | −2.3 | 8.8 | 6.9 | 17.6 | 18.3 |
| ST312 | 14.28 | 37.56 | 14.7 | 14.5 | 21.6 | 11.6 | 2.3 | 6.2 | 14.0 | 14.1 | 15.3 |
References
- Haile, G.G.; Tang, Q.; Moghari, S.M.H.; Liu, X.; Gebremicael, T.G.; Leng, G.; Kebeda, S.; Xu, X.; Yun, X. Projected impacts of climate change on drought patterns over East Africa. Earth’s Future 2020, 8, e2020EF001502. [Google Scholar] [CrossRef]
- Cook, B.; Seager, R.; Williams, P.; Puma, M.J.; McDermid, S.; Kelley, M.; Nazarenko, L. Climate Change Amplification of natural drought variability: The Historic mid-twentieth-century North American drought in a warmer. J. Clim. 2019, 32, 5417–5436. [Google Scholar] [CrossRef]
- Pérez, G.R.; Vico, G. Effects of Temperature and Water Availability on Northern European Boreal Forests. Front. For. Glob. Chang. 2020, 3. [Google Scholar] [CrossRef]
- Wang, M.; Zhi, D.; Chaoyang, W.; Lisheng, S.; Mingguo, M.; Pujia, Y.; Bingqing, L.; Xuguang, T. Divergent responses of ecosystem water-use efficiency to extreme seasonal droughts in Southwest China. Sci. Total. Environ. 2021, 760. [Google Scholar] [CrossRef] [PubMed]
- Jiao, W.; Tian, C.; Chang, Q.; Novick, K.A.; Wang, L. A new multi-sensor integrated index for drought monitoring. Agric. For. Meteorol. 2019, 268, 74–85. [Google Scholar] [CrossRef] [Green Version]
- Singh, R.M.; Shukla, P. Drought characterization using Drought indices and El Niño effects. Natl. Acad. Sci. Lett. 2020, 43, 339–342. [Google Scholar] [CrossRef]
- He, B.; Change, J.; Wang, W.; Zhou, S.; Chen, C. Spatio-temporal evolution and non-stationary characteristics of meteorological drought in inland arid areas. Ecol. Indic. 2021, 126, 107644. [Google Scholar] [CrossRef]
- Yang, P.; Xia, J.; Zhang, Y.; Zhan, C.; Cai, W.; Zhang, S.; Wang, W. Quantitative study on characteristics of hydrological drought in arid area of Northwest China under changing environment. J. Hydrol. 2021, 597, 126343. [Google Scholar] [CrossRef]
- Srinivasarao, C.H.; Rao, K.V.; Gopinath, A.; Prasad, G.; Runachalam, A.; Ramana, D.B.V.; Ravindra Chary, G.; Gangaiah, B.; Venkateswarlu, B.; Mohapatra, T. Chapter Two—Agriculture contingency plans for managing weather aberrations and extreme climatic events: Development, implementation and impacts in India. Adv. Agron. 2020, 159, 35–91. [Google Scholar]
- Mondala, S.K.; Huang, J.; Wang, Y.; Su, B.; Zhai, J.; Tao, H.; Wang, G.; Fischer, T.; Wen, S.; Jiangc, T. Doubling of the population exposed to drought over South Asia: CMIP6 multi-model-based analysis. Sci. Total Environ. 2021, 771, 145186. [Google Scholar] [CrossRef] [PubMed]
- Mishra, A.; Bruno, E.; Zilberman, D. Compound natural and human disasters: Managing drought and COVID-19 to sustain global agriculture and food sectors. Sci. Total Environ. 2021, 754, 142210. [Google Scholar] [CrossRef] [PubMed]
- Phillips, C.A.; Caldas, A.; Cleetus, R.; Dahl, K.A.; Barreto, J.D.; Licker, R.; Merner, L.D.; Partida, P.O.J.; Phelan, A.L.; Spanger-Siegfried, E.; et al. Compound climate risks in the COVID-19 pandemic. Nat. Clim. Chang. 2020, 10, 586–588. [Google Scholar] [CrossRef]
- Schwartz, S.A. Climate change, Covid-19, preparedness, and consciousness. Explore 2020, 16, 141–144. [Google Scholar] [CrossRef] [PubMed]
- Parsons, D.J.; Reyb, D.; Tanguyc, M.; Holman, I.P. Regional variations in the link between drought indices and reported agricultural impacts of drought. Agric. Syst. 2019, 173, 119–129. [Google Scholar] [CrossRef]
- Esit, M.; Kumar, S.; Pandey, A.; Lawrence, D.M.; Rangwala, I.; Yeager, S. Seasonal to multi-year soil moisture drought forecasting. Clim. Atmos. Sci. 2021, 4. [Google Scholar] [CrossRef]
- Cammarano, D.; Ceccarellib, S.; Grando, S.; Romagosa, I.; Benbelkaceme, A.; Akarf, T.; Yassin, A.; Pecchionihi, N.; Franciai, E.; Ronga, D. The impact of climate change on barley yield in the Mediterranean basin. Eur. J. Agron. 2019, 106, 1–11. [Google Scholar] [CrossRef]
- Sardans, J.; Urbin, F.; Grau, O.; Asensio, D.; Ogaya, R.; Peñuelas, J. Long-term drought decreases ecosystem C and nutrient storage in a Mediterranean holm oak forest. Environ. Exp. Bot. 2020, 177, 104135. [Google Scholar] [CrossRef]
- Crausbay, S.D.; Ramirez, A.R.; Carter, S.L.; Cross, M.S.; Hall, K.R.; Bathke, D.J.; Betancourt, J.L.; Colt, S.; Cravens, A.E.; Dalton, M.S.; et al. Defining Ecological Drought for the Twenty-First Century. Bull. Am. Meteorol. Soc. 2017, 98, 2543–2550. [Google Scholar] [CrossRef]
- Stott, P.A.; Christidis, N.; Otto, F.E.L.; Sun, Y.; Van Oderlinden, J.P.; Vautard, R.; von Storch, V.; Walton, P.; Yiou, P.; Zwiers, F.W. Attribution of extreme weather and climate-related events. Wiley Interdiscip. Rev. Clim. Chang. 2016, 7, 23–41. [Google Scholar] [CrossRef]
- Diffenbaugh, N.S.; Singh, D.; Mankin, J.S.; Horton, D.E.; Swain, D.L.; Touma, D.; Charland, A.; Liu, Y.; Haugen, M.; Tsiang, M.; et al. Quantifying the influence of global warming on unprecedented extreme climate events. Proc. Natl. Acad. Sci. USA 2017, 114, 4881–4886. [Google Scholar] [CrossRef] [PubMed] [Green Version]
- Crausbay, S.D.; Betancourt, J.; Bradford, J.; Cartwright, J.; Dennison, W.C.; Dunham, J.; Enquist, C.A.F.; Frazier, A.G.; Hall, K.; Littell, J.S.; et al. Unfamiliar territory: Emerging themes for ecological drought research and management. One Earth 2020, 3, 337–353. [Google Scholar] [CrossRef]
- Hasan, A.G.; Fullen, M.A.; Oloke, D. Problems of drought and its management in Yobe State, Nigeria. Weather. Clim. Extrem. 2019, 23, 100192. [Google Scholar] [CrossRef]
- Zhao, T.; Dai, A. The Magnitude and Causes of Global Drought Changes in the Twenty-First Century under a Low–Moderate Emissions Scenario. Bull. Am. Meteorol. Soc. 2015, 28, 4490–4512. [Google Scholar] [CrossRef]
- Zhao, T.; Dai, A. Uncertainties in historical changes and future projections of drought. Part II: Model-simulated historical and future drought changes. Clim. Chang. 2016, 144, 535–548. [Google Scholar] [CrossRef]
- Lu, Y.J.; Cai, H.J.; Jiang, T.T.; Sun, S.K.; Wang, Y.B.; Zhao, J.; Yu, K.; Sun, J. Assessment of global drought propensity and its impacts on agricultural water use in future climate scenarios. Agric. For. Meteorol. 2019, 278, 107623. [Google Scholar] [CrossRef]
- McEvoy, J.; Bathke, D.J.; Burkardt, N.; Cravens, A.E.; Haigh, T.; Hall, K.R.; Hayes, M.J.; Jedd, T.; Podebradska, M.; Wickham, E. Ecological drought: Accounting for the non-human impacts of water shortage in the Upper Missouri Headwaters Basin, Montana, USA. Resources 2018, 7, 14. [Google Scholar] [CrossRef] [Green Version]
- Lionello, P.; Scarascia, L. The relation between climate change in the Mediterranean region and global warming. Reg. Environ. Chang. 2018, 18, 1481–1493. [Google Scholar] [CrossRef]
- Spinoni, J.; Barbosa, P.; De Jager, A.; McCormick, N.; Naumann, G.; Vogt, J.V.; Magni, D.; Masante, D.; Mazzeschi, M. A new global database of meteorological drought events from 1951 to 2016. J. Hydrol. Reg. Stud. 2019, 22, 100593. [Google Scholar] [CrossRef]
- Vogel, J.; Paton, E.; Aich, V.; Bronstert, A. Increasing compound warm spells and droughts in the Mediterranean Basin. Weather Clim. Extrem. 2021, 32, 100312. [Google Scholar] [CrossRef]
- Malhi, Y.; Girardin, C.; Metcalfe, D.B.; Doughty, C.E.; Aragão, L.E.O.C.; Rifai, S.W.; Oliveras, I.; Shenkin, A.; Aguirre-Gutiérrez, J.; Dahlsjö, C.A.L.; et al. The global ecosystems monitoring network: Monitoring ecosystem productivity and carbon cycling across the tropics. Biol. Conserv. 2021, 253, 108889. [Google Scholar] [CrossRef]
- Soares, P.M.M.; Cardoso, R.M.; Lima, D.C.A.; Miranda, P.M.A. Future precipitation in Portugal: High-resolution projections using WRF model and EURO-CORDEX multi-model ensembles. Clim. Dyn. 2017, 49, 2503–2530. [Google Scholar] [CrossRef]
- Tramblay, Y.; Koutroulis, A.; Samaniego, L.; Vicente-Serrano, S.M.; Volaire, F.; Boone, A.; Page, M.L.; Llasat, M.C.; Albergel, C.; Burak, S.; et al. Challenges for drought assessment in the Mediterranean region under future climate scenarios. Earth Sci. Rev. 2020, 210, 103348. [Google Scholar] [CrossRef]
- IPCC. Global Warming of 1.5 °C. An IPCC Special Report on the Impacts of Global Warming of 1.5 °C Above Pre-Industrial Levels and Related Global Greenhouse Gas Emission Pathways. In The Context of Strengthening the Global Response to the Threat of Climate Change, Sustainable Development, and Efforts to Eradicate Poverty; Masson-Delmotte, P., Zhai, H.O., Pörtner, D., Roberts, D., Skea, J., Shukla, P.R., Pirani, A., Moufouma-Okia, W., Péan, C., Pidcock, R., et al., Eds.; 2018; in press. [Google Scholar]
- Ding, Y.; Mu, C.; Wu, T.; Hu, G.; Zou, D.; Wang, D.; Li, W.; Wu, X. Increasing cryospheric hazards in a warming climate. Earth Sci. Rev. 2020, 213, 103500. [Google Scholar] [CrossRef]
- Lionello, P.; Gacic, M.; Gomis, D.; Garcia-Herrera, R.; Giorgi, F.; Planton, S.; Trigo, R.; Theocharis, A.; Tsimplis, M.N.; Ulbrich, U.; et al. Program focuses on climate of the Mediterranean region. Eos Trans. Am. Geophys. Union 2012, 93, 105–106. [Google Scholar] [CrossRef]
- Michaelides, S.; Karacostas, T.; Sanchez, J.L.; Retalis, A.; Pytharoulis, I.; Homar, V.; Romero, R.; Zanis, P.; Giannakopoulos, C.; Bühl, J.; et al. Reviews and perspectives of high impact atmospheric processes in the Mediterranean. Atmos. Res. 2018, 208, 4–44. [Google Scholar] [CrossRef]
- Hertig, E.; Tramblay, Y. Regional downscaling of Mediterranean droughts under past and future climatic conditions. Glob. Planet Chang. 2017, 151, 36–48. [Google Scholar] [CrossRef]
- Cook, B.I.; Anchukaitis, K.J.; Touchan, R.; Meko, D.M.; Cook, E.R. Spatiotemporal drought variability in the Mediterranean over the last 900 years. J. Geophys. Res. Atmos. 2016, 121, 2060–2074. [Google Scholar] [CrossRef] [PubMed]
- Vicente-Serrano, S.M. Differences in spatial patterns of drought on different timescales: An analysis of the Iberian Peninsula. Water Resour. Manag. 2006, 20, 37–60. [Google Scholar] [CrossRef]
- Caloiero, T.; Veltri, S.; Frustaci, F. Drought Analysis in Europe and in the Mediterranean Basin Using the Standardized Precipitation Index. Water 2018, 10, 1043. [Google Scholar] [CrossRef] [Green Version]
- Klein Tank, A.M.G.; Wijngaard, J.B.; Konnen, G.P.; Böhm, R.; Demarée, G.; Gocheva, A.; Mileta, M.; Pashiardis, S.; Hejkrlik, L.; Kern-Hansen, C.; et al. Daily dataset of 20th-century surface air temperature and precipitation series for the European Climate Assessment. Int. J. Climatol. 2002, 22, 1441–1453. [Google Scholar] [CrossRef]
- Menne, M.J.; Durre, I.; Vose, R.S.; Gleason, B.E.; Houston, T.G. An overview of the global historical climatology network daily database. J. Atmos. Ocean. Technol. 2012, 29, 897–910. [Google Scholar] [CrossRef]
- Szentimrey, T. Theoretical questions of daily data homogenization. Időjárás 2013, 117, 113–122. [Google Scholar]
- Szentimrey, T. Multiple Analysis of Series for Homogenization (MASH). In Proceedings of the Second Seminar for Homogenization of Surface Climatological Data, Budapest, Hungary, 9–13 November 1998; WMO: Budapest, Hungary, 1999; pp. 27–46. [Google Scholar]
- Haied, N.; Foufou, A.; Chaab, S.; Azlaoui, M.; Khadri, K.; Benzahia, K.; Benzahia, I. Drought assessment and monitoring using meteorological indices in a semi-arid region. Energy Procedia 2017, 119, 518–529. [Google Scholar] [CrossRef]
- Adnan, S.; Ullah, K.; Shuanglin, L.; Gao, S.; Hayat Khan, A.; Mahmood, R. Comparison of various drought indices to monitor drought status in Pakistan. Clim. Dyn. 2018, 51, 1885–1899. [Google Scholar] [CrossRef]
- Xu, L.; Abbaszadeh, P.; Moradkhani, H.; Chen, N.; Zhang, X. Continental drought monitoring using satellite soil moisture, data assimilation and an integrated drought index. Remote Sens. Environ. 2020, 250, 112028. [Google Scholar] [CrossRef]
- Hong, M.; Lee, S.H.; Lee, S.J.; Choi, J.Y. Application of high-resolution meteorological data from NCAM-WRF to characterize agricultural drought in small-scale farmlands based on soil moisture deficit. Agric. Water Manag. 2021, 243, 106494. [Google Scholar] [CrossRef]
- Heim, R.R. A review of twentieth-century drought indices used in the United States. Bull. Am. Meteorol. Soc. 2002, 83, 1149–1165. [Google Scholar] [CrossRef] [Green Version]
- Alvalá, R.C.S.; Cunha, A.P.N.A.; Britos, S.S.B.; Seluchi, M.E.; Marengo, J.A.; Moraes, L.L.M.; Carvalho, M.A. Drought monitoring in the Brazilian Semiarid region. An. Acad. Bras. Ciências 2019, 91. [Google Scholar] [CrossRef] [Green Version]
- McKee, T.B.; Doesken, N.J.; Kleist, J. The relationship of drought frequency and duration to time scales. In Proceeding of the 8th Conference on Applied Climatology, Anaheim, CA, USA, 17–22 January 1993; American Meteorological Society: Boston, MA, USA, 1993; pp. 179–184. [Google Scholar]
- McKee, T.B.; Doesken, N.J.; Kleist, J. Drought monitoring with Multiple Time scales. In Proceeding of the Ninth Conference on Applied Climatology, Dallas, TX, USA, 15–20 January 1995; American Meteorological Society: Dallas, TX, USA, 1995; pp. 233–236. [Google Scholar]
- Guttman, N.B. Accepting the standardized precipitation index: A calculation algorithm. J. Am. Water Resour. Assoc. 1999, 35, 311–322. [Google Scholar] [CrossRef]
- Turco, M.; Jerez, S.; Donat, M.G.; Toreti, A.; Vicente-Serrano, S.M.; Doblas-Reyes, F.J. A global probabilistic dataset for monitoring meteorological droughts. Bull. Am. Meteorol. Soc. 2020, 101, E1628–E1644. [Google Scholar] [CrossRef] [Green Version]
- Vicente-Serrano, S.M.; Begueria, S.; Lopez-Moreno, J.I. A multi-scalar drought index sensitive to global warming: The standardized precipitation evapotranspiration index. J. Clim. 2010, 23, 1696–1718. [Google Scholar] [CrossRef] [Green Version]
- Beguería, S.; Vicente-Serrano, S.M.; Reig, F.; Latorre, B. Standardized Precipitation Evapotranspiration Index (SPEI) Revisited: Parameter fitting, evapotranspiration models, tools, datasets and drought monitoring. Int. J. Climatol. 2014, 34, 3001–3023. [Google Scholar] [CrossRef] [Green Version]
- Tsakiris, G.; Vangelis, H. Establishing a drought index incorporating evapotranspiration. Eur. Water 2005, 9, 3–11. [Google Scholar]
- Tsakiris, G.; Pangalou, D.; Vangelis, H. Regional Drought Assessment Based on the Reconnaissance Drought Index (RDI). Water Resour. Manag. 2007, 21, 821–833. [Google Scholar] [CrossRef]
- Zhang, J.; Shen, Y. Spatio-temporal variations in extreme drought in China during 1961–2015. J. Geogr. Sci. 2019, 29, 67–83. [Google Scholar] [CrossRef] [Green Version]
- Zhao, R.; Wang, H.; Chen, J.; Fu, G.; Zhang, C.; Yang, H. Quantitative analysis of nonlinear climate change impact on drought based on the standardized precipitation and evapotranspiration index. Ecol. Indic. 2021, 121, 107107. [Google Scholar] [CrossRef]
- Scocco, P.; Piermarteri, K.; Malfatti, A.; Tardella, F.M.; Catorci, A. Increase of drought stress negatively affects the sustainability of extensive sheep farming in sub-Mediterranean climate. J. Arid Environ. 2016, 128, 50–58. [Google Scholar] [CrossRef]
- González-Hidalgo, J.C.; Vicente-Serrano, S.M.; Peña-Angulo, D.; Salinas, C.; Tomas-Burguera, M.; Beguería, S. High-resolution spatio-temporal analyses of drought episodes in the western Mediterranean basin (Spanish mainland, Iberian Peninsula). Acta Geophys. 2018, 66, 381–392. [Google Scholar] [CrossRef] [Green Version]
- Wu, D.; Li, Z.; Zhu, Y.; Li, X.; Wu, Y.; Fang, S. A new agricultural drought index for monitoring the water stress of winter wheat. Agric. Water Manag. 2021, 244, 106599. [Google Scholar] [CrossRef]
- Hargreaves, G.H.; Samani, Z.A. Reference crop evapotranspiration from temperature. Trans. ASAE 1985, 1, 96–99. [Google Scholar] [CrossRef]
- Samani, Z.A. Estimating Solar Radiation and Evapotranspiration Using Minimum Climatological Data. J. Irrig. Drain. Eng. 2000, 126, 265–267. [Google Scholar] [CrossRef]
- Sheffield, J.; Wood, E.F.; Roderick, M.L. Little change in global drought over the past 60 years. Nature 2012, 491, 435–438. [Google Scholar] [CrossRef]
- Dai, A. Characteristics and trends in various forms of the Palmer Drought Severity Index during 1900–2008. J. Geophys. Res. Atmos. 2011, 116, D12. [Google Scholar] [CrossRef] [Green Version]
- Van der Schrier, G.; Barichivich, J.; Briffa, K.R.; Jones, P.D. A scPDSI-based global dataset of dry and wet spells for 1901–2009. J. Geophys. Res. Atmos. 2013, 118, 4025–4048. [Google Scholar] [CrossRef]
- Valipour, M.; Bateni, S.M.; Gholami Sefidkouhi, M.A.; Raeini-Sarjaz, M.; Singh, V.P. Complexity of Forces Driving Trend of Reference Evapotranspiration and Signals of Climate Change. Atmosphere 2020, 1, 1081. [Google Scholar] [CrossRef]
- Beguería, S.; Vicente-Serrano, S.M. SPEI: Calculation of the Standardised Precipitation-Evapotranspiration Index. Available online: https://cran.r-project.org/package=SPEI (accessed on 5 June 2020).
- Yang, P.; Zhang, Y.; Xia, J.; Sun, S. Identification of drought events in the major basins of central Asia based on a combined climatological deviation index from grace measurements. Atmos. Res. 2020, 244, 105105. [Google Scholar] [CrossRef]
- Sepulcre-Cantó, G.; Horion, S.; Singleton, A.; Carrao, H.; Vogt, J. Development of a Combined Drought Indicator to detect agricultural drought in Europe. Nat. Hazards Earth Syst. Sci. 2012, 12, 3519–3531. [Google Scholar] [CrossRef] [Green Version]
- Naumann, G.; Alfieri, A.; Wyser, K.; Mentaschi, L.; Betts, R.A.; Carrao, H.; Soinoni, J.; Vogt, J.; Feyen, L. Global Changes in Drought Conditions Under Different Levels of Warming. Geophys. Res. Lett. 2018, 45, 3285–3296. [Google Scholar] [CrossRef]
- Cammalleri, C.; Arias-Muñoz, C.; Barbosa, P.; De Jager, A.; Magni, D.; Musante, D.; Mazzeschi, M.; McCormick, N.; Naumann, G.; Spinoni, J.; et al. A revision of the Combined Drought Indicator (CDI) used in the European Drought Observatory (EDO). Nat. Hazards Earth Syst. Sci. 2021, 21, 481–495. [Google Scholar] [CrossRef]
- Hao, Z.; Hao, F.; Singh, V.P.; Xia, Y.; Ouyang, W.; Shen, X. A theoretical drought classification method for the multivariate drought index based on distribution properties of standardized drought indices. Adv. Water Resour. 2016, 92, 240–247. [Google Scholar] [CrossRef]
- Spinoni, J.; Vogt, J.V.; Naumann, G.; Barbosa, P.; Dosio, A. Will drought events become more frequent and severe in Europe? Int. J. Climatol. 2018, 38, 1718–1736. [Google Scholar] [CrossRef] [Green Version]
- Zhu, J.; Zhou, L.; Huang, S. A hybrid drought index combining meteorological, hydrological, and agricultural information based on the entropy weight theory. Arab. J. Geosci. 2018, 11. [Google Scholar] [CrossRef]
- Stagge, J.H.; Kohn, I.; Tallaksen, L.M.; Stahl, K. Modeling drought impact occurrence based on meteorological drought indices in Europe. J. Hydrol. 2015, 530, 37–50. [Google Scholar] [CrossRef]
- Hao, Z.; Singh, V.P. Drought characterization from a multivariate perspective: A review. J. Hydrol. 2015, 527, 668–678. [Google Scholar] [CrossRef]
- Dai, A.; Zhao, T.; Chen, J. Climate change and drought: A precipitation and evaporation perspective. Curr. Clim. Chang. Rep. 2018, 4, 301–312. [Google Scholar] [CrossRef]
- Salehnia, N.; Alizadeh, A.; Sanaeinejad, H.; Bannayan, M.; Zarrin, A.; Hoogenboom, G. Estimation of meteorological drought indices based on AgMERRA precipitation data and station-observed precipitation data. J. Arid Land 2017, 9, 797–809. [Google Scholar] [CrossRef] [Green Version]
- Tadić, L.; Bonacci, O.; Brleković, T. An example of principal component analysis application on climate change assessment. Theor. Appl. Climatol. 2019, 138, 1049–1062. [Google Scholar] [CrossRef]
- Lopez-Bustins, J.A.; Serrano, E.; Ayarzagüena, B.; Sanchez-Lorenzo, A. Spatial and temporal temperature trends in the lower stratosphere during the extended boreal winter from reanalysis. Int. J. Climatol. 2015, 35, 3888–3901. [Google Scholar] [CrossRef] [Green Version]
- Kaiser, H.F. An index of factorial simplicity. Psychometrika 1974, 39, 31–36. [Google Scholar] [CrossRef]
- North, G.R.; Bell, T.L.; Cahalan, R.F.; Moeng, R.F. Sampling errors in the estimation of empirical orthogonal functions. Mon. Weather Rev. 1982, 110, 699–706. [Google Scholar] [CrossRef]
- Henriques, A.G.; Santos, M.J.J. Regional drought distribution model. Phys. Chem. Earth Part B Hydrol. Ocean. Atmos. 1999, 24, 19–22. [Google Scholar] [CrossRef]
- Spinoni, J.; Naumann, G.; Vogt, J.V.; Barbosa, P. The biggest drought events in Europe from 1950 to 2012. J. Hydrol. Reg. Stud. 2015, 3, 509–524. [Google Scholar] [CrossRef]
- Wilhite, D.A.; Sivakumar, M.V.; Pulwarty, R. Managing drought risk in a changing climate: The role of national drought policy. Weather Clim. Extrem. 2014, 2, 4–13. [Google Scholar] [CrossRef] [Green Version]
- Krichak, S.O.; Breitgand, J.S.; Gualdi, S.; Feldstein, S.B. Teleconnection–extreme precipitation relationships over the Mediterranean region. Theor. Appl. Climatol. 2014, 117, 679–692. [Google Scholar] [CrossRef]
- Yao, J.; Tuoliewubieke, D.; Chen, J.; Huo, W.; Hu, W. Identification of Drought Events and Correlations with Large-Scale Ocean–Atmospheric Patterns of Variability: A Case Study in Xinjiang, China. Atmosphere 2019, 10, 94. [Google Scholar] [CrossRef] [Green Version]
- Ionita, M.; Boroneant, C.; Chelcea, S. Seasonal modes of dryness and wetness variability over Europe and their connections with large scale atmospheric circulation and global sea surface temperature. Clim. Dyn. 2015, 45, 2803–2829. [Google Scholar] [CrossRef] [Green Version]
- Cardil, A.; Rodrigues, M.; Ramirez, J.; de-Miguel, S.; Silva, C.A.; Mariani, M.; Ascoli, D. Coupled Effects of Climate Teleconnections on Drought, Santa Ana Winds and Wildfires in Southern California. Sci. Total Environ. 2020, 765, 142788. [Google Scholar] [CrossRef]
- Ionita, M.; Tallaksen, L.M.; Kingston, D.G.; Stagge, J.H.; Laaha, G.; Van Lanen, H.A.J.; Scholz, P.; Chelcea, S.M.; Haslinger, K. The European 2015 drought from a climatological perspective. Hydrol. Earth Syst. Sci. 2017, 21, 1397–1419. [Google Scholar] [CrossRef] [Green Version]
- Hurrell, J.W. Decadal trends in the North Atlantic Oscillation: Regional Temperatures and Precipitation. Science 1995, 269, 676–679. [Google Scholar] [CrossRef] [Green Version]
- Redolat, D.; Monjo, R.; Lopez-Bustins, J.A.; Martin-Vide, J. Upper-level Mediterranean oscillation index and seasonal variability of rainfall and temperature. Theor. Appl. Climatol. 2019, 135, 1059–1077. [Google Scholar] [CrossRef]
- Martín-Vide, J.; Lopez-Bustins, J.A. The Western Mediterranean Oscillation and rainfall in the Iberian Peninsula. Int. J. Climatol. 2006, 26, 1455–1475. [Google Scholar] [CrossRef]
- Barnston, A.G.; Livezey, R.E. Classification, seasonality and persistence of low-frequency atmospheric circulation patterns. Mon. Weather Rev. 1987, 115, 1083–1126. [Google Scholar] [CrossRef]
- Bueh, C.; Nakamura, H. Scandinavian pattern and its climatic impact. Q. J. R. Meteorol. Soc. 2007, 133, 2117–2131. [Google Scholar] [CrossRef]
- Hoell, A.; Barlow, M.; Saini, R. The leading pattern of intrapersonal and interannual Indian Ocean precipitation variability and its relationship with Asian circulation during the boreal cold season. J. Clim. 2012, 25, 7509–7526. [Google Scholar] [CrossRef]
- Barlow, M.; Zaitchik, B.; Paz, S.; Black, E.; Evans, J.; Hoell, A. A Review of Drought in the Middle East and Southwest Asia. J. Clim. 2016, 29, 8547–8574. [Google Scholar] [CrossRef]
- Garcia-Herrera, R.; Garrido-Perez, J.M.; Barriopedro, D.; Ordonez, C.; Vicente-Serrano, S.M.; Nieto, R.; Gimeno, L.; Sori, R.; Yiou, P. The European 2016/17 Drought. J. Clim. 2019, 32, 3169–3187. [Google Scholar] [CrossRef]
- García-Herrera, R.; Díaz, J.; Trigo, R.M.; Luterbacher, J.; Fischer, E.M. A Review of the European Summer Heat Wave of 2003. Crit. Rev. Environ. Sci. Technol. 2010, 40, 267–306. [Google Scholar] [CrossRef]
- Mitchell, D.; Kurnhuber, K.; Huntingford, C.; Uhe, P. The day the 2003 European heatwave record was broken. Lancet Planet. Health 2019, 3, e290–e292. [Google Scholar] [CrossRef] [Green Version]
- Touchan, R.; Anchukaitis, K.J.; Meko, D.M.; Sabir, M.; Attalah, S.; Aloui, A. Spatiotemporal drought variability in northwestern Africa over the last nine centuries. Clim. Dyn. 2011, 37, 237–252. [Google Scholar] [CrossRef]
- Touchan, R.; Anchukaitis, K.J.; Meko, D.M.; Attalah, S.; Baisan, C.; Aloui, A. Long term context for recent drought in northwestern Africa. Geophys. Res. Lett. 2008, 35, L13705. [Google Scholar] [CrossRef]
- Gleick, P.H. Water, Drought, Climate Change, and Conflict in Syria. Cover Weather Clim. Soc. 2014, 6, 331–340. [Google Scholar] [CrossRef]
- Mathbout, S.; Lopez-Bustins, J.A.; Martin-Vide, J.; Bech, J.; Rodrigoc, F.S. Spatial and temporal analysis of drought variability at several time scales in Syria during 1961–2012. Atmos. Res. 2018, 200, 153–168. [Google Scholar] [CrossRef]
- Lelieveld, J.; Hadjinicolaou, P.; Kostopoulou, E.; Chenoweth, J.; El Maayar, M.; Giannakopoulos, C.; Hannides, C.; Lange, M.A.; Tanarhte, M.; Tyrlis, E.; et al. Climate change and impacts in the Eastern Mediterranean and the Middle East. Clim. Chang. 2012, 114, 667–687. [Google Scholar] [CrossRef] [PubMed] [Green Version]
- Körner, C.; Sarris, D.; Christodoulakis, D. Long-term increase in climatic dryness in the East-Mediterranean as evidenced for the island of Samos. Reg. Environ. Chang. 2005, 5, 27–36. [Google Scholar] [CrossRef] [Green Version]
- Varol, T.; Ertuğrul, M. Climate change and forest fire trend in the Aegean and Mediterranean regions of Turkey. Fresenius Environ. Bull. 2016, 24, 3436–3444. [Google Scholar]
- Tabari, H.; Willems, P. More prolonged droughts by the end of the century in the Middle East. Environ. Res. Lett. 2018, 13, 104005. [Google Scholar] [CrossRef] [Green Version]
- Hanel, M.; Rakovec, O.; Markonis, Y.; Máca, P.; Samaniego, L.; Kyselý, J.; Kumar, R. Revisiting the recent European droughts from a long-term perspective. Sci. Rep. 2018, 8. [Google Scholar] [CrossRef]
- Zhong, L.; Hua, L.; Yan, Z. Datasets of meteorological drought events and risks for the developing countries in Eurasia. Big Earth Data 2020, 4, 191–223. [Google Scholar] [CrossRef] [Green Version]
- Inbar, M.; Bruins, H.J. Environmental Impact of Multi-Annual Drought in the Jordan Kinneret Watershed, Israel. Land Degrad. Dev. Geogr. Perspect. 2004, 15, 243–256. [Google Scholar] [CrossRef]
- Buttafuoco, G.; Caloiero, T. Drought events at different timescales in southern Italy (Calabria). J. Maps. 2014, 10, 529–537. [Google Scholar] [CrossRef]
- Polemio, M.; Casarano, D. Rainfall and drought in southern Italy (1821–2001). Basis Civiliz. Water Sci. 2004, 286, 217–227. [Google Scholar]
- Barriopedro, D.; Fischer, E.M.; Luterbacher, J.; Trigo, R.M.; Garcia-Herrera, R. The hot summer of 2010: Redrawing the temperature record map of Europe. Science 2011, 332, 220–224. [Google Scholar] [CrossRef] [PubMed] [Green Version]
- Djebbar, A.; Goosse, H.; Klein, K. Robustness of the link between precipitation in North Africa and standard Modes of atmospheric variability during the last millennium. Climate 2020, 8, 62. [Google Scholar] [CrossRef]
- Pal, J.S.; Giorgi, F.; Bi, X. Consistency of recent European summer precipitation trends and extremes with future regional climate projections. Geophys. Res. Lett. 2004, 31, L13202. [Google Scholar] [CrossRef]
- Peters, W.; Bastos, A.; Ciais, P.; Vermeulen, A. A historical, geographical and ecological perspective on the 2018 European summer drought. Philos. Trans. R. Soc. 2020, B 375, 20190505. [Google Scholar] [CrossRef]
- FAO. Drought Characterization and Management in Central Asia Region and Turkey; FAO Water Reports no. 44; FAO, FAO Sub-Regional Office for Central Asia: Ankara, Turkey, 2017; Available online: http://www.fao.org/resilience/resources/resources-detail/en/c/1113629/ (accessed on 20 June 2018).
- Ouassou, A.; Ameziane, T.; Ziyad, A.; Belghiti, M. Application of the Drought Management Guidelines in Morocco. In MEDROPLAN Mediterranean Drought Preparedness and Mitigation Planning; Morocco, 2005; Chapter 19. Available online: https://projects.iamz.ciheam.org/medroplan/guidelines/archivos/Guidelines_Chapter19.pdf (accessed on 21 June 2021).
- Payab, A.H.; Türker, U. Analyzing temporal–spatial characteristics of drought events in the northern part of Cyprus. Environ. Dev. Sustain. 2018, 20, 1553–1574. [Google Scholar] [CrossRef]
- Khan, N.; Hadipou, R.S.; Shahid, S.; Ismail, T.; Ahmed, K.; Chung, E.S.; Nawaz, N.; Wang, X. Spatial distribution of secular trends in rainfall indices of peninsular Malaysia in the presence of long-term persistence. Meteorol. Appl. 2019, 26, 655–670. [Google Scholar] [CrossRef]
- Selby, J.; Dahi, O.S.; Fröhlich, C.; Hulme, M. Climate change and the Syrian civil war revisited. Polit Geogr. 2017, 60, 232–244. [Google Scholar] [CrossRef]
- Kelley, C.P.; Mohtadi, S.; Cane, M.A.; Seager, R.; Kushnir, Y. Climate change in the Fertile Crescent and implications of the recent Syrian drought. Proc. Natl. Acad. Sci. USA 2015, 112, e3241–e3246. [Google Scholar] [CrossRef] [PubMed] [Green Version]
- Rateb, A.; Scanlon, A.R.; Kuo, C.Y. Multi-decadal assessment of water budget and hydrological extremes in the Tigris-Euphrates Basin using satellites, modeling, and in-situ data. Sci. Total Environ. 2021, 766, 144337. [Google Scholar] [CrossRef] [PubMed]
- Gumus, V.; Algin, H.M. Meteorological and hydrological drought analysis of the Seyhan-Ceyhan River Basins, Turkey. Meteorol. Appl. 2017, 24, 62–73. [Google Scholar] [CrossRef]
- Spinoni, J.; Antofie, T.; Barbosa, P.; Bihari, Z.; Lakatos, M.; Szalai, S.; Szentimrey, T.; Vogt, J. An overview of drought events in the Carpathian region in 1961–2010. Adv. Sci. 2013, 10, 21–32. [Google Scholar] [CrossRef] [Green Version]
- Sepulcre-Canto, G.; Vogt, J.V.; Arboleda, A.; Antofie, T. Assessment of the EUMETSAT LSA-SAF evapotranspiration productfor drought monitoring in Europe. Int. J. Appl. Earth Obs. Geoinf. 2014, 30, 190–202. [Google Scholar] [CrossRef]
- Mihajlović, D. Monitoring the 2003–2004 meteorological droughts over Pannonian part of Croatia. Int. J. Climatol. 2006, 26, 2213–2225. [Google Scholar] [CrossRef]
- Falloon, P.; Betts, R. Climate impacts on European agriculture and water management in the context of adaptation and mitigation--the importance of an integrated approach. Sci. Total Environ. 2010, 408, 5667–5687. [Google Scholar] [CrossRef] [PubMed]
- Tselepidaki, I.; Zarifis, B.; Asimakopoulos, D.N. Low precipitation over Greece during 1989–1990. Theor. Appl. Climatol. 1992, 46, 115–121. [Google Scholar] [CrossRef]
- Page, M.; Zribi, M. Analysis and Predictability of Drought In Northwest Africa Using Optical and Microwave Satellite Remote Sensing Products. Sci. Rep. 2019, 9. [Google Scholar] [CrossRef] [Green Version]
- Le Meddi, H.; Meddi, M.; Assani, A.A. Study of Drought in Seven Algerian Plains. Arab. J. Sci. Eng. 2014, 39, 339–359. [Google Scholar] [CrossRef]
- Vernar, D.; Tréguer, D.; Redwood, J.; Christensen, J.; Mcdonell, R.; Elbert, C. Climate Variability, Drought, and Drought Management in Morocco’s Agricultural Sector; The World Bank: Morocco, 2018. [Google Scholar]
- Rita, A.; Camarero, J.J.; Nole, A.; Borghetti, M.; Brunetti, M.; Pergola, N.; Serio, C.; Vicente-Serrano, S.M.; Tramutoli, V.; Ripullone, F. The impact of drought spells on forests depends on site conditions: The case of 2017 summer heat wave in southern Europe. Glob. Chang. Biol. 2020, 26, 851–863. [Google Scholar] [CrossRef]
- Buras, A.; Rammig, A.; Zang, C.S. Quantifying impacts of the 2018 drought on European ecosystems in comparison to 2003. Biogeosciences 2020, 17, 1655–1672. [Google Scholar] [CrossRef] [Green Version]
- Fragaszy, S.R.; Jedd, T.; Wall, N.; Knutson, C.; Fraj, M.B.; Bergaoui, K.; Svoboda, M.; Hayes, M.; McDonnell, R. Drought Monitoring in the Middle East and North Africa (MENA) Region: Participatory Engagement to Inform Early Warning Systems. Cover Bull. Am. Meteorol. Soc. 2020, 101, E1148–E1173. [Google Scholar] [CrossRef] [Green Version]
- Dimitrakopoulos, A.P.; Vlahou, M.; Anagnostopoulou, C.G.; Mitsopoulos, I.D. Impact of drought on wildland fires in Greece: Implications of climatic change? Clim. Chang. 2011, 109, 331–347. [Google Scholar] [CrossRef]
- Quintana Seguí, P.; Martin, E.; Sanchez, E.; Zribi, M.; Vennetier, M.; Vicente-Serrano, S.M.; Vidal, J.P. Drought: Observed trends, future projections. In The Mediterranean under Climate Change; Thiebault, S., Moatti, J.P., Eds.; IRD Editions: Marseille, France, 2016; pp. 123–131. Available online: https://hal.archives-ouvertes.fr/hal-01401386 (accessed on 21 July 2021).
- Nicholson, S.E.; Funk, C.; Fink, A.H. Rainfall over the African continent from the 19th through the 21st century. Glob. Planet. Chang. 2018, 165, 114–127. [Google Scholar] [CrossRef]
- Schilling, J.; Freier, K.P.; Hertig, E.; Scheffran, J. Climate change, vulnerability and adaptation in North Africa with focus on Morocco. Agric. Ecosyst. Environ. 2012, 156, 12–26. [Google Scholar] [CrossRef]
- IPCC. Climate change 2014: Synthesis report. In Contribution of Working Groups I, II and III to the Fifth Assessment Report of the Intergovernmental Panel on Climate Change; Core Writing Team, Pachauri, R.K., Meyer, L.A., Eds.; IPCC: Geneva, Switzerland, 2014; 151p. [Google Scholar]
- Seim, A.; Treydte, K.; Trouet, V.; Frank, D.; Fonti, P.; Tegel, W.; Panayotov, M.; Fernández-Donado, L.; Krusic, P.; Büntgen, U. Climate sensitivity of Mediterranean pine growth reveals distinct east-west dipole. Int. J. Climatol. 2015, 35, 2503–2513. [Google Scholar] [CrossRef]
- Homdee, T.; Pongput, K.; Kanae, S. A comparative performance analysis of three standardized climatic drought indices in the Chi River basin, Thailand. Agric. Nat. Resour. 2016, 3, 211–219. [Google Scholar] [CrossRef] [Green Version]
- Pathak, A.A.; Dodamani, B.M. Trend analysis of rainfall, rainy days and drought: A case study of Ghataprabha River Basin, India. Modeling Earth Syst. Environ. 2020, 6, 1357–1372. [Google Scholar] [CrossRef]
- Pei, Z.; Fang, S.; Wang, L.; Yang, W. Comparative Analysis of Drought Indicated by the SPI and SPEI at Various Timescales in Inner Mongolia, China. Water 2020, 12, 1925. [Google Scholar] [CrossRef]
- Krichak, S.O.; Alpert, P. Decadal trends in the East Atlantic West Russia pattern and the Mediterranean precipitation. Int. J. Climatol. 2005, 25, 183–193. [Google Scholar] [CrossRef]
- Yosef, Y.; Sarroni, H.; Alpert, P. Trends in daily rainfall intensity over Israel 1950/1–2003/4. Open Atmos. Sci. J. 2009, 3, 196–203. [Google Scholar] [CrossRef] [Green Version]
- Hannaford, J.; Lloyd-Hughes, B.; Keef, C.; Parry, S.; Prudhomme, C. Examining the large-scale spatial coherence of European drought using regional indicators of precipitation and streamflow deficit. Hydrol. Process 2011, 25, 1146–1162. [Google Scholar] [CrossRef]


| Start event, month (ST) | The first month with an index value below a certain threshold |
| End event, month (EN) | The last month with an index value below a certain threshold |
| Drought duration (DD) | Number of consecutive months between drought start and drought end (length of drought event) |
| Drought severity (DRS) | Sum of the absolute values of drought indices during a drought event |
| Drought intensity (DRI) | The mean value of drought indices during a drought event (DRS/DD) |
| Drought frequency (DRF) | Number of drought events during specific interval, usually expressed as number of events every decade. |
| Areal Extent (AE) | Percentage of the region with indicator values below a certain threshold |
| Peak Area (PA) | The largest area exposed to drought during the event (%). Usually the PA is presented with its corresponding date in month and year (AMY) |
| Peak month and year (PM) | The month with the lowest value of the index over the drought event. This parameter is usually presented with severity value of this month. |
| Grade | DP Status |
|---|---|
| 6 | DP > 95th percentile over the recorded events at the subregional and regional scale |
| 5 | 90th percentile < DP ≤ 95th percentile over the recorded events at the subregional and regional scale |
| 4 | 70th percentile < DP ≤ 90th percentile over the recorded events at the subregional and regional scale |
| 3 | 50th percentile < DP ≤ 70th percentile over the recorded events at the subregional and regional scale |
| 2 | 30th percentile < DP ≤ 50th percentile over the recorded events at the subregional and regional scale |
| 1 | DP < 30th percentile over the recorded events at the subregional and regional scale |
| PCs | Code | Regions | Country |
|---|---|---|---|
| PC1 | IBE–NWA | Iberian Peninsula–Northwest Africa | Spain–Portugal–South France–Morocco–Gibraltar |
| PC2 | EMME | Eastern and Middle East | Syria–Lebanon–Israel–Palestine–Jordan–Cyprus–North Egypt–North Libya–South and South-East Turkey |
| PC3 | AEG | Aegean Sea | Greece and West Turkey |
| PC4 | BLK–FR | Balkans–France | France–Croatia–Slovenia–Central and North Italy |
| PC5 | NA | North Africa and south Italy | Algeria–Tunisia–Malta–Tyrrhenian Sea |
| Region | Period | DRS | DRI | Peak Event | Area Involved with PM % | DDI | AE % | Widest Area | ||
|---|---|---|---|---|---|---|---|---|---|---|
| PM (Mon/Year) | DRS | PA% | Mon/Year | |||||||
| IBE–NWA | 1981–1983 | 20.1 | 1.4 | 11/1981 | 2.4 | 57.3 | 3.6 | 21.1 | 57.1 | 11/1981 |
| 1989–1992 | 20.3 | 1.4 | 04/1992 | 2.8 | 50.0 | 4.8 | 20.3 | 50.0 | 04/1992 | |
| 1994–1995 | 28.7 | 2.2 | 12/1995 | 3.1 | 52.1 | 11.3 | 36.2 | 78.1 | 10/1995 | |
| 1999–2000 | 27.5 | 2.3 | 06/1999 | 3.2 | 50.1 | 7.1 | 51.0 | 58.4 | 05/1999 | |
| 2004–2005 | 25.4 | 2.1 | 01/2005 | 3.3 | 30.1 | 11.9 | 52.7 | 74.2 | 08/2005 | |
| 2012 | 17.6 | 1.5 | 03/2012 | 2.8 | 57.0 | 8.5 | 46.6 | 70.0 | 07/2012 | |
| 2014–2016 | 20.2 | 1.7 | 04/2014 | 2.8 | 33.8 | 4.6 | 32.0 | 58.4 | 01/1016 | |
| 2017–2018 | 35.3 | 2.0 | 11/2017 | 3.7 | 41.0 | 6.2 | 33.5 | 74.3 | 12/2017 | |
| 2019 | 17.0 | 1.5 | 07/2019 | 2.9 | 45.5 | 5.9 | 45.0 | 57.1 | 11/2019 | |
| EMME | 1999–2001 | 30.5 | 2.5 | 07/1999 | 2.8 | 70.0 | 14.3 | 51.0 | 80.3 | 12/1999 |
| 2007–2012 | 40.6 | 2.2 | 05/2008 | 3.3 | 61.3 | 9.8 | 33.2 | 80.0 | 01/2009 | |
| 2014–2018 | 53.6 | 2.2 | 01/2017 | 3.3 | 60.0 | 10.5 | 35.1 | 67.9 | 12/2017 | |
| AGE | 1977 | 14.4 | 1.3 | 08/1977 | 2.3 | 22.4 | 2.9 | 50.0 | 51.0 | 11/1977 |
| 1989–1991 | 31.9 | 2.3 | 01/1990 | 3.3 | 59.2 | 11.3 | 52.4 | 77.6 | 11/1990 | |
| 1992–1993 | 33.0 | 1.5 | 08/1992 | 2.5 | 36.7 | 6.3 | 30.0 | 51.0 | 12/1992 | |
| 1999–2001 | 37.0 | 2.1 | 10/2001 | 2.9 | 65.3 | 9.0 | 50.0 | 65.3 | 03/2001 | |
| 2006–2009 | 44.0 | 2.1 | 06/2008 | 3.2 | 42.9 | 13.0 | 51.0 | 78.0 | 10/2007 | |
| 2013–2014 | 40.1 | 1.7 | 02/2014 | 3.3 | 50.0 | 4.1 | 20.0 | 51.0 | 02/2014 | |
| 2015–2018 | 43.1 | 1.7 | 09/2017 | 3.8 | 30.0 | 6.8 | 35.0 | 55.0 | 10/2016 | |
| BLK–FR | 1989–1991 | 39.2 | 1.8 | 10/1989 | 3.3 | 52.2 | 9.4 | 48.6 | 66.7 | 09/1990 |
| 2001–2002 | 35.4 | 1.5 | 12/2001 | 2.8 | 30.0 | 7.9 | 50.0 | 71.6 | 04/2002 | |
| 2003 | 15.0 | 1.4 | 11/2003 | 2.4 | 46.3 | 3.9 | 31.0 | 50.0 | 12/2003 | |
| Winter (2003–2004) | 5.7 | 1.6 | 01/2004 | 2.5 | 49.3 | 4.0 | 43.8 | 50.7 | 02/2004 | |
| 2006–2008 | 45.4 | 1.6 | 12/2006 | 2.9 | 38.8 | 7.2 | 26.0 | 53.7 | 10/2007 | |
| 2011–2012 | 33.3 | 2.4 | 11/2011 | 3.1 | 39.3 | 8.4 | 38.6 | 71.5 | 03/2012 | |
| 2016–2018 | 40.6 | 1.5 | 10/2017 | 3.2 | 62.7 | 9.2 | 37.8 | 65.7 | 11/2017 | |
| 2019 | 20.0 | 1.5 | 06/2019 | 2.7 | 37.3 | 4.9 | 30.0 | 50.1 | 03/2019 | |
| NA | 1980–1982 | 50.1 | 2.1 | 08/1981 | 2.9 | 35.9 | 4.9 | 30.0 | 50.2 | 12/1981 |
| 1988 | 15.0 | 1.4 | 05/1988 | 2.1 | 53.8 | 5.8 | 37.8 | 53.8 | 05/1988 | |
| 1999–2002 | 51.2 | 2.2 | 10/1999 | 3.4 | 64.1 | 8.5 | 36.0 | 64.1 | 02/2002 | |
| 2004–2005 | 44.0 | 2.1 | 12/2004 | 3.8 | 43.6 | 4.9 | 28.7 | 50.0 | 12/2004 | |
| 2016 | 17.1 | 1.4 | 01/2016 | 2.2 | 30.8 | 2.8 | 38.0 | 51.3 | 11/2016 | |
| 2017–2018 | 26.0 | 1.5 | 01/2018 | 3.9 | 61.5 | 6.6 | 30.3 | 61.5 | 01/2018 | |
| Subregion | Most Severe | Most Intense | Longest Event | Widest Area | Highest Degree of Dryness | |||||
|---|---|---|---|---|---|---|---|---|---|---|
| Period | DRS | Period | DRI | Period | DD | AE% | Period | DDI | Year | |
| IBE–NWA | 1989–1990 | 57.5 | 1999 | 2.7 | 1989–1990 | 41 | 71.3 | 2017–2018 | 11.9 | 2005 |
| EMME | 2008–2012 | 95.4 | 2005–2007 | 2.8 | 2008–2012 | 47 | 75.6 | 2008–2009 | 14.3 | 1999 |
| AEG | 2015–2018 | 77.2 | 2016–2018 | 2.7 | 2015–2018 | 36 | 67.0 | 2007 | 13.0 | 2007 |
| BLK–FR | 2015–2018 | 72.7 | 2004–2006 | 2.7 | 2015–2018 | 37 | 67.2 | 2002 | 10.4 | 1990 |
| NA | 1999–2004 | 84.6 | 2006–2007 | 2.7 | 1999–2004 | 51 | 62.8 | 2002 | 8.5 | 1999 |
| Country | ST | EN | DRS | DRI | AE % | Widest Area | Grade | Mentioned by | |
|---|---|---|---|---|---|---|---|---|---|
| PA% | AMY | ||||||||
| Spain | 06/1994 | 12/1995 | 30.2 | 2.1 | 50.1 | 83.3 | 10/1995 | 15 | [118] |
| 12/2004 | 05/2006 | 28.7 | 2.7 | 50.0 | 78.3 | 08/2005 | 15 | [62] | |
| 04/2017 | 08/2018 | 35.3 | 1.9 | 34.1 | 71.7 | 01/2018 | 14 | [102,119] | |
| Portugal | 12/2004 | 01/2006 | 23.7 | 2.0 | 93.0 | 100.0 | 09/2005 | 18 | [107] |
| Morocco | 10/2004 | 12/2005 | 30.3 | 2.3 | 69.9 | 83.3 | 10/2005 | 16 | [120] |
| 01/1995 | 11/1995 | 28.2 | 2.3 | 48.5 | 50.0 | 10/1995 | 14 | [105,121] | |
| 12/1998 | 11/2000 | 25.4 | 2.0 | 55.0 | 83.3 | 09/1999 | 15 | [121] | |
| Cyprus | 02/2008 | 01/2009 | 33.3 | 2.2 | 57.1 | 85.7 | 08/2008 | 15 | [122] |
| 12/2013 | 12/2014 | 20.2 | 1.7 | 83.5 | 100.0 | 12/2013 | 15 | [123] | |
| 01/2017 | 11/2018 | 22.4 | 1.9 | 57.1 | 85.7 | 11/2018 | 14 | [124] | |
| Israel | 11/1998 | 12/1999 | 29.7 | 2.2 | 95.1 | 100.0 | 3–12/1999 | 18 | [100] |
| Jordan | 01/1999 | 12/1999 | 22.2 | 1.9 | 88.9 | 100.0 | 11/1999 | 14 | [99] |
| Syria | 10/2007 | 10/2011 | 45.0 | 1.9 | 70.0 | 87.5 | 02/2009 | 16 | [38,125] |
| 11/1998 | 11/2000 | 25.6 | 2.1 | 70.0 | 91.7 | 12/1999 | 14 | [99,100] | |
| 01/2014 | 03/2015 | 37.0 | 2.3 | 31.7 | 45.8 | 04/2014 | 14 | [120] | |
| Turkey | 01/2007 | 01/2009 | 43.3 | 2.0 | 57.7 | 91.3 | 01/2008 | 15 | [126] |
| 02/2016 | 01/2018 | 40.8 | 2.0 | 36.5 | 65.2 | 10/2016 | 14 | [126] | |
| 04/1989 | 04/1990 | 34.9 | 1.9 | 39.4 | 67.4 | 12/1989 | 14 | [127] | |
| 05/1999 | 11/2001 | 37.0 | 2.1 | 42.6 | 69.6 | 10/2001 | 14 | [126,127] | |
| Greece | 02/1989 | 01/1991 | 42.0 | 2.8 | 51.1 | 77.3 | 11/1990 | 15 | [28] |
| 09/1999 | 06/2002 | 41.1 | 1.8 | 39.4 | 68.2 | 07/2000 | 14 | [128] | |
| 12/2006 | 01/2009 | 37.1 | 1.8 | 34.3 | 59.1 | 09/2007 | 14 | [28] | |
| Croatia | 09/2011 | 10/2012 | 23.0 | 1.9 | 71.4 | 84.6 | 12/2011 | 16 | [129] |
| 01/1989 | 11/1990 | 37.1 | 1.6 | 70.0 | 97.0 | 09/1990 | 15 | [111] | |
| 08/2003 | 04/2004 | 15.6 | 1.8 | 74.0 | 100.0 | 12/2003 | 14 | [130] | |
| France | 09/2001 | 09/2002 | 23.1 | 1.8 | 40.0 | 65.0 | 04/2002 | 14 | [111] |
| 03/1989 | 11/1990 | 37.0 | 2.0 | 42.8 | 86.5 | 10/1989 | 14 | [131] | |
| 12/2015 | 04/2018 | 48.1 | 1.8 | 41.3 | 89.2 | 11/2017 | 15 | [101] | |
| Italy | 07/1988 | 12/1991 | 44.7 | 1.5 | 20.0 | 40.0 | 03/1989 | 14 | [132] |
| 10/2001 | 09/2002 | 20.0 | 1.7 | 48.4 | 70.3 | 04/2002 | 14 | [115] | |
| 11/2015 | 11/2016 | 25.6 | 1.9 | 35.3 | 48.6 | 01/2016 | 14 | [101] | |
| 02/2017 | 05/2018 | 25.0 | 1.8 | 43.8 | 65.0 | 01/2018 | 14 | [101] | |
| Algeria | 04/2017 | 03/2018 | 23.5 | 1.9 | 50.4 | 66.7 | 08/2017 | 15 | [133] |
| 08/1999 | 11/2002 | 67.0 | 1.8 | 37.5 | 89.9 | 02/2002 | 14 | [134] | |
| Tunisia | 04/1999 | 07/2000 | 28.7 | 1.7 | 58.2 | 92.3 | 10/1999 | 15 | [105,114] |
| 02/1979 | 03/1982 | 50.1 | 1.7 | 42.7 | 69.2 | 08/1981 | 14 | [120] | |
| R | ST | EN | DRS | DRI | AE % | PA % | AMY | Score | Mentioned by |
|---|---|---|---|---|---|---|---|---|---|
| IBE–NWA | 09/1994 | 12/1995 | 28.7 | 2.2 | 36.2 | 78.1 | 10/1995 | 14 | [87] |
| 01/1999 | 03/2000 | 27.5 | 2.3 | 45.0 | 58.4 | 05/1999 | 15 | [87,100] | |
| 11/2004 | 12/2005 | 25.4 | 2..1 | 52.7 | 74.2 | 08/2005 | 15 | [101,111] | |
| 01/2012 | 12/2012 | 20.2 | 1.5 | 46.4 | 68.9 | 07/2012 | 13 | [111] | |
| 03/2014 | 11/2016 | 30.6 | 1.6 | 25.8 | 58.4 | 01/2016 | 13 | [135] | |
| 04/2017 | 09/2018 | 35.3 | 2.0 | 33.5 | 74.1 | 12/2017 | 14 | [136,137] | |
| EMME | 11/1998 | 02/2001 | 30.5 | 2.3 | 51.0 | 80.0 | 12/1999 | 15 | [100,138] |
| 01/2007 | 12/2012 | 40.6 | 2.2 | 33.2 | 80.0 | 01/2009 | 14 | [38,126] | |
| 12/2014 | 01/2019 | 53.6 | 2.1 | 35.1 | 67.9 | 12/2017 | 14 | [120] | |
| AEG | 11/1989 | 01/1991 | 31.9 | 2.3 | 52.4 | 77.6 | 11/1990 | 16 | [28,57] |
| 11/1999 | 04/2001 | 37.0 | 2.1 | 41.7 | 65.3 | 03/2001 | 15 | [87] | |
| 12/2006 | 01/2009 | 44.0 | 2.1 | 51.0 | 78.0 | 10/2007 | 16 | [87,139] | |
| 12/2015 | 01/2018 | 43.1 | 1.7 | 35.0 | 55.0 | 10/2016 | 14 | [126,136] | |
| BLK–FR | 12/1988 | 10/1991 | 39.2 | 1.8 | 48.6 | 65.7 | 09/1990 | 14 | [28] |
| 12/2001 | 09/2002 | 41.1 | 2.6 | 50.0 | 71.6 | 04/2002 | 15 | [28,140] | |
| 07/2003 | 05/2004 | 11.7 | 1.9 | 37.0 | 50.7 | 02/2004 | 13 | [137] | |
| 01/2005 | 12/2005 | 20.1 | 1.9 | 30.0 | 38.8 | 08/2005 | 13 | [140] | |
| 05/2006 | 10/2008 | 42.7 | 1.5 | 30.1 | 53.7 | 04/2007 | 13 | [87] | |
| 07/2011 | 10/2012 | 33.3 | 2.5 | 38.6 | 71.6 | 03/2012 | 15 | [129] | |
| 11/2015 | 04/2018 | 38.1 | 1.5 | 37.8 | 65.7 | 11/2017 | 14 | [101,135] | |
| NA | 02/1980 | 03/1982 | 50.1 | 2.1 | 27.7 | 50.2 | 12/1981 | 14 | [135,141] |
| 01/1999 | 12/2002 | 22.3 | 1.5 | 36.0 | 64.1 | 02/2002 | 14 | [45] | |
| 02/2004 | 10/2005 | 442 | 2.1 | 28.7 | 50.0 | 12/2004 | 14 | [120,142] | |
| 01/2012 | 07/2018 | 27.6 | 1.9 | 23.6 | 61.5 | 01/2018 | 13 | [133] |
| Subregion | Average Number of Events (N) | DD | DRS | DRI | AE (%) | DDI (%) | ||||||
|---|---|---|---|---|---|---|---|---|---|---|---|---|
| 1975 1996 | 1997 2019 | 1975 1996 | 1997 2019 | 1975 1996 | 1997 2019 | 1975 1996 | 1997 2019 | 1975 1996 | 1997 2019 | 1975 1996 | 1997 2019 | |
| IBE–NWA | 5 | 14 | 6.1 | 6.5 | 9.1 | 9.8 | 1.3 | 1.4 | 12.4 | 18.6 | 2.5 | 3.6 |
| EMME | 9 | 11 | 4.4 | 10.4 | 6.0 | 16.8 | 1.1 | 1.5 | 5.5 | 23.8 | 1.1 | 4.4 |
| AEG | 5 | 8 | 6.8 | 8.3 | 10.1 | 13.1 | 1.4 | 1.4 | 12.1 | 18.2 | 2.3 | 3.5 |
| BLK–FR | 5 | 8 | 6.2 | 7.3 | 9.5 | 11.1 | 1.3 | 1.4 | 10.5 | 20.2 | 2.2 | 3.7 |
| NA | 6 | 9 | 6.3 | 8.0 | 8.9 | 12.6 | 1.3 | 1.4 | 10.1 | 18.3 | 1.9 | 3.6 |
| Subregion | NAO | ULMO | WeMO | EATL/WRUS | SCAND | |||||||||||||||
|---|---|---|---|---|---|---|---|---|---|---|---|---|---|---|---|---|---|---|---|---|
| SPI-12 | SPEI-12 | RDI-12 | DXI-12 | SPI-12 | SPEI-12 | RDI-12 | DXI-12 | SPI-12 | SPEI-12 | RDI-12 | DXI-12 | SPI-12 | SPEI-12 | RDI-12 | DXI-12 | SPI-12 | SPEI-12 | RDI-12 | DXI-12 | |
| IBE–NWA | −0.5 | −0.3 | −0.5 | |||||||||||||||||
| EMME | −0.3 | −0.4 | −0.4 | −0.5 | −0.3 | −0.5 | −0.4 | −0.5 | ||||||||||||
| AEG | −0.3 | −0.3 | −0.4 | |||||||||||||||||
| BLK–FR | 0.3 | 0.3 | 0.3 | 0.4 | −0.5 | −0.5 | −0.4 | −0.5 | −0.3 | −0.4 | −0.3 | −0.4 | ||||||||
| NA | 0.3 | 0.3 | −0.3 | −0.4 | −0.5 | |||||||||||||||
Publisher’s Note: MDPI stays neutral with regard to jurisdictional claims in published maps and institutional affiliations. |
© 2021 by the authors. Licensee MDPI, Basel, Switzerland. This article is an open access article distributed under the terms and conditions of the Creative Commons Attribution (CC BY) license (https://creativecommons.org/licenses/by/4.0/).
Share and Cite
Mathbout, S.; Lopez-Bustins, J.A.; Royé, D.; Martin-Vide, J. Mediterranean-Scale Drought: Regional Datasets for Exceptional Meteorological Drought Events during 1975–2019. Atmosphere 2021, 12, 941. https://0-doi-org.brum.beds.ac.uk/10.3390/atmos12080941
Mathbout S, Lopez-Bustins JA, Royé D, Martin-Vide J. Mediterranean-Scale Drought: Regional Datasets for Exceptional Meteorological Drought Events during 1975–2019. Atmosphere. 2021; 12(8):941. https://0-doi-org.brum.beds.ac.uk/10.3390/atmos12080941
Chicago/Turabian StyleMathbout, Shifa, Joan Albert Lopez-Bustins, Dominic Royé, and Javier Martin-Vide. 2021. "Mediterranean-Scale Drought: Regional Datasets for Exceptional Meteorological Drought Events during 1975–2019" Atmosphere 12, no. 8: 941. https://0-doi-org.brum.beds.ac.uk/10.3390/atmos12080941