
Characteristics of Dust Events in China from 2015 to 2020
by
 ,
,
Lili Yang
1,2 ,
,
Shuwen Zhang
1,*, 
Zhongwei Huang
1,
Yanping Yang
1,2,
Lina Wang
2,
Wenyu Han
3 and
Xiaoyun Li
4 1
Key Laboratory for Semi-Arid Climate Change of the Ministry of Education, College of Atmospheric Sciences, Lanzhou University, Lanzhou 730000, China
2
Forecast Department, Gansu Province Environmental Monitoring Center, Lanzhou 730020, China
3
Forecast Department, Lanzhou Ecological Environment Monitoring Center, Lanzhou 730000, China
4
Marketing Center, Wuxi CAS Photonics Co., Ltd., Wuxi 214135, China
*
Author to whom correspondence should be addressed.
Atmosphere 2021, 12(8), 952; https://0-doi-org.brum.beds.ac.uk/10.3390/atmos12080952
Submission received: 16 June 2021
/
Revised: 8 July 2021
/
Accepted: 17 July 2021
/
Published: 24 July 2021
(This article belongs to the Special Issue Dust Detection and Long-Term Transport in High Spatiotemporal Resolution)
Abstract
:As the main source of dust in Asia, China often suffers from dust events. The temporal and spatial characteristics of dust events change with the variations of geography, climate and human activities. Based on the criteria of selecting dust events proposed recently by the China Environmental Monitoring Station, the hourly concentration of PM10 and PM2.5 of 336 cities in China from 2015 to 2020 were used to study the temporal and spatial characteristics of dust events more accurately and objectively. The results showed that all of the dust events in China clearly decreased, but the strong dust events did not decrease. There were 334 cities that had dust events except Shenzhen and Dongguan, 299 cities were seriously polluted due to dust events, 134 cities encountered dust level III and 56 cities encountered dust level IV. The high frequencies of dust events were mainly distributed in Northern China, especially in Northwest China. The dust contribution of PM10 to the cities in Northwest China was more than 10% and about 5–10% for PM2.5. The most likely month for dust was May. The starting time of dust was bimodally distributed, and the most common starting time was 10:00–11:00 BJT, followed by 22:00–23:00 BJT. According to the PSCF (Potential Source Contribution Function) results, the dust potential source contribution of different cities mainly came from the northwest, and was mainly affected by Mongolia in addition to the local dust in China. In addition, Beijing was obviously affected by dust recirculation. This study is of great significance to the improvement of the forecast of dust weather and the warning of heavy pollution caused by dust events.
1. Introduction
Due to the existence of Taklimakan Desert, Gobi Desert, Badain Jaran Desert, Tengger Desert and other deserts, dust events often affect China. The dust emission capacity of Taklimakan Desert is the highest in East Asia, and the emission in spring is about 70.54 Tg/yr, accounting for 42% of the total dust emission in East Asia [1]. Dust events are a common natural phenomenon caused by special geographical and climatic conditions; its occurrence and development accelerate land desertification [2,3]. A dust event not only has a direct impact on human activity and life but also affects human health. Aragnou et al., 2021 [4] estimated the dust storm event across the state of New South Wales in February 2019 caused four premature deaths, 161 respiratory disease hospitalizations and seven cardiovascular disease hospitalizations. Ardon-Dryer et al., 2019 [5] investigated the impact that particles from dust storms have on human lung epithelial cells and found that intermediate dust concentrations lead to a larger fraction of dying cells compared to lower and higher concentrations. In addition, dust events have a sustained and long-term indirect impact on the ecological environment and climate. Using a series of climate model results, Kok et al., 2018 [6] found that direct dust–climate feedback accounts for a substantial fraction of the total aerosol feedbacks in the climate system. Huang et al., 2015 [7] found that East Asian dust aerosols influence the cloud properties through two aspects, one is as cloud condensation nuclei, the other is by changing the relative humidity and stability of the atmosphere. The impact of a dust event on air quality should not neglected. Aili et al., 2021 [8] found that all pollutants, such as total suspended particulates (TSP), SO2 and NO2, were increased on strong dust storm days, as compared to normal days. A dust event contributes greatly to particle concentration in Hohhot, Inner Mongolia, especially in spring [9]. Filonchyk et al., 2018 [10] found strong territory pollution with aerosols during sandstorms by studying a severe dust storm that occurred in Northwest China during April 2014. Therefore, the study of dust events is of great significance to the management of the ecological environment and sustainable development.
There are many studies on dust events, but most are based on case analysis [11,12,13,14]. Some scholars have studied dust events based on years of data, such as the WRF-Chem that was used to simulate the total dust emissions from the deserts of North Africa, Middle East and East Asia [15]. Based on different paleoclimate archives, the relationship between dust storm events and climate change in Northern China in the past 1000 years were analyzed [16]. The major dust trajectories within seven major deserts worldwide were identified based on satellite images from 2000 to 2010 [17]. The temporal characterization of dust activity in the Central Patagonia Desert from 1964 to 2017 was studied based on surface synoptic observations and satellite aerosol detection [18]. A new empirical equation relating horizontal visibility and PM10 concentrations was proposed to reproduce the characteristics of seasonal dust over North Africa [19]. Yang et al., 2013 [20] investigated the characteristic distributions of regional dust events over Northeast Asia from 1980 to 2011 by using different meteorological data. However, when compared with the measured results, these studies have some weaknesses due to the data. For example, model simulation results always have a certain error, and clouds easily affect the satellite remote sensing data. There is uncertainty and a lack of rationality when using meteorological data such as visibility to study the dust events, owing to the haze that causes heavy pollution and very low visibility. Therefore, in order to identify the dust events more accurately, it is necessary to eliminate the influence of haze.
The occurrences of dust events are not only related to the special geographical climate, but also closely related to human activities. Based on the study of the characteristics of dust storm in the Ebinur Lake of Xinjiang [21], it was found that agricultural acreage exhibited the strongest influence on dust storms. Wan et al., 2016 [22] found that the significant high dust flux during 1950s–2011 was caused by increasing human activities in Northwest China. The study found that since at least 2000 years ago, the impact of human activities may have exceeded the impact of natural climate changes on dust storms in Eastern China [23]. With the improvement of people’s awareness on ecological environment protection and the proposal of some environmental protection policies in recent years, the ambient air quality has been improved significantly. Therefore, it is imperative to update the research on the characteristics of dust events in China.
Based on these reasons, this study focused on the temporal and spatial characteristics of dust events in China from 2015 to 2020 and aimed to investigate the characteristics of dust events with the changes of geography, climate and human activities. In order to eliminate the influence of haze, the criteria of selecting dust events proposed by China environmental monitoring station were used. The potential source contribution of dust events in different regions was studied using the PSCF. In addition, on the one hand, the pollution caused by dust events reflects the actual air quality; on the other hand, it causes interference to prevention and control of local air pollution. In order to provide a scientific basis for air pollution prevention and control, it is necessary to evaluate the ambient air quality more accurately and objectively. Therefore, the contribution of dust events to the urban particulate concentration was further studied.
Hourly concentration data of PM10 and PM2.5 obtained from national air quality automatic monitoring stations are described in Section 2.1. In Section 2.2 and Section 2.3, the methods of selecting dust events and contribution of dust events to urban particulate concentration are briefly introduced. Section 2.4 shows the method of PSCF. Temporal and spatial distribution characteristics of dust events in China from 2015 to 2020 are calculated and analyzed in Section 3. Section 4 gives the conclusions and possible future improvements to this study.
2. Data and Methods
2.1. Data of Particulate Concentration
The Ministry of Ecological Environment of the People’s Republic of China approved the “ambient air quality standard” (GB3095-2012) on 29 February 2012, and stipulated that the standard would be implemented nationwide beginning on 1 January 2016. Compared with the previous standard (GB3095-1996), the annual and daily average concentration limits of PM2.5 and the concentration limits of O3-8 h were increased, and the index values of PM10 and NO2 were strict. Although the regulation would be implemented nationwide from 1 January 2016, monitoring started as early as 2016 in some cities. For example, Gansu Province, Lanzhou, started the trial implementation in 2013, and Jiayuguan and Jinchang in 2014. In 2015, all cities and prefectures implemented the GB3095-2012 standard. Prior to that, the implementation was in accordance with the GB3095-1996 standard. Therefore, the data from 00:00 on 1 January 2015 to 23:00 on 31 December 2020 (Beijing time) were studied in this paper. The data of PM10 and PM2.5 concentration were obtained from the national urban air quality real-time release platform (http://106.37.208.233:20035/, accessed on 2 January 2015), released by China Environmental Monitoring Station, with a time resolution of 1 h.
2.2. Method of Selecting Dust Events
As the distance of sand storm transport increases, the coarse particles gradually settle and the concentration decreases, fine particles become prominent. Similarly, the concentration of coarse and fine particles are high in haze pollution, especially the concentration of fine particles, which leads to the confusion between pollution caused by haze and pollution caused by sand storms after long-distance transport. In order to identify dust events effectively, the starting and ending time of dust events were determined according to the notice proposed by China Environmental Monitoring Station.
Criteria for the starting time of dust events:
The hourly concentration of PM10 is greater than 150 µg·m−3 and one of the following conditions is achieved: (a) The hourly concentration of PM10 is greater than or equal to 2 times of the average concentration of PM10 in the previous 6 h. (b) The ratio of hourly concentration of PM2.5 to hourly concentration of PM10 is less than or equal to 50% of the average ratio in the previous 6 h.
Criteria for the ending time of dust events:
The moment when one of the following conditions is achieved for the first time: (a) The hourly concentration of PM10 is reduced to less than 1.1 times of the average PM10 concentration in the previous 6 h of starting time. (b) The hourly IAQI (Individual Air Quality Index) of PM2.5 is greater than the hourly IAQI of PM10.
According to these criteria, a dust event may last for several days, or several dust events may occur in one day. Therefore, this paper stipulated that when the interval between different dust events was less than 12 h, they would be recorded as one dust event.
2.3. Contribution of Dust Events to Urban Particulate Concentration
Contribution of dust events to urban particulate concentration is calculated as follows:
where Contribution is the contribution of dust events to urban particulate concentration, ContributionPMb represents the average concentration of particulates at all times, and ContributionPMa represents the average concentration of particulates except during the period of dust events.
2.4. Method of PSCF
Based on the backward trajectories calculated by HYSPLIT (Hybrid Single-Particle Lagrangian Integrated Trajectory) model, PSCF is widely used to evaluate the transport pathways and the contribution of potential source areas of pollutions [24,25,26]. The PSCF value is the ratio of the number of pollution trajectories (mij) and the number of all trajectories (nij) passing through the receiving point (i,j). That is,
The higher the PSCF value, the greater the pollution contributions to the receiving point.
In order to study the potential source contribution of sand storms in densely populated cities, eight cities, including Urumqi, Lhasa, Hohhot, Beijing, Taiyuan, Lanzhou, Xining and Xi’an, were selected to study the PSCF values. The start location for PSCF is shown in Table 1. The run hours for all dust events were set to 48 h for convenience. The PSCF value needs to set a threshold value for the pollution factor. When the value of the pollution factor corresponding to the backward trajectory is higher than the threshold value, the trajectory is considered as the pollution trajectory. In this study, different thresholds were selected according to the dust intensity in different cities. The threshold value of PM10 concentration in Urumqi and Lhasa was set to 150 µg·m−3, because the moments of the PM10 concentrations greater than 350 µg·m−3 were very few when dust occurred. The threshold value of PM10 concentration in Hohhot, Beijing, Taiyuan, Lanzhou, Xining and Xi’an was set to 350 µg·m−3.
Because the PSCF value is a conditional probability, when the residence time of airflow in each grid is short, the PSCF value will fluctuate greatly, which makes the error larger. In order to reduce the error, the weight function (Wij) was introduced to minimize the uncertainty. After calculation, the weight function used in this study was as follows [27]:
Therefore,
The meteorological data of PSCF was obtained from GDAS (Global Data Assimilation System) which provided by NCEP (National Center for Environmental Prediction).
GDAS assimilates the following types of observations to a 3-D model space grid: surface observations, balloon data, wind profiler data, aircraft reports, and buoy, radar and satel-lite observations. In this paper, the grid resolution is 0.5° and the time resolution is 6 h.
3. Results and Discussion
According to the criteria of the starting time of dust events, the minimum concentra-tion of PM10 is 150 µg·m−3 when dust events occur. Concerning the technical regulation on ambient air quality index (Chinese National environmental protection standard HJ 633-2012), when the concentration of PM10 is greater than 350 µg·m−3, the corresponding ambient air quality level achieves heavy pollution. In addition, the hourly concentration of PM10 is greater than 1000 µg·m−3 frequently when strong dust events occur, and may even exceed 2000 µg·m−3.Therefore, the dust events were classified into four levels according to PM10 hourly concentrations, which were named dust level I, II, III and IV. The PM10 hourly concentrations greater than 150 µg·m−3, 350 µg·m−3, 1000 µg·m−3, and 2000 µg·m−3 were for dust level I, II, III, IV, respectively.
3.1. Spatial Distribution of Dust Event Frequency of 336 Cities in China from 2015 to 2020
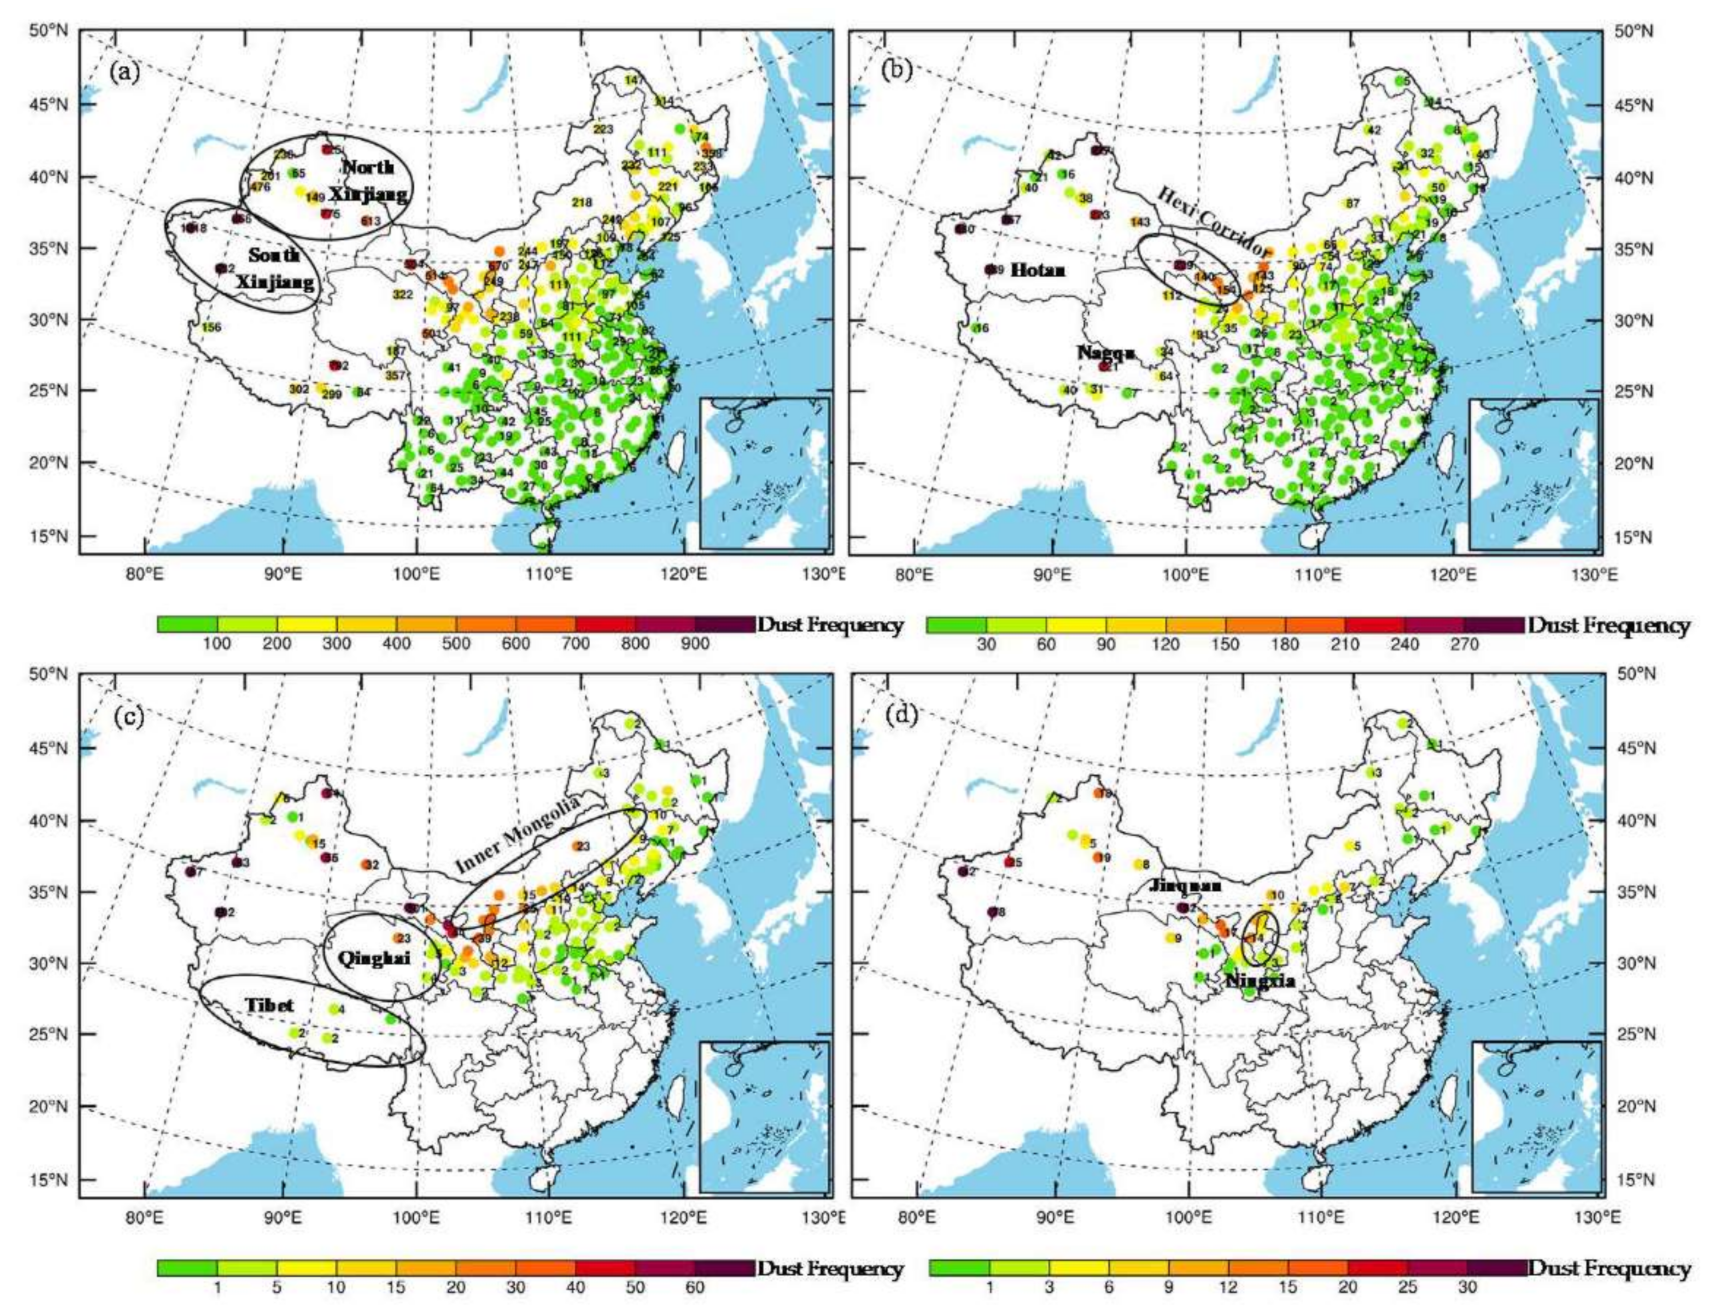
Figure 1 shows the total dust events of 336 cities in China during 2015–2020. In order to highlight the distribution characteristics of different levels of dust events, the cities without corresponding levels of dust events are no longer drawn. The dust prone areas are marked in Figure 1.
After statistical calculation, there were 334 cities affected by dust events except for Shenzhen and Dongguan in the period of 2015–2020 (Figure 1a). The frequencies of dust level I in the cities of Northern China, especially in Northwest China, were significantly higher than that in the cities of Southern China, which was more than 500 in the cities of Northwest China. The most affected area of dust level I was South Xinjiang, where the frequency of dust level I in each city was about 1000. The second is North Xinjiang, Western Hexi Corridor and Nagqu, their frequencies of dust level I were about 500–800. These were followed by Ningxia, Inner Mongolia, Qinghai, and Tibet, which were about 200–300. Figure 1b shows dust level II; its main occurrence area was consistent with that of dust level I. The difference was that the influence area of dust level II was reduced, and there were 299 cities were affected, which indicates that the ambient air quality of most cities were seriously polluted due to dust events during 2015–2020. Figure 1c shows the dust events of dust level III. It can be seen that the influence area was significantly reduced; there were 134 cities with PM10 hourly concentration exceeding 1000 µg·m−3 due to dust events in the period of 2015–2020. The most affected city was Hotan, where 202 dust events occurred, followed by Jiuquan, which experienced 101 dust events. The region of dust level IV was reduced further, as shown in Figure 1d, which was still distributed in Northern China, especially in South Xinjiang and Hexi Corridor. The results show that there were 56 cities with PM10 hourly concentration exceeding 2000 µg·m−3 due to dust events from 2015 to 2020. The most affected city was Hotan, where 78 dust events occurred, followed by Jiuquan, which experienced 52 dust events.
It can be seen that almost all cities in China experienced dust events, which led to severe air pollution in most cities during 2015–2020. The dust events mainly occurred in Northern China. The area with the highest dust frequency of all dust levels were South Xinjiang, followed by Western Hexi Corridor, Ningxia, Inner Mongolia, Qinghai and Tibet. For North Xinjiang, the dust frequencies of dust level I were higher than that in Western Hexi Corridor, and dust level II was close to that in Western Hexi Corridor. However, the frequencies of dust level III and dust level IV were fewer than that in Western Hexi Corridor, which indicated that North Xinjiang was more prone to dust events than that in Western Hexi Corridor, but the strong dust events were fewer than Western Hexi Corridor. For Tibet, the frequencies of dust level I and dust level II were larger, but the frequencies of dust level III were very low, and dust events of dust level IV never happened from 2015 to 2020, which indicated that Tibet was prone to dust events, but the occurrence of strong dust events was rare. In addition, compared with the cities in Northern China, the impacts of dust events in Southern China were obviously weakened, and the hourly concentrations of PM10 were less than 1000 µg·m−3 when the dust events occur.
3.2. Contribution of Dust Events to Urban Particulate Concentration
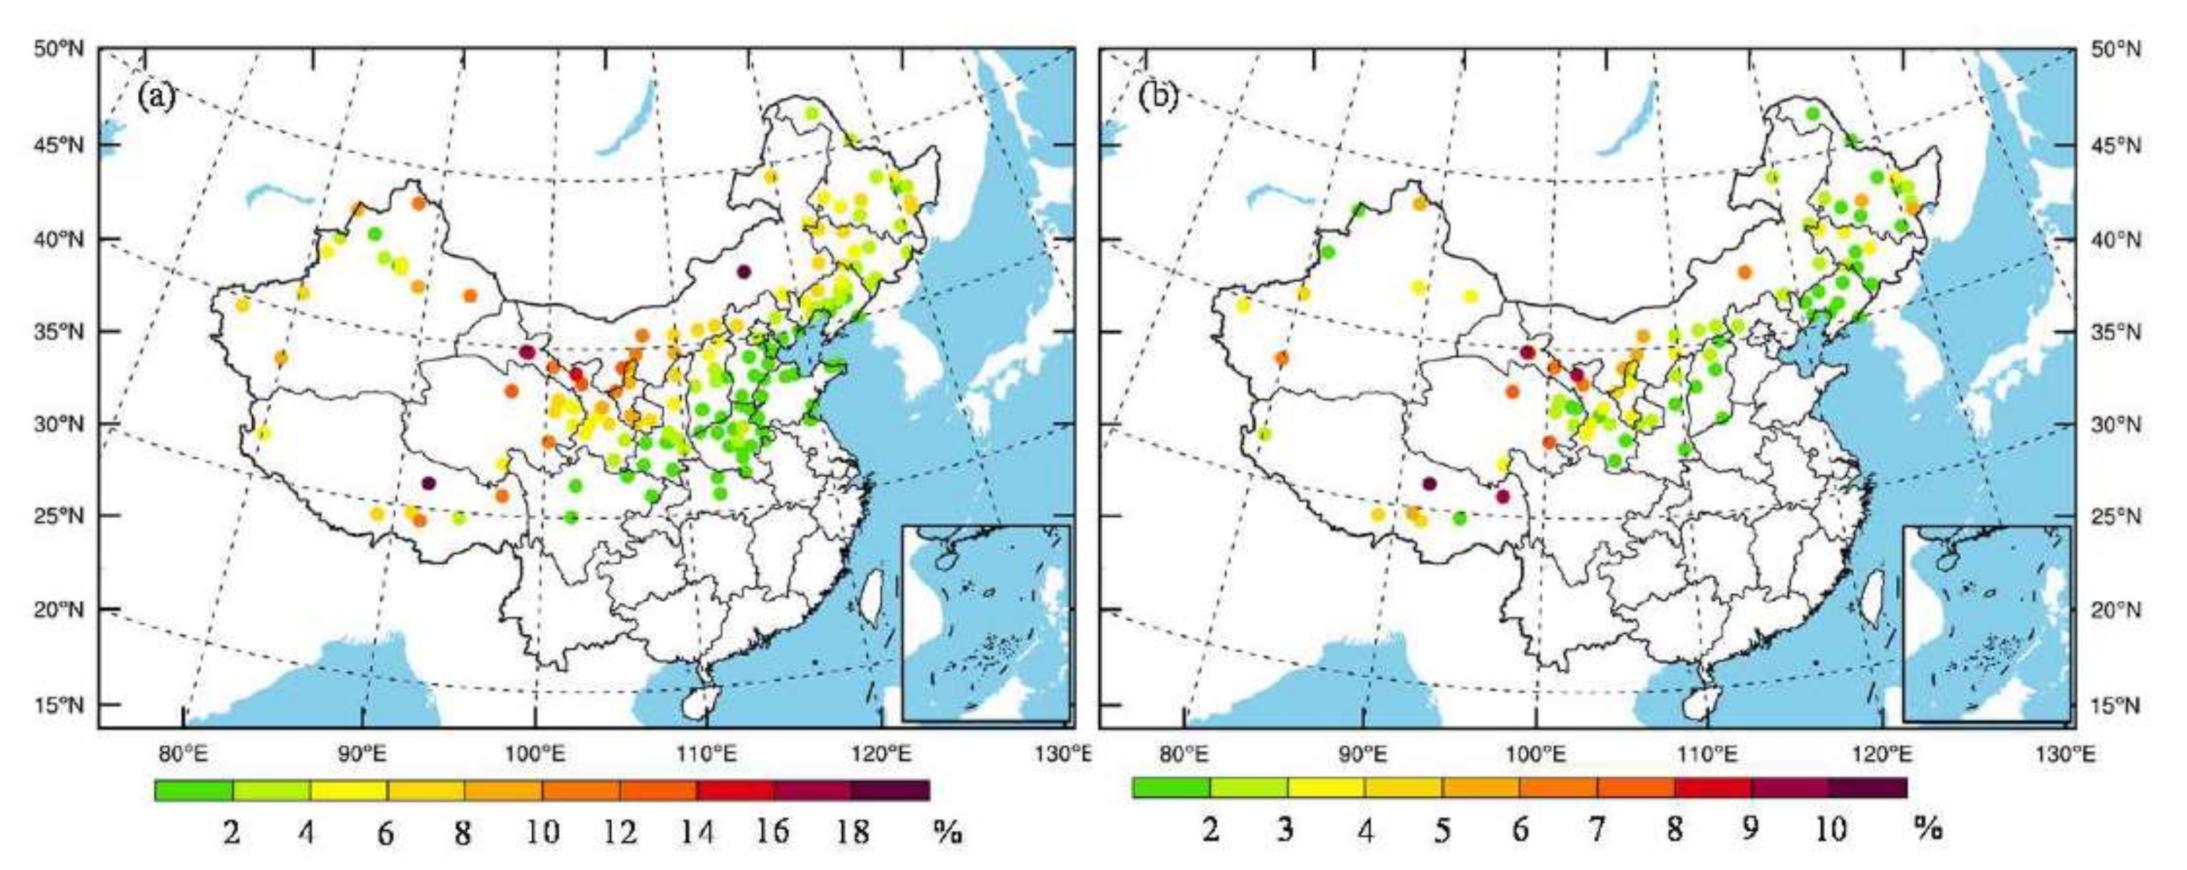
Dust events often make the concentration of particulate matter rise significantly, which leads to serious air pollution. Therefore, the contribution of dust events to the particulate concentration of 336 cities in China was further studied. Figure 2 shows the contribution of dust events to the average concentrations of PM10 (Figure 2a) and PM2.5 (Figure 2b) during 2015–2020. In order to highlight the cities with obvious influence of dust events, Figure 2 only shows the cities with more than 1% contribution. It can be seen that the contribution of dust events to the average concentration of PM10 and PM2.5 in the cities of Northern China was obvious, especially for the cities of Northwest China, which was more than 10% for PM10 and about 5–10% for PM2.5. The contribution to the average concentration of PM10 and PM2.5 in the cities of Southern China was less than 1%. The most affected city was Nagqu, where the contribution to the average concentration of PM10 reached 18.6%, followed by Xilingol, Jiayuguan, Jiuquan and Jinchang, which were 18.0%, 16.7%, 15.5% and 14.9%, respectively. Nagqu was also the city with the largest contribution to the average concentration of PM2.5, reaching 16.2%, followed by Changdu, Jiayuguan and Jinchang, which were 9.9%, 9.4% and 9.2%, respectively. Although Xinjiang was prone to dust events, the contribution of dust events to urban air quality was less than that of the cities noted above due to the high concentration of particulates during dust-free periods. Figure 2 indicates that the contribution of dust events to the average concentration of PM10 was significantly greater than that of PM2.5.
3.3. Annual Change of the Dust Event Frequencies from 2015 to 2020
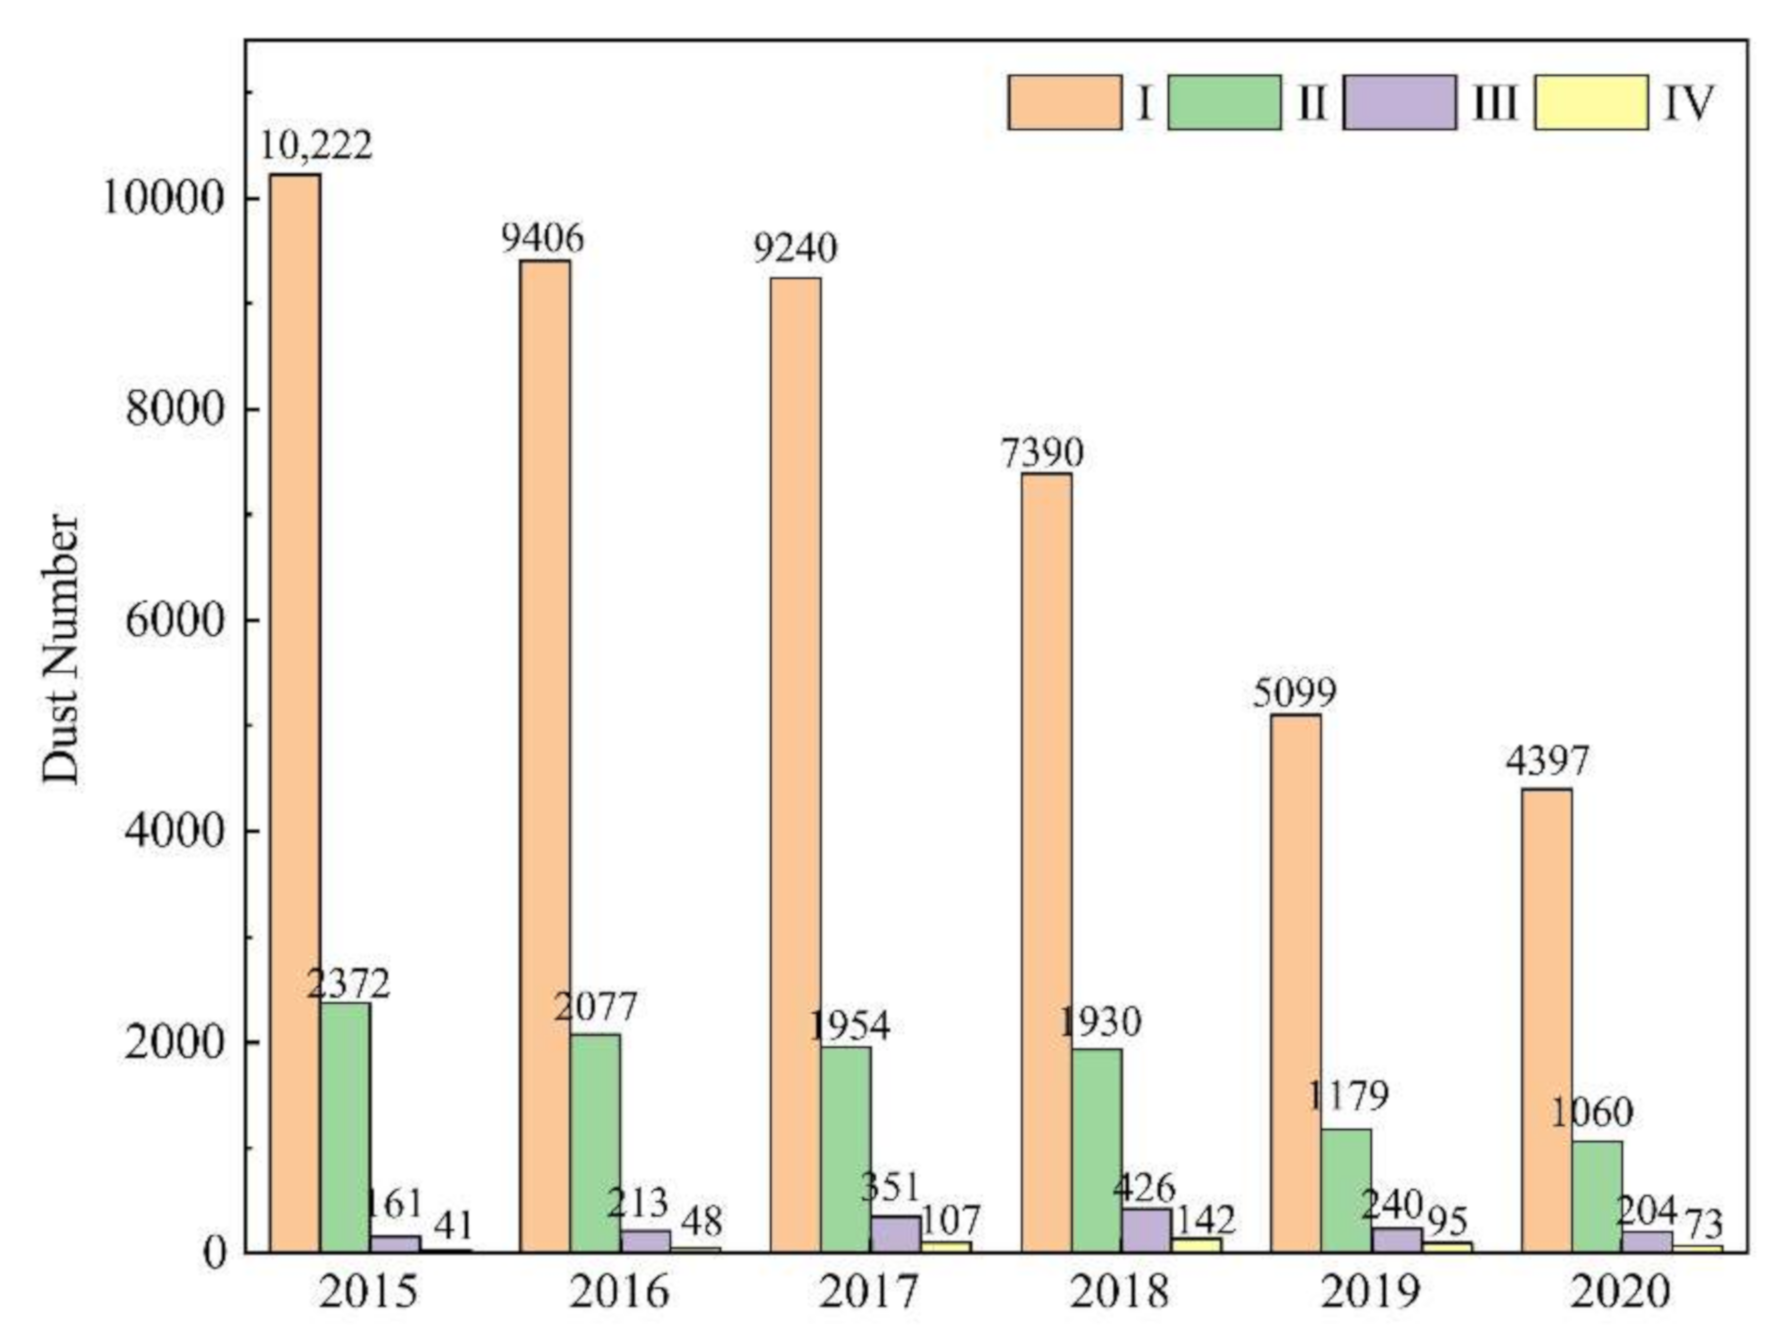
Figure 3 shows the annual change of the dust event frequencies for different levels from 2015 to 2020. The number of dust events of dust level I and dust level II decreased significantly year-by-year; it decreased from 10,222 in 2015 to 4397 in 2020 for dust level I and decreased from 2372 in 2015 to 1060 in 2020 for dust level II. The decrease in 2019 was very significant; the number of dust events of dust level I and dust level II was 5099 and 1179, respectively, which was almost half of that in 2015. However, the trend reversed in dust level III and dust level IV, which increased gradually in the period of 2015–2018. The number of dust events increased from 161 in 2015 to 426 in 2018 for dust level III and increased from 41 in 2015 to 142 in 2018 for dust level IV, that is, an increase of about three times. The number of dust events of dust level III decreased slightly in 2019, but it was still higher than that in 2015 and 2016, and close to that in 2016 until 2020. Similarly, the number of dust events of dust level IV in 2019 and 2020 showed a downward trend, but still higher than that in 2015 and 2016. Figure 3 shows that all of the dust events in China clearly decreased, but the strong dust events did not decrease.
In order to explore the reason for the increasing of strong dust in the period of 2015–2018, representative cities in different regions were selected according to the data shown in Figure 1c. Hotan represented South Xinjiang, Turpan represented North Xinjiang, Jiuquan represented Western Hexi Corridor, Wuwei represented Eastern Hexi Corridor, Zhongwei represented Hetao, Bayan Nur represented Central Inner Mongolia and Xilingol represented Eastern Inner Mongolia. The annual dust frequencies of dust level III in the representative cities from 2015 to 2020 are labeled in Figure 4 and listed in Table 2, and locations of the representative cities are also provided in Figure 4. Strong dust events did not occur in Xilingol during 2015, but increased gradually from 2016 to 2018, especially in 2018. Fortunately, it decreased significantly in 2019 and 2020. There were no strong dust events in 2015 and 2016 in Bayan Nur, where 3 and 13 strong dust events occurred during 2017 and 2018, respectively, and then decreased gradually. Zhongwei did not experience any strong dust events in 2015, but the number of strong dust events in the period of 2016–2018 was relatively high, approaching about 10 every year. The number of strong dust events in Wuwei remained essentially unchanged from 2015 to 2020, with 6–8 strong dust events per year. The number of strong dust events in Turpan increased in 2018, reaching 14, and experienced 7–9 strong dust events during the other years. There were many strong dust events in Hotan each year, which increased gradually during 2016–2018; the number was greatest in 2018, when it reached 54. The total frequency of strong dust in Jiuquan was lower than that in Hotan during the period from 2015 to 2020, but it was higher than that in Hotan in 2019, with a total of 33 times.
To explain the results shown in Figure 4 and Table 2, the main reason for the increase of strong dust during 2015–2018 was that the strong dust events in Mid-Eastern Inner Mongolia and North Xinjiang increased gradually. For example, the growth rate in 2018 compared to 2017 of Bayan Nur and Xilingol was 333.33% and 275.00%, respectively, followed by Turpan, where the growth rate achieved 55.56%. In addition, the increase of strong dust events in Western Hexi Corridor in 2019 was obvious.
3.4. Monthly Change of the Dust Event Frequencies
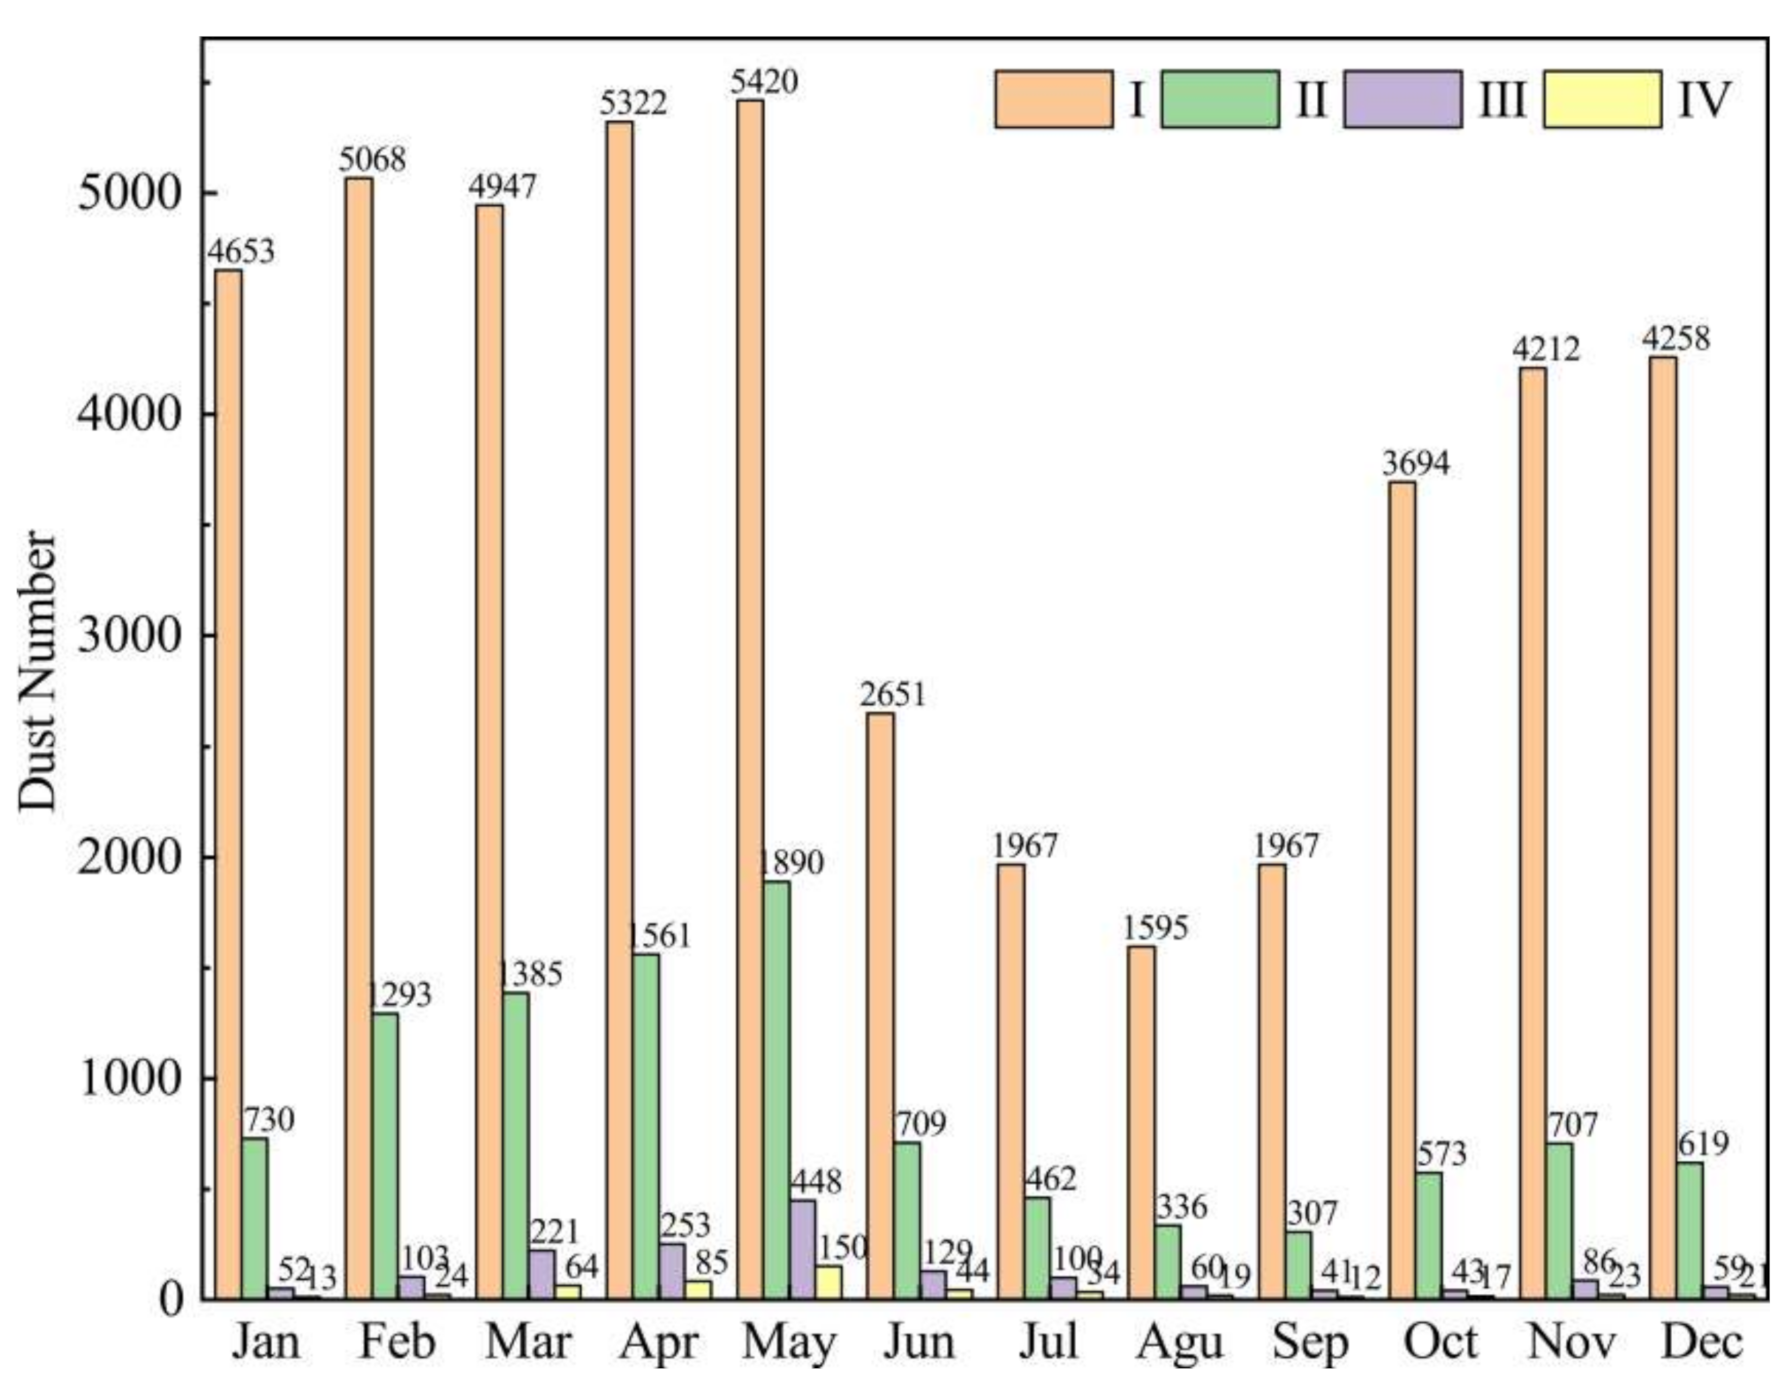
The monthly change of the frequency for different dust levels from 2015 to 2020 can be found in the Figure 5. It can be seen that the trend of monthly dust event frequencies of each level was similar, and it increased gradually from January to May. The frequencies increased from 4653 to 5420 for dust level I, increased from 730 to 1890 for dust level II, increased from 52 to 448 for dust level III, and increased from 13 to 150 for dust level IV. Since June, with the rainfall belt moving northward [28], the frequencies of dust occurrence decreased significantly. The frequencies of dust level I and dust level II dropped to half of that in May, and the frequencies of dust level III and dust level IV decreased more significantly, which reduced to a third of that in May. The frequencies of each dust level increased gradually from September to December, but it was still less than January until December. It can be seen that the dust events were the least in August, and it was the most prone to occur in May, which may be due to the increase of temperature, thawing of frozen soil, less precipitation, sparse vegetation and strong wind in spring [8,29,30,31].
3.5. Frequency of the Starting Time of Dust Events
In order to explore the characteristics of sand storms starting time in 2015–2020, this study selected the same cities in shown in Figure 4 as the representative cities, which are near the sand source. As shown in Figure 6, the starting time of sand storms showed obvious bimodal distribution, and the most likely starting time was 10:00–11:00 BJT, followed by 22:00–23:00 BJT. After sunrise, with the increase of surface temperature, the convective mixing in the boundary layer was strengthened, and the frequencies of dust occurrence increased gradually. The frequencies reached a maximum at 11:00 BJT, which was about 10.2%, and then the frequencies decreased gradually. In the afternoon, the frequencies of sand storms starting time were only 2–3%, and in the evening, the frequencies increased gradually. The frequencies reached 8.0% at 22:00 BJT, and then decreased again. Some studies [32,33] have shown that a low-level jet (LLJ) often occurs in the stable boundary layer at night. The LLJ can result in an “upside-down” effect and increase turbulent vertical mixing from top to bottom [34], which may be the reason why the sand storm can occur at night. From 2:00 to 7:00, the frequencies were only 1–3%.
3.6. Results of PSCF
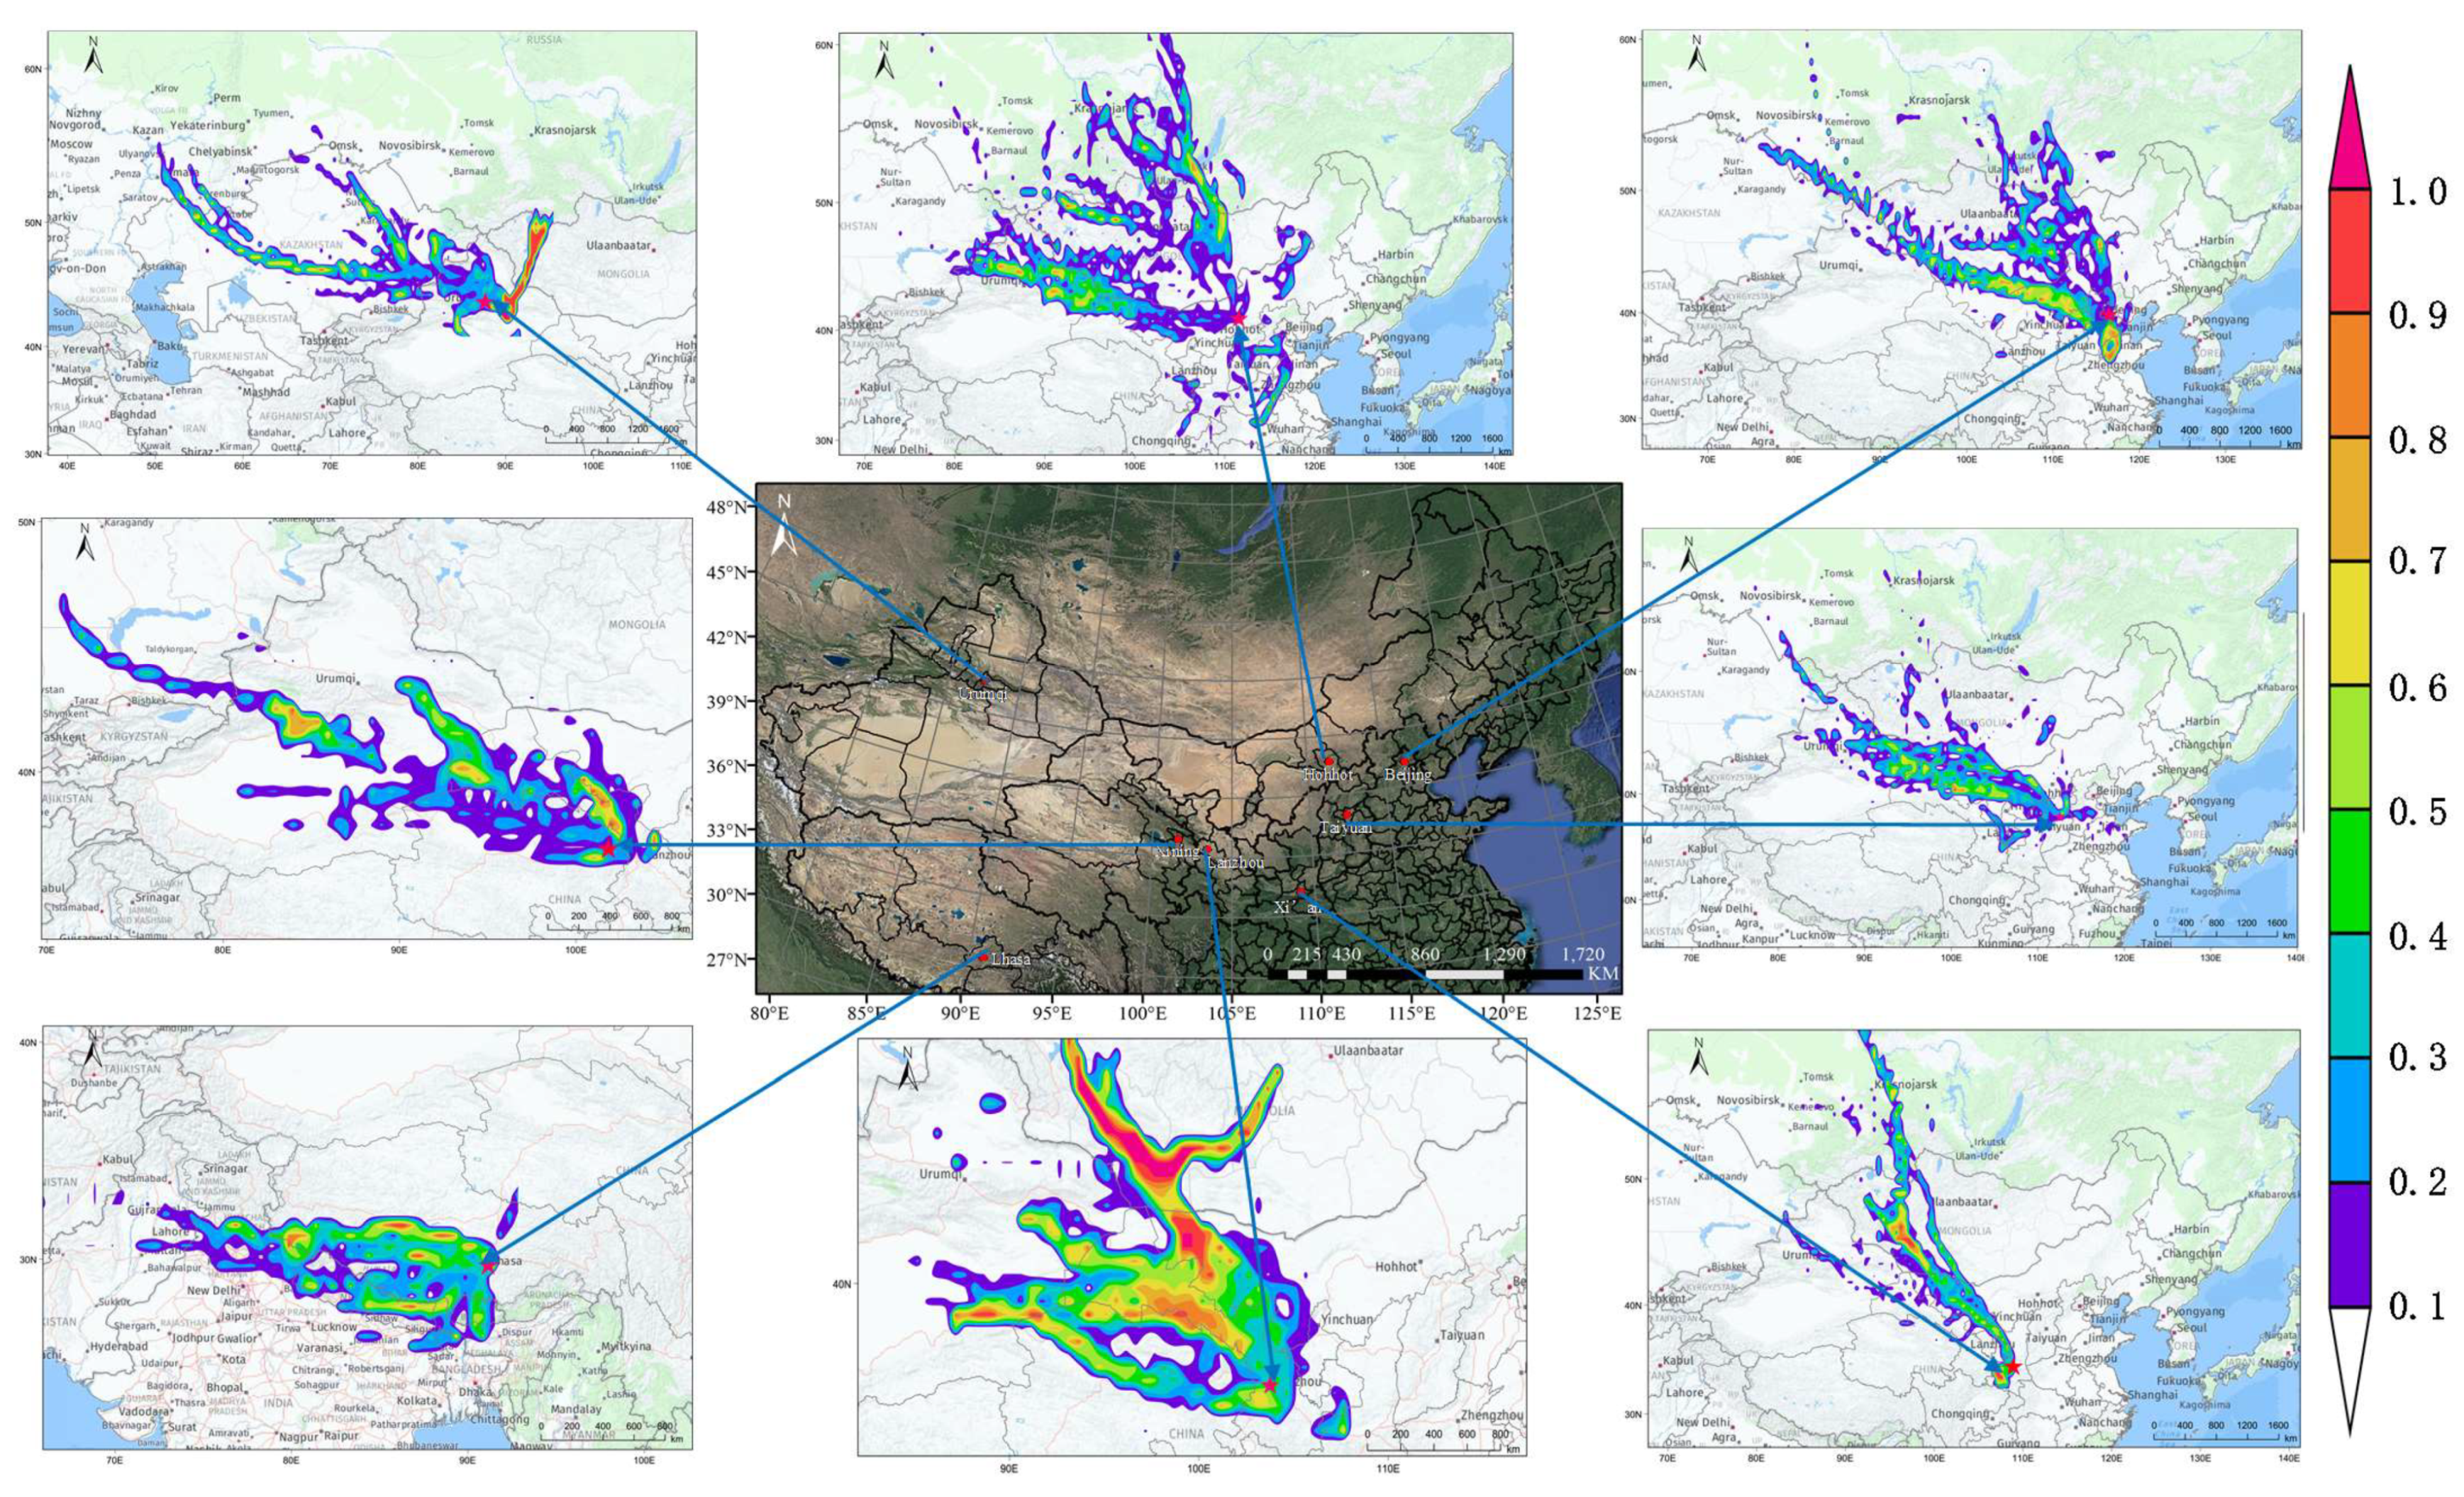
From the distribution of WPSCF values (Figure 7), one can see that the dust in Urumqi mainly came from western Mongolia to the northeast, Kazakhstan to the West and Gurbantunggut Desert to the north. The potential source areas of dust in Hohhot were mainly distributed in the North of Xinjiang to the West and Mongolia to the north. The high value of WPSCF in Beijing was mainly distributed in the Central and Western Inner Mongolia to the northwest. In addition, the high value of WPSCF in a small area existed to the south of Beijing, which indicated that besides the influence of upstream transport, dust recirculation was also very common in Beijing. The potential sources of dust in Taiyuan were consistent, mainly from the northwest, and were affected by Badain Jaran, Tengger, Kubuqi and Ulanbuh deserts, and so on. The potential sources of dust in Xi’an were consistent, too, mainly from the northwest. Compared with Taiyuan, the potential source area was located in the north, and was more affected by the western region of Mongolia. In addition, the influence of dust recirculation in the South cannot be ignored. As far as Lanzhou was concerned, the potential source areas of dust were more widely distributed than other cities, which were affected from Southern Xinjiang through Qaidam Basin to Lanzhou, and from Hexi Corridor to Lanzhou. In addition, the contribution of Badain Jaran Desert and Tengger Desert superimposed by Western Mongolia is very clear. The potential dust sources of Lhasa, which is located in the Qinghai Tibet Plateau, were mainly distributed in the Gobi to the west of Lhasa. The dust in Xining came from the west and the north, the west was mainly affected by the northern Tagramagan Desert and Qaidam Desert, and the north was mainly affected by the Hexi Corridor.
It can be seen that the dust potential source contribution in each city mainly came from the northwest, and was mainly affected by Mongolia in addition to the local dust in China. The potential sources of dust were closely related to the distribution of deserts, which were mainly affected by the Grammagan, Gurbantunggut, Badain Jaran, Tengger, Kubuqi, Ulanbuh deserts, among others. In addition, Beijing, the capital city, was obviously affected by dust recirculation.
4. Discussions and Conclusions
In order to investigate the temporal and spatial characteristics of dust events in recent years, the hourly observed concentration of PM10 and PM2.5 in 336 cities in China from 2015 to 2020 was analyzed. The contribution of dust events to the urban particulate concentration was investigated. In addition, the potential source contribution of dust events in different regions was studied using the PSCF. The following conclusions are obtained.
(1) For the spatial distribution of dust events, 334 cities had dust events except Shenzhen and Dongguan. Dust prone areas may not have more strong dust events. The dust contribution to PM10 of the cities in Northwest China was more than 10% and about 5–10% to PM2.5. In addition, 299 cities were seriously polluted by the dust events during 2015–2020; 134 cities encountered dust level III and 56 cities encountered dust level IV.
(2) The dust events clearly decreased during 2015–2020, but the strong dust events did not decrease because the strong dust events in Mid-Eastern Inner Mongolia and North Xinjiang increased gradually during 2015–2018. The trend of monthly dust frequencies of different levels was the same, and it reached the highest value in May. The starting time of sand storms revealed a bimodal distribution, and the most frequent time was 10:00–11:00 BJT, followed by 22:00–23:00 BJT.
(3) The dust potential source contribution of different cities mainly came from the northwest of each city. Mongolia was the main potential source contribution outside China. In addition, Beijing was obviously affected by dust recirculation.
It is of great significance to the improvement of the forecast of dust weather and the warning of strong dust events by studying the temporal and spatial characteristics of dust events. However, only the ground observation data were used in this study. In the future, the data from the ground Lidar network will be used to study the vertical distribution and size and shape characteristics of dust aerosols.
Author Contributions
S.Z. designed the experiments; L.Y. analyzed the data and wrote the manuscript; Z.H. and Y.Y. reviewed and edited the manuscript; W.H. contributed and analyzed Figure 1; L.W. helped with the discussion; X.L. contributed and analyzed Figure 6. All authors have read and agreed to the published version of the manuscript.
Funding
This research was funded by the foundation for National Natural Science Foundation of China (42075126); Project of Field Scientific Observation and Research Station of Gansu Province (18JR2RA013); Natural Science Foundation of Gansu Province (20JR10RA444). This work was supported by Supercomputing Center of Lanzhou University.
Institutional Review Board Statement
Not applicable.
Informed Consent Statement
Not applicable.
Data Availability Statement
Data are available in a publicly accessible repository that does not issue DOIs. The surface PM2.5 and PM10 concentrations datasets can be found at: http://www.cnemc.cn/, 2 January 2015 The GDAS datasets can be found at: ftp://arlftp.arlhq.noaa.gov/pub/archives/gdas1, accessed on 5 March 2020.
Acknowledgments
We are grateful to NOAA for distributing the GDAS data (ftp://arlftp.arlhq.noaa.gov/pub/archives/gdas1, accessed on 5 March 2020). The authors acknowledge the anonymous reviewers and the editor for their valuable comments and suggestions.
Conflicts of Interest
The authors declare no conflict of interest.
References
- Chen, S.Y.; Huang, J.P.; Li, J.X.; Jia, R.; Jiang, N.X.; Kang, L.T.; Ma, X.J.; Xie, T.T. Comparison of dust emissions, transport, and deposition between the Taklimakan Desert and Gobi Desert from 2007 to 2011. Sci. China Earth Sci. 2017, 60, 1338–1355. [Google Scholar] [CrossRef]
- Li, C.X.; Dong, Z.B.; Zhang, S.L. Response on land desertification to dust storm in recent 45a in Alxa Plateau. In Proceedings of the 2012 International Conference on Biomedical Engineering and Biotechnology (ICBEB), Macau, Macao, 28–30 May 2012; IEEE: New York, NY, USA, 2012; pp. 1653–1655. [Google Scholar] [CrossRef]
- Abraham, E.M.; Guevara, J.C.; Candia, R.J.; Soria, N.D. Dust storms, drought and desertification in the Southwest of Buenos Aires Province, Argentina. Rev. FCA UNCUYO 2016, 48, 222–241. [Google Scholar]
- Aragnou, E.; Watt, S.; Duc, H.N.; Cheeseman, C.; Riley, M.; Leys, J.; White, S.; Salter, D.; Azzi, M.; Chang, L.; et al. Dust transport from inland Australia and its impact on air quality and health on the Eastern Coast of Australia during the February 2019 dust storm. Atmosphere 2021, 12, 141. [Google Scholar] [CrossRef]
- Ardon-Dryer, K.; Mock, C.; Reyes, J.; Lahav, G. The effect of dust storm particles on single human lung cancer cells. Environ. Res. 2019, 181, 108891–108898. [Google Scholar] [CrossRef] [PubMed]
- Kok, J.; Ward, D.S.; Mahowald, N.M.; Evan, A. Global and regional importance of the direct dust-climate feedback. Nat. Commun. 2018, 9, 241–254. [Google Scholar] [CrossRef]
- Huang, J.P.; Wang, T.H.; Wang, W.C.; Li, Z.Q.; Yan, H.R. Climate effects of dust aerosols over East Asian arid and semiarid regions. J. Geophys. Res. Atmos. 2014, 119, 11398–11416. [Google Scholar] [CrossRef]
- Aili, A.; Xu, H.L.; Kasim, T.; Kasim, T.; Abulikemu, A. Origin and transport pathway of dust storm and its contribution to particulate air pollution in northeast edge of Taklimakan Desert, China. Atmosphere 2021, 12, 113. [Google Scholar] [CrossRef]
- Gao, W.K.; Zhu, L.Y.; Ma, Z.Y.; Gao, Q.X.; Yu, X.P.; Wu, S.F.; Gu, Y. Particulate matter trends and quantification of the spring sand-dust contribution in Hohhot, Inner Mongolia, from 2013 to 2017. Atmos. Ocean. Sci. Lett. 2021, 14, 100036–100041. [Google Scholar] [CrossRef]
- Filonchyk, M.; Yan, H.W.; Yang, S.W.; Lu, X.M. Detection of aerosol pollution sources during sandstorms in Northwestern China using remote sensed and model simulated data. Adv. Space Res. 2018, 61, 1035–1046. [Google Scholar] [CrossRef]
- Li, J.; Shao, L.Y.; Chang, L.L.; Xing, J.P.; Wang, W.H.; Li, W.J.; Zhang, D.Z. Physicochemical characteristics and possible sources of individual mineral particles in a dust storm episode in Beijing, China. Atmosphere 2018, 9, 269. [Google Scholar] [CrossRef] [Green Version]
- Huang, Z.W.; Huang, J.P.; Hayasaka, T.; Wang, S.S.; Zhou, T.; Jin, H.C. Short-cut transport path for Asian dust directly to the Arctic: A case study. Environ. Res. Lett. 2015, 10, 114018–114027. [Google Scholar] [CrossRef] [Green Version]
- Yang, L.L.; Hu, Z.Y.; Huang, Z.W.; Wang, L.N.; Han, W.Y.; Yang, Y.P.; Tao, H.J.; Wang, J. Detection of a dust storm in 2020 by a multi-observation platform over the northwest china. Remote Sens. 2021, 13, 1056. [Google Scholar] [CrossRef]
- Nguyen, H.D.; Riley, M.; Leys, J.; Salter, D. Dust storm event of February 2019 in Central and East Coast of Australia and evidence of long-range transport to New Zealand and Antarctica. Atmosphere 2019, 10, 653. [Google Scholar] [CrossRef] [Green Version]
- Hu, Z.Y.; Huang, J.P.; Zhao, C.; Bi, J.R.; Jin, Q.J.; Qian, Y.; Leung, L.R.; Feng, T.C.; Chen, S.Y.; Ma, J.M. Modeling the contributions of Northern Hemisphere dust sources to dust outflow from East Asia. Atmos. Environ. 2019, 202, 234–243. [Google Scholar] [CrossRef]
- Yang, B.; Bräuning, A.; Zhang, Z.Y.; Dong, Z.B.; Esper, J. Dust storm frequency and its relation to climate changes in northern china during the past 1000 years. Atmos. Environ. 2007, 41, 9288–9299. [Google Scholar] [CrossRef]
- Al-Dousari, A.; Al-Awadhi, J.; Ahmed, M. Dust fallout characteristics within global dust storm major trajectories. Arab. J. Geosci. 2013, 6, 3877–3884. [Google Scholar] [CrossRef]
- Gassó, S.; Torres, O. Temporal characterization of dust activity in the Central Patagonia Desert (years 1964–2017). J. Geophys. Res. Atmos. 2019, 124, 3417–3435. [Google Scholar] [CrossRef] [Green Version]
- Camino, C.; Cuevas, E.; Basart, S.; Alonso-Pérez, S.; Baldasano, J.M.; Terradellas, E.; Marticorena, B.; Rodríguez, S.; Berjón, A. An empirical equation to estimate mineral dust concentrations from visibility observations in Northern Africa. Aeolian Res. 2015, 16, 55–68. [Google Scholar] [CrossRef] [Green Version]
- Yang, Y.Q.; Wang, J.Z.; Niu, T.; Zhou, C.H.; Chen, M.; Liu, J.Y. The variability of spring sand-dust storm frequency in Northeast Asia from 1980 to 2011. Acta Meteorol. Sin. 2013, 27, 119–127. [Google Scholar] [CrossRef]
- Liu, D.W.; Abuduwaili, J.; Wang, L.X. Salt dust storm in the ebinur lake region: Its 50-year dynamic changes and response to climate changes and human activities. Nat. Hazards 2015, 77, 1069–1080. [Google Scholar] [CrossRef]
- Wan, D.J.; Jin, Z.D.; Zhang, F.; Song, L.; Yang, J.S. Increasing dust fluxes on the northeastern Tibetan Plateau linked with the Little Ice Age and recent human activity since the 1950s. Aeolian Res. 2016, 23, 93–102. [Google Scholar] [CrossRef]
- Chen, F.H.; Chen, S.Q.; Zhang, X.; Chen, J.H.; Wang, X.; Gowan, E.J.; Qiang, M.R.; Dong, G.H.; Wang, Z.L.; Li, Y.C.; et al. Asian dust-storm activity dominated by chinese dynasty changes since 2000 bp. Nat. Commun. 2020, 11, 992. [Google Scholar] [CrossRef] [Green Version]
- Zhang, H.Y.; Cheng, S.Y.; Wang, X.Q.; Yao, S.; Zhu, F. Continuous monitoring, compositions analysis and the implication of regional transport for submicron and fine aerosols in Beijing, China. Atmos. Environ. 2018, 195, 30–45. [Google Scholar] [CrossRef]
- Fan, W.Z.; Qin, K.; Xu, J.; Yuan, L.M.; Li, D.; Jin, Z.; Zhang, K.F. Aerosol vertical distribution and sources estimation at a site of the Yangtze River Delta region of China. Atmos. Res. 2019, 217, 128–136. [Google Scholar] [CrossRef] [Green Version]
- Ham, J.; Lee, H.J.; Cha, J.; Ryoo, S.B. Potential source of PM10, PM2.5, and OC and EC in Seoul during Spring 2016. Atmosphere 2017, 27, 41–54. [Google Scholar] [CrossRef] [Green Version]
- Wang, Y.Q.; Zhang, X.Y.; Arimoto, R. The contribution from distant dust sources to the atmospheric particulate matter loadings at Xi’an, China during spring. Sci. Total Environ. 2006, 368, 875–883. [Google Scholar] [CrossRef] [PubMed]
- Wang, C.L.; Zhao, N.; Yue, T.X.; Zhao, M.W.; Chen, C. Change trend of monthly precipitation in China with an improved surface modeling method. Environ. Earth Sci. 2015, 74, 6459–6469. [Google Scholar] [CrossRef]
- Zou, X.K.; Zhai, P.M. Relationship between vegetation coverage and spring dust storms over Northern China. J. Geophys. Res. Atmos. 2005, 109, 3104. [Google Scholar] [CrossRef]
- Tan, S.C.; Shi, G.Y.; Wang, H. Long-range transport of spring dust storms in Inner Mongolia and impact on the China seas. Atmos. Environ. 2012, 46, 299–308. [Google Scholar] [CrossRef]
- Li, X.L.; Zhang, H.S. Micrometeorological characteristics during severe dust storms in spring of the Beijing area in 2010. Clim. Environ. Res. 2012, 17, 400–408. [Google Scholar] [CrossRef]
- Ao, Y.H.; Lv, S.H.; Chen, Y.H. Characteristic analysis of different terra in PBL in Hexi region. Plateau Meteor. 2004, 23, 215–219. (In Chinese) [Google Scholar] [CrossRef]
- Rosenfeld, D. Suppression of rain and snow by urban and industrial air pollution. Science 2000, 287, 1793–1796. [Google Scholar] [CrossRef] [PubMed]
- Wu, Z.H. Rainstorm in North China; China Meteorological Press: Beijing, China, 1992; pp. 102–103. (In Chinese) [Google Scholar]
Figure 1.
Spatial distribution of dust event frequencies of 336 cities in China from 2015 to 2020: (a) dust level I; (b) dust level II; (c) dust level III; (d) dust level IV.
Figure 1.
Spatial distribution of dust event frequencies of 336 cities in China from 2015 to 2020: (a) dust level I; (b) dust level II; (c) dust level III; (d) dust level IV.

Figure 2.
Contribution of dust events to the concentration of PM10 (a) and PM2.5 (b).

Figure 3.
Annual change of the dust event frequencies for different levels from 2015 to 2020.

Figure 4.
Annual dust frequencies of dust level III in the representative cities.

Figure 5.
Monthly change of the dust event frequencies for different levels from 2015 to 2020.

Figure 6.
Frequencies of the starting time of dust events in the representative cities from 2015 to 2020.
Figure 6.
Frequencies of the starting time of dust events in the representative cities from 2015 to 2020.

Figure 7.
Potential source contribution of PM10 in dust storm events for different cities (2015 to 2020).
Figure 7.
Potential source contribution of PM10 in dust storm events for different cities (2015 to 2020).


Table 1.
The urban start location for PSCF.
| City | Urumqi | Lhasa | Hohhot | Beijing | Taiyuan | Lanzhou | Xining | Xi’an |
|---|---|---|---|---|---|---|---|---|
| Longitude (°E) | 87.68 | 91.00 | 111.65 | 116.42 | 112.53 | 103.73 | 101.75 | 108.95 |
| Latitude (°N) | 43.77 | 29.60 | 40.82 | 39.92 | 37.87 | 36.03 | 36.57 | 34.27 |
Table 2.
Annual dust frequencies of dust level III in the representative cities.
| City | 2015 | 2016 | 2017 | 2018 | 2019 | 2020 | Growth Rate 1 /% |
|---|---|---|---|---|---|---|---|
| Hotan | 33 | 25 | 41 | 54 | 30 | 19 | 31.71 |
| Tulufan | 8 | 8 | 9 | 14 | 7 | 9 | 55.56 |
| Jiuquan | 10 | 8 | 19 | 15 | 33 | 16 | −21.05 |
| Wuwei | 8 | 8 | 7 | 9 | 6 | 6 | 28.57 |
| Zhongwei | 0 | 11 | 8 | 11 | 6 | 3 | 37.50 |
| Bayan Nur | 0 | 0 | 3 | 13 | 4 | 3 | 333.33 |
| Xilingol | 0 | 1 | 4 | 15 | 2 | 1 | 275.00 |
1 Growth rate in 2018 compared to 2017.
Publisher’s Note: MDPI stays neutral with regard to jurisdictional claims in published maps and institutional affiliations. |
© 2021 by the authors. Licensee MDPI, Basel, Switzerland. This article is an open access article distributed under the terms and conditions of the Creative Commons Attribution (CC BY) license (https://creativecommons.org/licenses/by/4.0/).
Share and Cite
MDPI and ACS Style
Yang, L.; Zhang, S.; Huang, Z.; Yang, Y.; Wang, L.; Han, W.; Li, X. Characteristics of Dust Events in China from 2015 to 2020. Atmosphere 2021, 12, 952. https://0-doi-org.brum.beds.ac.uk/10.3390/atmos12080952
AMA Style
Yang L, Zhang S, Huang Z, Yang Y, Wang L, Han W, Li X. Characteristics of Dust Events in China from 2015 to 2020. Atmosphere. 2021; 12(8):952. https://0-doi-org.brum.beds.ac.uk/10.3390/atmos12080952
Chicago/Turabian StyleYang, Lili, Shuwen Zhang, Zhongwei Huang, Yanping Yang, Lina Wang, Wenyu Han, and Xiaoyun Li. 2021. "Characteristics of Dust Events in China from 2015 to 2020" Atmosphere 12, no. 8: 952. https://0-doi-org.brum.beds.ac.uk/10.3390/atmos12080952
Note that from the first issue of 2016, this journal uses article numbers instead of page numbers. See further details here.