
Defining Heatwaves with Respect to Human Biometeorology. The Case of Attica Region, Greece


1
Research Centre for Atmospheric Physics and Climatology, Academy of Athens, 106 79 Athens, Greece
2
Laboratory of Climatology and Atmospheric Environment, Department of Geology and Geoenvironment, National and Kapodistrian University of Athens, 157 84 Athens, Greece
3
Biomedical Research Foundation, Academy of Athens, 115 27 Athens, Greece
4
Navarino Environmental Observatory, 240 01 Messinia, Greece
5
Mariolopoulos-Kanaginis Foundation for the Environmental Sciences, 106 75 Athens, Greece
*
Author to whom correspondence should be addressed.
Atmosphere 2021, 12(9), 1100; https://0-doi-org.brum.beds.ac.uk/10.3390/atmos12091100
Submission received: 28 July 2021
/
Revised: 12 August 2021
/
Accepted: 23 August 2021
/
Published: 25 August 2021
(This article belongs to the Section Biometeorology)
Abstract
:To date, due to climate change, heatwaves are more frequent, with greater intensity and duration resulting in deleterious impacts on human health. To be able to manage heatwaves and quantify the impacts on human health, it is crucial to define them and implement policy preventive measures. However, heatwaves are relative to the climate of a location: The same meteorological conditions can constitute a heatwave in one place but not in another. Due to different climatic conditions, social characteristics, and adaptation, heatwaves should be defined on a local scale, which poses difficulties when it comes to comparison of different definitions. The aim of the present study is to define heatwaves, implementing robust statistical analysis for three different indicators (temperature, physiological equivalent temperature (PET), and universal thermal climate index (UTCI)) for three causes of mortality (i.e., cardiological and respiratory mortality and cardiorespiratory mortality) using Attica (Greece) as a case study. Our results define a heatwave for Attica as a period of at least 3 days when the mean temperature is higher than the 97.5th percentile. Afterwards, we encapsulate the harvesting effect by implementing robust statistical analysis, using the Superposed Epoch analysis. Consequently, quantifying heatwaves is crucial so as to create early warning systems and prevent avoidable mortality.
1. Introduction
As climate change evolves, the frequency, duration, and intensity of extreme events will be amplified in the foreseeable future. Extreme events (such as heatwaves and cold spells) are shown to have devastating effects on mortality in moderate climates [1], as well as Mediterranean climates [2]. Summer of 2003 provided evidence of the relationship between temperature and all causes of mortality [3,4]. As a result, it is crucial to define heatwaves in order to be able to quantify them. Nonetheless, to date, among academics, there is no universal and unequivocally accepted definition for heatwaves since heatwaves remain “imprecisely defined events” [5]. Usually, a combination of critical temperature and lag effect provides a definition for heatwaves. Arguably, it is very hard to provide an internationally consistent definition, as climate and bioclimate, socio-demographic characteristics, population acclimatization, and adaptation illustrate a large diversity across different regions [6,7,8]. Moreover, definitions based on assumptions about temperature may lead to wrong conclusions, since similar temperatures can have different impacts depending on the duration, intensity, and timing of an event, as well as the acclimatization status of the population from one country to another. Likewise, different biometeorological indices are taken into account in order to define or forecast heatwaves [9]. Additionally, there is not a universally accepted statistical procedure in order to define a heatwave, since the variety of the criteria makes it difficult to determine universal thresholds of any climate [10]. The variety of definitions poses some obvious difficulties when it comes to comparing and assessing the effectiveness of these definitions at different time horizons (past or future). Furthermore, future projections of heatwaves include different parameters, for instance, summer days, tropical days and nights, maximum air temperature, etc. [9].
In meteorological terms, a heatwave is “an extended period of days with higher than normal temperatures” [11]. Different definitions using different durations are proposed throughout the years (see inter alia [12,13,14]). Using a critical temperature, heatwave days can be defined as “the days when the daily maximum temperature exceeds 32 °C for at least 3 continuous days” [15] (p. 7338), while using percentiles, heatwaves can be defined as the “95th percentile of mean temperature for 2 or more consecutive days in the summer season” [16] (p. 1) or as “temperatures at the 99.5th percentile or higher and 2 days duration or longer” [17] (p. 6). However, other definitions consider a heatwave as “a spell of at least 6 consecutive days with maximum temperatures exceeding the local 90th percentile” [18] (p. 399), or as “a period of at least 3 days where the combined effect of excess heat and heat stress are unusual with respect to the local climate” [5] (p. 13). A heatwave event should be analyzed based on the following characteristics: Duration, intensity, timing, frequency, and spatial extent [19]. However, it is difficult to define heatwave intensity [19].
Numerous studies highlight that while a heatwave is a meteorological event, it cannot be scrutinized without reference to human health impacts [20,21]. To that extent, the synergy of weather elements linked to human sensation, as well as the effects of duration and intensity must be captured by appropriate thresholds. Temperature thresholds are defined as the thresholds at which the harmful effects of ambient heat appear as health outcomes [22]. It is critical to define a tipping point closely related to the definition of heatwave, after which effects on human health increase rapidly [14]. These thresholds should take into account both daytime high and overnight low values along with the climatic variability of the area under study due to the cumulative build-up effect of the heat load [20]. In this respect, day- and night-time conditions are equally important for understanding the health effects of heatwaves [21]. Another definition of a heatwave implies that it is “an extended period of unusually high atmosphere-related heat stress, which causes temporary modifications in lifestyle, and which may have adverse health consequences for the affected population” [20] (p. 763). However, there is no standard public health definition of heat-related illnesses and mortality, due to the complex interactions between climatic conditions and the health impacts [23]. Hence, defining a heatwave based on human health is a complicated and multifactorial issue.
The aftermath of a heatwave is another major challenge. Harvesting effect, also known as displacement effect or short-term mortality displacement, refers to the phenomenon where a specific exposure (for instance, temperature) impacts already frail population or individuals leading to excess mortality [24]. During a heatwave event, excess mortality is observed mainly in individuals whose health is already compromised [21]. Additionally, after a heatwave episode lower-than-expected (below normal levels) mortality is sometimes observed [21,25]. However, to date, no robust methods of quantification of the harvesting effect are developed, resulting in an uncertain proportion of harvesting mortality, since most studies that examine heatwaves do not report the harvesting effect, either due to the fact that they overlook it or it occurs infrequently [25]. Since the harvesting effect is not reported in many studies, it is difficult to draw robust conclusions or compare the methodological framework concerning the displacement effect from different studies.
The most significant bottleneck concerning an accurate definition of heatwaves is the fact that the effects of heatwaves vary greatly in geographical terms and are heterogeneous across different regions. Different climatic zones provide different definitions concerning a heatwave. Additionally, optimal temperature indicators and indices may vary across different cities as well as age groups. Moreover, there is not one optimal temperature predictor known as the best explanatory variable of mortality [26]. At the same time, different measures of a variable (for instance, mean and maximum temperature) provide different conclusions. Key components to a robust definition of heatwaves are the indices taken into account (temperature, humidity, health impacts (mortality, morbidity), heatwave duration and intensity) that shape different definitions. Moreover, in research studies that combine heatwaves and health effects, distinct attention should be paid on the different categorization of diseases, gender, and age groups. Numerous studies consider different causes of deaths (for instance, cardiological, cerebrovascular, respiratory, all-causes, etc.) providing different definitions. Consequently, comparison of different definitions and evaluation of possible future consequences are not straightforward processes.
The aim of the present study is to define a heatwave using Attica (Greece) as a case study. In order to do so, we use data concerning temperature, thermal indices (i.e., PET and UTCI), and mortality (cardiological and respiratory mortality), as well as two different durations: heatwaves duration greater than or equal to 2 and 3 days. We use cardiorespiratory mortality since these causes are among the leading causes of temperature-related mortality [27]. Correspondingly, we use two thermal indices (PET and UTCI) since they provide information to individuals as a means to adjust and adapt their behaviours to the outdoor environment [28]. Moreover, in order to capture the aftermath of a heatwave (i.e., the harvesting effect), we use the superposed Epoch analysis (SEA), a robust non-parametric statistical tool, for the different causes of mortality under examination, considering a heatwave duration of at least 2 and 3 days. To our knowledge, this is the first study that defines heatwaves using three causes of mortality and numerous different indices for the Attica region.
2. Materials and Methods
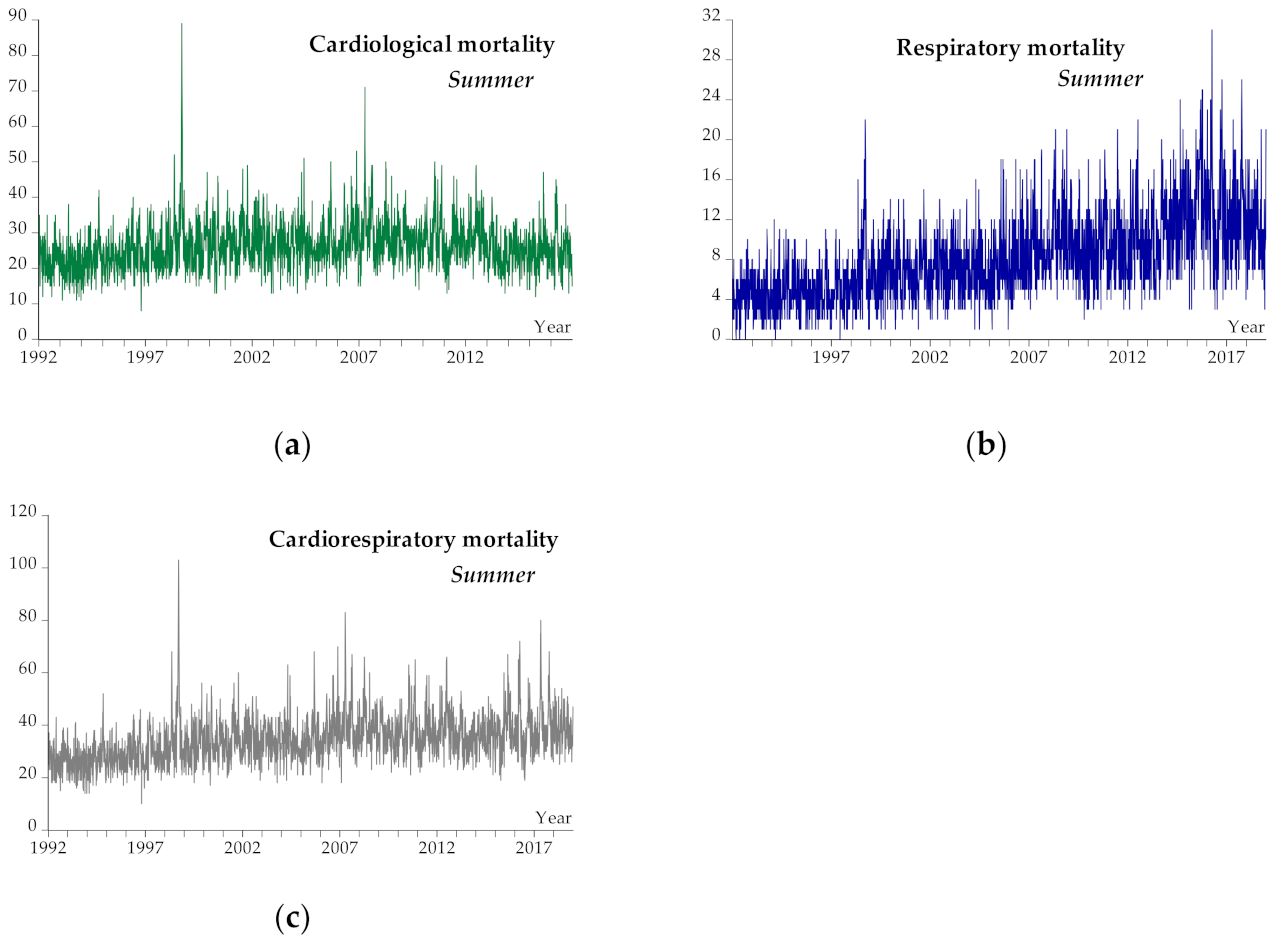
Attica, which concentrates half of Greece’s population, is the case study. The aim of the present study is to define a heatwave using data concerning temperature (mean and maximum), thermal indices (mean and maximum physiological equivalent temperature (PET), mean and maximum universal thermal climate index (UTCI)), and mortality (cardiological, respiratory, and cardiorespiratory mortality). We collect the respective data concerning cardiological and respiratory mortality on a daily basis from the Hellenic Statistical Authority (https://www.statistics.gr/en/home/ accessed on 22 August 2021). We define cardiorespiratory mortality as the sum of deaths attributed to cardiological and respiratory diseases. The period under examination is from 1 January 1992 to 31 December 2016 (9.132 days). We focus on summer since that is the period when heatwaves take place, and we define summer as the period that includes June, July, and August. The data concern mortality and not morbidity, since mortality data are the most regularly collected, organized, and standardized data, unlike hospital admissions where the reports lack consistency and may depend on each country’s health system.
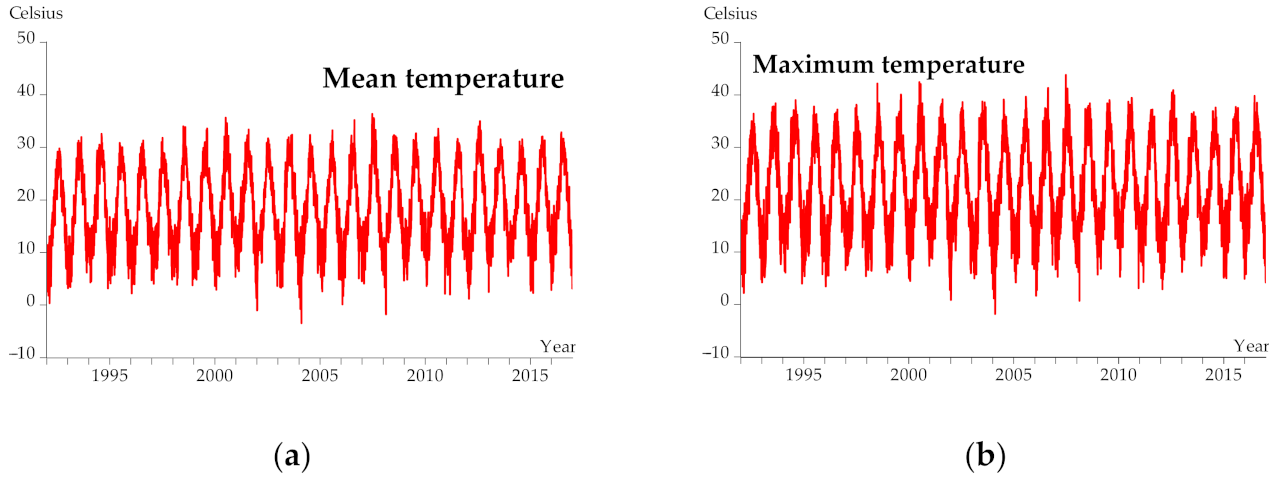
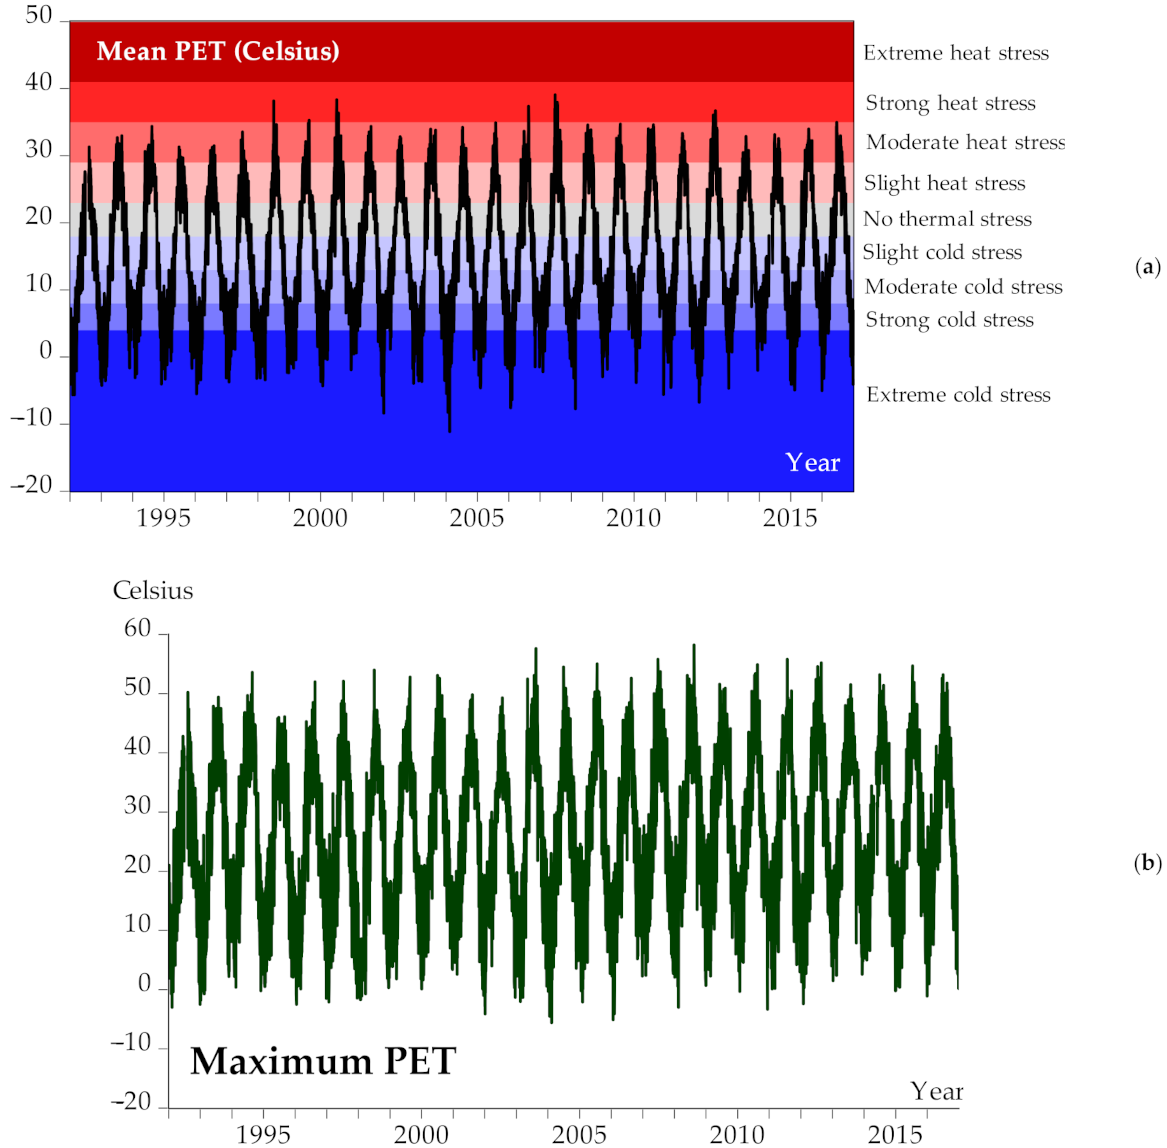
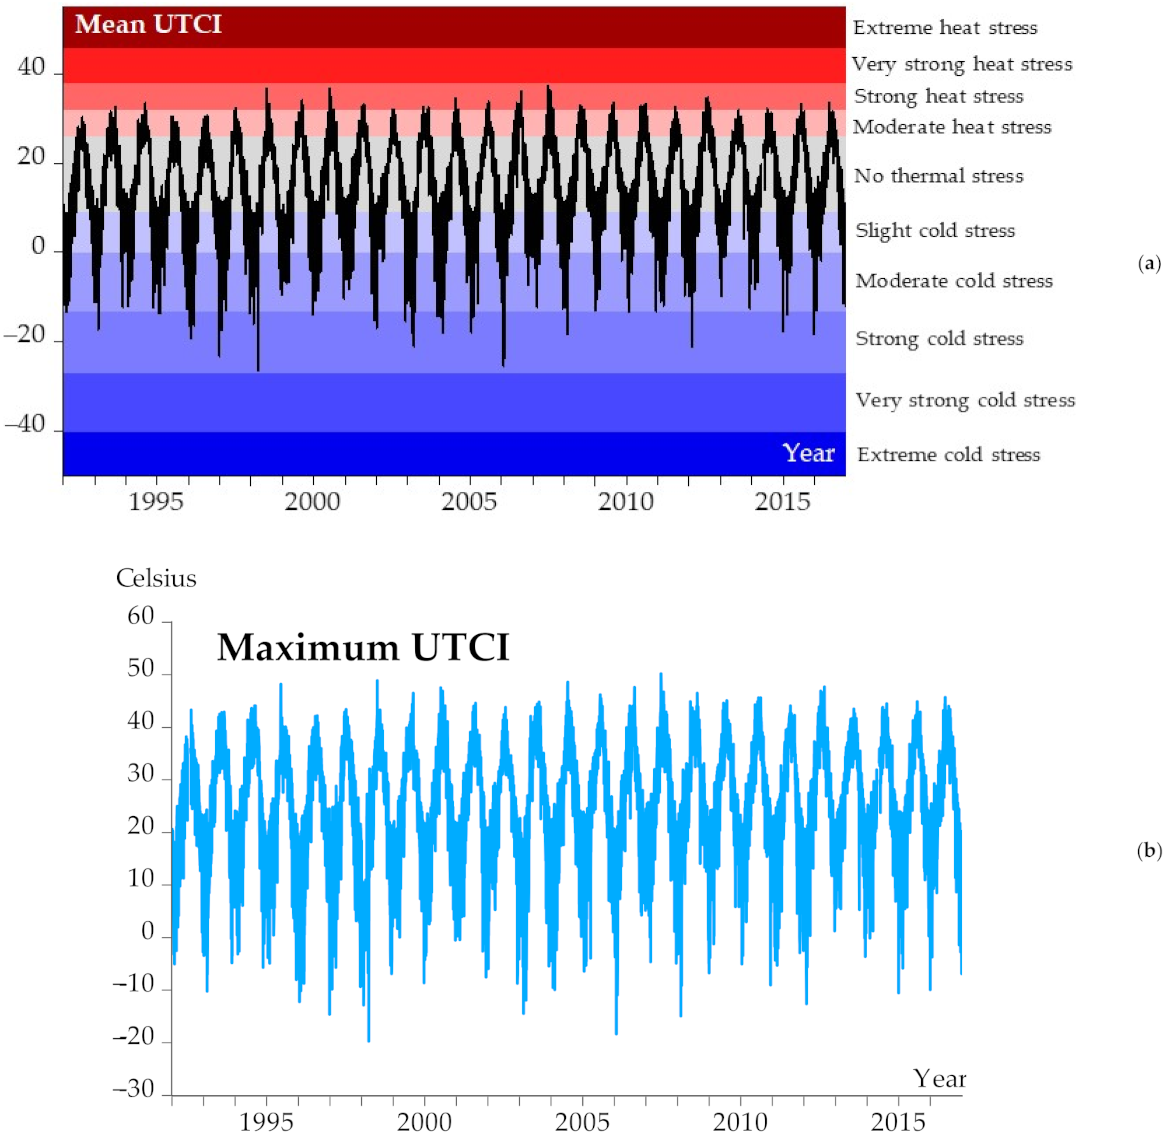
Data on hourly temperature for the same period (i.e., from 1 January 1992 to 31 December 2016) are obtained from the National Observatory of Attica (https://www.noa.gr/en/ accessed on 22 August 2021) The data are then converted into daily observations of mean and maximum temperature and for the period under examination (i.e., summer) are presented in Figure 2. The physiological equivalent temperature (PET) (Figure 3) and universal thermal climate index (UTCI) (Figure 4) are calculated with the RayMan model [29,30]. We use temperature, PET, and UTCI since they are in close relationship with mortality [31].
In order to define a heatwave for different causes of mortality and different indices, we use three indices (temperature, PET, and UTCI) and we apply five different percentiles of them (90, 92.5, 95, 97.5, and 99th). By comparing the indices, we investigate the optimal index to accurately depict their impact on mortality. Additionally, we examine the duration of a heatwave using a duration of at least 2 and 3 days, respectively.
After the data collection, we calculate the percentiles for heatwaves for the different indices (i.e., temperature, PET, and UTCI). In order to create a robust definition of a heatwave, we use six indicators: Two temperature indicators (mean and maximum temperature), two PET indicators (mean and maximum PET), and two UTCI indicators (mean and maximum UTCI). Five percentiles are used (90, 92.5, 95, 97.5, and 99th) for each index and two durations of a heatwave event (greater than or equal to 2 and 3 days, respectively). In other words, for each percentile, three binary variables are created:
- A binary variable to capture if a percentile exceedance exists for each index (i.e., temperature, PET, and UTCI), with “0” signifying non-exceedance and “1” signifying exceedance of the percentile value, and
- Two binary heatwave variables, with “0” representing non-heatwave day and “1” representing heatwave day for durations that are greater than or equal to 2 and 3 days, respectively.
Moreover, in order to depict the aftermath of the heatwave event (harvesting effect) and encapsulate the harvesting effect, we use a lag effect (from day 0 to the 10th day of the event). The lag effect is used for two reasons: (1) To run the sensitivity analysis to test different lag effects after an event, and (2) to test when the heatwave effect is stronger on mortality (which day during or after the event) and capture whether there is an aftermath mortality (i.e., the harvesting effect).
In order to remove the seasonality element, an annualized change is implemented. The next step is to run a regression analysis between the binary heatwave variable for each index (i.e., temperature, PET, and UTCI) and the time series concerning mortality due to cardiological, respiratory, and cardiorespiratory diseases. Since we try to optimally describe and define a heatwave, computed by the regression analysis, the R-squared (R2) interprets to what extent the variance of the heatwave variable explains the variance of the mortality. Lastly, in order to quantify the harvesting effect, we run a robust statistical analysis using the superposed Epoch analysis (SEA) as a means to observe when mortality peaks using different temperature percentiles. In the present section, the null H0 and the alternative H1 hypotheses are as follows:
Hypothesis 1.
For cardiological mortality:
where is the mean value, is the cardiological mortality, and is the mean value at the zero-crossing point.
Hypothesis 2.
For respiratory mortality:
where is the mean value, is the respiratory mortality, and is the mean value at the zero-crossing point.
Hypothesis 3.
For cardiorespiratory mortality:
where is the mean value, is the cardiorespiratory mortality, and is the mean value at the zero-crossing point.
The data used concern the mean temperature and cardiological, respiratory, and cardiorespiratory (i.e., the sum of cardiological and respiratory). The SEA runs for a window that spans for 15 days before and 15 days after an event occurs. Day 0 is the day that the heatwave event begins (i.e., the day that the mean temperature exceeds the value of a certain percentile).
3. Results
Figure 1 presents the data concerning the three different causes of mortality taken into account (i.e., cardiological, respiratory, and cardiorespiratory mortality) during summer months (i.e., June, July, and August).
Figure 2 presents the graphs for temperature, while Figure 3 and Figure 4 show the physiological equivalent temperature (PET) and universal thermal climate index (UTCI), respectively.
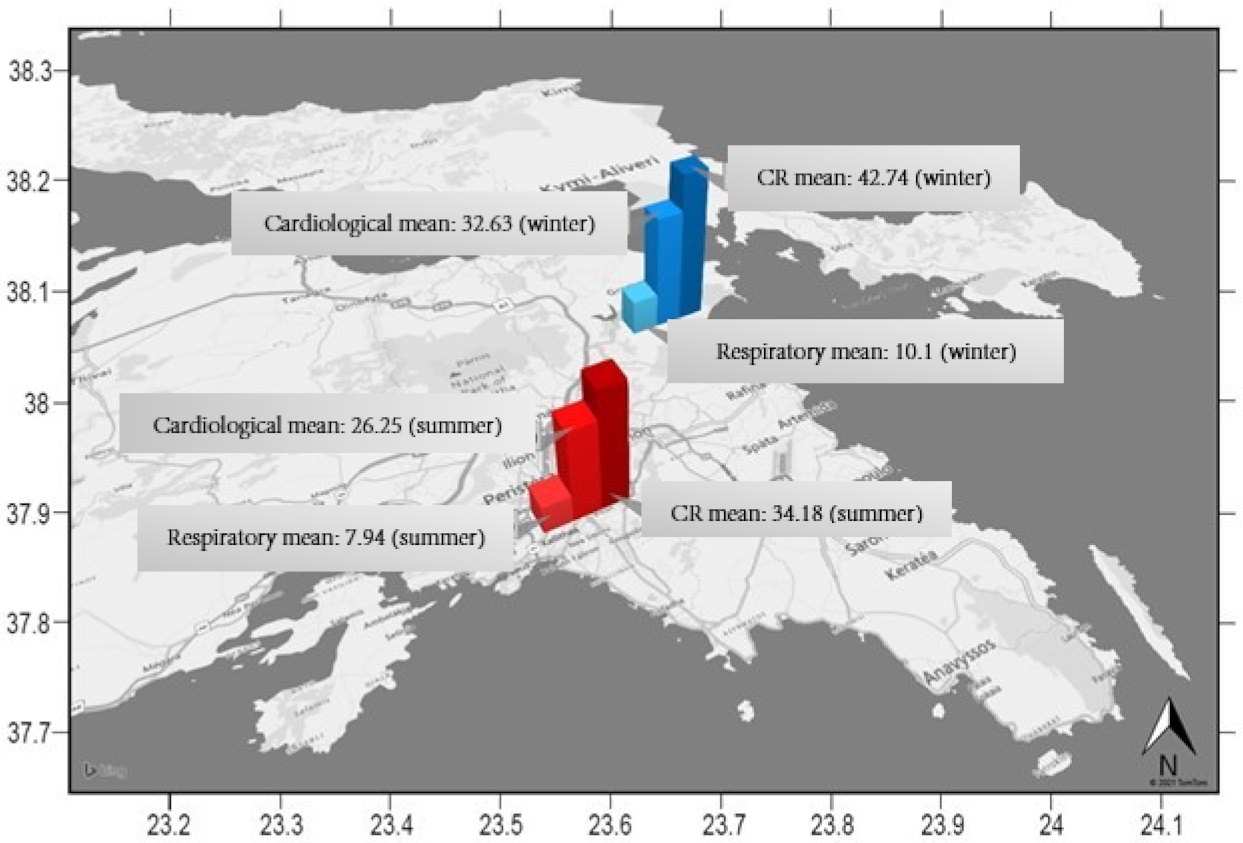
In order to define heatwaves for the case of Attica, six indicators (mean and maximum temperature, mean and maximum PET, and mean and maximum UTCI), five percentiles (90, 92.5, 95, 97.5, and 99th) and two durations of the heatwave event (greater than or equal to 2 and 3 days) are used. Table 1 presents the descriptive statistics concerning mortality for two different seasons, i.e., winter and summer (specifically, winter months are December, January and February, while summer months are June, July and August). As shown, mortality for all the causes under examination in the present paper, is higher in winter compared to summer, when it comes to minimum and mean values. Our results agree with previous studies in the relevant literature [4,32]. Nonetheless, during summer, the maximum values of cardiological and cardiorespiratory mortality is higher than the respective values during winter.
For a detailed representation of the causes of mortality under examination, the table above is presented as a map of Attica (Figure 5) for the winter and summer season.
After data collection, we calculate five different percentiles (i.e., 90, 92.5, 95, 97.5, and 99th) for the indices taken into account (i.e., temperature, PET, and UTCI). Table 2 presents the values of the different percentiles for the six indicators.
Table 3 and Table 4 illustrate the number of days and the number of events for different percentiles for mean and maximum temperature, mean and maximum PET, and mean and maximum UTCI and for two different heatwave durations (i.e., 2 and 3 days). As expected, the number of days and events increases at low values of percentiles, while decreasing for high values of percentiles. Furthermore, it is evident that using different percentiles the number of days and events change, as well. Hence, the different definitions of heatwaves provide different results.
After the running regression analysis for the indicators mentioned above, the most accurate indicator is the mean value rather than the maximum for all three variables. Additionally, the optimal percentile is the 97.5th with the higher R-squared values for all three indices. Concerning the aftermath effect, the higher R-squared is observed 5 days after the event and at the cardiorespiratory mortality as the cause of death. More specifically, the values for R2, 5 days after the event for the 97.5th percentile are equal to 0.044 for mean temperature, 0.039, for mean PET, and 0.033 for mean UTCI. In conclusion, the optimal and more robust definition of a heatwave for the case of Attica, concerning this analysis is “a period of at least 3 days when mean temperature is higher than the 97.5th percentile”. After defining a heatwave, we use the Superposed Epoch Analysis, a non-parametric statistical technique, using different percentiles of mean temperature, since as we show it is the optimal index to define a heatwave event and according to [17], it may best reflect heat stress For our estimation, the confidence interval is constructed using the preferred percentiles of the empirical distribution for a large number of resampled values. In particular, we use 10,000 resamples to construct the 95% confidence interval. Since our interest concentrates on the 15 days before and after an event, the superposed Epoch analysis constructs 10.000 randomly selected samples of size equal to 31 observations, which in turn are used to calculate the mean, the standard deviation, and finally, the confidence interval. The resampling method used in our analysis to construct the reported confidence intervals offer robustness for the results and thus minimizes the effects of data measurement errors.
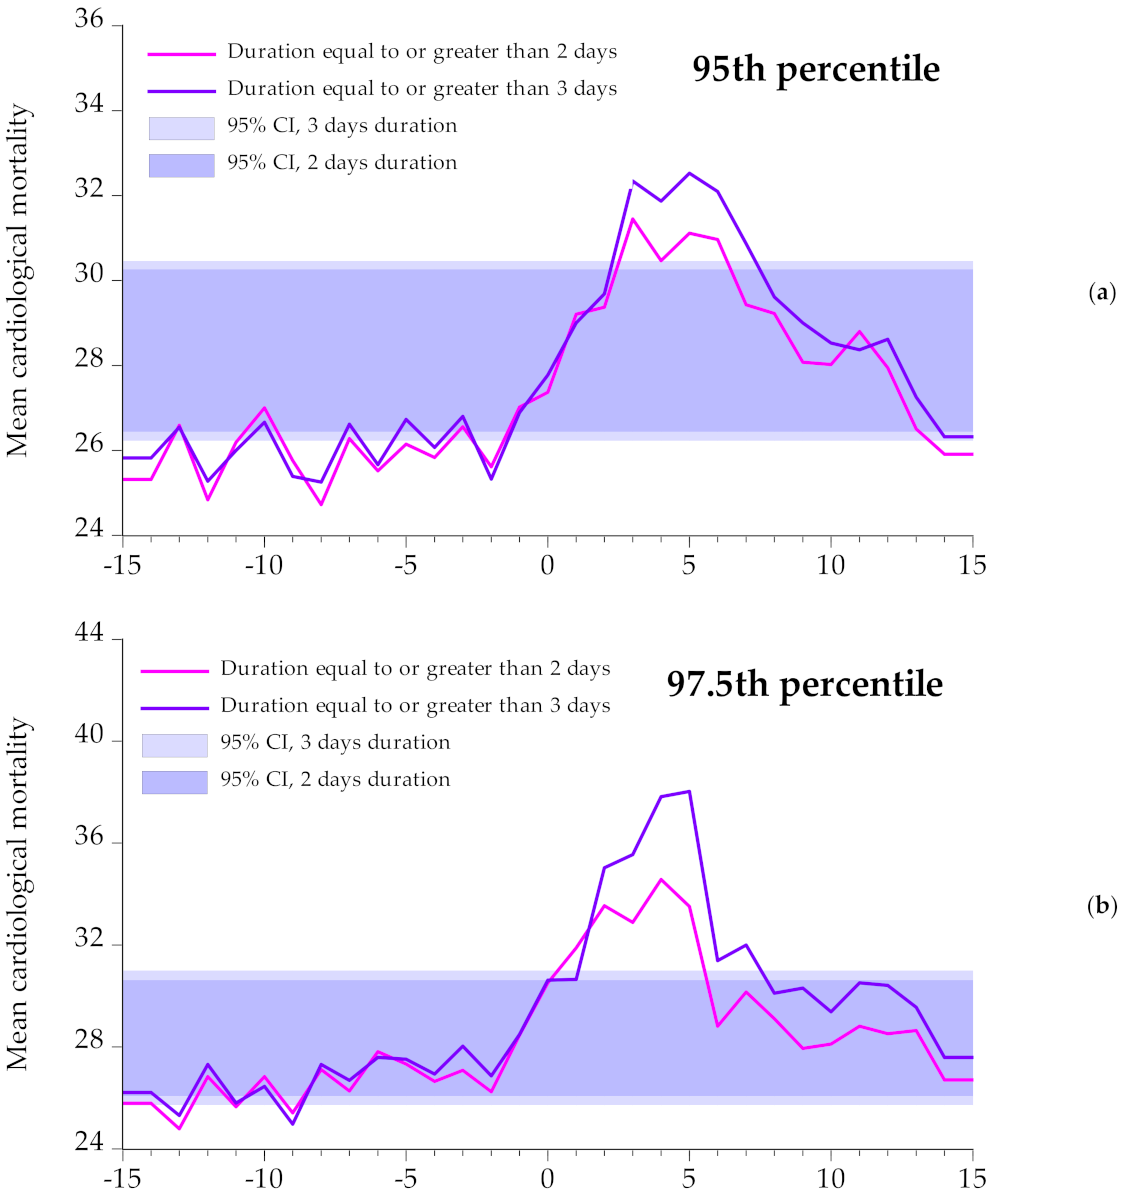
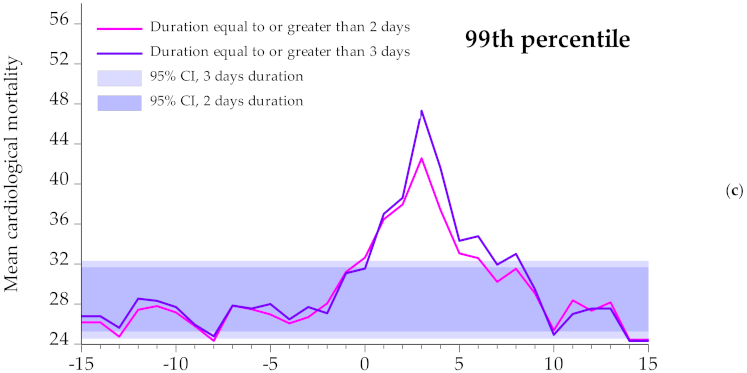
The results are shown in the figures below. Figure 6 illustrates the results of the Superposed Epoch Analysis for cardiological mortality for three different percentiles (i.e., 95, 97.5, and 99th) with the heatwave event duration greater than or equal to 2 and 3 days. As discussed in the Introduction section, different definitions of a heatwave provide different results. As demonstrated in Figure 6, for the 95th percentile and for a duration of at least 2 days, the peak value of cardiological mortality is equal to 31 in the third and fifth day of the event, while when we examine the duration of a heatwave event of at least 3 days, the peak value is equal to 33 in the fifth day of the event. Concerning the 97.5th percentile and for a duration of at least 2 days, the peak value is equal to 35 in the fourth day of the event, while for a duration of at least 3 days for the 97.5th percentile the peak value is equal to 38 in the fourth and fifth day of the event. Lastly, for the 99th percentile with a duration of at least 2 days, the peak value is equal to 43 in the third day of the event and for the 99th percentile with a duration of at least 3 days the peak value is equal to 47 in the third day of the event.
These results point out a harvesting effect of short-term mortality ranging from day 3 to 5 for different percentiles. Comparing the two different heatwave durations, it is evident that by defining different percentile thresholds and different durations, there are different impacts on cardiological mortality. However, the results shown highlight that for the 99th percentile the highest values are in the third day for both durations, while for the rest of the percentiles the peak values range from the third to the fifth day.
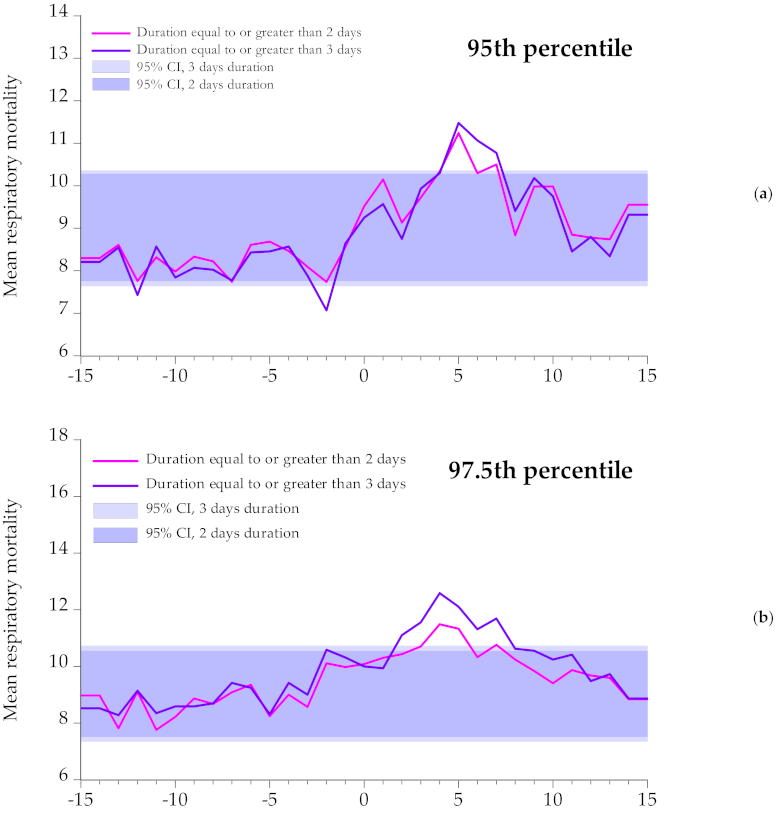
Figure 7 depicts the results of the superposed Epoch analysis for respiratory mortality for three different percentiles (i.e., 95, 97.5, and 99th) with the heatwave event duration of 2 and 3 days. For the 95th percentile and a duration of a heatwave of at least 2 days, the peak value is equal to 11 in the fifth and seventh day of the event, while for a duration of at least 3 days, the peak value is equal to 11 in the fifth day of the event. For the 97.5th percentile and a duration of at least 2 days, the peak value is equal to 11 in the fourth day of the event, while for a duration of at least 3 days the peak value is equal to 12 in the fourth day of the event. Lastly, for the 99th percentile for a duration of at least 2 days, the peak value is equal to 14 in the fourth day of the event, while for a duration of at least 3 days, the peak values are equal to 14 in the third day of the event. These results illustrate a harvesting effect of short-term mortality ranging from day 3 to 5 for different percentiles. Again, by defining a heatwave event based on different percentiles and different duration, there are different impacts on the respiratory mortality.
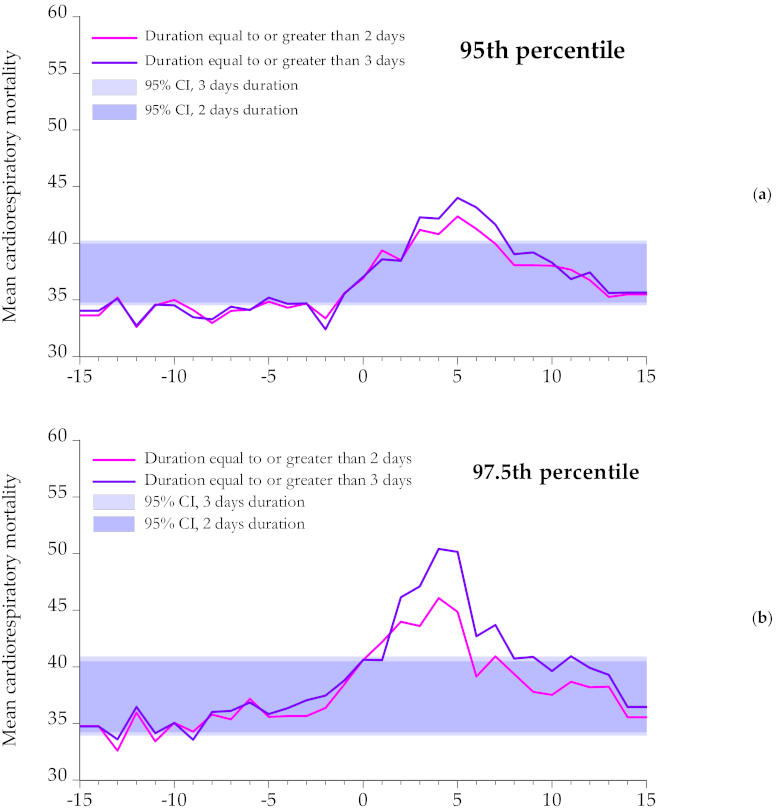
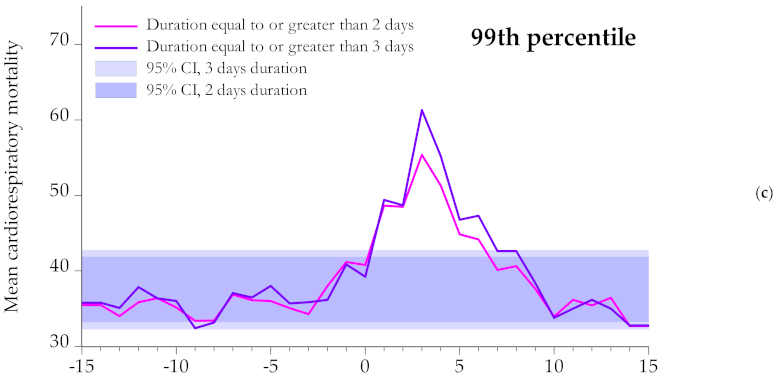
Figure 8 depicts the results of the superposed Epoch analysis for cardiorespiratory mortality for three different percentiles (i.e., 95, 97.5, and 99th) with the heatwave event duration greater than or equal to 2 and 3 days. For the 95th percentile and for a duration of a heatwave event of at least 2 days, the peak value is equal to 42 in the fifth day of the event, while for a duration of at least 3 days, for the 95th percentile the peak value is equal to 44 in the fifth day of the event. Concerning the 97.5th percentile and a duration of at least 2 days, the peak value is equal to 46 in the fourth day of the event, while for a duration of at least 3 days the peak value is equal to 50 in the fourth and fifth day of the event. Lastly, for the 99th percentile and a duration of a heatwave event of at least 2 days, the peak value is equal to 55 in the third day of the event, while for a duration of at least 3 days the peak value is equal to 61 in the third day of the event. These results illustrate a harvesting effect of short-term mortality ranging from day 3 to 5 for different percentiles.
Comparing the results of the two different durations taken into account, it is evident that by defining different percentile thresholds and different durations, there are different impacts on cardiorespiratory mortality.
4. Discussion
As the intensity, duration, and frequency of heatwaves increase, it is imperative to define heatwaves. Due to the fact that heatwaves are relative to the climate of a location: The same meteorological conditions can constitute a heatwave in one place but not in another, heatwaves should be defined on a local scale. The aim of the present study is to define heatwaves implementing robust statistical analysis using Attica as a case study, for three different variables (i.e., temperature, PET, and UTCI), three causes of mortality (i.e., cardiological, respiratory, and cardiorespiratory mortality), in order to select the optimal indicator that precisely represents a heatwave. Five percentiles are created (90, 92.5, 95, 97.5, and 99th) for each indicator and two different durations (greater than or equal to 2 and 3 days, respectively) are taken into account. In conclusion, for Attica the optimal heatwave definition is “a period of at least 3 days when mean temperature is higher than the 97.5th percentile”. Afterwards, we use the Superposed Epoch analysis as a non-parametric technique, so as to capture the aftereffect of a heatwave. Specifically, our model runs for 30 days (15 days before and 15 days after a heatwave event). Day 0 is defined as the first day of an event. The model runs for three different temperature percentiles (since we prove that the mean temperature is the optimal indicator to define a heatwave for Attica), two different durations (equal to or greater than 2 and 3 days), and three causes of mortality (cardiological, respiratory, and cardiorespiratory). Our results from using the superposed Epoch analysis, show a short-term mortality that varies depending on different percentiles and different causes of mortality. It is critical to borne in mind that by defining the different percentile thresholds and different durations, there are different impacts on mortality.
5. Conclusions
Heatwaves and human health are inextricably linked. Defining a heatwave on a local scale is crucial for policy measures so as to forecast a heatwave event, predict possible outcomes, and prevent the consequences of upcoming heatwaves. After several devastating heatwave events, the need to develop effective coping mechanisms and accurate surveillance to reduce the risk and avoid premature deaths is critical. Past heatwave experiences can be used as a road map to the unpredictable future. Arguably, different meteorological thresholds require different actions for different population groups. Hence, our objective in the present paper is to define a heatwave using the impact of heatwaves on human health. The point often overlooked is the setting of a threshold in order to activate a health response. For instance, a high threshold would initiate response to the most extreme heatwave events not taking into account the majority of heat-related mortality on less extreme days [30]. Moreover, the combination of elevated ambient temperature, relative humidity, and air pollution may amplify the effects on human health. Heatwave early warning systems are effective measures to reduce the effects on human health and reduce mortality and morbidity, especially on frail populations. Early alert systems are based on temperature and humidity thresholds. They link meteorological forecasts to public health interventions. The principal parameters of an early warning system contain forecasting and identification of a heatwave event, prediction of the possible health outcomes, an effective and timely response plan, and an ongoing updated evaluation of the system and its components [33].
Preventive policy measures and alert systems operate on a national scale. Since heatwaves are defined at a local level, early warning systems are implemented at a local scale, as well. Hence, they vary widely in structure and different characteristics are taken into account. The effective collaboration of meteorological organizations and public health authorities is critical as a means to prevent excess mortality and morbidity. Weather forecasting and surveillance are key public health activities since they can predict whether an event is associated to health effects. Additionally, emergency public health interventions should always be updated and ready to interfere. Public health warnings should be disseminated to all age groups. Dissemination in a time effective manner and public education and awareness strategies are essential parts of a warning system. Nevertheless, tailoring messages for specific groups (for instance, frail populations and low-socio-economic populations) in an early warning system is a significant driver to address the public. As a consequence, a basic understanding and evaluation of human behaviour and susceptibility should be developed in order to achieve the optimal and most sufficient dissemination. In all cases, frequent, systematic, and effective evaluation of a heatwave early warning system and public health intervention is needed. Nonetheless, there are limitations and difficulties concerning the quantitative and qualitative assessment and evaluation of the effectiveness of warning systems as a whole or of individual intervention actions.
Author Contributions
Conceptualization, L.D., P.N. and C.Z.; methodology, L.D., P.N. and C.Z.; software, L.D.; formal analysis, L.D., P.N. and C.Z.; investigation, L.D.; resources, C.Z.; data curation, L.D.; writing—original draft preparation, L.D.; writing—review and editing, P.N. and C.Z.; visualization, L.D.; supervision, P.N. and C.Z.; project administration, C.Z.; funding acquisition, C.Z. All authors have read and agreed to the published version of the manuscript.
Funding
This research was funded by the Mariolopoulos-Kanaginis Foundation for the Environmental Sciences.
Institutional Review Board Statement
Not applicable.
Informed Consent Statement
Not applicable.
Data Availability Statement
Not applicable.
Acknowledgments
The authors are grateful to the reviewers for many valuable suggestions, which helped improve the quality of the manuscript.
Conflicts of Interest
The authors declare no conflict of interest.
References
- Saucy, A.; Ragettli, M.S.; Vienneau, D.; de Hoogh, K.; Tangermann, L.; Schäffer, B.; Röösli, M. The role of extreme temperature in cause-specific acute cardiovascular mortality in Switzerland: A case-crossover study. Sci. Total Environ. 2021, 790, 147958. [Google Scholar] [CrossRef] [PubMed]
- López-Bueno, J.A.; Navas-Martín, M.A.; Linares, C.; Mirón, I.J.; Luna, M.Y.; Sánchez-Martínez, G.; Díaz, J. Analysis of the impact of heat waves on daily mortality in urban and rural areas in Madrid. Environ. Res. 2020, 195, 110892. [Google Scholar] [CrossRef]
- Le Tertre, A.; Lefranc, A.; Eilstein, D.; Declercq, C.; Medina, S.; Blanchard, M.; Ledrans, M. Impact of the 2003 heatwave on all-cause mortality in 9 French cities. Epidemiology 2006, 17, 75–79. [Google Scholar] [CrossRef]
- Rodrigues, M.; Santana, P.; Rocha, A. Modelling of Temperature-Attributable Mortality among the Elderly in Lisbon Metropolitan Area, Portugal: A Contribution to Local Strategy for Effective Prevention Plans. J. Urban Health 2021, 98, 516–531. [Google Scholar] [CrossRef] [PubMed]
- Nairn, J.; Fawcett, R. Defining Heatwaves: Heatwave Defined as a Heat-Impact Event Servicing All Communiy and Business Sectors in Australia; CSIRO and the Bureau of Meteorology: Melbourne, Australia, 2013; CAWCR Technical Report No. 060. [Google Scholar]
- Tong, S.; FitzGerald, G.; Wang, X.Y.; Aitken, P.; Tippett, V.; Chen, D.; Guo, Y. Exploration of the health risk-based definition for heatwave: A multi-city study. Environ. Res. 2015, 142, 696–702. [Google Scholar] [CrossRef] [PubMed]
- Xu, Z.; FitzGerald, G.; Guo, Y.; Jalaludin, B.; Tong, S. Impact of heatwave on mortality under different heatwave definitions: A systematic review and meta-analysis. Environ. Int. 2016, 89–90, 193–203. [Google Scholar] [CrossRef]
- Nastos, P.T.; Matzarakis, A. Human bioclimatic conditions, trends, and variability in the athens university campus, Greece. Adv. Meteorol. 2013, 2013, 976510. [Google Scholar] [CrossRef]
- Nastos, P.T.; Kapsomenakis, J. Regional climate model simulations of extreme air temperature in Greece. Abnormal or common records in the future climate? Atmos. Res. 2015, 152, 43–60. [Google Scholar] [CrossRef]
- Perkins, S.E.; Alexander, L.V. On the measurement of heat waves. J. Clim. 2013, 26, 4500–4517. [Google Scholar] [CrossRef]
- Kenney, W.L.; Craighead, D.H.; Alexander, L.M. Heat waves, aging, and human cardiovascular health. Med. Sci. Sport Exerc. 2015, 46, 1891–1899. [Google Scholar] [CrossRef] [Green Version]
- Kuglitsch, F.G.; Toreti, A.; Xoplaki, E.; Della-Marta, P.M.; Zerefos, C.S.; Türkeş, M.; Luterbacher, J. Heat wave changes in the eastern mediterranean since 1960. Geophys. Res. Lett. 2010, 37, 1–5. [Google Scholar] [CrossRef] [Green Version]
- D’Ippoliti, D.; Michelozzi, P.; Marino, C.; de’Donato, F.; Menne, B.; Katsouyanni, K.; Perucci, C.A. The impact of heat waves on mortality in 9 European cities: Results from the EuroHEAT project. Environ. Health A Glob. Access Sci. Source 2010, 9, 37. [Google Scholar] [CrossRef] [Green Version]
- Park, J.; Kim, J. Defining heatwave thresholds using an inductive machine learning approach. PLoS ONE 2018, 13, e0206872. [Google Scholar] [CrossRef]
- Dong, W.; Liu, Z.; Zhang, L.; Tang, Q.; Liao, H.; Li, X. Assessing heat health risk for sustainability in Beijing’s urban heat island. Sustainability 2014, 6, 7334–7357. [Google Scholar] [CrossRef] [Green Version]
- Tong, S.; Wang, X.Y.; Yu, W.; Chen, D.; Wang, X. The impact of heatwaves on mortality in Australia: A multicity study. BMJ Open 2014, 4, 1–6. [Google Scholar] [CrossRef] [PubMed] [Green Version]
- Anderson, B.G.; Bell, M.L. Weather-Related Mortality: How Heat, Cold, and Heat Waves Affect Mortality in the United States. Epidemiology 2009, 20, 205. [Google Scholar] [CrossRef] [PubMed] [Green Version]
- Fischer, E.M.; Schär, C. Consistent geographical patterns of changes in high-impact European heatwaves. Nat. Geosci. 2010, 3, 398–403. [Google Scholar] [CrossRef]
- Royé, D.; Codesido, R.; Tobías, A.; Taracido, M. Heat wave intensity and daily mortality in four of the largest cities of Spain. Environ. Res. 2020, 182, 109027. [Google Scholar] [CrossRef] [PubMed]
- Robinson, P.J. On the definition of a heat wave. J. Appl. Meteorol. 2001, 40, 762–775. [Google Scholar] [CrossRef]
- WMO; WHO. Heatwaves and Health: Guidance on Warning-System Development; World Meteorological Organization (WMO): Geneva, Switzerland, 2015; WMO, No. 1142. [Google Scholar]
- Dutta, A.; Bhattacharya, S.; Ak, K.; Pati, S.; Swain, S.; Nanda, L. At which temperature do the deleterious effects of ambient heat ‘kick-in’ to affect all-cause mortality? An exploration of this threshold from an eastern Indian city. Int. J. Environ. Health Res. 2020, 30, 187–197. [Google Scholar] [CrossRef]
- Montero, J.C.; Miron, I.J.; Criado, J.J.; Linares, C.; Díaz, J. Difficulties of defining the term, heat wave, in public health. Int. J. Environ. Health Res. 2013, 23, 377–379. [Google Scholar] [CrossRef]
- Basu, R.; Malig, B. High ambient temperature and mortality in California: Exploring the roles of age, disease, and mortality displacement. Environ. Res. 2011, 111, 1286–1292. [Google Scholar] [CrossRef]
- Åström, D.O.; Bertil, F.; Joacim, R. Heat wave impact on morbidity and mortality in the elderly population: A review of recent studies. Maturitas 2011, 69, 99–105. [Google Scholar] [CrossRef] [PubMed]
- Barnett, A.; Tong, S.; Clements, A. What Measure of Temperature is the Best Predictor of Mortality? Epidemiology 2009, 20, S13. [Google Scholar] [CrossRef] [Green Version]
- Iñiguez, C.; Royé, D.; Tobías, A. Contrasting patterns of temperature related mortality and hospitalization by cardiovascular and respiratory diseases in 52 Spanish cities. Environ. Res. 2021, 192. [Google Scholar] [CrossRef]
- Höppe, P. The physiological equivalent temperature—A universal index for the biometeorological assessment of the thermal environment. Int. J. Biometeorol. 1999, 43, 71–75. [Google Scholar] [CrossRef]
- Matzarakis, A.; Rutz, F.; Mayer, H. Modelling the thermal bioclimate in urban areas with the RayMan model. In Proceedings of the International Conference on Passive and Low Energy Architecture, Geneva, Switzerland, 6–8 September 2006. [Google Scholar]
- Matzarakis, A.; Muthers, S.; Rutz, F. Application and comparison of UTCI and pet in temperate climate conditions. Finisterra 2014, 49, 21–31. [Google Scholar] [CrossRef]
- Nastos, P.T.; Matzarakis, A. The effect of air temperature and human thermal indices on mortality in Athens, Greece. Theor. Appl. Climatol. 2012, 108, 591–599. [Google Scholar] [CrossRef]
- Rodrigues, M.; Santana, P.; Rocha, A. Effects of extreme temperatures on cerebrovascular mortality in Lisbon: A distributed lag non-linear model. Int. J. Biometeorol. 2019, 63, 549–559. [Google Scholar] [CrossRef] [PubMed]
- Ebi, K.L.; Schmier, J.K. A stitch in time: Improving public health early warning systems for extreme weather events. Epidemiol. Rev. 2005, 27, 115–121. [Google Scholar] [CrossRef] [PubMed] [Green Version]
Figure 1.
Graphs of mortality for Attica: (a) Graph of cardiological mortality during summer months; (b) graph of respiratory mortality during summer months; (c) graph of cardiorespiratory mortality during summer months.
Figure 1.
Graphs of mortality for Attica: (a) Graph of cardiological mortality during summer months; (b) graph of respiratory mortality during summer months; (c) graph of cardiorespiratory mortality during summer months.

Figure 2.
Temperature graphs of mortality for Attica: (a) Graph of mean temperature; (b) graph of maximum temperature.
Figure 2.
Temperature graphs of mortality for Attica: (a) Graph of mean temperature; (b) graph of maximum temperature.

Figure 3.
PET graphs of mortality for Attica: (a) Graph of mean PET; (b) graph of maximum PET.

Figure 4.
UTCI graphs of mortality for Attica: (a) Graph of mean UTCI; (b) graph of maximum UTCI.

Figure 5.
Map of mean values of cardiological, respiratory, and cardiorespiratory mortality (CR) for summer and winter for Attica. Note: The latitude and longitude coordinates are 37.983810 and 23.727539, respectively.
Figure 5.
Map of mean values of cardiological, respiratory, and cardiorespiratory mortality (CR) for summer and winter for Attica. Note: The latitude and longitude coordinates are 37.983810 and 23.727539, respectively.

Figure 6.
Superposed Epoch analysis for mortality due to cardiological diseases for duration of the heatwave event of at least 2 and 3 days: (a) 95th percentile; (b) 97.5th percentile; (c) 99th percentile. Notes: (i) The shaded area shows the 95% Confidence Interval (CI), (ii) the vertical axis measures the mean number of deaths due to cardiological diseases, (iii) the horizontal axis depicts the time 15 days before and 15 days after the heatwave event. Day 0 is the first day of the event.


Figure 7.
Superposed Epoch analysis for mortality due to respiratory diseases for duration of the heatwave event of at least 2 and 3 days: (a) 95th percentile; (b) 97.5th percentile; (c) 99th percentile. Notes: (i) The shaded area shows the 95% Confidence Interval (CI), (ii) the vertical axis measures the mean number of deaths due to respiratory diseases, (iii) the horizontal axis depicts the time 15 days before and 15 days after the heatwave event. Day 0 is the first day of the event.


Figure 8.
Superposed Epoch analysis for mortality due to cardiorespiratory diseases for duration of the heatwave event of at least 2 and 3 days: (a) 95th percentile; (b) 97.5th percentile; (c) 99th percentile. Notes: (i) The shaded area shows the 95% Confidence Interval (CI), (ii) the vertical axis measures the mean number of deaths due to cardiorespiratory mortality, (iii) the horizontal axis depicts the time 15 days before and 15 days after the heatwave event. Day 0 is the first day of the event.


Table 1.
Descriptive statistics for mortality (winter and summer).
| Mortality | Winter | Summer | ||||||
|---|---|---|---|---|---|---|---|---|
| Mean | Min. | Max. | Std. Deviation | Mean | Min. | Max. | Std. Deviation | |
| Cardiological | 32.63 | 15.00 | 70.00 | 6.72 | 26.25 | 8.00 | 89.00 | 6.87 |
| Respiratory | 10.10 | 1.00 | 36.00 | 5.00 | 7.94 | 0.00 | 31.00 | 4.19 |
| Cardiorespiratory | 42.74 | 20.00 | 96.00 | 9.26 | 34.18 | 10.00 | 103.00 | 8.94 |
Table 2.
Percentiles (Unit: °C).
| Percentiles | 90th | 92.5th | 95th | 97.5th | 99th |
|---|---|---|---|---|---|
| Mean Temperature | 28.67 | 29.23 | 30.00 | 31.00 | 32.15 |
| Max. Temperature | 33.89 | 34.60 | 35.41 | 36.60 | 38.01 |
| Mean PET | 28.61 | 29.50 | 30.58 | 31.39 | 33.46 |
| Max. PET | 43.00 | 43.97 | 45.50 | 47.79 | 50.00 |
| Mean UTCI | 28.35 | 29.17 | 30.02 | 31.25 | 32.55 |
| Max. UTCI | 38.70 | 39.50 | 40.58 | 42.20 | 43.90 |
Table 3.
Number of days and events for different percentiles for heatwave events (2 days).
| Temperature Percentile | 2 Days | |||||||||
|---|---|---|---|---|---|---|---|---|---|---|
| 90th | 92.5th | 95th | 97.5th | 99th | ||||||
| Days | Events | Days | Events | Days | Events | Days | Events | Days | Events | |
| Mean Temp. | 858 | 142 | 635 | 114 | 404 | 81 | 196 | 51 | 82 | 24 |
| Max Temp. | 11 | 5 | 7 | 3 | 2 | 1 | 0 | 0 | 0 | 0 |
| Mean PET | 845 | 148 | 622 | 122 | 405 | 97 | 191 | 51 | 71 | 22 |
| Max PET | 725 | 166 | 515 | 135 | 298 | 95 | 127 | 45 | 34 | 12 |
| Mean UTCI | 841 | 147 | 617 | 121 | 402 | 93 | 186 | 51 | 74 | 23 |
| Max UTCI | 766 | 169 | 536 | 129 | 340 | 99 | 142 | 44 | 46 | 16 |
Table 4.
Number of days and events for different percentiles for heatwave events (3 days).
| Temperature Percentile | 3 Days | |||||||||
|---|---|---|---|---|---|---|---|---|---|---|
| 90th | 92.5th | 95th | 97.5th | 99th | ||||||
| Days | Events | Days | Events | Days | Events | Days | Events | Days | Events | |
| Mean Temp. | 810 | 118 | 581 | 92 | 362 | 60 | 158 | 33 | 68 | 15 |
| Max Temp. | 3 | 1 | 3 | 1 | 0 | 0 | 0 | 0 | 0 | 0 |
| Mean PET | 779 | 116 | 570 | 94 | 339 | 63 | 149 | 30 | 57 | 15 |
| Max PET | 615 | 112 | 401 | 85 | 194 | 45 | 83 | 22 | 20 | 6 |
| Mean UTCI | 767 | 108 | 561 | 91 | 348 | 64 | 150 | 33 | 56 | 14 |
| Max UTCI | 658 | 112 | 438 | 83 | 250 | 54 | 106 | 26 | 36 | 11 |
Publisher’s Note: MDPI stays neutral with regard to jurisdictional claims in published maps and institutional affiliations. |
© 2021 by the authors. Licensee MDPI, Basel, Switzerland. This article is an open access article distributed under the terms and conditions of the Creative Commons Attribution (CC BY) license (https://creativecommons.org/licenses/by/4.0/).
Share and Cite
MDPI and ACS Style
Dimitriadou, L.; Nastos, P.; Zerefos, C. Defining Heatwaves with Respect to Human Biometeorology. The Case of Attica Region, Greece. Atmosphere 2021, 12, 1100. https://0-doi-org.brum.beds.ac.uk/10.3390/atmos12091100
AMA Style
Dimitriadou L, Nastos P, Zerefos C. Defining Heatwaves with Respect to Human Biometeorology. The Case of Attica Region, Greece. Atmosphere. 2021; 12(9):1100. https://0-doi-org.brum.beds.ac.uk/10.3390/atmos12091100
Chicago/Turabian StyleDimitriadou, Lida, Panagiotis Nastos, and Christos Zerefos. 2021. "Defining Heatwaves with Respect to Human Biometeorology. The Case of Attica Region, Greece" Atmosphere 12, no. 9: 1100. https://0-doi-org.brum.beds.ac.uk/10.3390/atmos12091100
Note that from the first issue of 2016, this journal uses article numbers instead of page numbers. See further details here.