
Tropical Cyclone Formation within Strong Northeasterly Environments in the South China Sea


1
Department of Atmospheric Sciences, National Taiwan University, Taipei 10617, Taiwan
2
Central Weather Bureau, Taipei 100006, Taiwan
3
National Center for Atmospheric Research, Boulder, CO 80301, USA
4
International Master/Doctoral Degree Program in Climate Change and Sustainable Development, National Taiwan University, Taipei 10617, Taiwan
5
Center for Weather Climate and Disaster Research, National Taiwan University, Taipei 10617, Taiwan
*
Authors to whom correspondence should be addressed.
Atmosphere 2021, 12(9), 1147; https://0-doi-org.brum.beds.ac.uk/10.3390/atmos12091147
Submission received: 28 July 2021
/
Revised: 24 August 2021
/
Accepted: 1 September 2021
/
Published: 5 September 2021
(This article belongs to the Special Issue Asia-Pacific Region: Monsoons and Typhoons)
Abstract
:In the South China Sea (SCS), 17% of tropical cyclones (TCs) formed in the late season (November−January) were associated with a strong northeasterly monsoon. This study explores the effects of northeasterly strength on TC formation over the SCS. The Weather Research and Forecasting (WRF) model is used to simulate the disturbances that develop into TCs (formation cases) and those that do not (non-formation cases). Two formation (29W on 18 November 2001 and Vamei on 26 December 2001) and two non-formation (30 December 2002 and 9 January 2003) cases are simulated. To address the importance of upstream low-level northeasterly strength to TC formation, two types of sensitivity experiments are performed: formation cases with increased northeasterly flow and non-formation cases with decreased northeasterly flow. If the strength of the northeasterly is increased for the formation case, the stronger cold advection reduces the convective instability around the disturbance center, leading to the weakening of the simulated disturbance. If the strength of the northeasterly is decreased for the non-formation case, the simulated disturbance can develop further into a TC. In summary, strength of the upstream low-level northeasterly flow does affect the environmental conditions around the disturbance center, resulting in the change of TC formation probability over the SCS in the late season.
1. Introduction
The South China Sea (SCS) is a unique basin of the western North Pacific (WNP). The SCS, surrounded by lands, has warm sea surface temperature in the whole year and is affected by the synoptic-scale systems and longer timescale systems from the Maritime Continent [1,2]. These cause the synoptic characteristics of tropical cyclone (TC) formation in the SCS to differ from those in the WNP [3]. Due to the narrower ocean basin and shorter TC warning period, accurate TC formation forecast (occurrence, timing, and location) in the SCS is a significant challenge to the surrounding countries.
During the peak typhoon season (July−October), the monsoon trough provides a strong southwesterly flow with high moisture in the SCS, favoring the formation of tropical cloud clusters and TCs [4,5]. However, the probability density function (PDF) of TC formation number in the SCS during the peak typhoon season is lower than that in the WNP [6]. In turn, the SCS has higher PDFs of TC formation than the WNP during the early (May−June) and late (November−January) typhoon seasons, especially in May and December. The baroclinicity associated with the Mei-Yu front and the significant vertical wind shear in these two periods are unfavorable for TC formation. The TC formation that overcomes these unfavorable conditions over the SCS in the early and late seasons deserves to be studied further.
In the SCS, the TC formation associated with the Mei-Yu front has been explored [7], while the process of TC formation associated with strong northeasterly flow in the fall and winter is still unclear. Strong winter monsoon circulation affects tropical cloud cluster formation (i.e., a precursor of TC) and maintenance in the SCS and WNP, thus further influences the TC formation [8]. The northeasterly cold surges may result in the intensification of convective disturbances in the near-equatorial region of the SCS [9,10,11]. Under favorable conditions, disturbances that form within the semi-stationary, near-equatorial trough over the coast of northern Borneo, or a westward-propagating wave from the WNP can develop into TCs over the SCS. For instance, Typhoon Vamei, which formed in the southern SCS during the boreal winter of 2001, developed in a semi-stationary near-equatorial trough environment. Chang et al. (2003) [11] indicated that the formation process of Vamei was associated with a strong and persistent northeasterly cold surge. This characteristic caused a large background vorticity near the equator and an initial Borneo vortex that drifted into the southern SCS, resulting in the formation of Vamei.
Lin and Lee (2011) [6] have analyzed the differences in the circulation patterns between the formation and the non-formation disturbances in the SCS during the late season. They found that the 925-hPa northeasterly flow is stronger for the formation cases, and the 500-hPa subtropical high is stronger and extends farther westward for the non-formation cases. In addition, the averaged 200-hPa divergence over the southern SCS is stronger for the formation cases. They also indicated that the strong northeasterly surge provided large low-level background vorticity at lower latitude favorable for the formation of the initial vortex, which is also pointed out by Chang et al. (2003) [11]. However, the cold and dry advection associated with the strong northeasterly flow is not favorable for the following development of the initial disturbance or the formation of TC. Therefore, a weakening in the upstream low-level northeasterly flow after the formation of the initial disturbance would decrease the vertical wind shear and reduce the stabilizing effect associated with the intrusion of cold and dry air. This might be a critical factor for the subsequent development of the initial disturbance and the formation of a TC over the SCS in the late season. This is the hypothesis to be explored in this study.
The Weather Research and Forecasting (WRF) model can be used to simulate TC formation and explore the physical processes. The sensitivity experiment through the WRF model is a known method to evidence and quantify the contribution of a specific factor to TC characteristics (e.g., references [12,13,14,15,16]). For TC formation, the sensitivity experiments of the environmental vorticity [17], trade-wind surge [18], and moisture patterns [19] have been conducted. Building on these studies, this study uses the WRF model to simulate the formation and non-formation cases associated with strong northeasterly flow in the SCS, and performs the sensitivity experiments to examine the importance of upstream low-level northeasterly strength for TC formation.
In this paper, the data used in this study and the model settings are presented in Section 2. The formation and non-formation cases are selected, simulated, and analyzed in Section 3. Results of sensitivity experiments with changed northeasterly strength are presented in Section 4. Finally, the discussion and conclusions are summarized in Section 5.
2. Data and Methodology
2.1. Data and Case Selection
Referring to Lin and Lee (2011) [6], two formation and two non-formation cases are selected and simulated in this study. The formation cases are typhoon Vamei (26 December 2001) and the 29th TC (18 November 2001) over the WNP in 2001 defined by the Joint Typhoon Warning Center (JTWC; labeled as 0129W). The non-formation cases are the disturbances on 30 December 2002 (case A) and 9 January 2003 (case B). The locations and intensities of the formation cases are obtained from the six-hourly best-track data of the JTWC. The formation time is defined as the time when the surface maximum sustained wind speed of disturbance reaches 25 knots (~13 m s−1).
Model simulations use the Final Operational Global Analysis (FNL) of the National Centers for Environmental Prediction (NCEP) as the initial and lateral boundary conditions, except simulations for Vamei. The NCEP FNL is produced by the Global Forecast System (GFS), which is a 6-hourly, near-real time, 1° × 1°, 26-level, and globally dataset from 1999 to present. Because the track error of Vamei between the simulation with the NCEP FNL initial condition and the observation is large, the Advanced Operational Analysis of the European Centre for Medium-Range Weather Forecasts (ECMWF) is used for simulations of Vamei. It is a six-hourly, 1.125° × 1.125°, 26-level, and globally dataset from 1985 to 2010.
The QuikSCAT oceanic wind data, which are derived from microwave scatterometers [20,21], are used in this study for comparison with the simulation results. Daily weather charts of the Japan Meteorological Agency (JMA) are used to identify surface features. The infrared and visible satellite images from the Multi-Functional Transport Satellite (MTSAT) are used to verify these surface features and simulation characteristics.
2.2. Model Setting
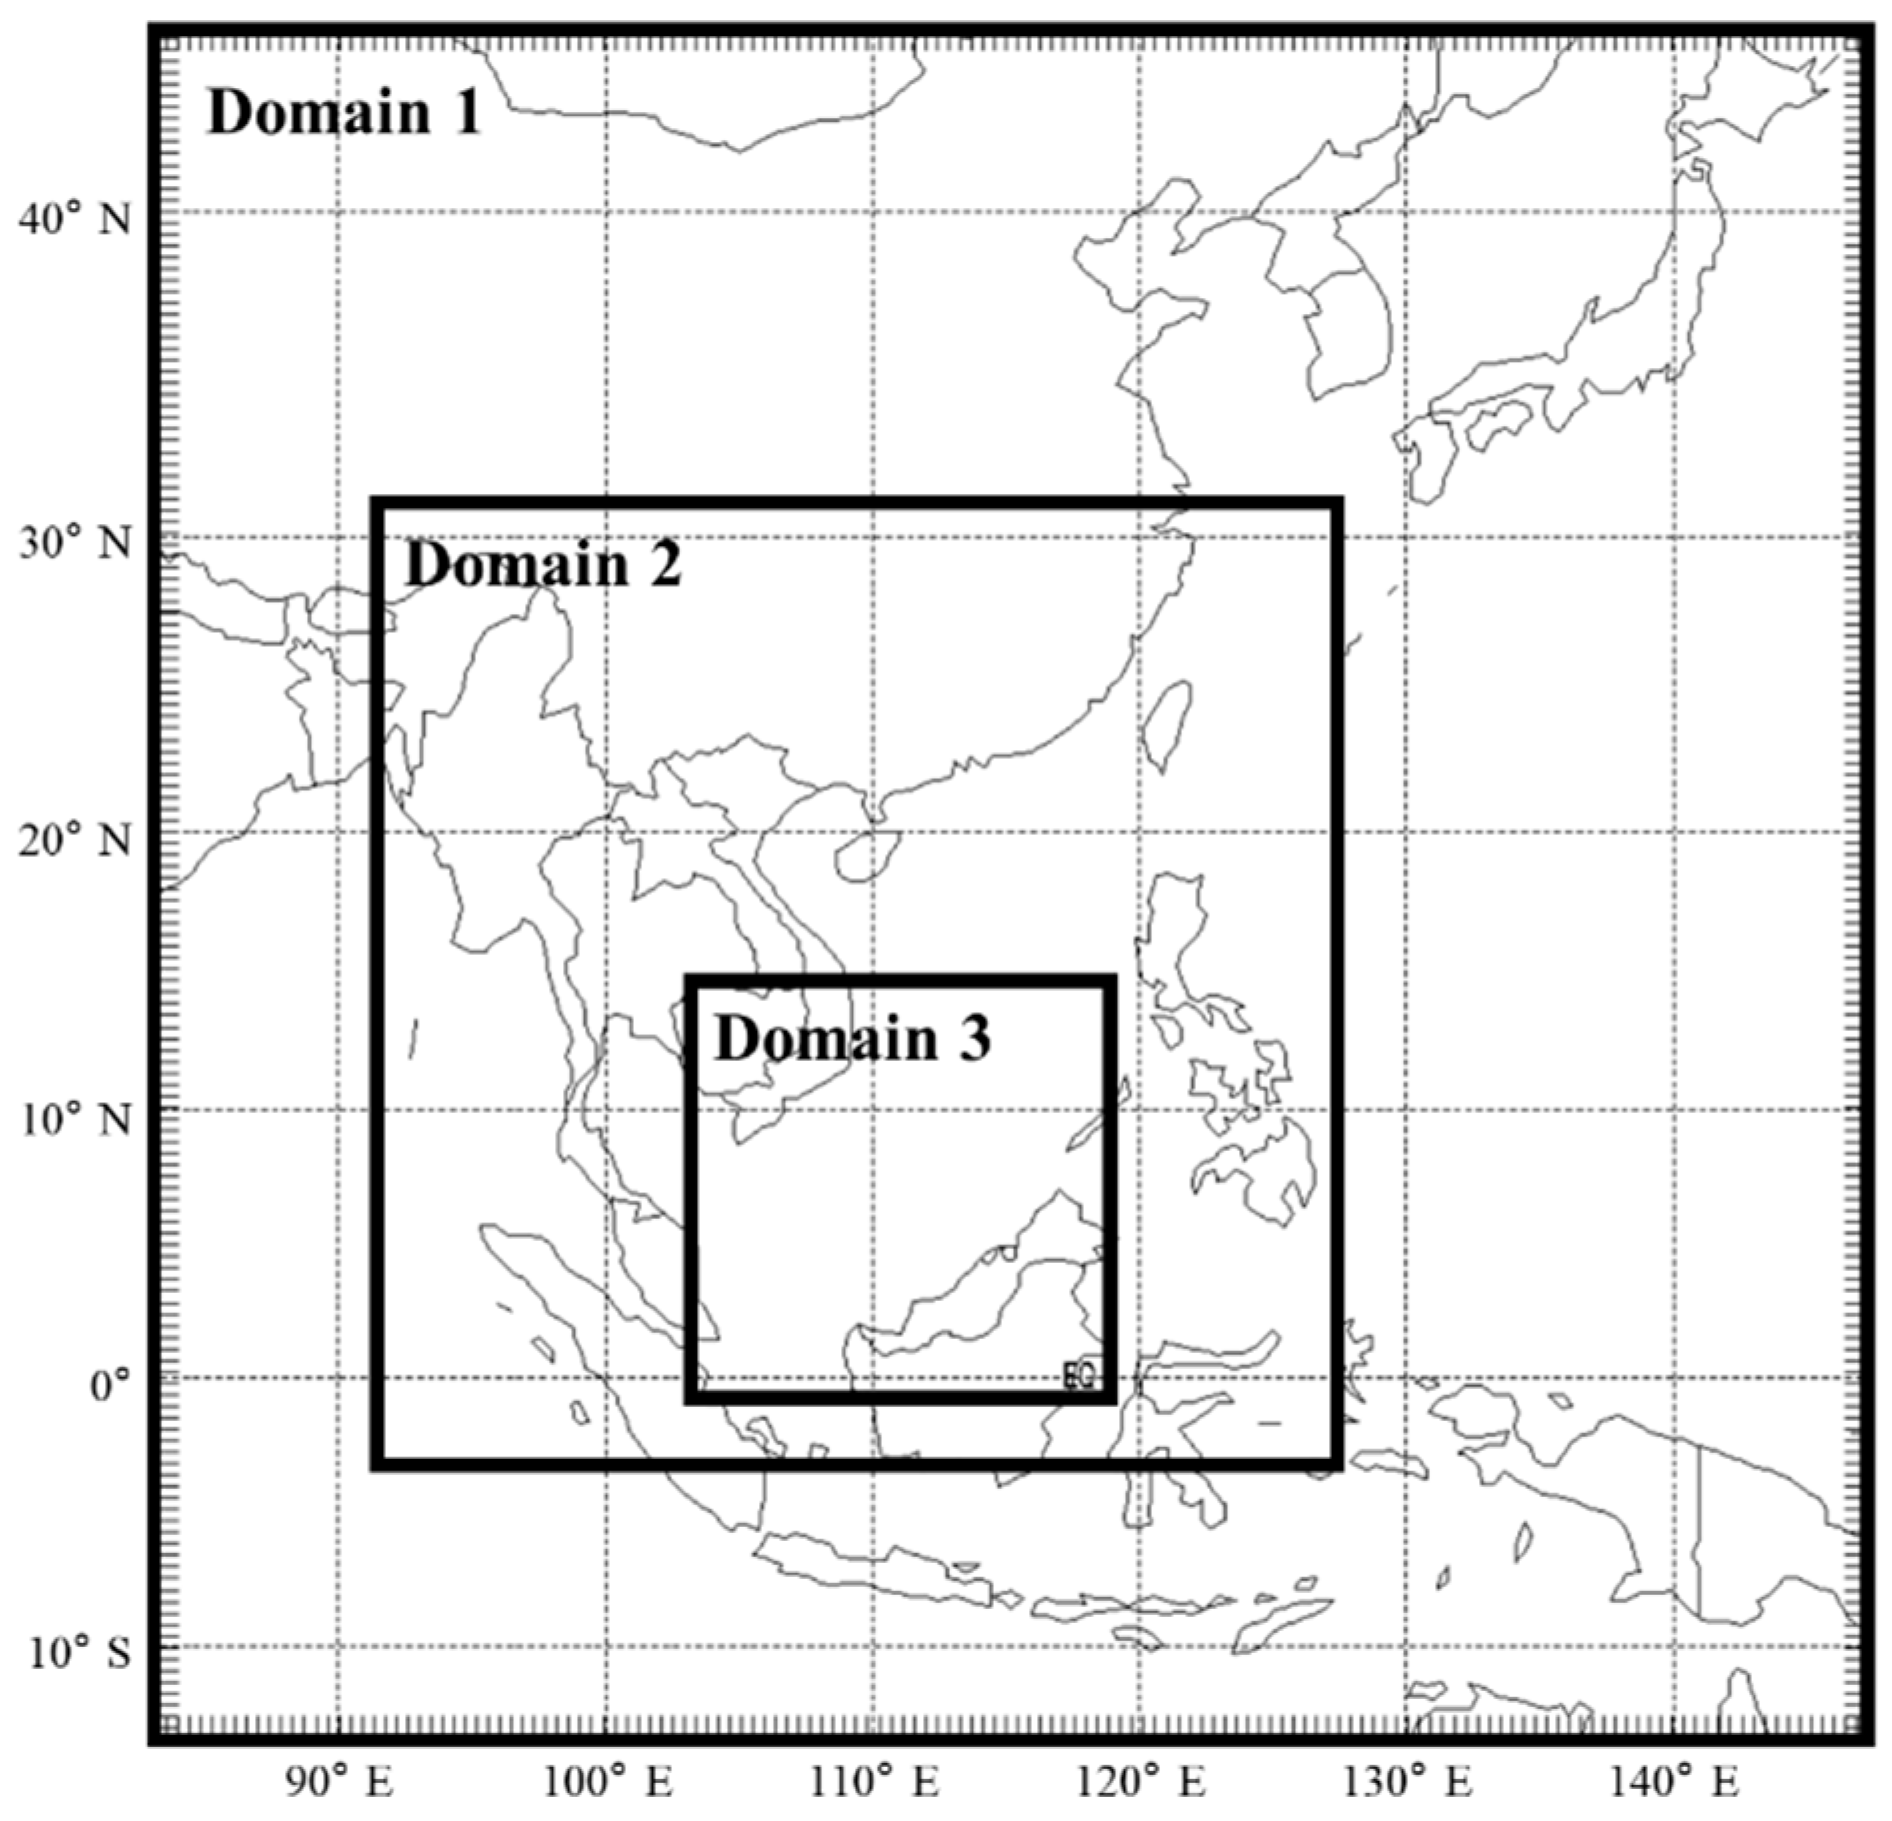
This study uses the Advanced Research—WRF model version 3.2.1 (ARW). The WRF model considers fully compressible, Eulerian, and nonhydrostatic with a run-time hydrostatic option, and uses terrain-following and hydrostatic-pressure vertical coordinates [22]. For the simulations in this study, three nested domains, which are fixed geographically, are employed with two-way interaction. As Figure 1 shows, the domains use horizontal grid spacing of 45-, 15- and 5-km and grid dimensions of 150 × 150, 253 × 253, and 322 × 322, respectively. The domain 2 covers the whole South China Sea, and domain 3 focuses on the main development area of the four selected cases. Each simulation considers 28 vertical levels from the surface to 50 hPa.
In this study, the physical parameterization setting mainly follows Chang (2013) [18] and Hsieh et al. (2017) [17]. The WRF single-moment six-class microphysics scheme [23] is used for all domains. The Kain–Fritsch convective parameterization scheme [24] is used in the domains with 45- and 15-km resolutions. Moreover, the Yonsei University planetary boundary layer scheme [25], Dudhia shortwave radiation scheme [26], and rapid radiative transfer model longwave radiation scheme [27] are considered in all simulations. No additional data assimilation or vortex bogus method is adopted in the control simulations.
For TC 0129W, a four-day simulation initialized at 0000 UTC 17 November 2001 is performed (i.e., 41 h prior to the second TC formation alert issued by JTWC and 42 h before the 25-knot intensity). For Typhoon Vamei, a two-day simulation initialized at 0000 UTC 25 December 2001 is conducted (i.e., 36 h before the 25-knot intensity). For the two non-formation cases, three-day simulations initialized one day before the disturbances with a closed surface isobar in the JMA weather charts are performed.
3. Numerical Simulations
3.1. Verification
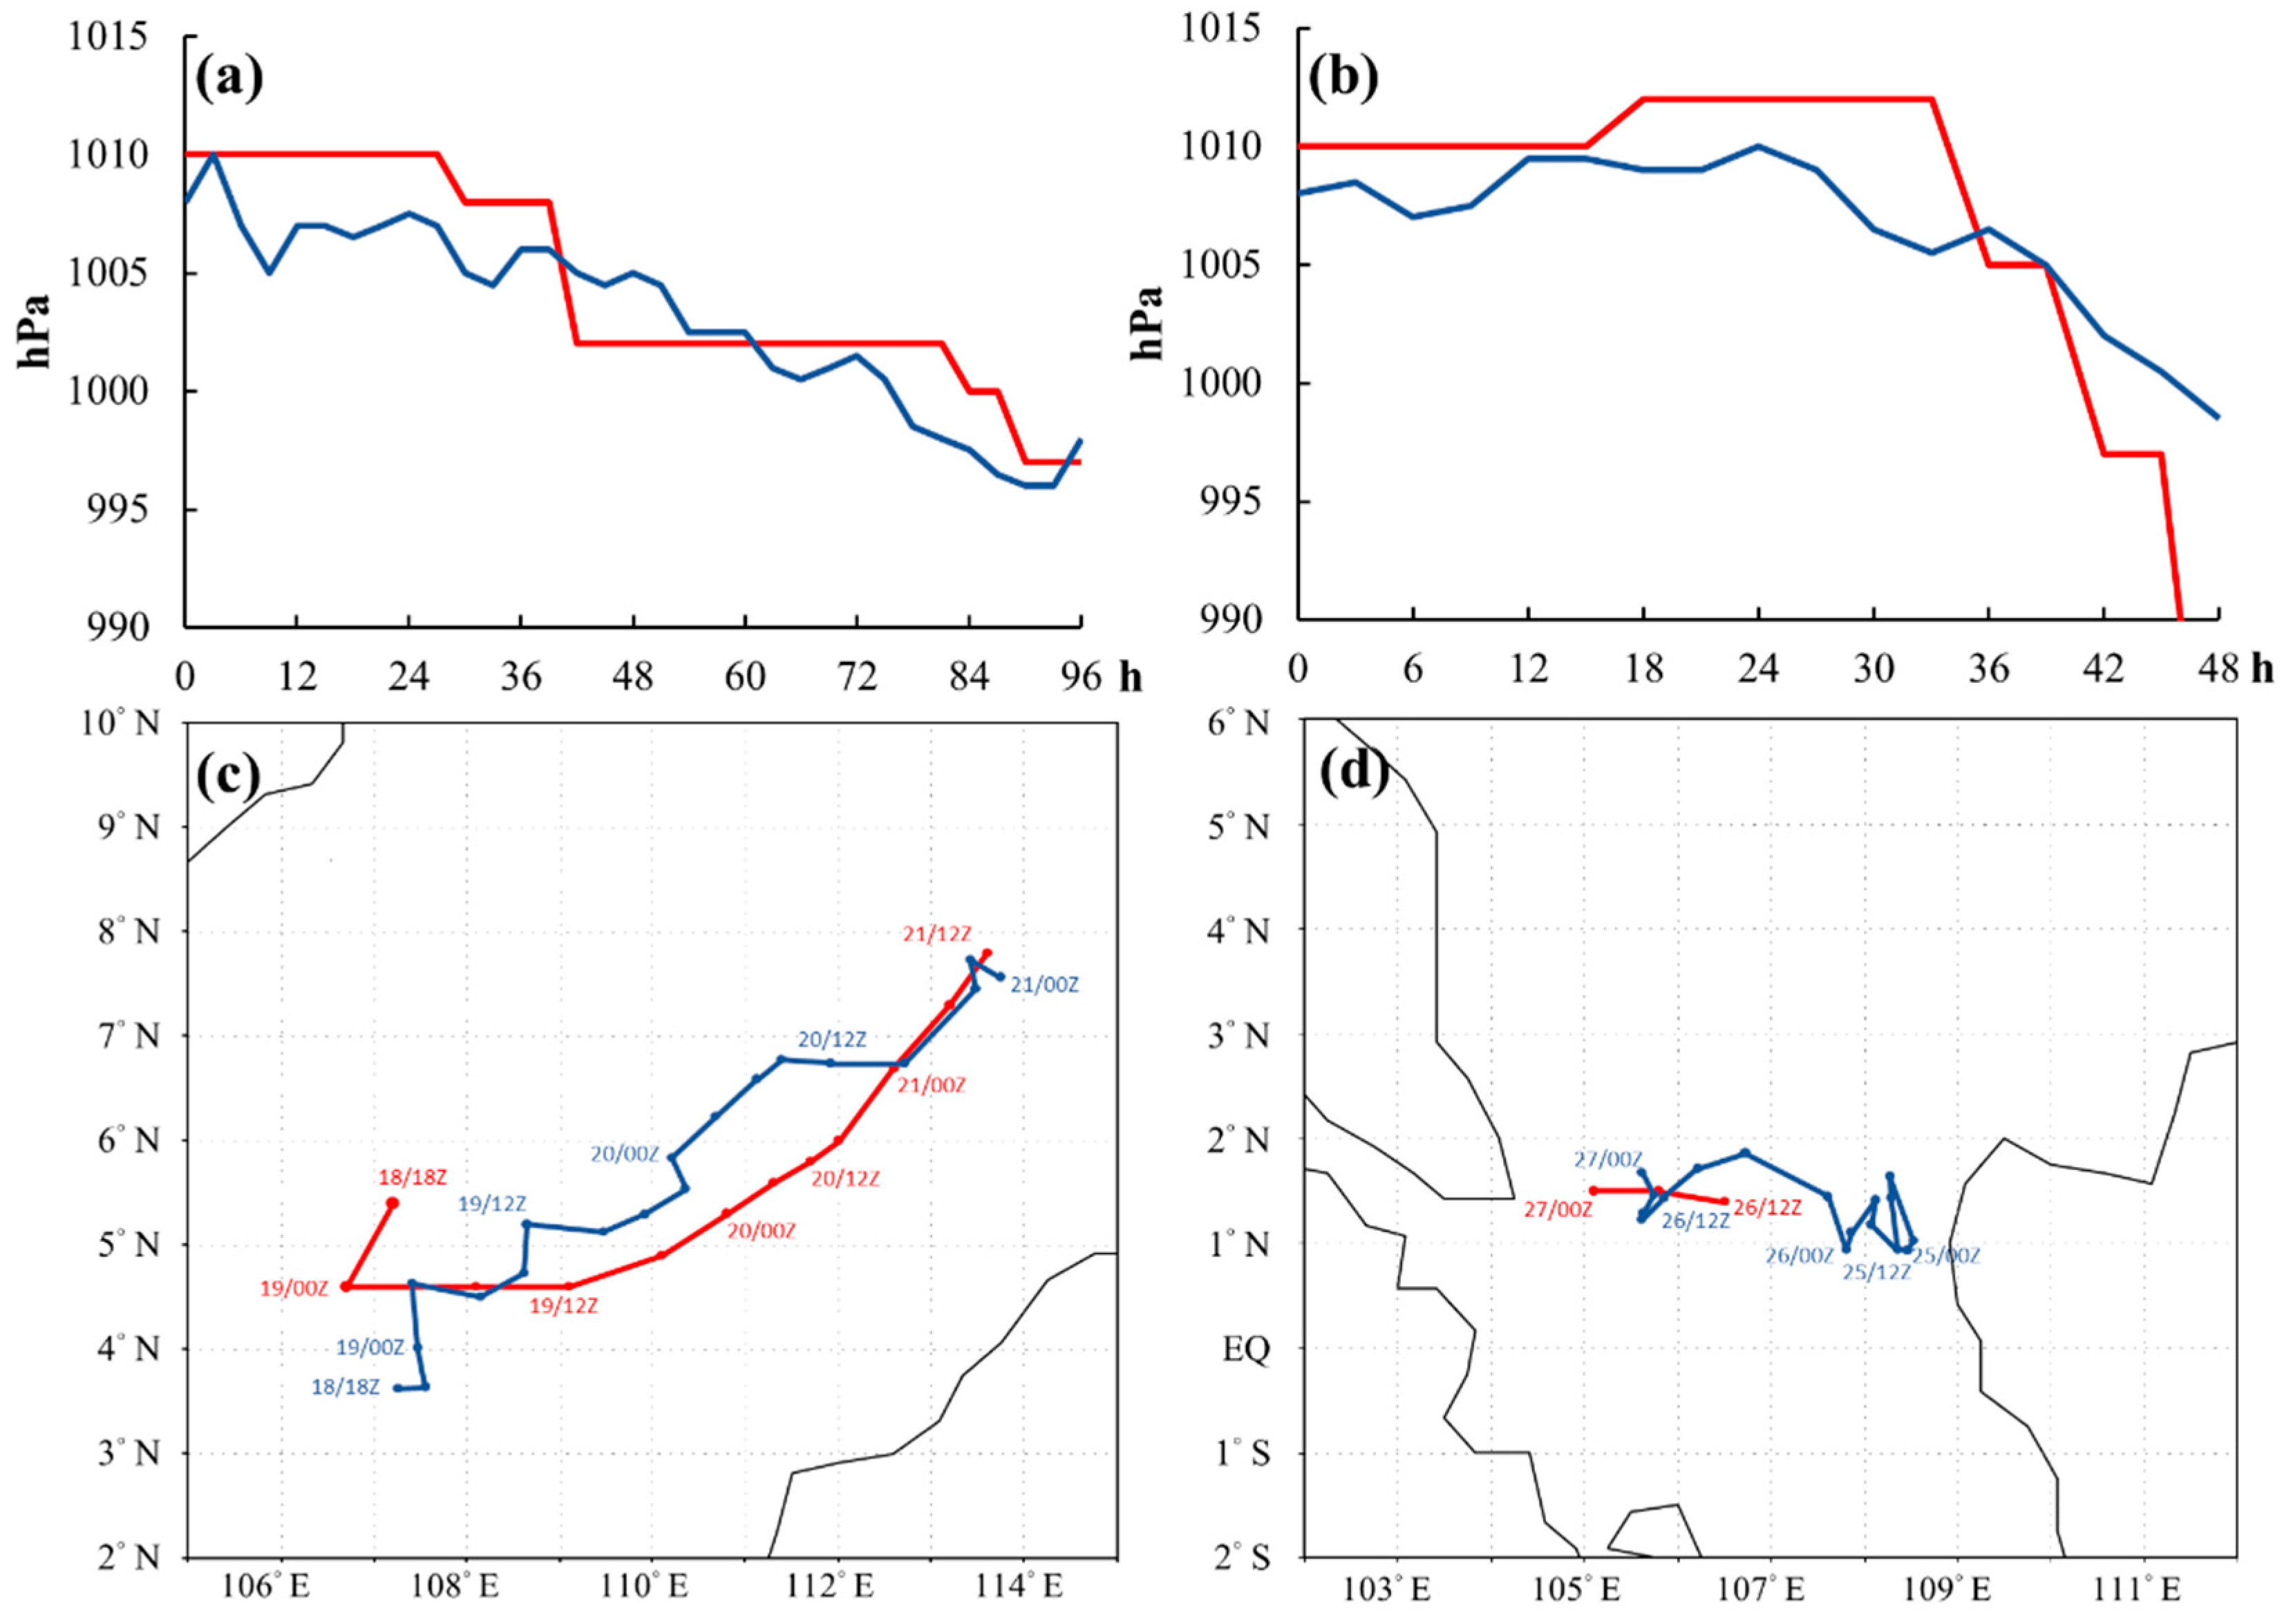
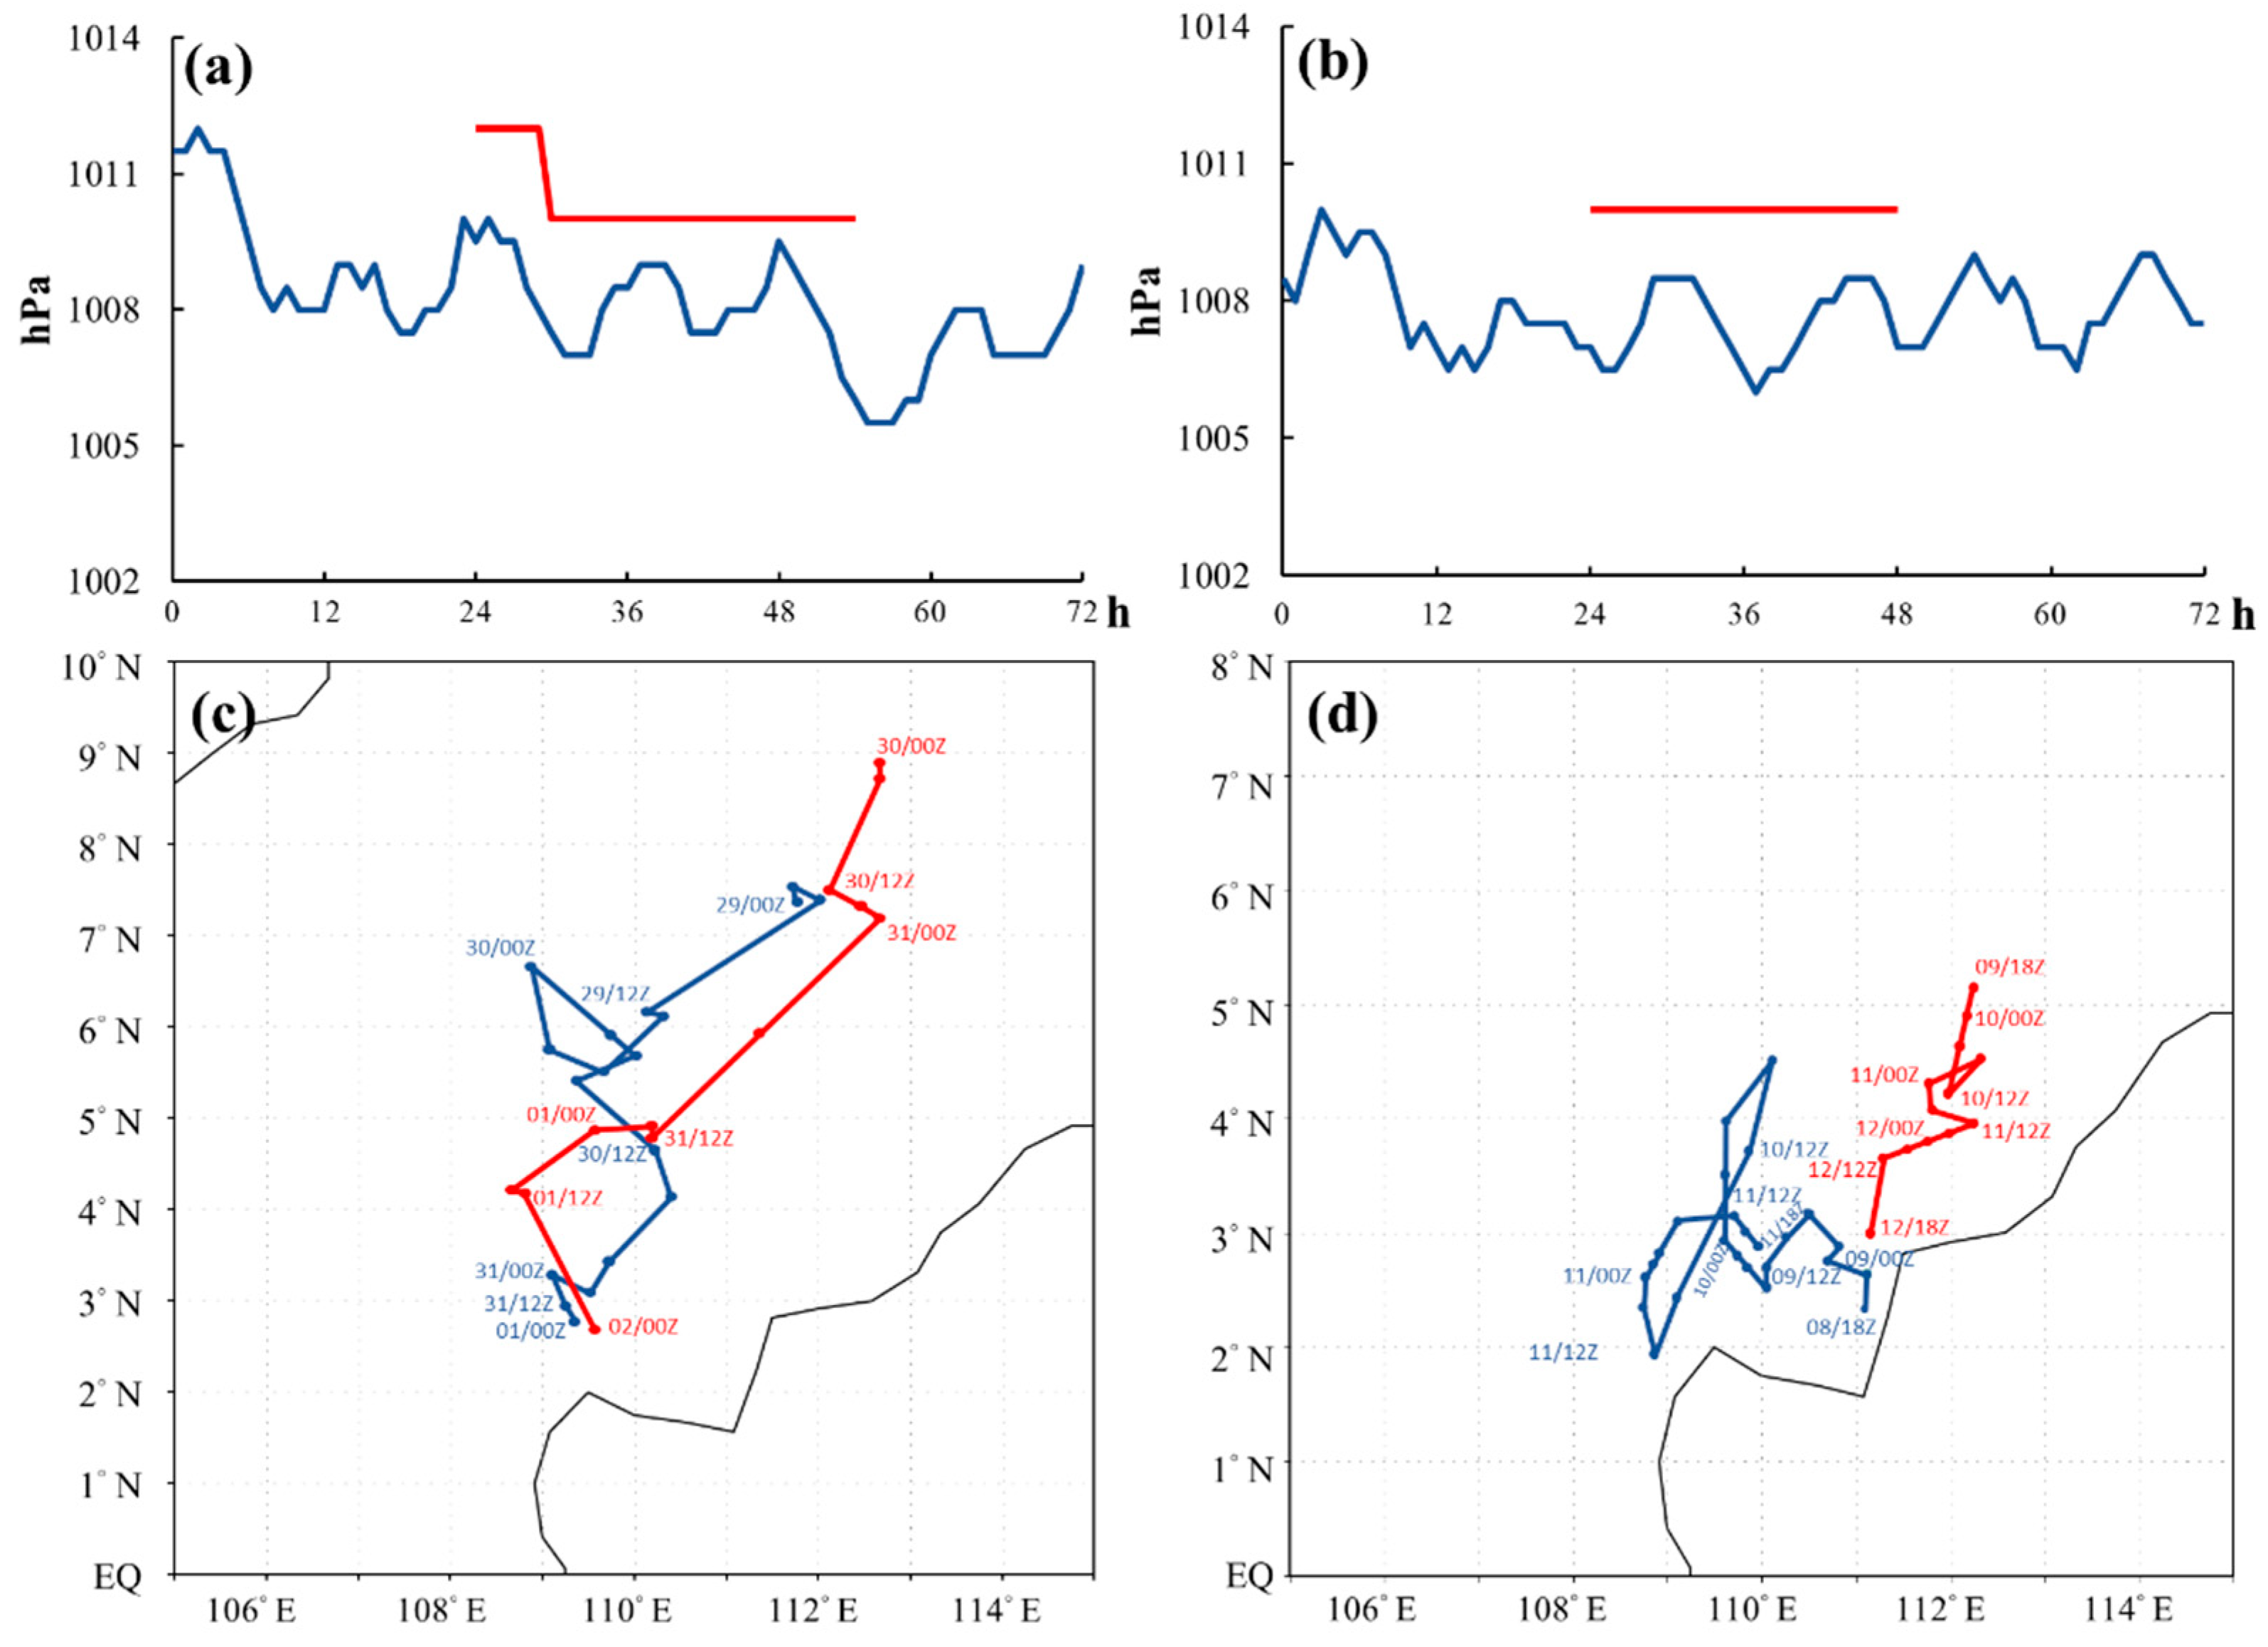
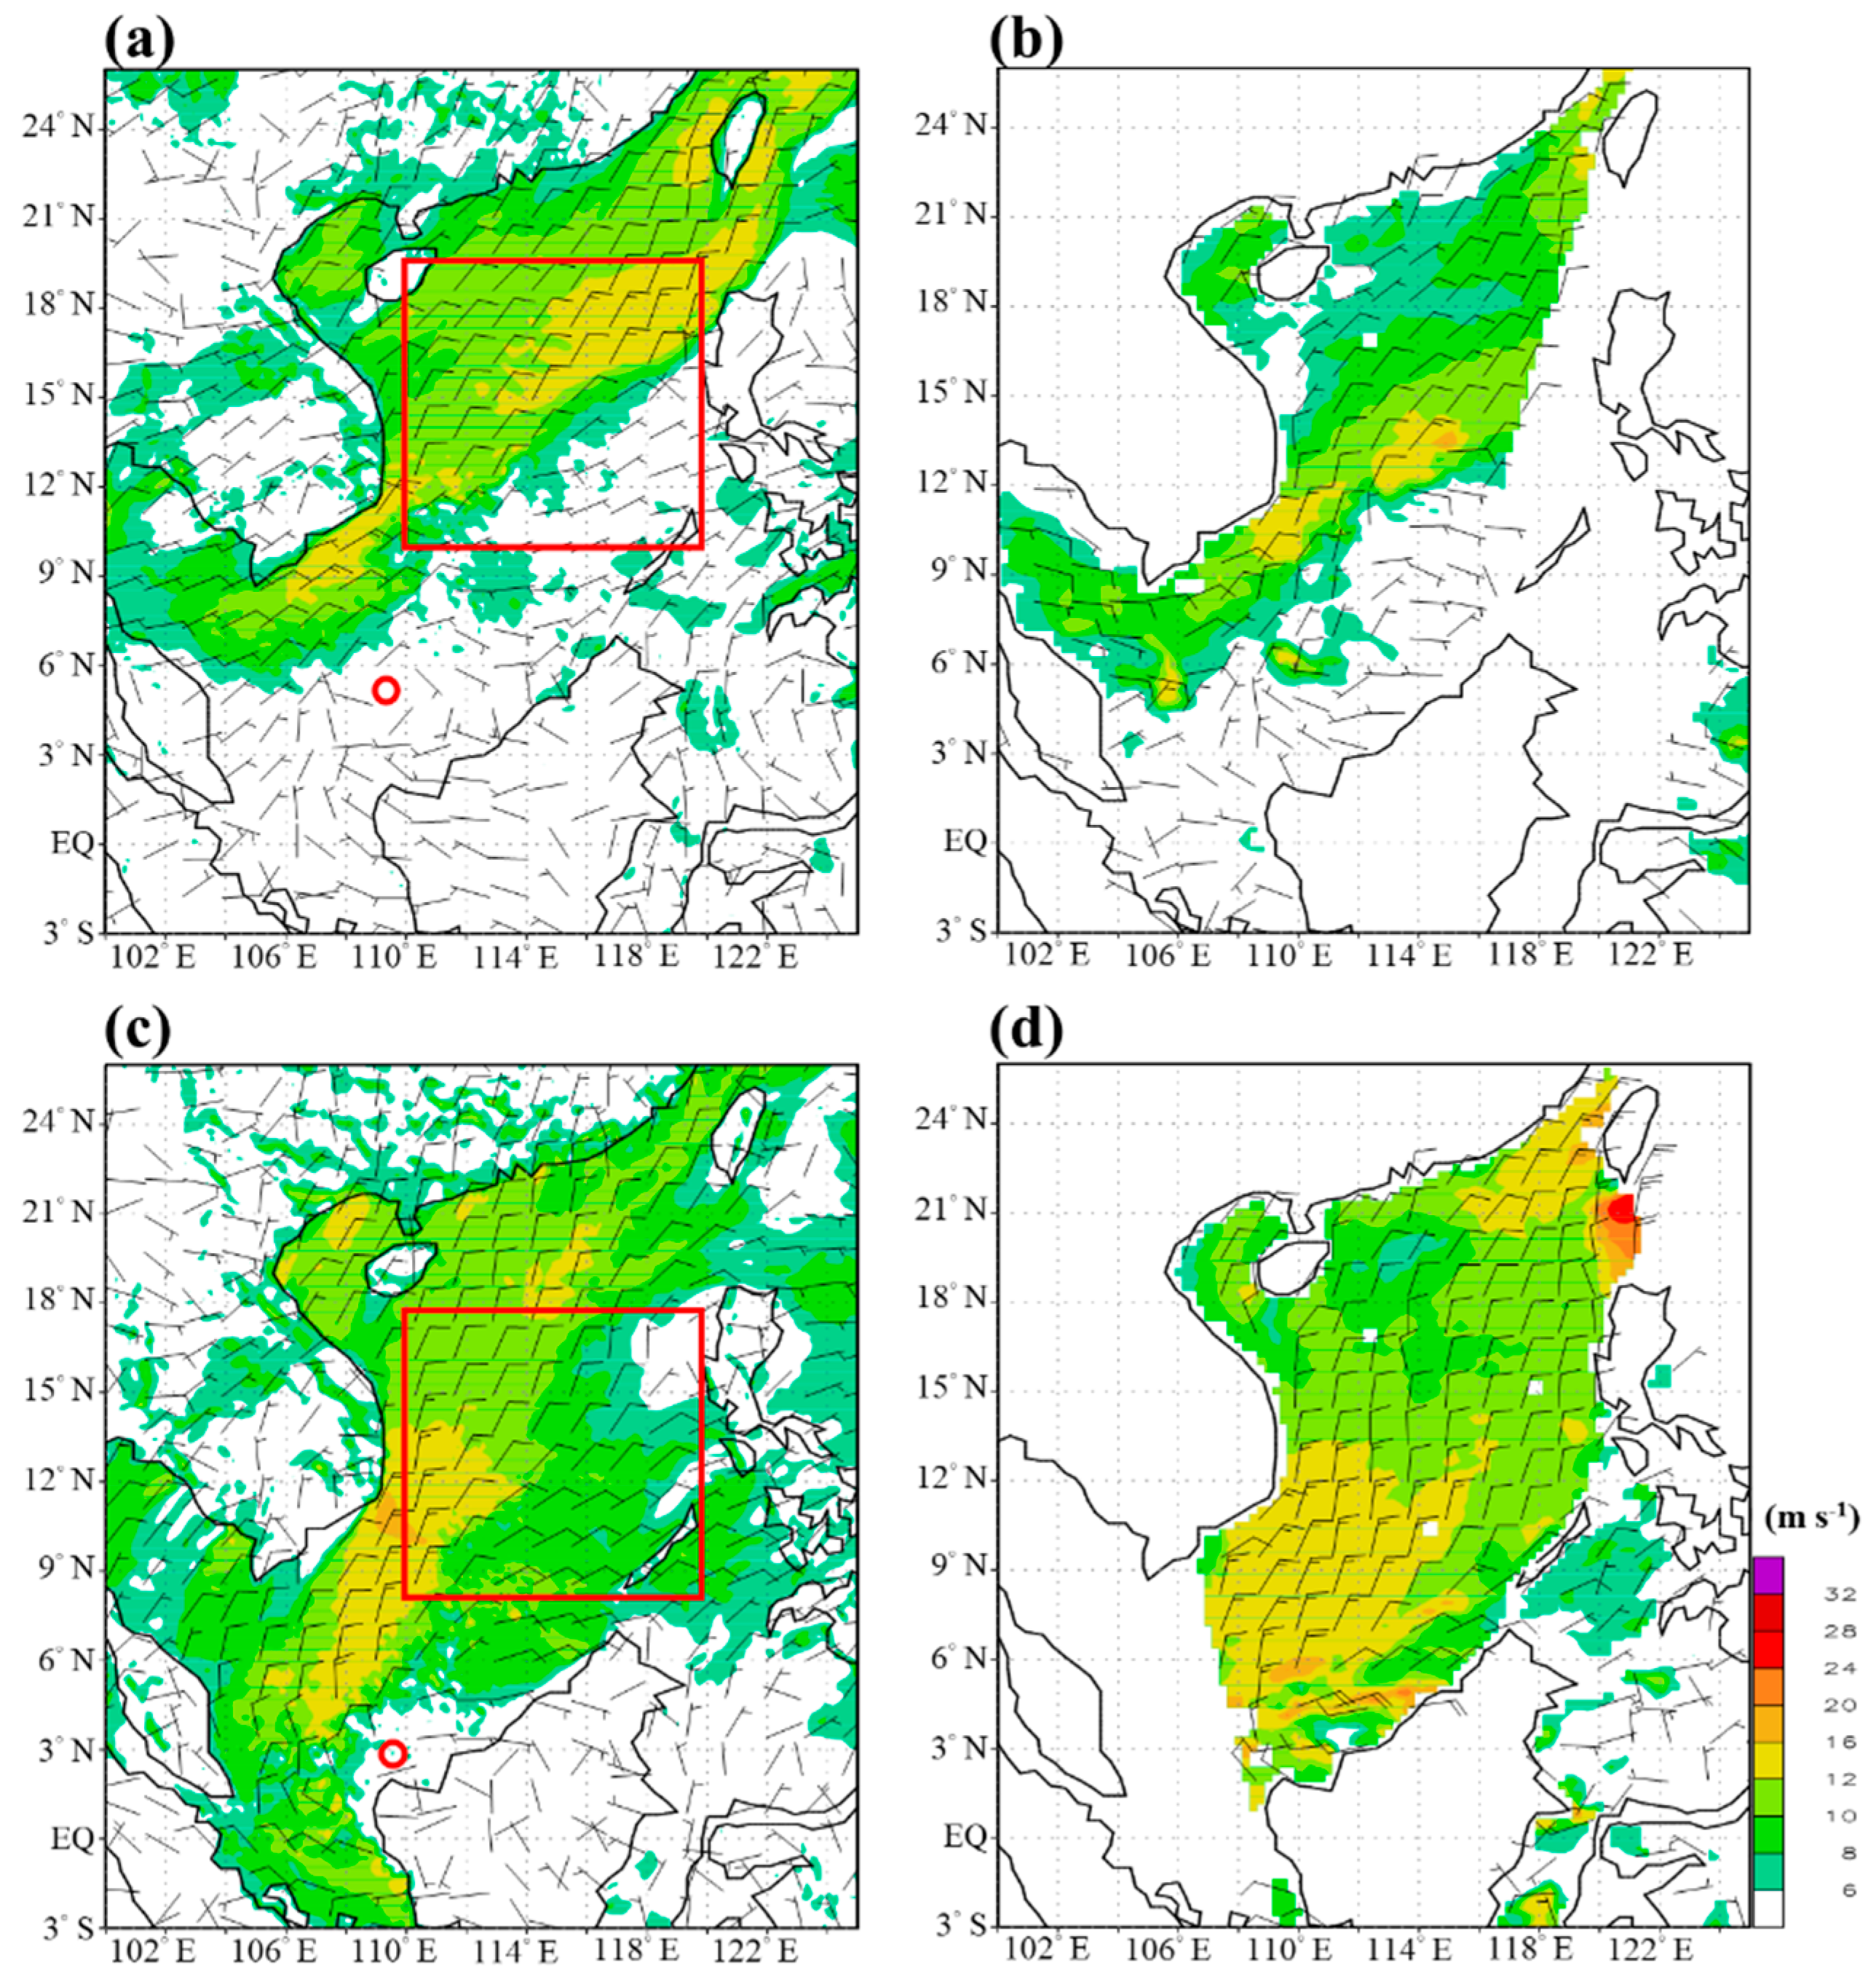
This section shows the simulation performance for the four selected cases, which are defined as the control runs (CTL) in this study. The simulated tracks agree well with the best tracks for the formation cases, 0129W and Vamei (Figure 2). The simulated intensities are also similar to those shown in the JTWC data, although the simulated 0129W intensifies more rapidly into a tropical storm (TS) stage than the observation. The simulated tracks for the non-formation cases, cases A and B, are similar to the disturbance positions obtained from the NCEP FNL (Figure 3) and the locations of the incipient vortex shown in QuikSCAT (Figure 4). These two non-formation cases are steered by the low-level northeasterly flow toward the northwest coast of Borneo. Their simulated intensities (~1008 hPa) are similar to the observation shown in surface map analysis, and hence the disturbances do not develop into TCs in observations and simulations.
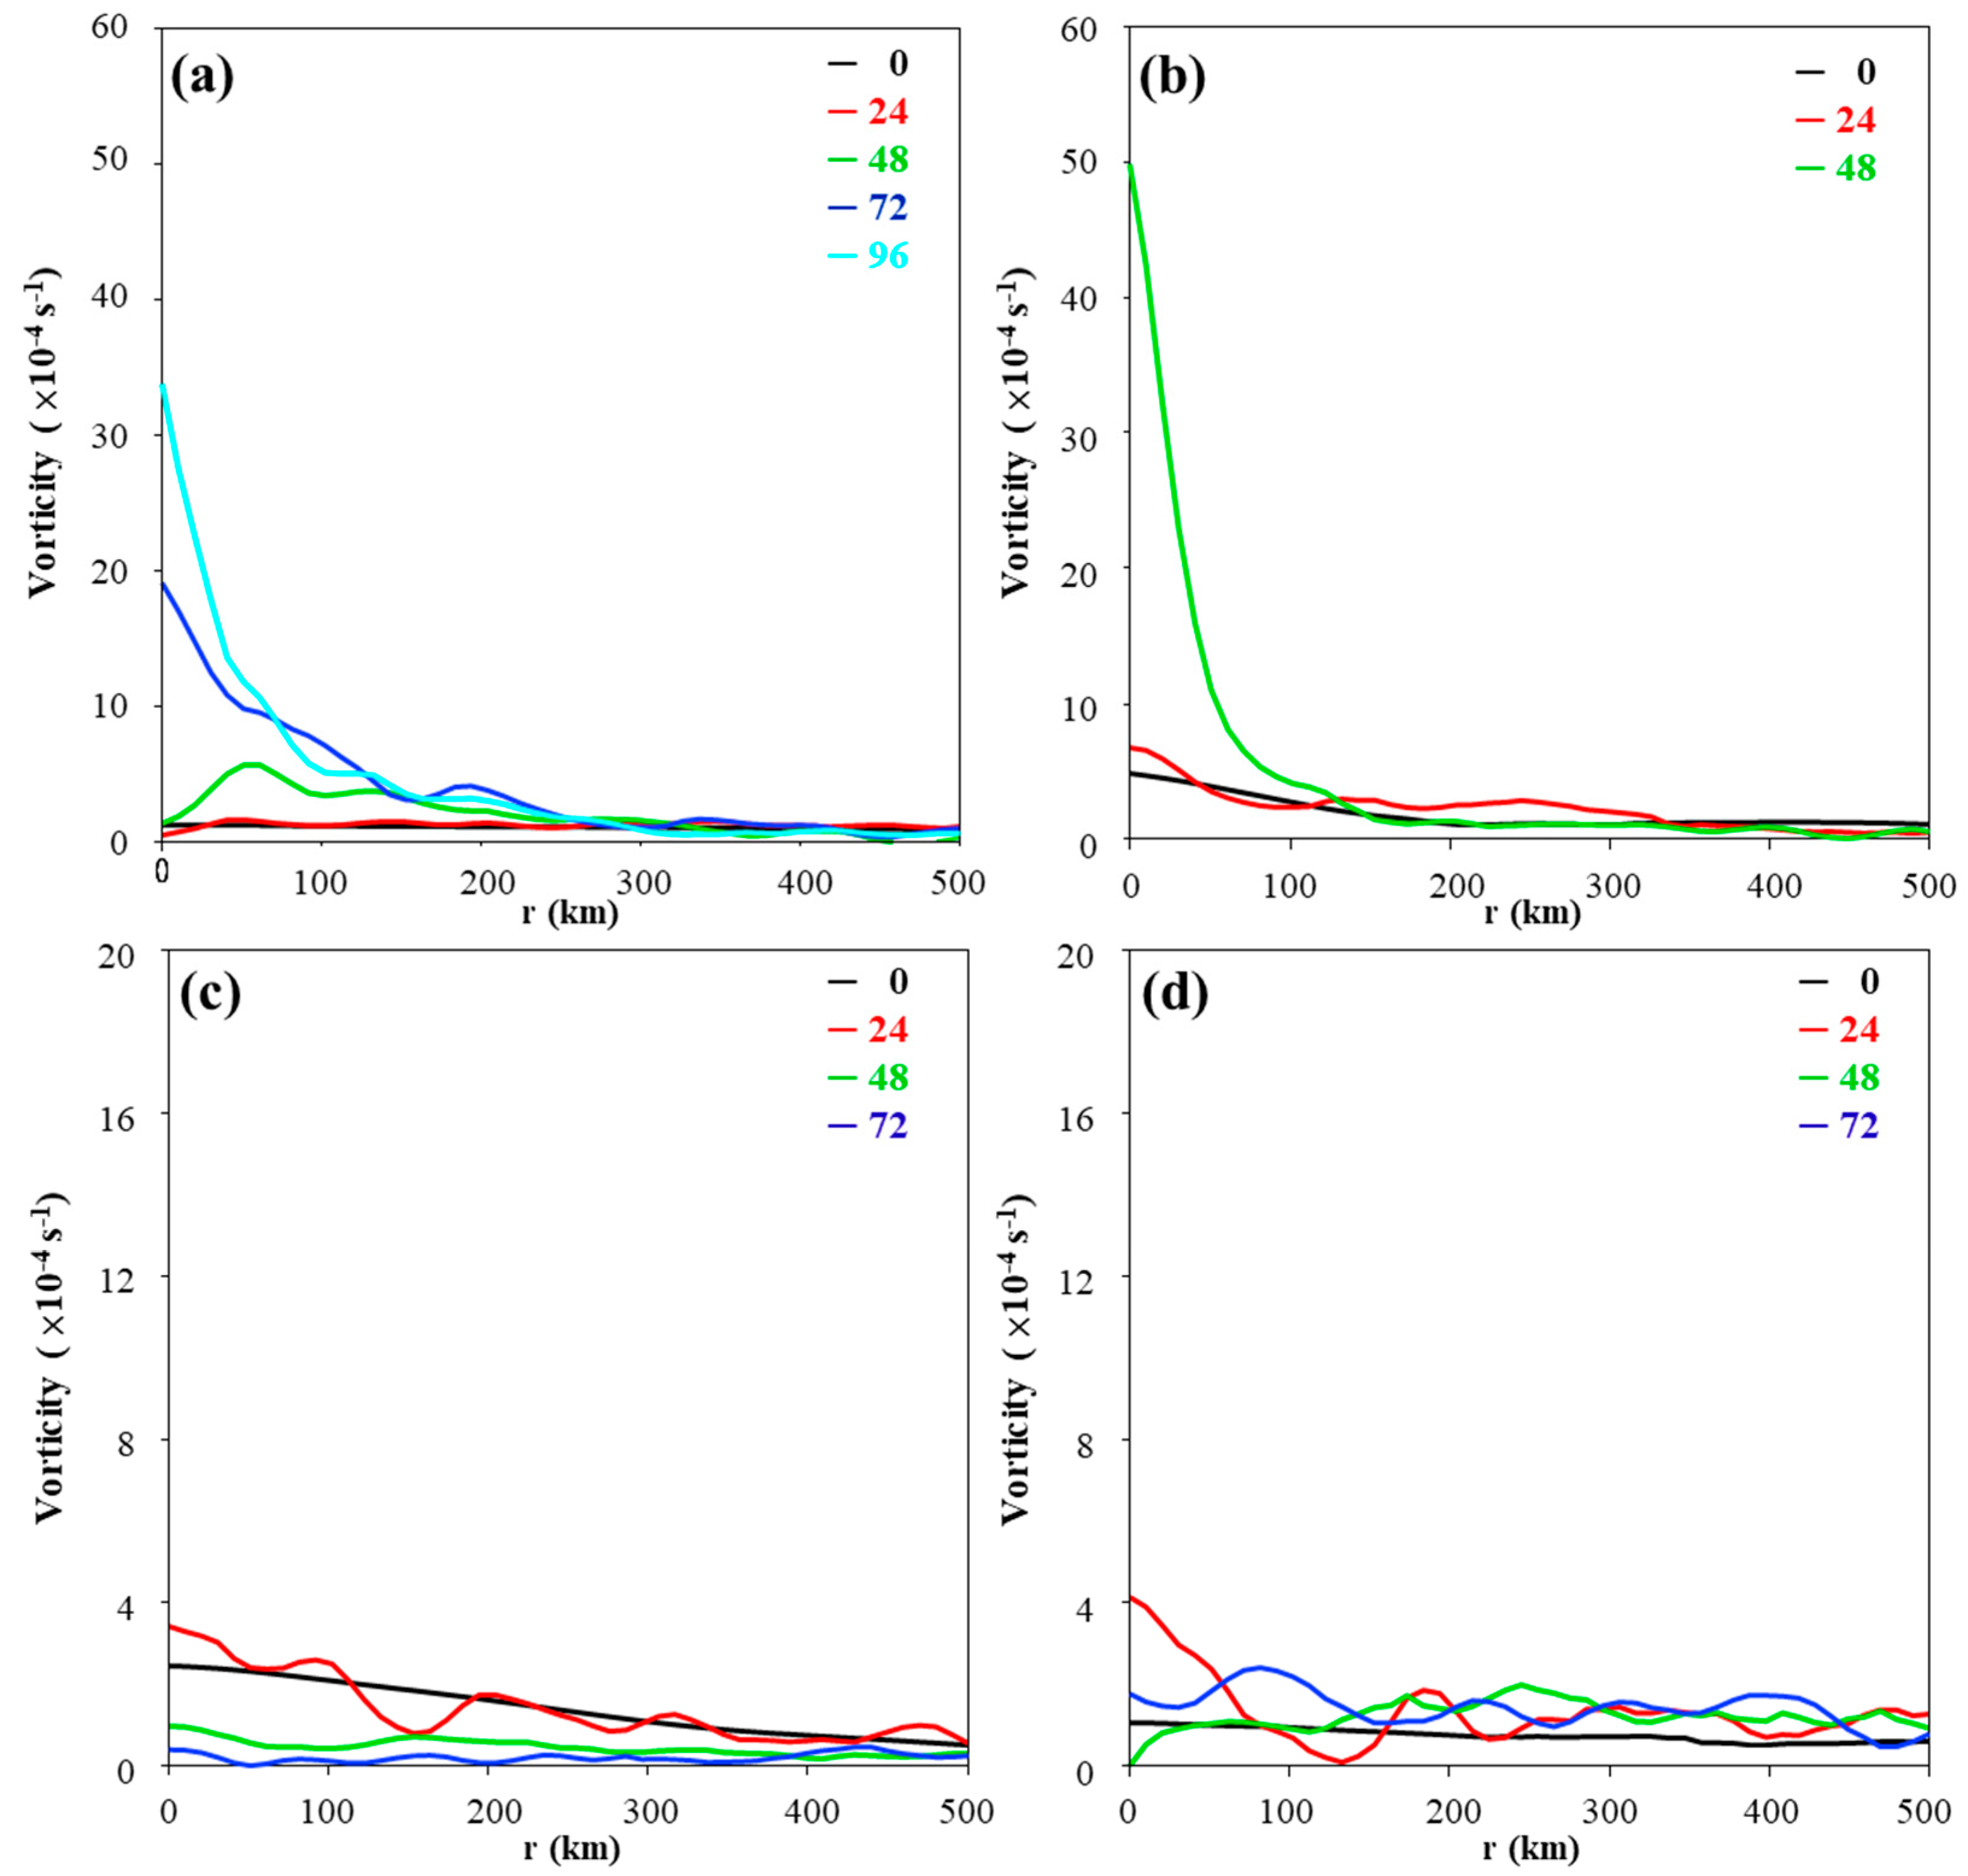
The azimuthal-averaged 925-hPa relative vorticity for the four cases are shown in Figure 5. An intensification occurs within a 100-km radius where the relative vorticity increases substantially, after simulating 48 h for 0129W and after 24 h for Vamei. However, no intensification process is observed for the non-formation cases.
3.2. Analyses of Low-Level Northeasterly Flow and Equivalent Potential Temperature Advection
To examine the effects of northeasterly flow on TC formation process, the upstream northeasterly within a 10° × 10° box (defined as upstream area) is analyzed for each simulation. This box is centered at a point 5° to the northeast of the disturbance center (red box in Figure 4). Moreover, to analyze the contribution of temperature and moisture advection to TC formation, the equivalent potential temperature advection is calculated based on Bolton (1980) [28] as follows:
where θe is the equivalent potential temperature, u and v are the horizontal and meridional wind, Te is the equivalent temperature, T is the temperature, TL is the temperature of lifting condensation level, cp is the specific heat of dry air, q is the mixing ratio, p0 and p are the reference pressure and local pressure, and R is the specific gas constant of dry air. In Equation (1), the difference in the equivalent potential temperature between the two adjacent grid points divided by the grid spacing distance is considered as the partial differential term.
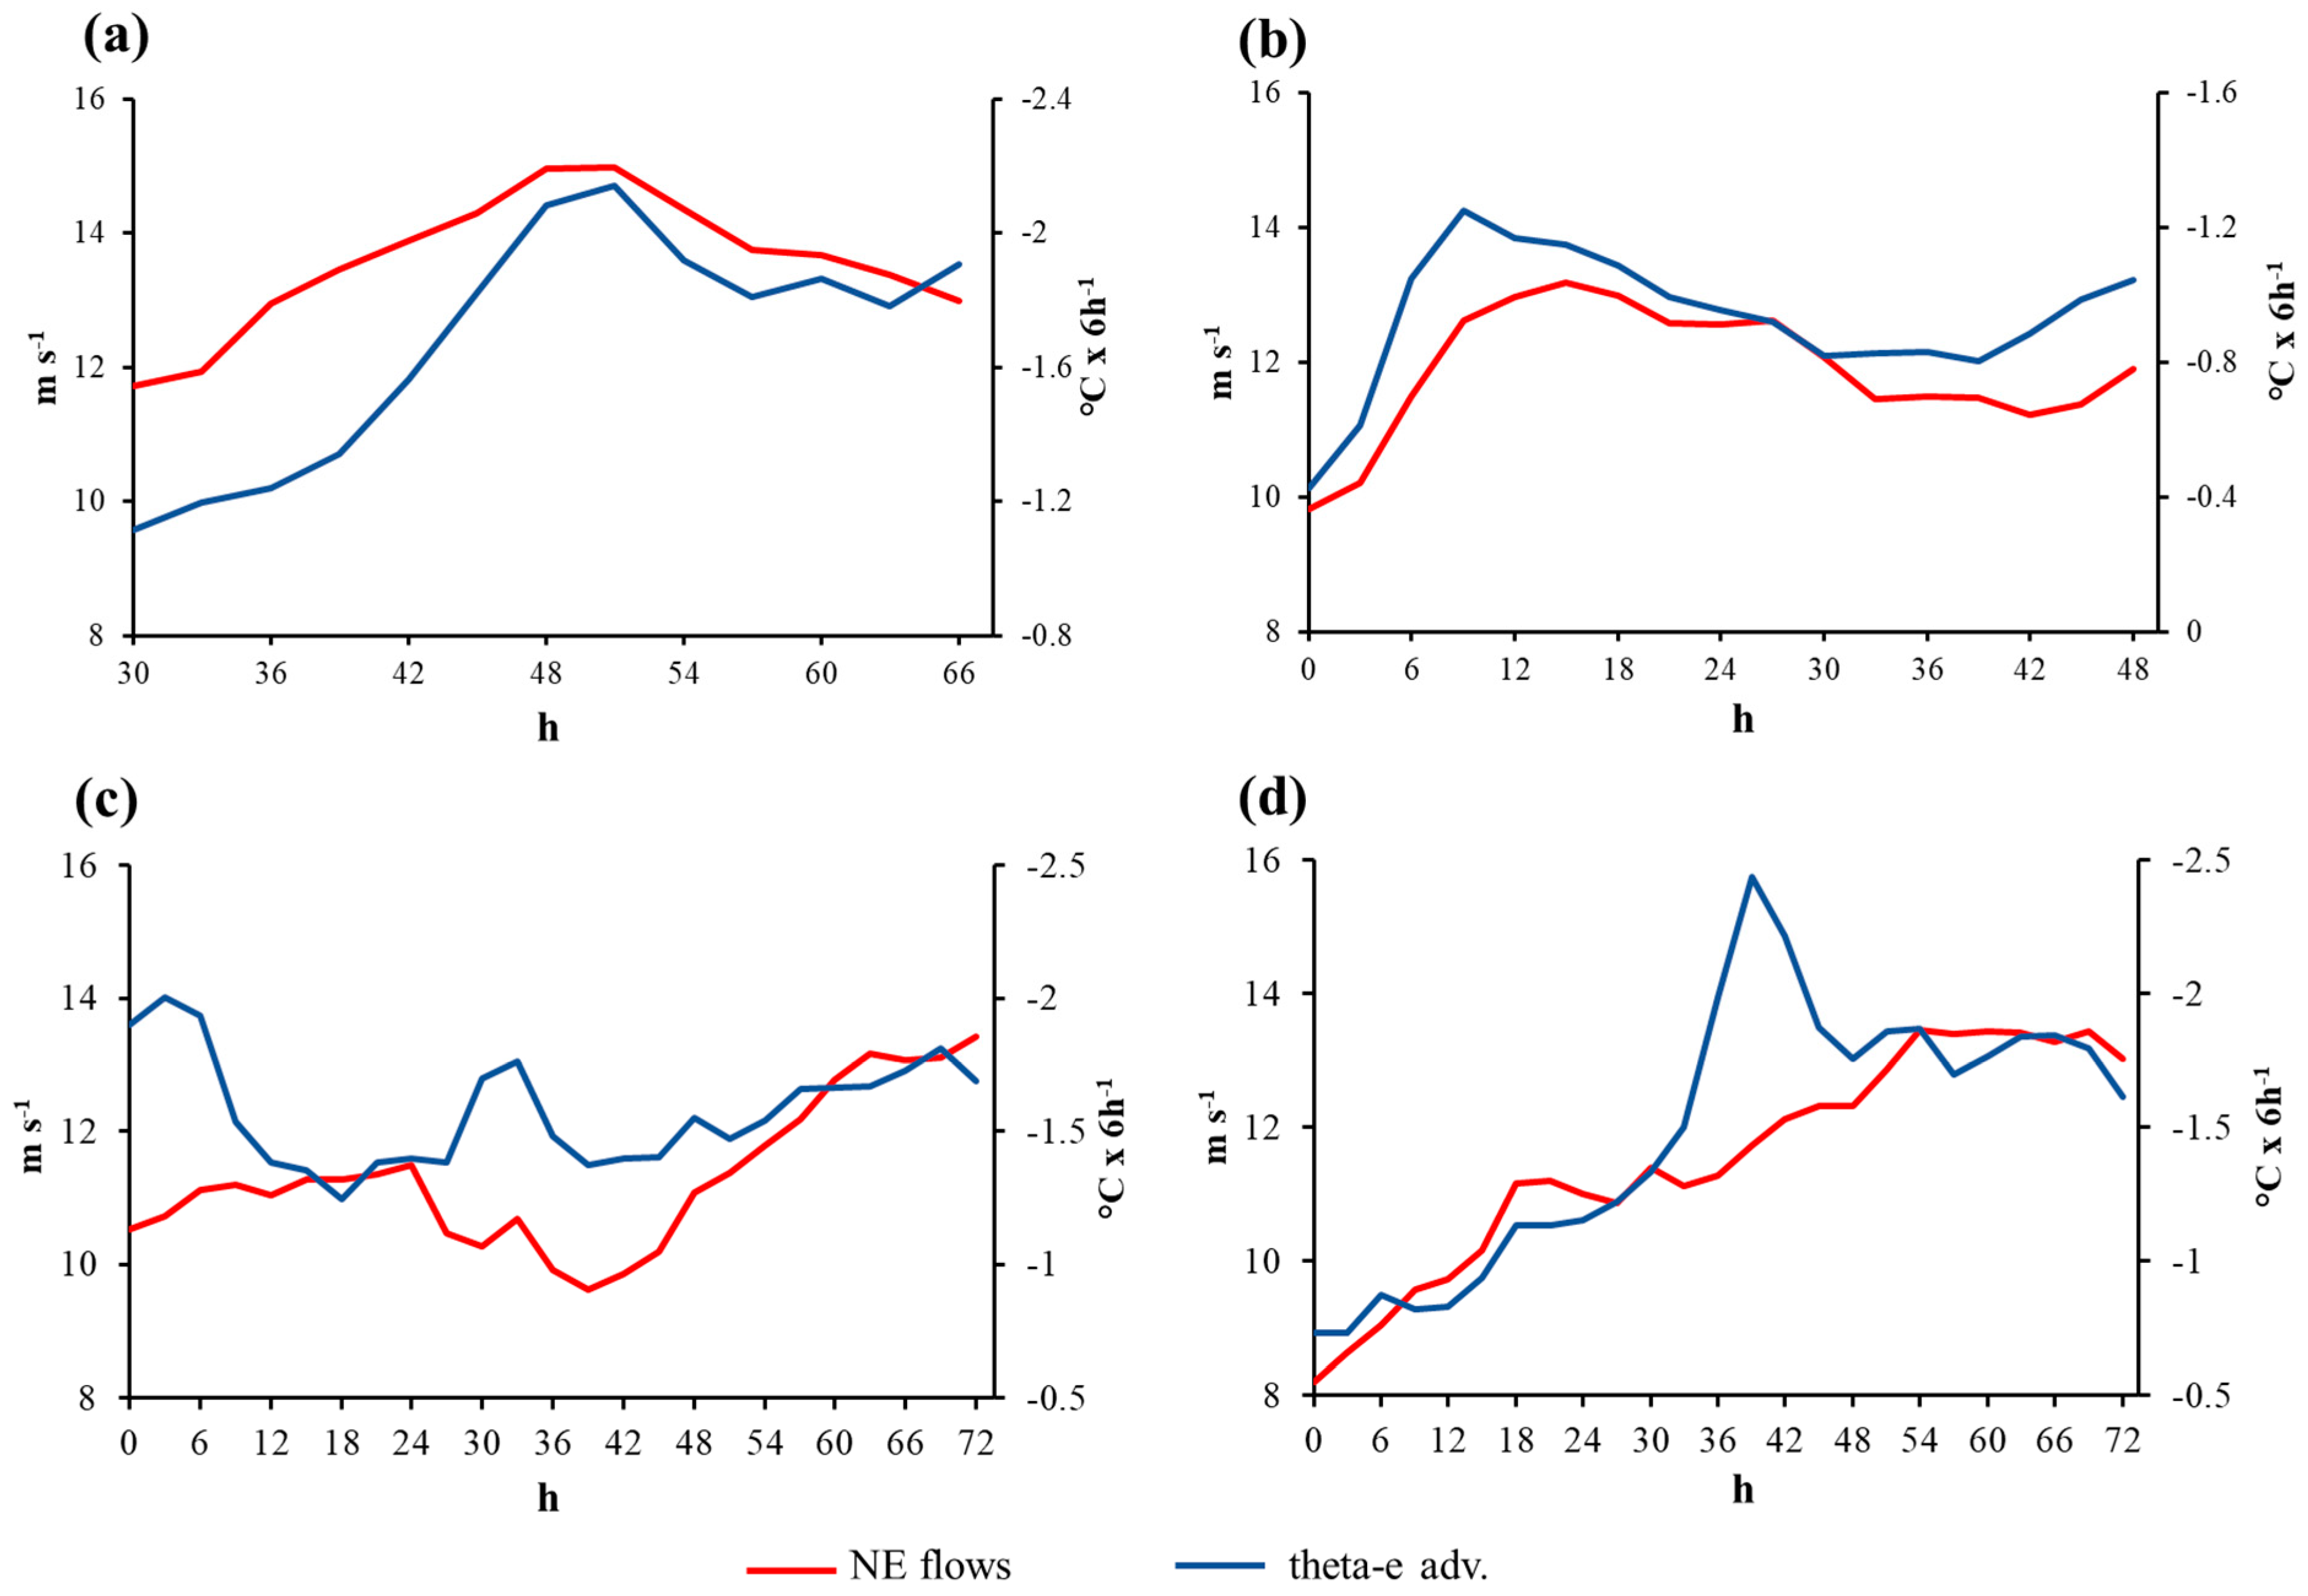
The time series of the 1000-hPa northeasterly flow and equivalent potential temperature advection in the upstream area for 0129W and Vamei are shown in Figure 6a,b. The correlation coefficients between the northeasterly flow and the cold advection are 0.84 and 0.85 for 0129W and Vamei, respectively, which pass the Pearson’s correlation test at a 95% confidence level. For 0129W, both the northeasterly flow and cold advection increase from 30 h to 48 h, and then decrease afterward. For Vamei, the northeasterly flow and cold advection decrease after 15 h and 9 h, respectively. For the non-formation cases, there is no apparent decreasing tendency for the upstream cold advection (Figure 6c). The stronger northeasterly flow and cold advection in the upstream area are not favorable for TC formation.
4. Sensitivity Experiments
To assess the impact of northeasterly flow on the formation of late-season TCs in the SCS, sensitivity tests with the modified intensity of the continental high are performed. A similar experiment procedure has been used in Chang (2013) [18] to explore the relationship between the high intensity and TC formation. The circulation (u and v) of the continental anticyclone over an area of 35° × 30°, which is centered at the highest surface pressure center of the continental high, is changed in the initial field or during the integration. A 5° buffer zone with a linear decreasing tendency is located at the boundary of each nested domain.
4.1. Change of Environmental Northeasterly in the Initial Field for Formation Cases
For each formation case, four sensitivity experiments are performed with the values of initial wind fields (anticyclonic circulation) being reduced to 80%, 60%, 40%, and 20% of the original values (only 60% and 20% experiments are shown in this paper; labeled as H60 and H20; Table 1). Because the model needs about 12–24 h to adjust before reaching a balanced state, results of the first 24 h for each experiment are not analyzed.
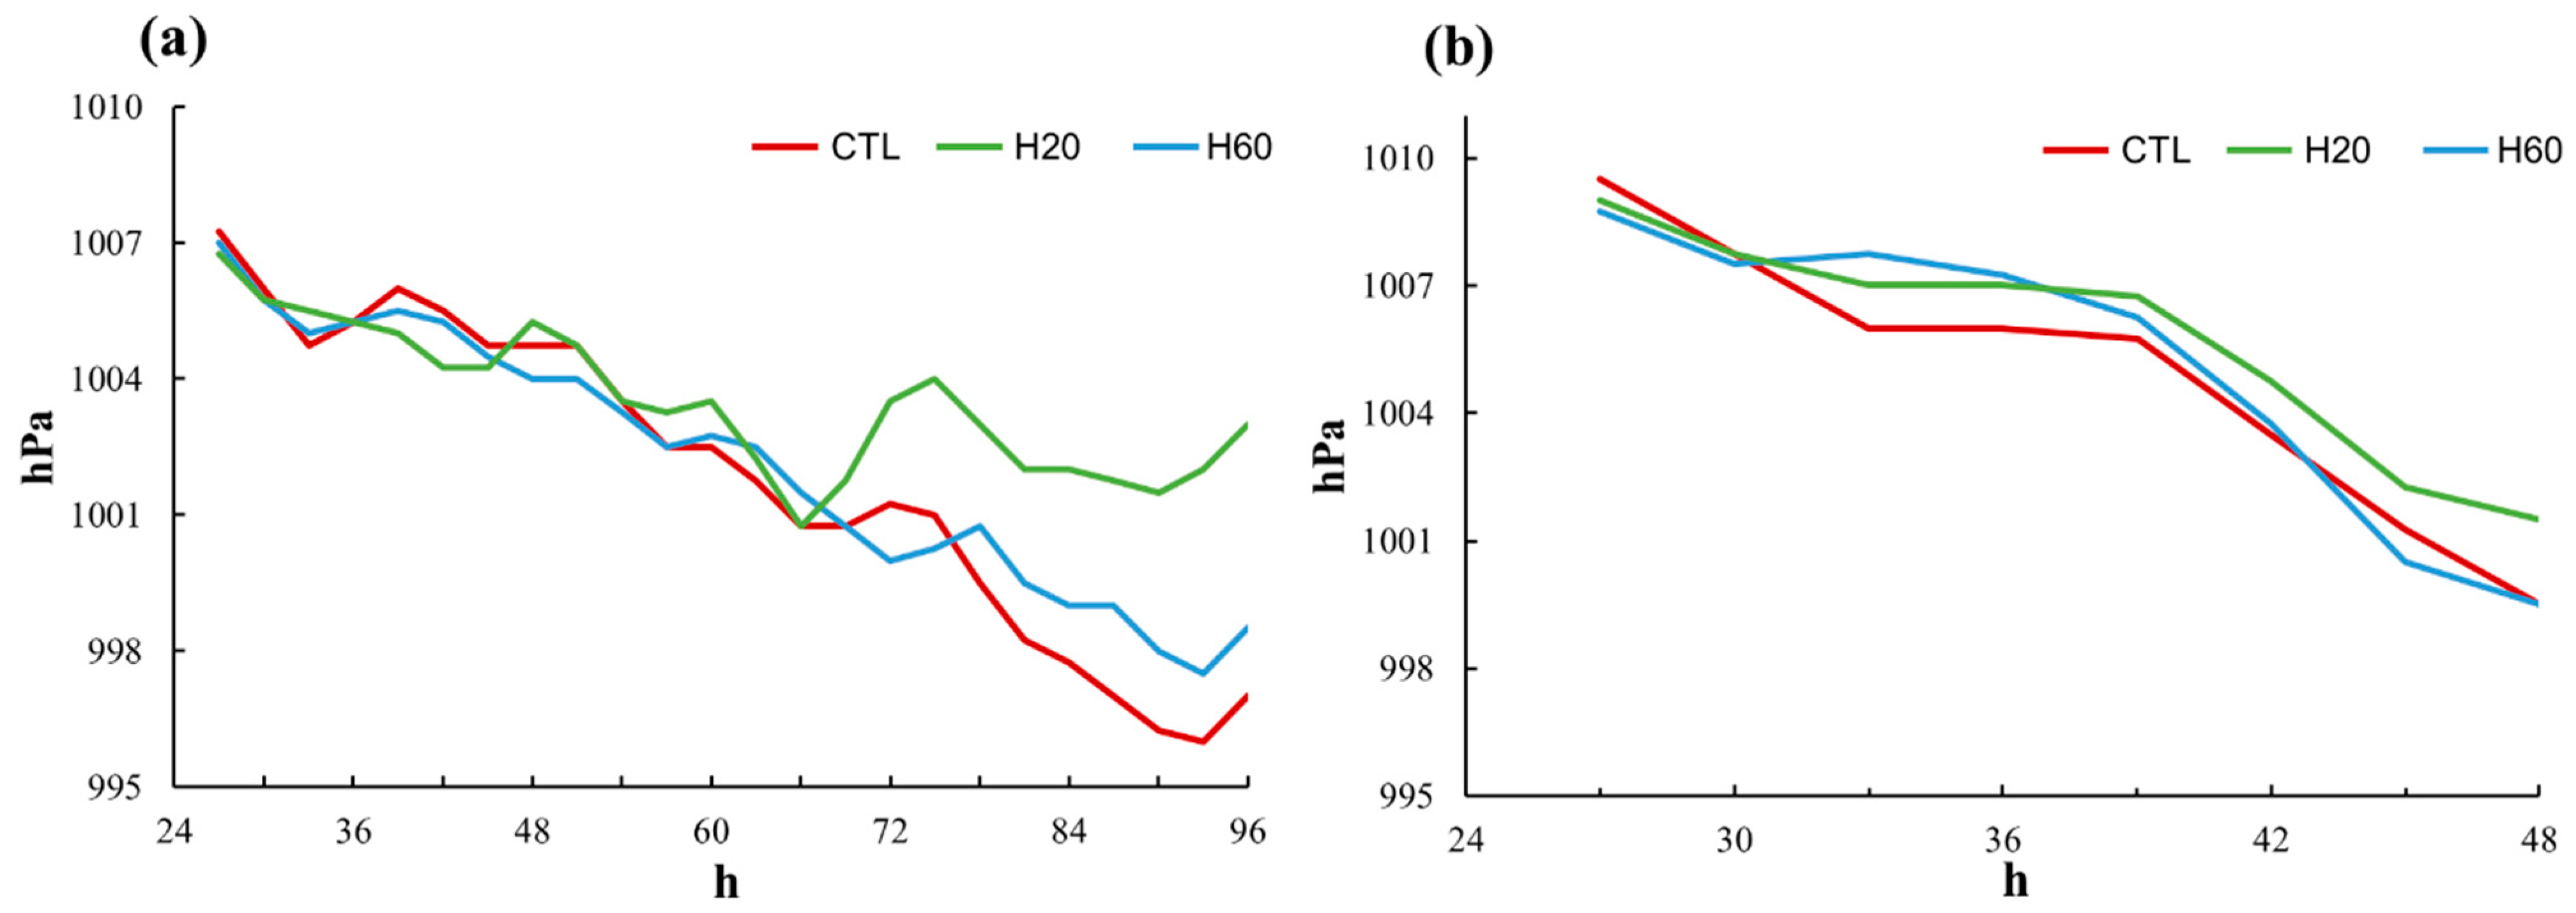
Results show that the maximum intensity of the simulated disturbance decreases when the strength of the continental high is reduced. As shown in Figure 7, the intensity changes in the sensitivity experiments and control run are similar before 66 h for 0129W and before 42 h for Vamei. For H60 experiments, the simulated pre-TC disturbances of 0129W and Vamei can still develop into TCs, but with higher minimum surface pressure compared to that of the control run. For H20 experiments, however, the minimum surface pressure of the simulated pre-TC disturbance remains around 1001 hPa after these times, and no TC forms. When the initial continental high is reduced (H60 and H20), the initial shear vorticity is also reduced, which is not favorable for TC formation. If the continental high is weakened to 20% of the original strength, the background environment cannot support TC formation. This result agrees with the finding of Lin and Lee (2011) [6]. In summary, the northeasterly flow can provide some favorable environmental conditions (e.g., initial shear vorticity) for the development of pre-TC disturbance.
4.2. Change of Environmental Northeasterly during Formation Process
For the formation cases, the weakening in the northeasterly flow affects the later development process of the disturbance and may be a key factor of TC formation within this type of environment. Therefore, sensitivity tests are further performed to assess the effects caused by changing the environmental northeasterly during the TC formation process. The WRF grid nudging technique [29] is used to maintain the changed magnitudes of the continental high during the simulation period. The intensity of continental high is weakened for the non-formation cases and strengthened for the formation cases during their formation process, as shown in Table 1.
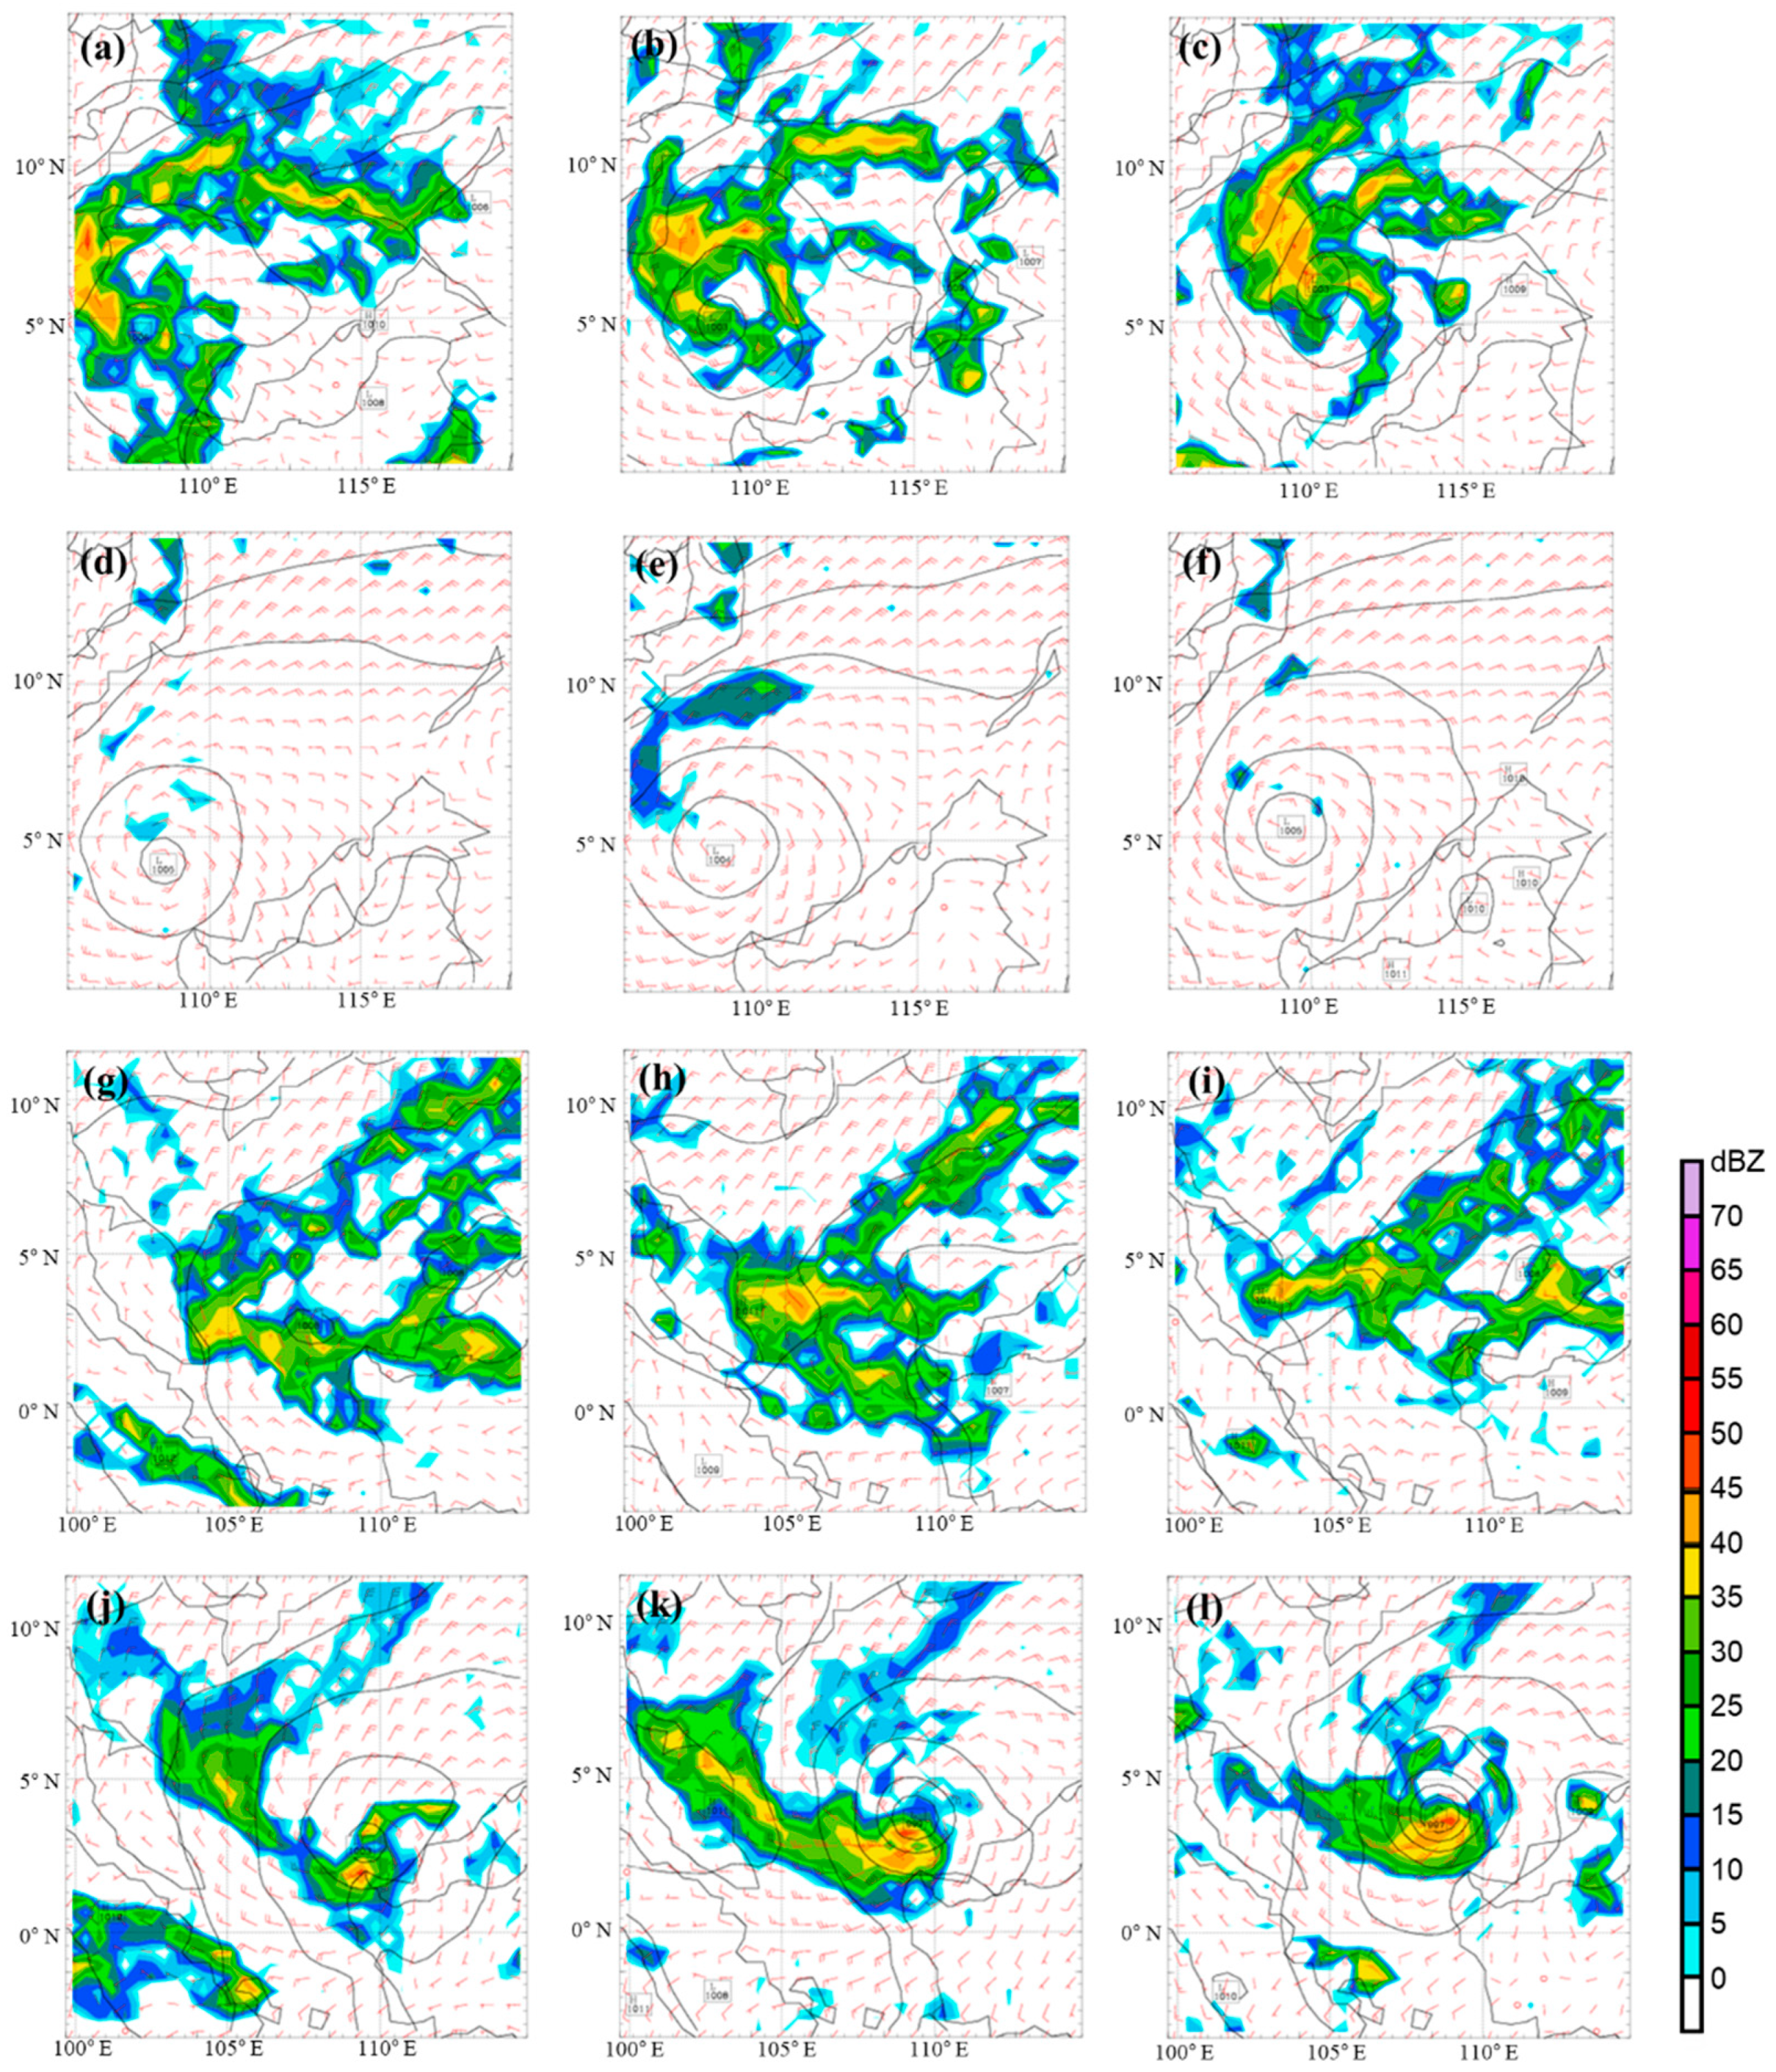
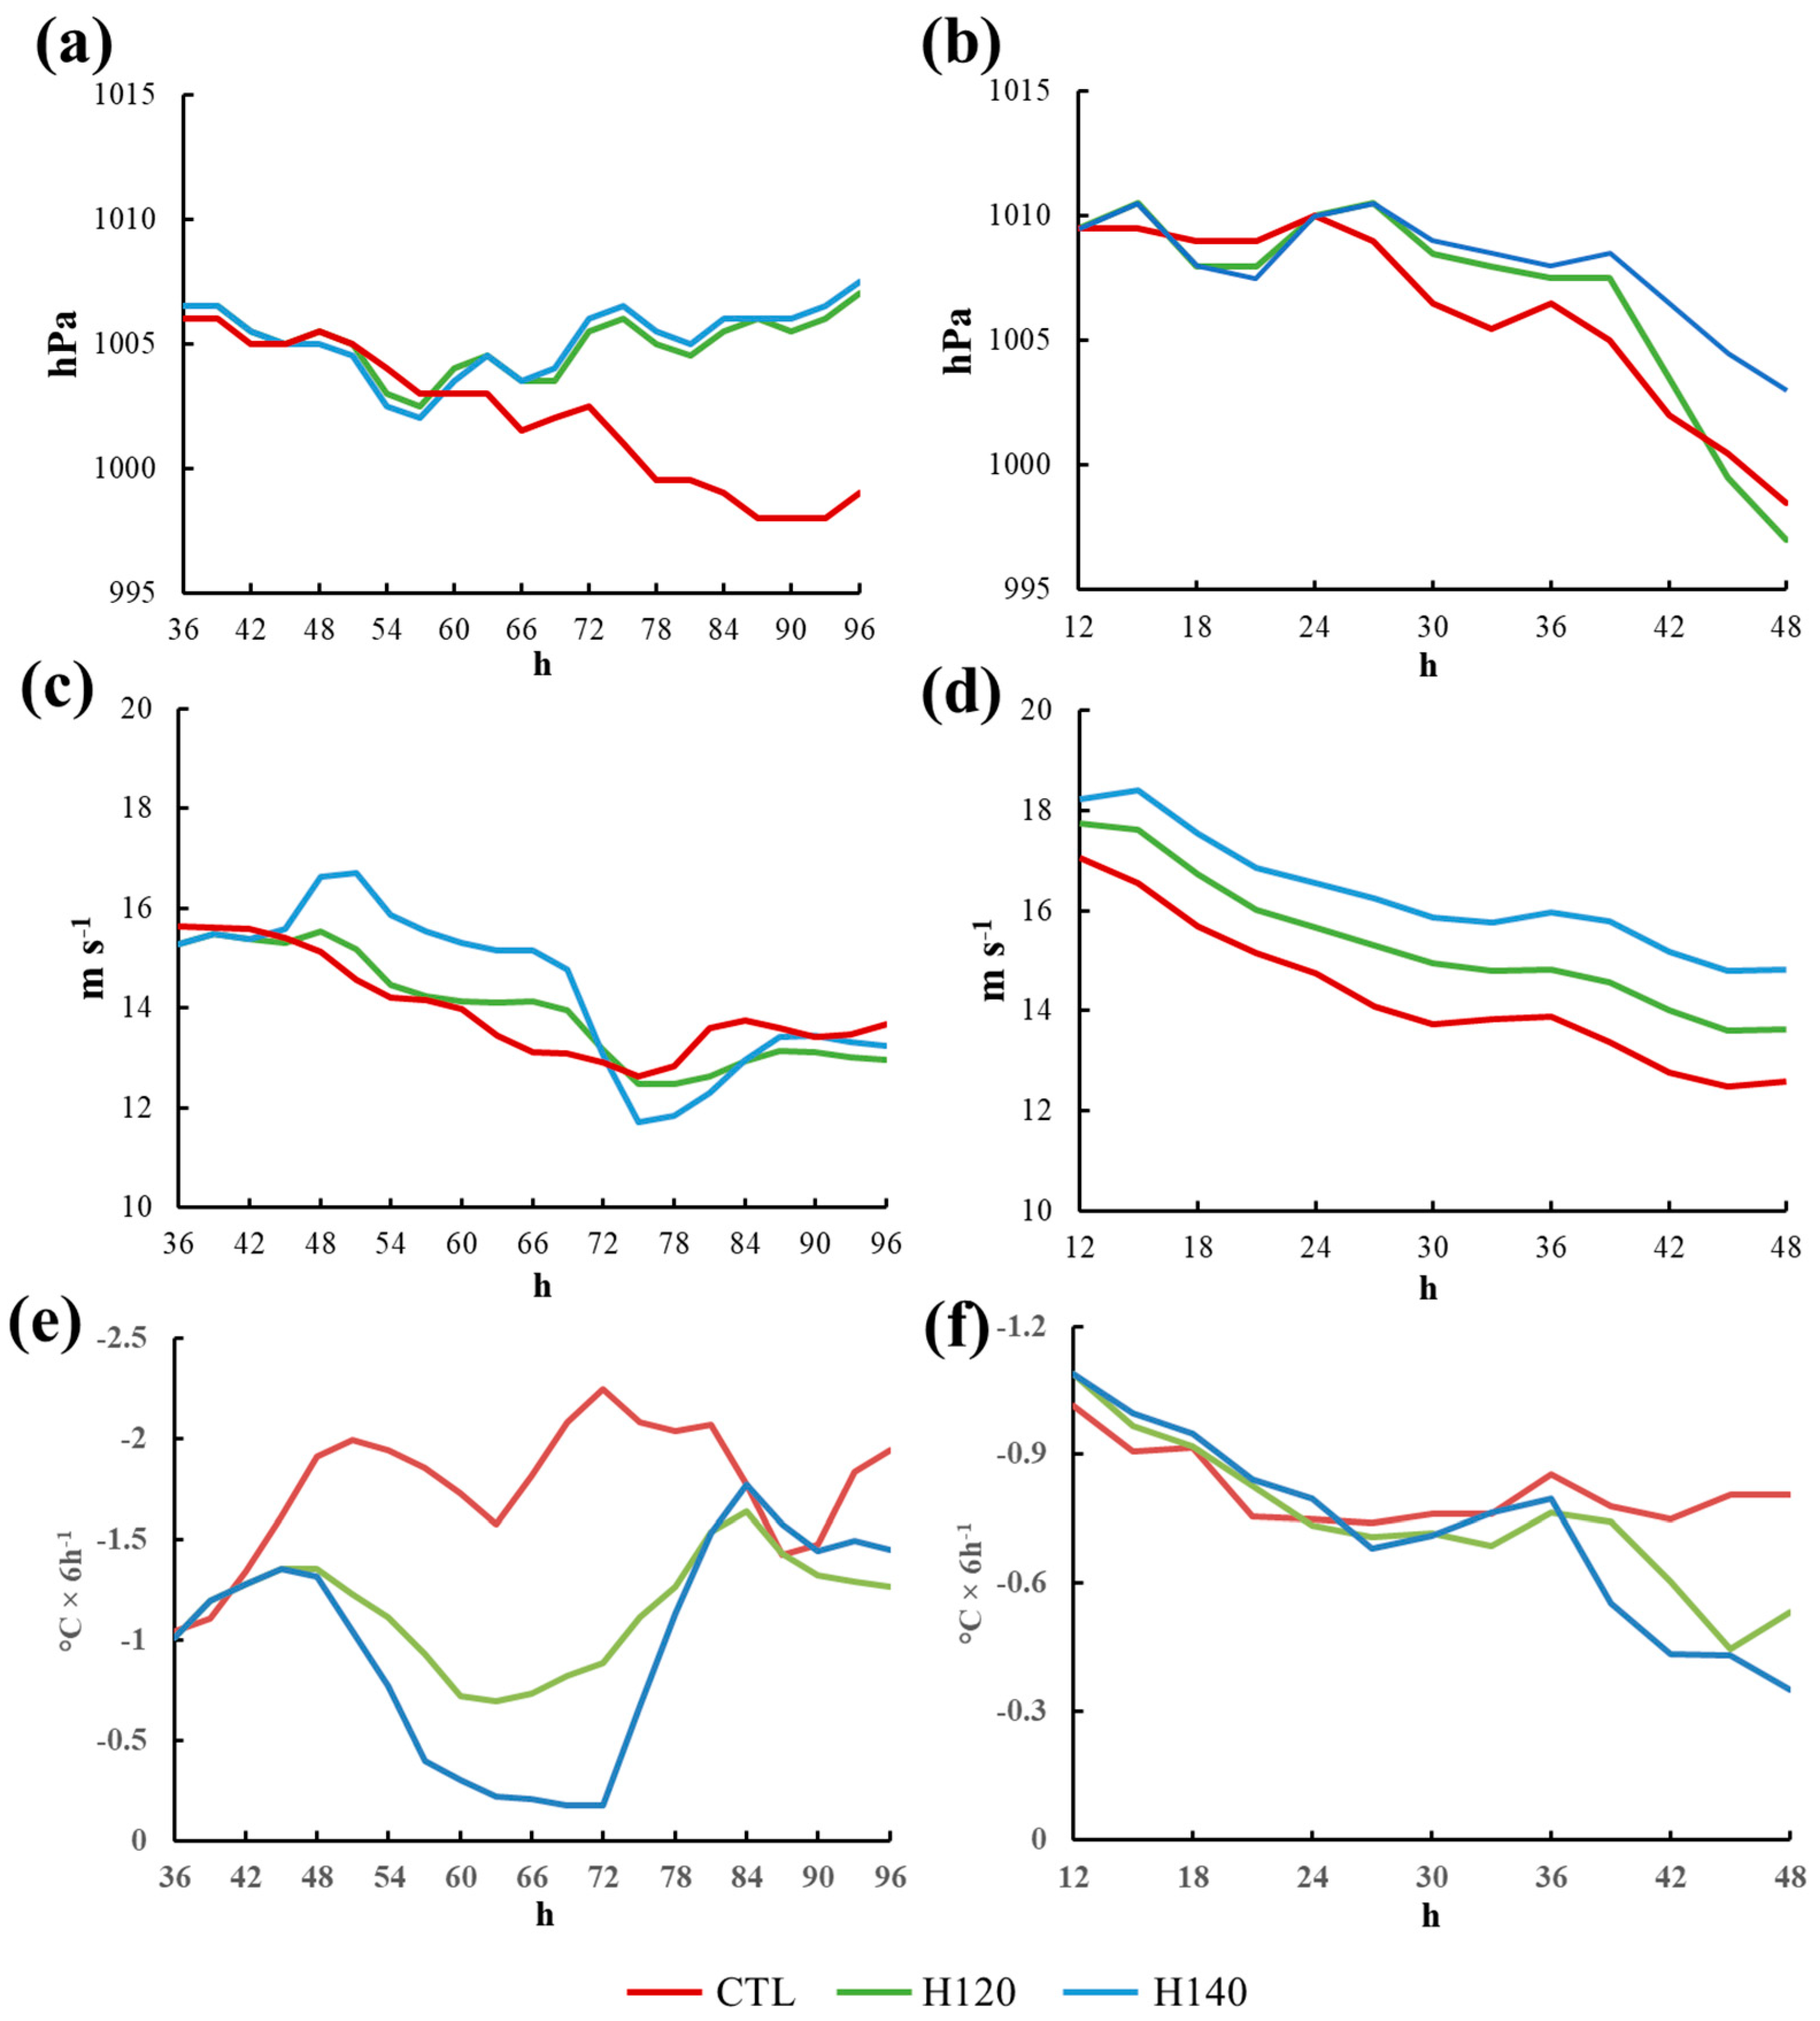
For the formation cases, the experiment setting is the same as that in Section 4.1, but the intensity of the continental high is increased by 20% and 40% (labeled as H120 or H140) compared to the original intensity. For 0129W, TC convective structure and cyclonic circulation can be simulated in the control run (Figure 8a−c) and the grid nudging technique is employed during the period 48–66 h of simulation for the sensitivity experiments. Note that the northeasterly flow for the control run of 0129W (shown in Section 3) shows a decreasing tendency during the period 48–66 h of simulation. As Figure 9c shows, the northeasterly flow of the sensitivity experiments for 0129W is 1–2 m s−1 stronger than that of the control run. The simulated disturbances weaken after 57 h of simulation (minimum surface pressure increases to 1007 hPa; Figure 9a), and do not develop into TCs (Figure 8d−f). The tendency of cold advection in the sensitivity experiments after 72 h (Figure 9e) is significantly increased than that of the control run, which is a potential factor causing TCs not forming in the sensitivity experiment.
For Vamei, the grid nudging technique is used during the period 12–48 h of simulation, which is the period with weakening northeasterly flow in the control run. When the northeasterly flow is enhanced in the sensitivity experiments (Figure 9d), the intensities of the simulated disturbances are lower than that of the control run (Figure 9b). Specifically, no TC formation is observed in H140, but a weak TC still forms in H120 (weaker than that of the control run in the first 44 h of simulation). The difference in disturbance intensity between the control run and the sensitivity experiments for Vamei is smaller than that of 0129W (Figure 9a,b). Note that the cold advection strength in the experiment of Vamei is not significantly increased, compared to that of 0129W, although the northeasterly flow is strengthened (Figure 9d,f). This indicates that although stronger northeasterly flow is not favorable for TC formation, the main suppressing effect on TC formation can be attributed to changes in cold advection intensity associated with the changes of the northeasterly flow.
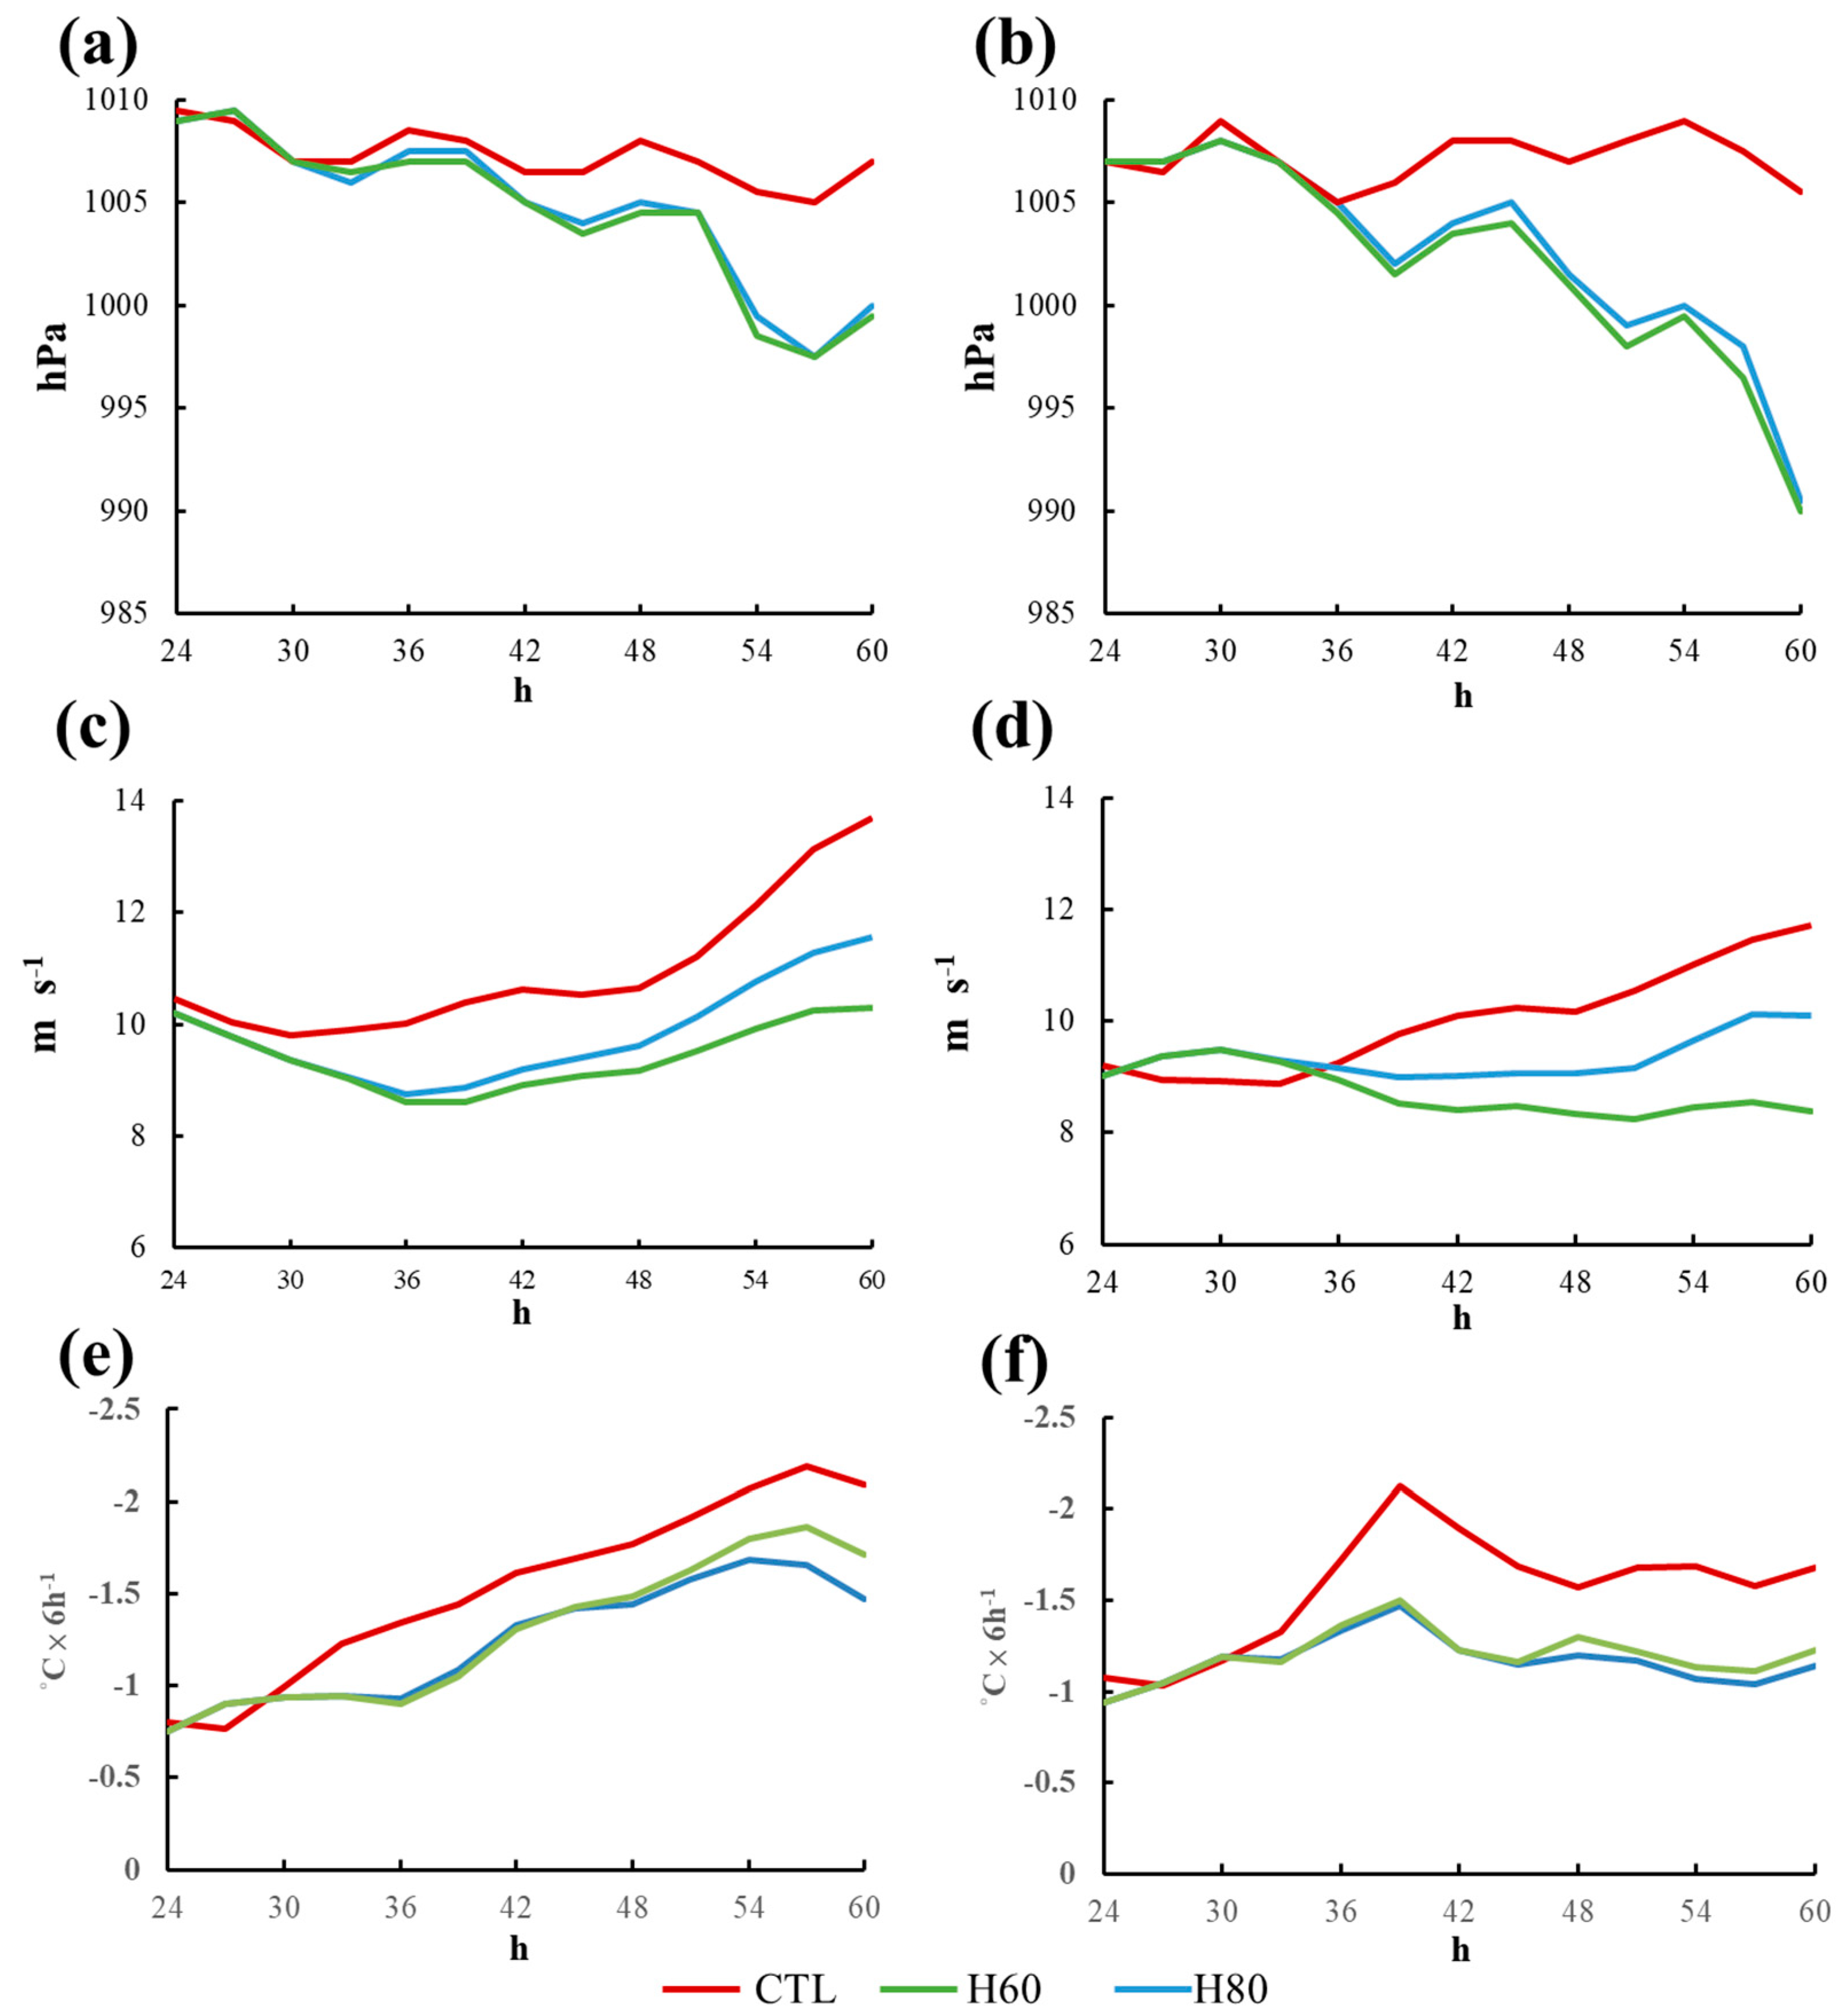
For the non-formation cases A and B, the experiment setting is the same as that of the formation cases, but the intensity of the continental high is reduced by 20% and 40% (labeled as H80 and H60) compared to the original intensity. No TC formation process occurs in the control run (Figure 8g−i) and the grid nudging technique is conducted during the period 36–72 h of simulation for the sensitivity experiments. The northeasterly flow is weaker than that of the control run after 36 h of simulation for these two cases (Figure 10c,d). The cold advection is also weaker in these sensitivity experiments and the simulated disturbances for both cases can develop into TCs (Figure 8j−l).
In summary, the northeasterly flow affects TC formation during the TC formation process by changing the low-level cold advection. Although the northeasterly flow can provide the initial shear vorticity favorable for TC formation, the strong cold advection associated with the northeasterly flow may suppress the development of the disturbance during TC formation process.
4.3. Analysis of the Effects of Northeasterly Flow on TC Formation
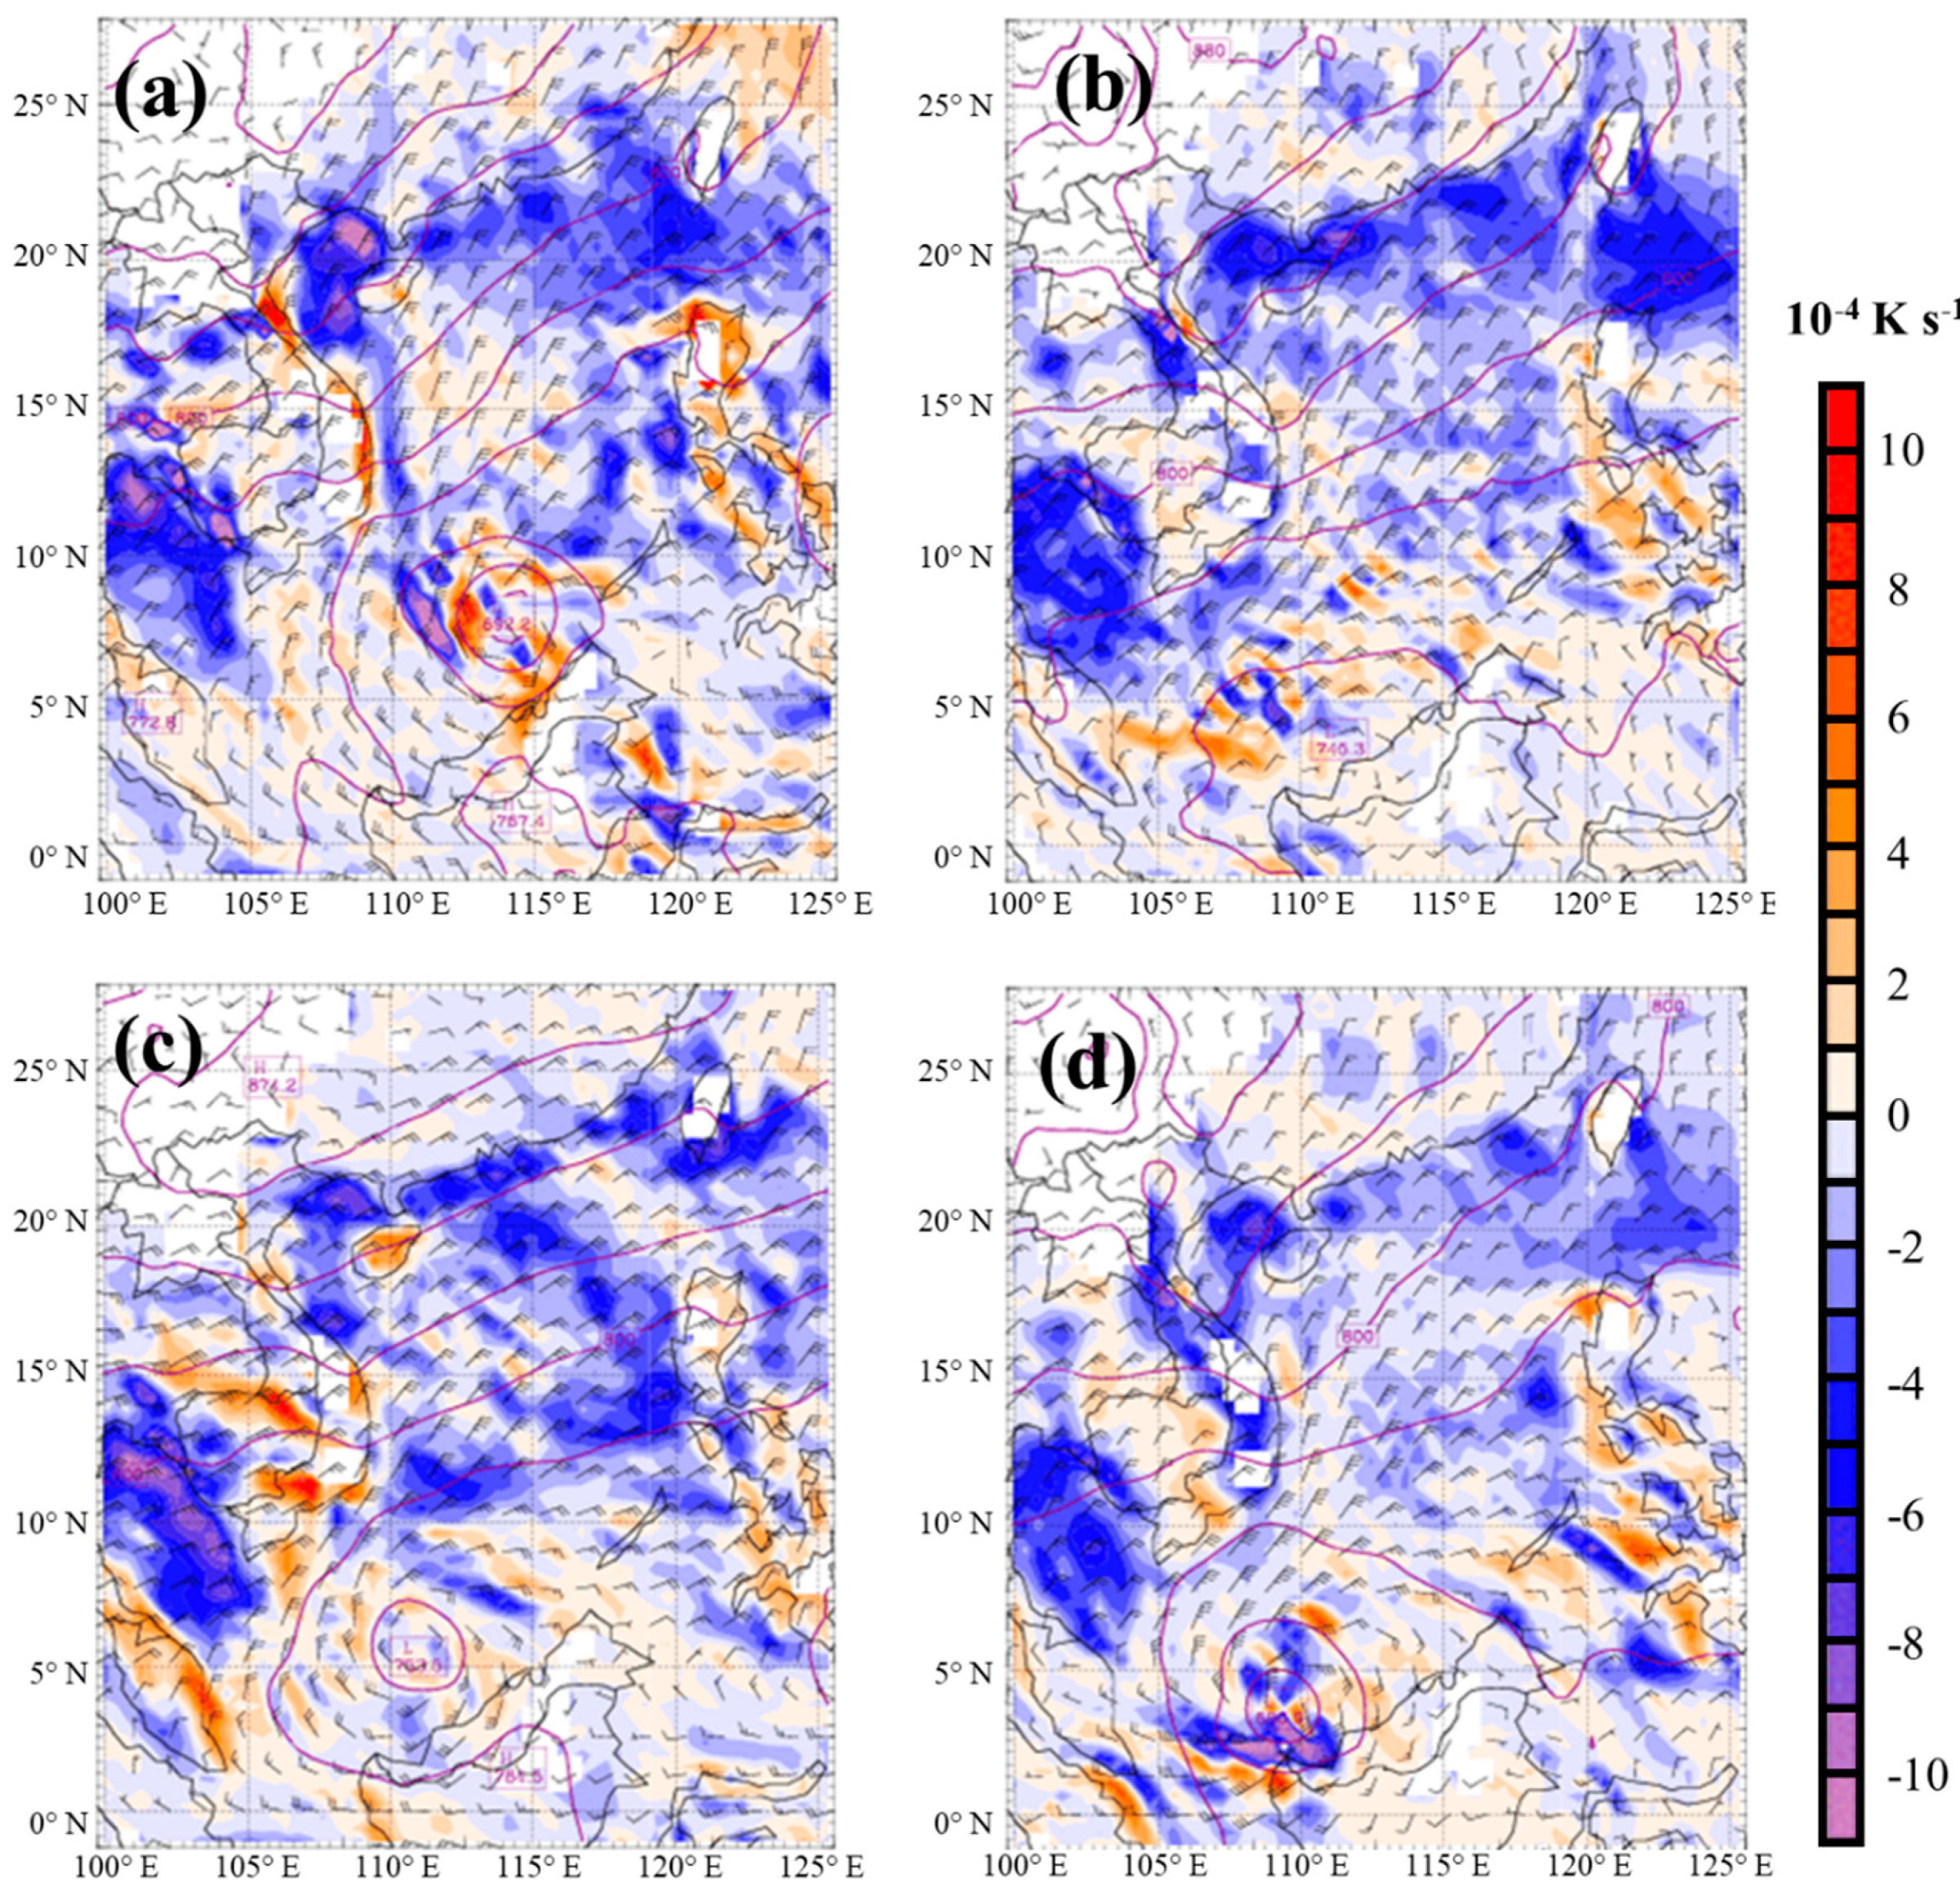
To address the effects of the cold and dry advection or the warm and moist advection on TC formation, the flow field and the equivalent potential temperature field are analyzed. To simplify the comparison and highlight the difference, this section presents only the results for the formation case 0129W and the non-formation case B. Figure 11a shows the 925-hPa flow fields and the equivalent potential temperature advection for the control run of 0129W at 84 h (during the TC formation process) when the cold advection weakens obviously in the northeastern SCS (as shown in Figure 9e). For the H140 experiment of 0129W, the simulated disturbance does not develop into a TC, due to the cold air intrusion from the northeastern SCS (Figure 11c). Conversely, for the non-formation case B, the 925-hPa cold and dry air spreads over the southern SCS in the control run (Figure 11b), which is not favorable for the formation of a TC. However, in the H60 experiment of case B, the cold advection retreats from the southern SCS (Figure 11d) and the simulated disturbance can develop to a TC.
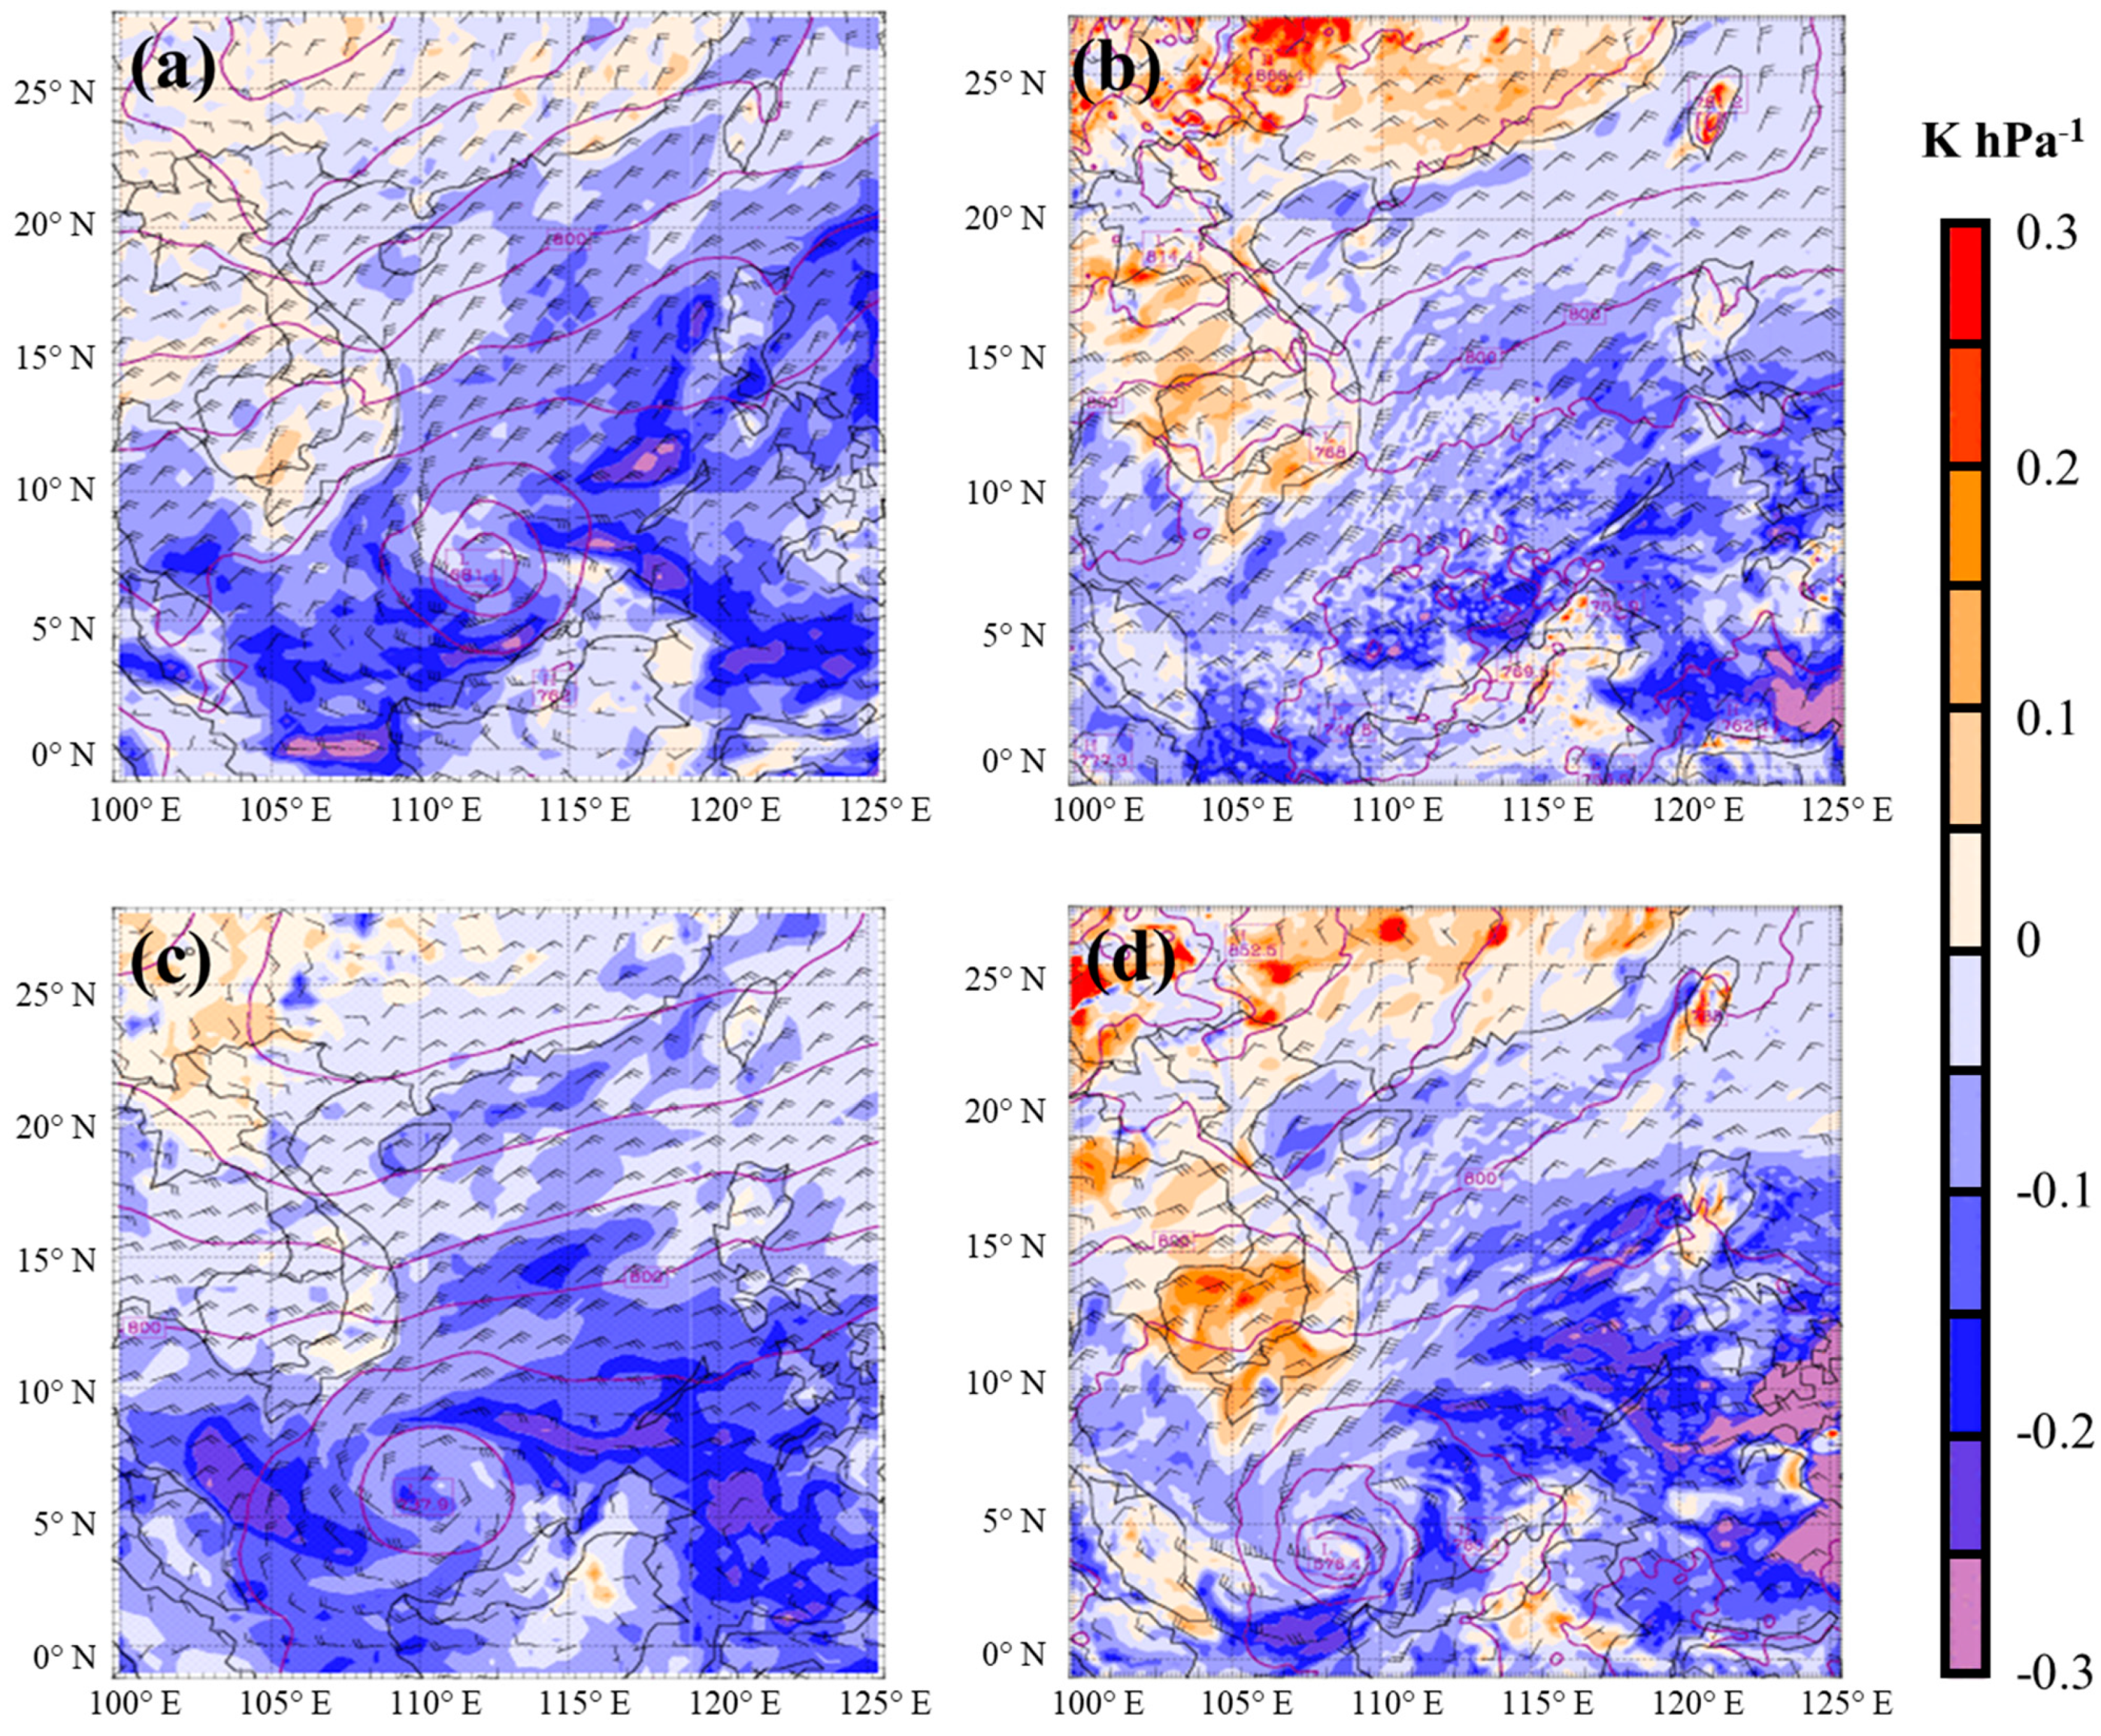
Figure 12 shows the convective instability at 925-hPa for the formation and the non-formation cases. Results show that for the formation case 0129W (Figure 12a,c), the convective instability of the control run is much stronger in the SCS during the formation process than that of the sensitivity experiment (H140). For the non-formation case B (Figure 12b,d), conversely, the convective instability in the SCS is much stronger for the sensitivity experiment (H60) than that of the control experiment. Figure 12d also shows that the air parcels with stronger instability to the North of Borneo tend to propagate gradually toward the northeast of the disturbance.
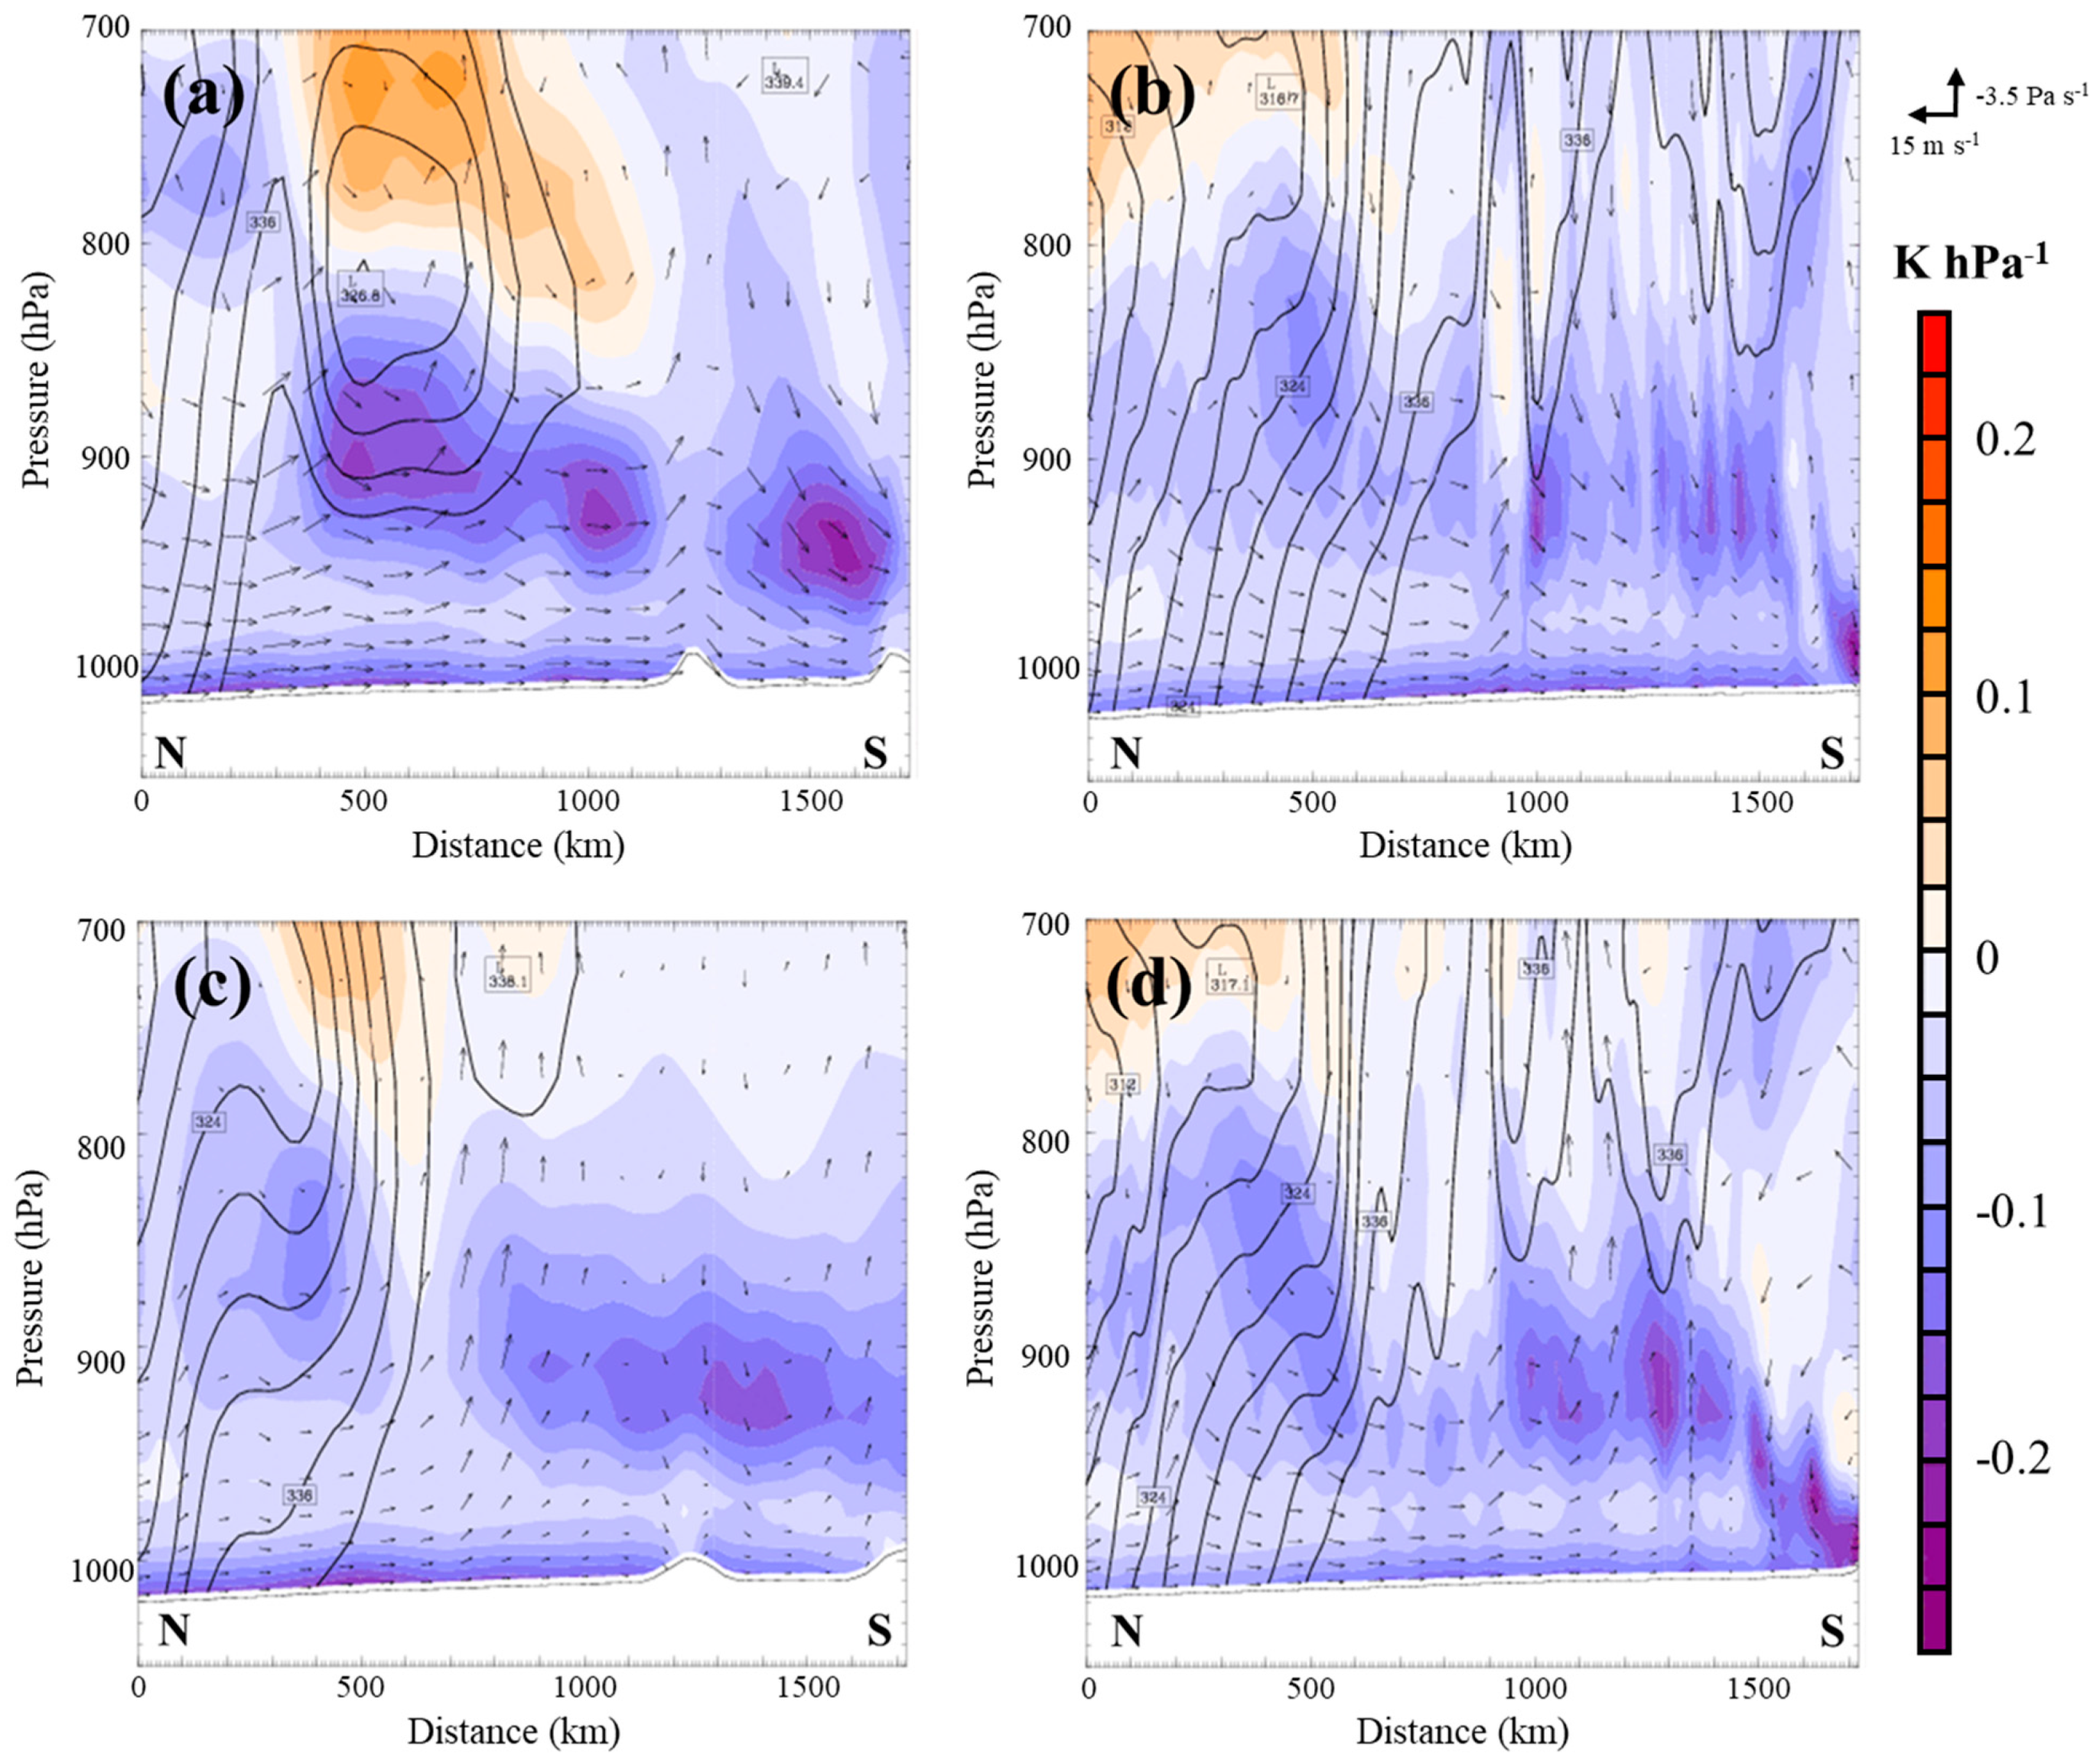
Moreover, Figure 13 shows the south-north cross-section of convective instability below 700 hPa at 118.5° E and 115° E for the formation and non-formation cases, respectively (about 600–800 km to the east of the disturbance center). According to Lin and Lee (2011) [6], the strength of the environmental northeasterly flow at the region 600–800 km to the east of the disturbance center, rather than the region close to the disturbance center, plays key role in differentiating the TC formation process over the SCS. The vertical development at the initial stage of the TC formation process is much shallower (below 700 hPa) over the SCS in the late season, compared to that in the WNP. During the formation process, a peak instability is observed at 900 hPa in the control run of 0129W (Figure 13a). This area with high instability is larger than that of H140 (Figure 13c). Specifically, the low-level cold air retreats from the northern SCS associated with the increase in equivalent potential temperature, which favors TC formation in the control run. In turn, the area of higher (>339-K) equivalent potential temperature extends further southward in the experiment of H60 for the non-formation case B (Figure 13d) compared to that of the control run (Figure 13b). This increases the low-level convective instability and favors TC formation.
To highlight the contribution of northeasterly flow to TC formation, the air parcels transporting toward the disturbance from different quadrants are further compared among the experiments. The backward trajectory analysis method of the Read Interpolate Plot version 4.7 is applied in this section. Sixty-four air parcel seeds are homogeneously placed at 345-K level (~1000 hPa) within a 6° × 6° box centered at the disturbance center for each experiment, and then are backward tracked during the nudging period. For 0129W, compared to the control run, the experiment H140 (with an environment with the stronger northeasterly flow) has a relatively higher percentage of air parcels coming from the northeast quadrant of the disturbance center (Table 2), and no TC formation occurs. However, for the non-formation case B, more air parcels coming from the southwest quadrant of the disturbance center are transported into the disturbance when the northeasterly flow is weakened in the experiment H60 (Table 2), and the disturbance can develop into a TC. These results show that the advection of the cold and dry air from the northeast of the disturbance tends to suppress the further development of the disturbance. In contrast, the advection of the warm and moist air from the southwest of the disturbance is more favorable for the further development of the disturbance.
In summary, in the SCS during the late season, the upstream cold and dry northeasterly flow is an unfavorable environmental condition for the TC formation process, based on the results of sensitivity experiments (Table 3). Although the strong northeasterly flow might provide an environment with strong shear vorticity, which is favorable for the formation of the initial disturbance, the disturbance would have less probability to further develop into a TC if the northeasterly flow keeps bringing cold and dry air from the northern SCS to the disturbance region. Conversely, a weakening in the northeasterly flow or more air transported from the southern SCS to the disturbance region would provide a higher probability for a disturbance to develop into a TC.
5. Discussion and Summary
In the SCS, the relative percentage of TCs that form in the late typhoon season is higher than that in the WNP, especially in December. The characteristics of TC formation in the SCS are likely different from those over the other basins. Most of the previous studies focused on the specific favorable environmental conditions for TC formation in the SCS, such as the shear vorticity and the warm ocean water [6,30], but the unfavorable conditions for TC formation are rarely discussed. In the SCS, some incipient disturbances can develop into TCs if the characteristics of strong environmental northeasterly are changed. This is a challenge for accurate TC formation forecasts. Strong northeasterly flow over the SCS provides different contributions to TC formation, depending on its strength, direction, and timing. The environment with the strong northeasterly flow is not a common circulation pattern for TC formation in the WNP [5,31,32,33]; thus, the interaction between northeasterly flow and pre-TC disturbance is still unclear. To increase our understanding of TC formation and improve the forecast skill of TC formation in the SCS, this study explores and quantifies the importance of strong northeasterly flow for TC formation in the SCS using numerical experiments.
Two formation cases (0129W and Vamei) and two non-formation cases (cases A and B) are simulated and compared in this study. When the environmental northeasterly in the initial field is weakened, the development of the simulated pre-TC disturbance is suppressed because the environmental shear vorticity is also weakened. However, during the developing phase of the pre-TC disturbance, the strong upstream low-level northeasterly flow may strengthen the cold and dry advection around the disturbance region, which would suppress the TC formation process. Conversely, if the upstream low-level northeasterly flow is weakened during the developing phase of disturbance, the simulated disturbance can develop into a TC in the sensitivity experiments for the non-formation cases. Although the performance whether TC forms in sensitivity experiments is similar for 0129W and Vamei, the corresponding changes in sensitivity experiments for Vamei are smaller than those for 0129W. This is likely because that Vamei is a rapid development case (i.e., developed to TS stage in 6 h after the first JTWC TC formation alert) and has a weak cold advection in observations. In addition, the formation of Vamei is associated with negative effects of the intraseasonal oscillation, and occurs nearby the equator [6,11]. Compared to 0129W, Vamei has less favorable large-scale environmental conditions; thus its formation process has a higher proportion contributed by mesoscale or convective-scale mechanisms [34,35]. These characteristics may cause the formation of Vamei to be less sensitive to large-scale northeasterly.
In summary, TC formation over the SCS in the late season is highly sensitive to the strength and timing of northeasterly. This study characterizes and discusses the different contributions of northeasterly flow to TC formation. Stronger northeasterly flow might result in stronger cold and dry air being transported from the northern SCS to the disturbance region, which is not favorable for TC formation. Although weaker northeasterly flow may reduce the cold and dry advection toward the disturbance region, it also reduces the environmental shear vorticity, which is another important factor for TC formation. Therefore, an accurate upstream northeasterly forecast can improve the forecast skill of TC formation in the SCS and advance the TC warning time for the coastal countries of the SCS. This study can be a critical reference for ensemble forecast, and the spatial and temporal selections of data assimilation for the SCS TC forecast.
Author Contributions
Y.-L.L. conducted the simulations and analyzed the results during his Ph.D. study under the supervision of C.-S.L. Y.-L.L. also wrote the first draft of the manuscript. H.-F.T. restructured the results and completed the final manuscript and responses. Y.-H.H. reviewed the manuscript and revised the figures. C.-S.L. reviewed and improved the manuscript, and supported this study. All authors have read and agreed to the manuscript submission and publication.
Funding
This study and the article processing charge are supported by the Ministry of Science and Technology of the Republic of China (Taiwan) under grants 109-2111-M-002-006, 109-2625-M-002-024, and 110-2625-M-002-004. The National Center for Atmospheric Research is sponsored by the National Science Foundation.
Institutional Review Board Statement
Not applicable.
Informed Consent Statement
Not applicable.
Data Availability Statement
All data used in this study can be found on the website of the Research Data Archive of Computational and Information Systems Laboratory, i.e., https://rda.ucar.edu/, accessed on 31 August 2021.
Acknowledgments
The authors thank three anonymous reviewers who provided constructive comments for this paper.
Conflicts of Interest
The authors declare no conflict of interest.
References
- Wang, G.; Su, J.; Ding, Y.; Chen, D. Tropical cyclone genesis over the South China Sea. J. Mar. Syst. 2007, 68, 318–326. [Google Scholar] [CrossRef]
- Haghroosta, T.; Ismail, W.R. Typhoon activity and some important parameters in the South China Sea. Weather Clim. Extrem. 2017, 17, 29–35. [Google Scholar] [CrossRef] [Green Version]
- Gray, W.M. The formation of tropical cyclones. Meteor. Atmos. Phys. 1998, 67, 37–69. [Google Scholar] [CrossRef]
- Teng, H.F.; Lee, C.S.; Hsu, H.H. Influence of ENSO on formation of tropical cloud clusters and their development into tropical cyclones in the western North Pacific. Geophys. Res. Lett. 2014, 41, 9120–9126. [Google Scholar] [CrossRef]
- Teng, H.F.; Lee, C.S.; Hsu, H.H.; Done, J.M.; Holland, G.J. Tropical cloud cluster environments and their importance for tropical cyclone formation. J. Clim. 2019, 32, 4069–4088. [Google Scholar] [CrossRef]
- Lin, Y.-L.; Lee, C.-S. An analysis of tropical cyclone formations in the South China Sea during the late season. Mon. Weather Rev. 2011, 139, 2748–2760. [Google Scholar] [CrossRef] [Green Version]
- Lee, C.-S.; Lin, Y.-L.; Cheung, K.K.W. Tropical cyclone formations in the South China Sea associated with the Mei-Yu front. Mon. Weather Rev. 2006, 134, 2670–2687. [Google Scholar] [CrossRef]
- Williams, M.; Houze, R.A. Satellite-observed characteristics of winter monsoon cloud clusters. Mon. Weather Rev. 1987, 115, 505–519. [Google Scholar] [CrossRef] [Green Version]
- Cheang, B.K. Synoptic features and structures of some equatorial vortices over the South China Sea in the Malaysian region during the winter monsoon of December 1973. Pure Appl. Geophys. 1977, 115, 1303–1333. [Google Scholar] [CrossRef]
- Chang, C.P.; Erickson, J.E.; Lau, K.M. Northeasterly cold surges and near-equatorial disturbances over the winter MONEX area during December 1974. Part I: Synoptic aspects. Mon. Weather Rev. 1979, 107, 812–829. [Google Scholar] [CrossRef] [Green Version]
- Chang, C.P.; Liu, C.-H.; Kuo, H.-C. Typhoon Vamei: An equatorial tropical cyclone formation. Geophys. Res. Lett. 2003, 30, 1151–1154. [Google Scholar] [CrossRef] [Green Version]
- Chandrasekar, R.; Balaji, C. Sensitivity of tropical cyclone Jal simulations to physics parameterizations. J. Earth Syst. Sci. 2012, 121, 923–946. [Google Scholar] [CrossRef] [Green Version]
- Chandrasekar, R.; Balaji, C. Impact of physics parameterization and 3DVAR data assimilation on prediction of tropical cyclones in the Bay of Bengal region. Nat. Hazards 2016, 80, 223–247. [Google Scholar] [CrossRef]
- Srinivas, C.V.; Bhaskar Rao, D.V.; Yesubabu, V.; Baskaran, R.; Venkatraman, B. Tropical cyclone predictions over the Bay of Bengal using the high-resolution Advanced Research Weather Research and Forecasting (ARW) model. Q. J. R. Meteorol. Soc. 2013, 139, 1810–1825. [Google Scholar] [CrossRef]
- Mohan, P.R.; Srinivas, C.V.; Yesubabu, V.; Baskaran, R.; Venkatraman, B. Tropical cyclone simulations over Bay of Bengal with ARW model: Sensitivity to cloud microphysics schemes. Atmos. Res. 2019, 230, 104651. [Google Scholar] [CrossRef]
- Vijaya Kumari, K.; Karuna Sagar, S.; Viswanadhapalli, Y.; Dasari, H.P.; Vijaya Bhaskara Rao, S. Role of planetary boundary layer processes in the simulation of tropical cyclones over the Bay of Bengal. Pure Appl. Geophys. 2019, 176, 951–977. [Google Scholar] [CrossRef] [Green Version]
- Hsieh, Y.H.; Lee, C.S.; Sui, C.H. A study on the influences of low-frequency vorticity on tropical cyclone formation in the western North Pacific. Mon. Weather Rev. 2017, 145, 4151–4169. [Google Scholar] [CrossRef]
- Chang, L.Y. Tropical Cyclone Formation Associated with Trade-Wind Surges. Ph.D. Thesis, Department of Atmospheric Sciences, National Taiwan University, Taipei, Taiwan, 2013; 203p. [Google Scholar]
- Teng, H.F.; Kuo, Y.H.; Done, J.M. Importance of mid-level moisture for tropical cyclone formation in easterly and monsoon environments over the western North Pacific. Mon. Weather Rev. 2021, 149, 2449–2469. [Google Scholar]
- Boukabara, S.-A.; Hoffman, R.N.; Grassotti, C.; Leidner, S.M. Physically-based modeling of QSCAT SeaWinds passive microwave measurements for rain detection. J. Geophys. Res. 2002, 107, 4786. [Google Scholar] [CrossRef]
- Weissman, D.E.; Bourassa, M.A.; Tongue, J. Effects of rain rate and wind magnitude on SeaWinds scatterometer wind speed errors. J. Atmos. Ocean. Technol. 2002, 19, 738–746. [Google Scholar] [CrossRef]
- Skamarock, W.C.; Klemp, J.B.; Dudhia, J.; Gill, D.O.; Barker, D.M.; Wang, W.; Powers, J.G. A Description of the Advanced Research WRF Version 2; National Center for Atmospheric Research: Boulder City, NV, USA, 2005; 100p. [Google Scholar]
- Hong, S.-Y.; Dudhia, J.; Chen, S. A revised approach to ice microphysical processes for the bulk parameterization of clouds and precipitation. Mon. Weather Rev. 2004, 132, 103–120. [Google Scholar] [CrossRef]
- Kain, J.S.; Fritsch, J.M. Convective parameterization for mesoscale models: The Kain-Fritsch scheme. In The Representation of Cumulus Convection in Numerical Models; Emanuel, K.A., Raymond, D.J., Eds.; Meteorological Monographs. American Meteorological Society: Boston, MA, USA, 1993; Volume 24, pp. 165–170. [Google Scholar]
- Hong, S.-Y.; Noh, Y.; Dudhia, J. A new vertical diffusion package with an explicit treatment of entrainment processes. Mon. Weather Rev. 2006, 134, 2318–2341. [Google Scholar] [CrossRef] [Green Version]
- Dudhia, J. Numerical study of convection observed during the winter monsoon experiment using a mesoscale two-dimensional model. J. Atmos. Sci. 1989, 46, 3077–3107. [Google Scholar] [CrossRef]
- Mlawer, E.J.; Taubman, S.J.; Brown, P.D.; Iacono, M.J.; Clough, S.A. Radiative transfer for inhomogeneous atmosphere: RRTM, a validated correlated-k model for the longwave. J. Geophys. Res. 1997, 102, 16663–16682. [Google Scholar] [CrossRef] [Green Version]
- Bolton, D. The computation of equivalent potential temperature. Mon. Weather Rev. 1980, 108, 1046–1053. [Google Scholar] [CrossRef] [Green Version]
- Stauffer, D.R.; Seaman, N.L. Use of four dimensional data assimilation in a limited-area mesoscale model. Part I: Experiments with synoptic-scale data. Mon. Weather Rev. 1990, 118, 1250–1277. [Google Scholar] [CrossRef] [Green Version]
- Chambers, C.R.S.; Li, T. Simulation of formation of a near-equatorial typhoon Vamei (2001). Meteor. Atmos. Phys. 2007, 98, 67–80. [Google Scholar] [CrossRef]
- Ritchie, E.A.; Holland, G.J. Large-scale patterns associated with tropical cyclogenesis in the western Pacific. Mon. Weather Rev. 1999, 127, 2027–2043. [Google Scholar] [CrossRef]
- Lee, C.-S.; Cheung, K.K.W.; Hui, J.S.N.; Elsberry, R.L. Mesoscale features associated with tropical cyclone formations in the western North Pacific. Mon. Weather Rev. 2008, 136, 2006–2022. [Google Scholar] [CrossRef]
- Teng, H.F.; Done, J.M.; Lee, C.S.; Hsu, H.H.; Kuo, Y.H. Large-scale environmental influences on tropical cyclone formation processes and development time. J. Clim. 2020, 33, 9763–9782. [Google Scholar] [CrossRef]
- Houze, R.A. Clouds in tropical cyclones. Mon. Weather Rev. 2010, 138, 293–344. [Google Scholar] [CrossRef]
- Houze, R.A.; Lee, W.C.; Bell, M.M. Convective contribution to the genesis of hurricane Ophelia (2005). Mon. Weather Rev. 2009, 137, 2778–2800. [Google Scholar] [CrossRef]
Figure 1.
The domain setting used in this study.

Figure 2.
Time series (h) of (a,b) the minimum central surface pressure (hPa) and (c,d) tracks of the observations (red) and simulations (blue) for 0129W (a,c) and Vamei (b,d).
Figure 2.
Time series (h) of (a,b) the minimum central surface pressure (hPa) and (c,d) tracks of the observations (red) and simulations (blue) for 0129W (a,c) and Vamei (b,d).

Figure 3.
As Figure 2, but for the non-formation case A (a,c) and case B (b,d).
Figure 3.
As Figure 2, but for the non-formation case A (a,c) and case B (b,d).

Figure 4.
The 10-m wind barb and wind speed (shaded; m s−1) of (a,b) the non-formation case A for (a) simulation at integrated 33 h and (b) QuikSCAT at 1000UTC 30 Dec 2002, and (c,d) the case B for (c) simulation at integrated 27 h and (d) QuikSCAT at 2200UTC 09 Jan 2003. The red box denotes the upstream area defined in this study for each case, and the red circle denotes the disturbance center.

Figure 5.
Azimuthal average of 925-hPa relative vorticity (10−4 s−1) for (a) 0129W, (b) Vamei, (c) non-formation case A, and (d) non-formation case B. Curves with different colors represent different simulated times from 0 h to 96 h.
Figure 5.
Azimuthal average of 925-hPa relative vorticity (10−4 s−1) for (a) 0129W, (b) Vamei, (c) non-formation case A, and (d) non-formation case B. Curves with different colors represent different simulated times from 0 h to 96 h.

Figure 6.
The time series (h) of the average 1000-hPa northeasterly flow (red; m s−1) and the 1000-hPa horizontal equivalent potential temperature (theta-e) advection (blue; °C × 6 h−1) in the upstream area (defined in Section 3.2) in the control runs for (a) 0129W, (b) Vamei, (c) non-formation case A, and (d) non-formation case B.

Figure 7.
Time series (h) of the minimum central surface pressure (hPa) for the control runs and sensitivity experiments for (a) 0129W and (b) Vamei. Curves with different colors represent the control run and different sensitivity experiments.
Figure 7.
Time series (h) of the minimum central surface pressure (hPa) for the control runs and sensitivity experiments for (a) 0129W and (b) Vamei. Curves with different colors represent the control run and different sensitivity experiments.

Figure 8.
The convective patterns (colored shading; dBZ), 925 hPa wind field (red barb), and sea surface pressure (contour; hPa) around the disturbance center at 48 h (a,d,g,j), 60 h (b,e,h,k), and 72 h (c,f,i,l) of simulations. (a−c) the control run of 0129W, (d−f) the experiment H120 of 0129W, (g−i) the control run of non-formation case B, and (j−l) the experiment H60 of non-formation case B.

Figure 9.
Time series (h) of (a,b) the minimum central surface pressure (hPa), (c,d) the 925-hPa northeasterly flow in the northern SCS (m s−1), and (e,f) the 925-hPa equivalent potential temperature (theta-e) advection in the upstream area (°C × 6 h−1) for 0129W (a,c,e) and Vamei (b,d,f). Curves with different colors represent the control run and different sensitivity experiments.

Figure 10.
As Figure 9, but for the non-formation case A (a,c,e) and case B (b,d,f).
Figure 10.
As Figure 9, but for the non-formation case A (a,c,e) and case B (b,d,f).

Figure 11.
The wind field (barb; knots), advection of equivalent potential temperature (shaded; 10−4 K s−1) at 925-hPa, and sea surface pressure (contour; hPa) for (a,b) the control runs and (c,d) sensitivity experiments of 0129W at 84 h (a,c), and of non-formation case B at 60 h (b,d). The sensitivity experiment is H140 for 0129W and H60 for case B.

Figure 12.
The 925-hPa wind field (barb; knots), convective instability (shaded; K hPa−1), and geopotential height (contour; gpm) for (a,b) the control runs and (c,d) sensitivity experiments of 0129W at 84 h (a,c) and non-formation case B at 60 h (b,d). The sensitivity experiment is H140 for 0129W and H60 for case B.

Figure 13.
The vertical cross-section (from surface to 700 hPa and the north to south) of convective stability (shaded; K hPa−1), wind vector (v and omega), and equivalent potential temperature (contour; <339 K) for (a,b) the control runs and (c,d) the sensitivity experiments of 0129W at 84 h (a,c) and non-formation case B at 60 h (b,d). Sensitivity experiment is H140 for 0129W and H60 for case B. The vertical cross-section is along 118.5°E from 5 to 21°N for 0129W, and along 115°E from 5 to 21°N for case B.


Table 1.
The label and description of sensitivity experiments for the formation and non-formation cases.
Table 1.
The label and description of sensitivity experiments for the formation and non-formation cases.
| Change in High Intensity | Formation Case | Non-Formation Case | Development into TC |
|---|---|---|---|
| Initial field, reduced to 20% of original | H20 | - | No |
| Initial field, reduced to 60% of original | H60 | - | Yes |
| Nudging field, reduced to 60% of original | - | H60 | Yes |
| Nudging field, reduced to 80% of original | - | H80 | Yes |
| Nudging field, increased to 120% of original | H120 | - | No * |
| Nudging field, increased to 140% of original | H140 | - | No |
* 0129W does not form in the experiment but Vamei forms with weaker intensity than the control run.
Table 2.
The percentage distribution (%) of the origin of air parcel transporting toward the disturbance from the four quadrants in each experiment. The last column shows the ratio of air parcels from the northeast quadrant to the southwest quadrant. The backward trajectory analysis is performed during 48 h to 72 h of simulation for 0129W, while it is during 36 h to 72 h of simulation for Case B.
| Experiment | Northeast | Northwest | Southwest | Southeast | Ratio of Northeast to Southwest |
|---|---|---|---|---|---|
| 0129W control | 56 | 2 | 16 | 26 | 3.5 |
| 0129W H140 | 60 | 11 | 11 | 18 | 5.5 |
| Case B control | 70 | 13 | 12 | 5 | 5.8 |
| Case B H60 | 33 | 45 | 22 | 0 | 1.5 |
Table 3.
Schematic summary of nudging sensitivity experiments for the four cases.
| Case | Difference in High Intensity | Difference in Cold Advection | Difference in Convective Instability | Development into TC |
|---|---|---|---|---|
| 0129W | Increase | Stronger | Less | No |
| Vamei | Increase | Neutral to stronger | Neutral to less | No * |
| A | Decrease | Weaker | Greater | Yes |
| B | Decrease | Weaker | Greater | Yes |
* except for H120 experiment.
Publisher’s Note: MDPI stays neutral with regard to jurisdictional claims in published maps and institutional affiliations. |
© 2021 by the authors. Licensee MDPI, Basel, Switzerland. This article is an open access article distributed under the terms and conditions of the Creative Commons Attribution (CC BY) license (https://creativecommons.org/licenses/by/4.0/).
Share and Cite
MDPI and ACS Style
Lin, Y.-L.; Teng, H.-F.; Hsieh, Y.-H.; Lee, C.-S. Tropical Cyclone Formation within Strong Northeasterly Environments in the South China Sea. Atmosphere 2021, 12, 1147. https://0-doi-org.brum.beds.ac.uk/10.3390/atmos12091147
AMA Style
Lin Y-L, Teng H-F, Hsieh Y-H, Lee C-S. Tropical Cyclone Formation within Strong Northeasterly Environments in the South China Sea. Atmosphere. 2021; 12(9):1147. https://0-doi-org.brum.beds.ac.uk/10.3390/atmos12091147
Chicago/Turabian StyleLin, Yung-Lan, Hsu-Feng Teng, Yi-Huan Hsieh, and Cheng-Shang Lee. 2021. "Tropical Cyclone Formation within Strong Northeasterly Environments in the South China Sea" Atmosphere 12, no. 9: 1147. https://0-doi-org.brum.beds.ac.uk/10.3390/atmos12091147
Note that from the first issue of 2016, this journal uses article numbers instead of page numbers. See further details here.