Article

Real-Time Low-Cost Personal Monitoring for Exposure to PM2.5 among Asthmatic Children: Opportunities and Challenges

1
School of Economic, Political and Policy Sciences, The University of Texas at Dallas, Richardson, TX 75080, USA
2
Department of Biostatistics, College of Medicine, Korea University, Seoul 02841, Korea
3
University of North Texas Health Science Center, Fort Worth, TX 76107, USA
4
Department of Pediatrics, Seoul National University Bundang Hospital, Seongnam 13620, Korea
5
Department of Pediatrics, Inje University Seoul Paik Hospital, Seoul 04551, Korea
6
Department of Pediatrics, Hallym University Kangdong Sacred Heart Hospital, Seoul 05355, Korea
7
Department of Pediatrics, Seoul National University College of Medicine, Seoul 03080, Korea
8
Pediatric Allergy and Respiratory Center, Department of Pediatrics, Soonchunhyang University College of Medicine, Seoul 04401, Korea
9
Department of Pediatrics, Korea University Anam Hospital, Seoul 02841, Korea
10
Environmental Health Center for Childhood Asthma, Korea University Anam Hospital, Seoul 02841, Korea
11
Asan Medical Center, Department of Pediatrics, University of Ulsan College of Medicine, Seoul 05505, Korea
12
Department of Pediatrics, School of Medicine, Inha University, Incheon 22212, Korea
13
Department of Environmental Health and Safety, College of Health Industry, Eulji University, Seongnam 13135, Korea
14
Department of Pediatrics, Korea University College of Medicine, Seoul 02841, Korea
*
Authors to whom correspondence should be addressed.
Dohyeong Kim and Yunjin Yum these two authors contributed equally as the first authors.
Submission received: 25 August 2021 / Revised: 12 September 2021 / Accepted: 12 September 2021 / Published: 15 September 2021

Abstract

:
This study aims to evaluate the accuracy and effectiveness of real-time personal monitoring of exposure to PM concentrations using low-cost sensors, in comparison to conventional data collection method based on fixed stations. PM2.5 data were measured every 5 min using a low-cost sensor attached to a bag carried by 47 asthmatic children living in the Seoul Metropolitan area between November 2019 and March 2020, along with the real-time GPS location, temperature, and humidity. The mobile sensor data were then matched with station-based hourly PM2.5 data using the time and location. Despite some uncertainty and inaccuracy of the sensor data, similar temporal patterns were found between the two sources of PM2.5 data on an aggregate level. However, average PM2.5 concentrations via personal monitoring tended to be lower than those from the fixed stations, particularly when the subjects were indoors, during nighttime, and located farther from the fixed station. On an individual level, a substantial discrepancy is observed between the two PM2.5 data sources while staying indoors. This study provides guidance to policymakers and researchers on improving the feasibility of personal monitoring via low-cost mobile sensors as an alternative or supplement to the conventional station-based monitoring.

1. Introduction

Exposure to particulate matter (PM) has been identified as having an adverse impact on human health [1]. It is associated not only with respiratory diseases but also other diseases such as heart disease, type 2 diabetes and dementia [2,3,4]. Most of these studies emphasize the cumulative effects of PM exposure over an extended period time, which emphasizes the importance of personalized continuous monitoring and the need for control of indoor and outdoor PM levels in surrounding atmosphere of individuals who experience relevant symptoms [5]. However, in many countries, air quality management and health impact evaluation are still based on ambient air monitoring using the traditional station-based system [6,7,8]. This monitoring system is typically equipped with high-performance and expensive sensors with strong calibration stability, producing accurate data on outdoor air quality measurements for surrounding environments [9]. The high construction and maintenance cost of station-based monitoring system has prevented the development of a sufficient number of air quality monitoring stations, which has resulted in coverage gaps and a high measurement error rate in areas far from the monitoring locations [10]. Although a variety of GIS and spatial modeling techniques have been used to create an interpolated surface of ambient PM exposure, their precision and accuracy levels are still lacking [11,12].
PM measurements from stations are often inaccurate and insufficient to be used for providing guidelines for asthmatic patients to avoid exacerbations of their symptoms since the station-based data are limited. Therefore, they are unable to indicate the true level of exposure for individuals, depending on their lifestyle, mobility and actual location. Most people nowadays tend to stay indoors for longer periods of time and the impact of indoor PM on their health is far more important than that of outdoor air pollution, especially due to its long-term exposure at low concentration levels [7]. Thus, personalized PM monitoring based on real-time locations has been proven itself to be a better alternative for exposure assessment and is being actively researched due to the advances in IoT (Internet of Things) devices and networks [13]. In particular, a growing number of researchers have attempted to explore the potential of low-cost sensors for real-time personal exposure assessment as a supplementary method tool for traditional ambient air monitoring [14,15,16]. However, personal PM monitoring has not been widely implemented as a guideline for clinical intervention and policy decision mainly due to various technical difficulties and financial implications [17]. The existing empirical evidences from a long-term, large-scale study are not sufficient to allow useful and general insights into the accuracy and effectiveness of real-time personal monitoring in comparison to conventional station-based monitoring.
Despite the rapid improvement of low-cost PM sensors, several limitations have been reported and attempts have been made to resolve them. First, reliability issues are still preventing a broad exploitation of low-cost portable devices. The PM measurements are heavily influenced by various factors such as aerosol size and meteorological variation [16], and each device has different ways of retrieving the PM levels [18]. A handful of recent studies have been conducted to adjust these factors [16,18,19], but there is still a long way to go. Second, limited battery performance has been reported as a critical issue for real-time monitoring since the battery for the portable IoT sensors may run out during the day causing interruption of continuous monitoring unless recharged within a reasonable time [20]. Third, most low-cost PM sensing devices require an internal calibration process or modeling which might generate arbitrary errors or systemic biases [21]. A growing number of studies have been dedicated to addressing these limitations [22,23], which would ensure the wide and effective application of real-time mobile PM monitoring using low-cost portable sensors.
In South Korea, most of the PM-related public health policies and clinical interventions remain based on outdoor environments monitored by the conventional station-based method due to the lack of efforts to promote a large-scale personalized monitoring [24,25]. Recently, a number of monitoring efforts have been undertaken including a feasibility study to assess indoor PM exposure, but most of them focused on fixed IoT devices which failed to capture the concurrent air pollution and environmental monitoring data from their real-time locations [26,27]. Despite a handful of recent studies on real-time sensing of indoor and outdoor PM exposure using a low-cost portable device in South Korea [28,29], personally monitored PM data were not thoroughly evaluated for feasibility and accuracy in comparison to conventional data from station-based area monitoring. Therefore, this study aims to evaluate the patterns of PM2.5 concentrations exposed to asthmatic children in South Korea collected from their real-time locations (indoor vs. outdoor) in comparison with the corresponding air quality data from the nearest monitoring station. It demonstrated not only the potential role but also the limitations of personalized PM monitoring using a low-cost mobile sensor as an alternative or supplement to the conventional station-based ambient air monitoring. These findings would be useful for evidence-based policy intervention and patient consultation as they provide guidance to policymakers, clinicians and researchers on what efforts need to be made to improve the quality and feasibility of the personal monitoring process and how large-scale ambient air monitoring data should be used and adjusted for personalized care and intervention when personal monitoring data are not available.

2. Materials and Methods

2.1. Study Participants

Study subjects were recruited between November 2019 and March 2020 from the outpatient group visiting eight hospitals in Seoul’s metropolitan area. We sampled children aged 5–15 years old who had asthma symptoms in the last 12 months and at least 12% of bronchodilator response or PC20 methacholine ≤16 mg/mL or PD15 mannitol ≤635 m. In total, 47 patients were included in the study. Their home locations, distributed around Seoul Metropolitan Area, are shown as a triangle in Figure 1.

2.2. Station-Based PM Monitoring via Air Korea

There are 522 atmospheric air quality monitoring stations across Korea, including urban and roadside air quality stations, of which 154 are in the Seoul and Gyeonggi areas, shown as circles in Figure 1. At each station, both PM 10 and PM 2.5 concentration data were measured by the β -ray measurement method every 5 min and then transmitted to the National Ambient Air Quality Monitoring Information System (NAMIS) along with other air pollutants such as SO 2 , CO, O 3 and NO 2 . The data were then aggregated into hourly averages through statistical processing and stored in a database called “Air Korea” maintained by the Korea Environment Corporation [30]. The reported concentration values were provided through application to the smartphone users based on data from the station closest to their real-time location, along with user-friendly color grading on risk level (e.g., red as high risk, yellow as medium risk, and green as low risk) to help them to identify the risk at their locations and take appropriate actions [31]. Moreover, the information from the “Air Korea” data have been used as a guideline for various air quality interventions and other public health policies [32,33]. This database was used to extract the PM 2.5 concentrations measured at the fixed monitoring station nearest to the patients’ real-time location measured via GPS during the study period, which was then integrated with the PM 2.5 data collected for each patient via personal monitoring.
However, several concerns have been raised about the accuracy and practical applicability of the data. Most importantly, the lack of monitoring stations impedes accurate assessment of dynamic trends of particulate matters within the region even in the urban areas. For instance, on average, one station covers about 15.5 km2 in Seoul, and over 108 km2 in other regions in South Korea [34], which leaves wide gaps between different monitoring stations [10]. Moreover, some Air Korea stations were installed substantially higher than the recommended height, creating a gap between the measured PM values and the actual level of exposure in people living in and around the area [35]. Additionally, another valid criticism is that the Air Korea data lack the metadata that describe a measuring instrument, specifics for measurement and potential outliers [36].

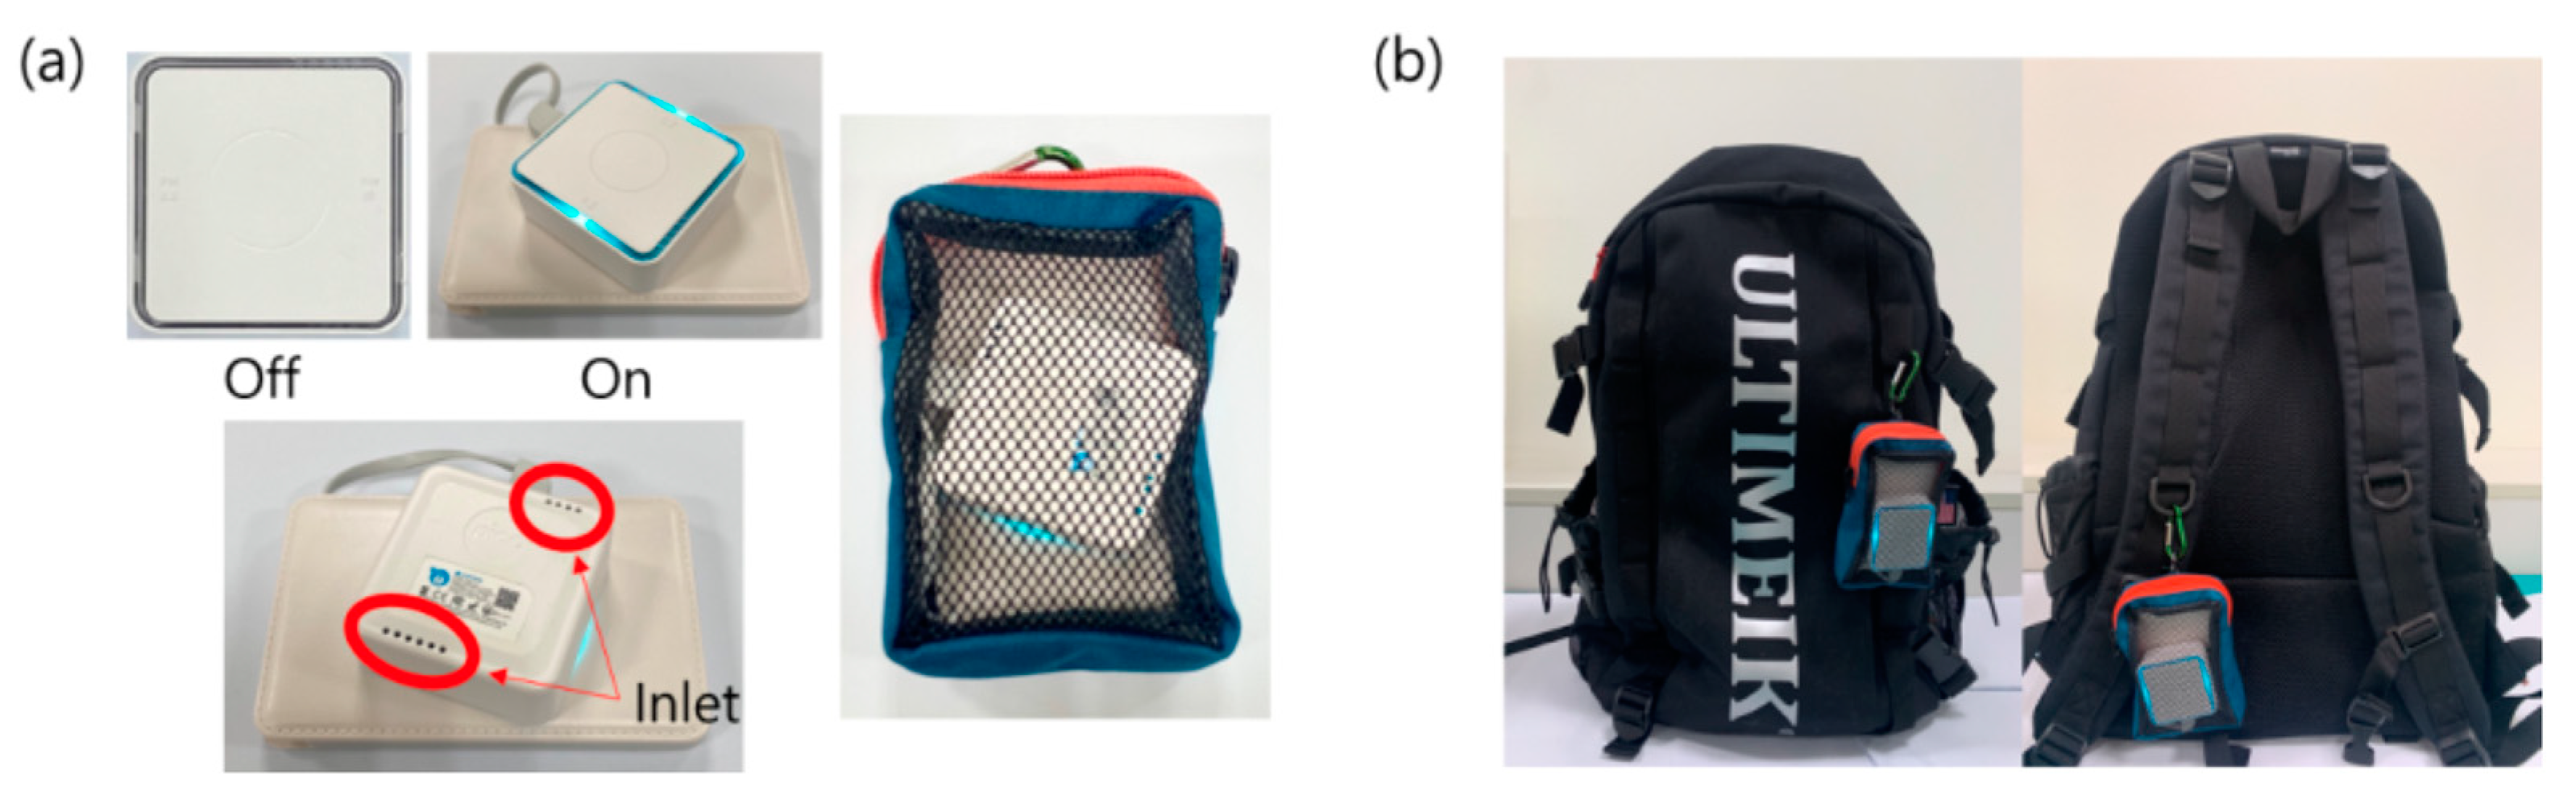
2.3. Personal Real-Time Monitoring via Low-Cost Sensors

For real-time personal monitoring, we collected PM 2.5 concentration data for the 47 study participants from December 2019 to March 2020 using a portable device with low-cost sensors. The device monitors the concentrations of PM 10 and PM 2.5 measured by the light scattering method as well as temperature, humidity together using each corresponding sensor in real time (model name: PMM-130 (hereafter PICO), size: 48.0 × 48.0 × 20.6 mm, weight: 45 g, power supply: 200 mA/h). On the date of the patient’s outpatient visit, we handed out a device that was placed in a pouch and hung on a backpack, as shown in Figure 2, and advised them to always carry it when outdoors and keep it in a specific location when indoors. Patient caregivers were asked to upload the collected data to the application server every evening and the data were monitored and managed by the clinical research coordinator (CRC). The CRC kept in touch with the caregivers regularly to ensure that the data were uploaded properly and on time.
Reliable positioning was identified through the GPS positioning system (EHS GPS Tracker, Mobile App), which allows consistent positioning during measurements. PICO measures both PM 10 and PM 2.5 concentrations from 1 to 1000 μg/m3, temperature from −40°C to 125°C and humidity from 0 to 100% relative humidity (RH) and the results are stored at 5 min intervals (measured in 30 s after waiting 4 min). The device is powered by external power supply and equipped with a storage device that can record PM measurement data in real time. The measured data were transmitted to a server through Bluetooth (BLE4.0) and Wi-Fi (2.4 GHz) while the device was being charged. The accuracy of PICO has been approved by receiving a high level of performance certification from the government-authorized agency, Korea Testing & Research Institute (KTR) and reported as 86.2% in our recent paper [26]. The calibration of PICO was performed by comparing the results from KTR with the same device used in the Air Korea monitoring stations. The accuracy was calculated as follows:
A c c u r a c y ( % ) = T h e   r e s u l t s   o f   P M s   f r o m   P I C O T h e   c o r r e s p o n d i n g   v a l u e s   f r o m   a   r e f e r e n c e   d e v i c e   o f   K T R   × 100
We selected this PM measuring device given its measurement reliability, weight, portability, power consumption, and data transmission capabilities. In particular, the calibration of measurements based on temperature and humidly was considered in device selection since they tended to influence the measurements of portable devices with a low-cost sensor [37].
To ensure validity and consistency in measurement across the devices prior to full sampling, we collected PM data for eight days in September and November 2020 using five PICO devices and a reference device (KTR) installed at the Korea Institute of Chemical Convergence Test which has been used for official routine monitoring of outdoor air quality. Figure 3 shows statistically significant consistency across the five PICOs (mean coefficient of variation = 0.12) throughout the testing period.
The results were used to derive a calibration formula for PM 2.5 values from PICO based on temperature and humidity by a robust multiple regression model as follows:
Calibrated PM2.5 = 49.19 + (0.45 × measured PM2.5) − (1.44 × temperature) − 0.006 × humidity
Figure 4 compares the measurements of a reference device (KTR reference instruments) with an average measurement from five PICO devices: (a) before and (b) after calibration. It appears that the temporal trends of PM 2.5 are overall similar between PICO and KTR even before calibration (Figure 4a), but the two measurements become more nearly identical after calibration (Figure 4b).

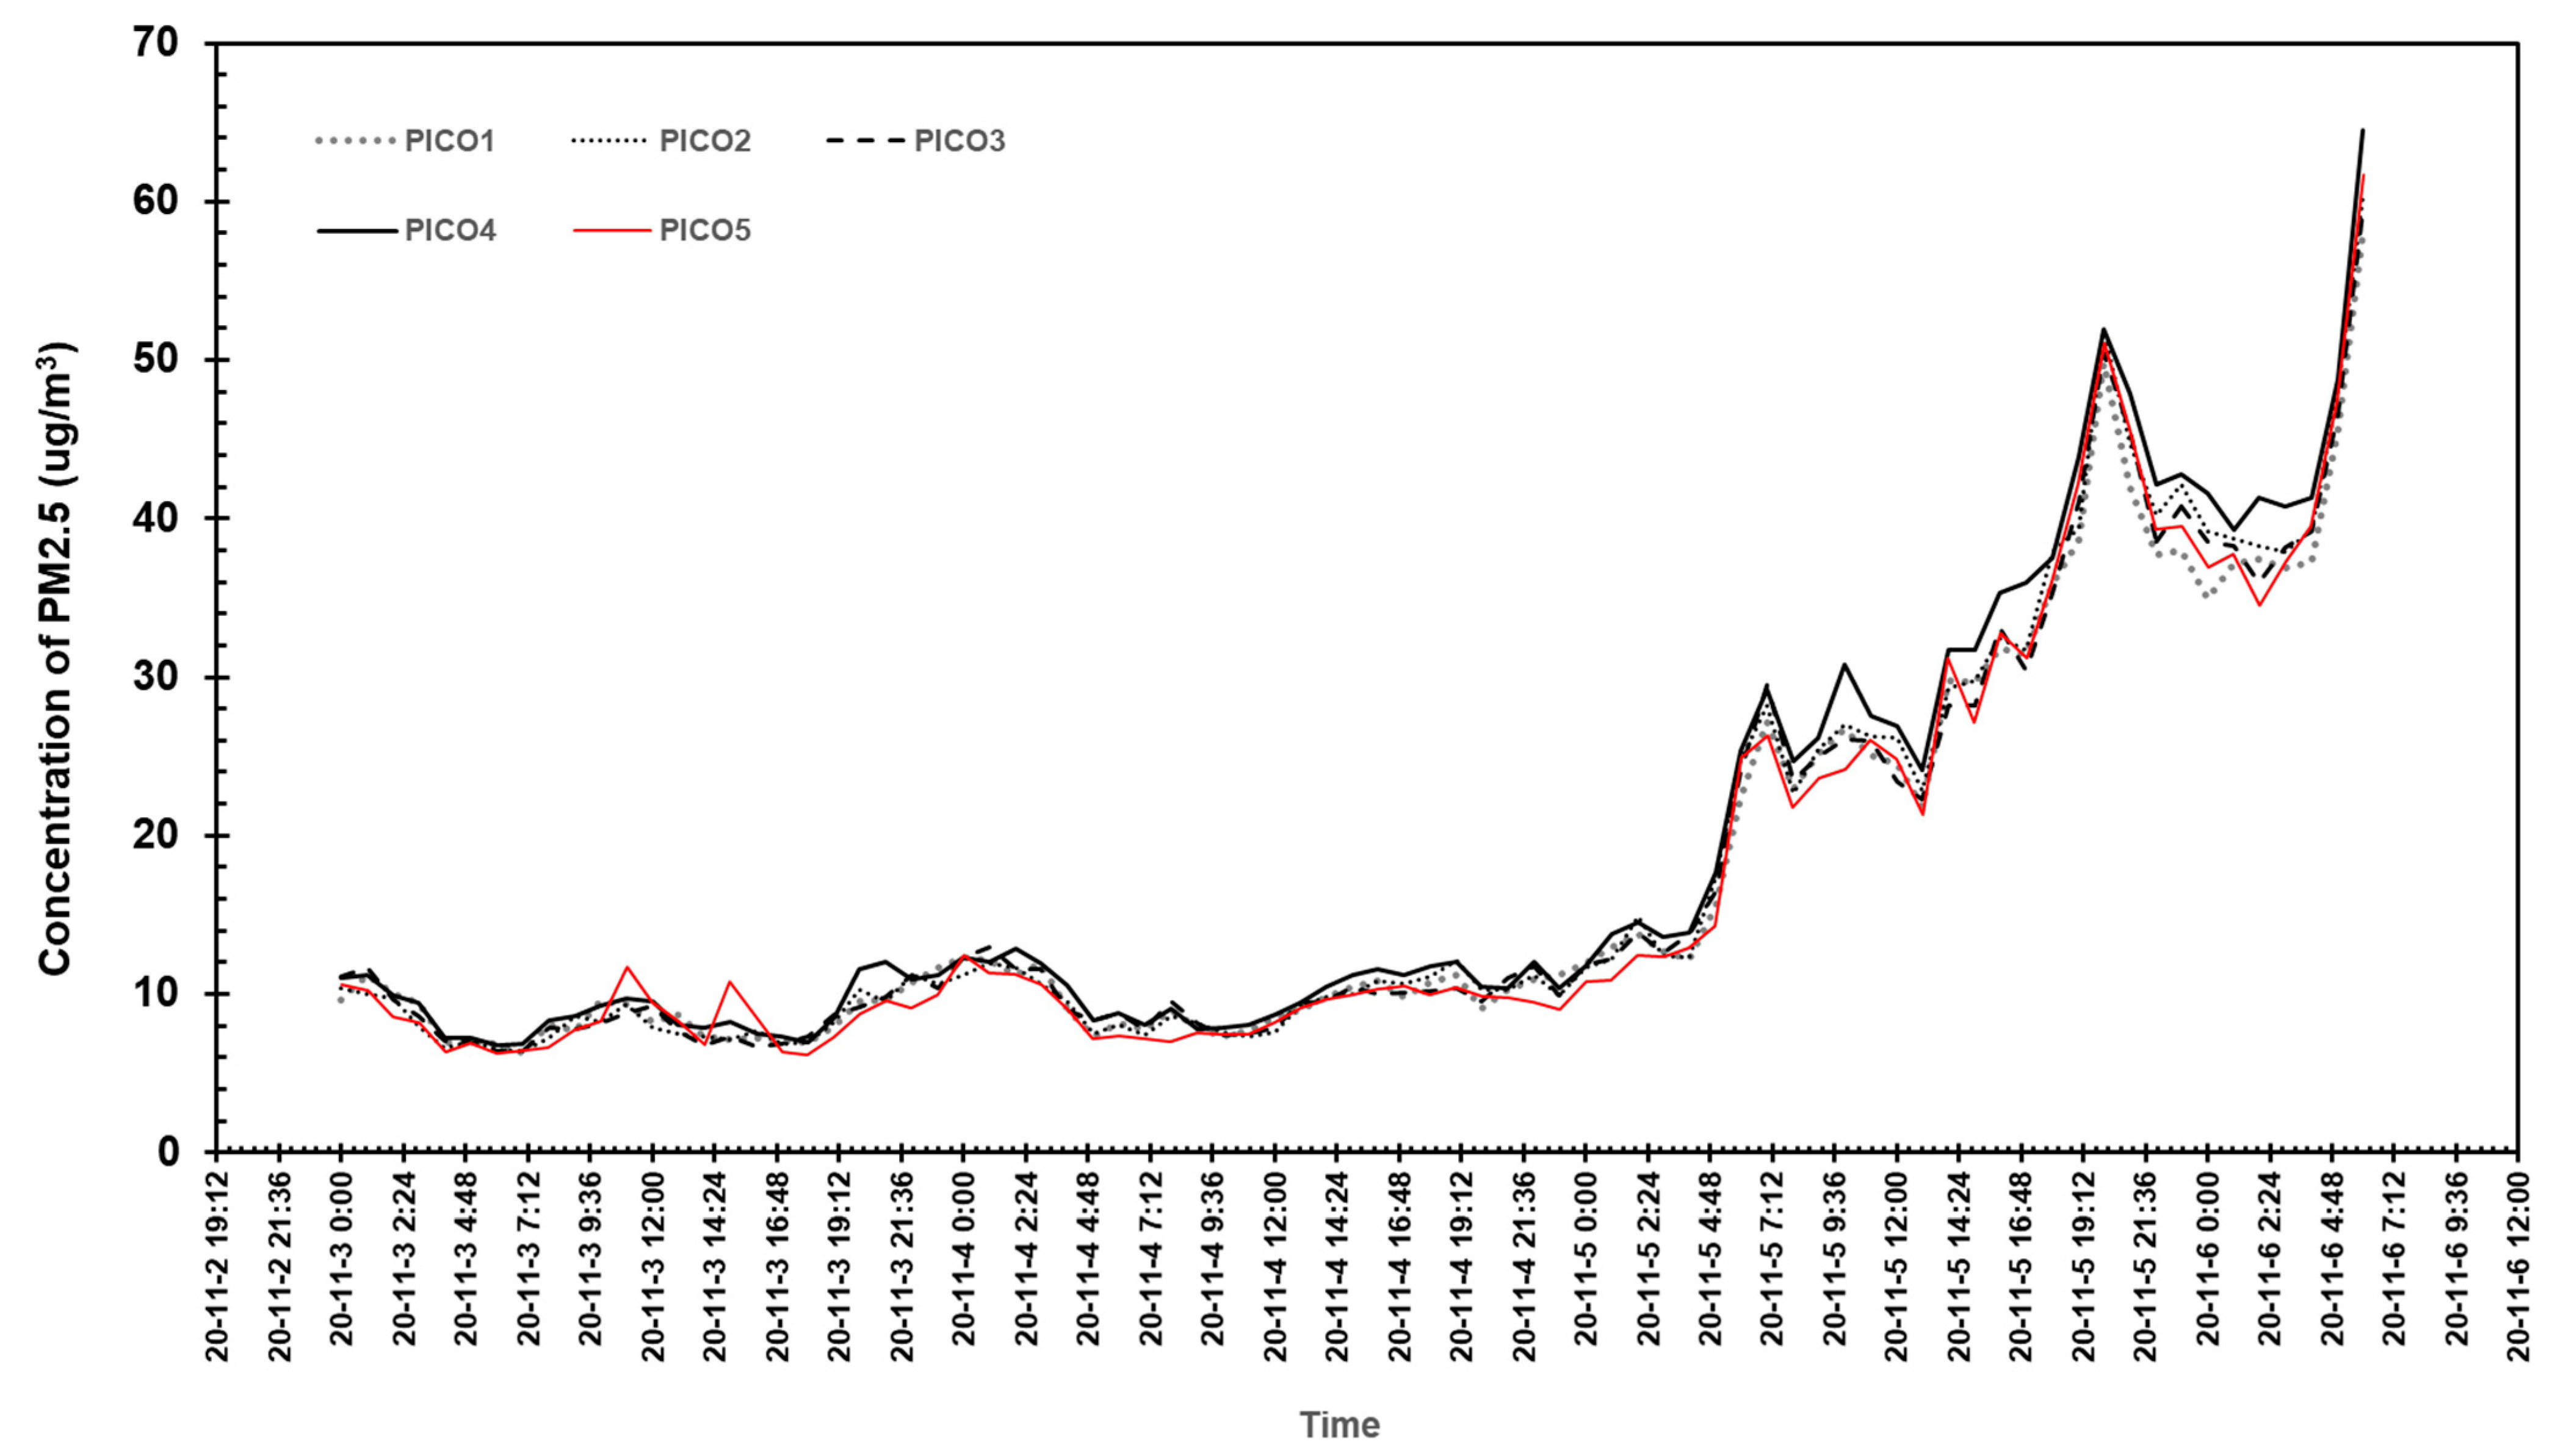
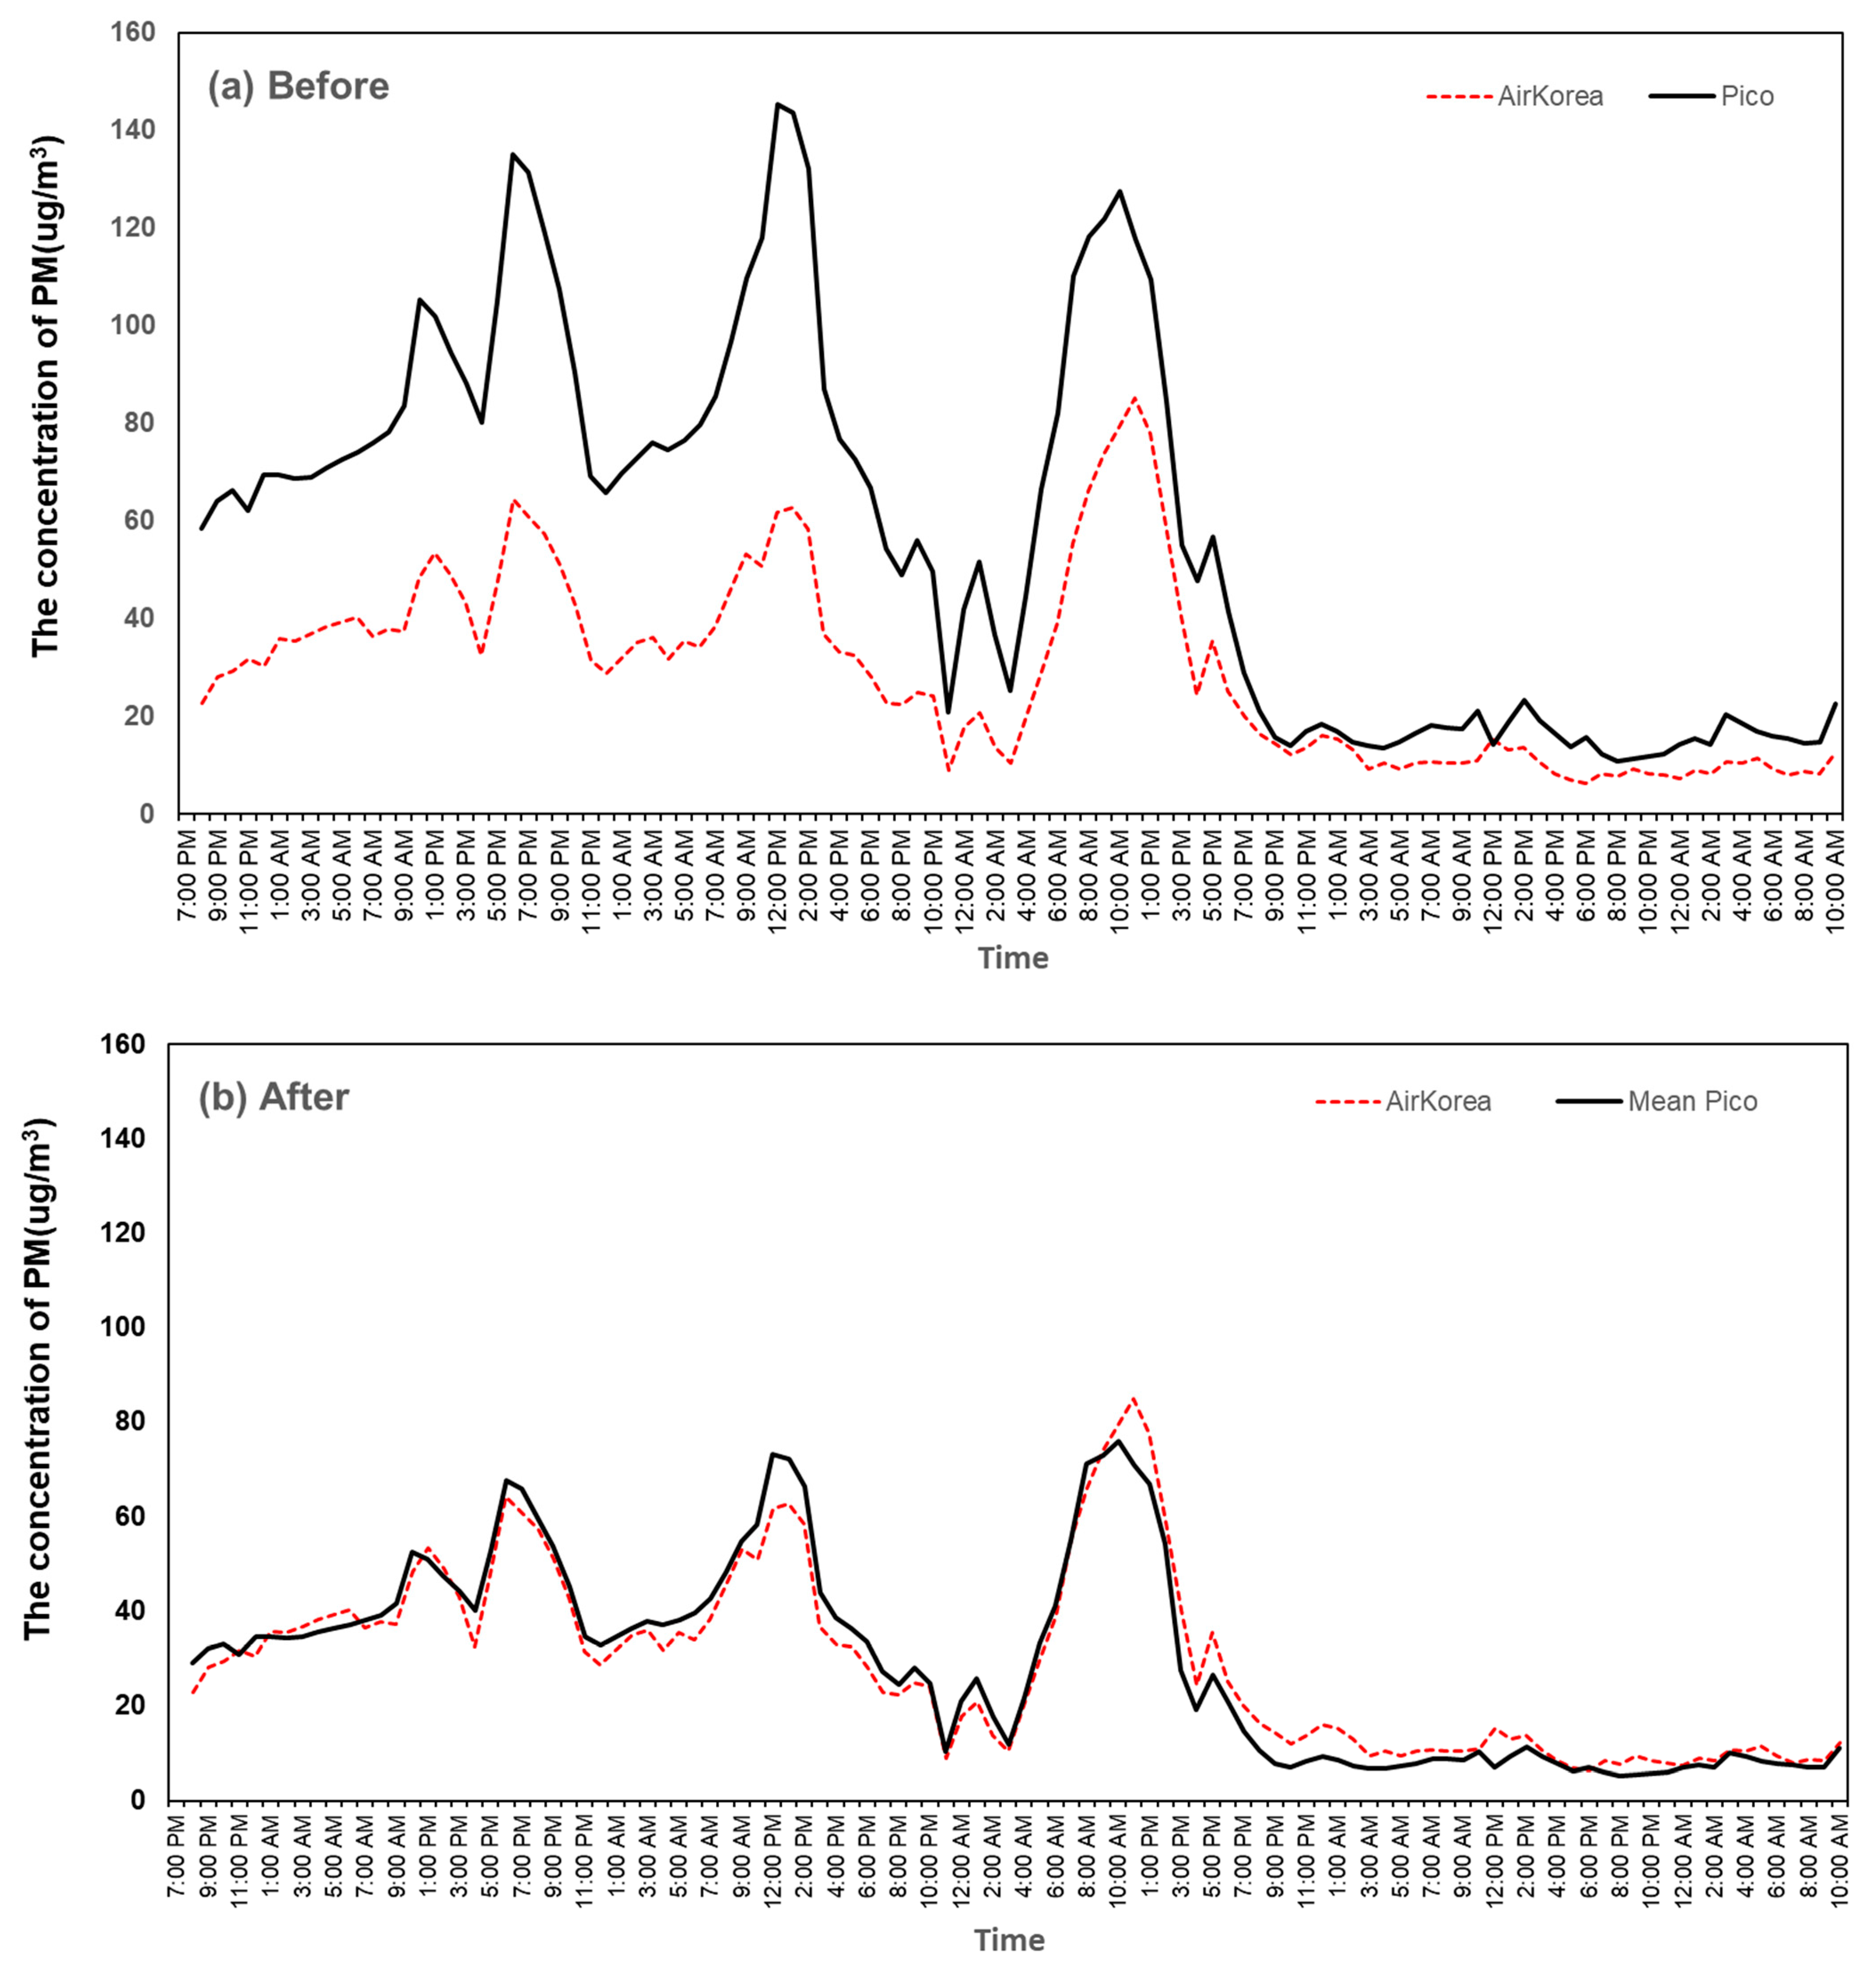
2.4. Data Integration and Analysis
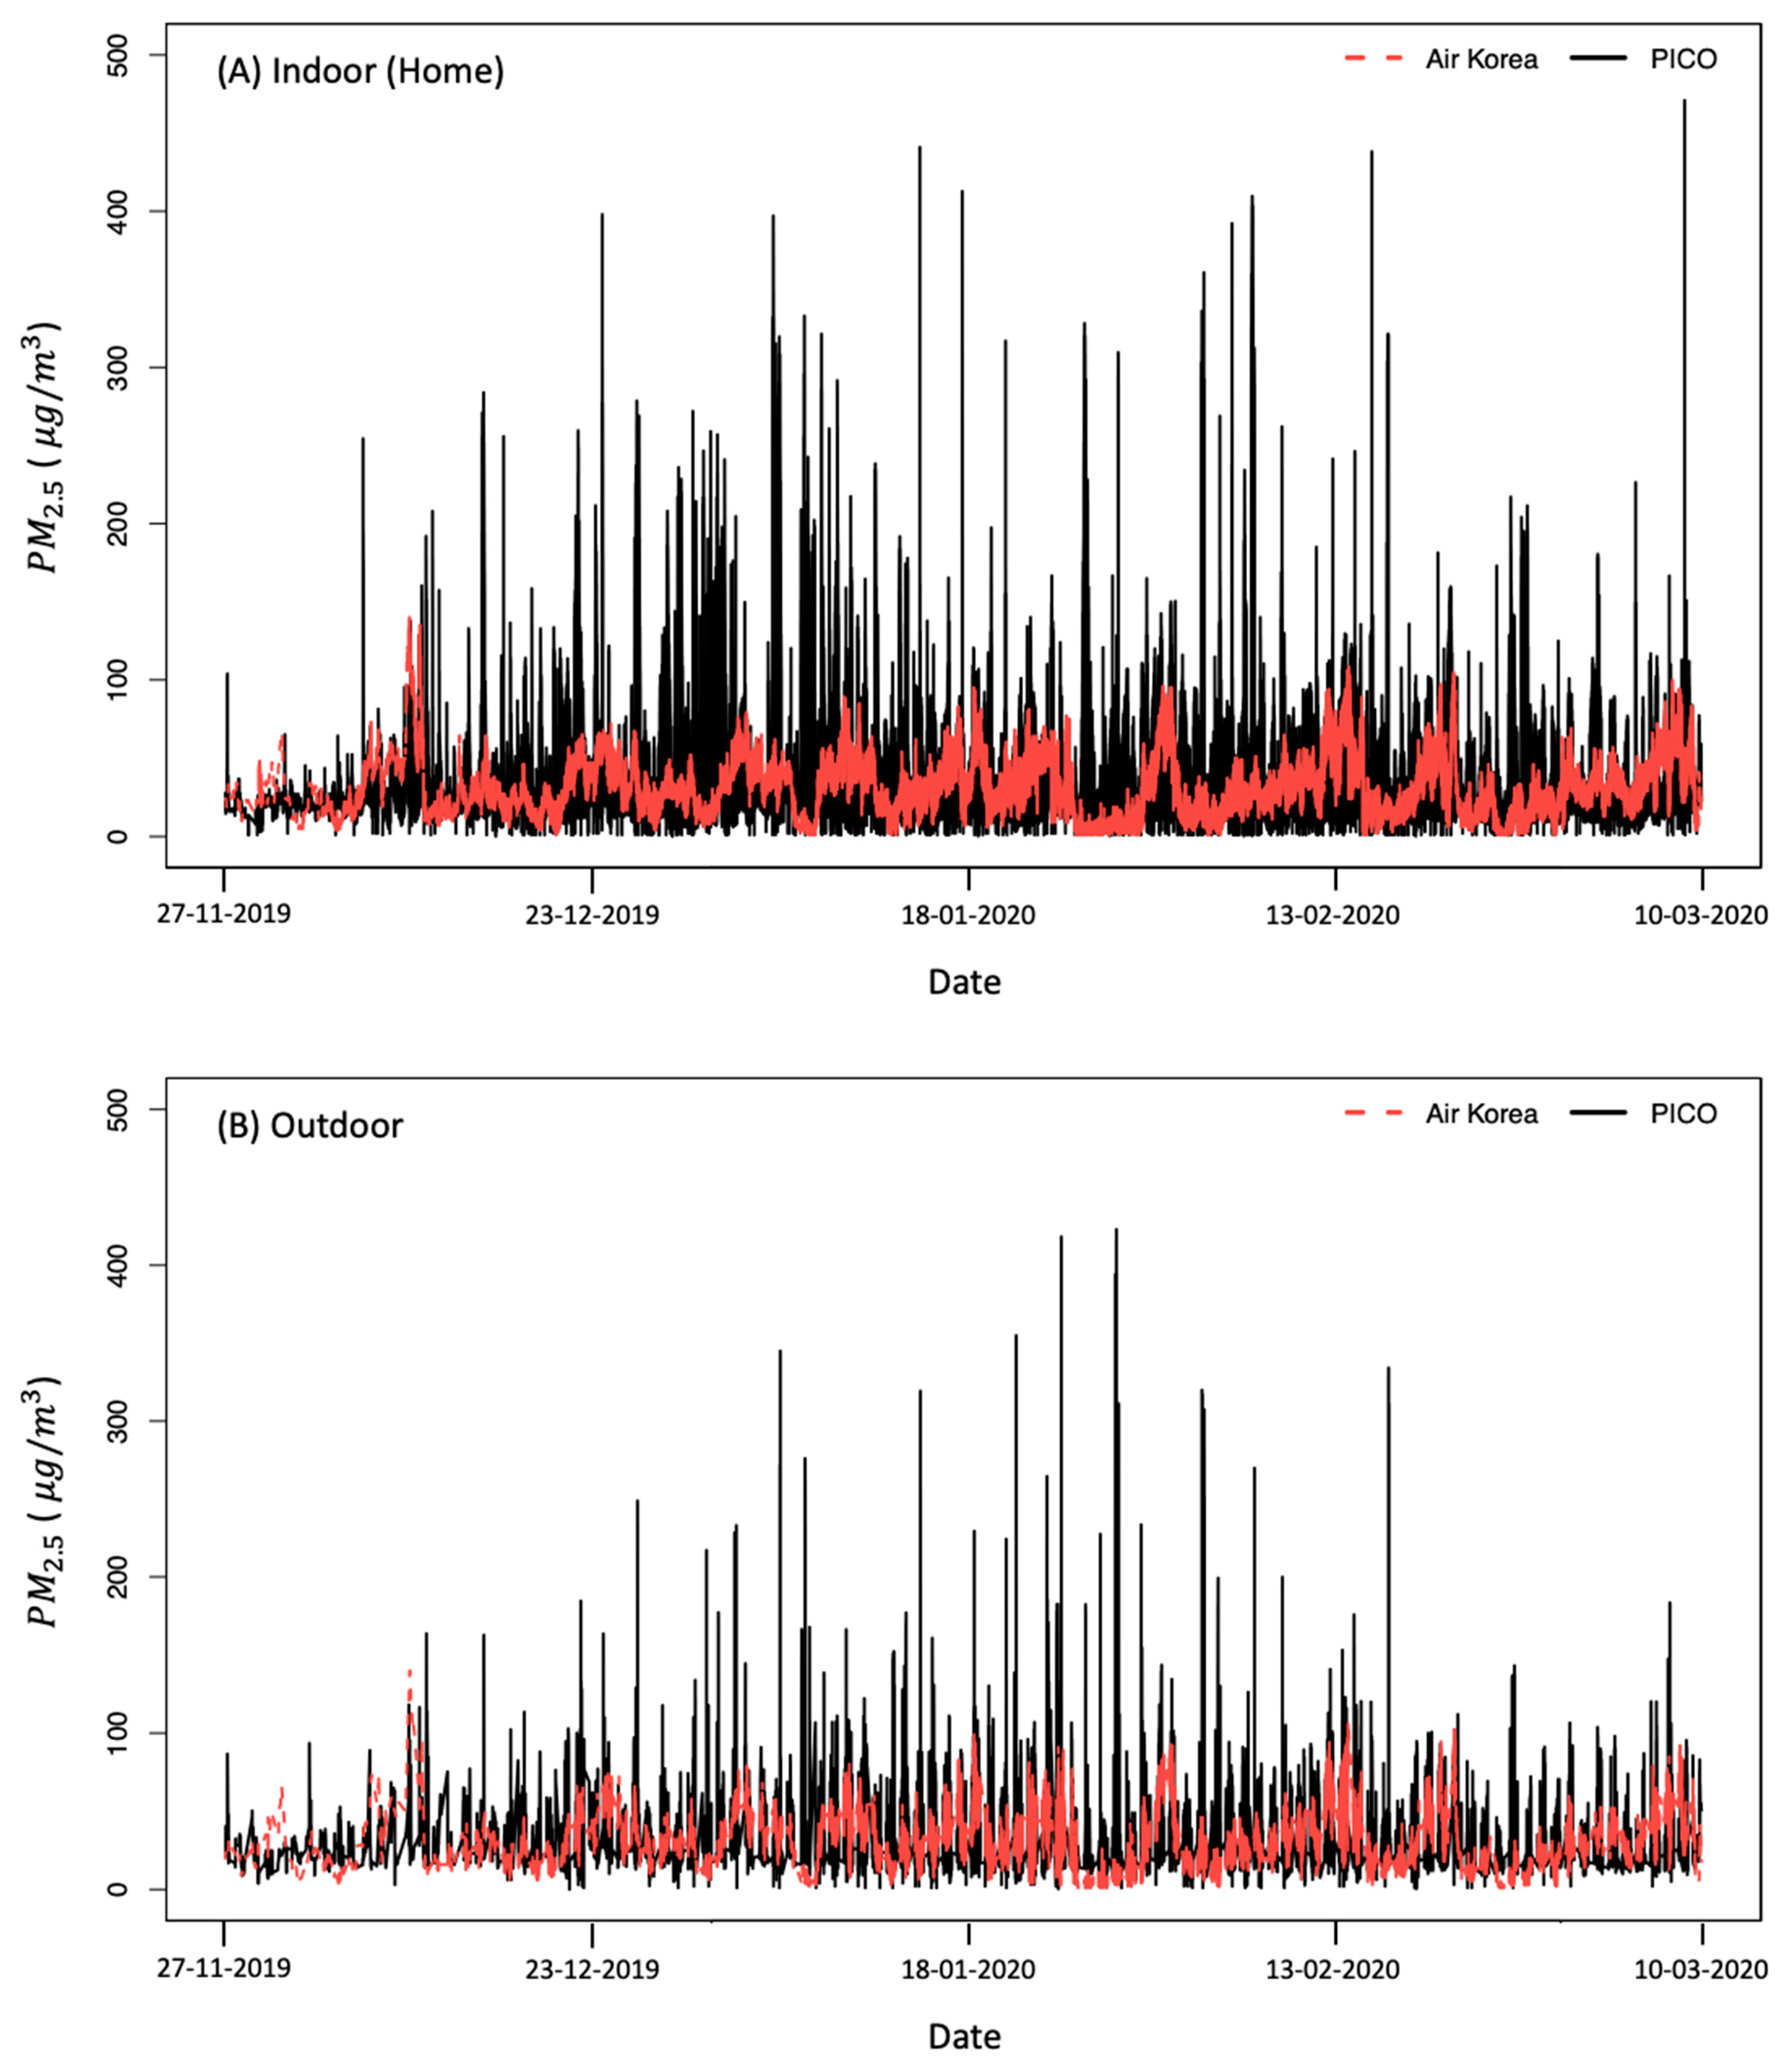
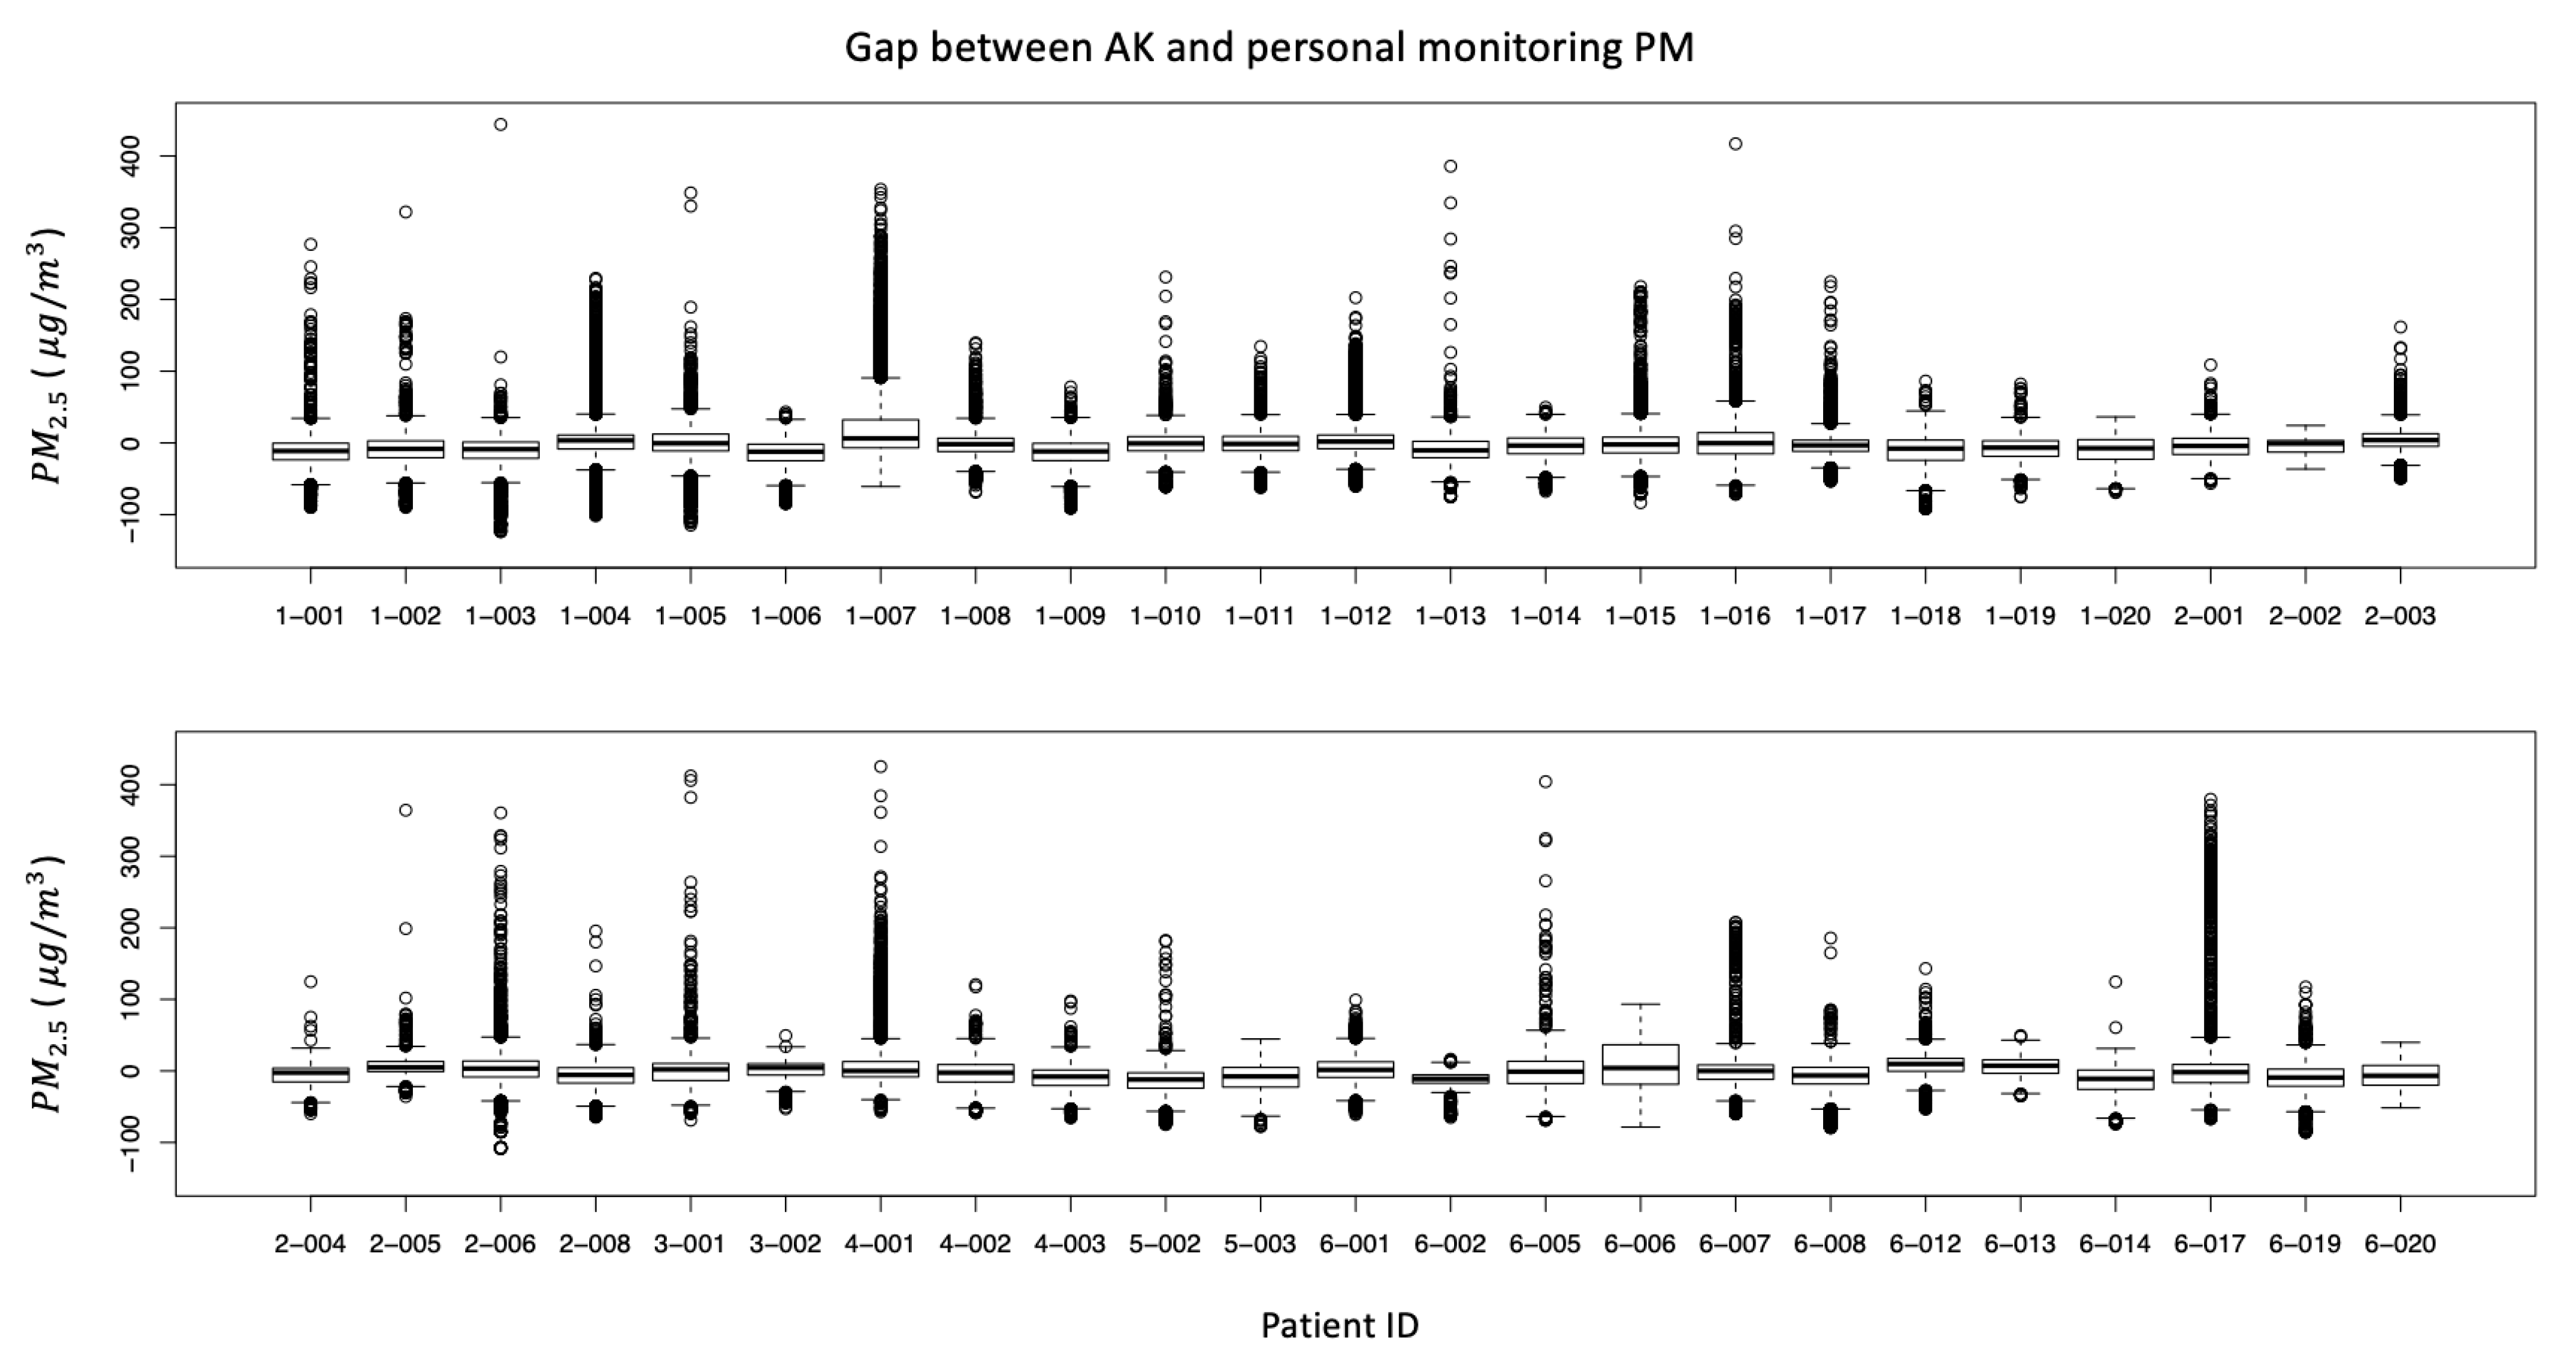
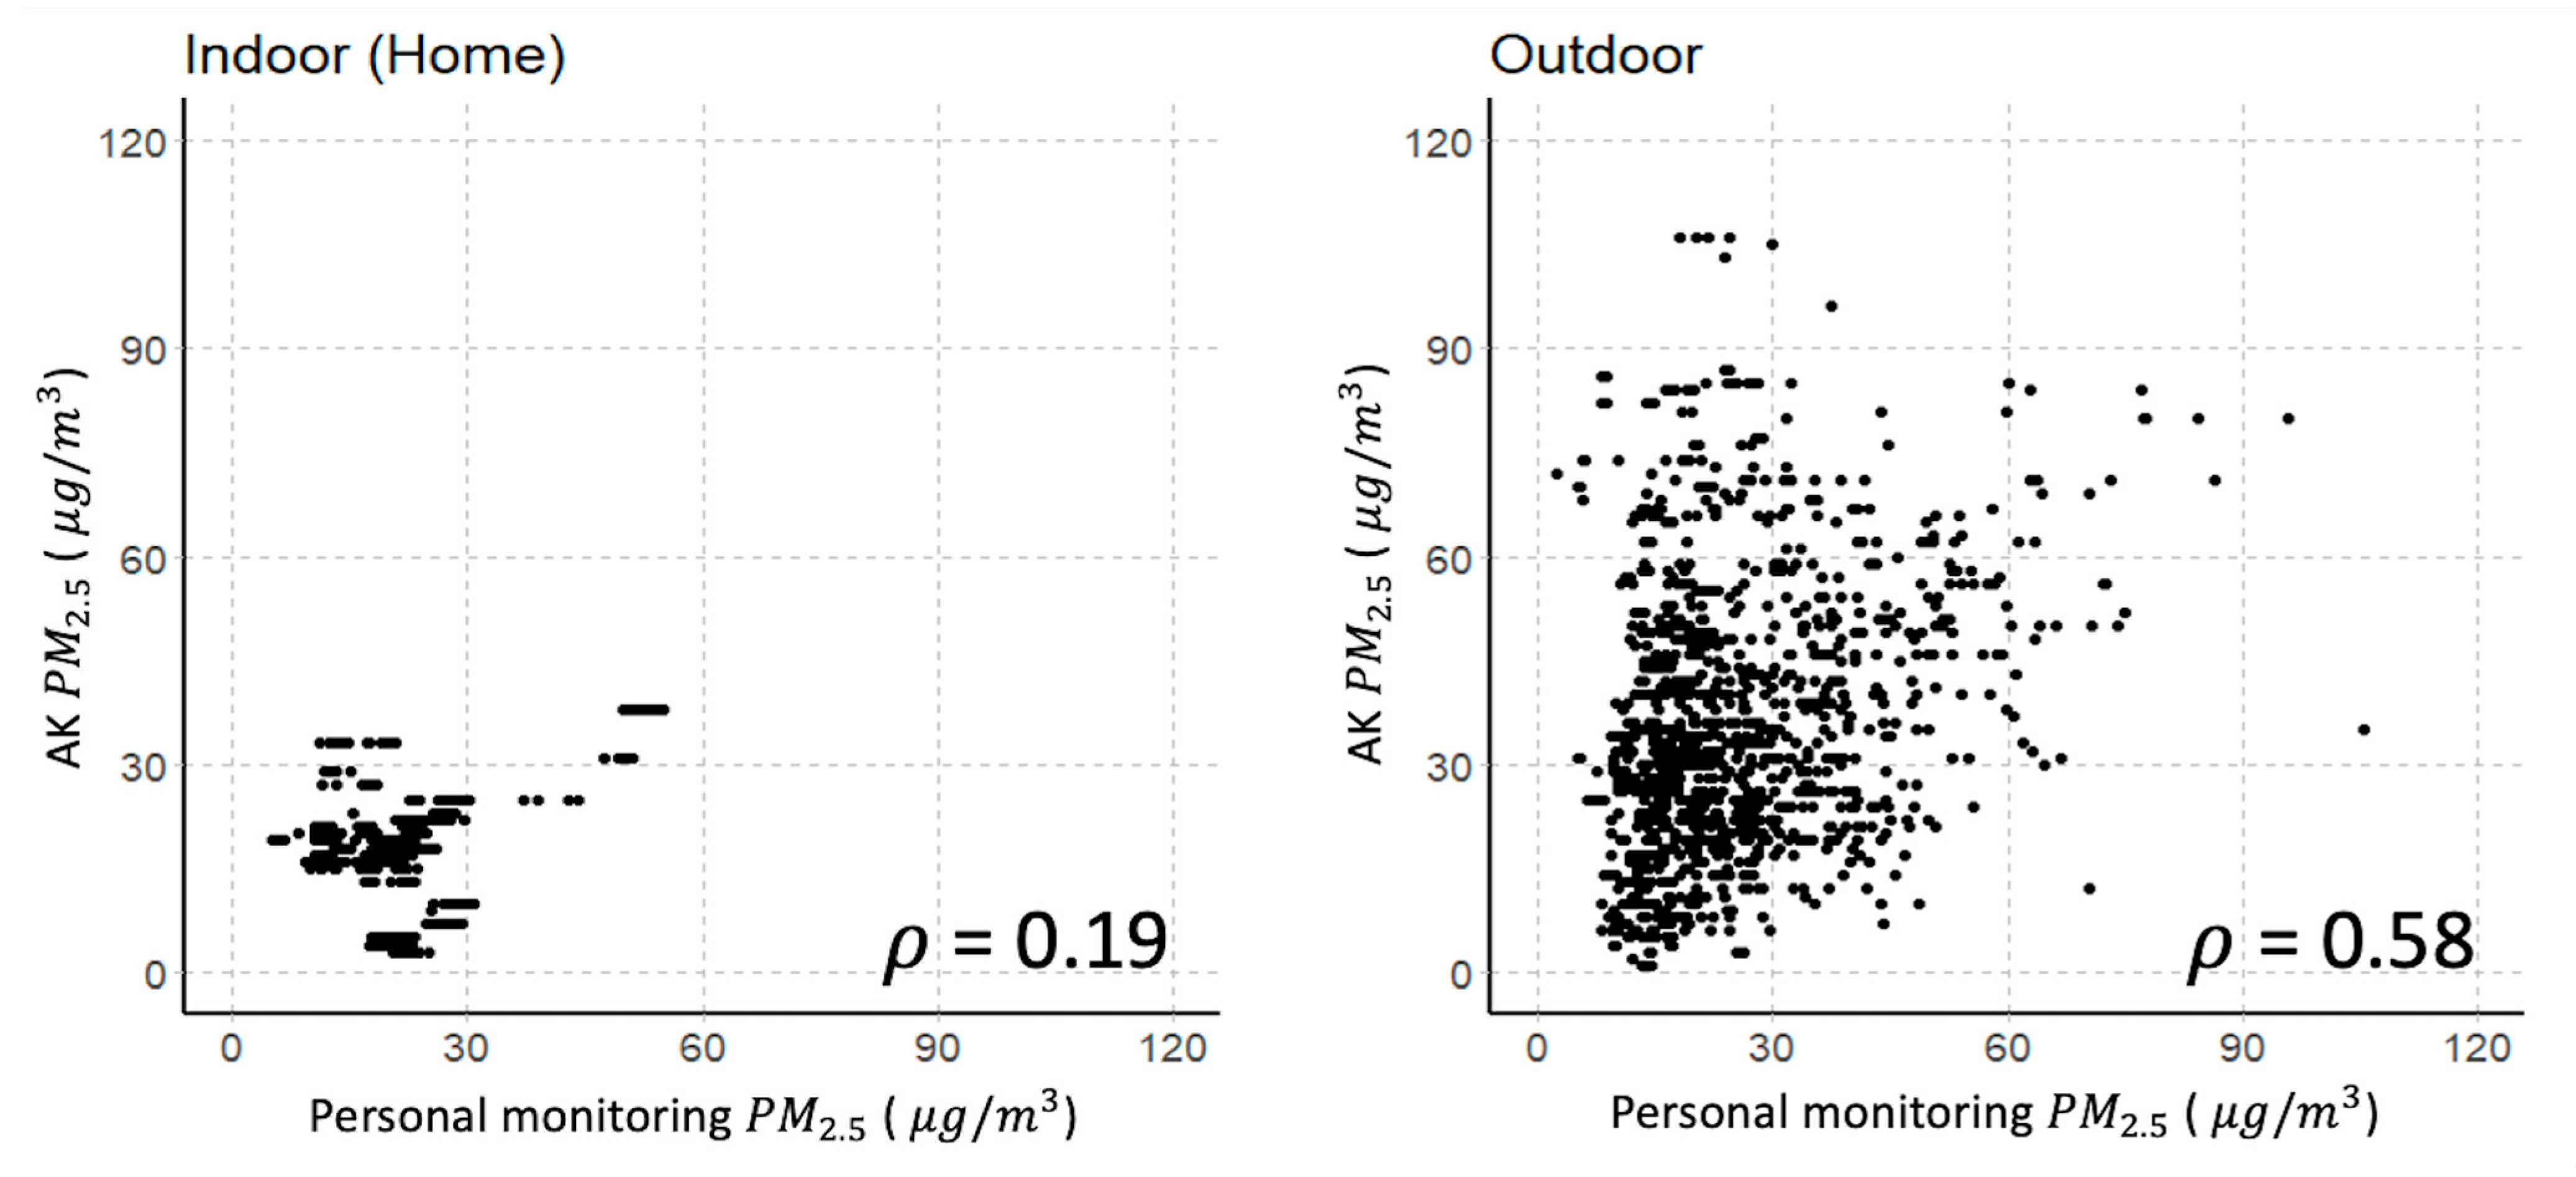
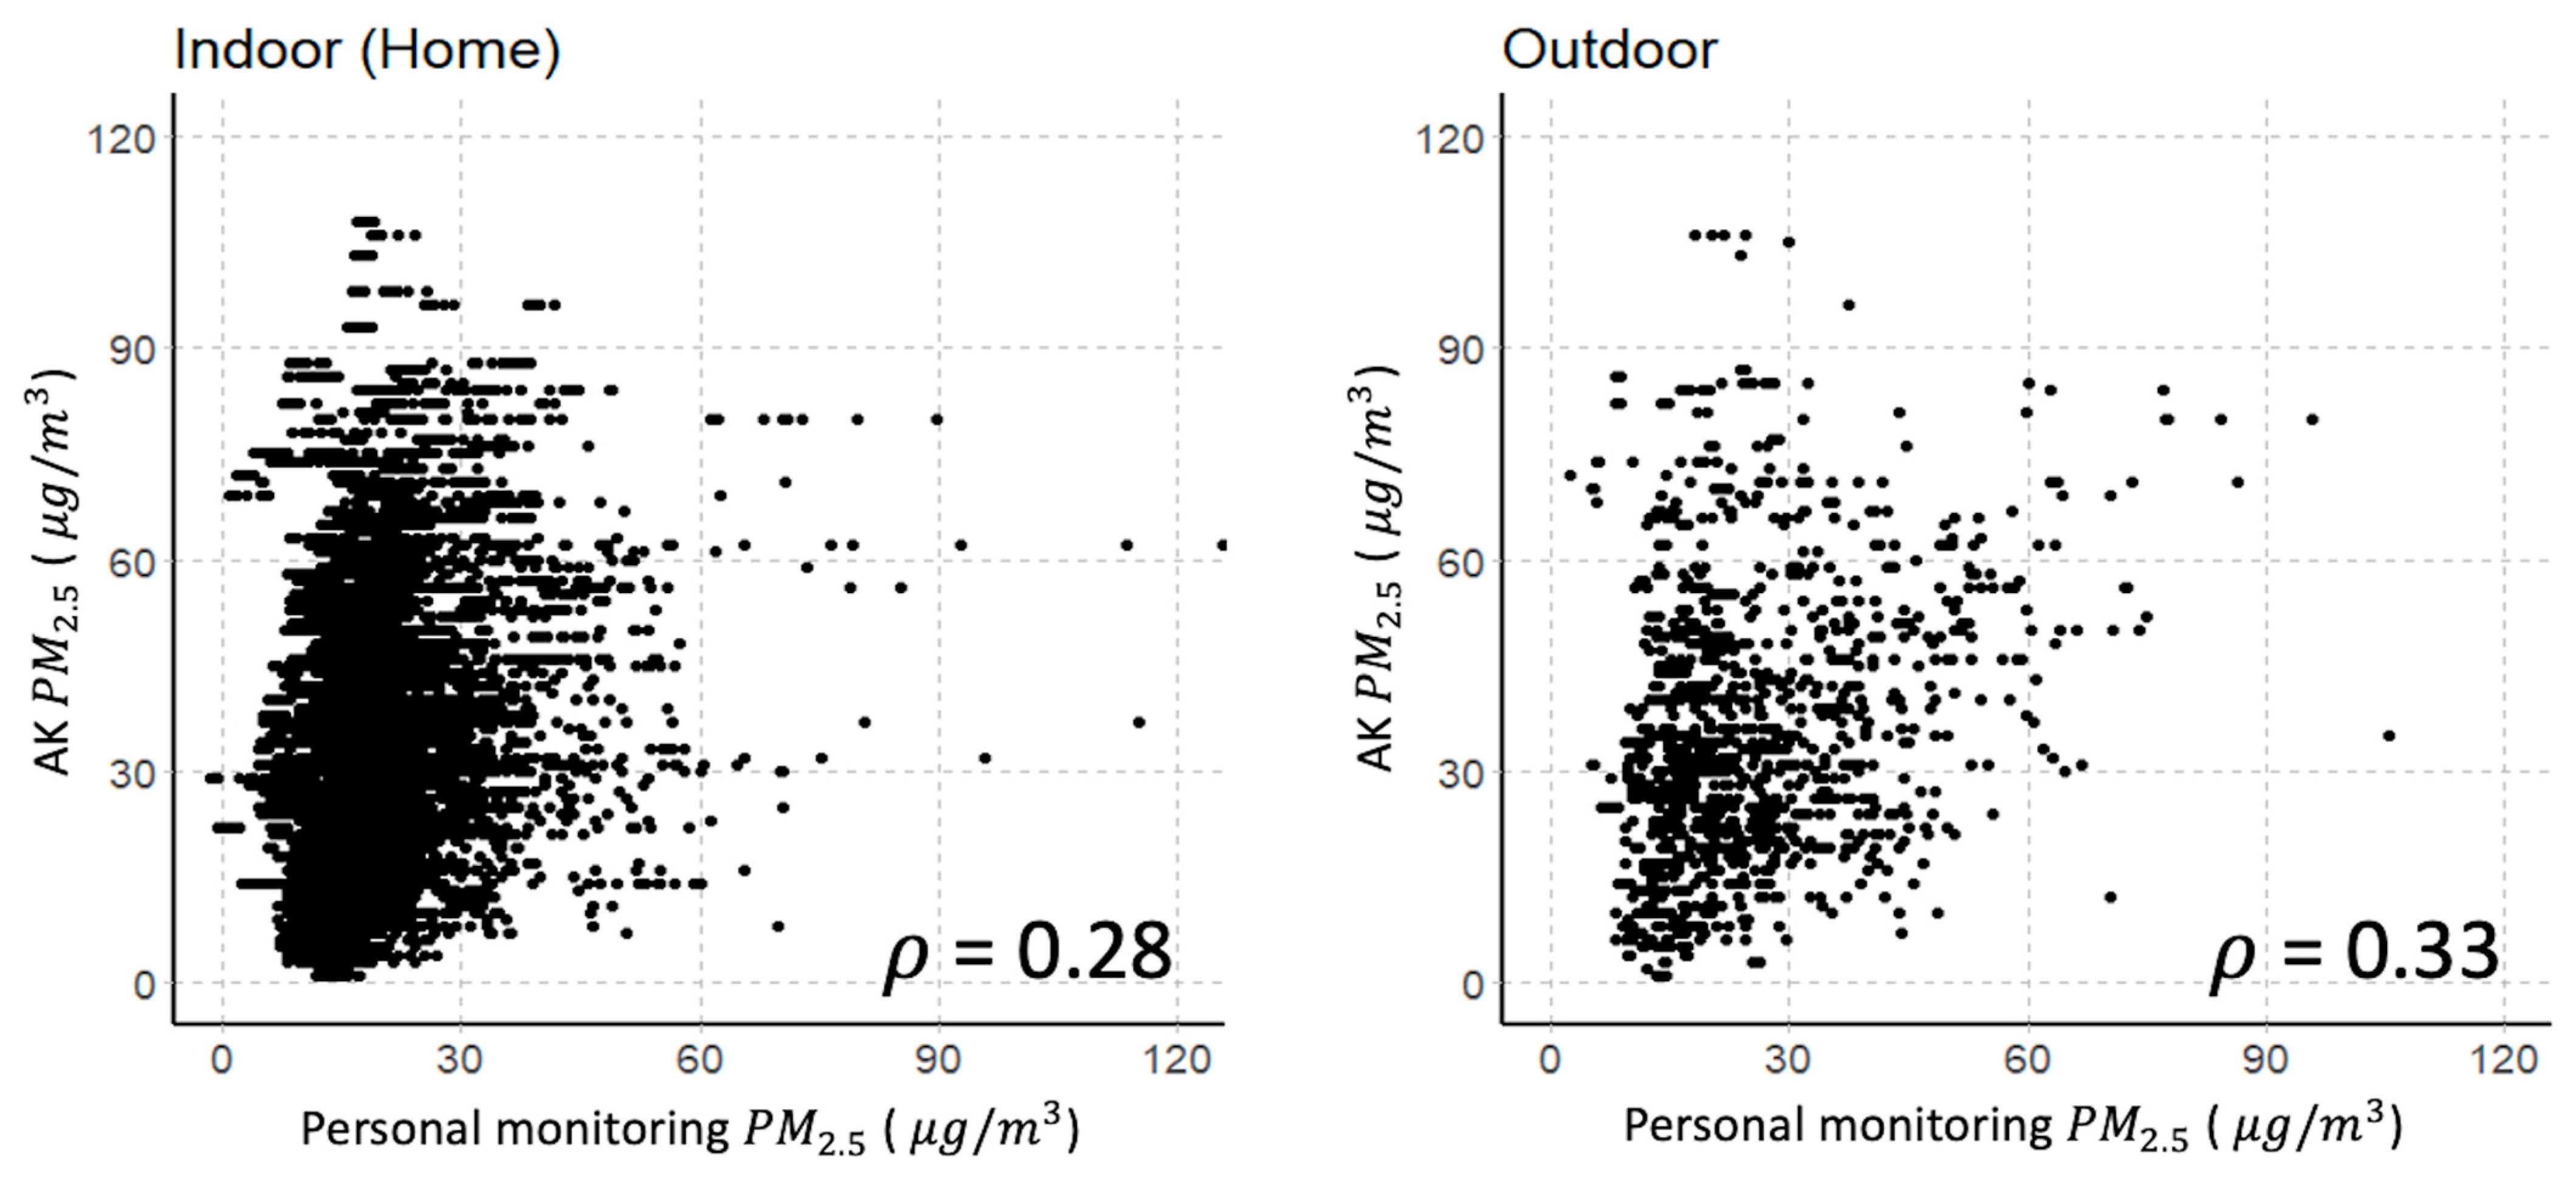
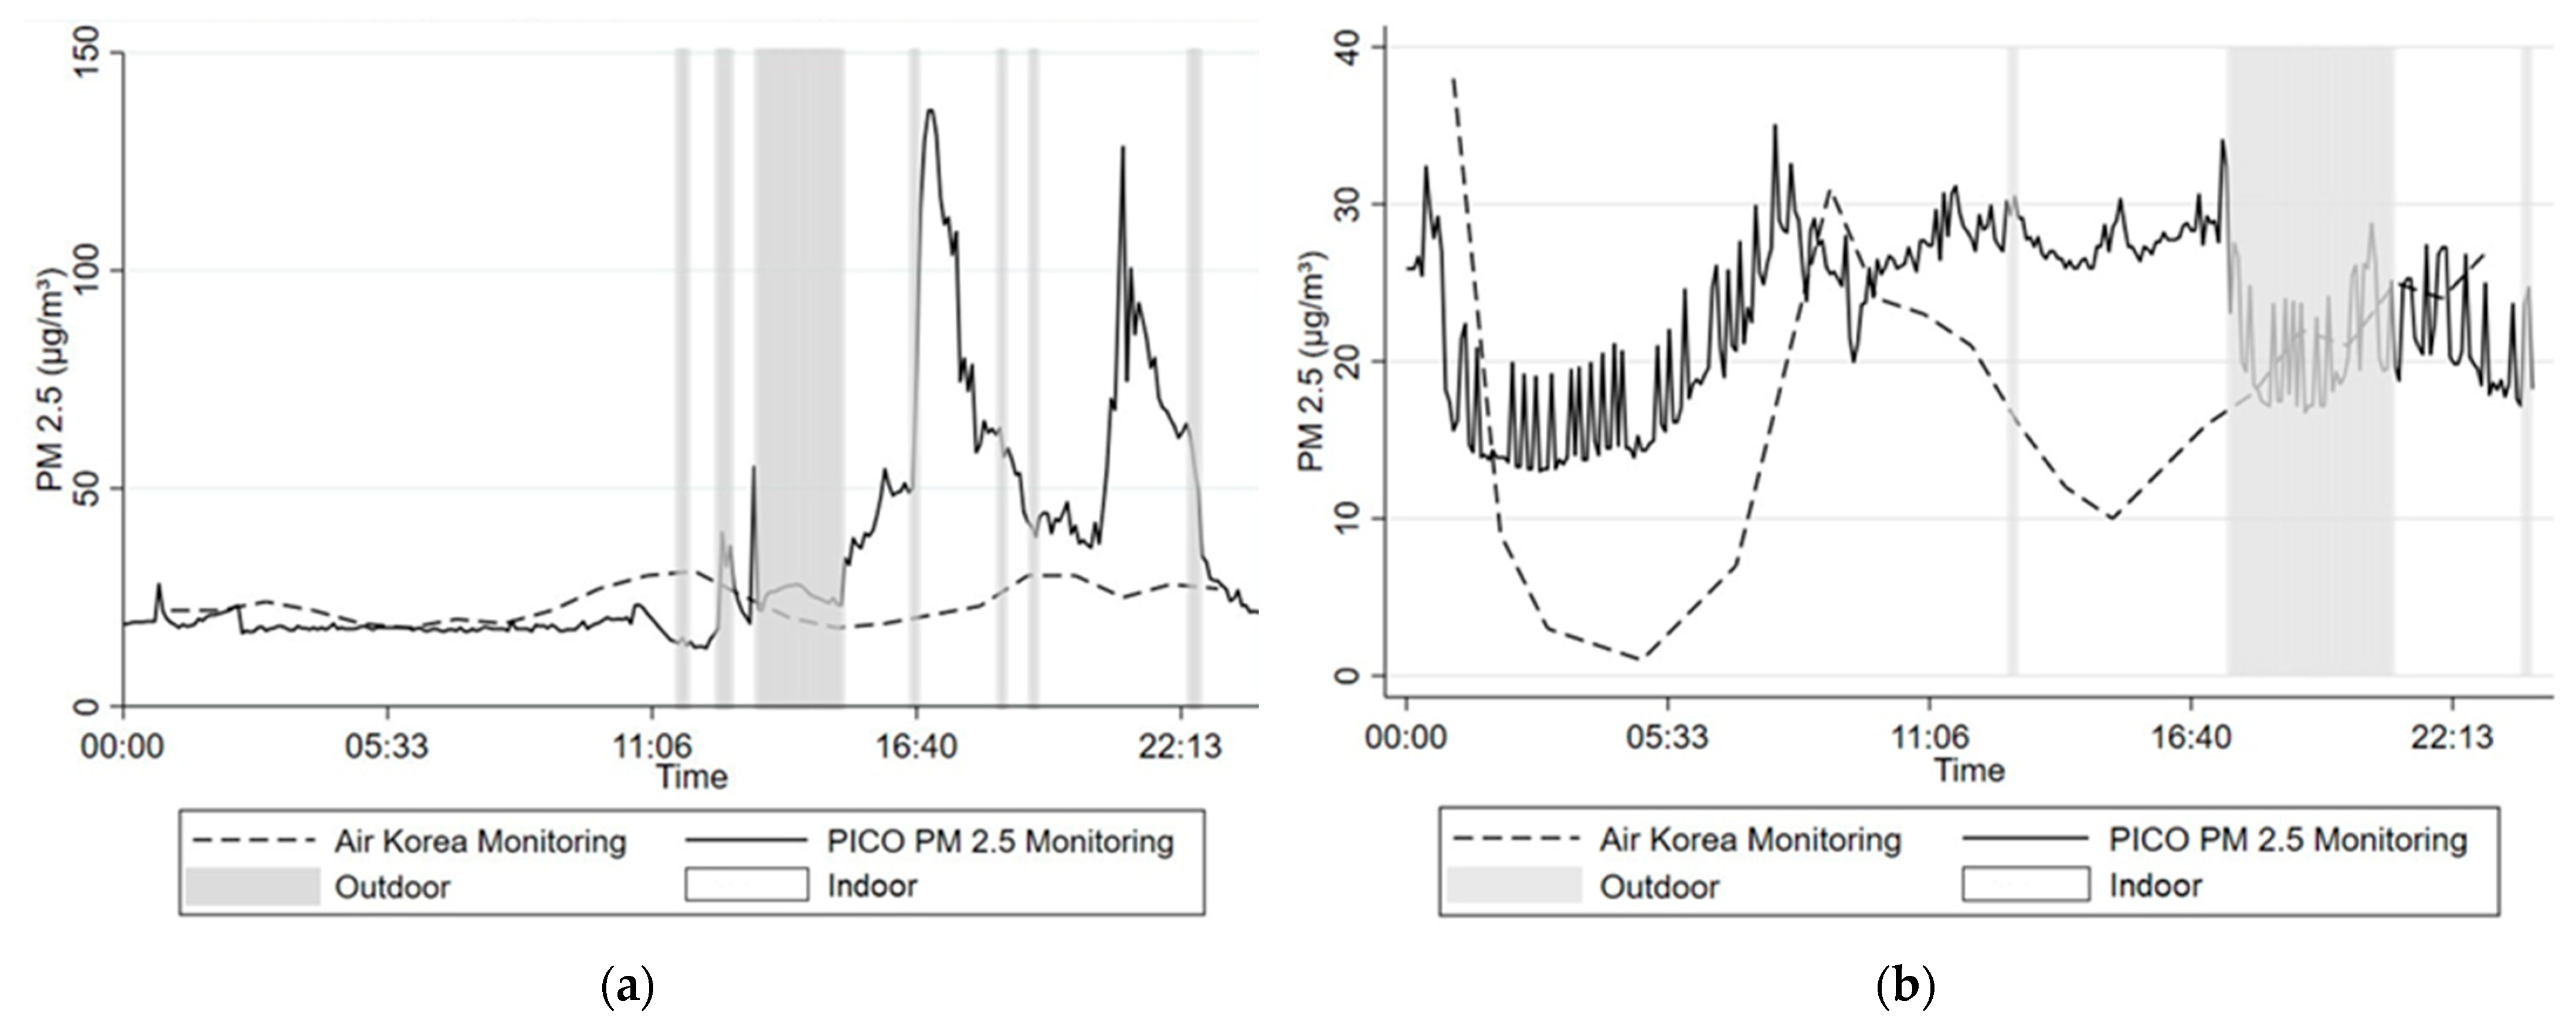
Both Air Korea data and PICO data were matched to construct the integrated database for all 47 study participants, which were used for a series of comparative data analyses on PM 2.5 measures from station-based monitoring (Air Korea) and personal monitoring (PICO). Each data point from PICO was assigned to one of three spatial categories based on each participant’s daily mobility pattern: indoor (home), indoor (other than home) and outdoor, indicating where the respective PM 2.5 reading from PICO took place. Their 5-min moving distance was also calculated based on the GPS coordinates and used to identify their location as indoors/outdoors, combined with their time information (e.g., identified as outdoors if their moving speed is above a certain threshold, identified as indoors between midnight and 8am, etc.). The indoor-outdoor classification was verified by patient caregivers. In comparison analysis, not only the location but also the time of the measurements were used to evaluate the patterns of PM2.5 concentrations exposed to each, and all participants collected from two different air quality monitoring sources: PICO measurements at their real-time mobile locations and Air Korea measurements at the nearest fixed monitoring station.

3. Results

Figure 5 was created to compare temporal trends of the average PM 2.5 concentration aggregated for all patients from the personal monitoring device (red lines) with that from the “Air Korea” data (black lines) throughout the study period. Overall, similar patterns were found between the two sources of PM 2.5 data, although on average PM 2.5 concentrations via personal monitoring tended to be lower with a larger variance across the records, compared to those from fixed monitoring stations. However, the differences between the two PM 2.5 data vary by time and location. As shown in Table 1, the difference in hourly PM 2.5 concentrations between Air Korea and PICO data are larger while staying indoors than outdoors, particularly in indoor environments other than home (p < 0.01), which indicates that the personal PM 2.5 monitoring data correspond well with the station-based data when the individuals stayed outdoors but show a substantially smaller exposure while indoors. While they were staying outdoors, the two PM 2.5 data sources were a lot better matched to each other during afternoon hours (noon to 8 p.m.) than morning (5 a.m. to noon) and night hours (8 p.m. to 6 a.m.). We also checked if the difference in PM 2.5 concentrations between Air Korea and PICO were substantially larger when they were outdoor at real-time locations farther from the nearest Air Korea station. The gap was found significantly bigger when they were beyond 500 m from the closest station (1.12 vs. 0.68), indicating the role of proximity to Air Korea stations in evaluating the similarities between the personalized and station-based PM 2.5 measures.
We then examined individual variation of PM 2.5 concentrations for each of 47 patients. The boxplot in Figure 6 shows a good amount of variation on the gap of PM 2.5 measures between station-based (Air Korea) and personal monitoring (PICO) among the patients. It appears that the Air Korea measurements were generally bigger than personalized PICO measurements for most of them, PICO measurements were found relatively higher for some patients (1-003, 5-003, 6-002), indicating heterogeneity in their life and the role of mobility patterns interacting with their neighboring environments.
For an illustration purpose, Figure 7 show a scatterplot comparing hourly average of PM 2.5 measures between station monitoring (AK) and personal monitoring (PICO) for two selected patients. For a majority of patients including these two, the two kinds of PM 2.5 measures are relatively well correlated with each other while staying outdoors with a correlation coefficient ranging between 0.3 and 0.6, compared to 0.1–0.3 while indoors at home. These results make sense when considering substantial variation in indoor environments and activities across different individuals.
Figure 8 also illustrates how the two PM 2.5 measures correspond to each other over time while indoors or outdoors, by comparing the data from the two monitoring sources (Air Korea and PICO) collected for two selected patients throughout the course of a 24 h time period, with the time of staying outdoors shaded in gray. Despite some fluctuations and noise, it looks evident that PICO measures are quite similar to those from Air Korea particularly when they stayed outdoors. However, a substantial discrepancy is observed between the two PM 2.5 data sources during indoors, implying that Air Korea measures may not be used as a proxy for indoor PM 2.5 exposure. Even if the indoor PM levels were reported to be generally lower from fixed sources than from personal monitoring while the subjects were indoors (shown in Table 1), these two examples illustrate the exact opposite, indicating some level of deviation from the overall trends depending on their indoor environments and activities.

4. Discussion

In this study, PM 2.5 concentrations were measured from the portable device with a low-cost sensor (“PICO”) for 47 asthmatic children living in Seoul’s metropolitan area and compared with the station-based hourly ambient PM 2.5 data (“Air Korea”) by the time and location. On an aggregate level, relatively similar temporal patterns were found between the two sources of PM 2.5 data, but average PM 2.5 concentrations via personal monitoring tended to be lower than those from fixed monitoring stations, particularly when the subjects were located indoors, during the evening or nighttime, and farther from the fixed monitoring station. However, on an individual patient level, the two PM 2.5 measures did not correspond well to each other while staying indoors due to significant variations in lifestyle, moving patterns and indoor environments across the subjects. These results not only underline the potential limitations of station-based data to assess a person’s true PM 2.5 exposure, but also highlight the role of personal monitoring via low-cost mobile sensors as an important supplement or even alternative to the conventional station-based monitoring. This is even more true since the COVID-19 pandemic began because people were forced or willing to spend more time indoors and reduce outdoor activities to avoid the risk of virus exposure [38]. It is beyond the scope of our study to identify the sources of elevated PM 2.5 measures, both indoor and outdoor, but is worth exploring in the future study.
It is known that both genetic and environmental factors have a role in the incidence or intensity of the symptoms of allergic diseases such as asthma [39]. However, primary prevention of allergic diseases by controlling a single environmental risk factor such as PM 2.5 is far from being achieved mostly because of the complex dynamics of various individual and ecological factors contributing to allergic diseases and other environmentally related diseases. Instead, a personalized prevention and proactive intervention to mitigate symptoms via exposure assessment and control could become more accurate and effective if an evidence-based analytical tool is developed to predict patient-specific risks for allergic diseases based on a close monitoring of a patient’s real-time exposure to indoor and outdoor PM 2.5 . This approach has been widely recommended as part of a secondary and tertiary prevention strategy for allergic disease [40].
Accurate large-scale monitoring of air pollutants often requires costly and high-precision measurement equipment, which serve as barriers for personalized intervention tailored to individual characteristics and exposure pathway. Despite the outstanding challenges revealed in this study, there is a great potential for low-cost, real-time sensors to be broadly implemented as a complementary PM monitoring platform to provide timely, personalized alerts and advice for vulnerable populations. Aside from the efforts to fine-tune the existing mobile sensors and devices, dedicated efforts should be made to develop GPS-enabled wearable and patchable devices as a next-generation environmental and health monitoring tool that assesses the true level of environmental exposure to the human body at every second or minute interval [41,42]. The recent development of IoT technology and deep learning algorithm could serve as promising tool for processing and analyzing the real-time air pollution data [43,44] that underpins the backbone of evidence-based personalized medicine and environmental exposure management.

Author Contributions

Conceptualization, D.J.S. and S.-C.S.; methodology, D.K.; software, Y.Y. (Yunjin Yum) and K.G.; formal analysis, Y.Y. (Yunjin Yum), K.G. and S.-C.S.; investigation, D.K., Y.Y. (Yunjin Yum), J.-W.K., W.K.K., H.-S.B., D.I.S., H.-J.Y., Y.Y. (Young Yoo), J.Y., D.H.L., S.-C.S. and D.J.S.; resources, D.J.S. and S.-C.S.; data curation, Y.Y. (Yunjin Yum); writing—original draft preparation, D.K. and Y.Y. (Yunjin Yum); writing—review and editing, S.-C.S. and D.J.S.; visualization, Y.Y. (Yunjin Yum) and K.G.; supervision, D.J.S.; project administration, D.J.S. and S.-C.S.; funding acquisition, D.J.S. All authors have read and agreed to the published version of the manuscript.

Funding

This research was supported by the Research Program funded by the Korea Disease Control and Prevention Agency (grant number 2019ER670800).

Institutional Review Board Statement

The study was conducted according to the guidelines of the Declaration of Helsinki and approved by the Institutional Review Board of Korea University Guro Hospital (protocol code: 2019GR0351/date of approval: 9-26-2019).

Informed Consent Statement

Informed consent was obtained from all subjects involved in the study.

Data Availability Statement

Data available on request due to restrictions eg privacy or ethical The data presented in this study are available on request from the corresponding author. The data are not publicly available due to the consent provided by participants on the use of confidential data.

Conflicts of Interest

The authors declare no conflict of interest.

References

  1. Englert, N. Fine particles and human health—A review of epidemiological studies. Toxicolgy Lett. 2004, 149, 235–242. [Google Scholar] [CrossRef]
  2. Chen, H.; Burnett, R.; Kwong, J.; Vileneuve, P.; Goldberg, M.; Brook, R.; Donkelaar, A.; Jerrett, M.; Martin, R.; Brook, J.; et al. Risk of Incident Diabetes in Relation to Long-term Exposure to Fine Particulate Matter in Ontario, Canada. Environ. Health Perspect. 2013, 121, 804–810. [Google Scholar] [CrossRef] [PubMed]
  3. Kriit, H.; Forsberg, B.; Astrom, D.; Oudin, A. Annual dementia incidence and monetary burden attributable to fine particulate matter (PM2.5) exposure in Sweden. Environ. Health 2021, 20, 65. [Google Scholar] [CrossRef]
  4. Peters, A. Particulate matter and heart disease: Evidence from epidemiological studies. Toxicol. Appl. Pharmacol. 2005, 207, 477–482. [Google Scholar] [CrossRef] [PubMed]
  5. Snyder, E.; Watkins, T.; Solomon, P.; Thoma, E.; Williams, R.; Hagler, G.; Shelow, D.; Hindin, D.; Kilaru, V.; Preuss, P. The Changing Paradigm of Air Pollution Monitoring. Environ. Sci. Technol. 2013, 47, 11369–11377. [Google Scholar] [CrossRef] [PubMed]
  6. Jacquemin, B.; Kauffmann, F.; Pin, I.; Moual, N.; Bousquet, J.; Gormand, F.; Just, J.; Nadif, R.; Pison, C.; Vervloet, D.; et al. Air pollution and asthma control in the Epidemiological study on the Genetics and Environment of Asthma. J. Epidemiol. Community Health 2012, 66, 796–802. [Google Scholar] [CrossRef] [Green Version]
  7. Kim, D.; Choi, H.; Gal, W.; Seo, S. Five Year Trends of Particulate Matter Concentrations in Korean Regions (2015–2019): When to Ventilate? Int. J. Environ. Res. Public Health 2020, 17, 5764. [Google Scholar] [CrossRef]
  8. Samoli, E.; Peng, R.; Ramsey, T.; Pipikou, M.; Touloumi, G.; Dominici, F.; Burnett, R.; Cohen, A.; Krewski, D.; Samet, J.; et al. Acute Effects of Ambient Particulate Matter on Mortality in Europe and North America: Results from the APHENA Study. Environ. Health Perspect. 2008, 116, 1480–1486. [Google Scholar] [CrossRef] [Green Version]
  9. Occhipinti, L.; Oluwasanya, P. articulate Matter Monitoring: Past, Present and Future. Int. J. Earth Environ. Sci. 2017, 2, 144. [Google Scholar] [CrossRef]
  10. Seo, S.; Kim, D.; Min, S.; Paul, C.; Yoo, Y.; Choung, J.T. GIS-based Association Between PM10 and Allergic Diseases in Seoul: Implications for Health and Environmental Policy. Allergy Asthma Immunol. Res. 2016, 8, 32–40. [Google Scholar] [CrossRef] [Green Version]
  11. Li, L.; Losser, T.; Yorke, C.; Piltner, R. Fast Inverse Distance Weighting-Based Spatiotemporal Interpolation: A Web-Based Application of Interpolating Daily Fine Particulate Matter PM2.5 in the Contiguous U.S. Using Parallel Programming and k-d Tree. Int. J. Environ. Res. Public Health 2014, 11, 9101–9141. [Google Scholar] [CrossRef]
  12. Liang, C.; Yu, P. Assessment and Improvement of Two Low-Cost Particulate Matter Sensor Systems by Using Spatial Interpolation Data from Air Quality Monitoring Stations. Atmosphere 2021, 12, 300. [Google Scholar] [CrossRef]
  13. Yun, J.; Sung, N.; Choi, S.; Kim, J. Real-time PM Monitoring System based on oneM2M IoT Platform and LoRa Networks. In Proceedings of the 2019 IEEE SENSORS, Montreal, QC, Canada, 27–30 October 2019; pp. 1–4. [Google Scholar]
  14. Steinle, S.; Reis, S.; Sabel, C.E.; Semple, S.; Twigg, M.M.; Braban, C.; Leeson, S.; Heal, M.; Harrison, D.; Lin, C.; et al. Personal exposure monitoring of PM2.5 in indoor and outdoor microenvironments. Sci. Total Environ. 2015, 508, 383–394. [Google Scholar] [CrossRef] [Green Version]
  15. Mukherjee, K.; Brocchieri, L.; Burglin, T.R. A comprehensive classification and evolutionary analysis of plant homeobox genes. Mol. Biol. Evol. 2009, 26, 2775–2794. [Google Scholar] [CrossRef] [PubMed] [Green Version]
  16. Bulot, F.; Johnston, S.J.; Basford, P.J.; Easton, N.; Apetroaie-Cristea, M.; Foster, G.; Morris, A.; Cox, S.; Loxham, M. Long-term field comparison of multiple low-cost particulate matter sensors in an outdoor urban environment. Sci. Rep. 2019, 9, 1–13. [Google Scholar] [CrossRef] [PubMed]
  17. Morawska, L.; Thai, P.; Liu, X.; Asumadu-Sakyi, A.; Ayoko, G.; Bartonova, A.; Bedini, A.; Chia, F.; Christensen, B.; Dunbabin, M.; et al. Applications of low-cost sensing technologies for air quality monitoring and exposure assessment: How far have they gone? Environ. Int. 2018, 116, 286–299. [Google Scholar] [CrossRef] [PubMed]
  18. Mukherjee, A.; Stanton, L.; Graham, A.; Roberts, P. Assessing the Utility of Low-Cost Particulate Matter Sensors over a 12-Week Period in the Cuyama Valley of California. Sensors 2017, 17, 1805. [Google Scholar] [CrossRef] [Green Version]
  19. Badura, M.; Batog, P.; Drzeniecka-Osiadacz, A.; Modzel, P. Regression methods in the calibration of low-cost sensors for ambient particulate matter measurements. SN Appl. Sci. 2019, 1, 622. [Google Scholar] [CrossRef] [Green Version]
  20. Lee, S.; Yang, T.; Kim, T. Mobile-Based Sensing Scheme to Minimize Battery Power Consumption for Urban Monitoring Systems. Electronics 2021, 10, 198. [Google Scholar] [CrossRef]
  21. Cavaliere, A.; Carotenuto, F.; Gennaro, F.; Gioli, B.; Gualtieri, G.; Martelli, F.; Matese, A.; Toscano, P.; Vagnoli, C.; Zaldei, A. Development of Low-Cost Air Quality Stations for Next Generation Monitoring Networks: Calibration and Validation of PM2.5 and PM10 Sensors. Sensors 2018, 18, 2843. [Google Scholar] [CrossRef] [Green Version]
  22. Loh, B.; Choi, G. Calibration of Portable Particulate Matter–Monitoring Device using Web Query and Machine Learning. Saf. Health Work 2019, 10, 452–460. [Google Scholar] [CrossRef]
  23. Wijeratne, L.; Kiv, D.; Aker, A.; Talebi, S.; Lary, D. Using Machine Learning for the Calibration of Airborne Particulate Sensors. Sensors 2020, 20, 99. [Google Scholar] [CrossRef] [PubMed] [Green Version]
  24. Jung, M.; Cho, D.; Shin, K. The Impact of Particulate Matter on Outdoor Activity and Mental Health: A Matching Approach. Int. J. Environ. Res. Public Health 2019, 16, 2983. [Google Scholar] [CrossRef] [PubMed] [Green Version]
  25. Kim, J. Particulate Matter Mortality Rates and Their Modification by Spatial Synoptic Classification. Int. J. Environ. Res. Public Health 2019, 16, 1904. [Google Scholar] [CrossRef] [PubMed] [Green Version]
  26. Kim, D.; Kim, J.; Seo, S. Real-Time Measurement of Indoor PM Concentrations on Daily Change of Endocrine Disruptors in Urine Samples of New Mothers. Sustainability 2020, 12, 6166. [Google Scholar] [CrossRef]
  27. Marques, G.; Pitarma, R. Particulate Matter Monitoring and Assessment through Internet of Things: A Health Information System for Enhanced Living Environments. J. Med. Syst. 2020, 44, 207. [Google Scholar] [CrossRef]
  28. Kim, S.; Park, S.; Lee, J. Evaluation of Performance of Inexpensive Laser Based PM2.5 Sensor Monitors for Typical Indoor and Outdoor Hotspots of South Korea. Appl. Sci. 2019, 9, 1947. [Google Scholar] [CrossRef] [Green Version]
  29. Lim, C.; Kim, H.; Vilcassim, M.; Thurston, G.; Gordon, T.; Chen, L.; Lee, K.; Heimbinder, M.; Kim, S. Mapping urban air quality using mobile sampling with low-cost sensors and machine learning in Seoul, South Korea. Environ. Int. 2019, 131, 105022. [Google Scholar] [CrossRef]
  30. Kim, D.; Seo, S.; Min, S.; Simoni, Z.; Kim, S.; Kim, M. A Closer Look at the Bivariate Association between Ambient Air Pollution and Allergic Diseases: The Role of Spatial Analysis. Int. J. Environ. Res. Public Health 2018, 15, 1625. [Google Scholar] [CrossRef] [Green Version]
  31. Hahm, Y.; Yoon, H. The impact of air pollution alert services on respiratory diseases: Generalized additive modeling study in South Korea. Environ. Res. Lett. 2021, 16, 064048. [Google Scholar] [CrossRef]
  32. Seo, J.; Kim, J.; Yang, J.; Yun, H.; Roh, M.; Kim, J.; Yu, S.; Jeong, N.; Jeon, H.; Choi, J.; et al. Changes in Air Quality during the COVID-19 Pandemic and Associated Health Benefits in Korea. Appl. Sci. 2020, 10, 8720. [Google Scholar] [CrossRef]
  33. Choi, Y.; Yoon, H.; Kim, D. Where do people spend their leisure time on dusty days? Application of spatiotemporal behavioral responses to particulate matter pollution. Ann. Reg. Sci. 2019, 63, 317–339. [Google Scholar] [CrossRef]
  34. Kim, K. Policy Report of Particulate Matters in Korea: Consumer’s Perspectives; KEITI: Seoul, Korea, 2019. [Google Scholar]
  35. Kwak, K. Relationship between rooftop and on-road concentrations of traffic-related pollutants in a busy street canyon: Ambient wind effects. Environ. Pollut. 2016, 208, 185–197. [Google Scholar] [CrossRef] [PubMed]
  36. Kim, J.; Kim, S. Comparative Analysis of Administrative Databases for Particulate Matter Air Pollution Between South Korea and the United States. J. Environ. Policy Adm. 2020, 28, 71–100. [Google Scholar] [CrossRef]
  37. Wang, Y.; Li, J.; Jing, H.; Zhang, Q.; Jiang, J.; Biswas, P. Laboratory Evaluation and Calibration of Three Low-Cost Particle Sensors for Particulate Matter Measurement. Aerosol Sci. Technol. 2015, 49, 1063–1077. [Google Scholar] [CrossRef]
  38. Oreskovic, N.; Kinane, B.; Aryee, E.; Kuhlthau, K.; Perrin, J. The Unexpected Risks of COVID-19 on Asthma Control in Children. J. Allergy Clin. Immunol. Pract. 2020, 8, 2489–2491. [Google Scholar] [CrossRef] [PubMed]
  39. Bener, A.; Abdulrazzaq, Y.M.; Al-Mutawwa, J.; Debuse, P. Genetic and Environmental Factors Associated with Asthma. Human Biol. 1996, 68, 405–414. [Google Scholar]
  40. Marinho, S.; Simpson, A.; Custovic, A. Allergen avoidance in the secondary and tertiary prevention of allergic diseases: Does it work? Prim. Care Respir. J. 2006, 15, 152–158. [Google Scholar] [CrossRef]
  41. Kamp, M.; Thio, B.; De Jongh, F.; Driessen, J. Wearable Home-Monitoring in Asthmatic Children. Am. J. Respir. Crit. Care Med. 2018, 197, A2028. [Google Scholar]
  42. Fahimi, D.; Mahdavipour, O.; Sabino, J.; White, R.; Paprotny, I. Vertically-stacked MEMS PM2.5 sensor for wearable applications. Sens. Actuators A 2019, 299, 111569. [Google Scholar] [CrossRef]
  43. Kim, D.; Cho, S.; Tamil, L.; Song, D.; Seo, S. Predicting Asthma Attacks: Effects of Indoor PM Concentrations on Peak Expiratory Flow Rates of Asthmatic Children. IEEE Access 2020, 8, 8791–8797. [Google Scholar] [CrossRef]
  44. Bhat, G.; Shanka, N.; Kim, D.; Song, D.; Seo, S.; Panahi, I.; Tamil, L. Machine Learning-based Asthma risk prediction using IoT and smartphone applications. IEEE Access 2021, 9, 118708–118715. [Google Scholar] [CrossRef]
Figure 1. Distribution of 154 fixed monitoring stations and 47 patient home locations.
Atmosphere 12 01192 g001
Figure 2. (a) PICO in a carrying pouch, (b) wearing appearance of PICO.
Atmosphere 12 01192 g002
Figure 3. Comparison of PM2.5 measurements across the five PICO devices.
Atmosphere 12 01192 g003
Figure 4. Temporal trends of PM2.5: (a) before calibration; (b) after calibration.
Atmosphere 12 01192 g004
Figure 5. Comparison in temporal variations of PM 2.5 values for all patients between station monitoring (Air Korea) and personal monitoring (PICO): (A) indoor (home)—hourly, (B) outdoor—hourly, (C) outdoor—daily.
Atmosphere 12 01192 g005aAtmosphere 12 01192 g005b
Figure 6. Box plot for the gap between station-based (Air Korea) and personal monitoring (PICO) PM2.5 measures for each patient.
Atmosphere 12 01192 g006
Figure 7. Scatterplot comparing hourly average of PM2.5 between station monitoring (AK) and per Scheme 2. Bottom: 1-009).
Atmosphere 12 01192 g007aAtmosphere 12 01192 g007b
Figure 8. Temporal trend of PM2.5 from station and personal monitoring for two selected patients (a: 1-005, b: 1-010).
Atmosphere 12 01192 g008
Table 1. Spatiotemporal comparison of PM2.5 statistics between station monitoring (Air Korea) and personal monitoring (PICO).
NAir Korea
Mean ± SD
PICO
Mean ± SD
Absolute DifferenceT (p)
Locations of measurementsIndoor (home)265,45731.08 ± 18.5027.31 ± 19.303.77<0.01
Indoor (other than home)64,53330.71 ± 17.9325.60 ± 19.335.11
Outdoor33,88031.34 ± 18.4930.33 ± 20.871.00
Time slots for measurements (outdoors only)Morning (6 a.m.–noon)769532.27 ± 17.8129.69 ± 16.702.58<0.01
Afternoon (noon–8 p.m.)20,04431.21 ± 19.0431.51 ± 22.270.29
Night/overnight (8 p.m.–6 a.m.)614130.58 ± 17.4527.32 ± 20.533.26
Distance from Air Korea station (outdoors only)Within 500 m222030.52 ± 18.5031.20 ± 22.410.68<0.01
Beyond 500 m31,66031.39 ± 18.4930.27 ± 20.761.12
Publisher’s Note: MDPI stays neutral with regard to jurisdictional claims in published maps and institutional affiliations.

