Article

Impact of Vehicle Soot Agglomerates on Snow Albedo

by
Sofía González-Correa
1,
Diego Gómez-Doménech
1,
Rosario Ballesteros
1,
Magín Lapuerta
1,*,
Diego Pacheco-Ferrada
2,
Raúl P. Flores
2,
Lina Castro
2,
Ximena Fadic-Ruiz
3 and
Francisco Cereceda-Balic
3
1
Escuela Técnica Superior de Ingenieros Industriales, Universidad de Castilla-La Mancha, 13071 Ciudad Real, Spain
2
Departamento de Obras Civiles, Universidad Técnica Federico Santa María, Avenue España 1680, Valparaíso 2390123, Chile
3
Centre for Environmental Technologies (CETAM) and Department of Chemistry, Universidad Técnica Federico Santa María, Avenue España 1680, Valparaíso 2390123, Chile
*
Author to whom correspondence should be addressed.
Submission received: 12 April 2022 / Revised: 21 April 2022 / Accepted: 11 May 2022 / Published: 13 May 2022
(This article belongs to the Special Issue Global Black Carbon Aerosols)

Abstract

:
Snow covers are very sensitive to contamination from soot agglomerates derived from vehicles. A spectroradiometric system covering a wavelength from 300 to 2500 nm with variable resolution (from 2.2 to 7.0 nm) was used to characterize the effect of soot derived from a diesel vehicle whose exhaust stream was oriented towards a limited snowed area. The vehicle was previously tested in a rolling test bench where particle number emissions and size distributions were measured, and fractal analysis of particle microscopic images was made after collecting individual agglomerates by means of an electrostatizing sampler. Finally, the experimental results were compared to modelled results of contaminated snow spectral albedo obtained with a snow radiative transfer model developed by our research group (OptiPar) and with other models. Both experimental and modelled results show that increasingly accumulated soot mass reduces the snow albedo with a constant rate of around 0.03 units per mg/kg, with a predominant effect on the UV-VIS range. Based on the small size of the primary particles (around 25 nm), the Rayleigh-Debye-Gans approximation, further corrected to account for the effect of multiple scattering within the agglomerates, was revealed as an appropriate technique in the model.

1. Introduction

Particles emitted by vehicles equipped with internal combustion engines have harmful effects on human health and the environment. Among the different ecosystems affected by such emissions, snowed surfaces are especially sensitive due to their high reflectivity [1]. Particles deposited on snow contribute to reducing the snow albedo, thus modifying the radiative forcing, the regional climate, and the water resources.
Many studies have been reported about the reduction of snow albedo by black carbon deposition from ambient, e.g., in the Himalayas [2,3], in Sierra Nevada (USA) [4], in Hokkaido island [5], in Alpes [6], Andes [7], etc. Other studies have examined the effect of well-controlled soot deposition on artificial snowpacks [8,9]. However, none of the above allows obtaining a clear relationship between the specific emission source and the radiative effect. Moreover, there are very few studies about the effect of the deposition of particulate matter from vehicle traffic onto snow surfaces, and these studies did not characterize morphologically the emitted particles and did not keep controlled conditions of the emitting vehicles.
Particulate matter emissions from vehicles are composed of soot agglomerates (black carbon) arranged as fractal clusters composed of quasi-spherical primary particles, and adsorbed hydrocarbons (organic carbon) [10]. Both soot and hydrocarbons have different optical properties. However, under hot-engine conditions, soot is the main component, and its light-absorbing characteristics become dominant, and can thus explain the snow albedo reduction and the consequent snow surface warming after deposition [11].
In a previous study [12], the variations of snow broadband albedo were related to the traffic intensity and the frequency of snowfalls. In the following study, reductions in broadband albedo were directly related to the BC areal mass density resulting from the traffic intensity [13]. Further on, a hyperspectral spectroradiometric system covering a wavelength from 300 to 2500 nm was used to characterize the effect of soot derived from traffic on the snow albedo [14]. In this complementary study, the particle emissions source is limited to a diesel vehicle whose exhaust stream was oriented towards a limited snowed area, and the analysis is again extended along the wavelength spectrum. The vehicle was previously tested in a rolling test bench where particle number emissions and size distributions were measured, and fractal analysis of particle microscopic images was made after collecting individual agglomerates by means of an electrostatizing sampler. Finally, experimental results were compared to modelled results of contaminated snow spectral albedo obtained with a snow radiative transfer model developed by our research group, named OptiPar [14].

2. Experimental Campaign

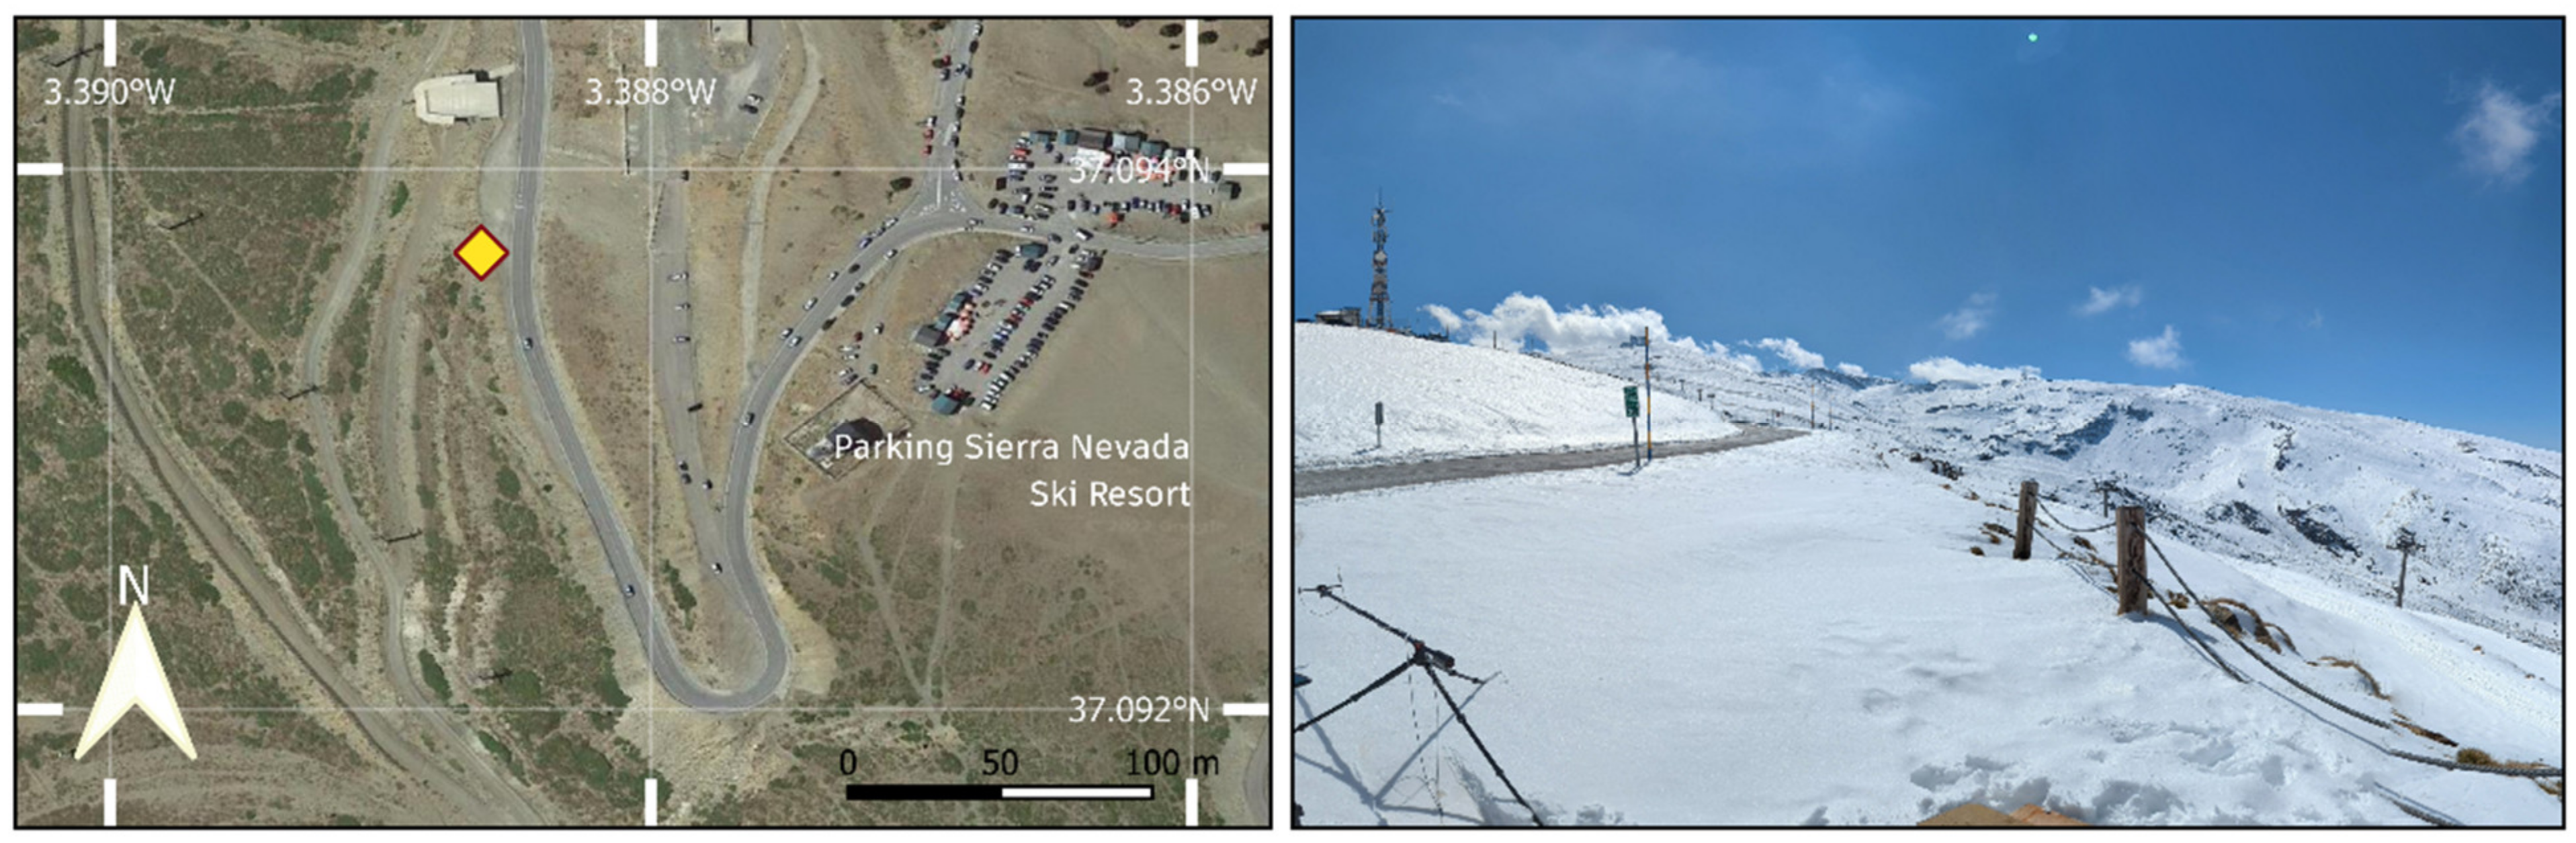
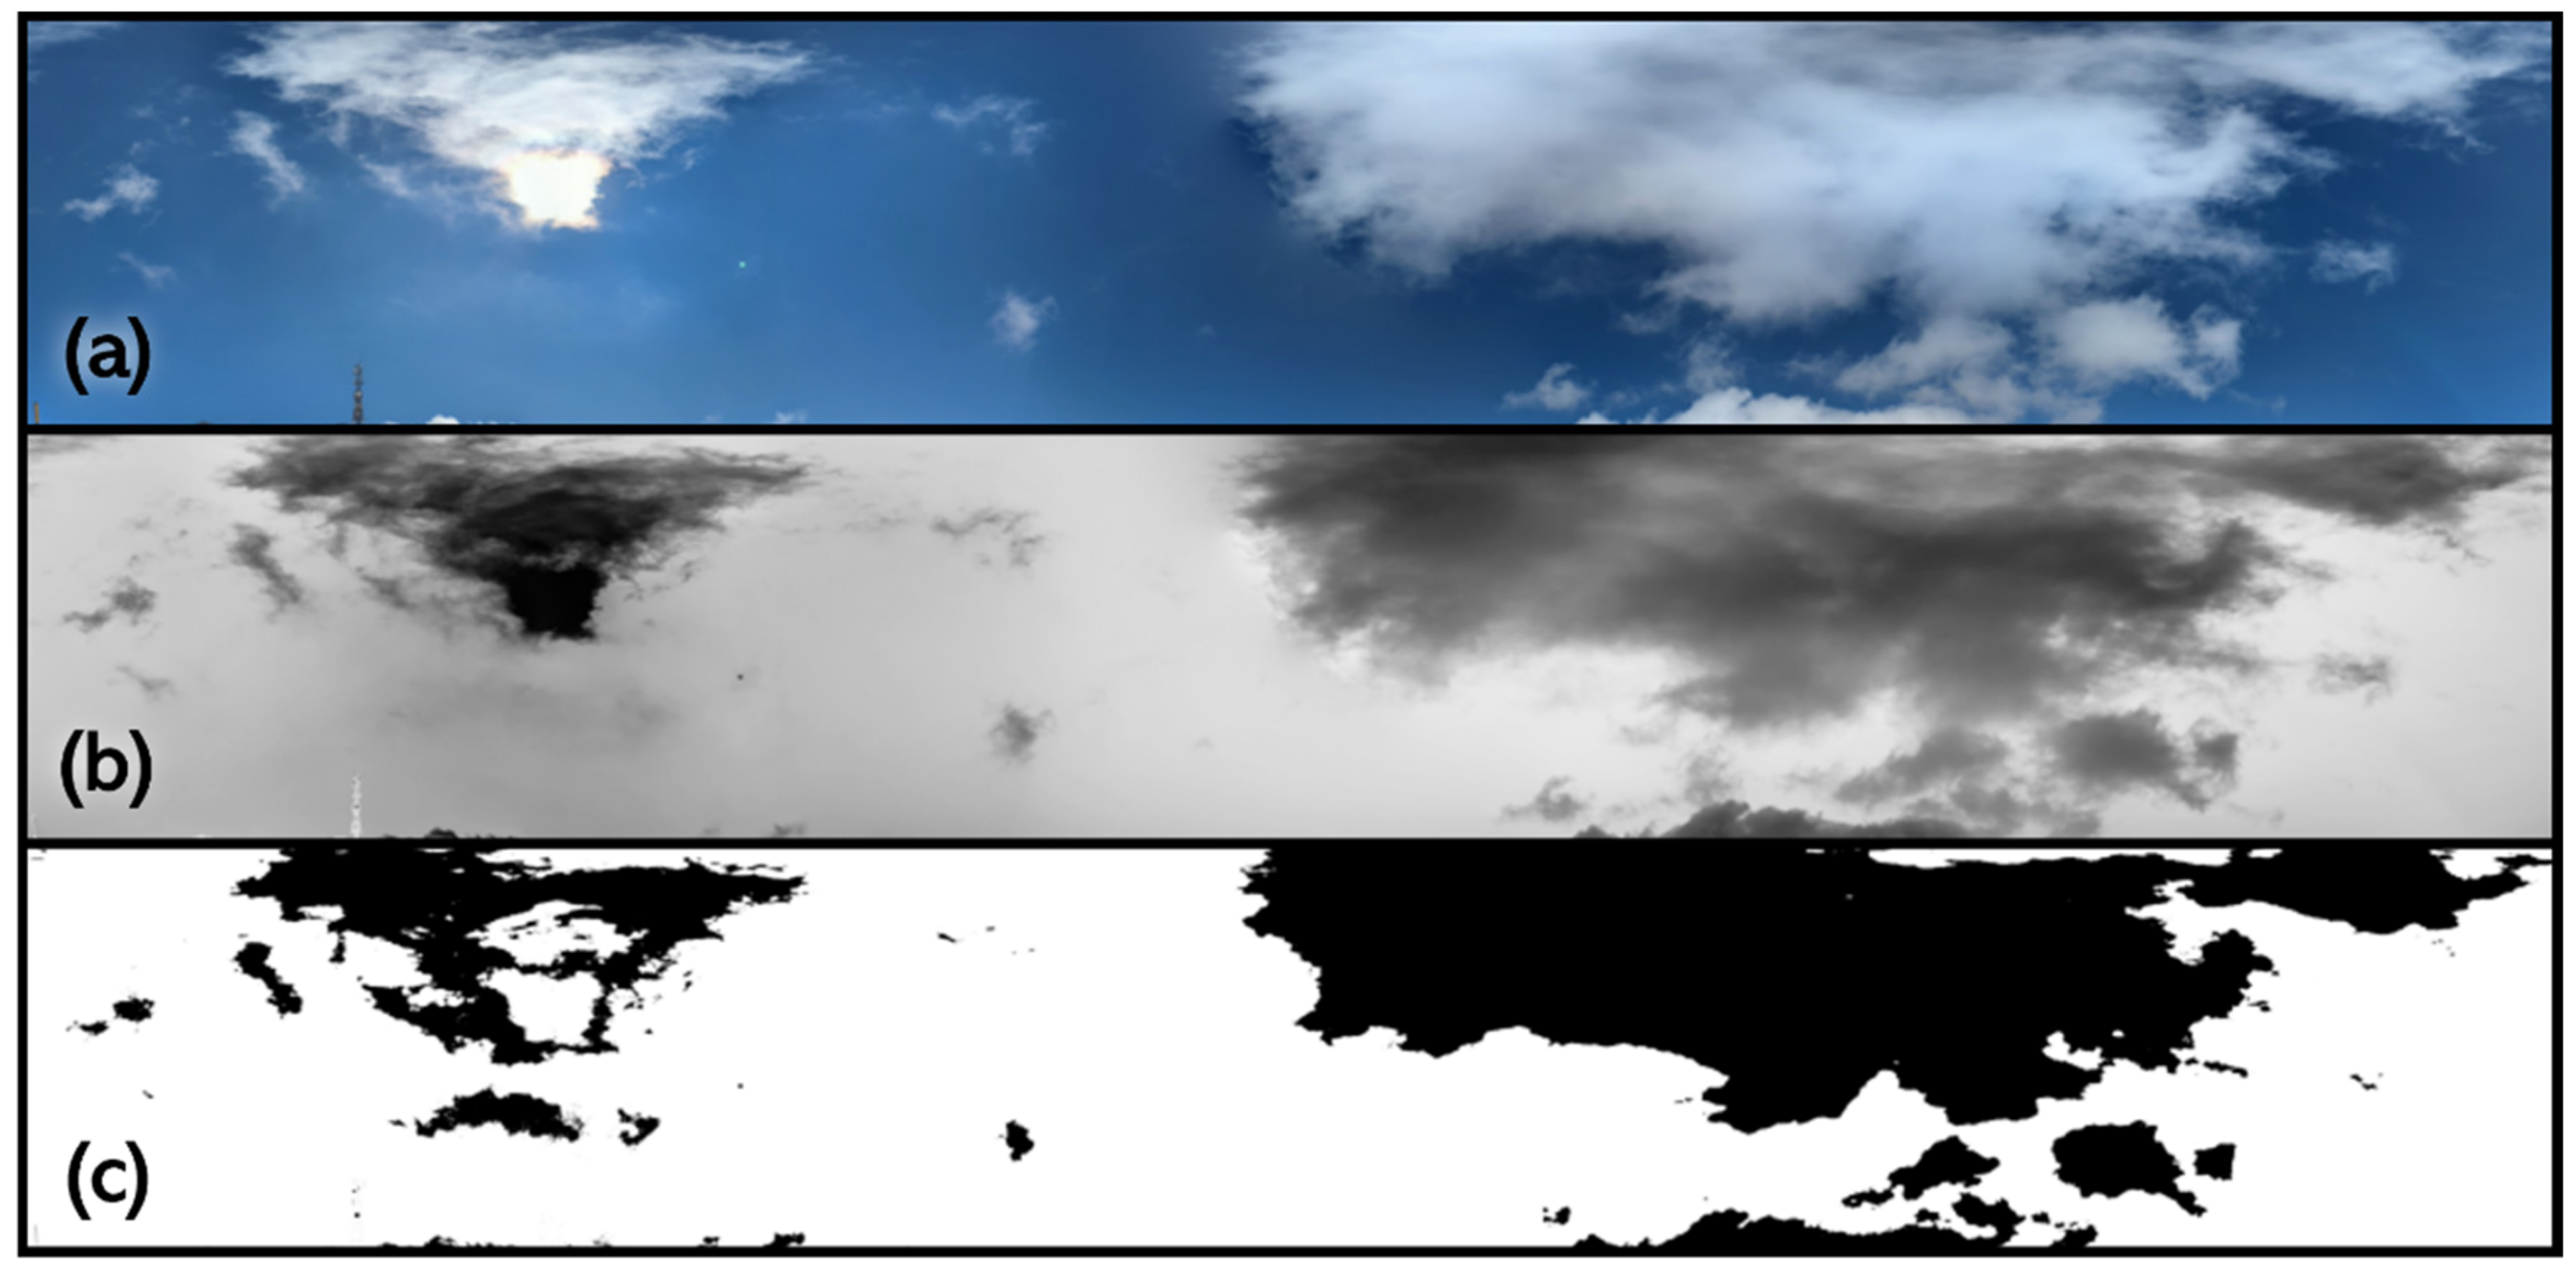
2.1. Site Description

The experimental campaign took place on 10 March 2022, in the proximities of Sierra Nevada ski resort, Granada, Spain (37.09° N, 3.39° W, 2500 m.a.s.l.) (see Figure 1). Sierra Nevada is characterized as a semiarid Mediterranean climate, with cold winters and a dry summer season, with precipitations concentrated between October and April [15]. Particularly, days previous to the experiment (4–8th March), weather conditions registered at Sierra Nevada ski resort showed mean air temperatures below 0° degrees and light snowfalls [16].
The site selected for the experiment was located nearby the road (see Figure 1). Measurements took place near solar noon (12.29 to 13:10 h. GTM + 1), where the snow albedo is less affected by solar time.

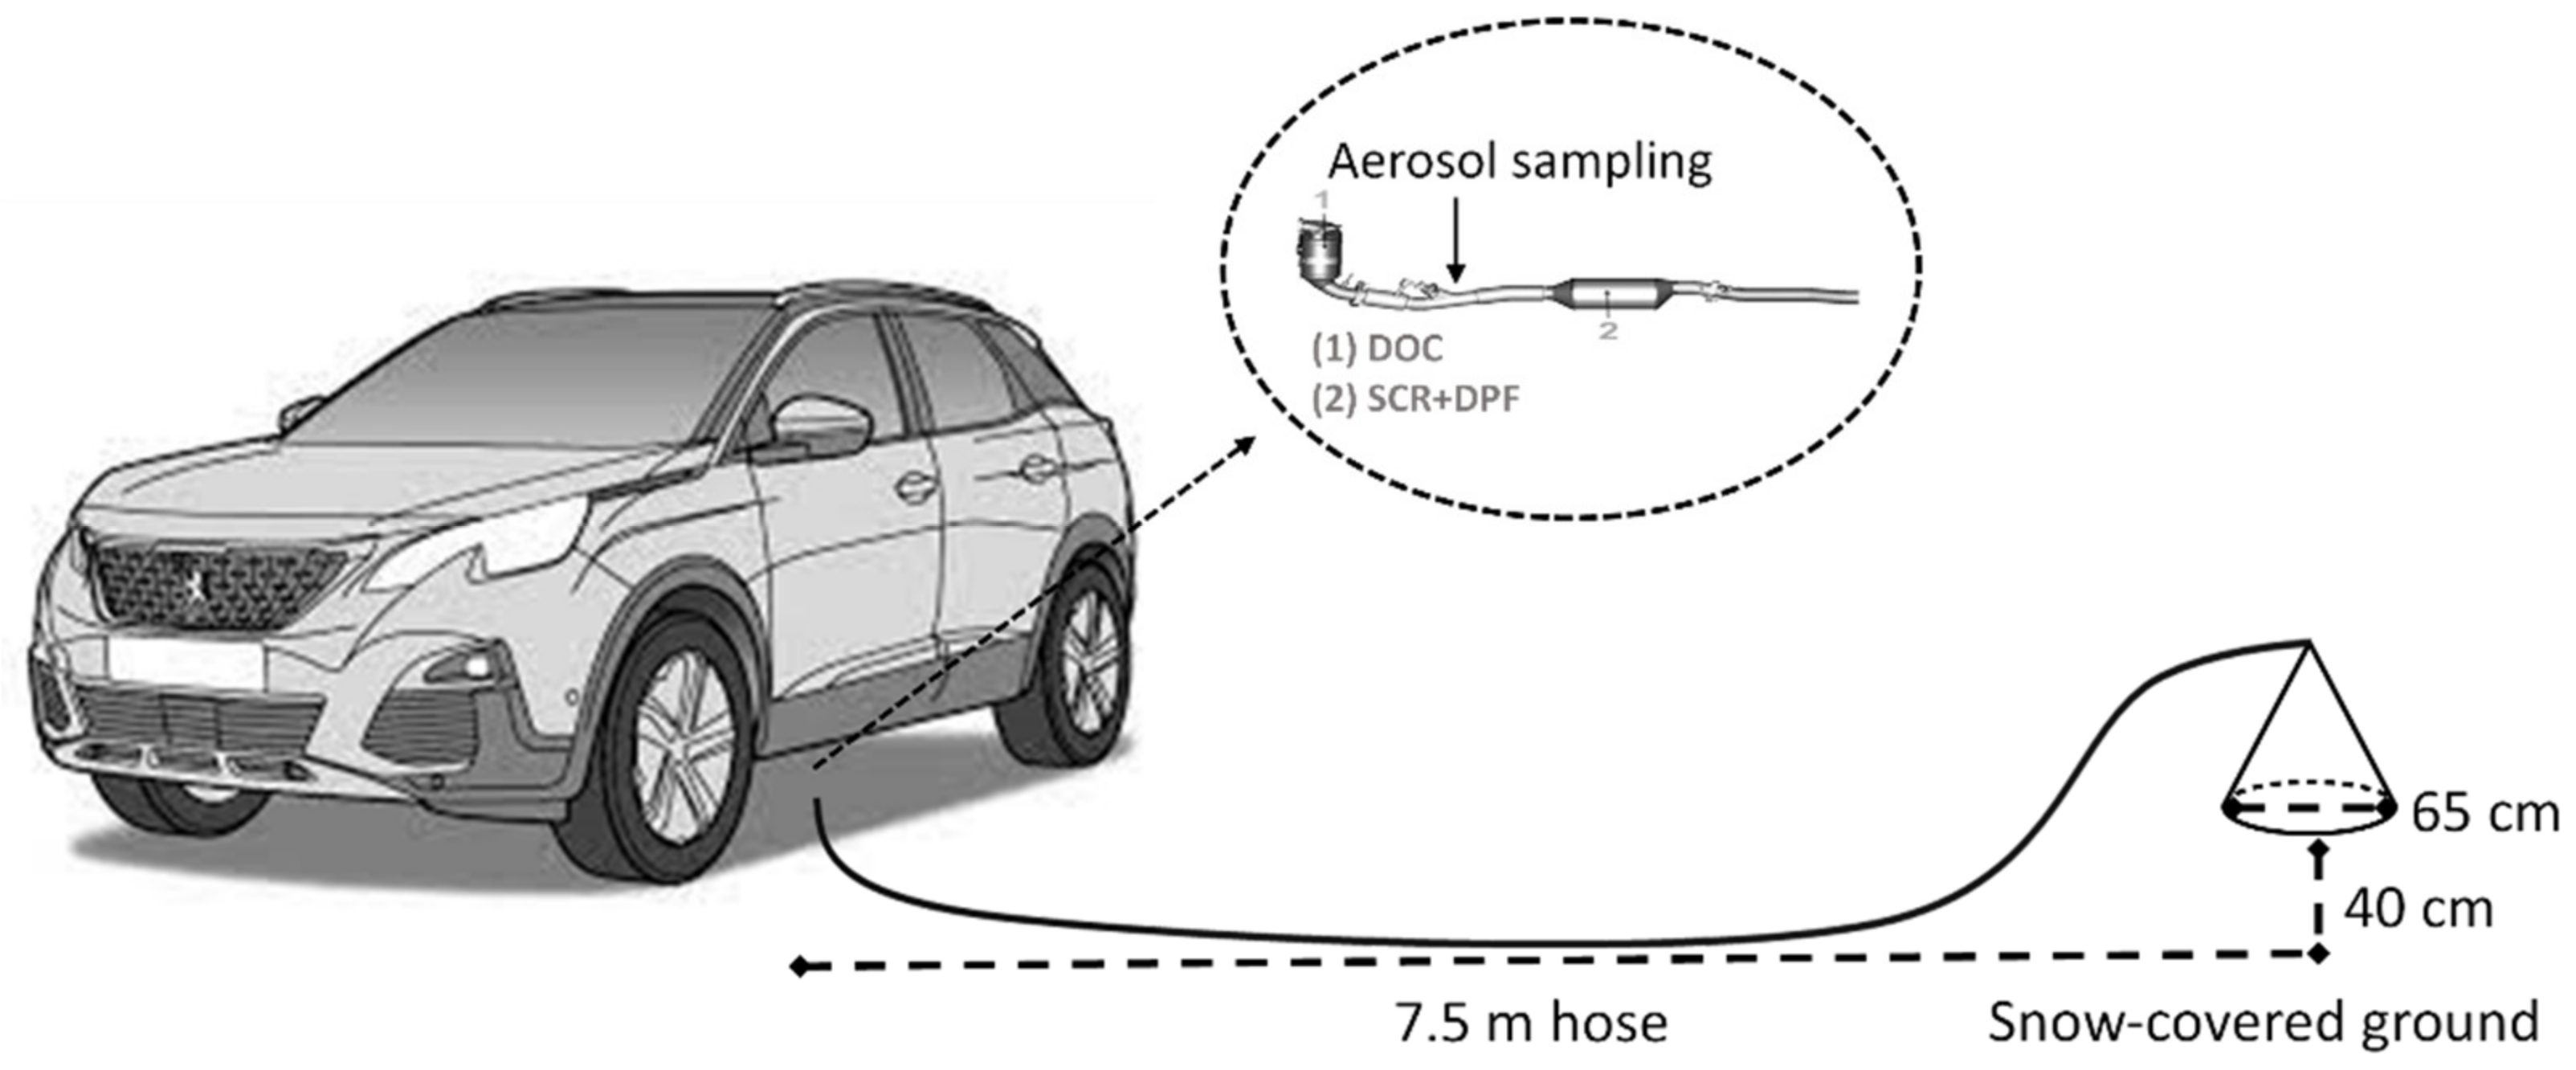
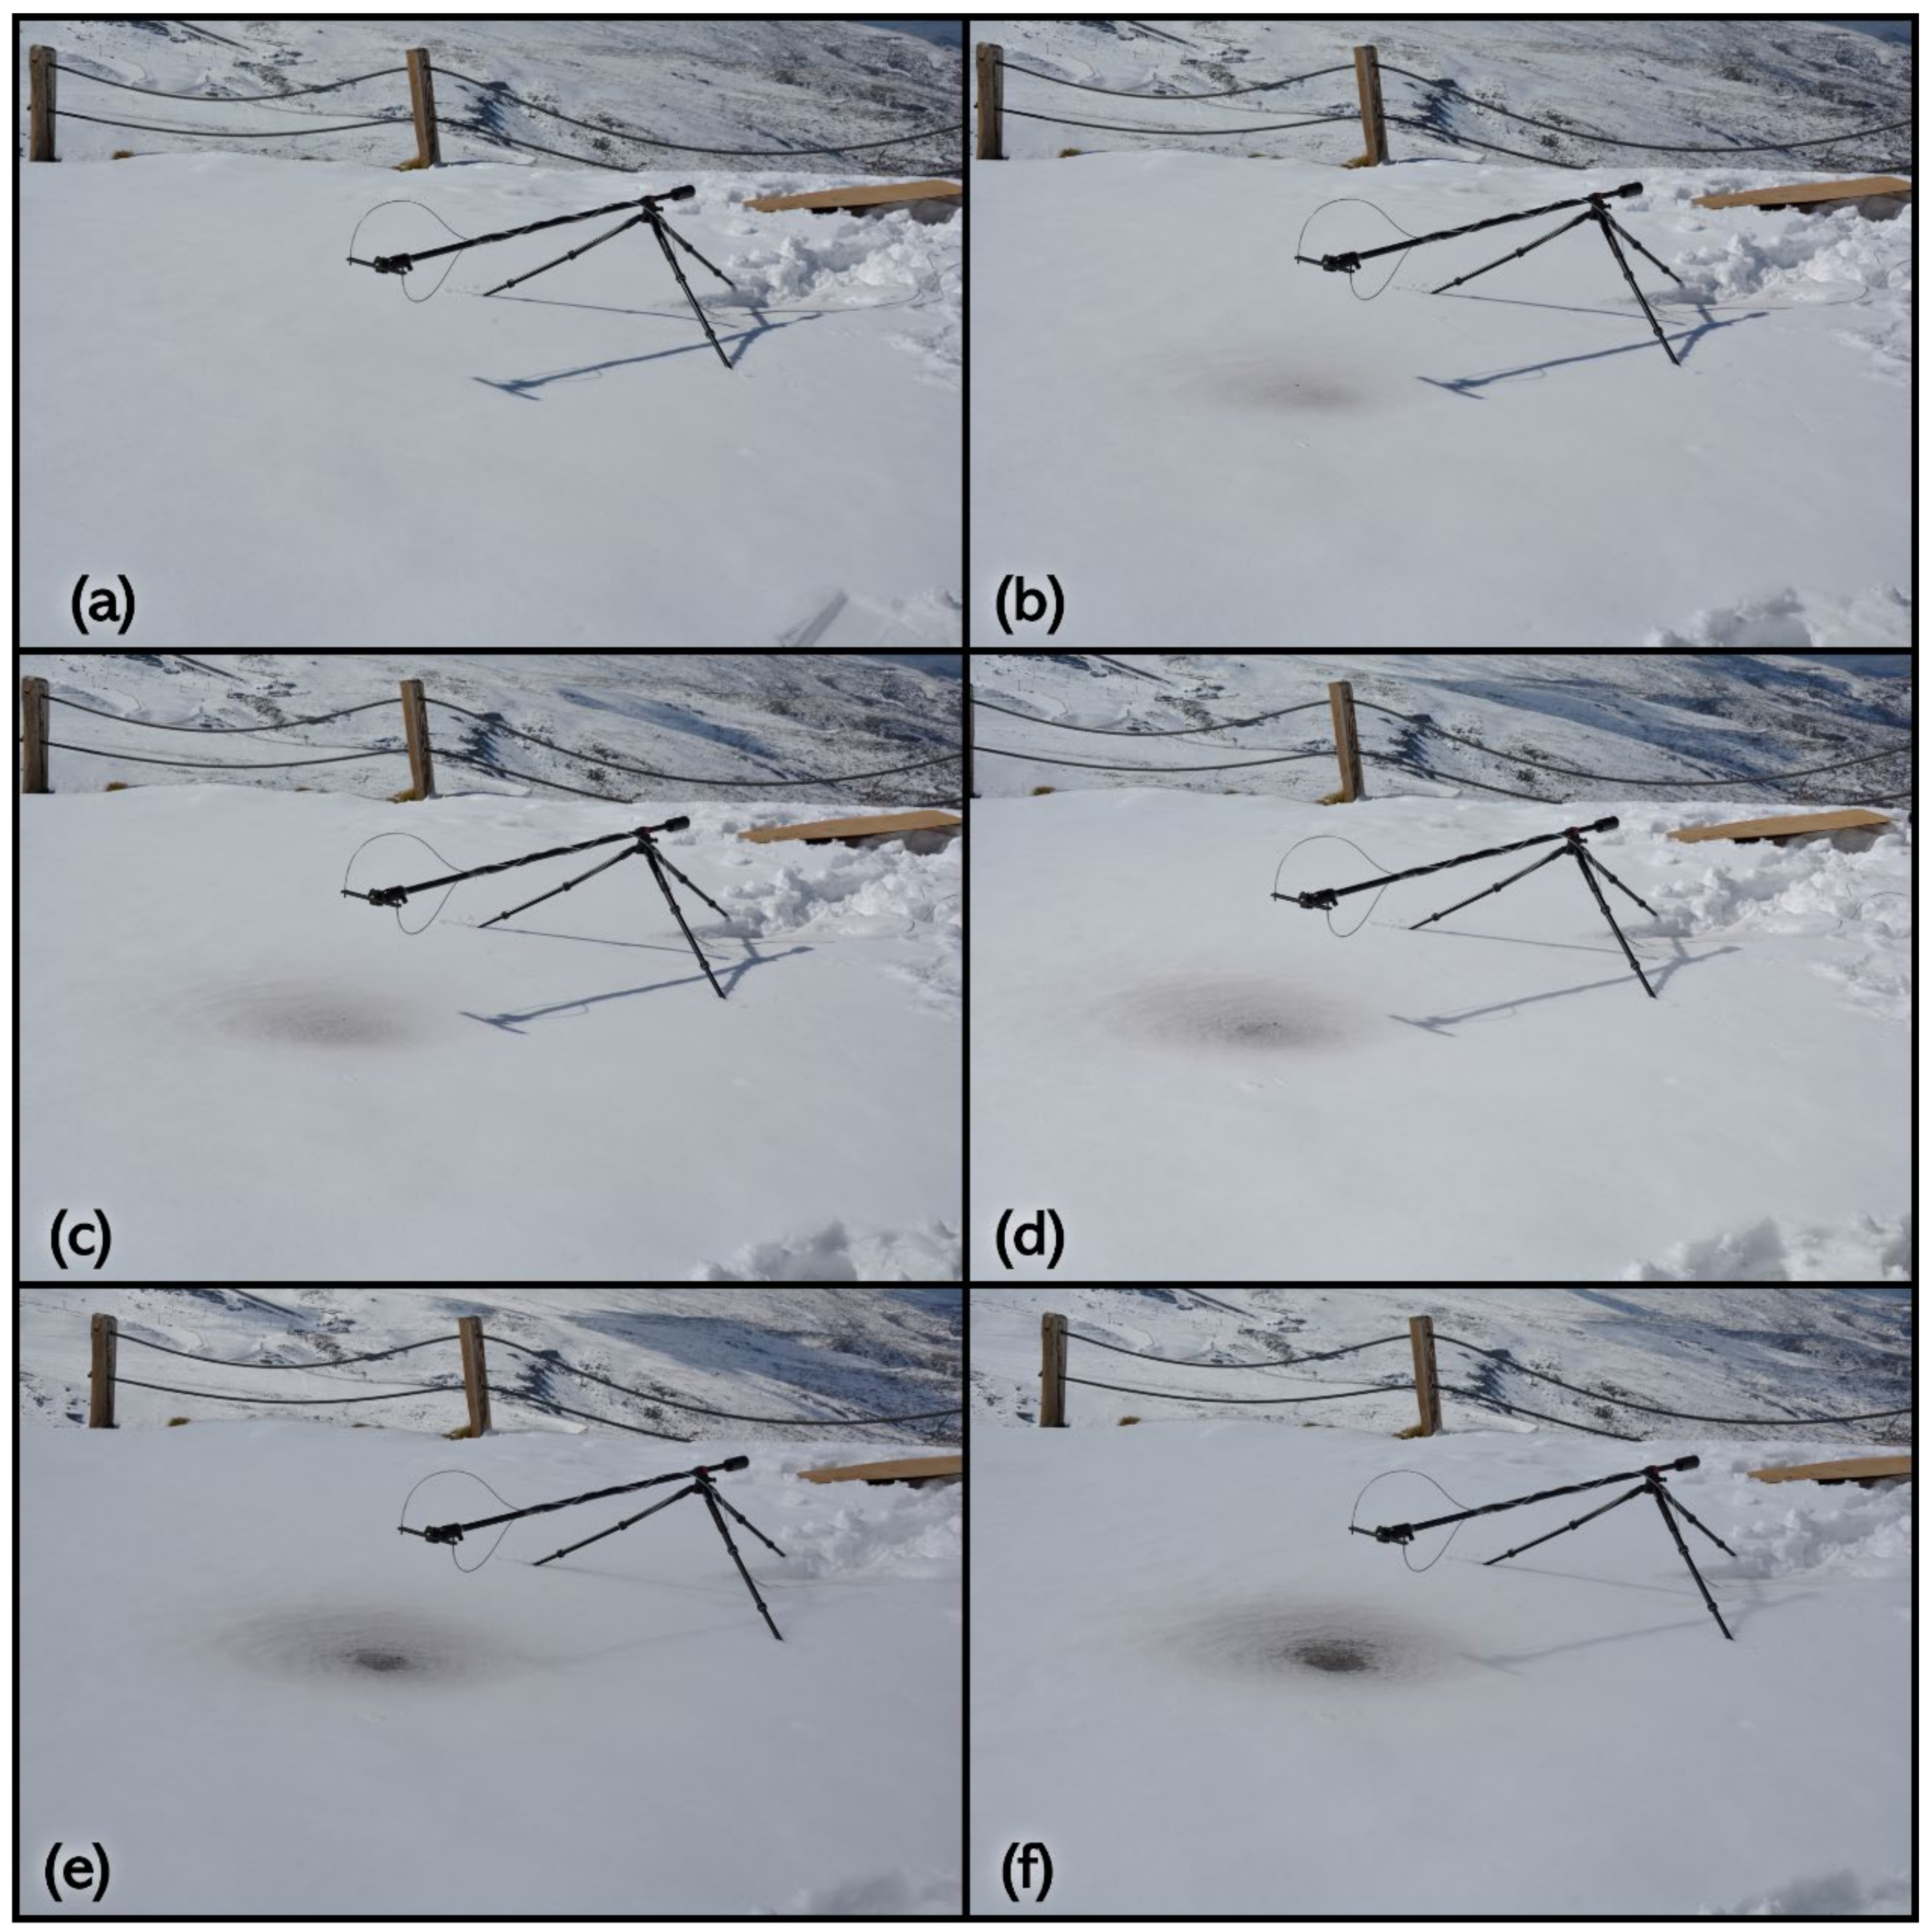
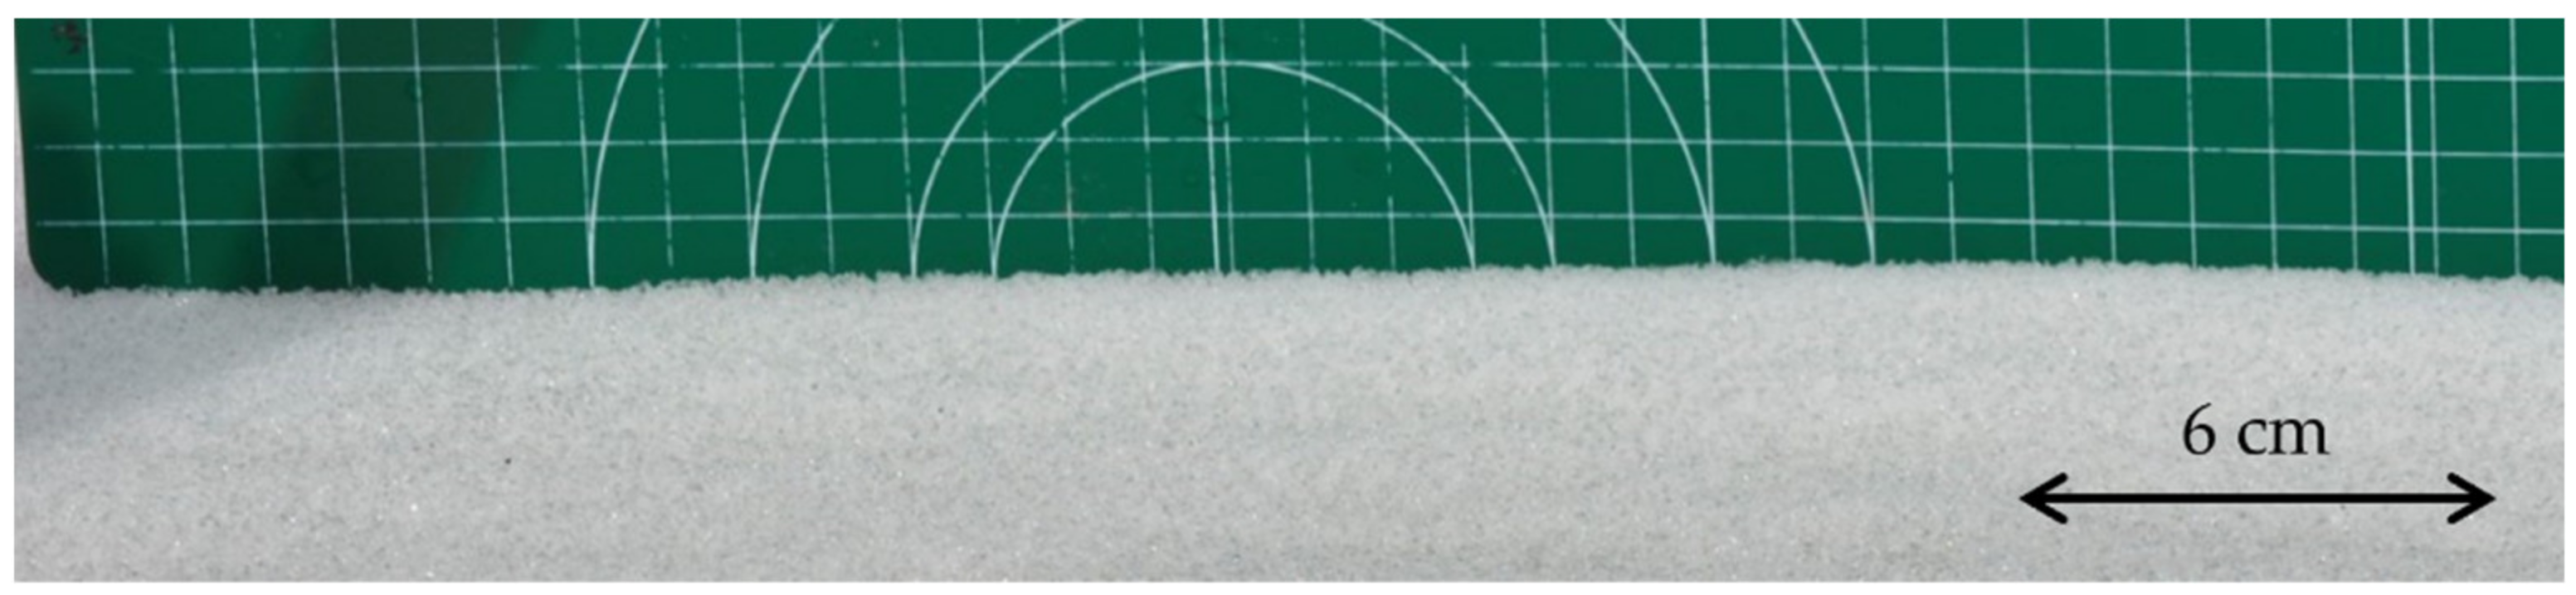
2.2. Experimental Methods

To reproduce particle deposition, an aerosol production and deposition method directly from a vehicle was designed (show Figure 2). Exhaust emissions from diesel vehicles were intercepted before any post-treatment system and conducted via a 6-m-long flexible pipe. At the pipe end, a plastic cone (65 cm diameter) was connected to act as a diffuser and to protect the assigned area from wind transport. A Peugeot 3008 1.6 blueHDi diesel vehicle was used as the source of soot particles, under hot engine conditions. The vehicle was filled with well-characterised first-fill diesel fuel, with nil biodiesel content, donated by Repsol [17]. Previously, the vehicle emissions (number and particle size distribution) were characterized in a rolling test bench [18]. In these tests, samples of individual soot agglomerates were collected with a handheld electrostatizing sampler (EPSnano Model 100 from DASH Connector Technology Inc., Spokane, WA, USA) and further analysed with a Transmission Electron Microscopy (TEM) Jeol 2100.
The spectral albedo of natural and contaminated snow surfaces was measured using a hyperspectral spectroradiometer system (Avantes). The equipment was designed for reflectance measurements and is composed of two groups of three spectroradiometers for each a particular wavelength range: UV-VIS (300–1100 nm, AvaSpec-ULS2048CL-EVO, with resolution 2.2 nm), NIR (900–1700 nm, AvaSpec-NIR512-1.7-HSCEVO, with resolution 7.0 nm) and IR (1700–2500 nm, AvaSpec-NIR512-2.5-HSC-EVO, with resolution 5.7 nm). Two cosine-corrector optical diffusers were used at both upwelling and downwelling fiber-ends to perform radiation measurements. Each of them was connected to three spectroradiometers by means of a trifurcate fiber and a demultiplexer.
Optical fibers were supported by an extended tripod, allowing to minimize the shadows over a 1.5 m radius of snow surface area. Cosine receptors were placed 36.5 cm above the snow surface, which led to a view factor of 95%, thus guaranteeing that the analysed area was fully covered with snow. The zenith angle for each measurement was also corrected considering the inclination angle of the surface (2°) [6].
With the aforementioned installation, five acceleration stages were made, amounting to 30, 60, 90, 120, and 150 accelerations. Each acceleration lasted 10 s and was composed of a fast increase in engine speed (around 2 s) followed by a decreasing speed (around 8 s) with a peak engine speed of around 4000 rpm. Care was taken to ensure that the intensity of all accelerations was unchanged throughout the whole experiment. Snow surface albedo was measured previously to the aerosol deposition and right after each deposition stage. As shown in Figure 3, snow contamination increases after each 30-accelerations stage. In addition, for avoiding variability in the experimental measurements, the tripod with the cosine receptors was not shifted, with prevented us from taking samples for composition and grain size analysis after the intermediate acceleration stages.
Herein, as grain size we refer to as the snow particle radius. Three photographs of the snow for both clean and contaminated snow were taken on a calibrated card Figure 4 (left) and, after this, they were analyzed with ImageJ (National Institutes of Health, Bethesda, MD, USA) [19]. Twenty grain sizes were selected from each image and grain size distributions were obtained before the initial acceleration stage (259.6 ± 58.1 µm) and after the final acceleration stage (286.2 ± 81.1 µm). Intermediate values were linearly interpolated, as shown in Table 1. Figure 4 (right) shows an example of one analyzed image and the size distribution for all acceleration stages (interpolated data for each acceleration stage are shown in dashed lines). As expected, the grain size increased during the acceleration stages, mainly because the melting caused exposition to hot exhaust gas during each stage.
Snow samples of natural and contaminated snow were collected at the end of the experiment. Using plastic shovels and a cylindrical plastic shape of 15 cm diameter, samples of 5 cm of depth and 200–300 g of snow were collected, put on glass containers, and kept cold for further analysis. Instrument and glass containers were previously washed with laboratory detergent Extran® MA 05, followed by distilled water and solvent (ethanol), to avoid external contamination of the samples.
Experimental snow samples were analyzed in the laboratory and the soot concentration (mg/kg) in both natural and contaminated snow was obtained. Soot mass concentration was obtained following a filtering and weighting procedure, similar to that described by Cereceda-Balic et al. [20]. First, samples were mixed with isopropanol (in proportion 20% v/v) to avoid the adherence of particles to the glass surface. Noteworthy, it was not possible to keep samples frozen before analysis, so isopropanol was added to the same glass containers to avoid soot losses. Then, they were filtered on a system composed of 47 mm diameter nucleopore polycarbonate filters with 0.4-μm pore diameter, a cylindrical funnel, and a vacuum glass. After filtration, samples were dried at environmental temperature and weighed to estimate the total mass of particles in the samples.
The initial particle mass concentration (particles background in natural snow) was 0.65 mg/kg. This can be explained due to heavy vehicular traffic on the nearby road (although limited to 5000 vehicles per day by authorities). Therefore, for modelling the effect in the spectral snow albedo, it was assumed that the total mass corresponded to vehicular soot. To obtain a representative value for the particle mass concentration after the final artificial contamination stage, collected samples were weigh-averaged with the view factor of each sample from the cosine receptor, assuming a circularly homogeneous concentration of soot (see Figure 3). Intermediate concentrations were linearly interpolated between initial and final values, as it is shown in Table 1.
Cloudiness was evaluated based on reflectance captured from RGB sky images taken in the open hemisphere. During each albedo measurement, open hemisphere photographs were taken to estimate a proxy of cloud cover fraction of the sky. Cloud covered pixels were selected transforming photographs to greyscale and then obtaining a binary homologous based on a reflectance threshold. This threshold was defined for each image visually compared with the RGB original. Due to image plane projection, pixel contribution to total cloudiness was corrected with the sin of the zenith angle, to match with a hemispherical view. Figure 5 shows an example of an RGB image and its corresponding binarization. Cloudiness for each albedo measurement is summarized in Table 1.
Surface roughness may contribute to decrease the snow albedo. If the surface is rough, part of the scattered energy can impact again into the snow cover, thus modifying the energy absorbed or reflected [21]. For this reason, it is necessary to know the number of collisions of the incident energy with the snow cover. Photographs (like the one in Figure 6) with a graduated plate of 1 cm square side were taken. After image processing, the surface profile was obtained, and therefore, the average slope angle (radians) and the average number of reflections were calculated [22]. Given the small roughness observed in the snow surface, the number of collisions resulted very close to unity, thus resulting in a negligible effect on the modelled albedo.
The snow density was calculated from the weight and volume of snow samples. On average, the estimated value was 255 kg/m3 which is consistent with recent snow precipitation and the calculated snow grain size. Snow cover depth was measured at the end of the experiment. Five-point measurements were made around the deposition site, resulting in an average snow depth of 23.4 cm (SD = 1.67), which allowed us to assume an optically semi-infinite snowpack for modelling purposes [23]. A certain humidity content (estimated around 15%) was observed at the end of the deposition process, while no humidity was observed at the beginning. This can be explained by the heating effect caused by the exhaust flow. For intermediate stages, again a linear interpolation of the humidity values was made, as shown in Table 1.

3. Modelling

Simulations were made with OptiPar, a software developed at the University of Castilla-La Mancha [14], which contains a two-stream radiative transfer model for the determination of optical properties of soot agglomerates and ice particles, as well as snow surfaces contaminated with deposited light absorbing particles. Among the various options available in OptiPar, the following methods and parameters were selected.
For the characterization of ice particles, the refractive index proposed by Warren and Brandt [24] was used. Since grain size was around 250 µm (Table 1), i.e., larger than the radiation wavelength in the studied range, the Mie solution was employed for isolated spherical ice particles. Optical properties of snow cover were determined following the Wiscombe and Warren [23] approach, and considering an optically semi-infinite snowpack [24]. The asymmetry parameter proposed by Macke et al. [25], corrected with the Delta-Eddington approximation proposed by Joseph et al. [26] to consider multiple scattering among snow grains, was employed. Measured parameters such as the snow density, the humidity, the cloudiness, and the zenith angle were also considered. To simulate the contribution of humidity, the effective medium method proposed by Lorentz-Lorenz [27] was used for weighting the ice refractive index and the water refractive index proposed by Irvine and Pollack [28]. Finally, cloudiness was also introduced for weighing direct and diffuse radiation [29].
After snow surface characterization, soot optical properties were determined. Soot morphological parameters were obtained with a fractal analysis of particle microscopic images collected from an electrostatizing sampler, leading to a fractal dimension of 1.85 and 80 primary particles with a monomer radius of 12.5 nm constituting each agglomerate. The soot refractive index correlation proposed by Chang and Charalampopoulos [30] was used and the single scattering albedo was calculated considering the Rayleigh regime, since soot primary particle diameters (around 25 nm) are much smaller than the radiation wavelength. After that, the Rayleigh-Debye-Gans (RDG) approximation was used to account for multiple scattering using the correction proposed by Mountain and Mullholland [31], which considers the fractal dimension of the agglomerate.
Finally, the albedo of soot-contaminated snow was determined through a radiative transfer model of energy balance between the amount of energy absorbed and scattered, which considers the penetration of soot particles into the snow cover, depending on the relative sizes of both ice and soot particles.
As a means to summarize results, the broadband albedo was calculated with the spectral solar irradiance measured with the hyperspectral spectroradiometric system for each contamination stage of the snow.
For albedo comparison, two radiative models, SNICAR (Snow, Ice, and Aerosol Radiative model) [32] and TARTES (Two-streAm Radiative TransfEr in Snow model) [33] were used. The parameters listed in Table 1 were used for the determination of the snow albedo in all cases.

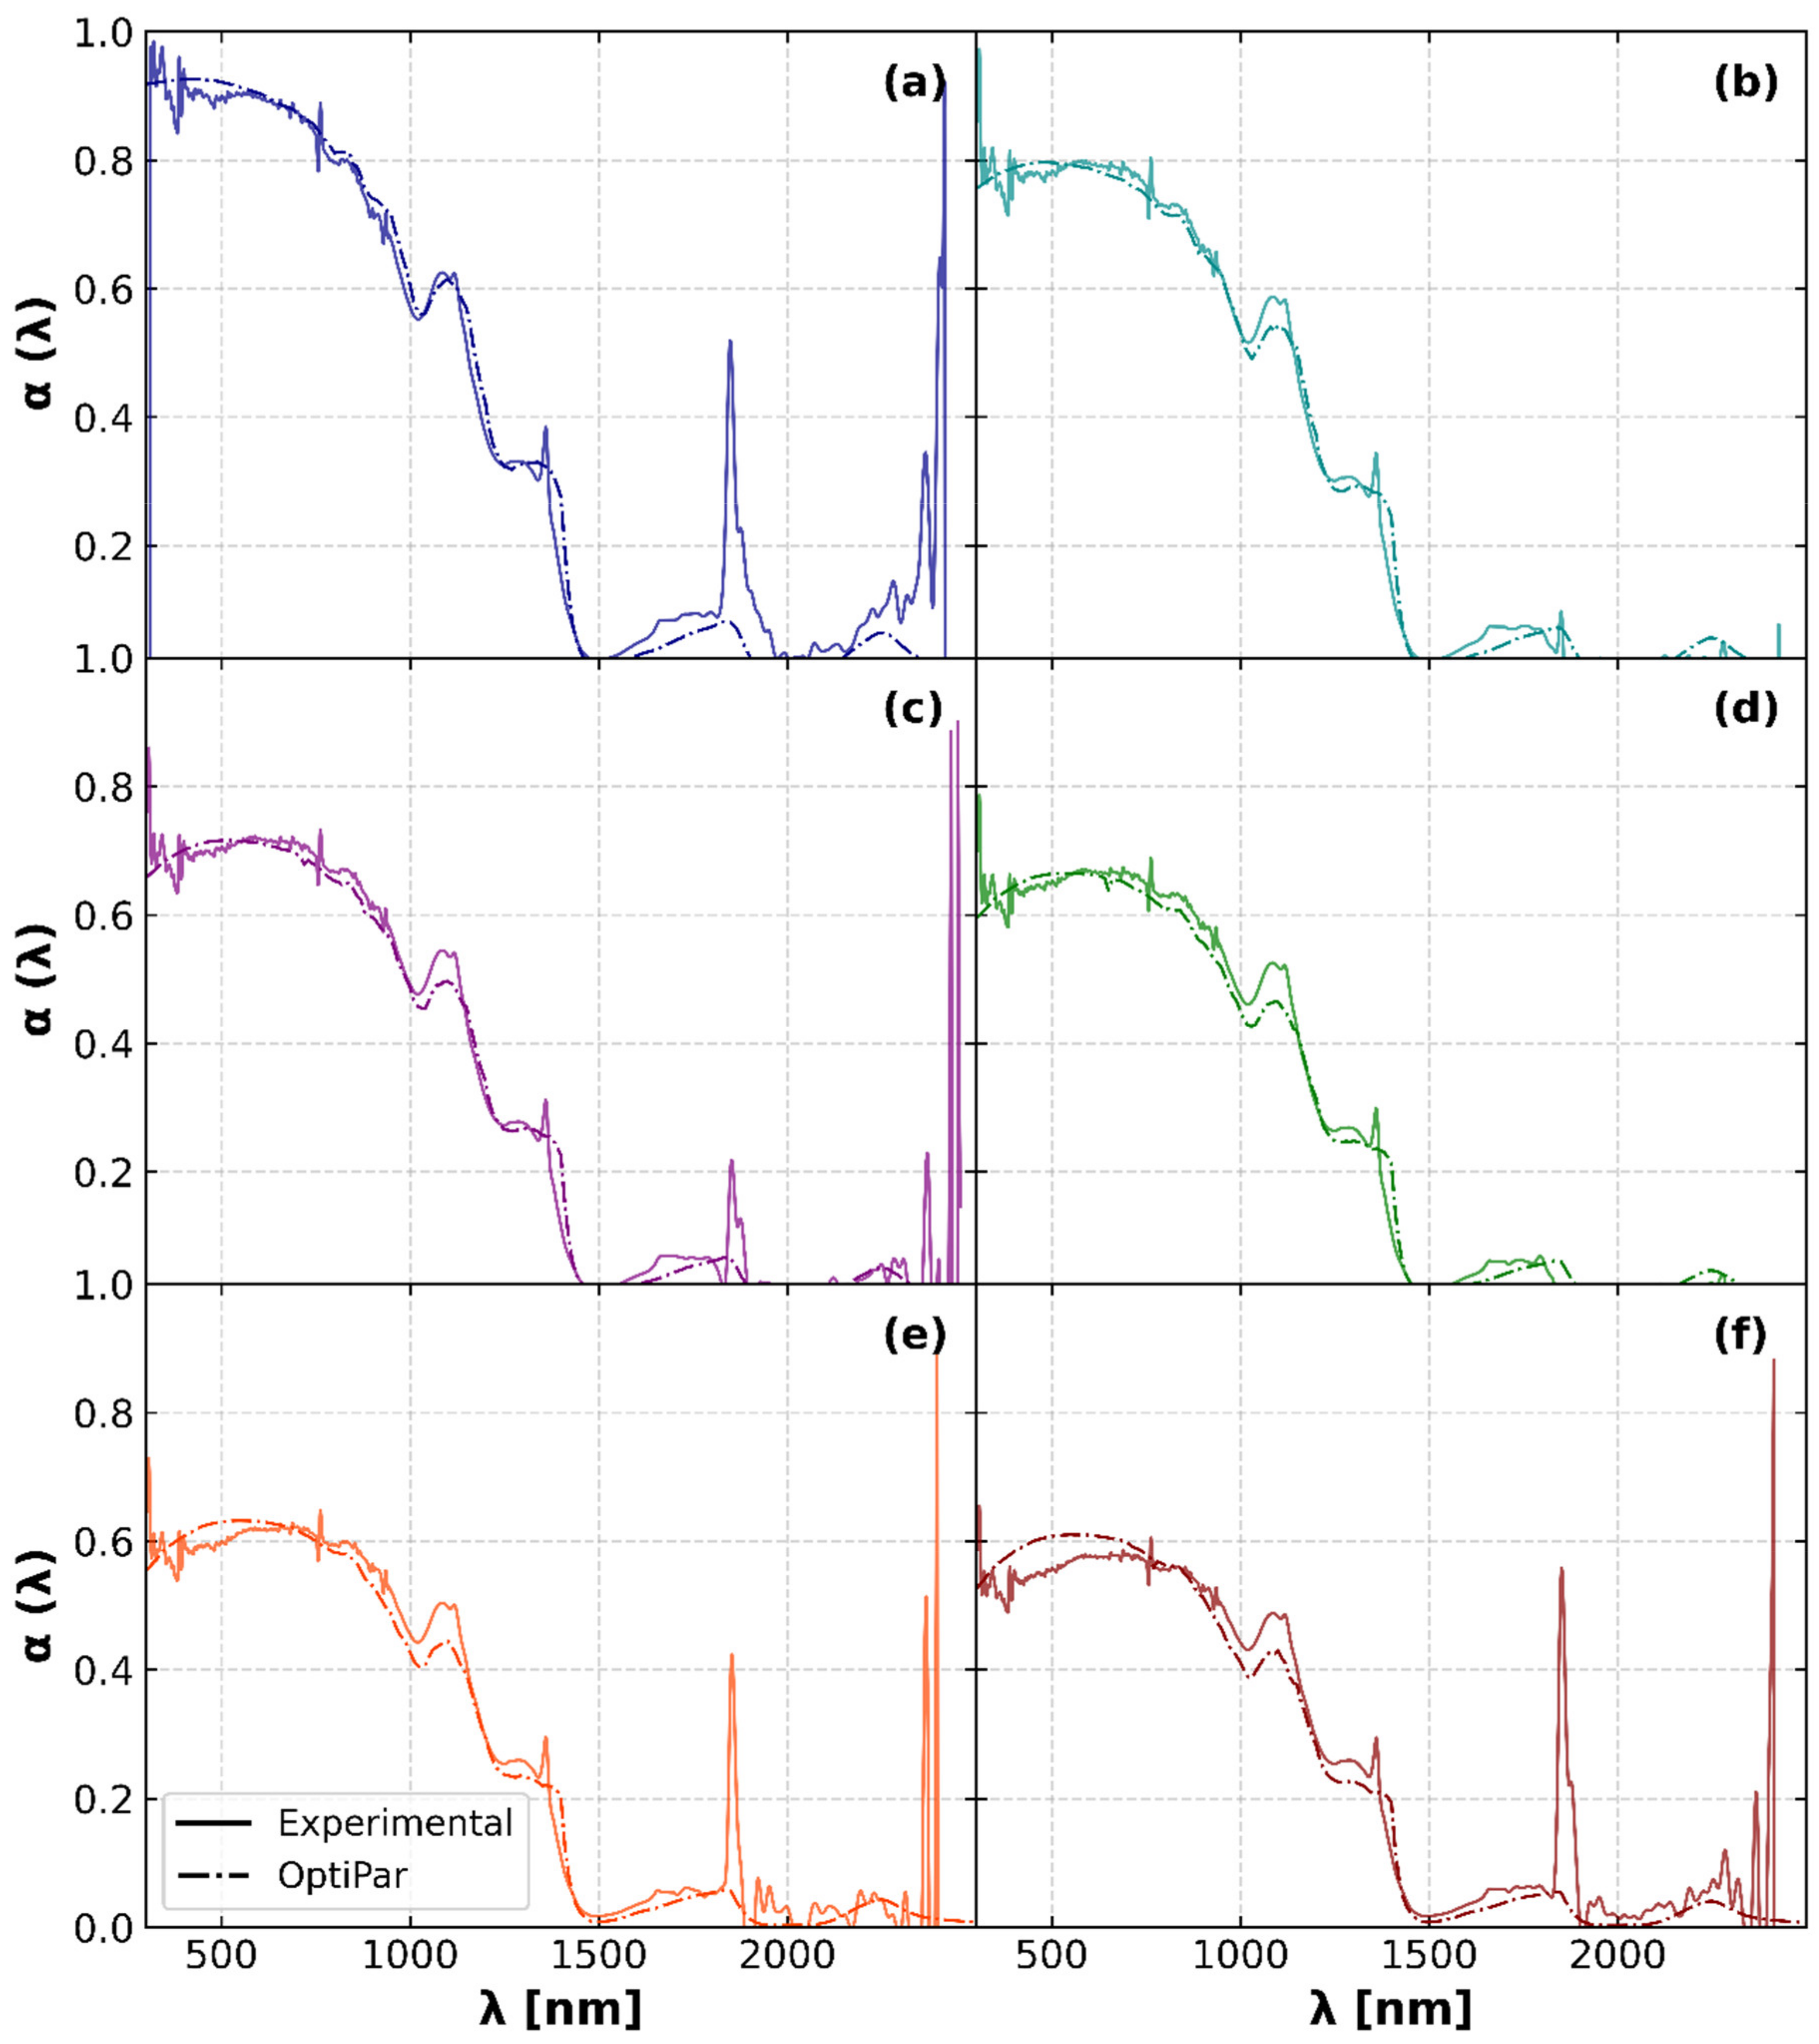
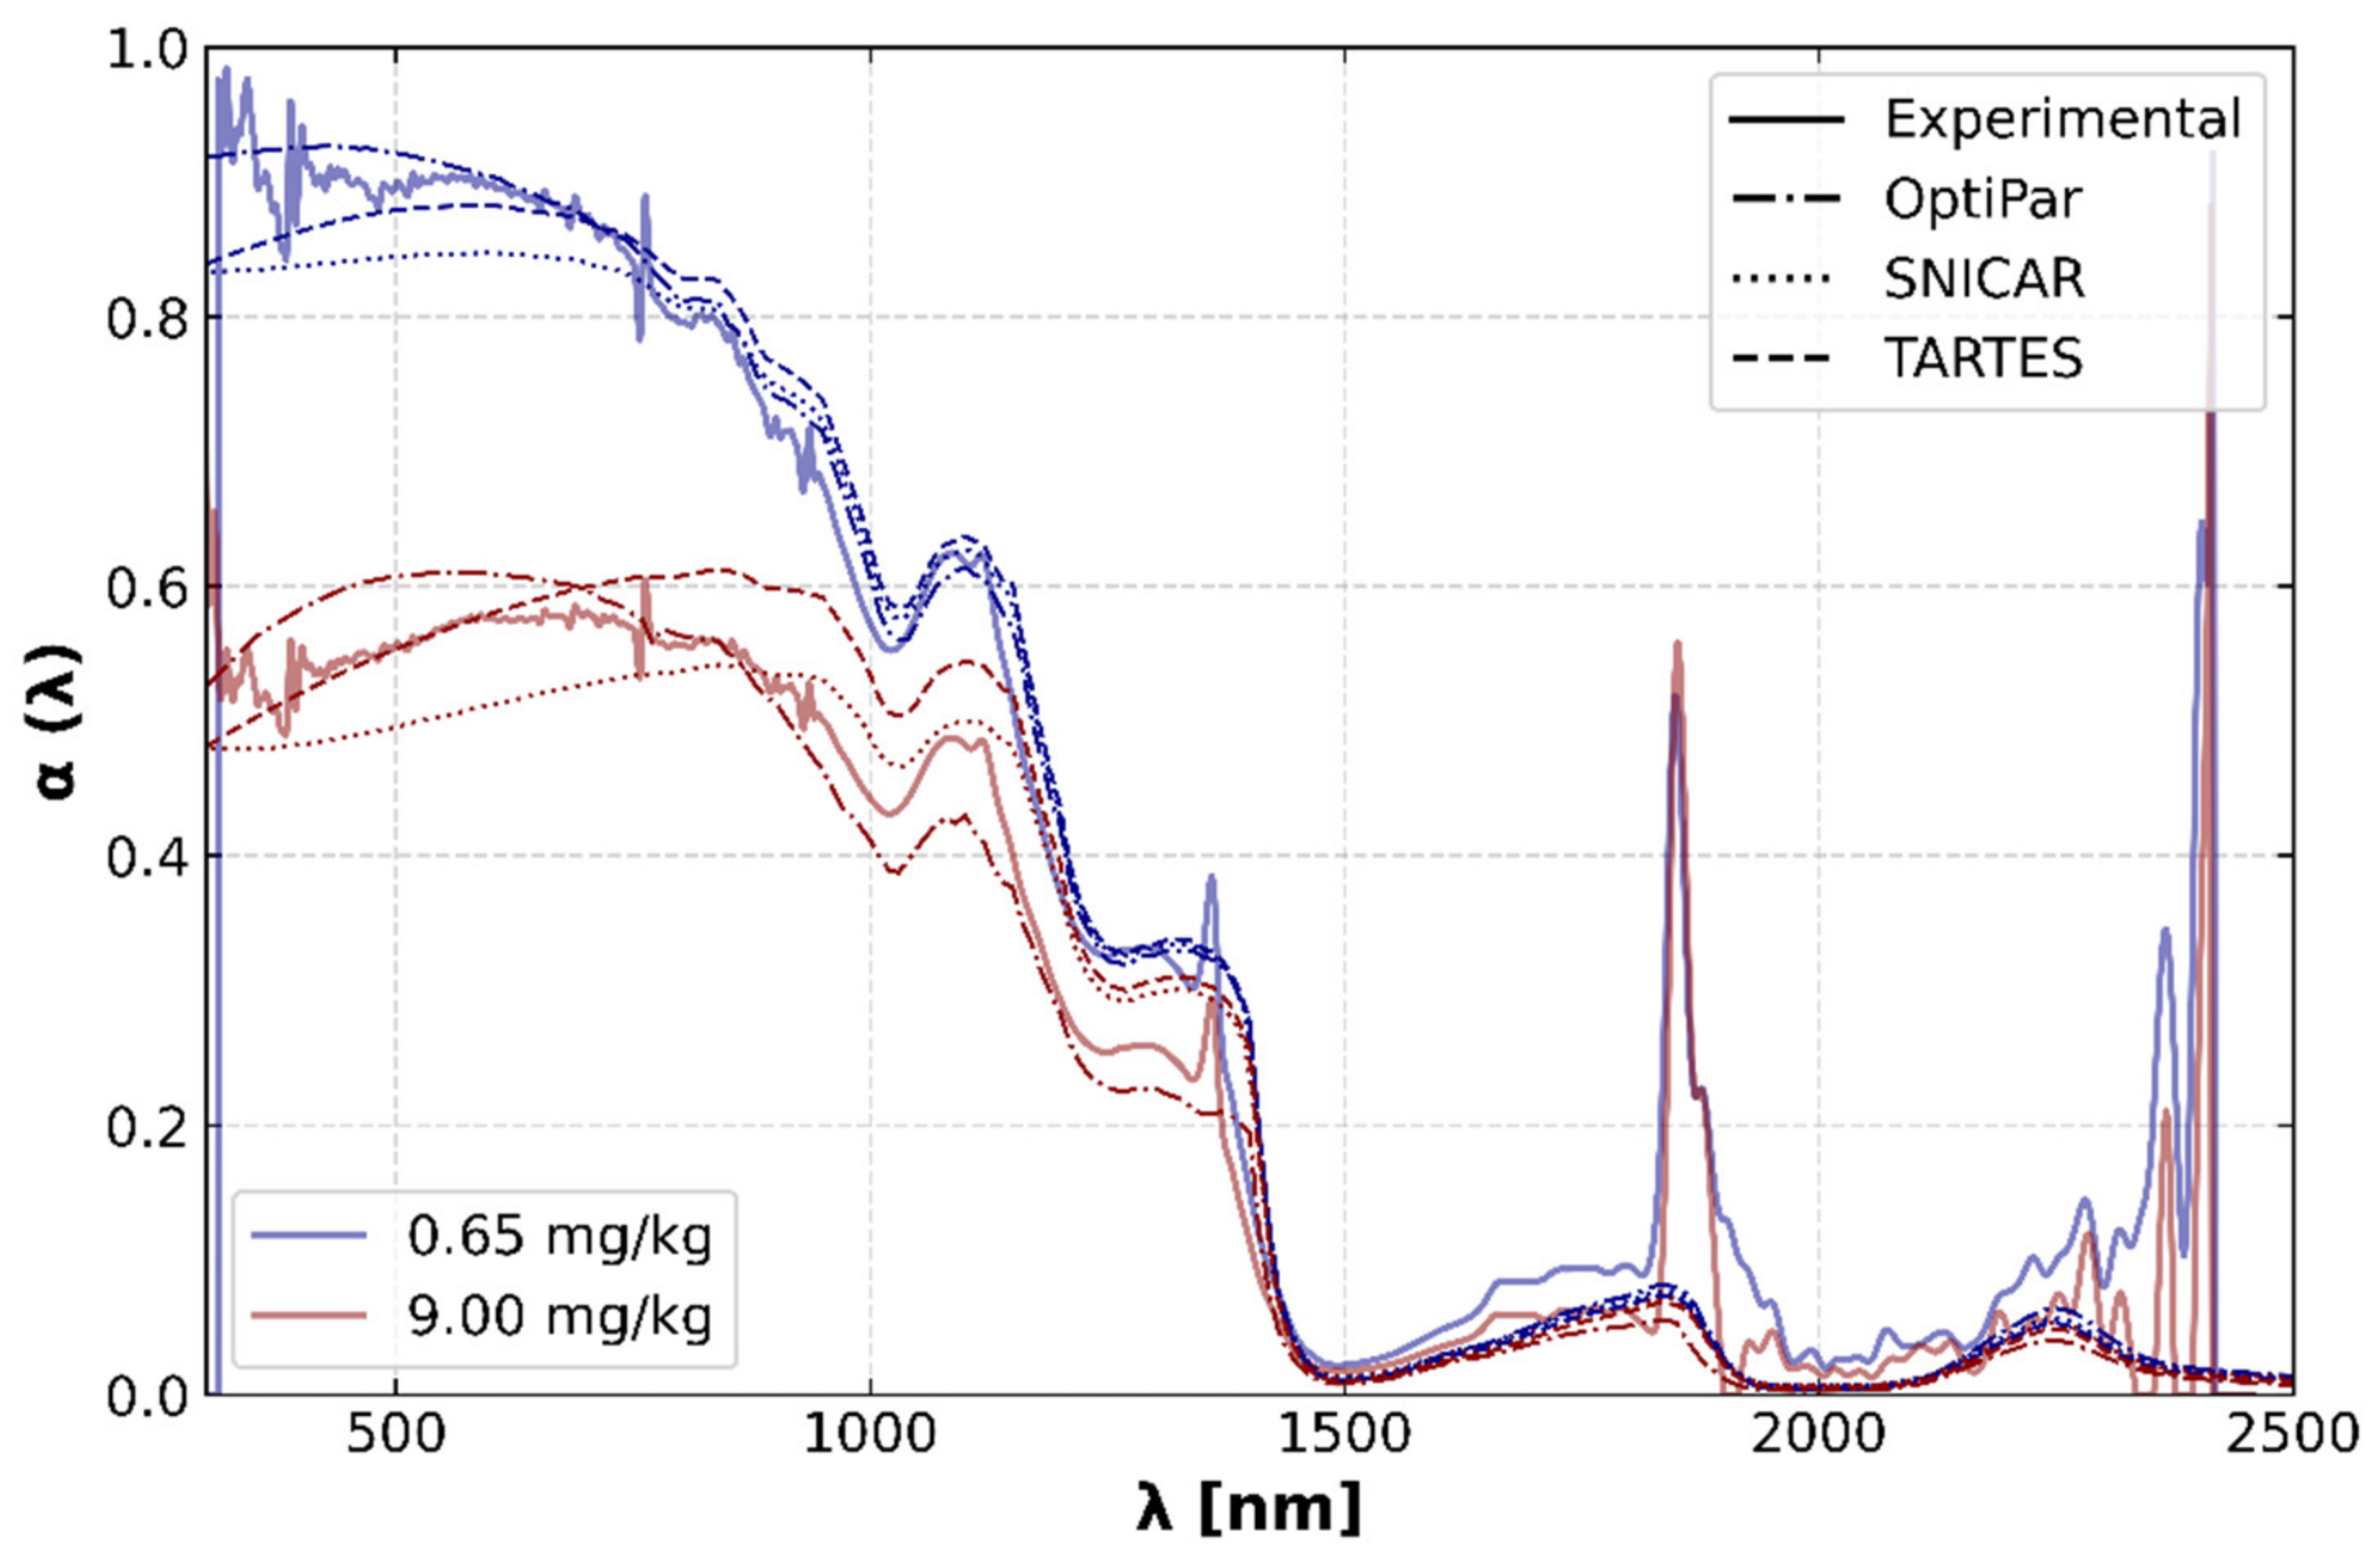
4. Results and Discussion

Figure 7 shows snow spectral albedo results from the artificial deposition stage as a function of soot mass concentration in the snow. Spectral albedo measurements show an unusual variability over 1500 nm. Between 1800 nm to 1950 nm approximately, such variability is due to the water vapor and CO2 absorption bands, which lead to a poor irradiance intensity. Above 2200 nm, the spectroradiometer calibration is not enough precise because it was done using halogen lamps, which provide weak irradiance intensity at this wavelength range.
Albedo reductions are highest near to UV and VIS wavelength range. Between 350 to 400 nm, albedo reductions of around 40% with respect to snow are measured before a deposition can be observed. At longer wavelengths, albedo reductions are lower (23% at 1000 nm), and they become even lower for longer wavelengths.
Noteworthy, grain size increase measured during the campaign is also reflected in an albedo reduction on NIR (wavelength usually correlated with grain size grown). Similar behaviours have been documented for artificial deposition experiments when in situ aerosol production was done [34].
In Figure 7, measured values for five accelerations are compared with those obtained with OptiPar software. As expected, snow albedo decreases as the number of accelerations increases, and therefore, as the amount of soot deposited increases. Results show a better agreement at low soot mass concentration and, as it increases, OptiPar does not reproduce the experimental results exactly. In the UV-VIS range, OptiPar slightly overestimates snow surface reflection but, on the contrary, in the NIR range, it slightly underestimates.
In Figure 8, experimental and modelled results for the initial and the final concentration (0.6 and 9.0 mg/kg) are shown. Experimental and OptiPar results fit reasonably well in comparison with SNICAR and TARTES results. These models do not consider soot morphology which causes differences with the experimental results in the visible range, as a major effect. For SNICAR and TARTES simulations of spherical snow grains were used. Other grain shapes were also simulated, but no improvement in the agreement was achieved.
In addition, to better appreciate the reduction of snow albedo with soot contamination and as a summary of the results, the broadband albedo was determined with each model, as shown in Figure 9. The models adequately reproduce the overall behaviour of decreasing albedo with progressively increasing soot concentration in the snow. The OptiPar results match the experimental results reasonably well, while SNICAR broadband albedo results are somewhat lower. Noteworthy, no variables have been modified between different models, and similar snow properties were used in all of them (e.g., spherical grain shape).
An approximately constant decrease rate of around 0.03 units of snow broadband albedo per mg/kg of deposited soot was observed throughout whole experiment, with a slightly higher decrease rate at the initial stage (from clean snow) of 0.05. However, such a decrease rate should be partially attributed to the increase in snow grain size, since both effects cannot be separated in this experiment. Nevertheless, this decrease rate is similar (0.031) to that observed in [35] in Northern China, although it is lower than that estimated in Los Andes [13] and higher than that observed in North America and in the Arctic [35].

5. Conclusions

The in-situ soot deposition method using the conical diffuser allows control of the measurement area in the field and avoids effects associated with weather conditions such as wind. The previous morphological characterization of the soot agglomerates emitted from the vehicle (fractal dimension, prefactor, and number and diameter of primary particles) is essential to achieve an adequate agreement between the experimental data in the field and the modelled results.
Both experimental and modelled results show that increasingly accumulated soot mass leads to significant reductions in the snow albedo. These reductions are highest in the UV and VIS wavelength range. Especially, in the range between 350 to 400 nm, albedo reductions reached around 40% with respect to snow measured before deposition, while at 1000 nm, reductions were only around 23%, and they become very minor from 1500 nm onwards. When this effect is analysed in terms of broadband albedo, an approximately constant decrease rate of around 0.03 units per mg/kg was observed, although it should be partially attributed to the increase in snow grain size.
The flexibility of the OptiPar model, which integrates the morphological description of soot agglomerates, together with a variety of methods to determine their optical properties, allows for an accurate prediction of the spectral albedo of snow when it is contaminated with different concentrations of this pollutant.

Author Contributions

Conceptualization, M.L. and F.C.-B.; Resources, M.L., X.F.-R. and L.C.; Investigation, D.G.-D., D.P.-F. and S.G.-C.; Data curation, D.G.-D., D.P.-F. and S.G.-C.; Methodology, F.C.-B., D.G.-D., R.P.F. and R.B.; Supervision, R.B., L.C., X.F.-R. and M.L.; Writing—original draft, S.G.-C. and D.P.-F.; Writing—review & editing, R.B., F.C.-B. and M.L. All authors have read and agreed to the published version of the manuscript.

Funding

This study was funded by the Spanish Ministry of Science, Innovation and Universities under the Rad-Soot project (ref. PID2019–109767RB-I00), and by Chilean projects ANID-FONDEF ID19I10359, ANID-ANILLO ACT210021, ANID-FONDECYT Regular 1221526, and ANID-FONDECYT Iniciación 11220525 and 11220482. The spectroradiometric system was funded by the Spanish Ministry of Science and Innovation with the Acquisition of Scientific-Technique Equipment 2019 grant (ref. EQC2019-006105-P).

Institutional Review Board Statement

Not applicable.

Informed Consent Statement

Not applicable.

Conflicts of Interest

The authors declare no conflict of interest.

References

  1. Bond, T.C.; Doherty, S.J.; Fahey, D.W.; Forster, P.M.; Berntsen, T.; DeAngelo, B.J.; Flanner, M.G.; Ghan, S.; Kärcher, B.; Koch, D.; et al. Bounding the role of black carbon in the climate system: A scientific assessment. J. Geophys. Res. Atmos. 2013, 118, 5380–5552. [Google Scholar] [CrossRef]
  2. Jacobi, H.V.; Lim, S.; Ménégoz, M.; Ginot, P.; Laj, P.; Bonasoni, P.; Stocchi, P.; Marinoni, A.; Arnaud, Y. Black carbon in snow in the upper Himalayan Khumbu Valley, Nepal: Observations and modelling of the impact on the snow albedo, melting and radiative forcing. Cryosphere 2015, 9, 1685–1699. [Google Scholar] [CrossRef] [Green Version]
  3. Ganot, P.; Dumont, M.; Lim, S.; Patris, N.; Taupin, J.D.; Wagnon, P.; Gilbert, A.; Arnaud, Y.; Marinoni, A.; Bonasoni, P.; et al. A 10 year record of black carbon and dust from a Mera Peak ice core (Nepal): Variability and potential impact on melting of Himalayan glaciers. Cryosphere 2015, 9, 1685–1699. [Google Scholar] [CrossRef] [Green Version]
  4. Sterle, K.M.; McConnell, J.R.; Dozier, J.; Edwards, R.; Flanner, M.G. Retention and radiative forcing of black carbon in Eastern Sierra Nevada Snow. Cryosphere 2013, 7, 365–374. [Google Scholar] [CrossRef] [Green Version]
  5. Aoki, T.; Kuchiki, K.; Niwano, M.; Kodama, Y.; Hosaka, M.; Tanaka, T. Physically based snow albedo model for calculating broadband albedos and the solar heating profile in snowpack for general circulation models. J. Geophys. Res. 2011, 116, D11114. [Google Scholar] [CrossRef]
  6. Dumont, M.; Arnaud, L.; Picard, G.; Libois, Q.; Lejeune, Y.; Nabat, P.; Voisin, P.; Morin, S. In situ continuous visible and near-infrared spectroscopy of an alpine snowpack. Cryosphere 2017, 11, 1091–1110. [Google Scholar] [CrossRef] [Green Version]
  7. Cereceda-Balic, F.; Vidal, V.; Ruggeri, M.F.; González, H.E. Black carbon pollution in snow and its impact on albedo near the Chilean stations on the Antarctic peninsula: First results. Sci. Total Environ. 2020, 743, 140801. [Google Scholar] [CrossRef]
  8. Brandt, R.E.; Warren, S.G.; Clarke, A.D. A controlled snowmaking experiment testing the relation between black carbon content and reduction of snow albedo. J. Geophys. Res. 2011, 116, D08109. [Google Scholar] [CrossRef] [Green Version]
  9. Hadley, O.L.; Kirchstetter, T.W. Black-carbon reduction of snow albedo. Nat. Clim. Chang. 2012, 2, 437–440. [Google Scholar] [CrossRef]
  10. Lapuerta, M.; Ballesteros, R.; Martos, F. The effect of diesel engine conditions on the size and morphology of soot particles. Int. J. Veh. Des. 2009, 50, 91–106. [Google Scholar] [CrossRef]
  11. Zhu, C.S.; Qu, Y.; Zhou, Y.; Huang, H.; Liu, H.K.; Yang, L.; Wang, Q.Y.; Hansen, A.D.A.; Cao, J.J. High light absorption and radiative forcing contributions of primary brown carbon and black carbon to urban aerosol. Gondwana Res. 2021, 90, 159–164. [Google Scholar] [CrossRef]
  12. Cereceda-Balic, F.; Vidal, V.; Moosmüller, H.; Lapuerta, M. Reduction of snow albedo from vehicle emissions at Portillo, Chile. Cold Reg. Sci. Technol. 2018, 146, 43–52. [Google Scholar] [CrossRef]
  13. Beres, N.D.; Moosmüller, H. Snow surface albedo sensitivity to black carbon: Radiative transfer modelling. Atmosphere 2020, 11, 1077. [Google Scholar] [CrossRef]
  14. Lapuerta, M.; González-Correa, S.; Ballesteros, R.; Cereceda-Balic, F.; Moosmüller, H. Albedo reduction for snow surfaces contaminated with soot aerosols: Comparison of experimental results and models. Aerosol. Sci. Technol. under review.
  15. Palma, P.; Oliva, M.; García-Hernández, C.; Gómez Ortiz, A.; Ruiz-Fernández, J.; Salvador-Franch, F.; Catarineuc, M. Spatial characterization of glacial and periglacial landforms in the highlands of Sierra Nevada (Spain). Sci. Total Environ. 2017, 584–585, 1256–1267. [Google Scholar] [CrossRef]
  16. Meteoblue. Available online: https://www.meteoblue.com/es/tiempo/historyclimate/weatherarchive/estaci%c3%b3n-de-esqu%c3%ad-de-sierra-nevada_espa%c3%b1a_7602397?fcstlength=1m&year=2022&month=3 (accessed on 6 April 2022).
  17. Donoso, D.; García, D.; Ballesteros, R.; Lapuerta, M.; Canoira, L. Hydrogenated or oxyfunctionalized turpentine: Options for automotive fuel components. RSC Adv. 2021, 11, 18342–18350. [Google Scholar] [CrossRef]
  18. Calle-Asensio, A.; Hernández, J.J.; Rodríguez-Fernández, J.; Lapuerta, M.; Ramos, A.; Barba, J. Effect of advanced biofuels on WLTC emissions of a Euro 6 diesel vehicle with SCR under different climatic conditions. Int. J. Engine Res. 2021, 22, 3433–3446. [Google Scholar] [CrossRef]
  19. Schneider, C.A.; Rasband, W.S.; Eliceiri, K.W. NIH Image to ImageJ: 25 years of image analysis. Nat. Methods 2019, 9, 671–675. [Google Scholar] [CrossRef]
  20. Cereceda-Balic, F.; Gorena, T.; Soto, C.; Vidal, V.; Lapuerta, M.; Moosmüller, H. Optical determination of black carbon mass concentrations in snow samples: A new analytical method. Sci. Total Environ. 2019, 697, 133934. [Google Scholar] [CrossRef]
  21. Larue, F.; Picard, G.; Arnaud, L.; Ollivier, I.; Delcourt, C.; Lamare, M.; Tuzet, F.; Revuelto, J.; Dumont, M. Snow albedo sensitivity to macroscopic surface roughness using a new ray-tracing model. Cryosphere 2020, 14, 1651–1672. [Google Scholar] [CrossRef]
  22. Manninen, T.; Anttila, K.; Jääskeläinen, E.; Riihelä, A.; Peltoniemi, J.; Räisänen, P.; Lahtinen, P.; Siljamo, N.; Thölix, L.; Meinander, O.; et al. Effect of small-scale snow surface roughness on snow albedo and reflectance. Cryosphere 2021, 15, 793–820. [Google Scholar] [CrossRef]
  23. Wiscombe, S.G.; Warren, W.J. A model for the spectral albedo of snow. I: Pure snow. J. Atmos. Sci. 1980, 37, 2712–2733. [Google Scholar] [CrossRef] [Green Version]
  24. Warren, S.G.; Brandt, R.E. Optical constants of ice from the ultraviolet to the microwave: A revised compilation. J. Geophys. Res. Atmos. 2008, 113, 1–10. [Google Scholar] [CrossRef]
  25. Macke, A.; Mueller, J.; Raschke, E. Single scattering properties of atmospheric ice crystals. J. Atmos. Sci. 1996, 53, 2813–2825. [Google Scholar] [CrossRef] [Green Version]
  26. Joseph, W.J.; Wiscombe, J.H.; Weinman, J.A. The Delta-Eddington approximation for radiative flux transfer. J. Atmos. Sci. 1976, 33, 2452–2459. [Google Scholar] [CrossRef]
  27. Lorentz, H.A. Versuch Einer Theorie Der Electrischen und Optischen Erscheinungen in Bewegten Körpern; Collected Papers; Springer: Dordrecht, The Netherlands, 1937; Volume V, pp. 1–138. [Google Scholar]
  28. Irvine, W.M.; Pollack, J.B. Infrared optical properties of water and ice spheres. Icarus 1968, 8, 324–360. [Google Scholar] [CrossRef]
  29. Bird, R.E.; Riordan, C. Simple solar spectral model for direct and diffuse irradiance on horizontal and tilted planes at the Earth’s surface for cloudless atmospheres. J. Appl. Meteorol. Climatol. 1986, 25, 87–97. [Google Scholar] [CrossRef] [Green Version]
  30. Chang, H.; Charalampopoulos, T.T. Determination of the wavelength dependence of refractive indices of flame soot. Proc. R. Soc. Lond. Ser. A Math. Phys. Sci. 1990, 430, 577–591. [Google Scholar] [CrossRef]
  31. Mountain, R.D.; Mulholland, G.W. Light scattering from simulated smoke agglomerates. Langmuir 1988, 4, 1321–1326. [Google Scholar] [CrossRef]
  32. Flanner, M.G.; Arnheim, J.B.; Cook, J.M.; Dang, C.; He, C.; Huang, X.; Singh, D.; Skiles, S.M.; Whicker, C.A.; Zender, C.S. SNICAR-ADv3: A community tool for modeling spectral snow albedo. Geosci. Model Dev. 2021, 14, 7673–7704. [Google Scholar] [CrossRef]
  33. SnowTARTES. Available online: https://snowtartes.pythonanywhere.com/ (accessed on 7 April 2022).
  34. Beres, N.D.; Sengupta, D.; Samburova, V.; Khlystov, A.Y.; Moosmüller, H. Deposition of brown carbon onto snow: Changes in snow optical and radiative properties. Atmos. Chem. Phys. 2020, 20, 6095–6114. [Google Scholar] [CrossRef]
  35. Dang, C.; Warren, S.G.; Fu, Q.; Doherty, S.J.; Sturm, M.; Su, J. Measurements of light-absorbing particles in snow across the Arctic, North America, and China: Effects on surface albedo. J. Geophys. Res. Atmos. 2017, 122, 10149–10168. [Google Scholar] [CrossRef]
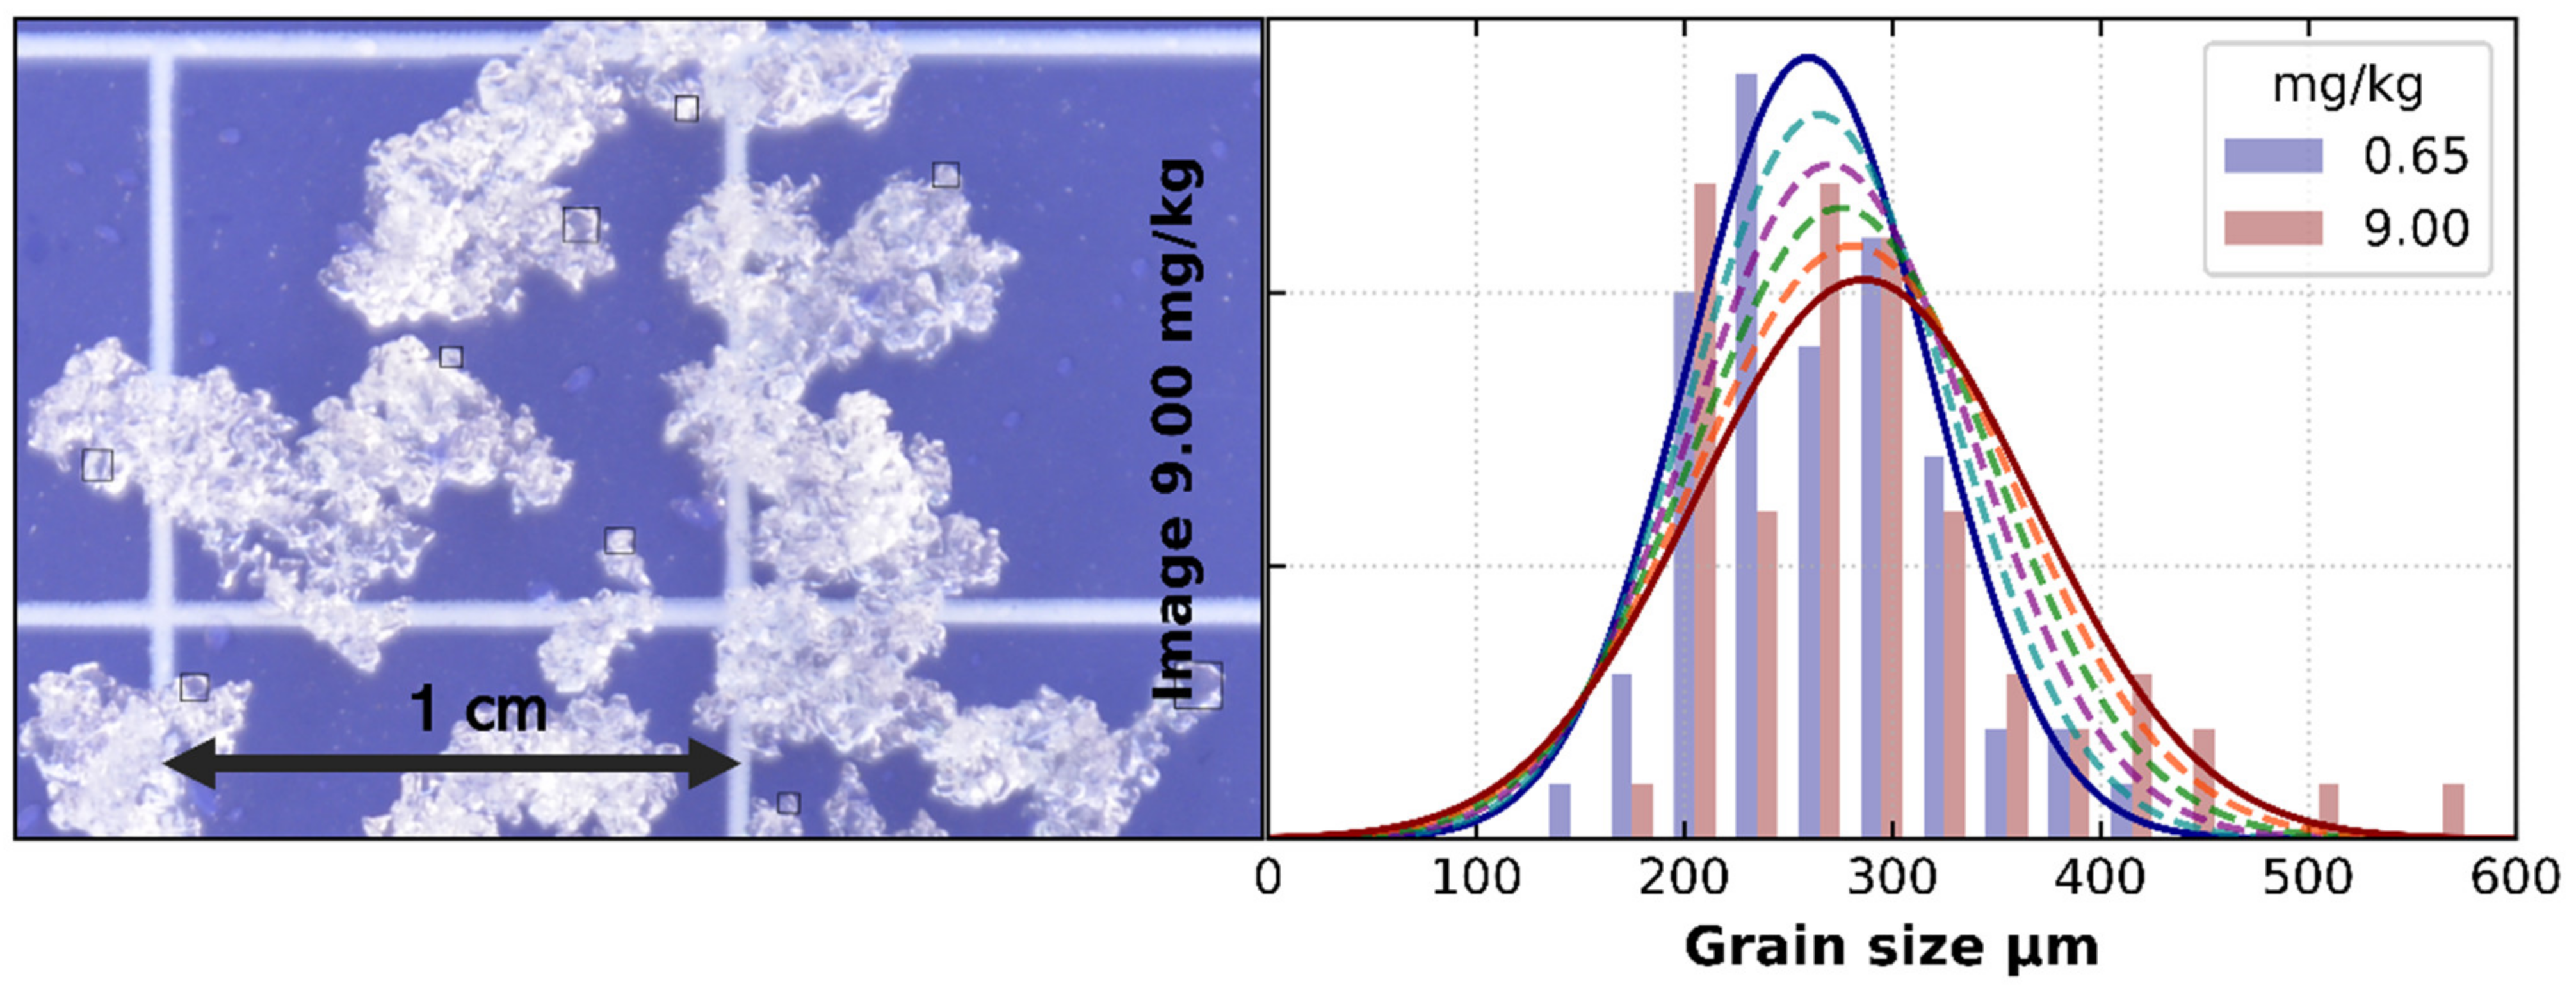
Figure 1. Location of the experimental site (left) and south view from the site (right).
Atmosphere 13 00801 g001
Figure 2. Scheme of the artificial contamination procedure.
Atmosphere 13 00801 g002
Figure 3. Snow contamination after each acceleration stage: (a) 0, (b) 30, (c) 60, (d) 90, (e) 120, and (f) 150 accelerations.
Atmosphere 13 00801 g003
Figure 4. Example of an analyzed image on the calibrated card, including squares to illustrate the sizing of snow grains (left), and snow grain size distributions during each acceleration stage (right).
Atmosphere 13 00801 g004
Figure 5. Example of (a) RGB image, (b) the grey image and (c) its binarization (corresponding to the initial stage). Estimated cloud fraction resulted in 24%.
Atmosphere 13 00801 g005
Figure 6. Image of the snow surface roughness.
Atmosphere 13 00801 g006
Figure 7. Experimental (continuous lines) and OptiPar modelled (dashed lines) albedo (α) results for snow surface contaminated with (a) 0.65, (b) 2.32, (c) 3.99, (d) 5.66, (e) 7.33, and (f) 9.00 mg/kg of soot.
Atmosphere 13 00801 g007
Figure 8. Comparison of experimental with modelled albedo (with OptiPar, SNICAR and TARTES) for 0.65 and 9.0 mg/kg soot. For SNICAR and TARTES simulations of spherical snow grains were used.
Atmosphere 13 00801 g008
Figure 9. Experimental and modelled broadband albedo ( α b r d ).
Atmosphere 13 00801 g009
Table 1. Parameters for snow contamination characterisation.
AccelerationsCenith Angle (°)Cloudiness (%)Grain Size (µm)mg/kgHumidity (%)
051.324.0259.6 ± 58.10.650
3051.921.0264.9 ± 62.7 *2.32 *3 *
6052.418.1270.2 ± 67.3 *3.99 *6 *
9052.741.9275.6 ± 71.9 *5.66 *9 *
12052.854.9280.9 ± 76.5 *7.33 *12 *
15052.963.9286.2 ± 81.19.0015
* Interpolated values between the initial state (before the first contamination stage) and final state (after the final contamination stage).
Publisher’s Note: MDPI stays neutral with regard to jurisdictional claims in published maps and institutional affiliations.

