Article

Can the Correlation between Radar and Cloud-to-Ground Daily Fields Help to Identify the Different Rainfall Regimes? The Case of Catalonia

1
Siemens Gamesa Renewable Energy, C/Ramírez de Arellano 37, 28043 Madrid, Spain
2
Servei Meteorològic de Catalunya, C/Berlin, 38, 08023 Barcelona, Spain
*
Author to whom correspondence should be addressed.
These authors contributed equally to this work.
Submission received: 12 April 2022 / Revised: 7 May 2022 / Accepted: 10 May 2022 / Published: 16 May 2022
(This article belongs to the Special Issue Drought and Precipitation Extremes)

Abstract

:
The rainfall regime is changing in the Catalan territory, likely in most areas in the Mediterranean Basin. This variability, spatial and temporal, means that there may be periods of severe drought combined with periods of heavy rainfall and floods. In this way, the management of water resources is complicated and can produce a high impact on different social aspects. The high convective activity leads to investigating the relationship between the electric discharges and radar parameters (reflectivity, echo top, vertically integrated liquid, and accumulated rainfall). The correlation allows identifying some elements that may be significant in terms of changes in rainfall regimes. Besides, using several radar parameters apart from precipitation accumulation reveals interesting explicit patterns of the previously known. These patterns can help better understand the precipitation behavior and the changes associated with it.

1. Introduction

The Mediterranean Basin is known for the extreme variability of its rainfall regime, both in space and time ([1,2,3,4]). This variability implies long dry periods combined with very wet ones, leading to alternate droughts and floods. In consequence, the management of the water requires a great effort in these regions, from economic and engineering points of view. In the same way, referencess [5,6] showed that nearly 90% of the total precipitation has a convective regime in Catalonia (NE of the Iberian Peninsula). According to Doswell et al. [7], convective nature clouds cause the majority of the flood events. Then, the link between precipitation and floods in Catalonia is clear. Besides, reference [8] showed how long dry epochs are usual after wet periods in the region. Finally, the expected future changes ([9]) will cause higher impacts on water management ([10]).
There are two methods of comparing lightning and radar data. The first one considers a set of severe or non-severe thunderstorms, searching for relationships during their life cycle ([11,12]). In general, the analyses are focused only on particular events, considering some different radar parameters, such as the surface reflectivity, the echo top for a certain reflectivity threshold, the Quantitative Precipitation Estimation (QPE) ([13,14]), or the Vertically Integrated Liquid (VIL) ([15]). Other studies are centered on the relationship in mesoscale convective systems ([16]) or in contrast to lightning activity in thunderstorms over land and sea surfaces ([17]).
The second methodology compares QPE from the weather radar with lightning flashes. Although Cloud-to-Ground (CG) flashes data are readily available and commonly utilized (as within this study), Intra-Cloud (IC) or Total Lightning (TL) data are more likely to produce better correlations between flash rates and storm characteristics ([18]). This methodology searches for an equation that provides the relationship between electrical activity and precipitation in a limited region, for different areas of China ([19]), the Western Mediterranean ([20]), tropical islands ([21]), or different regions of France (cheze1997area). Finally, we wanted to focus on the analysis of [22], who presented the relationship between CG lightning and surface precipitation during the warm season in six different regions (each one of the orders of 10,000 km2 in the south-central United States. The results show that this relationship between the two elements is highly variable, with values of the r2 coefficient ranging from 0.121 to 0.601.
The two methodologies introduced previously are helpful for the analysis of concrete situations but are very limited in many others. They both have limitations for real-time applications in regions such as Catalonia. For instance, the tracking of thunderstorms is only applicable in isolated cases. On the contrary, the relationship between the QPE radar and the lightning data presents many limitations in comparing distinct rainfall behaviors. These limitations derive from the lack of not considering the vertical development of the rainfall producing clouds. As shown before, this is a very significant factor at the time of understanding the phenomena recorded. A clear relationship between the regimes and the seasonal component also exists. In this sense, it is possible to find anomalous cases in each season or two or more types coexisting in a short period. To sum up, operational meteorological tasks need to know if a procedure recognizes the previous days as standard or, on the contrary, if it has had a different regime to the expected. However, none of the techniques can perform that requirement.
Reference [23] presented research showing the large variability in the radar parameters (reflectivity, precipitation estimation, top of the clouds, or vertically integrated liquid (VIL)) and the lightning activity in the Central Coast of Catalonia for a period of 15 years. The analysis also revealed the high differences in the correlation of both fields over the different years. The objective of this study was the new development and testing of a new real-time product. The product has the purpose of classifying the different convective regimes. As has been indicated before, these regimes are predominant in the region. It has examined remote sensing data, combining elements of the two types of methodologies presented previously. The technique starts generating annual curves of correlation between different radar products and CG maps. A final index integrated the various correlations. Then, the definitive correlation index series allows finding the thresholds that indicate the behavior for each type of convective precipitation. These indices were compared with a new version of the beta parameter, generated using exclusively remote sensing data. Finally, the lightning jump warnings have been used to validate the capability of both methodologies for detecting the more convective episodes. The article has the following points: first, the presentation of the study area and the data used; the next section introduces the methodology for obtaining the correlation values and thresholds for discriminating the different categories and, also, the new version of the beta parameter. Then, we present and discuss the results, leading to the final section, the conclusions.

2. Materials and Methods
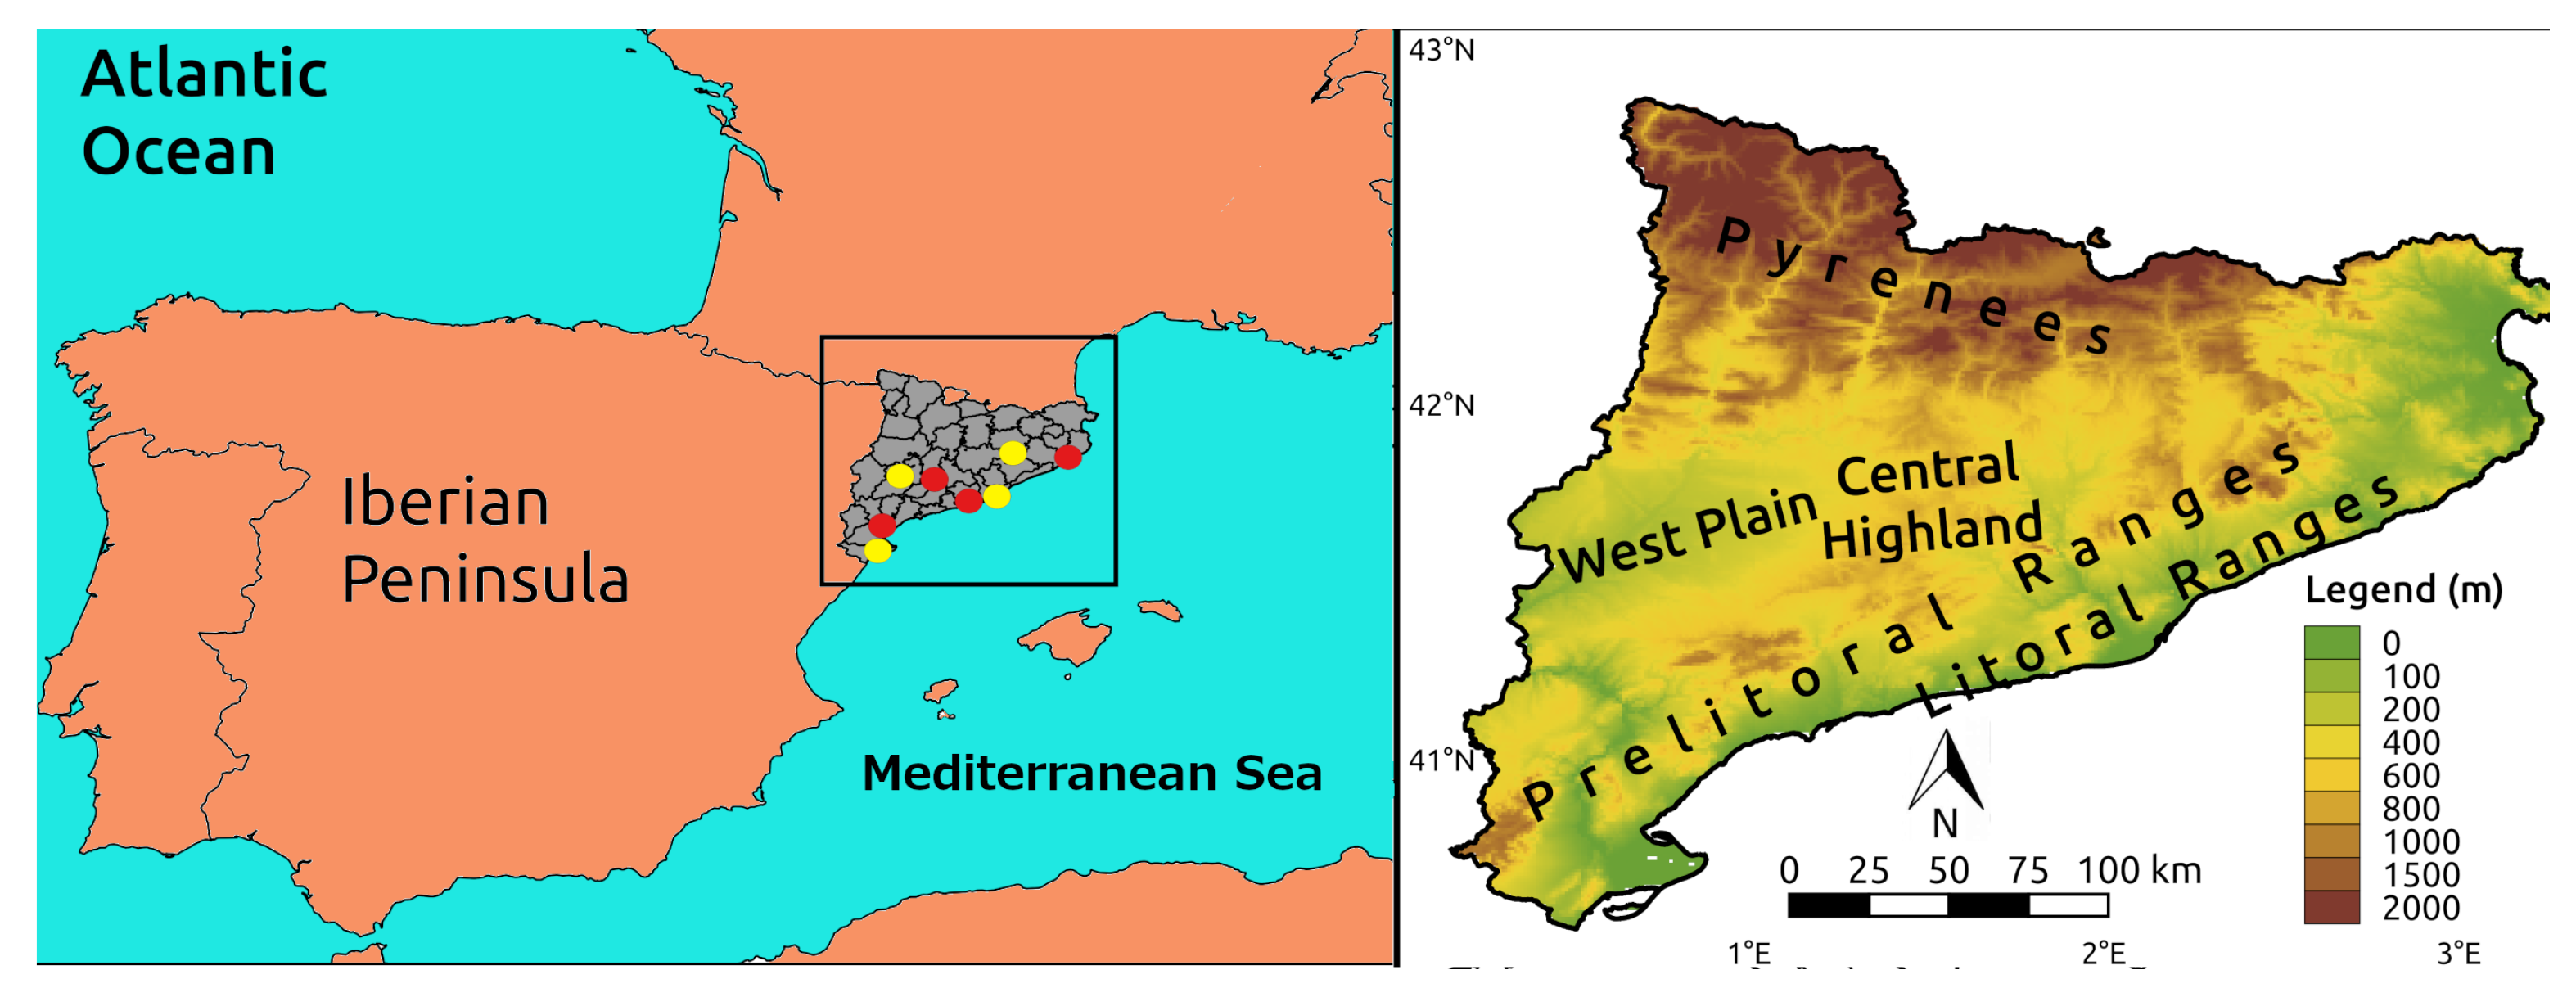
2.1. Area of Study

Catalonia (NE of the Iberian Peninsula, see Figure 1) has different geographical factors that characterize the topography. First, the Mediterranean Sea bathes its shores, modulating notably the convective development and the electrical nature of thunderstorms ([20,24]). Besides, the Pyrenees, with peaks over 3000 m, joined to other smaller ranges (heights that move between 500 and 2000 m), contribute to the triggering of convection because of their steeped slopes. Besides, they also affect the thunderstorms trajectories ([25,26,27]). Finally, the Ebro Valley is a plateau that connects Catalonia with the rest of the Iberian Peninsula, resulting in a route whereby deep convective thunderstorms approach from the West ([28,29,30]).
Different studies presented different precipitation regimes occurring in the analysis region ([11,13,31]). For instance, warm rain events occur during the transitions between cold and warm seasons (and vice versa). It is characterized by efficient precipitation rates, with few vertical developments of clouds and low lightning activity ([32,33]). The largest issue is that these transition periods do not always occur during the same weeks of the year, resulting in difficulty forecasting them in most cases.
The state-of-the-art showed that it is possible to classify the precipitation regime of Catalonia into four main categories. Firstly, the deep convection presents thunderstorms with the highest vertical cloud developments (between 12 and 18 km), which produce moderate to high rain rates in localized areas and elevated electrical activity. It is typical of summer ([34]), and severe weather phenomena occur in many events ([35]). Second, there is the non-deep convective precipitation, with high reflectivity values and top heights over 8 km in the warm season ([11]). However, when convection reaches these echo-tops in the cold season, it is likely to be more like deep convection as all the atmospheric levels are at lower altitudes. Non-deep convection occurs during the warm season mainly (May to October). It can coexist with deep convection, especially in July and August. Third, the thundersnow events of the cold season affect the smaller ranges near or over the coastal areas. These events could have moderate lightning flashes rates ([13]). During the cold season, the stratiform regime predominates with vertical cloud development around 2–4 km ([36,37,38]). Finally, warm rain presents elevated rain rates in short periods, with echo tops under 6 km and scarce lightning activity. The high sea surface temperature of the Mediterranean plays a very significant role in these types of events. These cases usually occur in autumn in coastal regions ([32]). Finally, summer-dry thunderstorms do not produce any precipitation, but the lightning rates can be elevated ([39]).

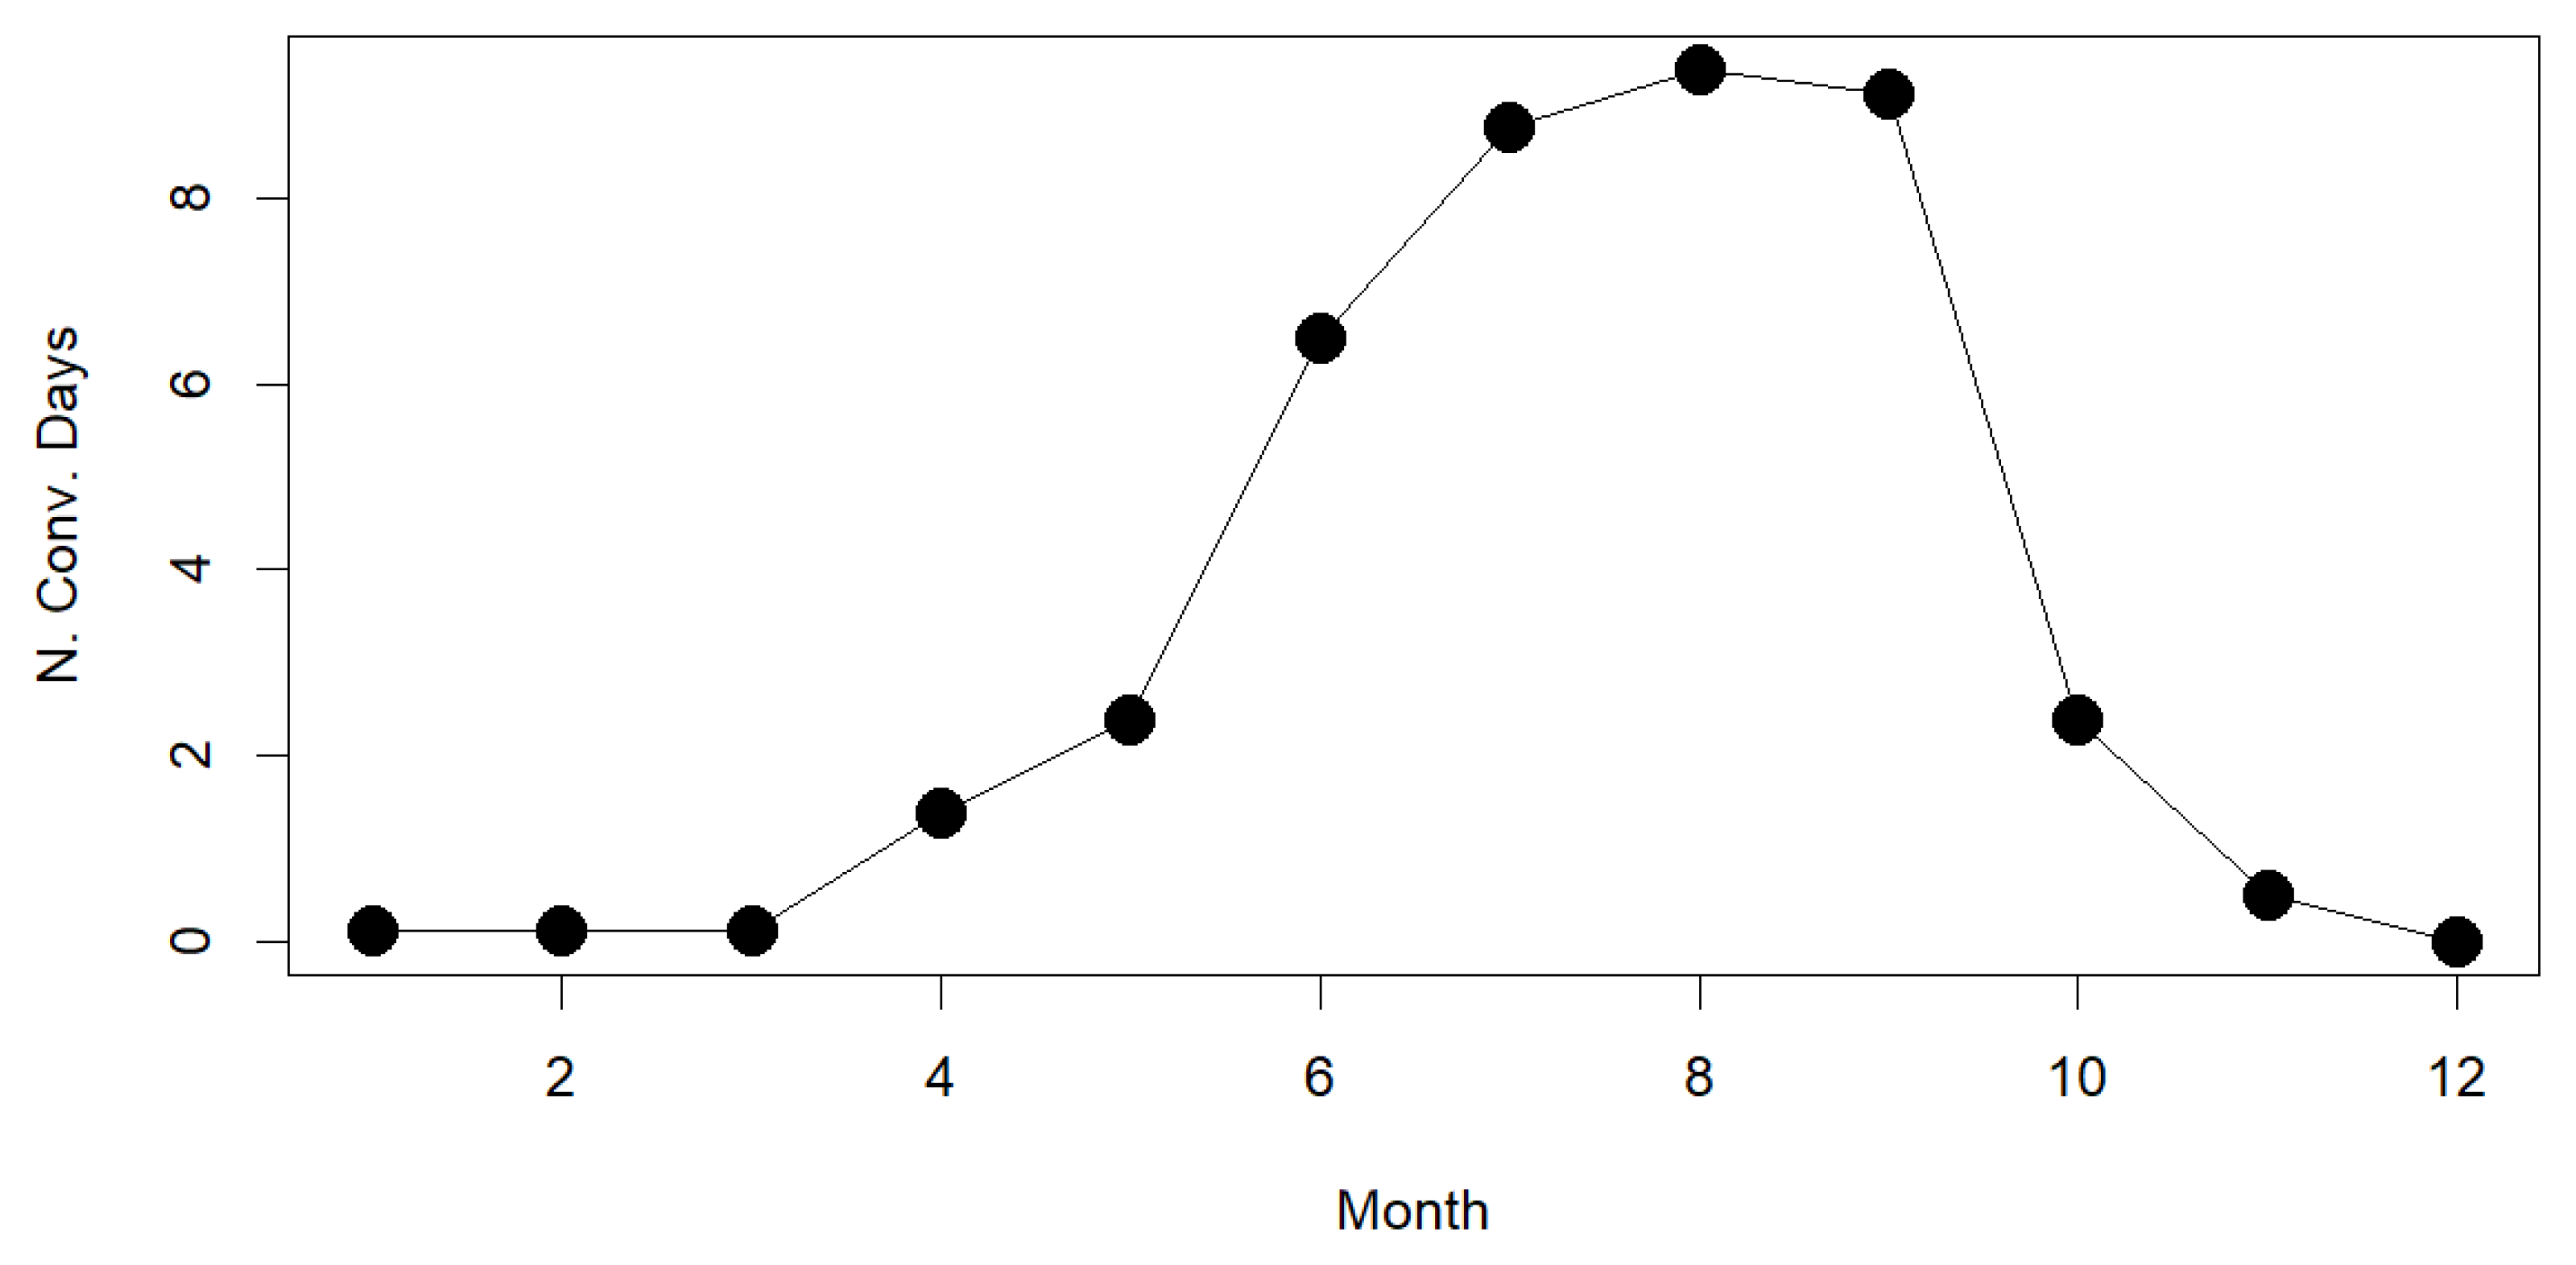
2.2. Precipitation Conditions in the Area of Study

The region of interest, like many other Mediterranean areas ([1,2,3,4]), presents a large variability in terms of precipitation. Figure 2 illustrates this characteristic through rainfall and lightning data. Of the 3287 days of the 2013–2021 period, a large part of the territory (practically all the Mid-Southern and the North-Eastern coast) presented 2700 (81.8%) or more days without precipitation. On the opposite, only reduced areas in the Pyrenees registered rainfall in over 25% (850 days) of the period. If we move to precipitate days with accumulated rainfall exceeding the 10- and 50-mm thresholds, only some reduced areas presented values larger than 6% (200) and 0.4% (15), respectively. However, there exist regions exceeding 50 mm twice per year. These are located mainly in a corridor in the North-eastern part and some mountain areas close to the coast. Finally, the cloud-to-ground (CG) activity presents values larger than the 50 mm precipitating threshold but with a different spatial distribution. In this case, the maximum takes place in the central part of the Pyrenees but with some secondary peaks in the Southern and Central Coastal areas. The maximum precipitation shows a focalization in small regions, while the lightning activity is widespread over the surrounding areas of the rainfall peaks.
The precipitation behavior was mainly dry in all the regions of Catalonia during the 2013–2021 period. Drought periods occur principally in the Southern and all the Coastal areas. However, it is possible they surpass ten and even the 50 mm daily thresholds with a relative facility (some parts of the Northern region can reach five and two times per year these values), indicating a high degree of convection of the precipitation. The electrical activity map confirms this fact. Besides, it also shows that convection can occur in low-precipitation cases. These values agree with other previous analyses in the region ([5,6,8,9]) but provide a higher spatial and temporal resolution of the information given by the remote sensing data. Besides, reference [40] and others classified rain events in Catalonia according to the beta parameter. This magnitude estimates the total precipitation exceeding a certain threshold (empirically estimated) by the total rainfall. The closer it is to one, the more convective is the event.

2.3. Data

The first data source considered in the analysis is the Network of Weather Radars (XRAD) of the Meteorological Service of Catalonia (SMC), which produces a 3D composition for the whole territory of Catalonia thanks to the four C-Band Single polarization radars. Figure 1 shows the radars distribution. Volumes were processed with a 6 min resolution, covering a large part of the lower and mid-atmospheric levels closed to each radar. Reference [41] provides more information about the network.
The analysis considered five types of operative (this is, running in real-time) composite radar products. The composite examines the data of all the radars over each point of the matrix, selecting the maximum daily value (for reflectivity, echo tops, and vertically integrated liquid). In the case of the rainfall field, the final daily raster considers the sum of all hourly registers. The different products are:
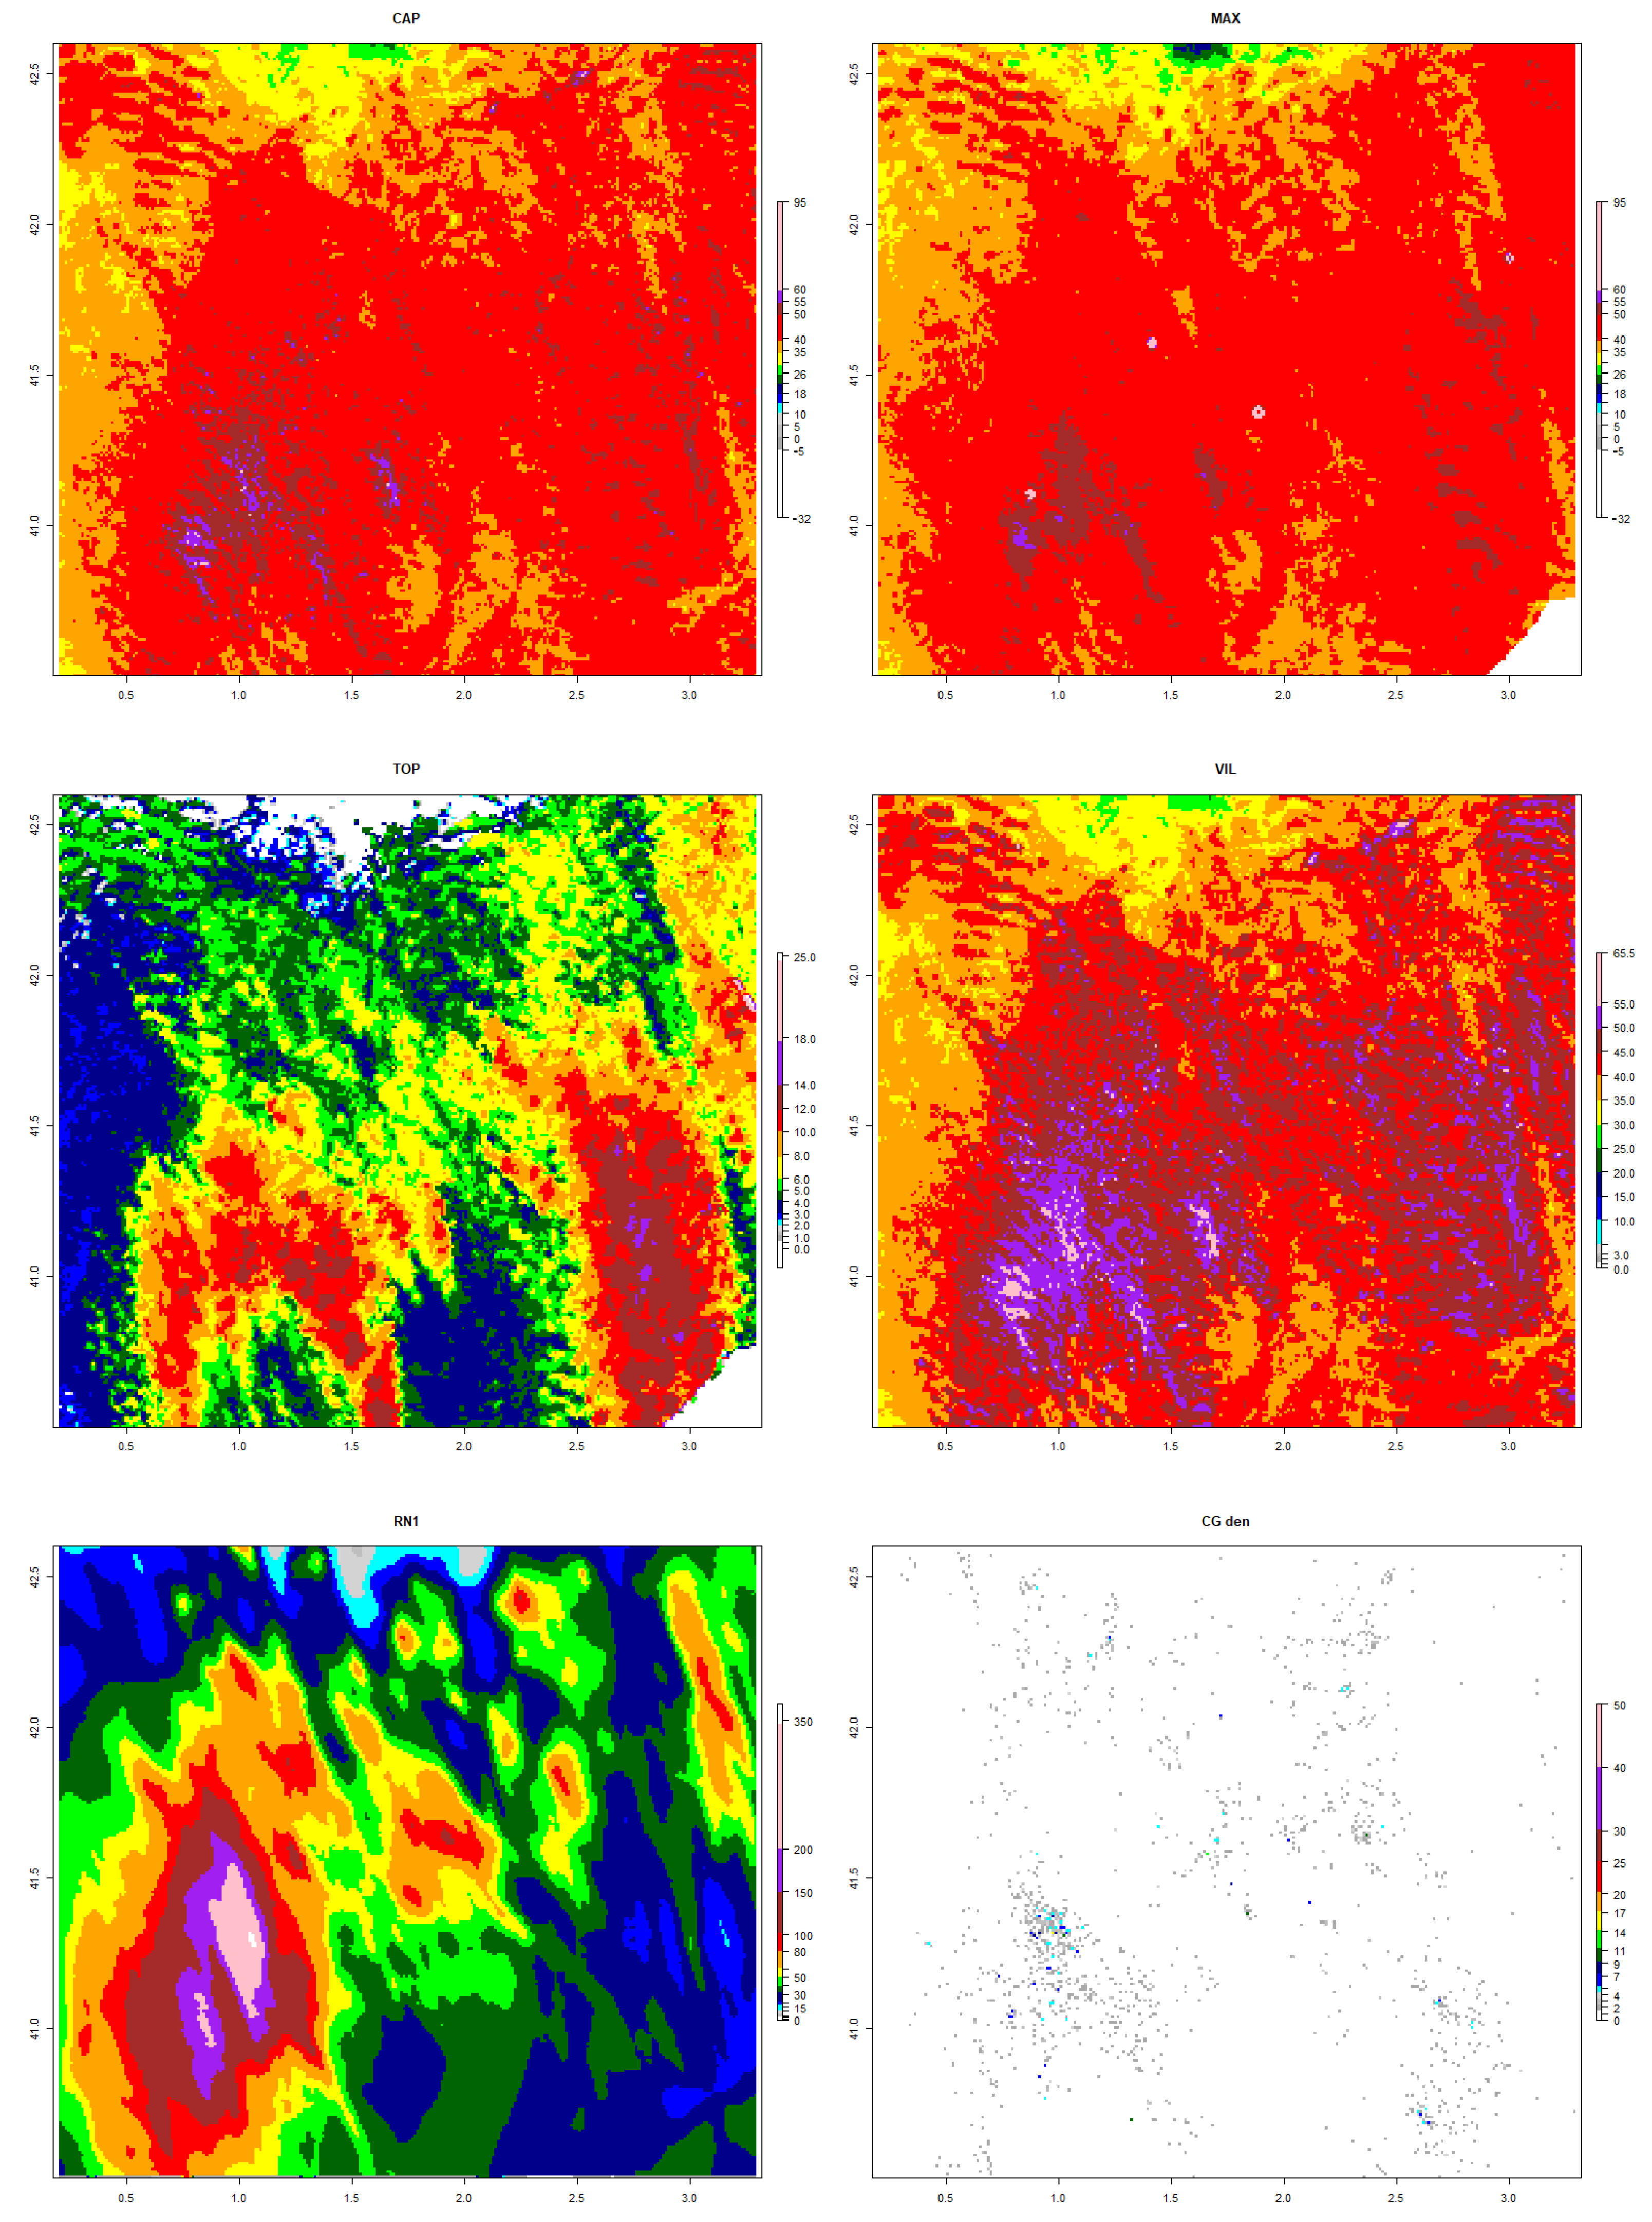
  • radar corrected reflectivity (CAP), which is a pseudo-CAPPI (Constant Altitude Plan Position Indicator), generated considering the corrections made by the EHIMI Hydro Meteorological Integrated System tool (see [42] for further information). Some of the corrections consist in removing sea and ground clutter, detecting electromagnetic interferences, and replacing the values for more accurate ones or using the vertical profile of reflectivity for estimating the reflectivity at the ground for all pixels (more information regarding this point is found in [43]);
  • the maximum reflectivity, hereafter MAX, considers all the levels for which the radars provide information (between 1 and 25 km above sea level) and selects the maximum value for each 2D pixel ([44]);
  • daily rainfall estimated by the XRAD, hereafter RN1, using the classical Z/R relationship with a = 200 and b = 1.6 ([45]);
  • the echo top (hereafter TOP) or the maximum height at which observed echoes are equal or larger to 35 dBZ reflectivity ([46]).
  • and, finally, the vertically integrated liquid (VIL) product, which is an estimation of the precipitable water mass in each column of the radar volume field ([47]).
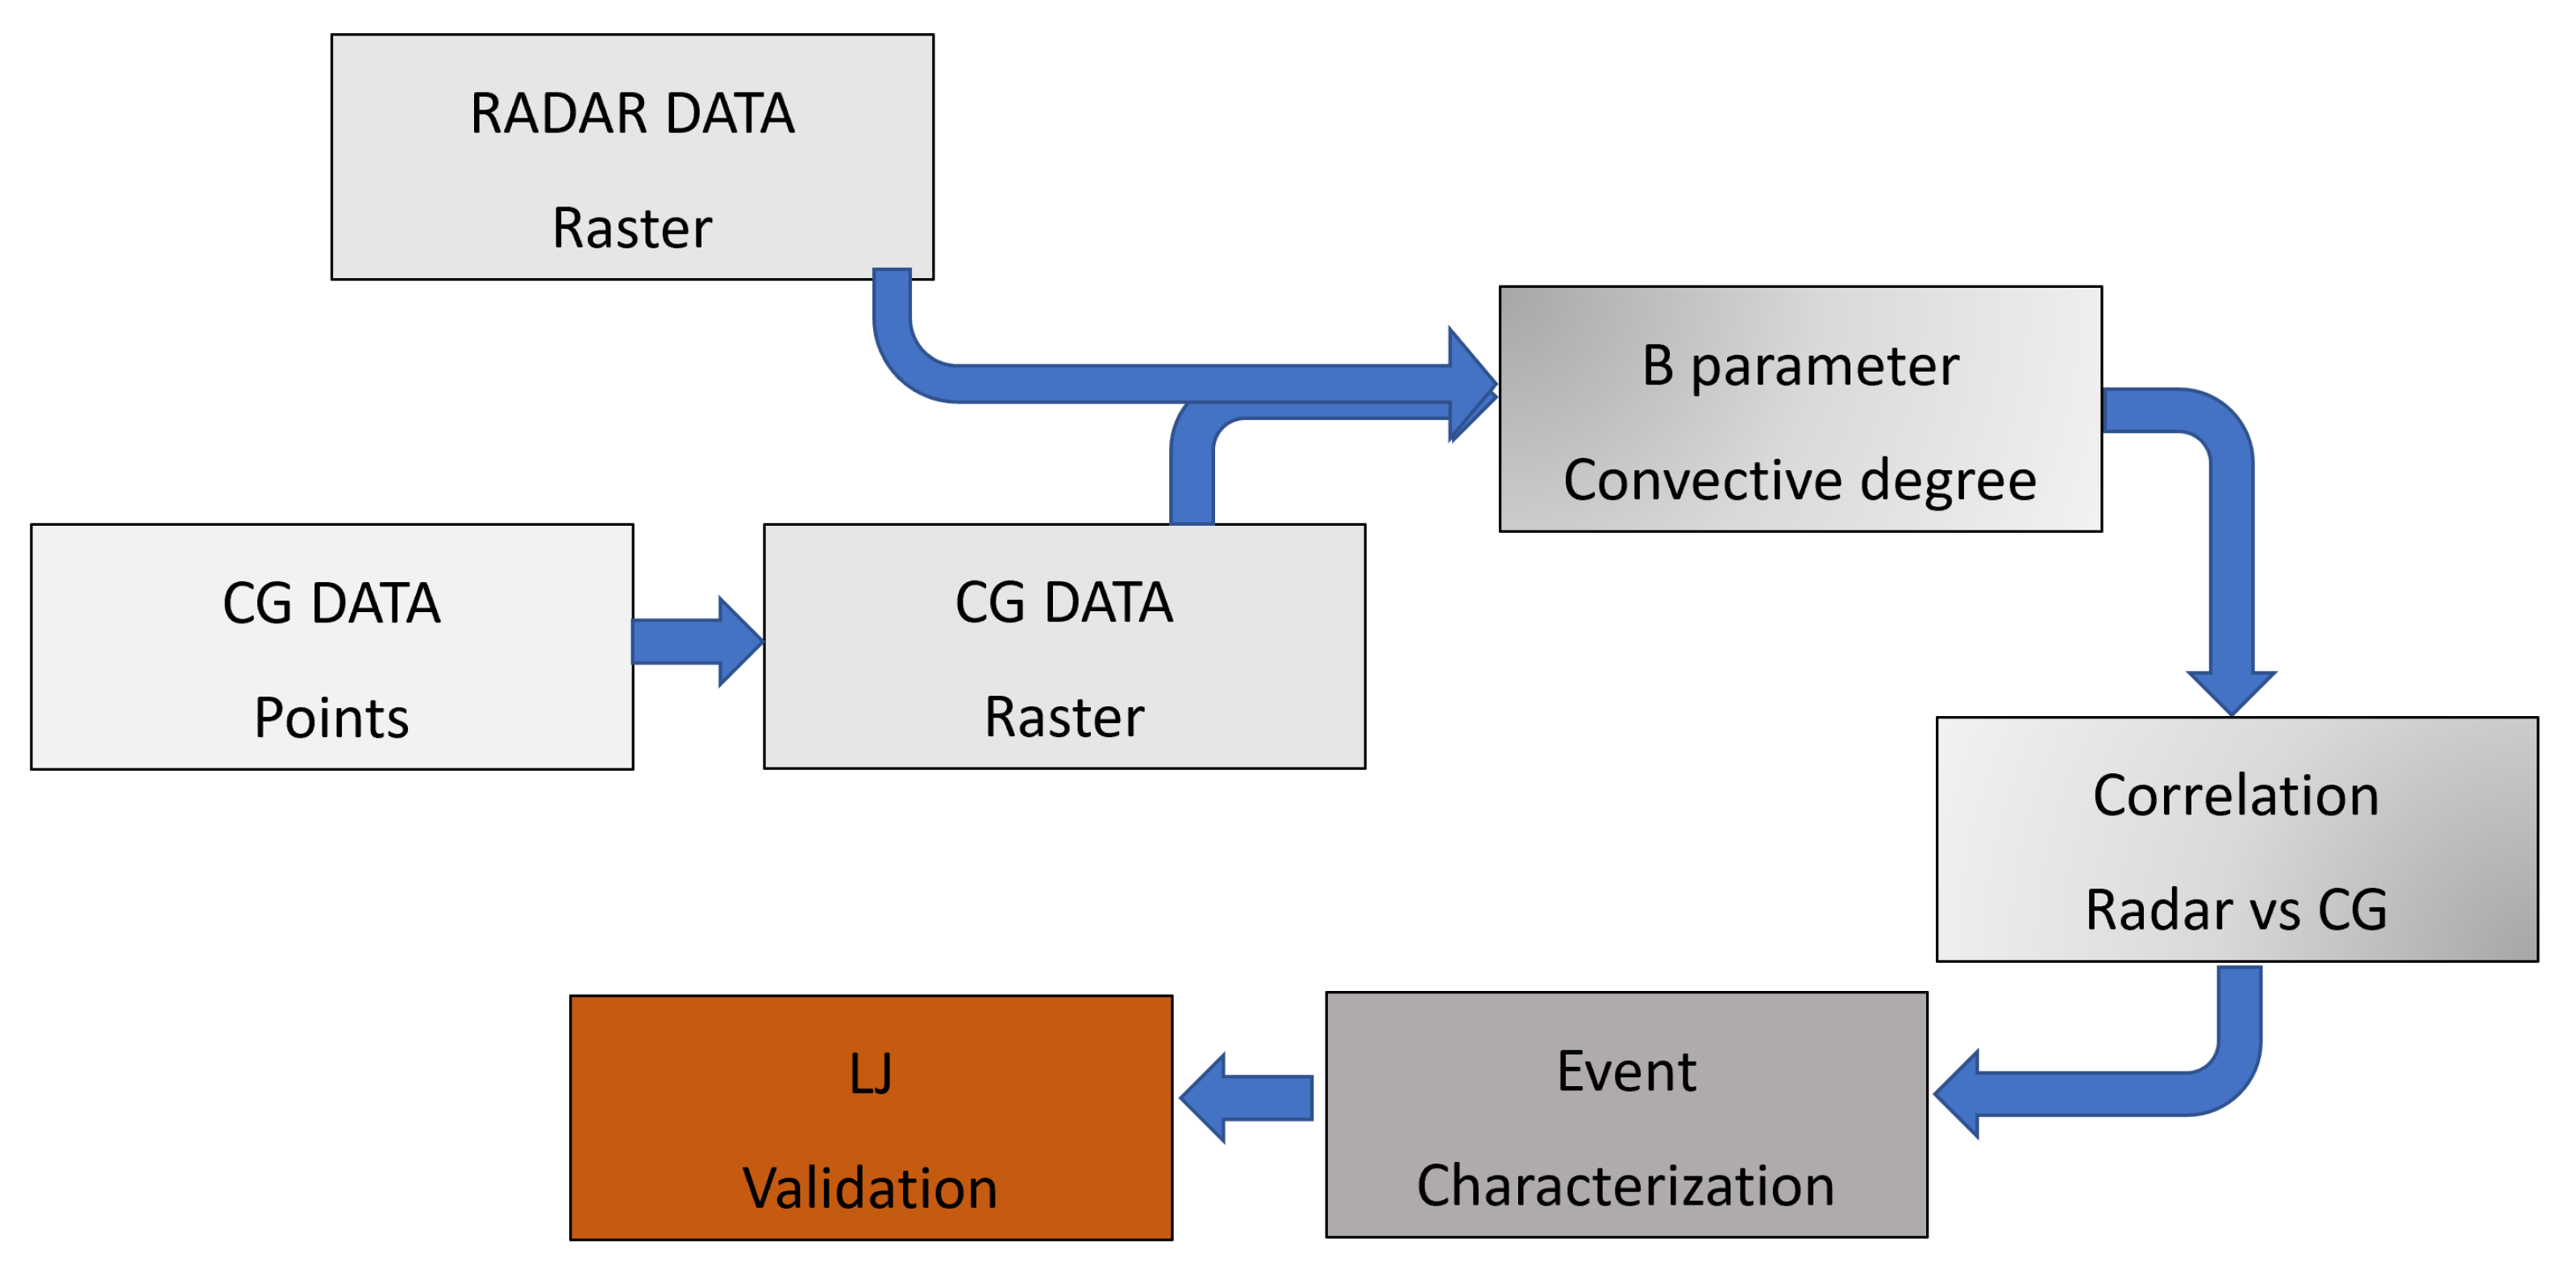
Only the CAP product has EHIMI corrections when it is processed. Moreover, all have been analyzed daily, considering the field with the maximum value at each pixel. Only RN1 considered the accumulated value (the sum of all the hourly estimations). Every product has a particular limit and spatial resolution. Then, we adjusted all of them to the following spatial resolution at the lat–long box: 0.2° E, 3.3° E, 40.5° N, 42.6° N. This allows that all the final radar fields have an equal spatial resolution.
The Lightning Location System (LLS) of the SMC is composed of four detectors of the Vaisala LS-8000 model (see Figure 1). The network can detect flashes using Very High Frequency (VHF) and Low Frequency (LF) activity sources. Reference [31] presented a detailed report of the network configuration. The LLS has the particularity of detecting and separately allocating IC and CG flashes ([48]). This characteristic allows having better results on the TL of thunderstorms characterization. The analysis of the 2013 campaign ([49]) establishes CG flash detection efficiency for the SMC-LLS around 80–85%, and the estimated mean location accuracy was about 1 km. Only CG flashes were considered because the locations are more precise than IC lightning. Besides, CGs are more related to the precipitation field. The last use of the LLS data was the Lightning Jump (LJ) climatology for the period of analysis ([35]). Each warning recorded in the database was assigned a level 2 for severe weather conditions (large hail, strong wind gusts, downbursts, or tornadoes) and 1 for non-severe weather (small hailstones, extended graupel, moderate convective winds, or heavy rainfall). The validation of the convection degree of each of the analyzed days was done through the LJ database.

2.4. Methodology

The analysis consisted of the regimes of precipitation characterization in Catalonia, considering radar and lightning data. The research included three different steps, shown in Figure 3, and consisting of:
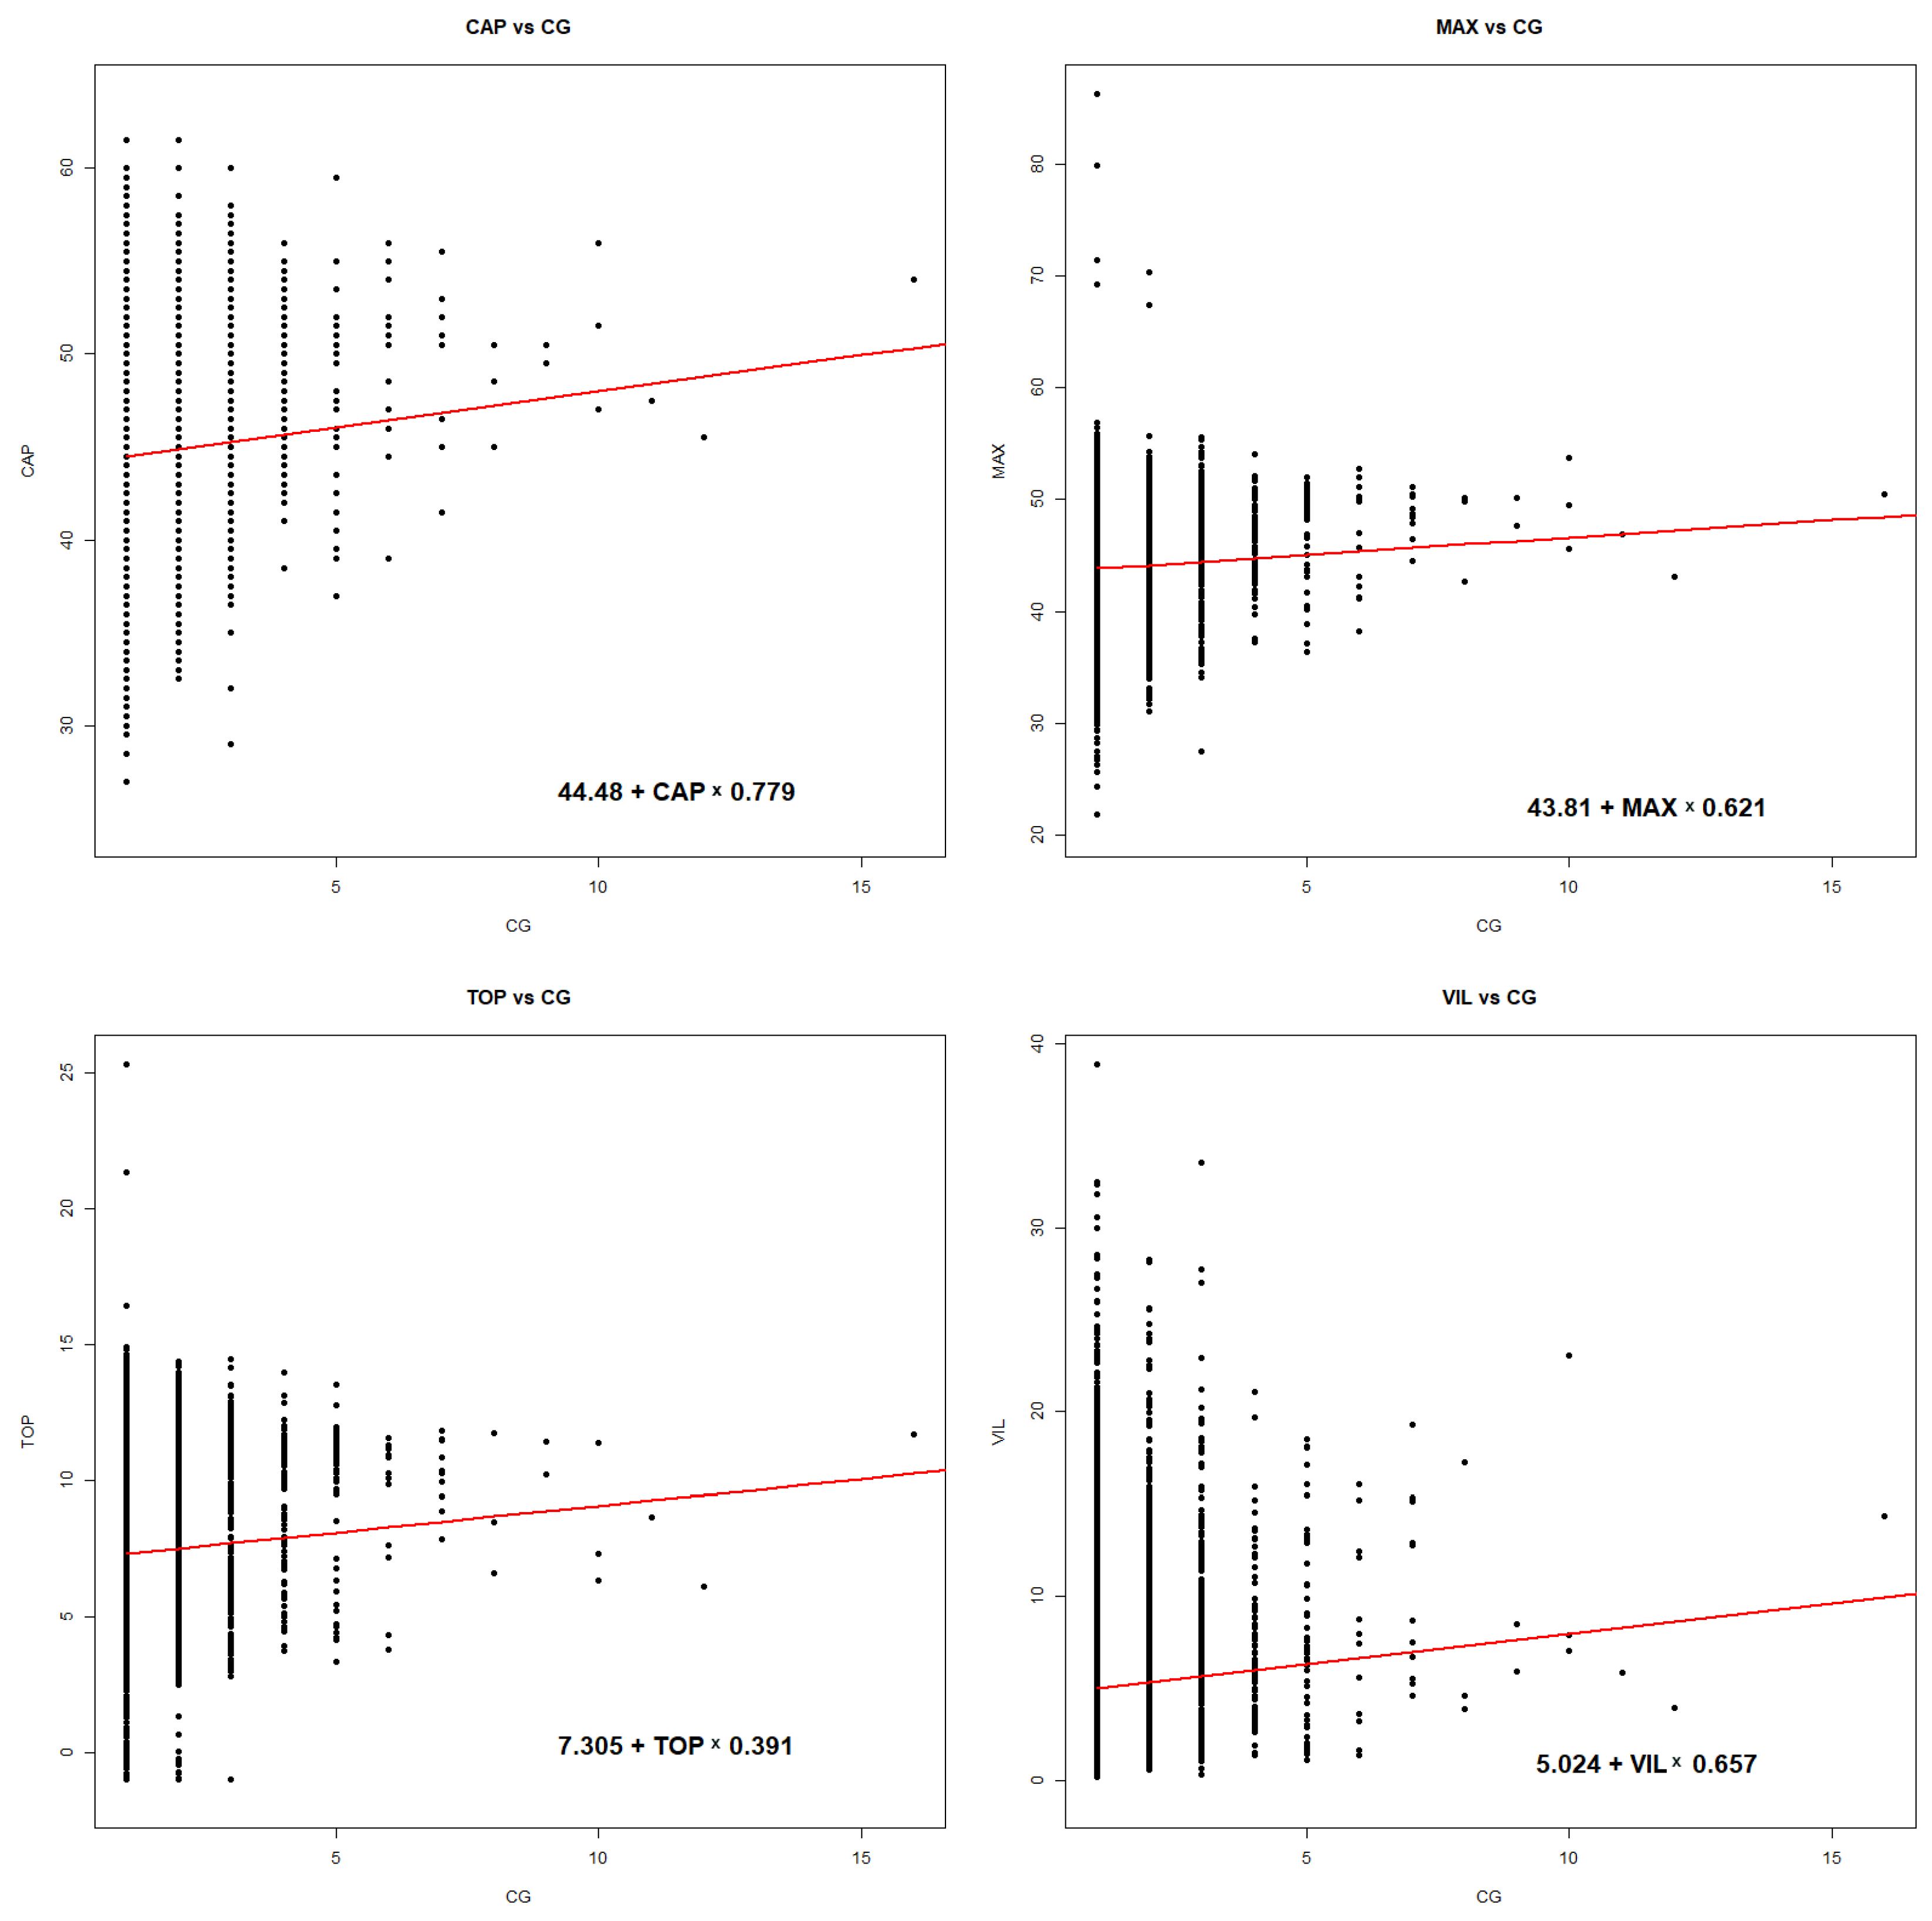
  • Characterization of the convective degree: departing from the technique shown in [40] and others, we took advantage of the capabilities of the radar and lightning observations data. In this way, we adapted the previous methodology, based exclusively on rain gauges data (the percentage of the precipitation that exceeds a certain threshold in a period of 5 min to the total accumulated, as Equation (1) shows), to calculate a new beta parameter but using radar data and lightning observations (the percentage of precipitating pixels with electrical activity—at least on CG flash—respect the total of rainfall pixels) for the area of study shown in Figure 1 (see Equation (2))
    β = 1 n P i [ > P t h ] 1 N P i ,
    β * = 1 n P i [ flash ] 1 N P i ,
    where, in Equation (1), P i is the rain rate for 5 min; P t h is the threshold of the rain rate for considering rainfall as convective (calculated empirically); n is the number of periods exceeding the threshold; and N is the total number of periods for one day. In the case of Equation (2), R i is the daily accumulated rainfall in a pixel of the domain; flash presence indicates that the pixel is convective; n is the number of pixels with flashes; and N the total number of pixels in the area with precipitation. The new β * is redefined as β for simplification.
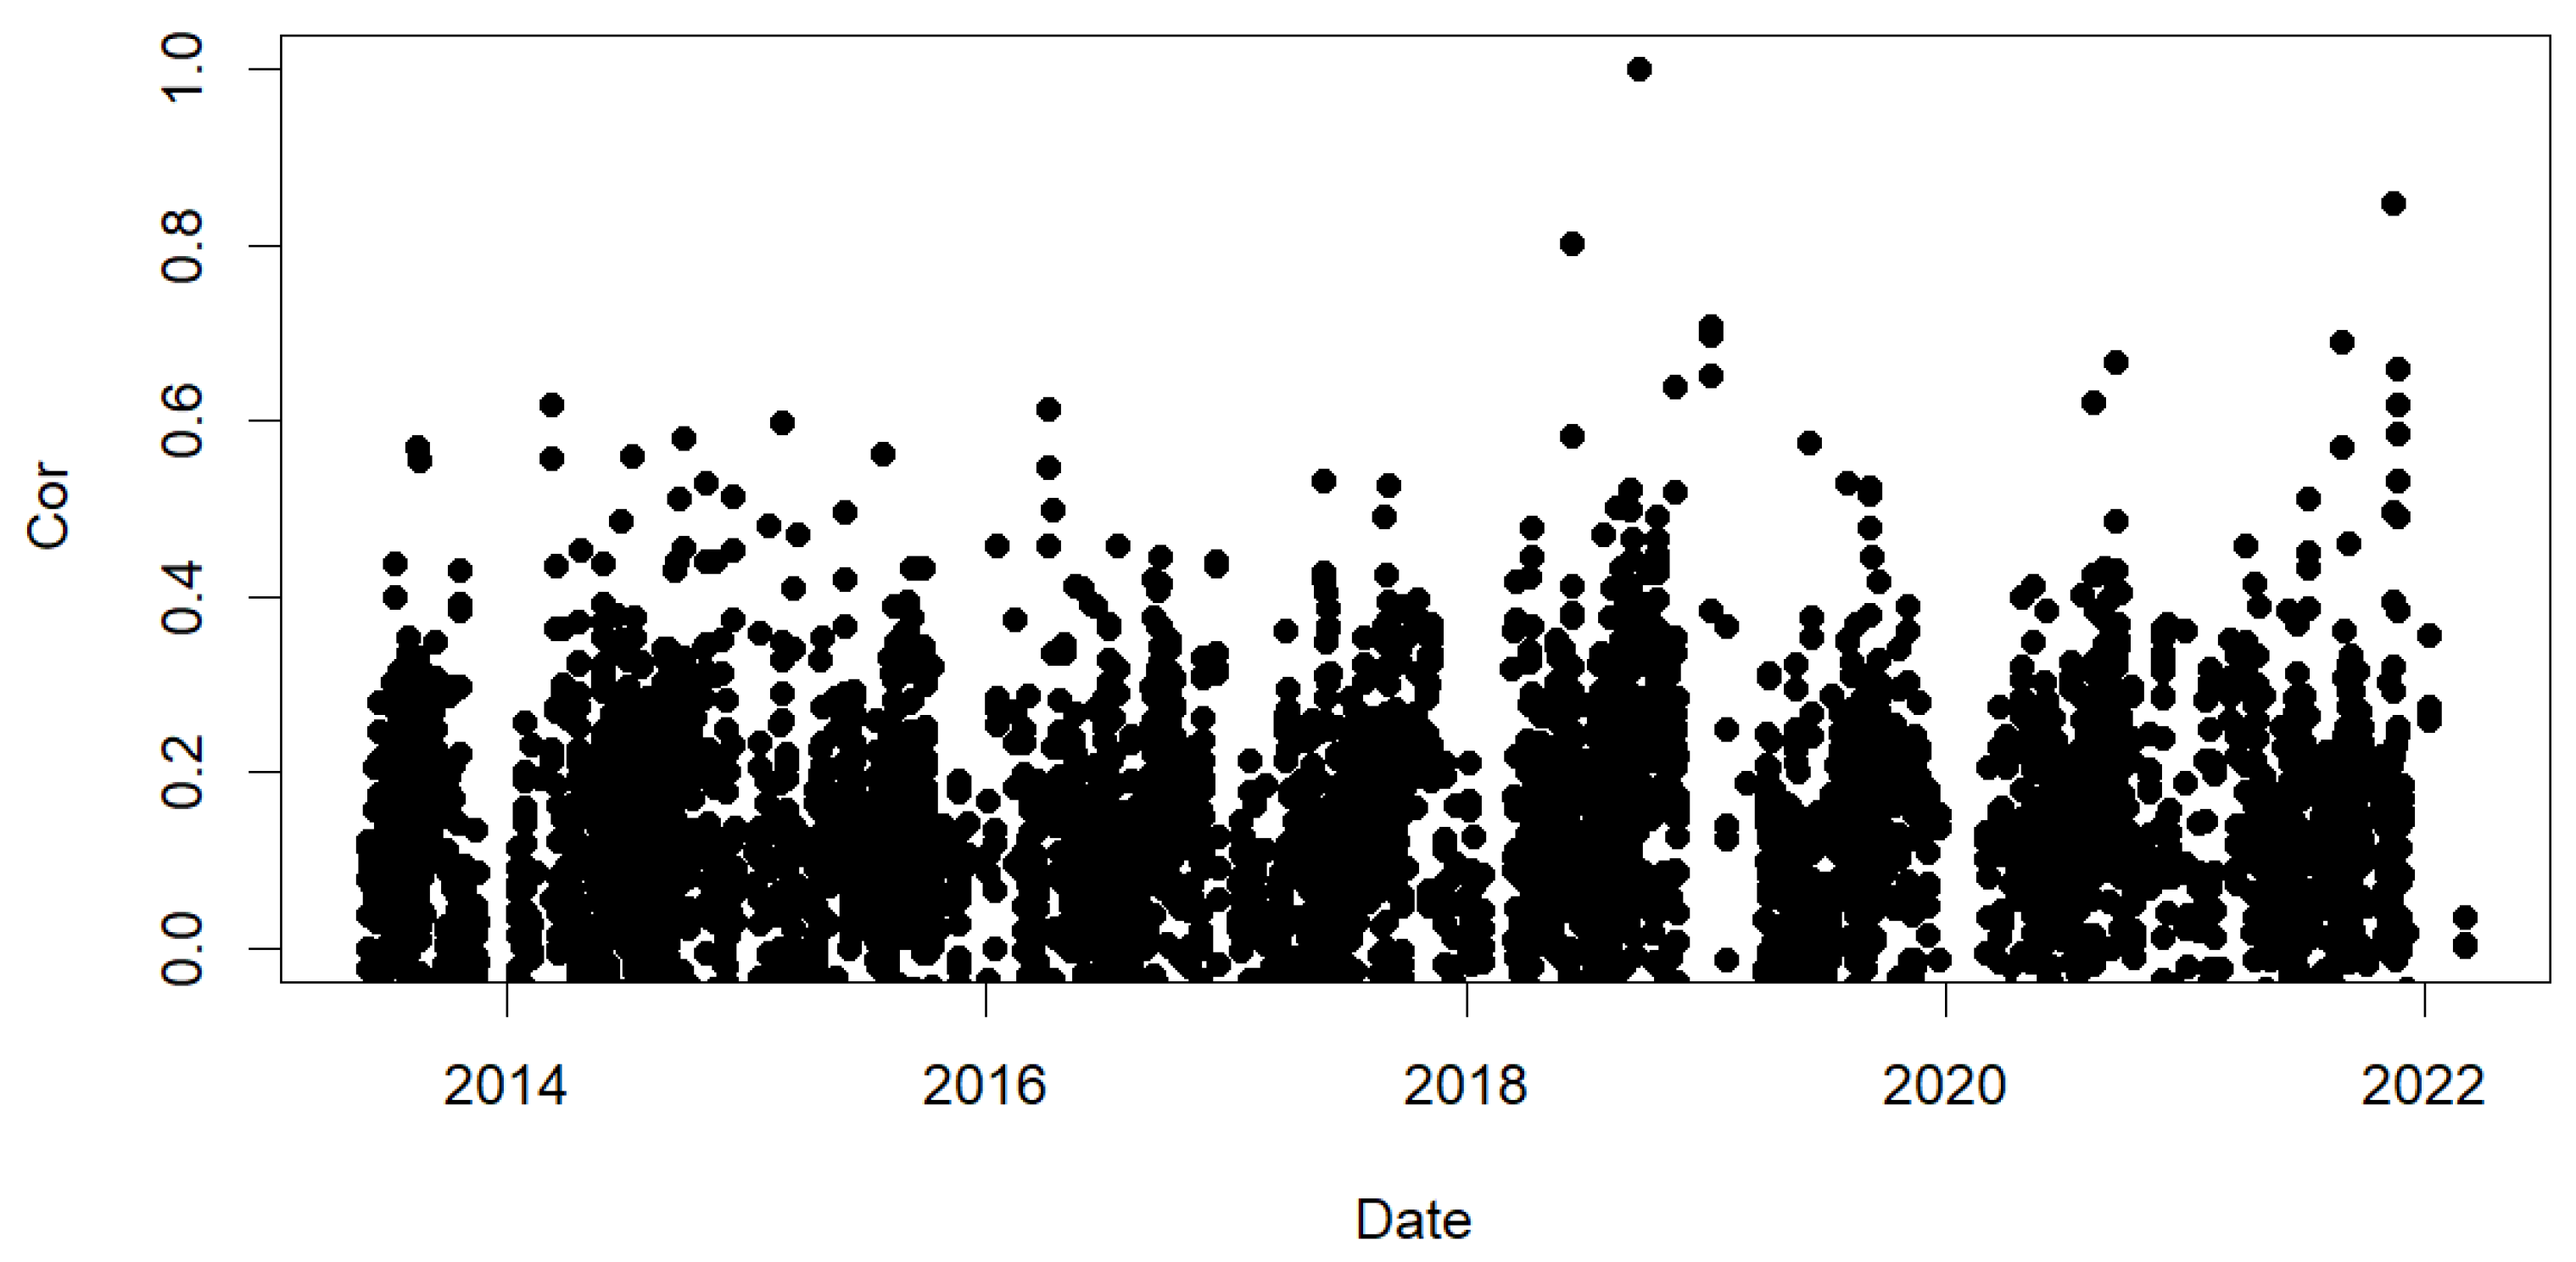
  • Estimation of the daily correlation degree for the different radar parameters and the raster of CG flashes density: In a similar way as [18], we estimated the correlation between radar parameters and the CG flashes in the region of study for each day of the period. However, the correlation was calculated not only for rainfall but for the maximum field of reflectivity, maximum reflectivity, echo tops, and VIL. This consideration tried to simulate the vertical degree (echo tops and VIL) and the instantaneous behavior of the convection (in a similar way to [11] but adapting from individual thunderstorms to global fields).
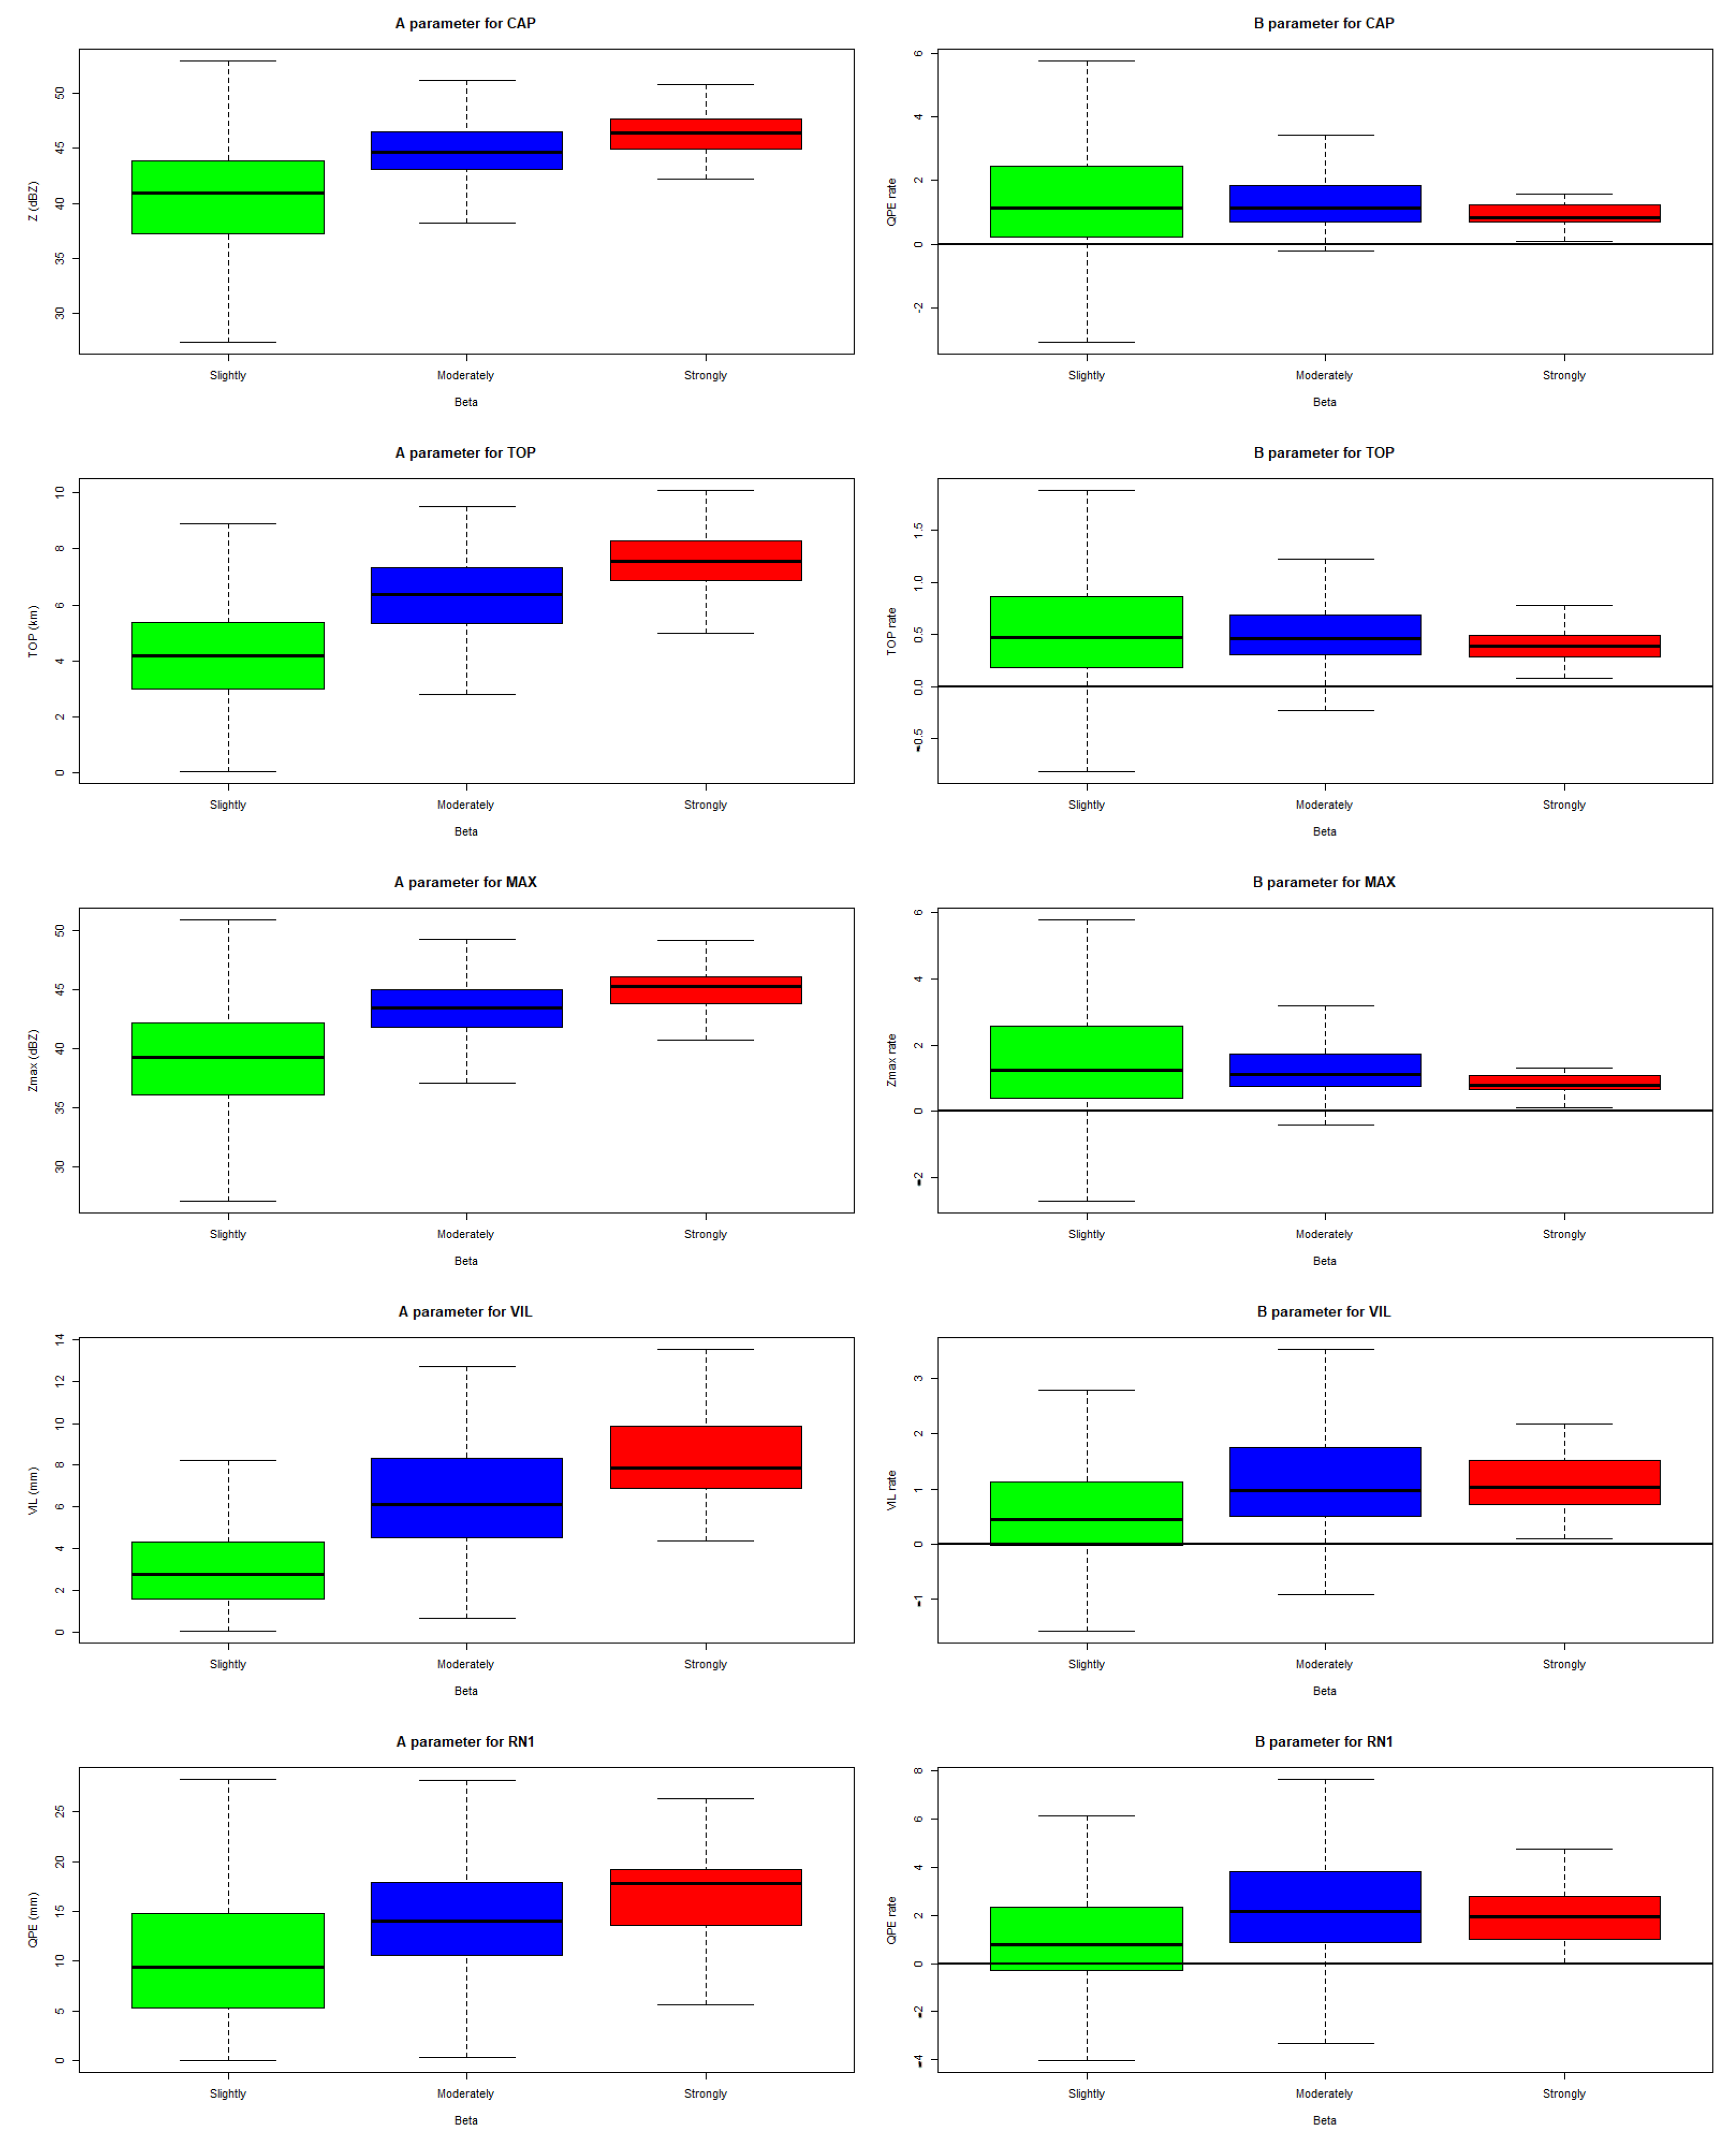
  • Characterization of the days: We used the same classification [40] for characterizing each day. The correlated values of the radar-CG fields for each of the day were associated with the beta parameter, redefining the daily characterization with a more accurate set of magnitudes (the correlations between CG and the radar fields).
  • Validation with LJ: To prove the reliability of the methodology, we focused on the most convective days. These cases usually present one or more LJ warnings. Then, we used skill scores considering the daily characterization as “the forecast” (“F” for forecast, and “f” for non-forecast), while the LJ occurrence acts as “the observation” (“O” for observation, and “o” for non-observation). Then, Table 1 presents the scores considered in this validation.

3. Results

The research focused on the characterization of the rainfall regime in Catalonia using lightning and radar data. In particular, the higher contribution of the convective precipitation type made it that the main interest was to find the best discriminators in these cases. The research had three steps: first, using quantitative precipitation fields and cloud-to-ground data to demonstrate the convective dominance of the precipitation; second, considering five daily radar fields and CG data to characterize these events with the highest values of the convective parameter; and third and last, validating the results of the previous characterization using the LJ database, taking into account that this phenomenon occurs in severe weather events with a high degree of convective organization.

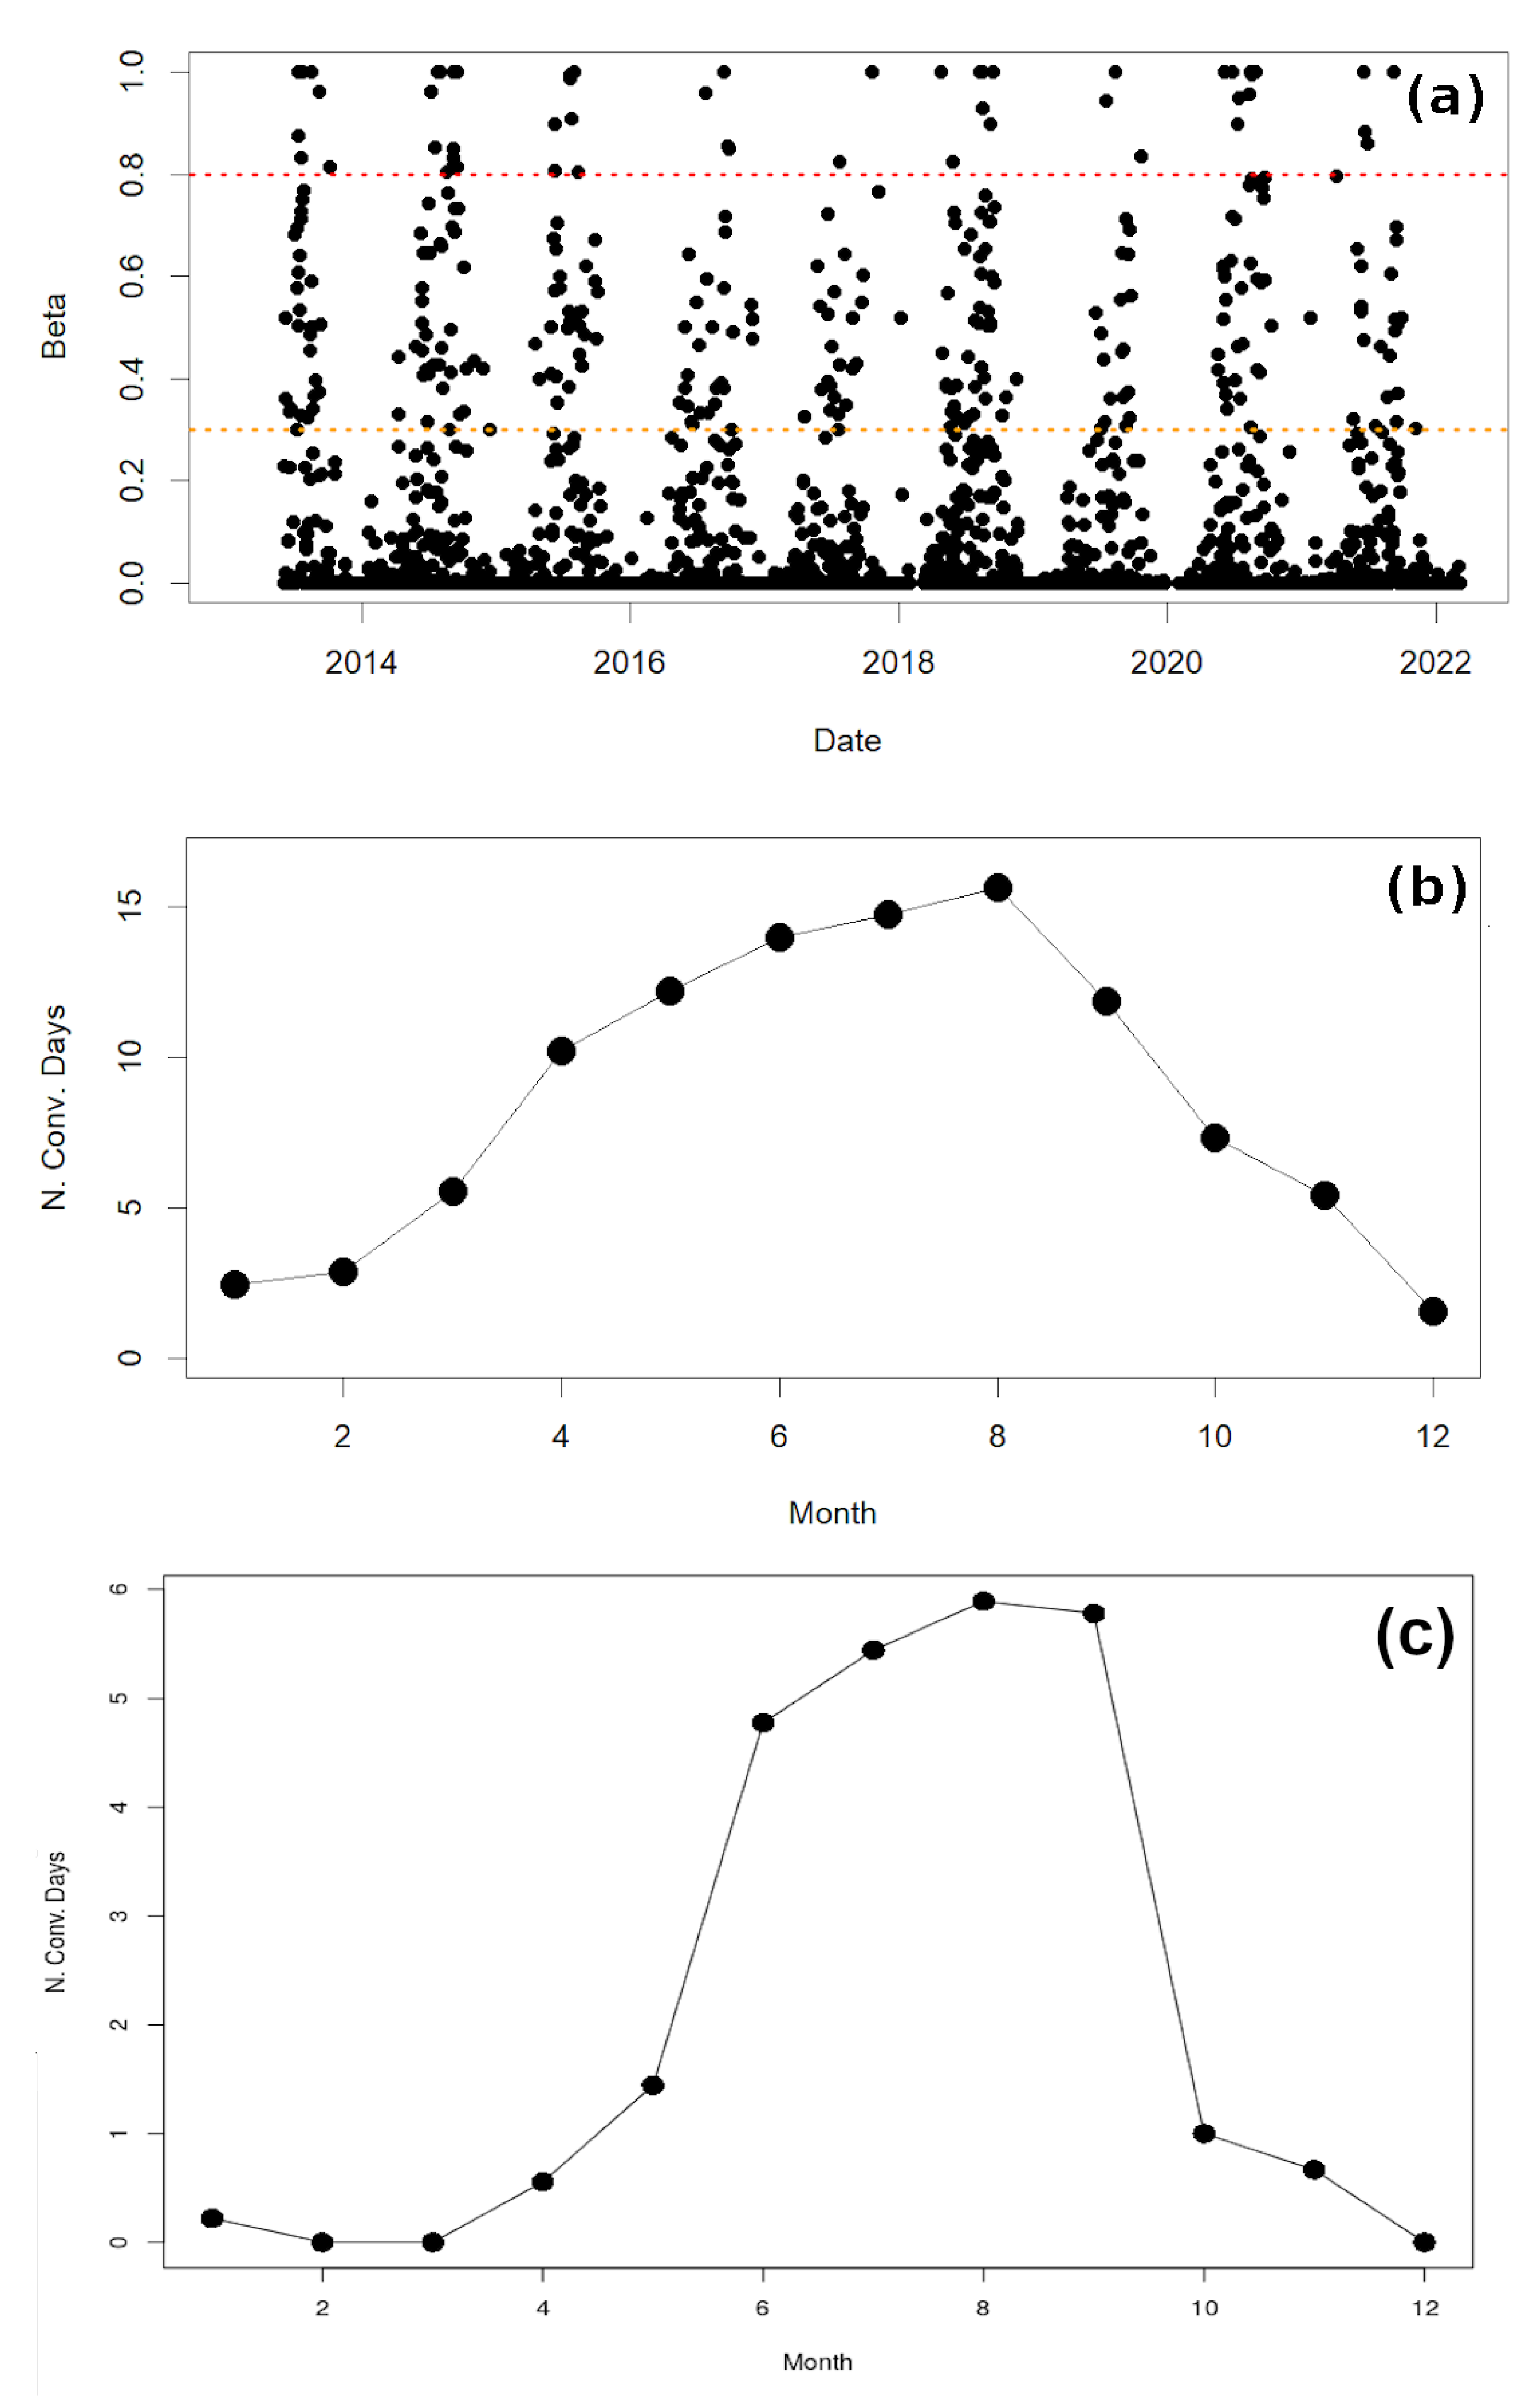
3.1. Adapting the Beta Parameter to Radar and Lightning

To show the high number of cases of convective rainfall in Catalonia, we adapted the beta parameter to the tools used in this research. The original parameter considered a rain rate series of rain gauges with a 5-min resolution. The main advantage was the high reliability of the results, but these were only applicable in a very reduced area surrounding the measuring point. The new method of estimating the parameter departs in that, by definition, lightning generally occurs in convective precipitation. Then, we considered all those pixels with at least one CG as convective rainfall. Because the objective of this research was not the exact estimation of the beta parameter, if not to identify the convective degree of the daily precipitation fields, we believe that the current Equation (2) is sufficient for this purpose. In any case, we believe that the methodology could be improved using better time resolutions for radar precipitation (for example, hourly instead of daily) or a larger radius of influence of the lightning data (for instance, 3 or 5 km, instead of the 1 km used here).
The top panel (“(a)”) of Figure 4 shows the distribution of the new beta parameter for the period of analysis. Yellow and red horizontal dotted lines indicate the thresholds used in [40] for defining the different degrees of convection (below 0.3 indicates a slightly convective regime; between 0.3 and 0.8 denotes moderate convection; while over 0.8 corresponds to strongly convective precipitation). The percentage for 2013 to 2021 was 45.0% with no rain or non-convective, 22.9% with slight convection, 7.6% with moderate convection, and only 1.6% strongly convective. These values would be in line with those observed in the original research of [5]. The mid panel (labeled as “(b)”) of Figure 4 presents the monthly distribution of moderately and strongly convective days. Although the values are higher than the observed in [40], they are in concordance. The difference is that it is probably due to the better spatial resolution of the new estimation of the beta parameter and, what is more important, that the original figure only refers to a unique point, while the new one considers all the Catalan territory. In any case, the maximum period extends from April to September, with a peak in August. Finally, panel (c) of Figure 4 has a more reliable behavior according to the expected of the previous studies, considering only those strongly convective events.

3.2. Characterization of the Convective Days Using the Different Correlations

Figure 5 presents an example of the radar, and the CG density fields, for the case of the 22 October 2019, a heavy rainfall event that affected mainly the Southern areas of Catalonia and a high degree of convection (see the beta parameter of Table 2). The rainfall maxima were recorded strictly in the Southwest of the image (with peaks over 200 mm in a wide area). However, the other variables also indicate relevant values in the Southeast, mainly for the volumetric ones. This second pattern is more coincident with the CG density field than the one for the accumulated rainfall map. In any case, the 24-h accumulation correlation (0.213, Table 2) is notably higher than the obtained for the rest of the magnitudes (between 0.101 and 0.128). Besides, correlations between lightning data and radar fields were not especially high. This characteristic occurs recursively along with the set of events and for each radar variable (Figure 6) for all types of convective behaviors (slightly, moderately, and strongly). Then, correlation cannot be considered as a good element for describing the relationship between electrical activity and the precipitating structures. However, it exists another way, following the works described in the literature, using the scatterplots and the linear regression between radar and CG density (Figure 7). The new application considers more radar fields than only the rainfall estimated map used in the original research. The coefficients of the linear fitting are: first, “a”, which is the value of the radar magnitude when the CG density is zero and, second, “b”, or the slope of the line, which can be assimilated as the rate of growth of the radar field as the CG density value increases. It is worth reminding that the CAP field is estimated using specific hydro-meteorological corrections that make that the final value of the reflectivity adapted to the ground observations (rain gauges of automatic weather stations). Then, the registers of this field can be larger than the MAX, which does not consider these corrections.

3.3. Global Behaviors of the Different Parameters thorough the Beta Thresholds

Figure 8 shows the boxplots for the parameters “a” and “b” of the linear regression equation, defined as: “a” + VAR * “b”, where VAR is the radar magnitude. The different colors indicate the three convective regimes estimated using the beta parameter: green for slightly, blue for moderately, and red for strongly. The left column corresponds to the “a” parameter, while the right shows the “b.” The “a” parameter indicates the relationship between a CG flash and each radar magnitude, while the “b” shows how this relationship varies as it increases the number of CGs in a pixel.
The first characteristic of the boxplots is that the “a” parameter differentiates the three convective behaviors for all five radar parameters. Besides, we could define the discriminating thresholds: 43.5 dBZ and 45 dBZ in the case of CAP, 5.5 km and 7.5 km for TOP, 42.5 dBZ and 44.5 dBZ for MAX, 4 mm and 8 mm in the case of VIL, and 11 mm and 13 mm for RN1. The more dispersed (this is, the one with lesser capability of discriminating the behaviors) variable was the RN1, which was the preliminary used in other works. Then, we considered that the new parametrization helps to clarify the precipitating regime.
Regarding the “b” parameter, two different patterns were observed. First, for CAP, TOP and MAX, there was a decrease in the parameter as the beta was more convective. It means that the slope was stepped for fewer convective events, in the case of the reflectivity and echo top fields. On the contrary, the “b” parameter increased as the event was more convective for the VIL and RN1 parameters. Then, the ratio radar magnitude variation and CG per pixel decreased as the event had a higher beta parameter for the first group (CAP, TOP, and MAX). By contrast, as the event is more convective, more variation exists as the number of CGs per pixel increases for VIL and RN1 variables.
The set of points has a higher distribution center as the event is more convective for all parameters. However, the increase in the fitting of the line slope is less evident as the event has more convection (higher beta parameter value) for all variables excepting VIL and RN1. This finding is interesting because it contradicts the previous research analysis. This conflict is caused by the simple reason that they were focused exclusively on the accumulated precipitation fields. Then, analyzing most radar variables fields provides a better understanding of the convective nature of the precipitation.

3.4. Validation with Lightning-Jump Warnings

Lightning-jump warnings are synonymous with deep convection in the Catalan area, as stated in [35,50]. We used the occurrence of LJ as evidence of severe convection, which was the observation in the validation of the previous methodologies. Figure 9 shows the monthly distribution of convective days in a similar way to the panels (b) and (c) of Figure 4. In this case, the distribution emphasizes the period from June to September, being coincident in shape with the second panel. Regarding the values, the daily LJ occurrence distribution is in the middle of the case of strongly and moderately beta cases and slightly higher than only for strongly convective events. It indicates that the moderately convective episode selection provides an excess of events, while the beta parameter is sometimes restrictive.
Table 3 compares the bottom and top limits of the datasets for the “a” parameter in the different degrees of convective precipitation with those obtained for the days with LJ occurrence. The values for this last set ranged between those for moderately convective and those for the strongly convective events. The lower limit was higher than the obtained for the cases of β 0.3 but below the minor limit for β 0.8. The same occurred for the higher limit. Then, using the first beta threshold, there existed an overestimation of the radar parameters, while, on the opposite, there was an underestimation. This fact indicates that these thresholds should be adjusted in a future analysis.
To illustrate this, Table 4 presents the skill scores (POD, FAR, and CSI) for the comparison between the beta methodology and the LJ registers. Although POD and CSI were good (close to 1) in the case of considering the moderate events, the FAR indicates a large number of false alerts (values of 70%). On the contrary, when the moderately convective events were discarded, POD and CSI decreased, while the FAR was fairly improved.

4. Discussion

The expected increase in variability in the precipitation regimes in areas such as the Catalan, among others in the Mediterranean Basin and around the world, makes it necessary to pay an effort to improve the knowledge of rainfall characteristics. This capability of understanding the rain cycle will be essential as water management would be one of the priorities at all administrative levels.
Until now, the techniques for estimating the degree of convection and the relationship between rainfall and lightning were of three types: first, comparing different radar variables with electrical activity in thunderstorms in a specific way; second, analyzing the rainfall field with the flashes in all the extensions; third and last, using rain rates with resolutions of 1 or 5 min for rain gauges series, thorough a threshold obtained empirically. The first and second methodologies considered mainly radar and lightning data. The first technique had the advantage of following with high precision in time and 3D space single thunderstorms but with the inconvenience of not being representative of all the episodes. The comparison between radar rainfall and lightning data described well the general behavior of the event. However, it fails in the part of the relationship of the convection at mid-high levels. Finally, the third procedure is the more precise for detecting the convective regime but with the inconvenience of being exclusively punctual.
The proposed technique attempts to combine the three previous methodologies to take advantage of the positive points and reduce the limitations. In this way, it considers a similar form of estimating the convection behavior of the beta parameter but using the existence of lightning linked with the precipitation, which is one of the characteristics of convective rainfall. Besides, it combines using radar parameters, including volumetric ones (such as the VIL or echo tops), with the estimation of the linear fitting previously used in the rainfall lightning rate studios.
Most of the past studies compared lightning and rainfall by evaluating the sum of the precipitation and the CG flashes in a region, assigning a unique global value to an event. Each pixel has an individual weight in two senses in the new methodology. First, it can contribute or not to the beta parameter estimation. Second, the three-dimensional characteristics of the same pixel (echo top and VIL) have the same relevance as the accumulated rainfall. Furthermore, the rain intensity is decisive through the maximum daily reflectivity.
Finally, the results have a more direct operational application because the thresholds and the parameters of the radar and lightning are those used in real-time by meteorologists and hydro-meteorologists. Then, it results in a simpler understanding of the relationships between radar and lightning parameters than in previous studies.

5. Conclusions

This research combined three different methodologies in a unique technique. This combination allows a better knowledge of the relationship between lightning data and radar fields. The new method considers the strong points of each one of the previous techniques. First, it discriminates convective pixels in a daily accumulated rainfall field using a threshold. The difference with the original methodology is the use of lightning occurrence instead applying a threshold empirically, which needs a higher preliminary. Second, it analyses the relationship point-by-point between rainfall and CG flashes. In this case, the new technique uses linear fitting but is applied to each matrix cell instead of the general field. Finally, the new methodology considers volumetric radar fields as the thunderstorm life-cycle tracking did, instead of the original spatial analysis that only contemplated total rainfall. The new variables are VIL or echo tops, which provide volumetric information about the rain structures. Besides, we can compare flashes qualitatively with rainfall intensity using reflectivity fields.
We discriminated between three convective behaviors: slight, moderate, and strong. The first one occurs when few total daily precipitations in the whole area of interest contain few points with electrical activity. On the opposite, strong convection occurs when CG flashes take place in most of the rainy pixels. We identified the thresholds of the radar variables for each threshold and linear fitting. It is worth noting how the rate grows with the increase in the CG flashes number, which changes depending on the radar variable. On the contrary, the CG flashes number decreases when the convection behavior becomes stronger for CAP, MAX, and TOP, while the opposite occurs for VIL and RN1.
To conclude, we validated LJ warnings occurrence, which demonstrated a high relationship with deep convection. The results were similar, but the skill scores suggest a change in the beta thresholds, decreasing the current values. In any case, the methodology provides a new method of defining and characterizing the precipitation regimes. This is of high interest in dry areas such Catalonia, where the hydrologic management becomes complicated because of the high precipitation variability.

Author Contributions

Conceptualization, S.C. and T.R.; methodology, S.C. and T.R.; software, S.C. and T.R.; validation, T.R. and C.F.; formal analysis, T.R.; investigation, S.C.; writing—original draft preparation, S.C. and T.R.; writing—review and editing, T.R.; visualization, S.C. and T.R.; supervision, T.R. and C.F. All authors have read and agreed to the published version of the manuscript.

Funding

This research received no external funding.

Institutional Review Board Statement

Not applicable.

Informed Consent Statement

Not applicable.

Acknowledgments

The authors want to thank to the Meteorological Service of Catalonia for the provided data.

Conflicts of Interest

The authors declare no conflict of interest.

Abbreviations

The following abbreviations are used in this manuscript:
CGCloud-to-Ground flash
ICIntra-Cloud lightning
TLTotal Lightning
XRADCatalan Radar network
TOPEcho top detected by weather radar
VILVertical Integrated Liquid
MAXMaximum reflectivity
QPEQuantitative Precipitation Estimation
RN1Hourly QPE
EHIMIHidroMeteorlogical Integrated System-tool
LLSLightning Location System
VHFVery High Frequency
LFLow Frequency
LJLightning Jump
RasterRADRaster of radar product
RasterCGRaster generated with CG data

References

  1. Molinié, G.; Ceresetti, D.; Anquetin, S.; Creutin, J.D.; Boudevillain, B. Rainfall regime of a mountainous Mediterranean region: Statistical analysis at short time steps. J. Appl. Meteorol. Climatol. 2012, 51, 429–448. [Google Scholar] [CrossRef]
  2. Reiser, H.; Kutiel, H. Rainfall uncertainty in the Mediterranean: Dryness distribution. Theor. Appl. Climatol. 2010, 100, 123–135. [Google Scholar] [CrossRef]
  3. Tarolli, P.; Borga, M.; Morin, E.; Delrieu, G. Analysis of flash flood regimes in the North-Western and South-Eastern Mediterranean regions. Nat. Hazards Earth Syst. Sci. 2012, 12, 1255–1265. [Google Scholar] [CrossRef] [Green Version]
  4. Benabdelouahab, T.; Gadouali, F.; Boudhar, A.; Lebrini, Y.; Hadria, R.; Salhi, A. Analysis and trends of rainfall amounts and extreme events in the Western Mediterranean region. Theor. Appl. Climatol. 2020, 141, 309–320. [Google Scholar] [CrossRef]
  5. Llasat, M.C. An objective classification of rainfall events on the basis of their convective features: Application to rainfall intensity in the northeast of Spain. Int. J. Climatol. J. R. Meteorol. Soc. 2001, 21, 1385–1400. [Google Scholar] [CrossRef]
  6. Llasat, M.C.; del Moral, A.; Cortès, M.; Rigo, T. Convective precipitation trends in the Spanish Mediterranean region. Atmos. Res. 2021, 257, 105581. [Google Scholar] [CrossRef]
  7. Doswell, C.A.; Brooks, H.E.; Maddox, R.A. Flash flood forecasting: An ingredients-based methodology. Weather. Forecast. 1996, 11, 560–581. [Google Scholar] [CrossRef]
  8. Lopez-Bustins, J.A.; Pascual, D.; Pla, E.; Retana, J. Future variability of droughts in three Mediterranean catchments. Nat. Hazards 2013, 69, 1405–1421. [Google Scholar] [CrossRef]
  9. Barrera-Escoda, A.; Cunillera, J. Climate change projections for Catalonia (NE Iberian Peninsula). Part I: Regional climate modeling. Tethys 2011, 8, 75–87. [Google Scholar] [CrossRef]
  10. Pascual, D.; Pla, E.; Lopez-Bustins, J.A.; Retana, J.; Terradas, J. Impacts of climate change on water resources in the Mediterranean Basin: A case study in Catalonia, Spain. Hydrol. Sci. J. 2015, 60, 2132–2147. [Google Scholar] [CrossRef] [Green Version]
  11. Rigo, T.; Pineda, N.; Bech, J. Analysis of warm season thunderstorms using an object-oriented tracking method based on radar and total lightning data. Nat. Hazards Earth Syst. Sci. 2010, 10, 1881–1893. [Google Scholar] [CrossRef] [Green Version]
  12. Williams, E.; Boldi, B.; Matlin, A.; Weber, M.; Hodanish, S.; Sharp, D.; Goodman, S.; Raghavan, R.; Buechler, D. The behavior of total lightning activity in severe Florida thunderstorms. Atmos. Res. 1999, 51, 245–265. [Google Scholar] [CrossRef] [Green Version]
  13. Bech, J.; Pineda, N.; Rigo, T.; Aran, M. Remote sensing analysis of a Mediterranean thundersnow and low-altitude heavy snowfall event. Atmos. Res. 2013, 123, 305–322. [Google Scholar] [CrossRef]
  14. Bech, J.; Arús, J.; Castán, S.; Pineda, N.; Rigo, T.; Montanyà, J.; van der Velde, O. A study of the 21 March 2012 tornadic quasi linear convective system in Catalonia. Atmos. Res. 2015, 158, 192–209. [Google Scholar] [CrossRef]
  15. Pineda, N.; Rigo, T.; Montanyà, J.; van der Velde, O.A. Charge structure analysis of a severe hailstorm with predominantly positive cloud-to-ground lightning. Atmos. Res. 2016, 178, 31–44. [Google Scholar] [CrossRef]
  16. Holle, R.L.; Watson, A.I.; López, R.E.; Macgorman, D.R.; Ortiz, R.; Otto, W.D. The life cycle of lightning and severe weather in a 3–4 June 1985 PRE-STORM mesoscale convective system. Mon. Weather. Rev. 1994, 122, 1798–1808. [Google Scholar] [CrossRef] [Green Version]
  17. Williams, E.; Stanfill, S. The physical origin of the land-ocean contrast in lightning activity. C. R. Phys. 2002, 3, 1277–1292. [Google Scholar] [CrossRef]
  18. Darden, C.B.; Nadler, D.J.; Carcione, B.C.; Blakeslee, R.J.; Stano, G.T.; Buechler, D.E. Utilizing total lightning information to diagnose convective trends. Bull. Am. Meteorol. Soc. 2010, 91, 167–176. [Google Scholar] [CrossRef]
  19. Zhou, Y.; Qie, X.; Soula, S. A study of the relationship between cloud-to-ground lightning and precipitation in the convective weather system in China. Ann. Geophys. 2002, 20, 107–113. [Google Scholar] [CrossRef] [Green Version]
  20. Pineda, N.; Rigo, T.; Bech, J.; Soler, X. Lightning and precipitation relationship in summer thunderstorms: Case studies in the North Western Mediterranean region. Atmos. Res. 2007, 85, 159–170. [Google Scholar] [CrossRef]
  21. Carey, L.D.; Rutledge, S.A. The relationship between precipitation and lightning in tropical island convection: A C-band polarimetric radar study. Mon. Weather. Rev. 2000, 128, 2687–2710. [Google Scholar] [CrossRef] [Green Version]
  22. Sheridan, S.C.; Griffiths, J.F.; Orville, R.E. Warm season cloud-to-ground lightning–precipitation relationships in the south-central United States. Weather. Forecast. 1997, 12, 449–458. [Google Scholar] [CrossRef]
  23. Rigo, T.; Castillo, S. Evolution of Radar and Lightning Variables in Convective Events in Barcelona and Surroundings for the Period 2006–2020. Adv. Environ. Eng. Res. 2021, 2, 17. [Google Scholar] [CrossRef]
  24. Martín, A.; Romero, R.; De Luque, A.; Alonso, S.; Rigo, T.; Llasat, M. Sensitivities of a flash flood event over Catalonia: A numerical analysis. Mon. Weather. Rev. 2007, 135, 651–669. [Google Scholar] [CrossRef]
  25. del Moral, A.; Rigo, T.; Llasat, M.C. A radar-based centroid tracking algorithm for severe weather surveillance: Identifying split/merge processes in convective systems. Atmos. Res. 2018, 213, 110–120. [Google Scholar] [CrossRef]
  26. Romero, R.; Ramis, C.; Alonso, S. Numerical simulation of an extreme rainfall event in Catalonia: Role of orography and evaporation from the sea. Q. J. R. Meteorol. Soc. 1997, 123, 537–559. [Google Scholar] [CrossRef]
  27. Llasat, M.C.; Rigo, T.; Montes, J.M. Orographic role in the temporal and spatial distribution of precipitation. The case of the internal basins of Catalonia (Spain). In Proceedings of the EGS Plinius Conference, Maratea, Italy, 14–16 October 2000; pp. 41–55. [Google Scholar]
  28. Ceperuelo, M.; Rigo, T.; Llasat, M.D.C.; Sánchez, J.L. Improving hail identification in the Ebro Valley region using radar observations: Probability equations and warning thresholds. Atmos. Res. 2009, 93, 474–482. [Google Scholar]
  29. Sánchez, J.; Fernández, M.; Fernández, J.; Tuduri, E.; Ramis, C. Analysis of mesoscale convective systems with hail precipitation. Atmos. Res. 2003, 67, 573–588. [Google Scholar] [CrossRef]
  30. Aran, M.; Sairouni, A.; Bech, J.; Toda, J.; Rigo, T.; Cunillera, J.; Moré, J. Pilot project for intensive surveillance of hail events in Terres de Ponent (Lleida). Atmos. Res. 2007, 83, 315–335. [Google Scholar] [CrossRef]
  31. Pineda, N.; Montanyà, J. Lightning detection in Spain: The particular case of Catalonia. In Lightning: Principles, Instruments and Applications; Springer: New York, NY, USA, 2009; pp. 161–185. ISBN 978-1-4020-9078-3. [Google Scholar]
  32. Ballart, D.; Figuerola, F.; Aran, M.; Rigo, T. Analysis of warm convective rain events in Catalonia. In Proceedings of the 11th Plinius Conference on Mediterranean Storms, Barcelona, Spain, 7–10 September 2009; Available online: http://meetings.copernicus.org/plinius11 (accessed on 12 April 2021).
  33. Martın, F.; Carretero, O. Tropical-like heavy convective rains over the Spanish Mediterranean regions: A radar-based perspective. In Proceedings of the 30th International Conference on Radar Meteorology, Munich, Germany, 19–24 July 2001; pp. 18–24. [Google Scholar]
  34. Ramis, C.; López, J.M.; Arús, J. Two cases of severe weather in Catalonia (Spain). A diagnostic study. Meteorol. Appl. 1999, 6, 11–27. [Google Scholar] [CrossRef] [Green Version]
  35. Farnell, C.; Rigo, T.; Pineda, N. Lightning jump as a nowcast predictor: Application to severe weather events in Catalonia. Atmos. Res. 2017, 183, 130–141. [Google Scholar] [CrossRef]
  36. Zipser, E.J. Deep cumulonimbus cloud systems in the tropics with and without lightning. Mon. Weather. Rev. 1994, 122, 1837–1851. [Google Scholar] [CrossRef]
  37. Barnolas, M.; Rigo, T.; Llasat, M. Characteristics of 2-D convective structures in Catalonia (NE Spain): An analysis using radar data and GIS. Hydrol. Earth Syst. Sci. 2010, 14, 129–139. [Google Scholar] [CrossRef] [Green Version]
  38. Sempere-Torres, D.; Sanchez-Diezma, R.; Zawadzki, I.; Creutin, J. Identification of stratiform and convective areas using radar data with application to the improvement of DSD analysis and ZR relations. Phys. Chem. Earth Part B Hydrol. Ocean. Atmos. 2000, 25, 985–990. [Google Scholar] [CrossRef]
  39. Pineda, N.; Rigo, T. The rainfall factor in lightning-ignited wildfires in Catalonia. Agric. For. Meteorol. 2017, 239, 249–263. [Google Scholar] [CrossRef]
  40. Llasat, M.C.; Marcos, R.; Turco, M.; Gilabert, J.; Llasat-Botija, M. Trends in flash flood events versus convective precipitation in the Mediterranean region: The case of Catalonia. J. Hydrol. 2016, 541, 24–37. [Google Scholar] [CrossRef] [Green Version]
  41. Altube, P.; Bech, J.; Argemí, O.; Rigo, T. Quality control of antenna alignment and receiver calibration using the sun: Adaptation to midrange weather radar observations at low elevation angles. J. Atmos. Ocean. Technol. 2015, 32, 927–942. [Google Scholar] [CrossRef] [Green Version]
  42. Trapero, L.; Bech, J.; Rigo, T.; Pineda, N.; Forcadell, D. Uncertainty of precipitation estimates in convective events by the Meteorological Service of Catalonia radar network. Atmos. Res. 2009, 93, 408–418. [Google Scholar] [CrossRef]
  43. Rigo, T.; Berenguer, M.; del Carmen Llasat, M. An improved analysis of mesoscale convective systems in the western Mediterranean using weather radar. Atmos. Res. 2019, 227, 147–156. [Google Scholar] [CrossRef]
  44. Novak, P.; Kracmar, J. Exploiting 3D volume data from the Czech weather radar network. Phys. Chem. Earth Part B Hydrol. Ocean. Atmos. 2000, 25, 1163–1168. [Google Scholar] [CrossRef]
  45. Rigo, T.; Llasat, M.C.; Esbrí, L. The Results of Applying Different Methodologies to 10 Years of Quantitative Precipitation Estimation in Catalonia Using Weather Radar. Geomatics 2021, 1, 347–368. [Google Scholar] [CrossRef]
  46. Lakshmanan, V.; Hondl, K.; Potvin, C.K.; Preignitz, D. An improved method for estimating radar echo-top height. Weather. Forecast. 2013, 28, 481–488. [Google Scholar] [CrossRef]
  47. Farnell, C.; Rigo, T.; Heymsfield, A. Shape of hail and its thermodynamic characteristics related to records in Catalonia. Atmos. Res. 2022, 271, 106098. [Google Scholar] [CrossRef]
  48. Rigo, T.; Pineda, N. Inferring the severity of a multicell thunderstorm evolving to supercell, by means of radar and total lightning. Electron. J. Sev. Storms Meteorol. 2016, 11, 1–27. [Google Scholar]
  49. Montanyà, J. Annual Report on the Performance of the Lightning Location System Operated by the Meteorological Service of Catalonia. Intern. Tech. Rep. 2014; not published. [Google Scholar]
  50. Rigo, T.; Farnell, C. Characterisation of Thunderstorms with Multiple Lightning Jumps. Atmosphere 2022, 13, 171. [Google Scholar] [CrossRef]
Figure 1. (Left) Map of the area of analysis marked by the black rectangle. The red dots indicate the positions of the weather radars, while yellow dots mark locations of lightning location sensors. (Right) The main topographic factors of the region.
Atmosphere 13 00808 g001
Figure 2. From left to right and top to bottom: Map of the number of days without precipitation (below 0.1 mm) for the period of 2013–2021; the same as that of the previous but for days with precipitation over 10 mm and for days with precipitation over 50 mm; days with cloud-to-ground flashes.
Atmosphere 13 00808 g002
Figure 3. Scheme of the procedure considered in the research.
Atmosphere 13 00808 g003
Figure 4. (a) Daily evolution of the beta parameter estimated with radar and lightning data for the period 2013–2021. Yellow and red horizontal dotted lines indicate the thresholds for the different types of convective regime (slightly, moderately, and strongly convection). (b) Monthly distribution of moderately and strongly convective days ( β 0.3). (c) The same as (b) only for strongly convective days.
Atmosphere 13 00808 g004
Figure 5. Daily maps of the different radar parameters (CAP, MAX, TOP, VIL, and RN1) and CG density for the day of 22 October 2019.
Atmosphere 13 00808 g005
Figure 6. Daily evolution of the correlated parameter estimated for all the different radar parameters (Cap, Max, Top, Vil, and Rn1) and lightning data for the period 2013–2021.
Atmosphere 13 00808 g006
Figure 7. Scatterplots of CAP, MAX, TOP, and VIL in front of CG density for the same case of Figure 5. Red lines indicate the linear regression, while the equation at the bottom-right of each panel shows the coefficients for each variable.
Atmosphere 13 00808 g007
Figure 8. Left column: A parameter of the linear regression equation boxplot for the three convective degrees (green: slightly, blue: moderately, red: strongly) for CAP, TOP, MAX, VIL, and RN1. Right column: the same but for B parameter.
Atmosphere 13 00808 g008
Figure 9. Monthly distribution of convective days according to the occurrence of LJ warnings in Catalonia.
Atmosphere 13 00808 g009
Table 1. Skill scores (Probability of Detection, POD; False Alarm Rate, FAR; and Critical Success Index, CSI) and the correspondent equation for each case (OF = Observation + Forecast, Of = Observation + NOForecast, oF = NOObservation + FORECAST).
Skill Score Equation
PODOF/(OF + Of)
FARoF/(OF + oF)
CSIOF/(OF + Of + oF)
Table 2. Correlation coefficient and beta parameter for the different radar variables in front of CG density for the case of 22 October 2019.
ParameterCorrelation
CAP0.128
MAX0.114
RN10.213
TOP0.101
VIL0.118
BETA0.835
Table 3. Bottom and top limits of the boxplots of “a” parameter shown in Figure 8, compared with the obtained for the days with LJ.
Radar Variable β > 0 β > 0.3 β > 0.8LJ
CAP (dBZ)37.25–43.9143.05–46.4944.95–47.6643.13–46.81
TOP (km)2.98–5.375.33–7.316.87–8.295.65–7.58
MAX (dBZ)36.07–42.1941.78–45.0543.82–46.0942.09–45.35
VIL (mm)1.59–4.284.50–8.316.86–9.894.64–8.53
RN1 (mm)5.36–14.8210.59–17.8913.56–19.2110.77–18.57
Table 4. Skill scores (POD, FAR, and CSI) for the beta parameter, considering the thresholds for the moderate and strong convection (left) and only strong convection (right).
Skill ScoreModerate and StrongStrong
POD0.980.66
CSI0.960.50
FAR0.700.29
Publisher’s Note: MDPI stays neutral with regard to jurisdictional claims in published maps and institutional affiliations.

