1. Introduction
Affected by human activities and buildings, the deterioration of the outdoor thermal environment runs counter to people′s requirements for the comfort and health of outdoor activities. The problem of the urban thermal environment has attracted extensive attention of the public. More and more researchers focus on the thermal environment and thermal comfort of the outdoor space.
To create a comfortable and healthy outdoor environment, we must first better evaluate outdoor thermal comfort. Mean radiant temperature (Tmrt), as a quantitative index of the effect of environmental radiation on human body, is widely used in the study of outdoor thermal environment and thermal comfort [
1,
2,
3]. Existing research [
4] has proved that half of the thermal comfort is driven by the radiant heat exchange between people and the environment. The mean radiation temperature is essential to understand this relationship. In the past 10 years, the number of studies on publications referring to the mean radiation temperature of the outdoor environment has been increasing [
5]. Juan A. Acero [
6] evaluated the influence of building shadow in the daily cycle of mean radiation temperature in different seasons through experiments. Nurnida Elmira Othman [
7] found that participants′ outdoor thermal feeling and preference voting were closely related to the mean radiation temperature. As the input value of evaluating outdoor thermal comfort conditions, the mean radiation temperature has become a widely used index of outdoor thermal environment. For outdoor thermal environment researchers, the accurate introduction of Tmrt will be an important topic in future research.
At present, there are two main methods to determine the mean radiation temperature of outdoor environment: six-direction radiation method and globe-thermometer method. Most researchers believe that the outdoor environment Tmrt determined by the six-direction radiation method is the most accurate description of the study area [
8]. However, the equipment used is expensive and less portable. This makes the globe-thermometer method, which is cheap and easy to operate, widely used by researchers to obtain the outdoor mean radiation temperature [
9,
10,
11,
12]. In the existing research, more than half of the mean radiation temperature is obtained by the globe temperature method. However, the relative inaccuracy of the results of the black bulb thermometer has been verified by many scholars. Compared with the six-direction radiation method, the black bulb thermometer is susceptible to fluctuations of the external environment, especially in some specific scenes where the error is larger, and the scope of application is limited.
Scholars at home and abroad have carried out a lot of research work on the measurement of outdoor radiation. Some researchers have questioned the accuracy of the results of the globe-thermometer method based on the six-direction radiation method [
13] and carried out a preliminary study. Firstly, some researchers modified the globe-thermometer method by comparing the measured results of the six-direction radiation method and the globe-thermometer method. In 2007, Thorsson [
14] conducted a five-day comparative test of the six-direction radiation method and the globe-thermometer method in the square of Gothenburg, Sweden. It was found that the results obtained by the globe-thermometer method were lower in sunny weather and higher in cloudy weather in summer. In autumn, the results of the globe-thermometer method are generally lower. The results of the six-direction radiation method are compared with the results of the globe-thermometer method, and the coefficients are corrected. In 2020, Henning Staiger [
15] experimentally examined how the circumsolar anisotropy in the diffuse SW irradiance affects Tmrt. The results show that outdoors during the daytime, Tmrt is unable to serve as an appropriate input for the calculation of rational-based thermal indices. In 2013, Tan [
16] conducted a four-month test in Singapore to obtain Tmrt results under clear weather conditions at multiple measuring points. The results show that the test results of the globe-thermometer method are lower in the daytime, and the maximum difference is close to 40 °C. However, the result of the globe-thermometer method is slightly higher at night. In 2010, Chen et al. [
17] comparative test results in Freiburg, Germany, showed that the results of the globe-thermometer method are generally higher than those of the six-direction radiation method, and the gap is more than 10 °C. It was pointed out that, if the wind speed of the experimental data is substituted into a low-speed and stable value (0.5 m/s), the results obtained by the globe-thermometer method will have a higher correlation with the results obtained by the six-direction radiation method. In 2015, Kántor et al. [
18] studied the accuracy of Tmrt results in the Taiwan area. It is considered that the Tmrt results obtained by the globe-thermometer method on clear days were overestimated; the difference between the results of the two methods under cloudy days was not significant, but the data fluctuated sharply.
On the other hand, some researchers have researched the structure of the black bulb thermometer, aiming at improving the response time of the black bulb thermometer to improve the accuracy of calculating the mean radiation temperature. Khrit [
19] conducted experiments in Malaysia by using two copper hollow spheres with diameters of 50 and 150 mm. Compared with the six-direction radiation method, we see that that the results of the black bulb thermometer with a smaller diameter respond faster, but the results fluctuate more when the radiation and wind speed change rapidly. This is similar to the findings of Nikolopoulou [
20]. Thorsson [
14] recommended using an acrylic hollow sphere with a diameter of 40 mm as the spherical shell of the black bulb thermometer through actual measurement; this method has been adopted by some scholars in recent years [
21]. However, in 2015, Wang [
22], through the comparative experiments of various spherical shells indoors and outdoors, found that the thermal conductivity of acrylic spherical shells is relatively lower, and the sunlight can penetrate the shell, significantly impacting the results of black globe temperature. It is suggested that the black bulb thermometer with a spherical metal shell should be used outdoors.
To sum up, although the current research has some exploration for the black bulb thermometer test, the accuracy of the Tmrt results obtained by the black bulb thermometer is related to what factors, and the degree of influence has not been verified. As far as the current research is concerned, the experimental conditions are not comprehensive, and the scope of application of the black bulb thermometer is relatively general. At the same time, the correction methods proposed for the globe thermometer method mainly focus on the transformation of the structure of the black bulb thermometer, as well as a small number of correction formulas that are difficult to be applied to other regions, except for the region where the proposer is located. Moreover, the further influence of the mean radiation temperature obtained by the globe-thermometer method on the subsequent thermal comfort index has not been studied by scholars. At the same time, the existing thermal comfort evaluation model integrates all the factors affecting radiation heat transfer into a single index of the mean radiation temperature obtained by the six-direction radiation method or the globe-thermometer method. It is difficult to accurately express the objective law of human thermal sensation and overall thermal comfort.
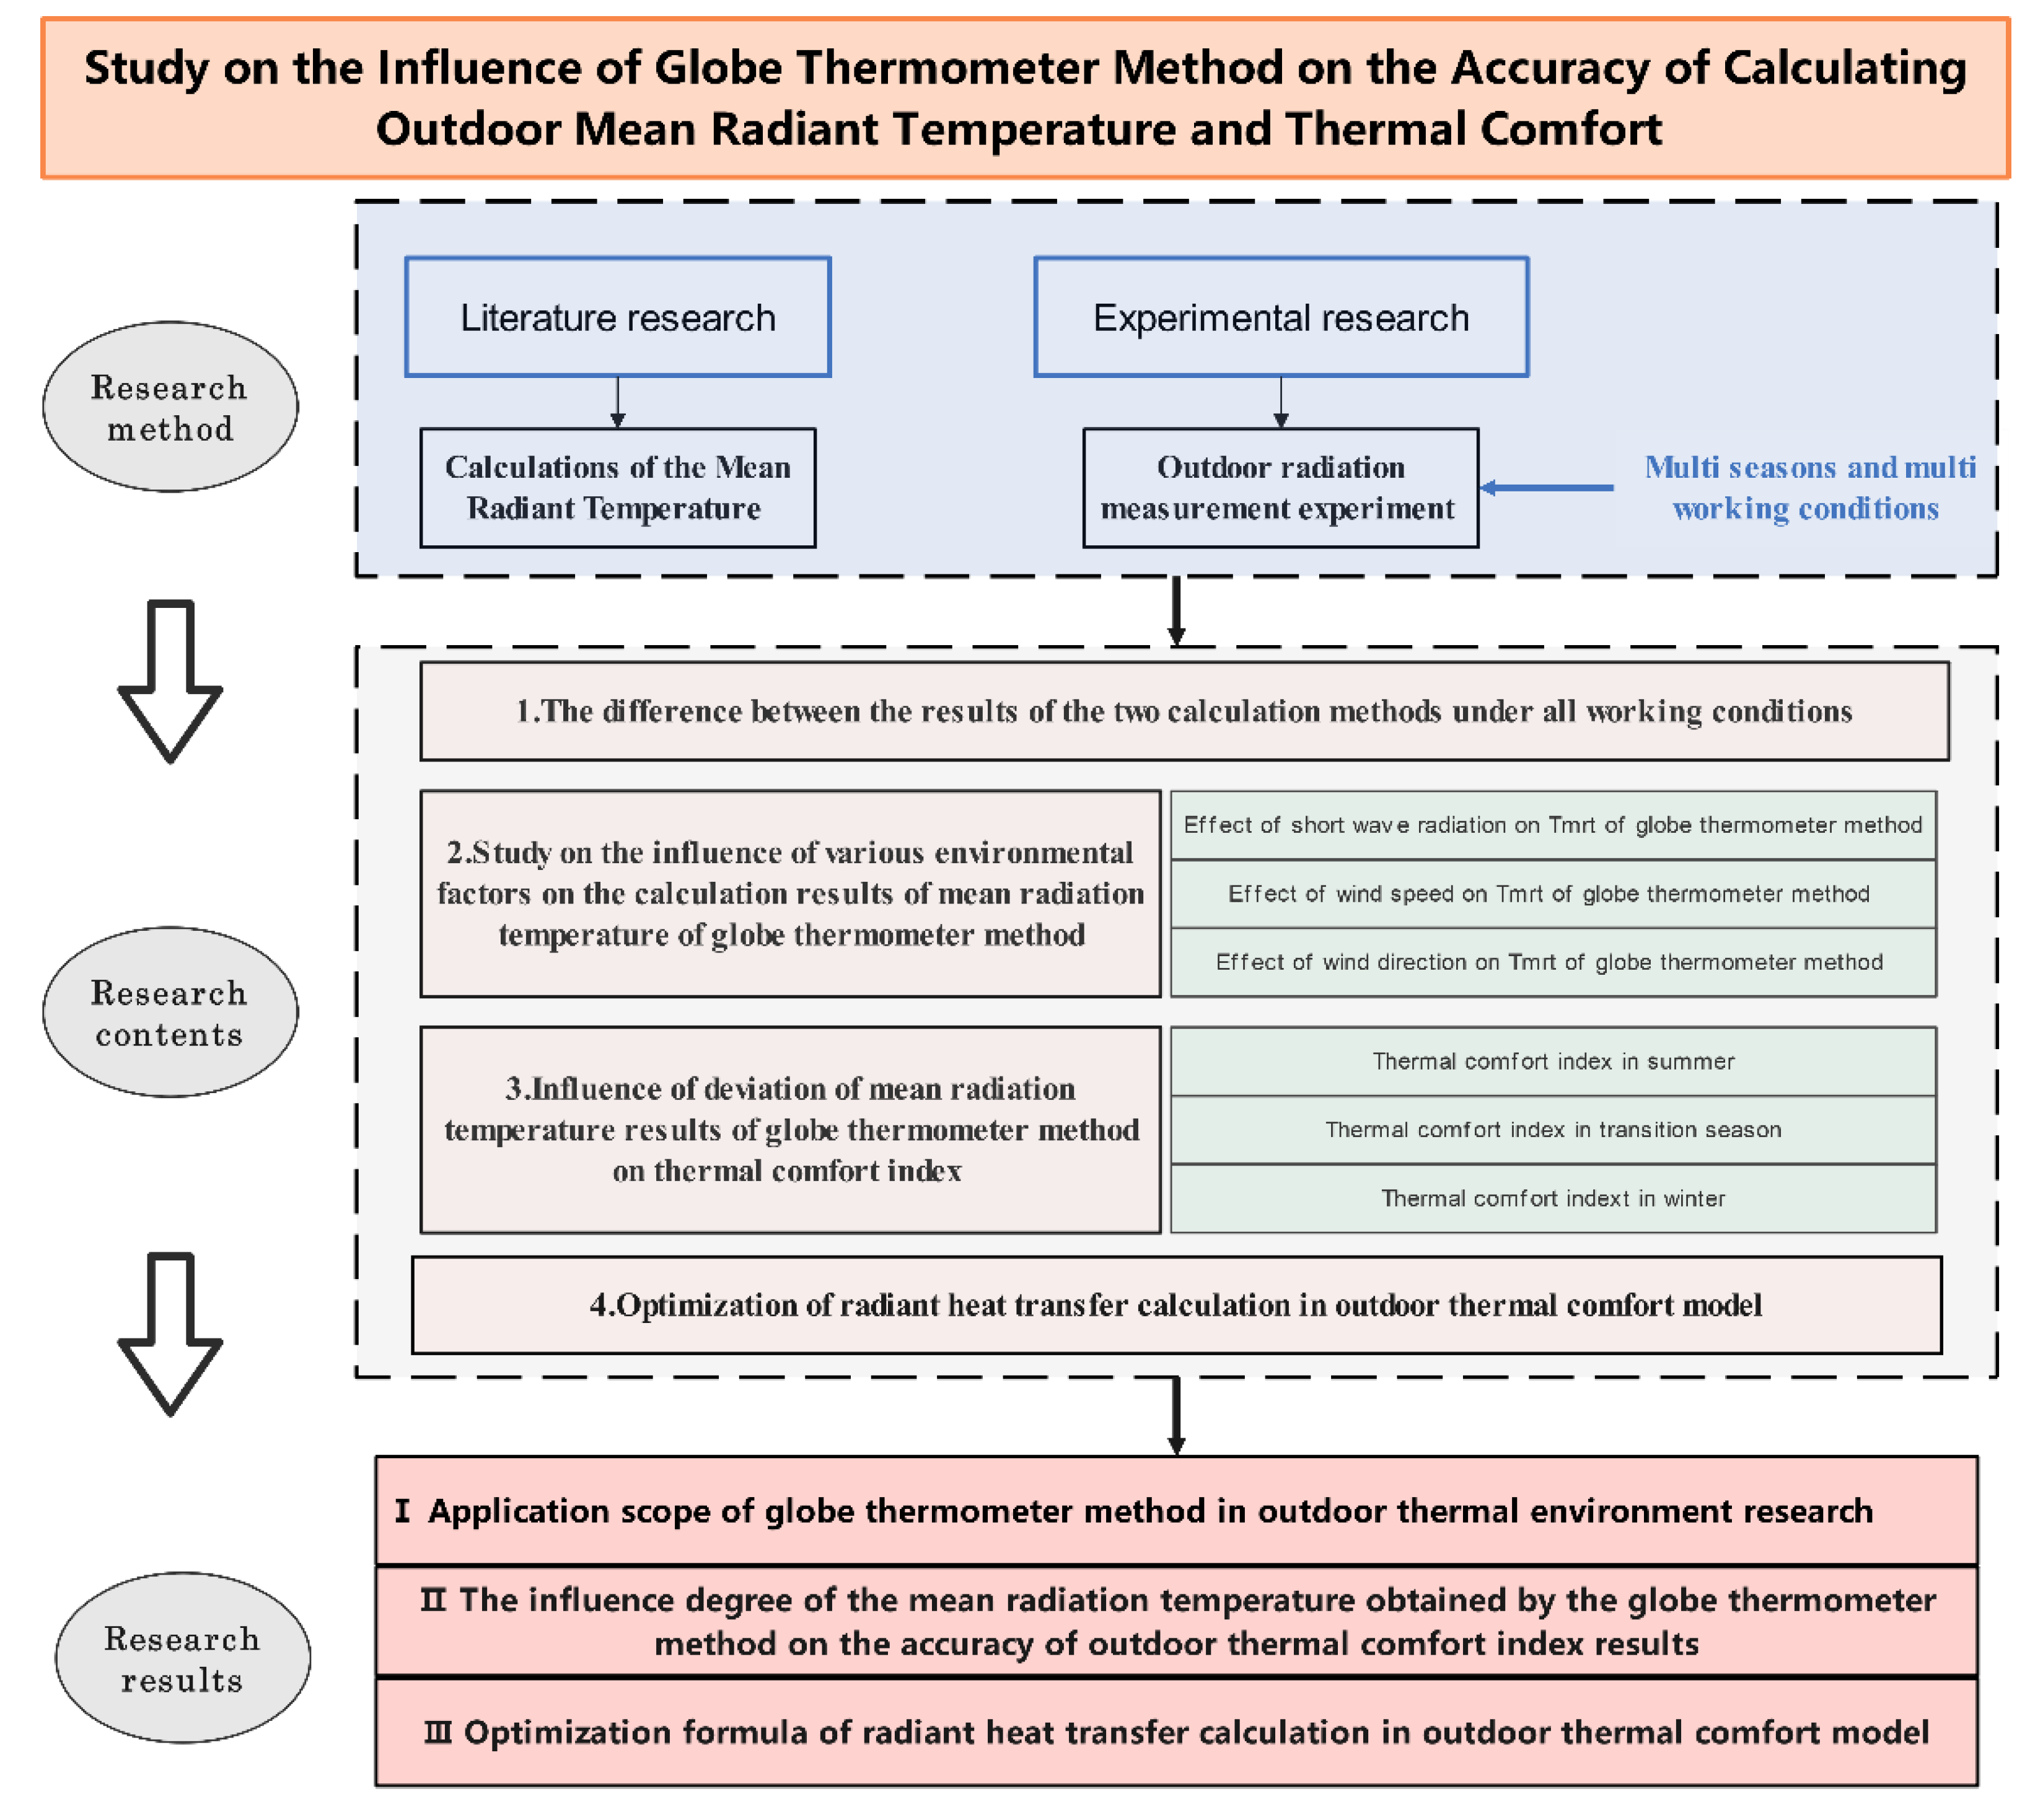
The research and optimization of the accuracy of the globe thermometer method, which is widely used to obtain the average radiation temperature, will mean a more scientific and more rigorous conclusion in the field of thermal comfort. Therefore, the main purposes of this study were to (1) study the accuracy and application range of black bulb thermometer under different meteorological parameters; (2) further analyze the influence of the average radiation temperature obtained by the globe-thermometer method on the accuracy of the results of thermal comfort index in each season; and (3) considering the anisotropy of radiation in principle, propose a universal optimization method for radiation heat transfer calculation for the model that only uses a single index such as mean radiant temperature or black ball temperature. We hope to make it more rigorous in the complex outdoor radiation environment assessment in the future. The specific research route is shown in
Figure 1, below.
2. Materials and Methods
In this study, outdoor test sites were selected to test the mean radiation temperature by multiple methods, and the statistical results of six-direction radiation method and globe-thermometer method under different working conditions were collected for further research. This section first introduces the selection of the experimental site and the experimental scheme and then introduces two methods used to quantify the outdoor thermal radiation field.
2.1. Study Area
This study was conducted in Tianjin. According to the regulations of China′s building climate zoning, Tianjin is in cold areas with four distinct seasons. The air temperature varies from −13.9 to 36.9 °C. The average air temperature is the highest in July and the lowest in January. The monsoon prevails, the annual average wind speed is 2–4 m/s, and the sunshine hours are long.
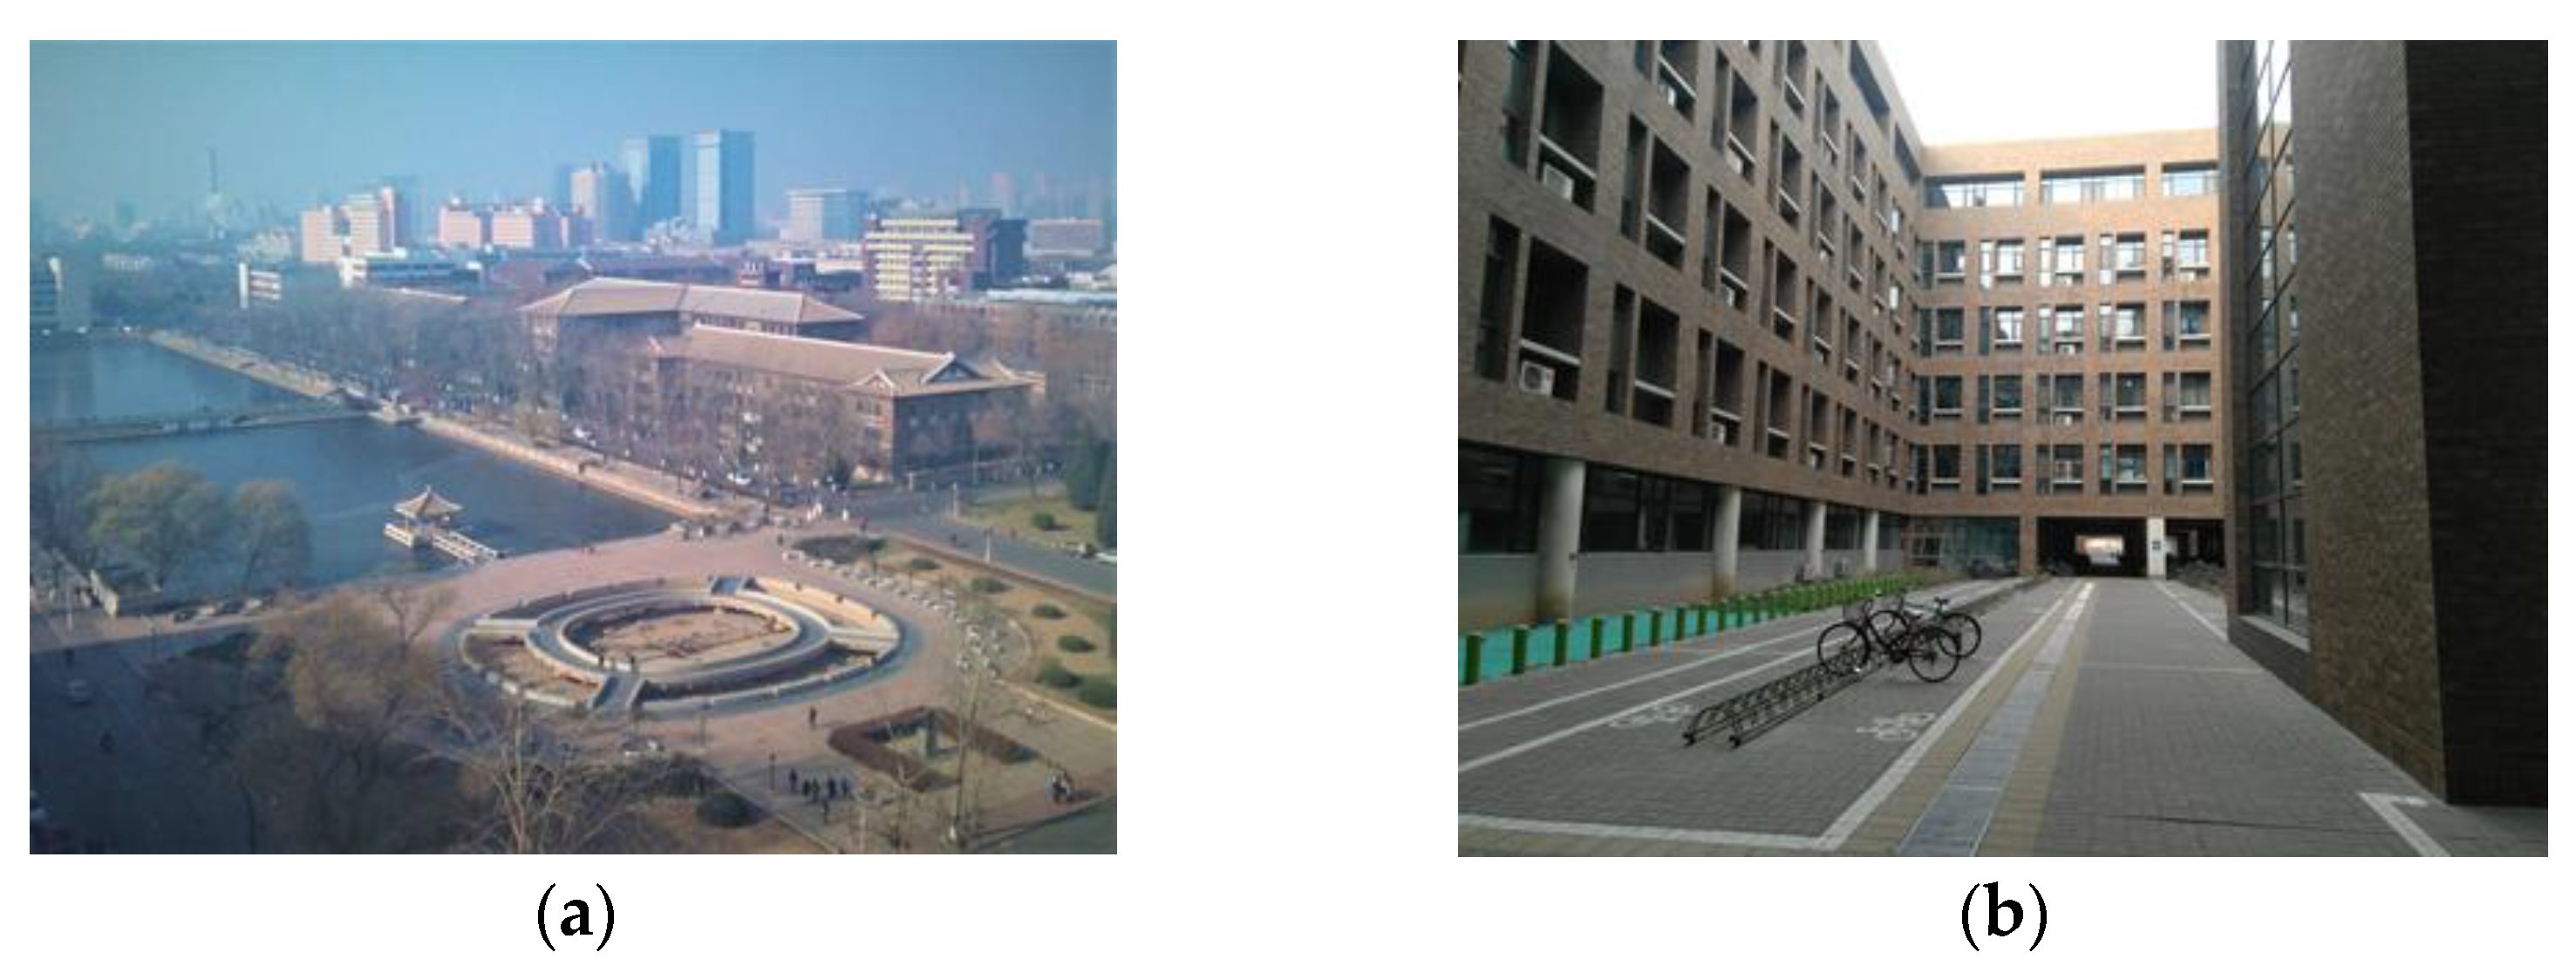
The experimental site was selected in Beiyang Square of Tianjin University and the atrium of Block C of Teaching Building 26, as shown in
Figure 2. The former is the largest square in the campus, and the main body includes the central fountain and the surrounding low shrubs. The square is paved with red bricks and stones, covered by buildings in its south and north directions, with lakes in the west and open in the east. The overall terrain is open. The atrium of Block C of Teaching Building 26 is located in the south of Tianjin University, surrounded by buildings on all sides. The building surface is brown masonry, and the atrium floor is gray masonry. The two selected sites represent high and low sky-view factors (SVF) and are intended to capture radiometric variability data for multiple conditions. The SVT of Beiyang Square of Tianjin University is about 0.98, which can receive sufficient solar radiation. The atrium area is small, and the SVF value in this area is low due to the long-term shelter of buildings and trees [
23,
24]; the SVF is about 0.36.
2.2. Experiment Procedure
2.2.1. Experimental Conditions
The purpose of this experiment was to compare the mean radiation temperature obtained by the six-direction radiation method and the globe-thermometer method in the outdoor radiation environment of various working conditions throughout the year and to explore the scope of application of the globe-thermometer method. The coverage of the experiment needs to be extensive. Therefore, the following experimental scheme is formulated: radiation observation experiments are carried out in spring, summer, autumn, and winter, and the test time of each experiment is a whole day. Tests under multiple weather conditions were carried out at the two selected locations to obtain a comprehensive radiation change condition as far as possible.
According to the above experimental requirements, a total of 17 experiments were conducted from 31 July 2018 to 24 August 2019, and the radiation test time was mainly 7:00 a.m. By 17:00 p.m., the test spanned spring, summer, autumn, and winter. The test was conducted in sunny and cloudy weather conditions in each season. The test site included Beiyang Square of Tianjin University with open terrain and the atrium of Block C of Teaching Building 26 with relatively closed terrain. Specific experimental measurement dates and environmental information are shown in
Table 1.
2.2.2. Data Acquisition
The meteorological parameters such as air temperature, wind speed, black globe temperature, shortwave radiation, and longwave radiation were measured under various working conditions in this experiment which were used to calculate the outdoor mean radiation temperature and analyze the influence of meteorological factors on the error.
In the outdoor environment, the wind is protean. In order to analyze the influence of instantaneous wind speed on the results of the black bulb thermometer, it is considered that the shortwave radiation and air temperature generally do not change abruptly in clear weather in all parameters. In order to reduce the complexity of the data, the shortwave radiation and air temperature obtained in the experiment were divided into several intervals. The variation of black bulb thermometer results with wind speed in different intervals was analyzed. At the same time, a separate experiment should be designed to analyze the variable of wind direction to verify the influence of different wind directions on the results of the black bulb thermometer. On the campus of Tianjin University, the west side of the 23rd teaching building was selected as the experimental site. The SVF of this area is about 0.52. It is backed by buildings, with dense vegetation planting, which has obvious shielding against outdoor wind. According to the weather forecast, choose a sunny and windless day for the experiment. Select the test time from 12:00 to 14:00. Under the condition that the outside wind speed less than 0.1 m/s is almost zero, a small fan is used to provide the required wind speed for the experiment to the black ball. In the experiment, to ensure that the test instrument is less disturbed, the instrument is located at the height of 1.1 m. Two black bulb thermometers were used in the experiment, and the two black bulb thermometers were placed at an interval of 1 m. A fan was placed on the south side of one black bulb thermometer, and a fan was placed on the north side of the other black bulb thermometer, all of which were fixed by a tripod. The fans provided a wind speed of about 1.5 m/s, and the wind speed before the black ball and the temperature of the black ball were recorded at a sampling interval of 5 min. At the same time, the surface temperature of two black bulb thermometers was recorded by an infrared thermal imager.
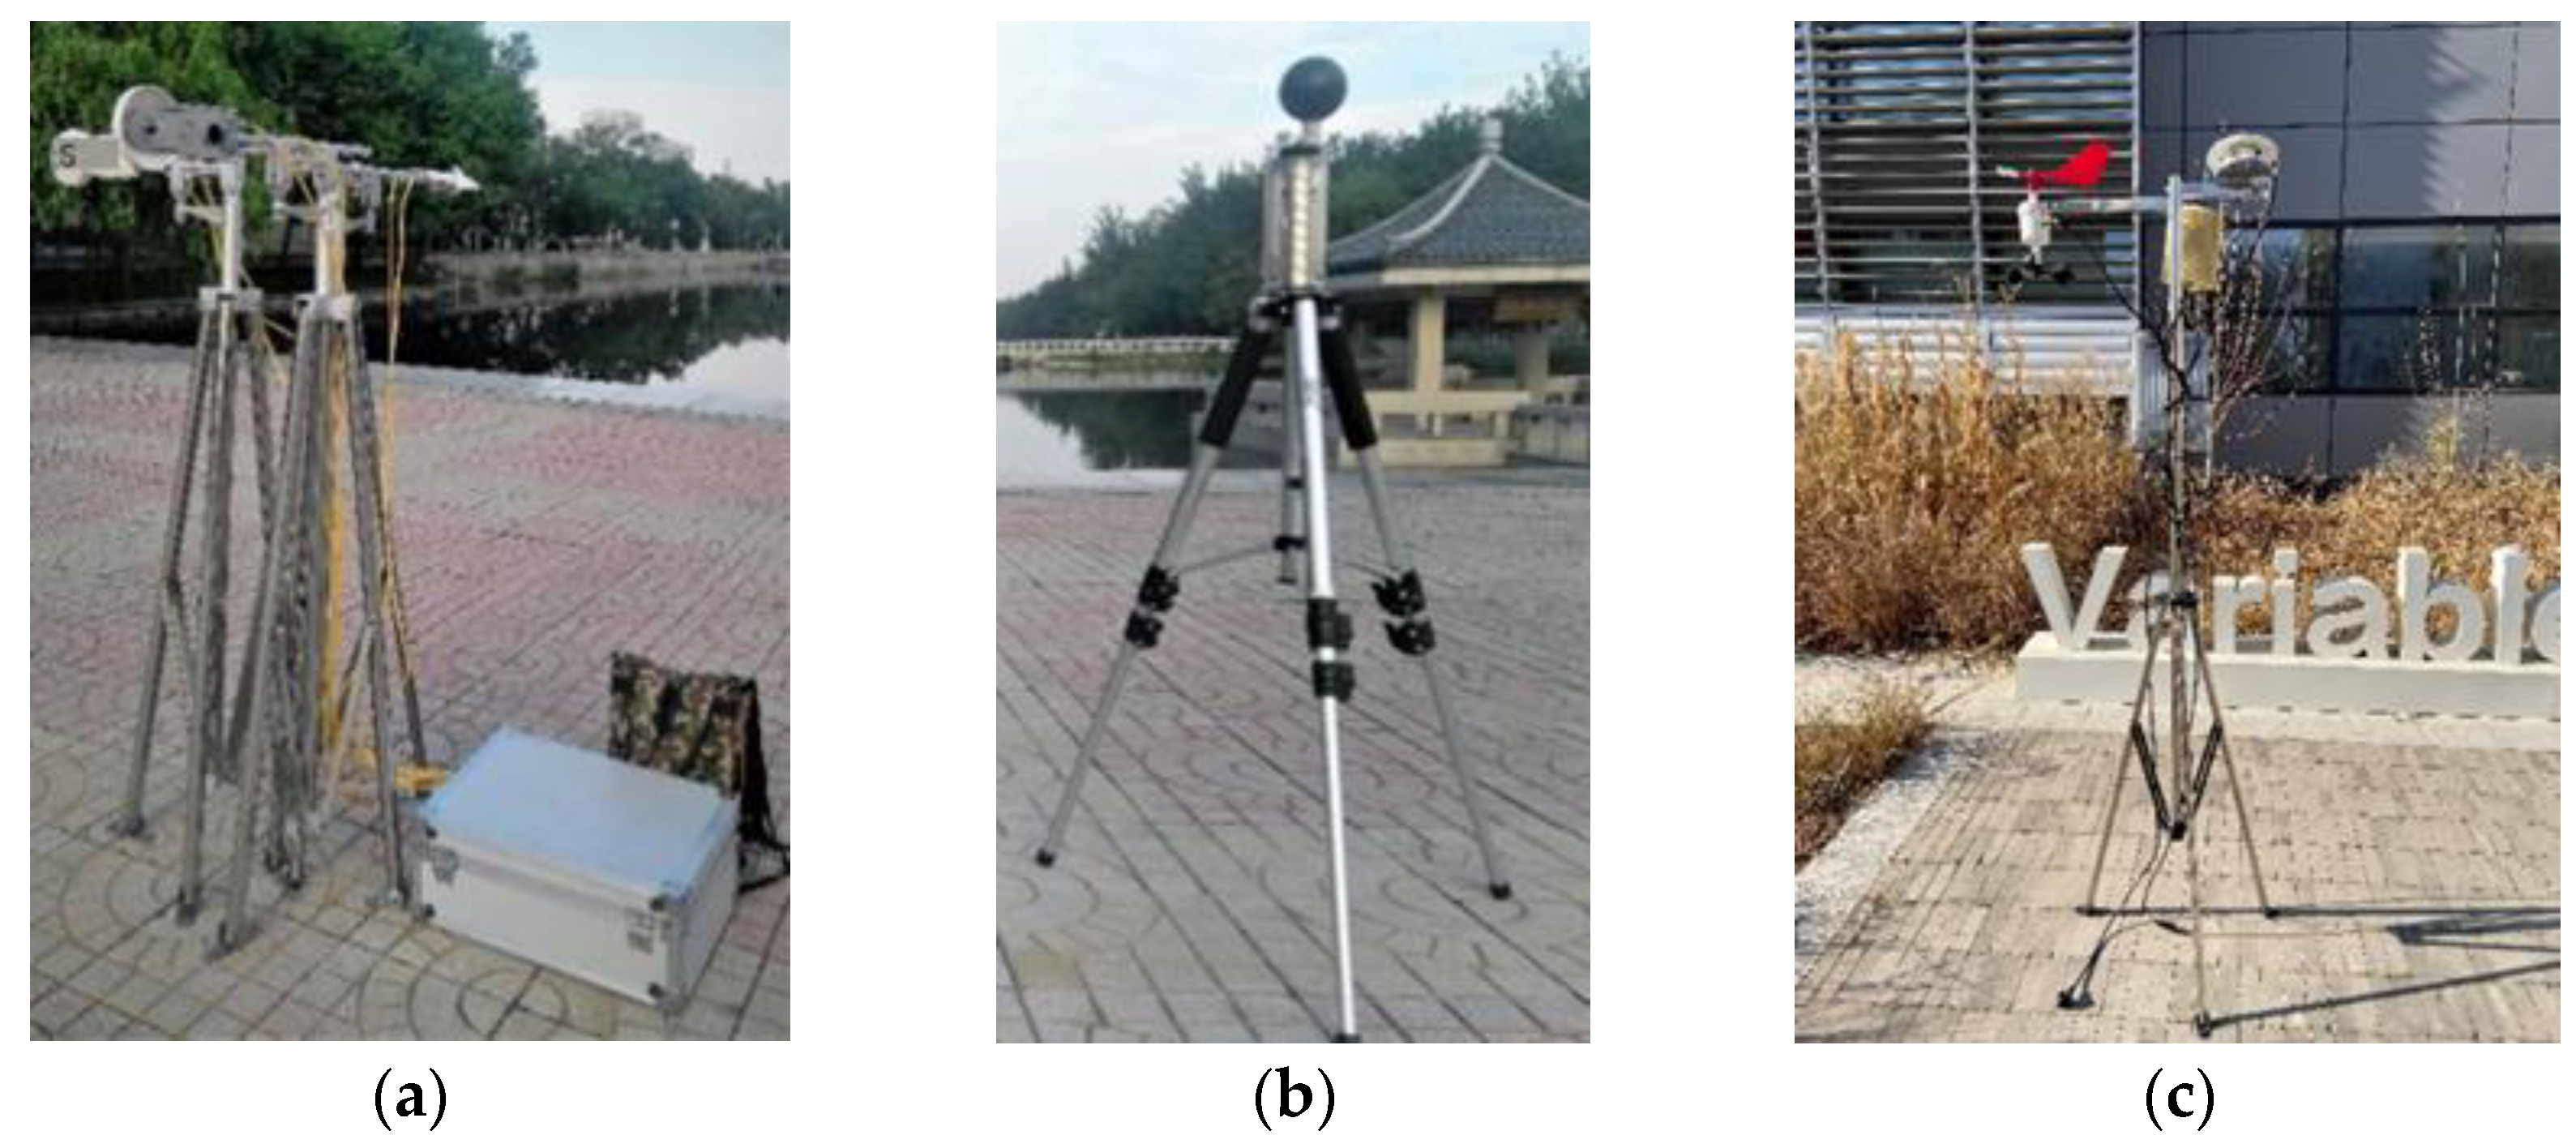
The instruments used for meteorological data acquisition are shown in
Figure 3 and
Table 2. The instrument was placed in the center of the test site. The air temperature, relative humidity, and wind speed were recorded by the meteorological station. The temperature-and-humidity sensor was 1.5 m away from the ground and in the shade, according to the measurement regulations; due to the height limit of the meteorological station equipment used, the wind-speed sensor was placed as high as possible, and the height was 1.8 m. Moreover, the sampling interval of each parameter was 1 min. The shortwave and longwave radiations were measured by a four-component radiometer at a height of 1.1 m. Corresponding to the average height of the center of gravity of adults, the sampling interval was 1 min. It is worth noting that three four-component radiometers were set up to be perpendicular to each other, measuring radiation from north and south, east and west, and up and down simultaneously, and recording a complete set of three-dimensional radiation data. The shell of the black bulb thermometer was made of copper, with a diameter of 70 mm; the test height was 1.1 m, and the data sampling interval was 5 min.
2.3. Calculations of the Mean Radiant Temperature
(1) Six-direction radiation method
Firstly, according to Formula (1), the average radiation flux density (S
str) of the human body is calculated by substituting the measured longwave–shortwave radiation quantity in six directions and the corresponding angle coefficient between the human body and the environment:
where K
i is the shortwave radiation flux (i = 1–6) in W/m
2; L
i is the longwave radiation flux (i = 1–6) in W/m
2; F
i is the angle factor between the person and the environmental surface (i = 1–6); α
k is the shortwave radiation absorption coefficient; and ε
p is the emissivity of the human body, which is theoretically equal to the absorption coefficient of longwave radiation.
The determination of the angle factor, Fi, depends on the position and orientation of the person, and Fi for the four horizontal orientations is set to 0.22 for a standing or walking person. Fi is set to 0.06 for the upper and lower hemispheres. For the sphere, Fi was set to 0.167 in each of the six directions.
After S
str is obtained by Equation (1), Tmrt is obtained by the Stefan–Boltzmann law:
where σ is the Stefan–Boltzmann constant (5.67 × 10
−8 W/(m
−2·K
−4)).
The Tmrt obtained by the six-direction radiation method is, by far, the most accurate method. In this study, the Tmrt obtained by the six-direction radiation method was used as a reference to evaluate the results of the black bulb thermometer.
(2) Globe-thermometer method
The black bulb thermometer is mainly composed of a hollow thin shell covered with a black coating. The temperature measuring point is located in the center of the spherical shell, and the measured result is the black globe temperature. According to the theory, the black ball reaches a thermal equilibrium state in the environment under the combined action of air convection heat transfer and ambient radiation heat transfer. At this time, Tmrt can be calculated according to the fact that the convective heat exchange is approximately equal to the radiation heat exchange.
When equilibrium is reached, the thermal equilibrium state of the black sphere can be expressed as follows:
where h
cg is the convective heat transfer coefficient at the horizontal height of the black ball, W/(m
2·K); σ is the Stefan–Boltzmann constant (5.67 × 10
−8 W/(m
−2·K
−4)); T
g is the black globe temperature in °C; and T
a is the air temperature in °C.
Accordingly, that expression of Tmrt under forced convection has been adopted by many researchers, and, at present, it can be obtained as follows:
where D is the diameter of the black sphere in m; ε
g is the surface emissivity of the black sphere; and V
a is the wind speed at the height of the black sphere in m/s.
2.4. Calculation of Thermal Comfort Evaluation Index
In this study, physiological equivalent temperature (PET) was selected as the evaluation index of thermal comfort [
25]. PET comprehensively considers the effects of main meteorological parameters, activities, clothing, and individual parameters on thermal comfort. It is a thermal comfort evaluation index derived from MEMI model. The thermal comfort evaluation index used in the study was calculated by Rayman software, and the physical parameters needed to be inputted included air temperature, wind speed, relative humidity, and mean radiation temperature. Individual parameters included age, gender, height, weight, metabolic rate, and clothing thermal resistance. During data input, all inputs were consistent, except for Tmrt. PET (s) and PET (g) were calculated by inputting Tmrt obtained by the six-direction radiation method and the globe-thermometer method, respectively. As shown in
Table 3, referring to Lai′s outdoor thermal comfort evaluation model in the Tianjin area [
26], the corresponding thermal sensory results TSV (s) and TSV (g) were obtained according to the PET results corresponding to the six-direction radiation method and the globe-thermometer method.
3. Results
3.1. Average Meteorological Parameter Results of Measured Date
From July 2018 to August 2019, the meteorological test results in the two experimental sites were as follows:
On the whole, the experiment covers a wide range of meteorology. In spring, the average air temperature in the site is high, between 20 and 27 °C. In summer, the average air temperature in both sites exceeds 30 °C. In autumn, the air temperature in the site fluctuates greatly, and the average temperature is between 10 and 18 °C. In winter, the average temperature is generally below 13 °C. In terms of wind speed, the results are different due to the different characteristics of the site. In Beiyang square, the terrain is open, and the average wind speed is higher than 1 m/s in most cases. In the atrium of the 26th teaching building, due to the high buildings around, the average wind speed is below 0.5 m/s, and it is windless most of the time.
3.2. Overall Results of the Two Tmrt Calculation Methods
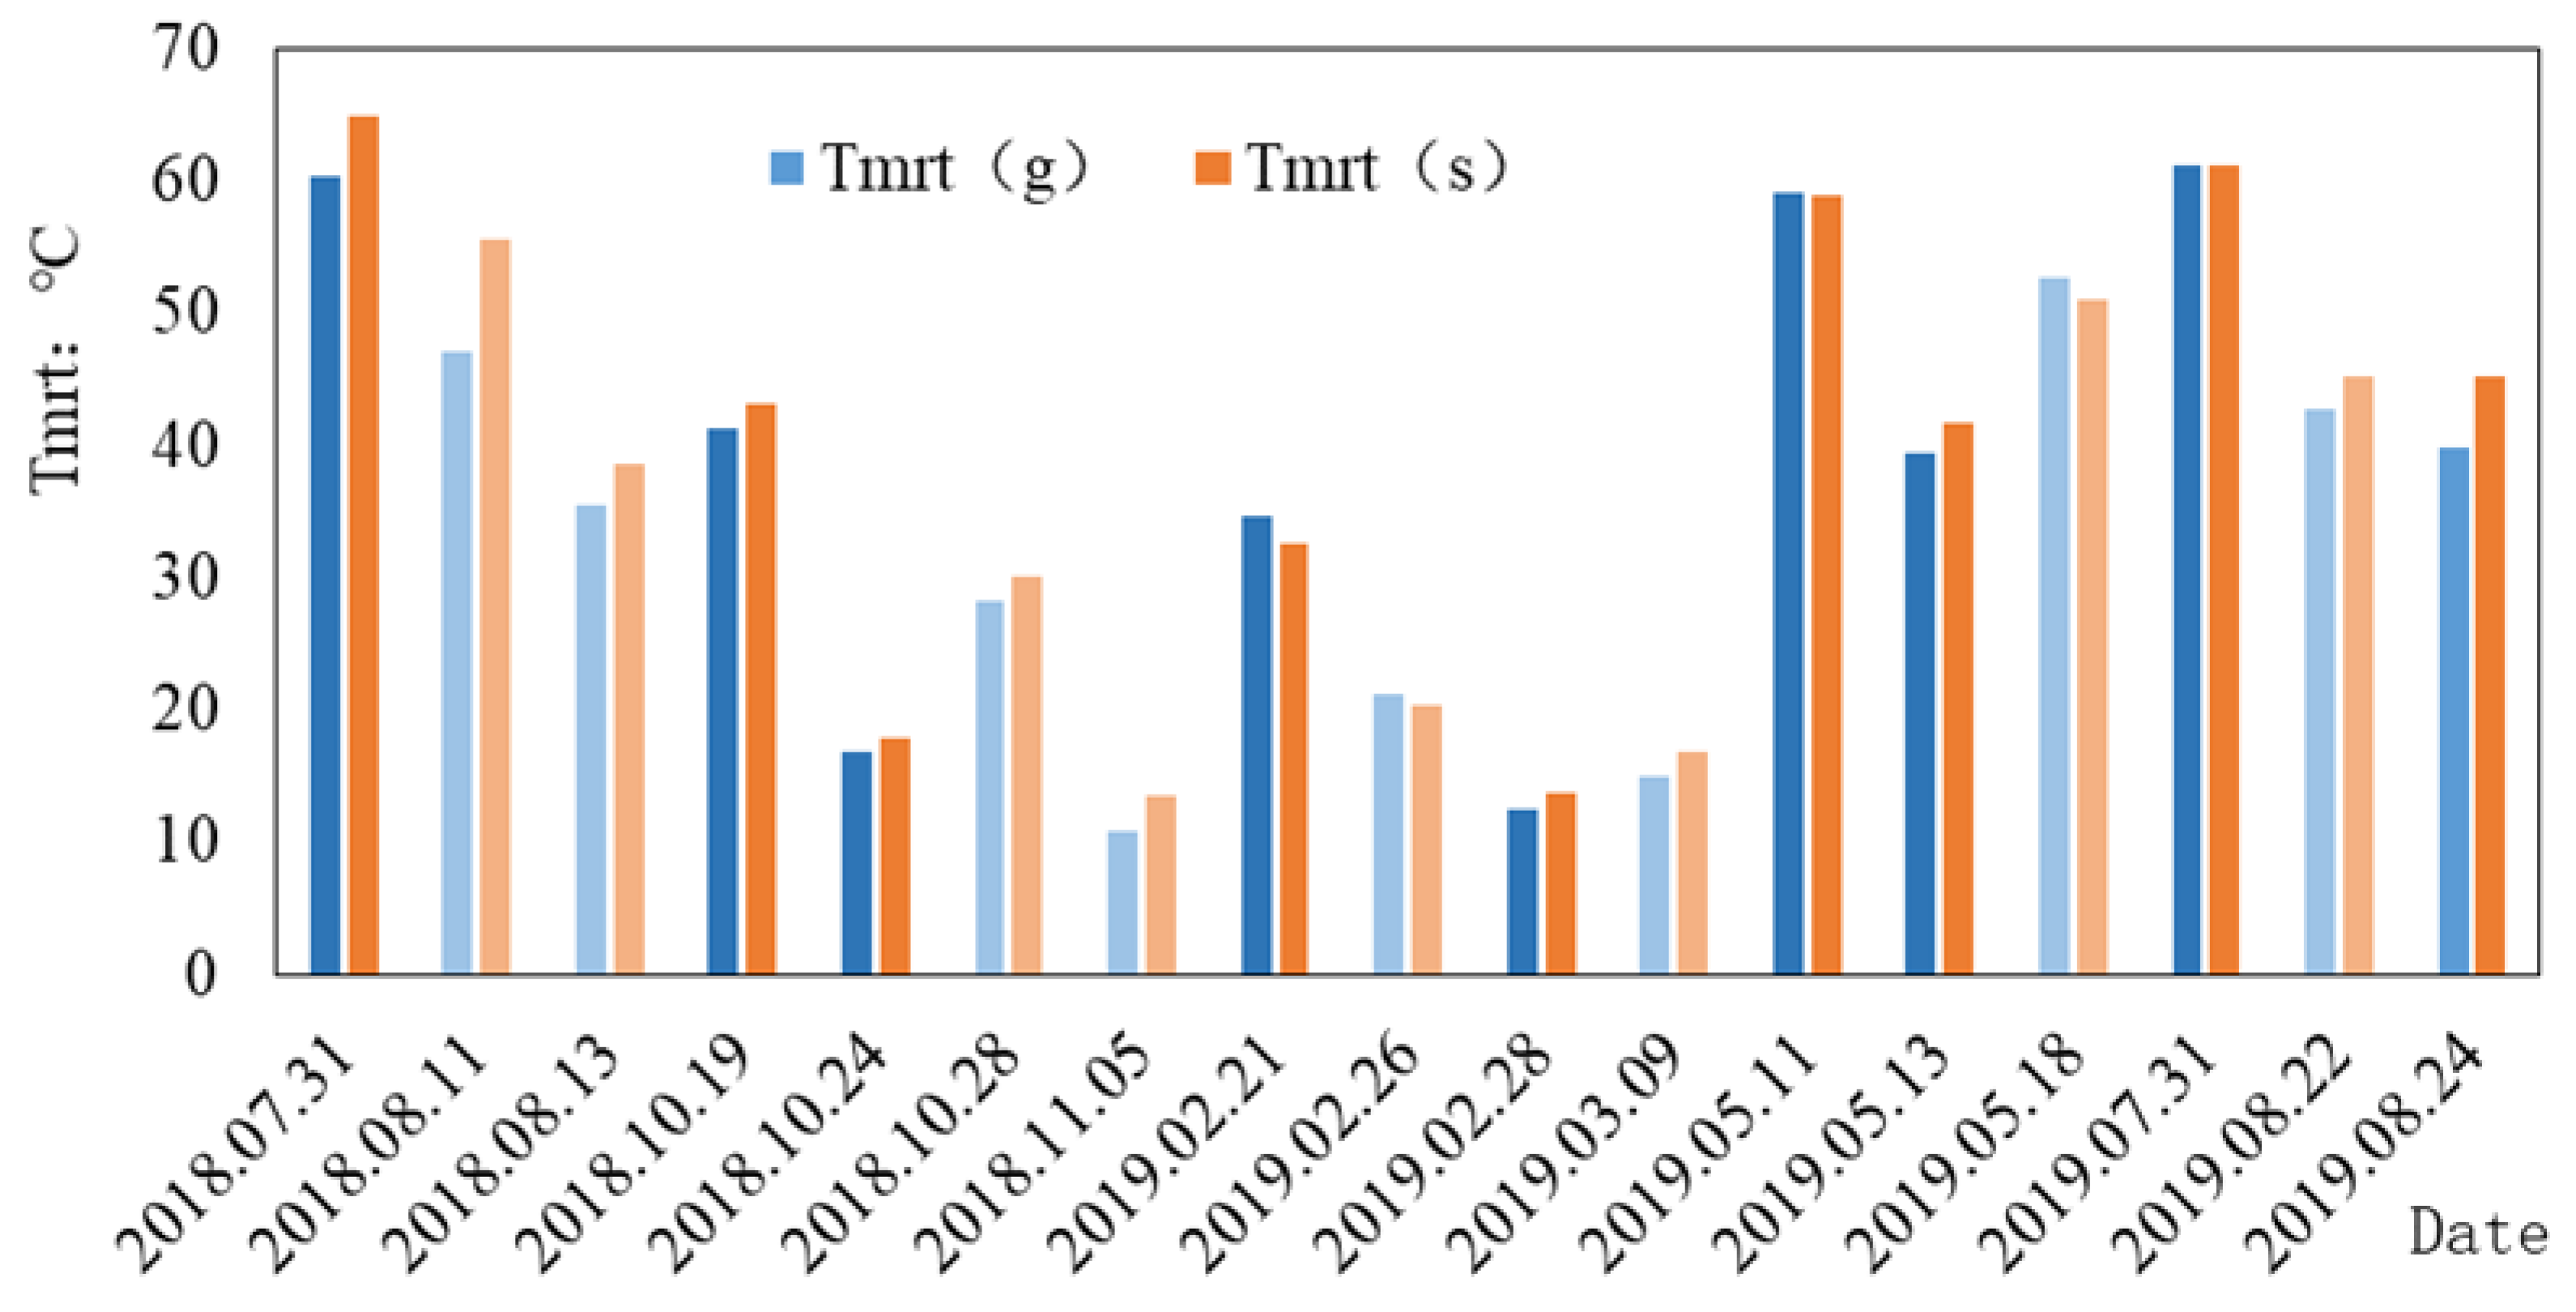
Tmrt (g) represents the mean radiation temperature calculated by the globe-thermometer method, and Tmrt (s) represents the mean radiation temperature calculated by the six-direction radiation method. The result of (Tmrt (g)—Tmrt (s)) is represented by ΔTmrt. The results are as follows: The dark color figure is the data under sunny conditions, and the light color is the calculation results of two kinds of Tmrt under overcast conditions.
In
Figure 4, it can be seen that the statistical results of Tmrt (g) are lower than those of Tmrt (s) in most operating conditions, with the statistical range of the average difference being (−8.08 °C, 1.9 °C). Among the multiple sets of conditions tested, the conditions with significant differences occurred in summer, and relatively close results were obtained in autumn and in winter for both methods. This is similar to the results obtained by Thomson′s experiment in 2007. The results obtained by black bulb thermometer method are lower in summer sunny weather and higher in cloudy weather [
14].
3.3. Influence of Various Environmental Factors on Globe Thermometer Method′s Mean Radiant Temperature
3.3.1. Effect of Shortwave Radiation on Tmrt Results Obtained by Globe Thermometer Method
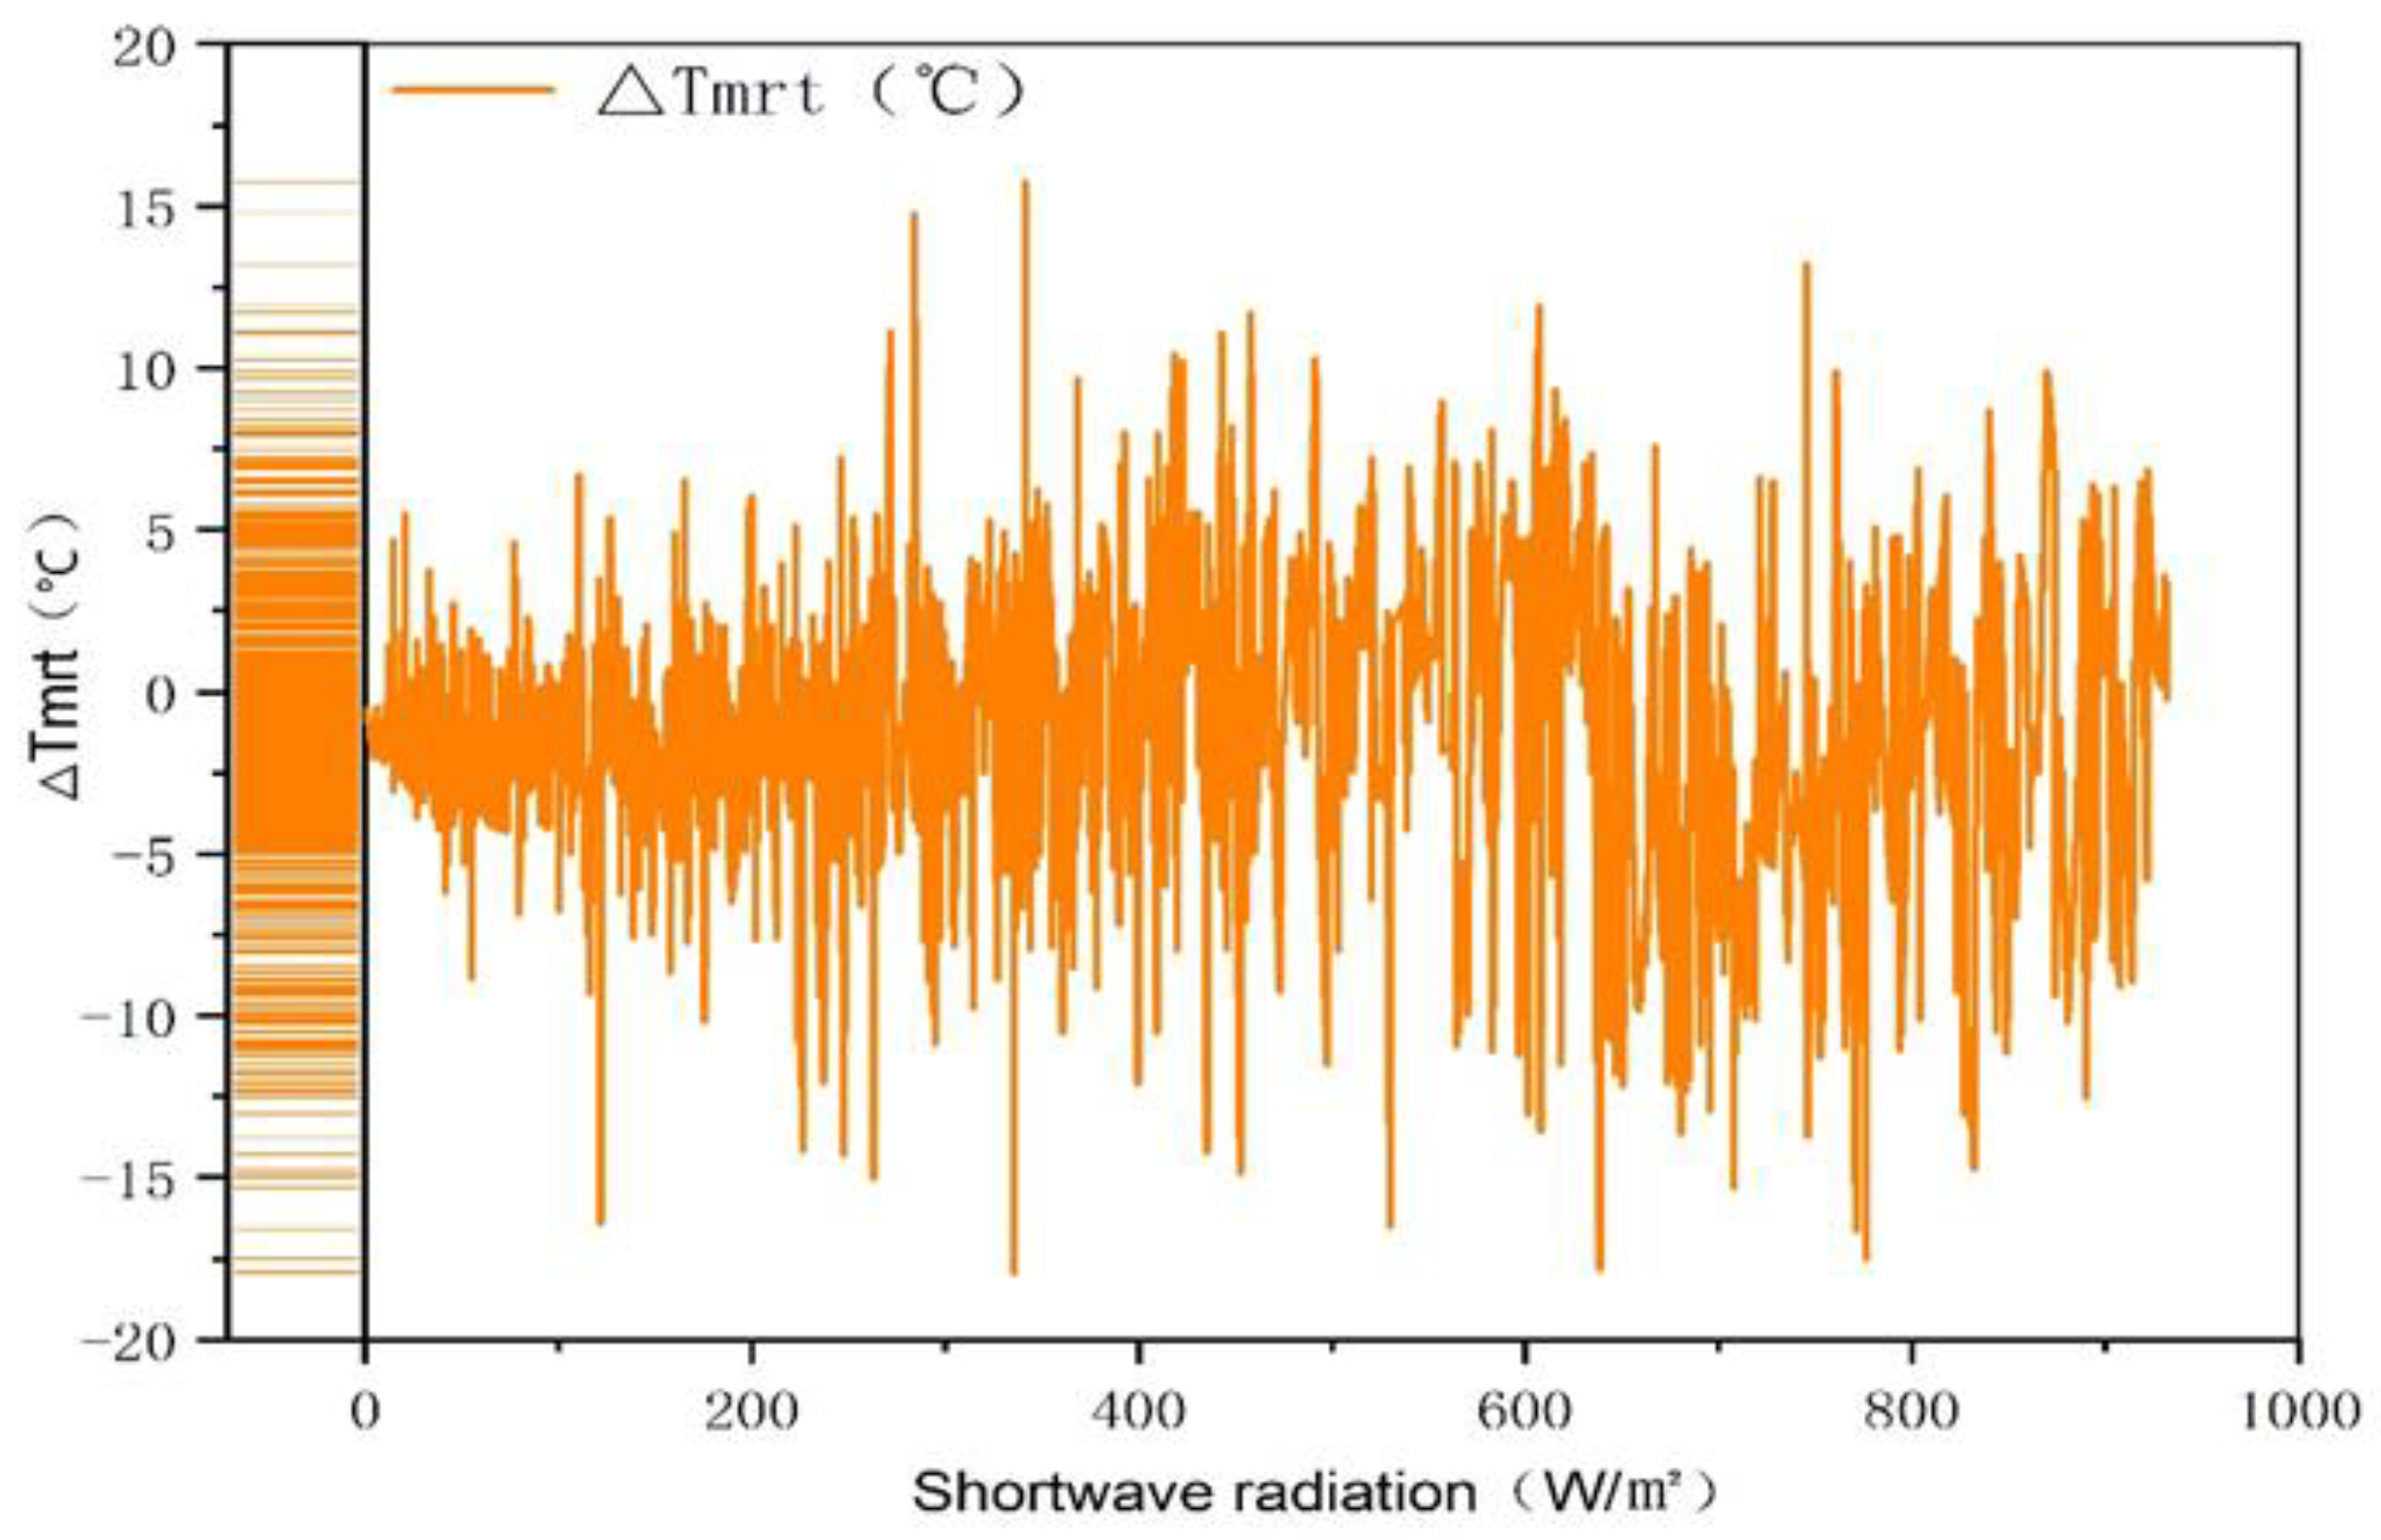
Taking the amount of shortwave radiation received on the horizontal plane as the statistical object, the maximum value can reach 931.8 W/m2. According to the number of data points in each shortwave radiation interval, the data are divided into eight intervals: 0–200, 200–300, 300–400, 400–500, 500–600, 600–700, 700–800, and >800 W/m2. Combined with the difference results of Tmrt (s) and Tmrt (g) and the measured shortwave radiation level, the data of various working conditions are integrated. There is a certain relationship between the shortwave radiation and the difference between Tmrt (s) and Tmrt (g). However, the discrepancy between the two results differs within different shortwave radiation intervals. In this study, when the results of ΔTmrt were considered to be in the range of (–5, 5) °C, the results of Tmrt (g) were considered to be accurate.
As shown in
Figure 5, the ΔTmrt results are quite scattered in different shortwave radiation ranges. First of all, the intensity of shortwave radiation directly affects the level of mean radiation temperature. With the strengthening of shortwave radiation, the mean radiation temperature increases. Secondly, the accuracy and validity of the mean radiation temperature results of the globe-thermometer method in different sections are varied with the six-direction method as the standard. When the shortwave radiation flux is small and the overall mean radiation temperature level is low, the difference between the results of the two methods is also small, and the globe-thermometer method is relatively accurate. When the shortwave radiation flux increases, the difference between the results of the two methods becomes obvious. According to the results of each data point, there are positive and negative results of ΔTmrt in each shortwave radiation range, and with the increase of shortwave radiation range, the dispersion range of data increases. Under the condition of low shortwave radiation, the data are mainly concentrated in the range of [−5, 5] °C, while under the condition of high shortwave radiation, the proportion of data overflowing the range of (−5, 5) °C is expanded.
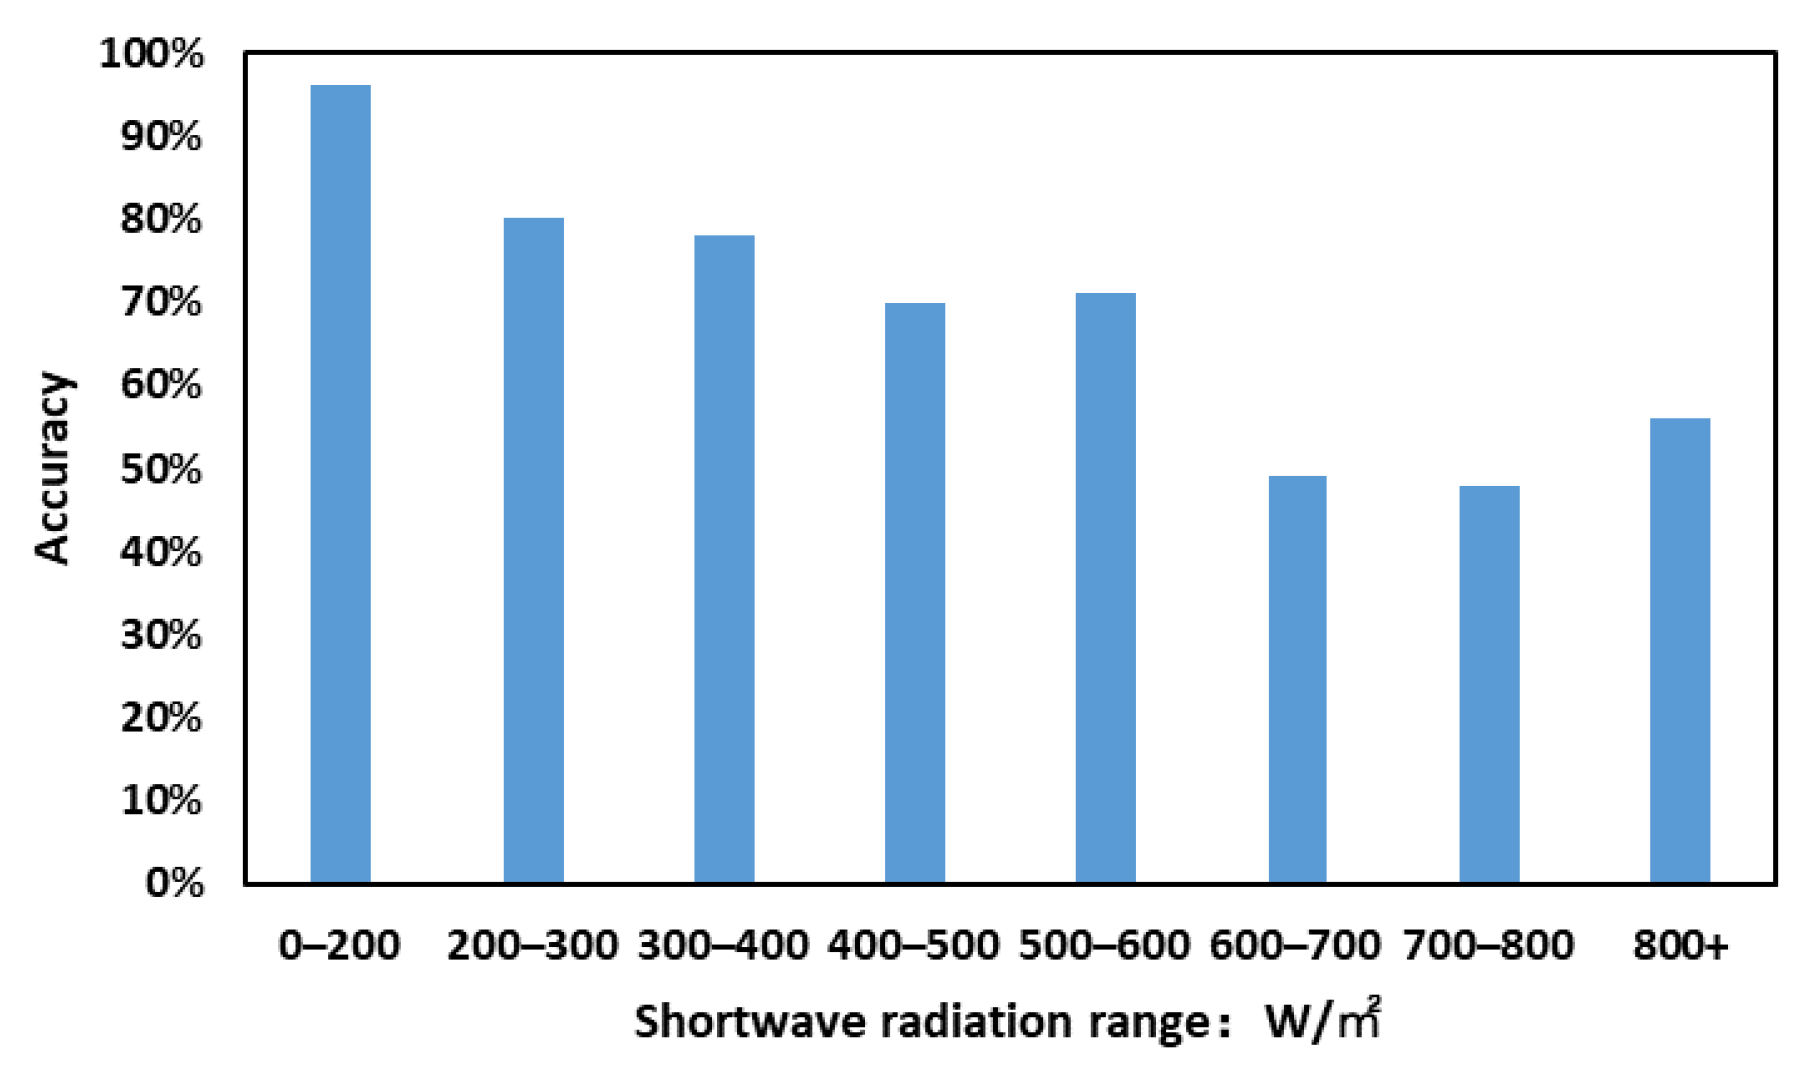
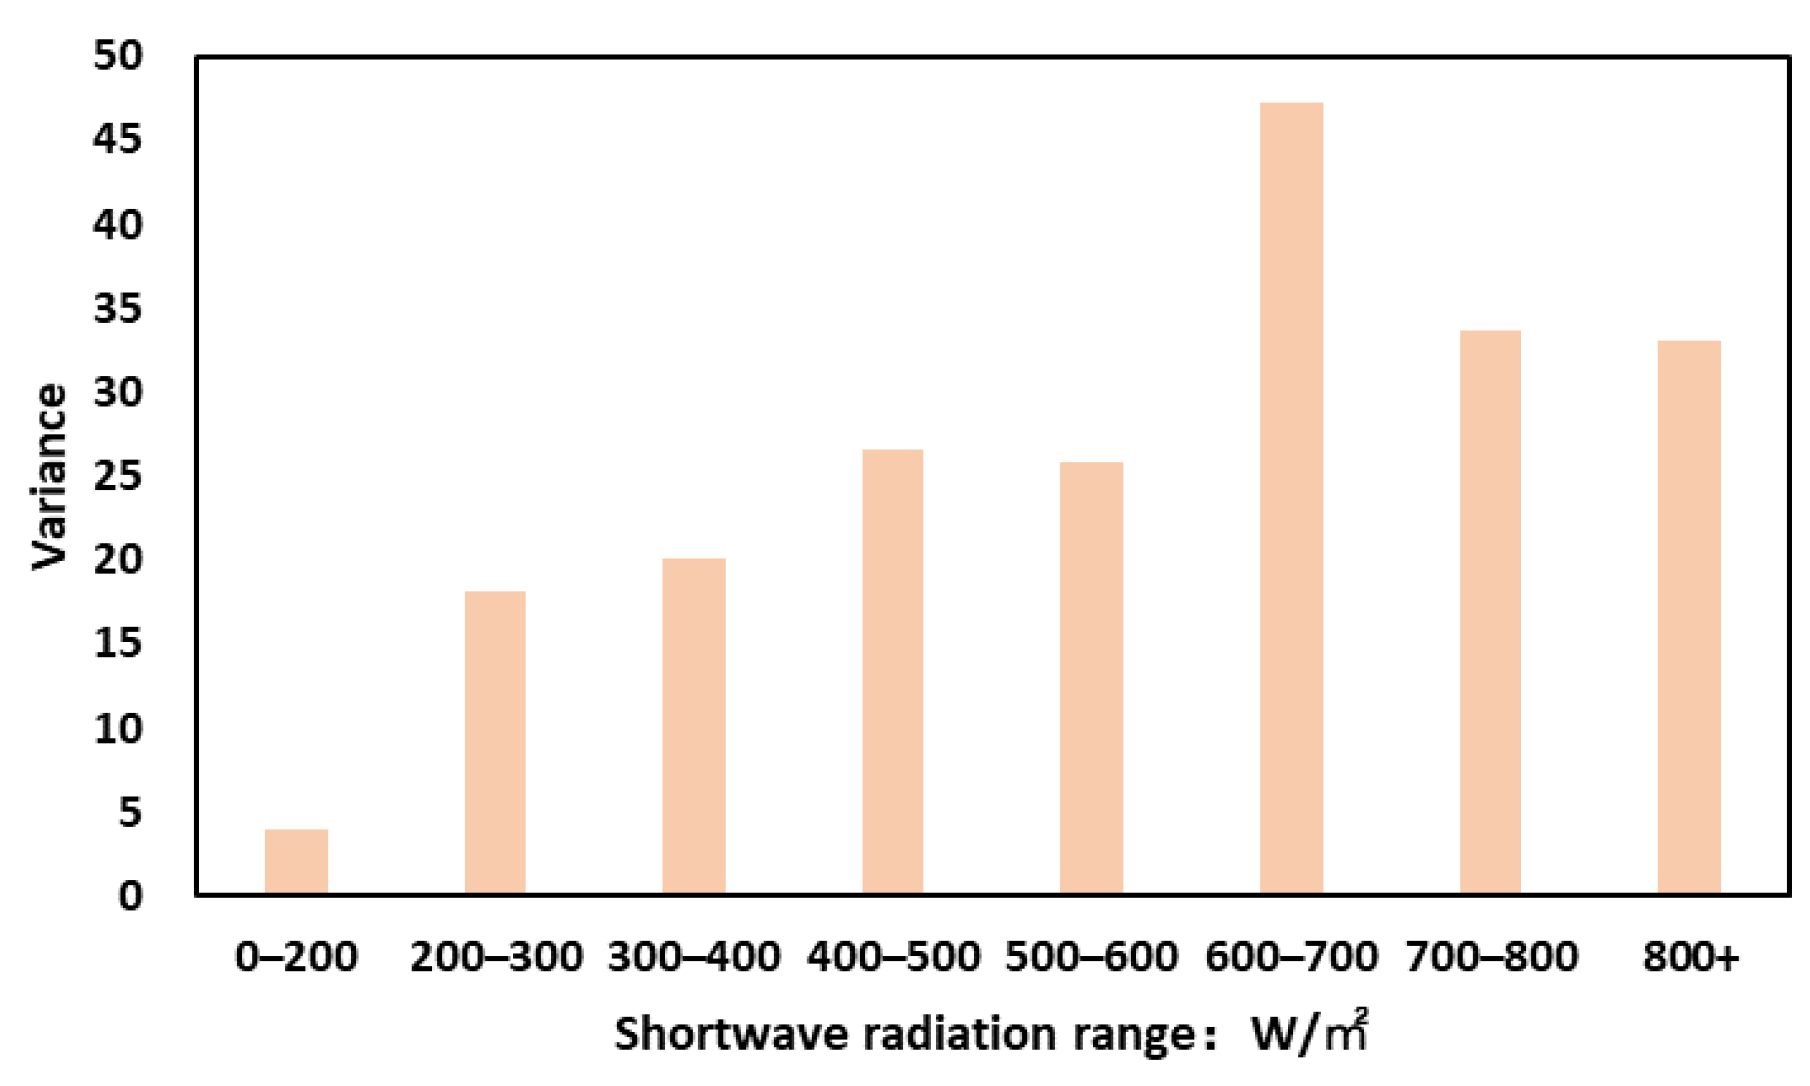
The exact proportion and error range of operating points under each shortwave radiation section are shown in
Figure 6 and
Figure 7. With the increase of shortwave radiation, the accuracy of black bulb thermometer data is declining, and the variance of the data is also increasing. The accuracy of the data in the shortwave radiation range of 0–200 W/m
2 is 96%, and the results of the black bulb thermometer can be considered accurate. When the shortwave radiation range is below 300 W/m
2, the accuracy of the data is above 80%. In the range of 300–600 W/m
2, the accuracy of the data is in the range of 70–80%. When the shortwave radiation exceeds 600 W/m
2, the accuracy of the data decreases sharply, only below 60%. That is to say, the accuracy of the test results of the black bulb thermometer in this range is extremely low.
3.3.2. Effect of Wind Speed Variation on Tmrt Results Obtained by Globe Thermometer Method
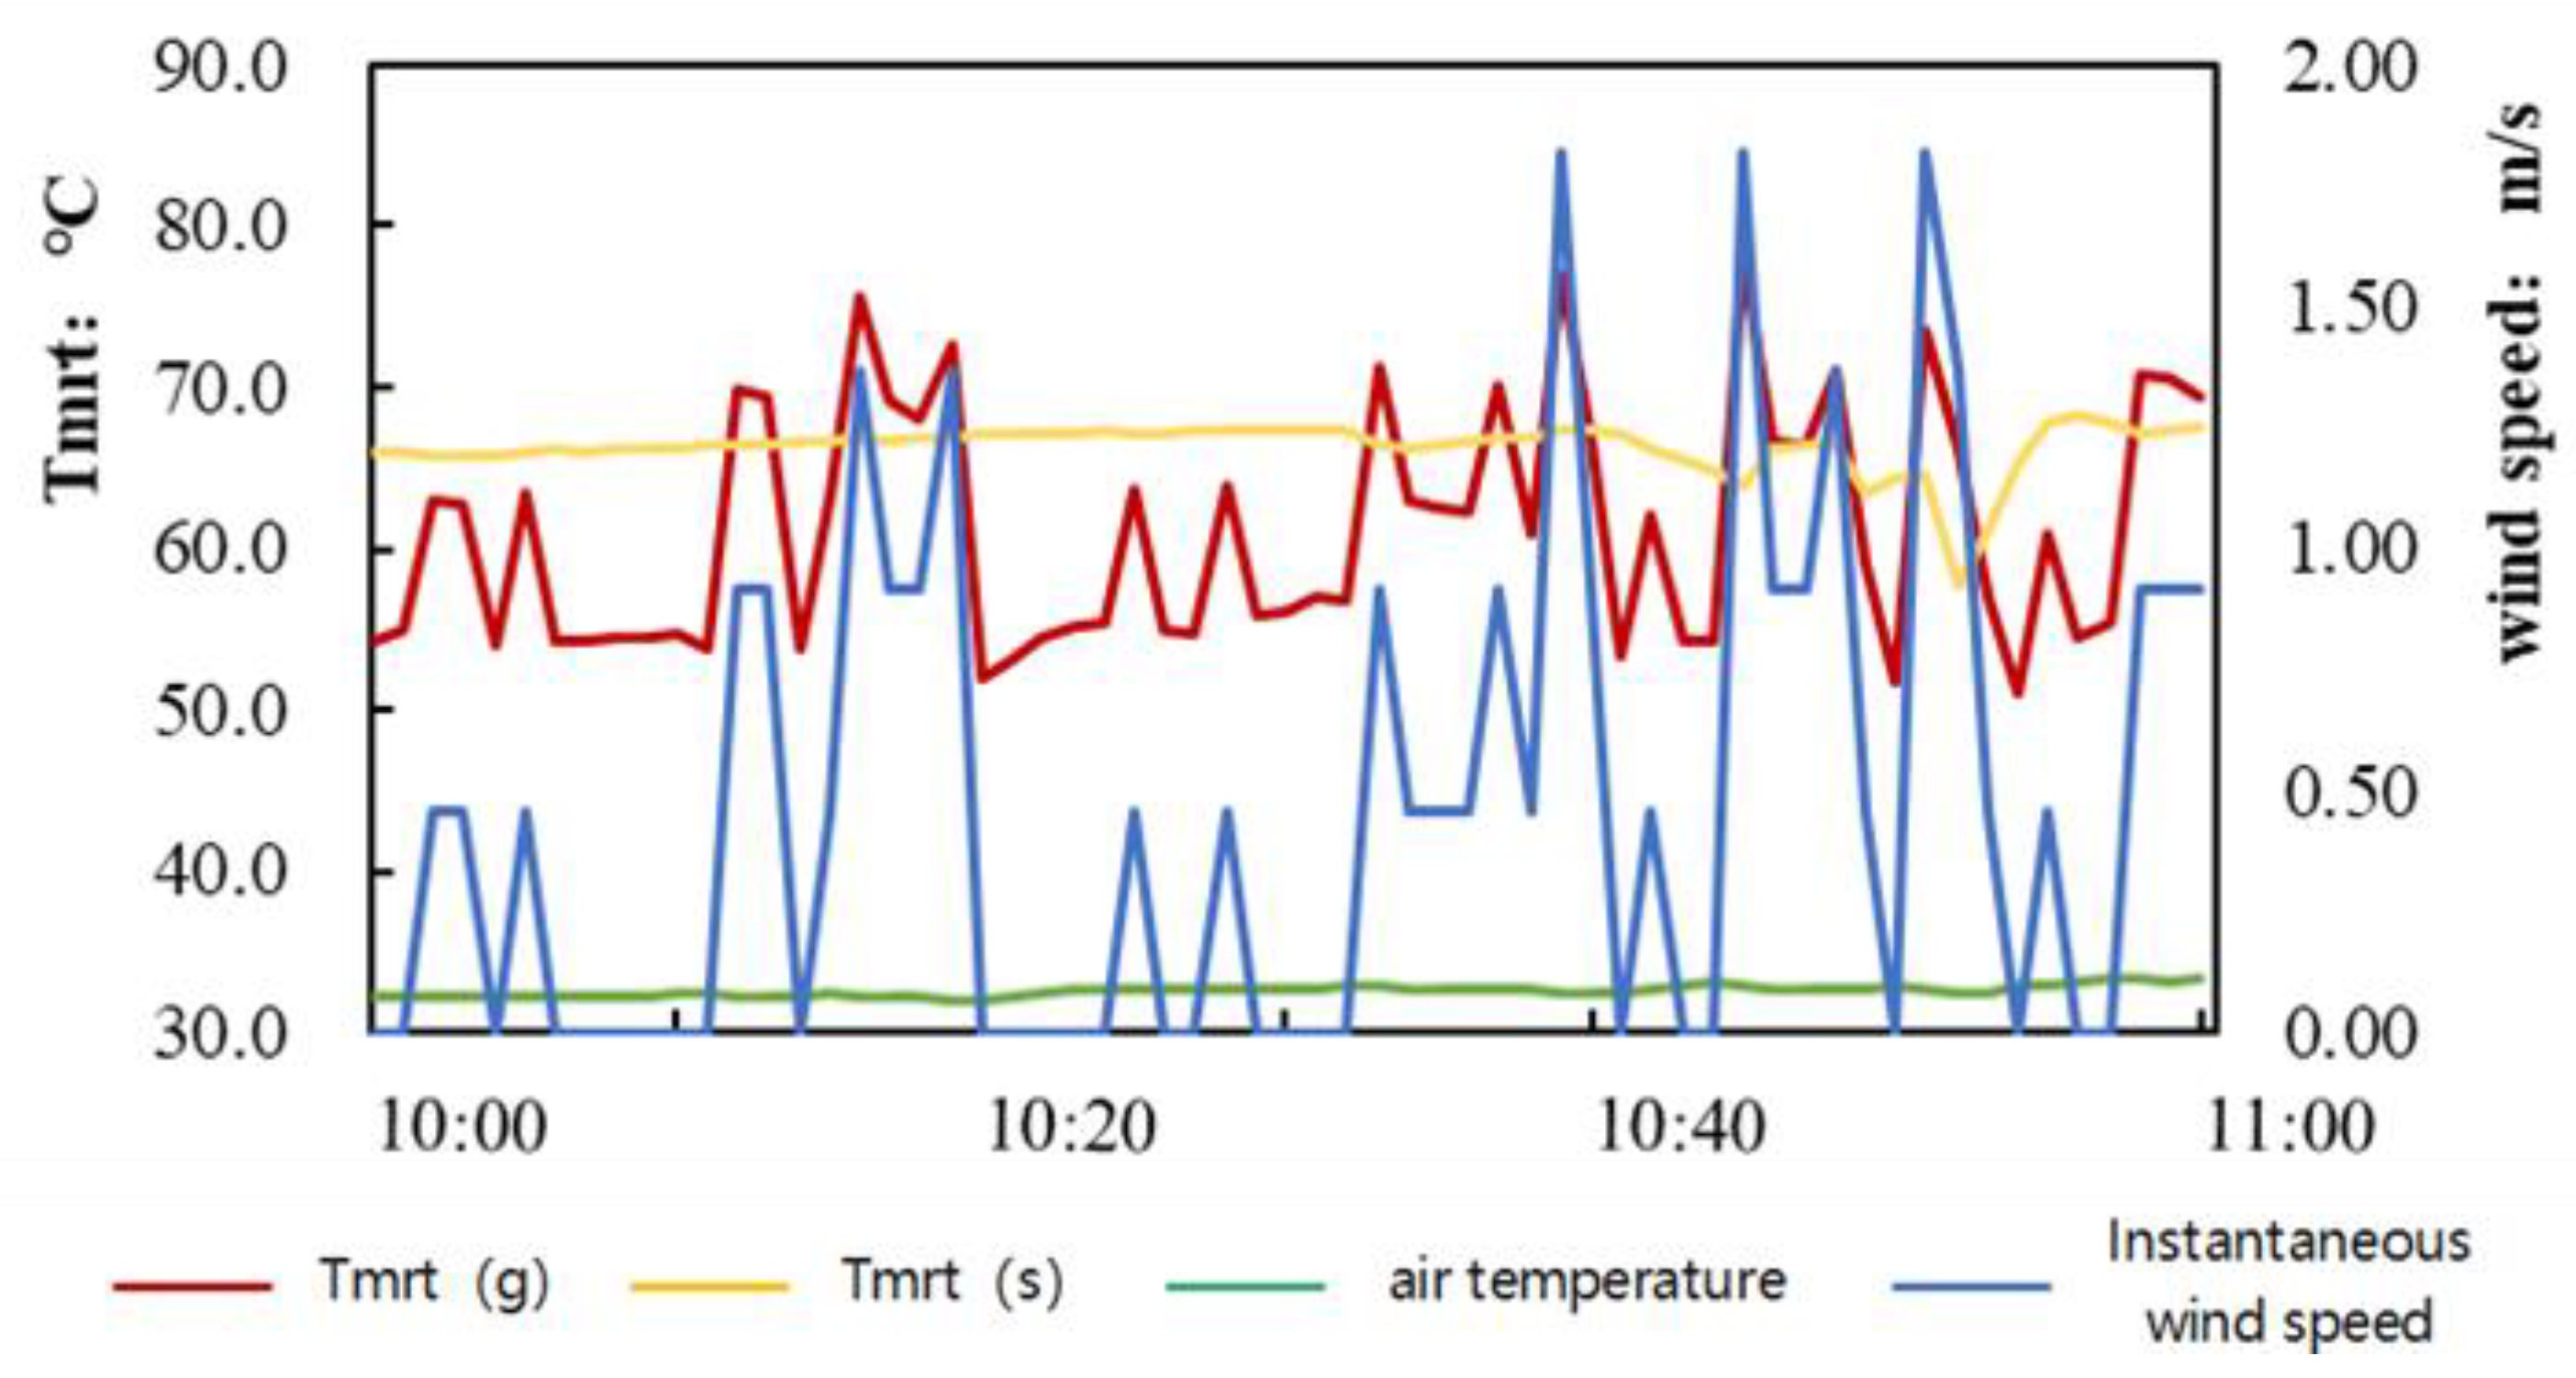
Taking the data from 10:00 a.m. to 11:00 a.m. on July 31st as an example for analysis, we see that the air temperature fluctuation range during this period is 32.1–33.3 °C, which is relatively stable, while the wind speed is constantly changing. As shown in
Figure 8, it is obvious that the fluctuation of Tmrt (g) is highly coincident with the fluctuation of instantaneous wind speed. During 10:15–10:20, the wind speed changes from 0.45 to 1.37 m/s and then decreases to 0.91 m/s. Tmrt (g) changed similarly from 63.3 to 75.5 °C and then decreased to 69.3 °C. This shows that the fluctuation of wind speed will bring about the instantaneous fluctuation of Tmrt (g) results, which will affect the accuracy of the results.
In order to count the influence of wind speed on ΔTmrt, the shortwave radiation and air temperature are divided into several intervals, and it is considered that the change of this parameter in the same interval has no obvious effect on the results. For this, the wind speed is uniformly taken as the 5 min average value and substituted into the calculation. Secondly, the data are arranged according to the magnitude of the shortwave radiation value and are divided into several sections, with 100 W/m
2 as the boundary. Within each segment, the average value of ΔTmrt under the condition of each wind speed value is counted and expressed as dTmrt. The specific statistical results are shown in
Table 4,
Table 5 and
Table 6:
It should be noted that the statistical result of the above table is not the result of continuous change in wind speed, but the set of data points for wind speed in a certain interval. Each dTmrt result in the table is the average value of ΔTmrt at all operating points under the condition that the wind speed is a certain value within a certain air temperature range and a certain shortwave radiation range. Red is positive, indicating that the result of Tmrt (g) is higher than Tmrt (s), while blue is the opposite. The darker the color, the greater the difference between the two results
From the wind speed alone, dTmrt increases gradually with the increase of wind speed value. When the wind speed is low, dTmrt is negative. When the wind speed exceeds 1 m/s, the result of dTmrt becomes positive; that is, the result of Tmrt (g) begins to exceed Tmrt (s). From the air temperature range, when the air temperature is low, the overall results are still within the acceptable range, with the increase of air temperature. The absolute value of the dTmrt result is expanded. In the same air temperature range and the same wind speed interval, the absolute value of the dTmrt results expands with the increase of shortwave radiation values. To sum up, there are many factors that affect the accuracy of the mean radiation temperature calculated by the black bulb thermometer, and they intercouple with each other. When the wind speed is lower than 0.5 m/s, the value of shortwave radiation is higher. The result of Tmrt (g) becomes smaller relative to Tmrt (s). When the wind speed is higher than 2.0 m/s, the higher the value of shortwave radiation is, the larger the result of Tmrt (g) is relative to Tmrt (s). When the wind speed is an optimum value in the middle, a part of the error caused by shortwave radiation can be offset, so that the result of Tmrt (g) is closest to Tmrt (s).
For the accuracy of the results calculated by the globe-thermometer method, the black bulb thermometer will underestimate Tmrt when the wind speed is low, and the results will be reversed when the wind speed is high. When the wind speed is less than 0.5 m/s and more than 2.0 m/s, the deviation of Tmrt (g) is mostly more than 5 °C, which deviates from the required accuracy range. When the wind speed is between 0.5 and 2.0 m/s, except for a few working conditions accompanied by high and shortwave radiation (>700 W/m2), the overall results are within the acceptable range.
3.3.3. Effect of Wind Direction on Tmrt Results Obtained by Globe Thermometer Method
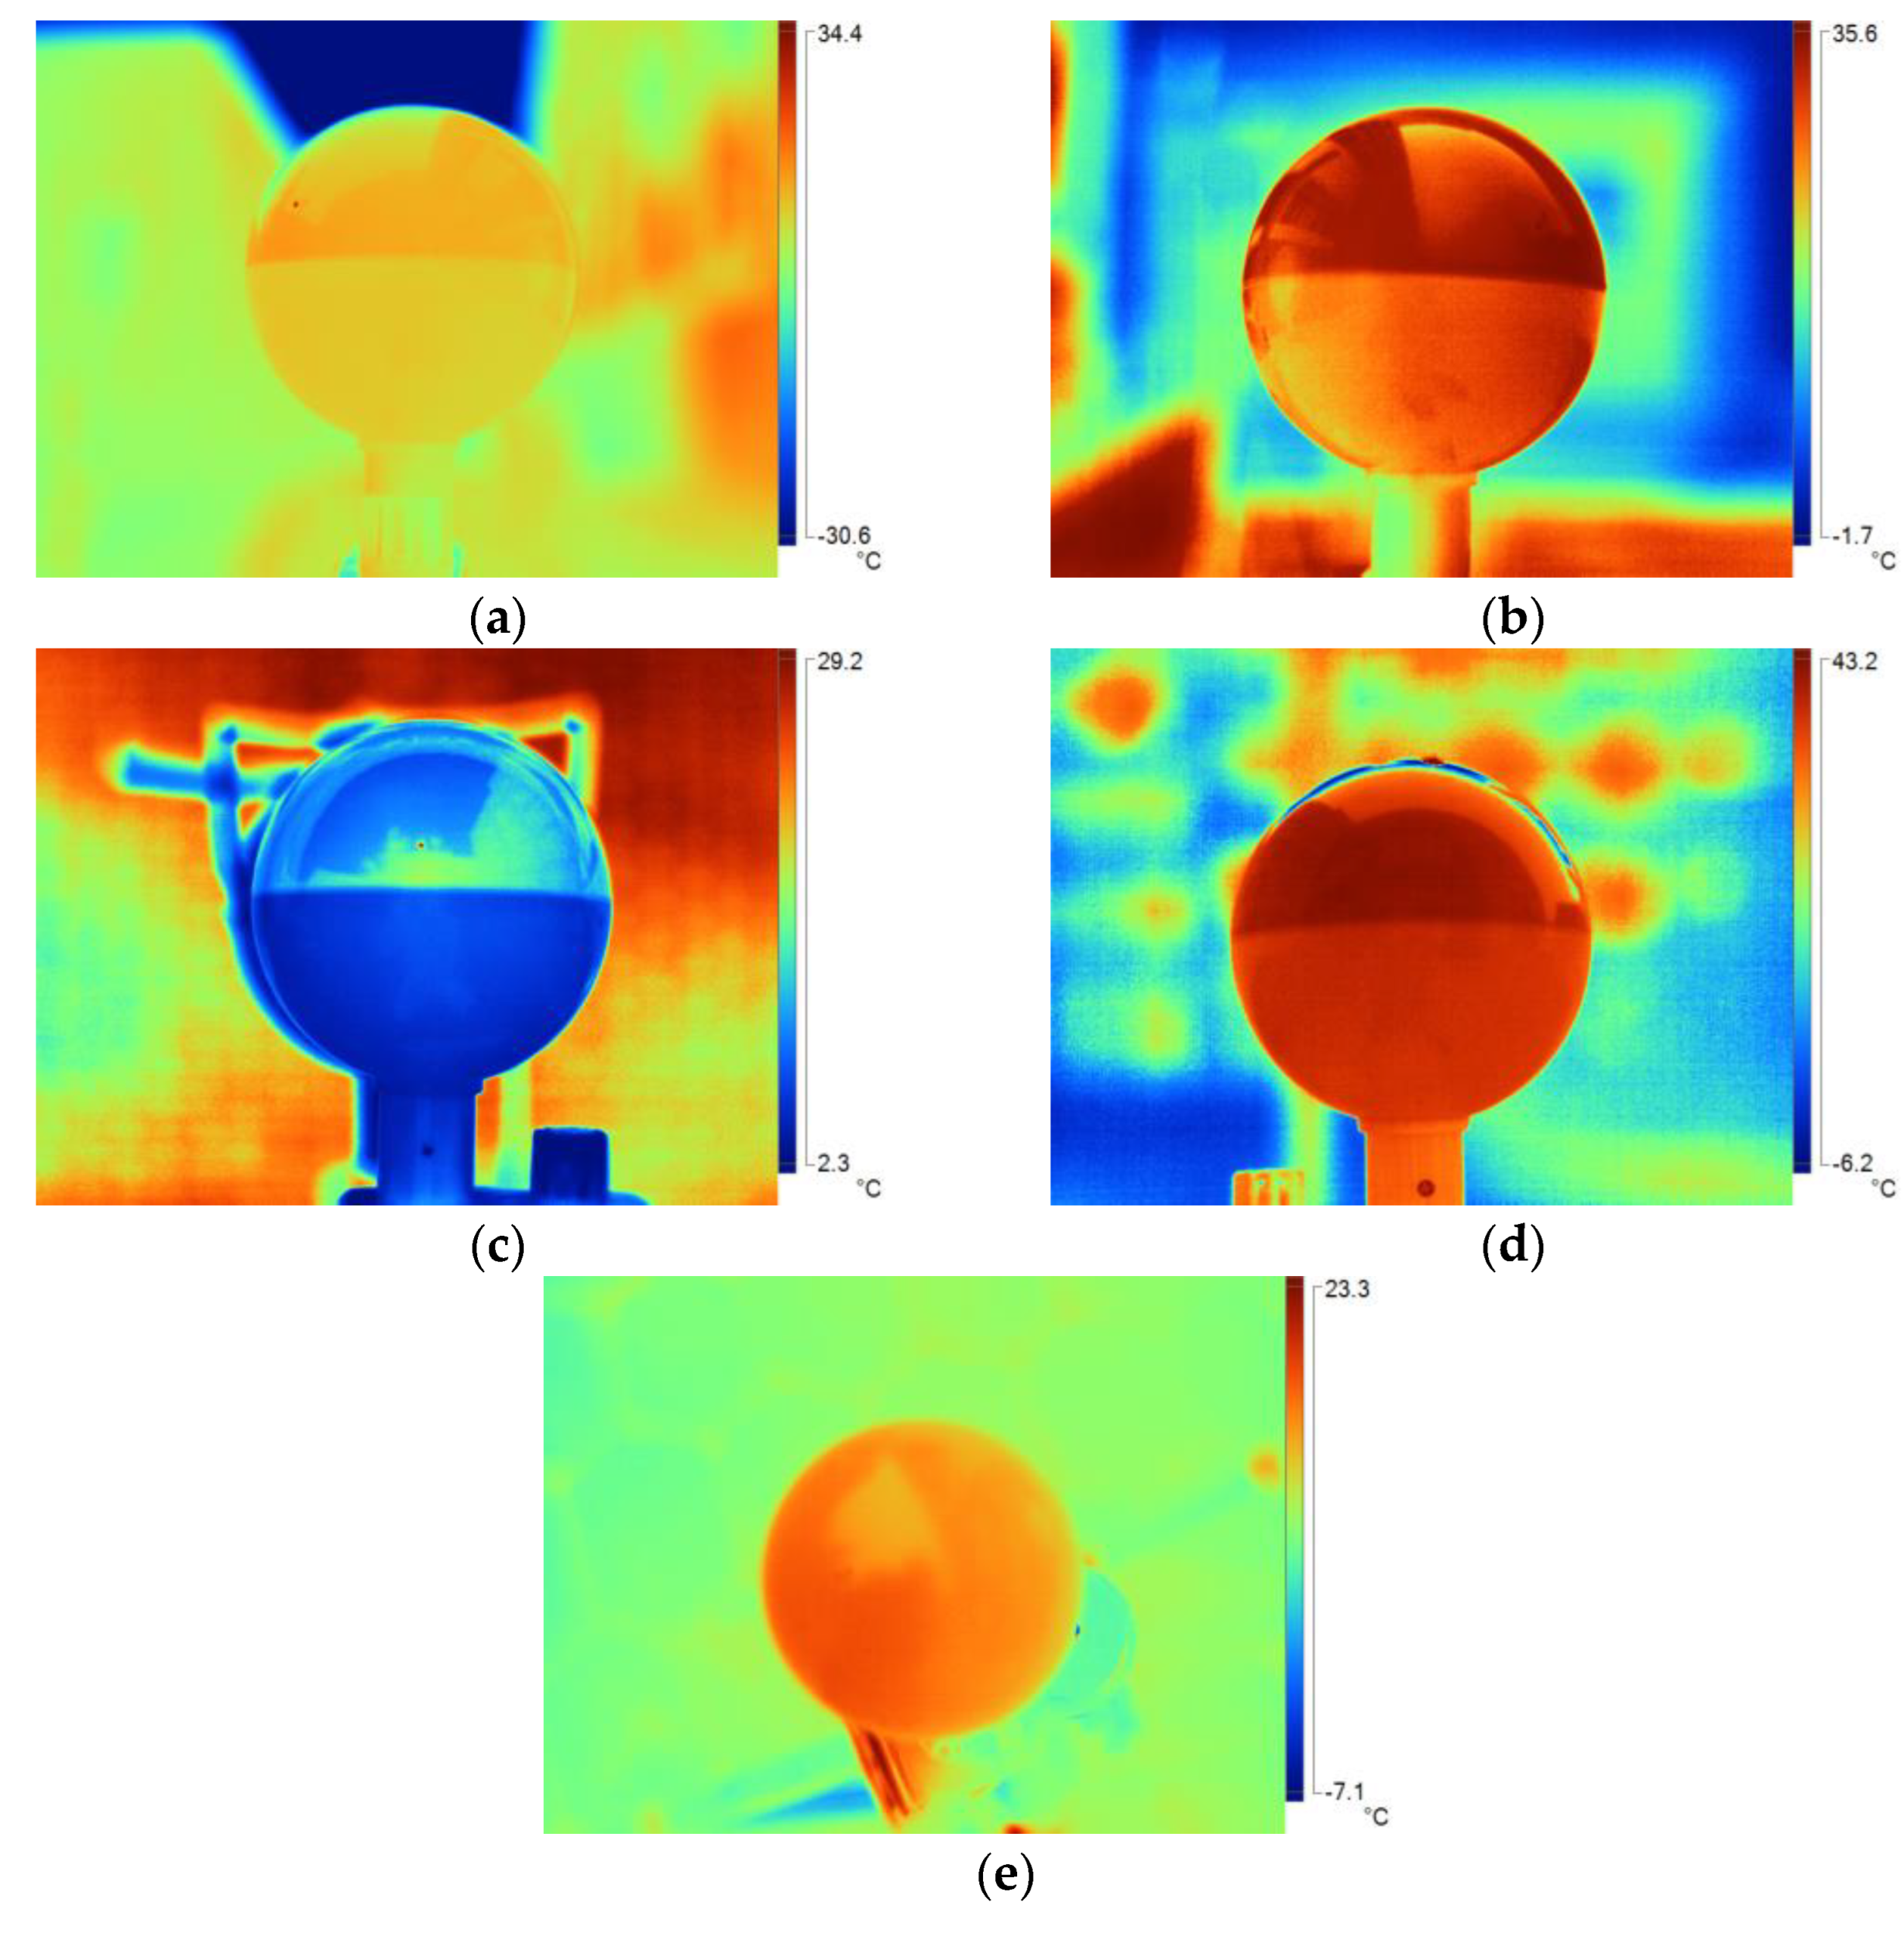
The average air temperature of the outdoor environment on the day of the test was 5.09 °C. After exposure to direct sunlight outdoors for a period of time, the results of the black ball are shown in
Figure 9 and
Table 7. It can be seen that the highest surface temperature is 28.97 °C, while the lowest temperature is only 4.59 °C, and the temperature difference is 24.38 °C. The above results show that, even if a metal material with good thermal conductivity is used, the surface temperature of the black globe will also be uneven in the outdoor high shortwave radiation environment, and the results of the black globe temperature cannot represent the overall average temperature of the globe, resulting in some errors in the calculation of Tmrt.
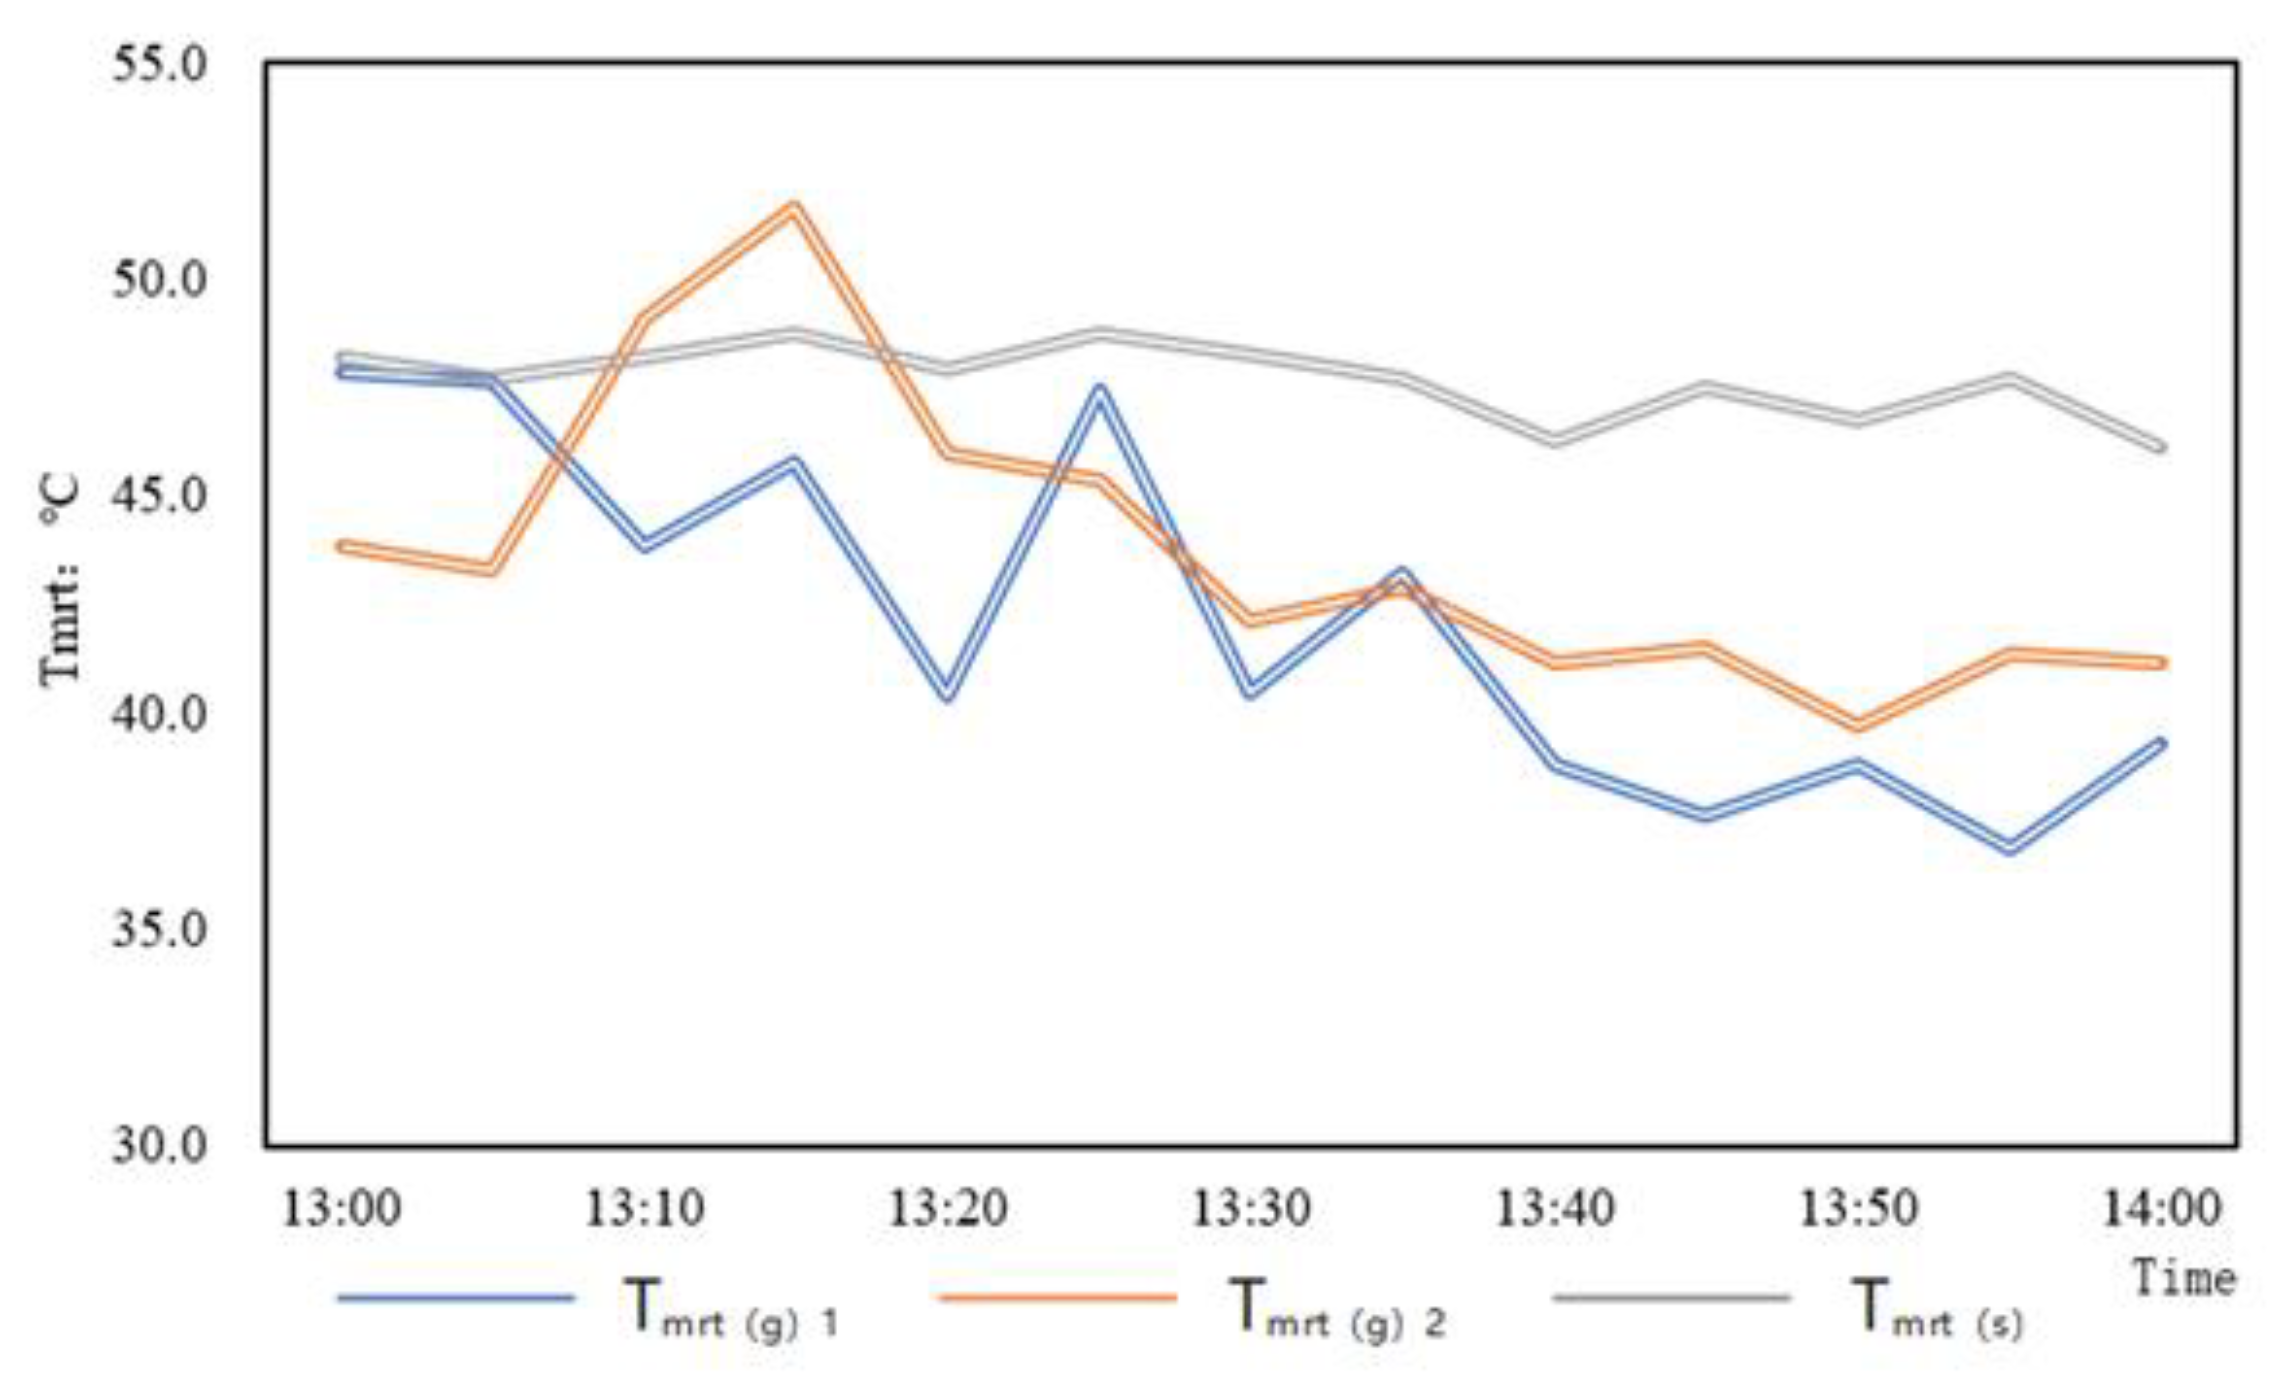
In the experiment, the test results of the six-direction radiation method are used as a reference standard to compare the results of the black bulb thermometer recorded in different wind directions. The black sphere receiving the south wind is marked as 1; the black sphere receiving the north wind is marked as 2; and Tmrt (g)1 and Tmrt (g)2, respectively, represent the mean radiation temperatures calculated by the two.
Figure 10 shows the test results relative to the six-direction radiation method. The results of black bulb thermometer are generally low, and the average differences of Tmrt (g)1 and Tmrt (g)2 to Tmrt (s) are 5.53 and 3.92 °C, respectively. From the overall performance, when the wind direction is north, the accuracy of the results is slightly higher than that when the wind direction is south. Wind direction has a certain influence on the results obtained by the black bulb thermometer.
3.4. Effect of Deviation of Mean Radiation Temperature Results on Thermal Comfort Index
This subsection discusses the impact of the bias in the Tmrt results resulting from the application of the globe-thermometer method on the calculation of thermal comfort indices. In this regard, one day is randomly selected from the test data from the four seasons of spring, summer, autumn, and winter as a typical working condition, and the thermal comfort of that day is used to represent the situation of that season. PET (s) and PET (g) represent the PET results calculated from Tmrt obtained by the six-direction radiation method and the globe-thermometer method, respectively. The corresponding thermal sensation results are denoted as TSV (s) and TSV (g), respectively.
3.4.1. Statistics and Analysis of PET and TSV Results in Summer
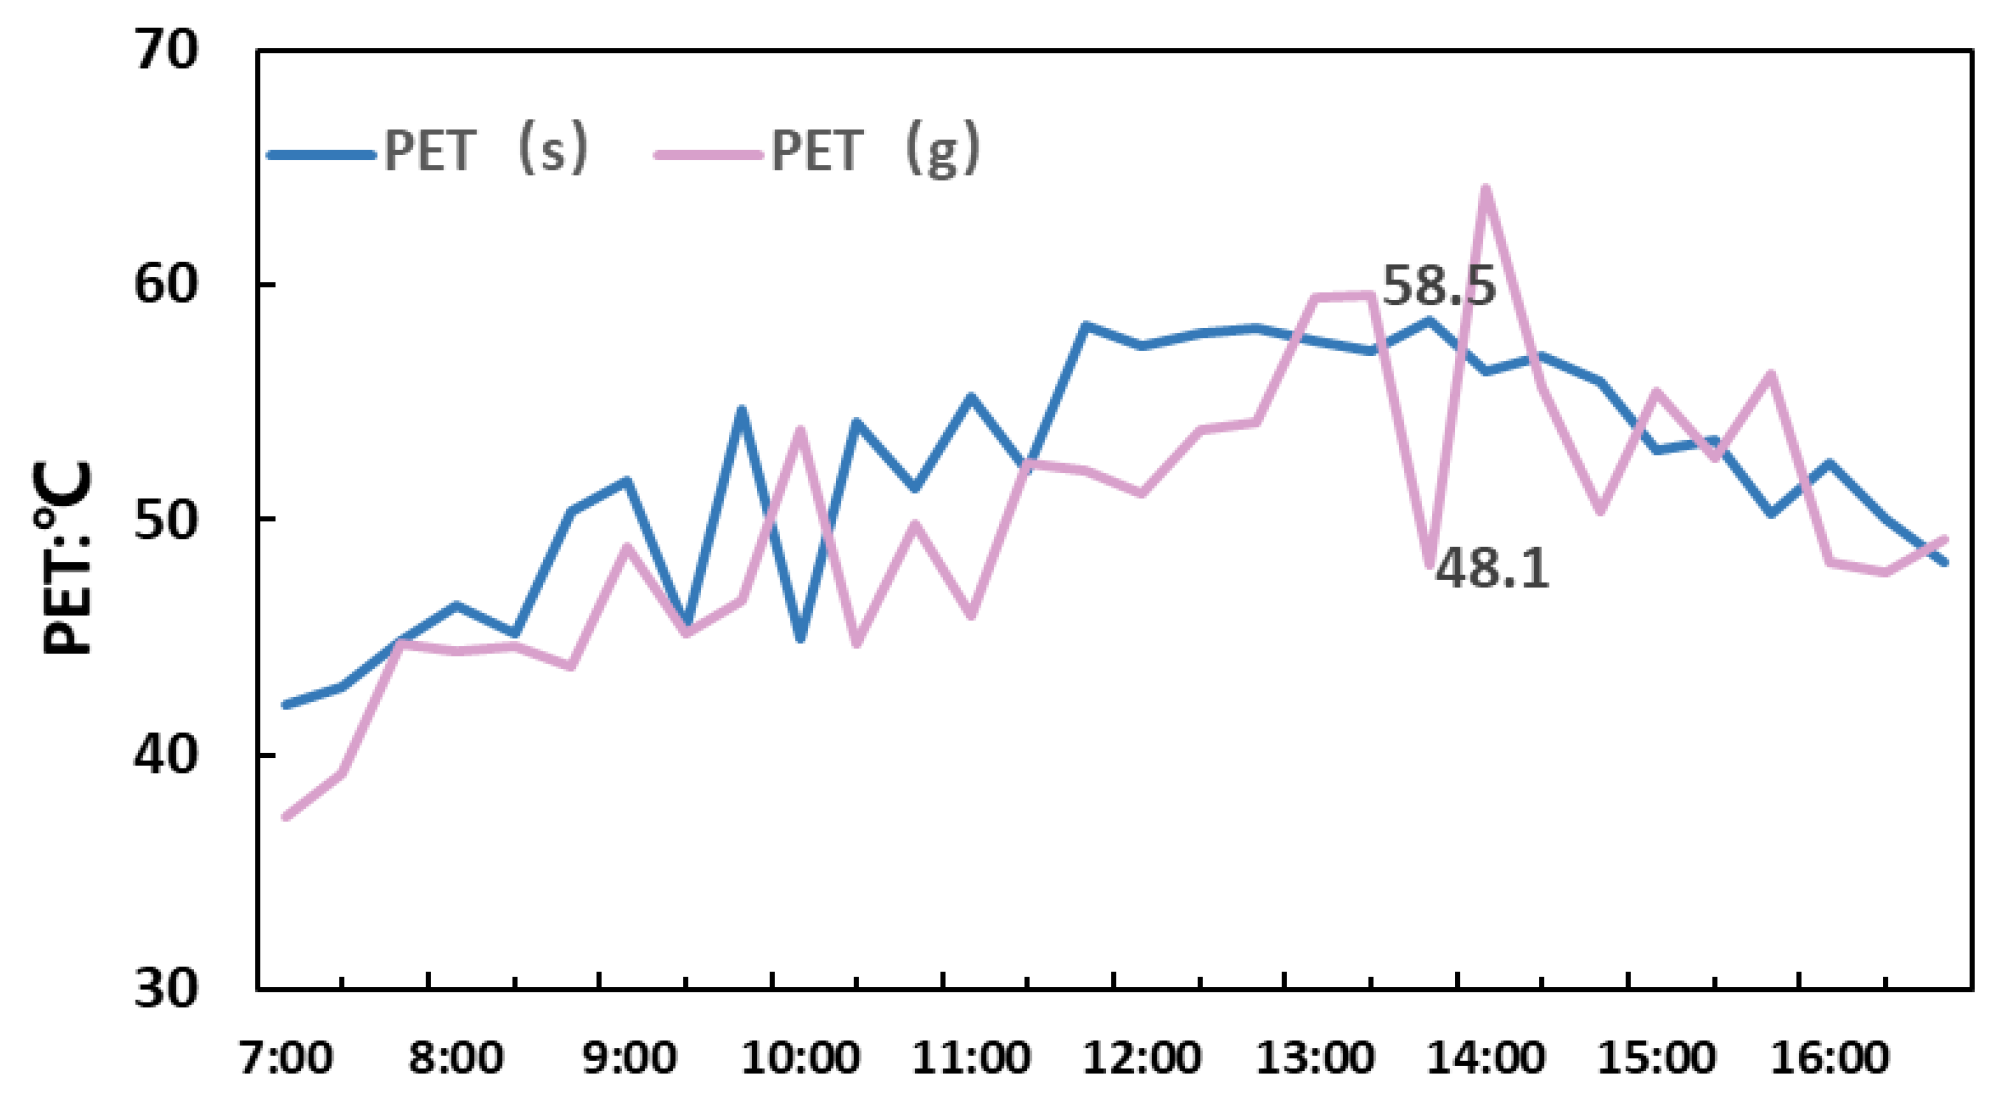
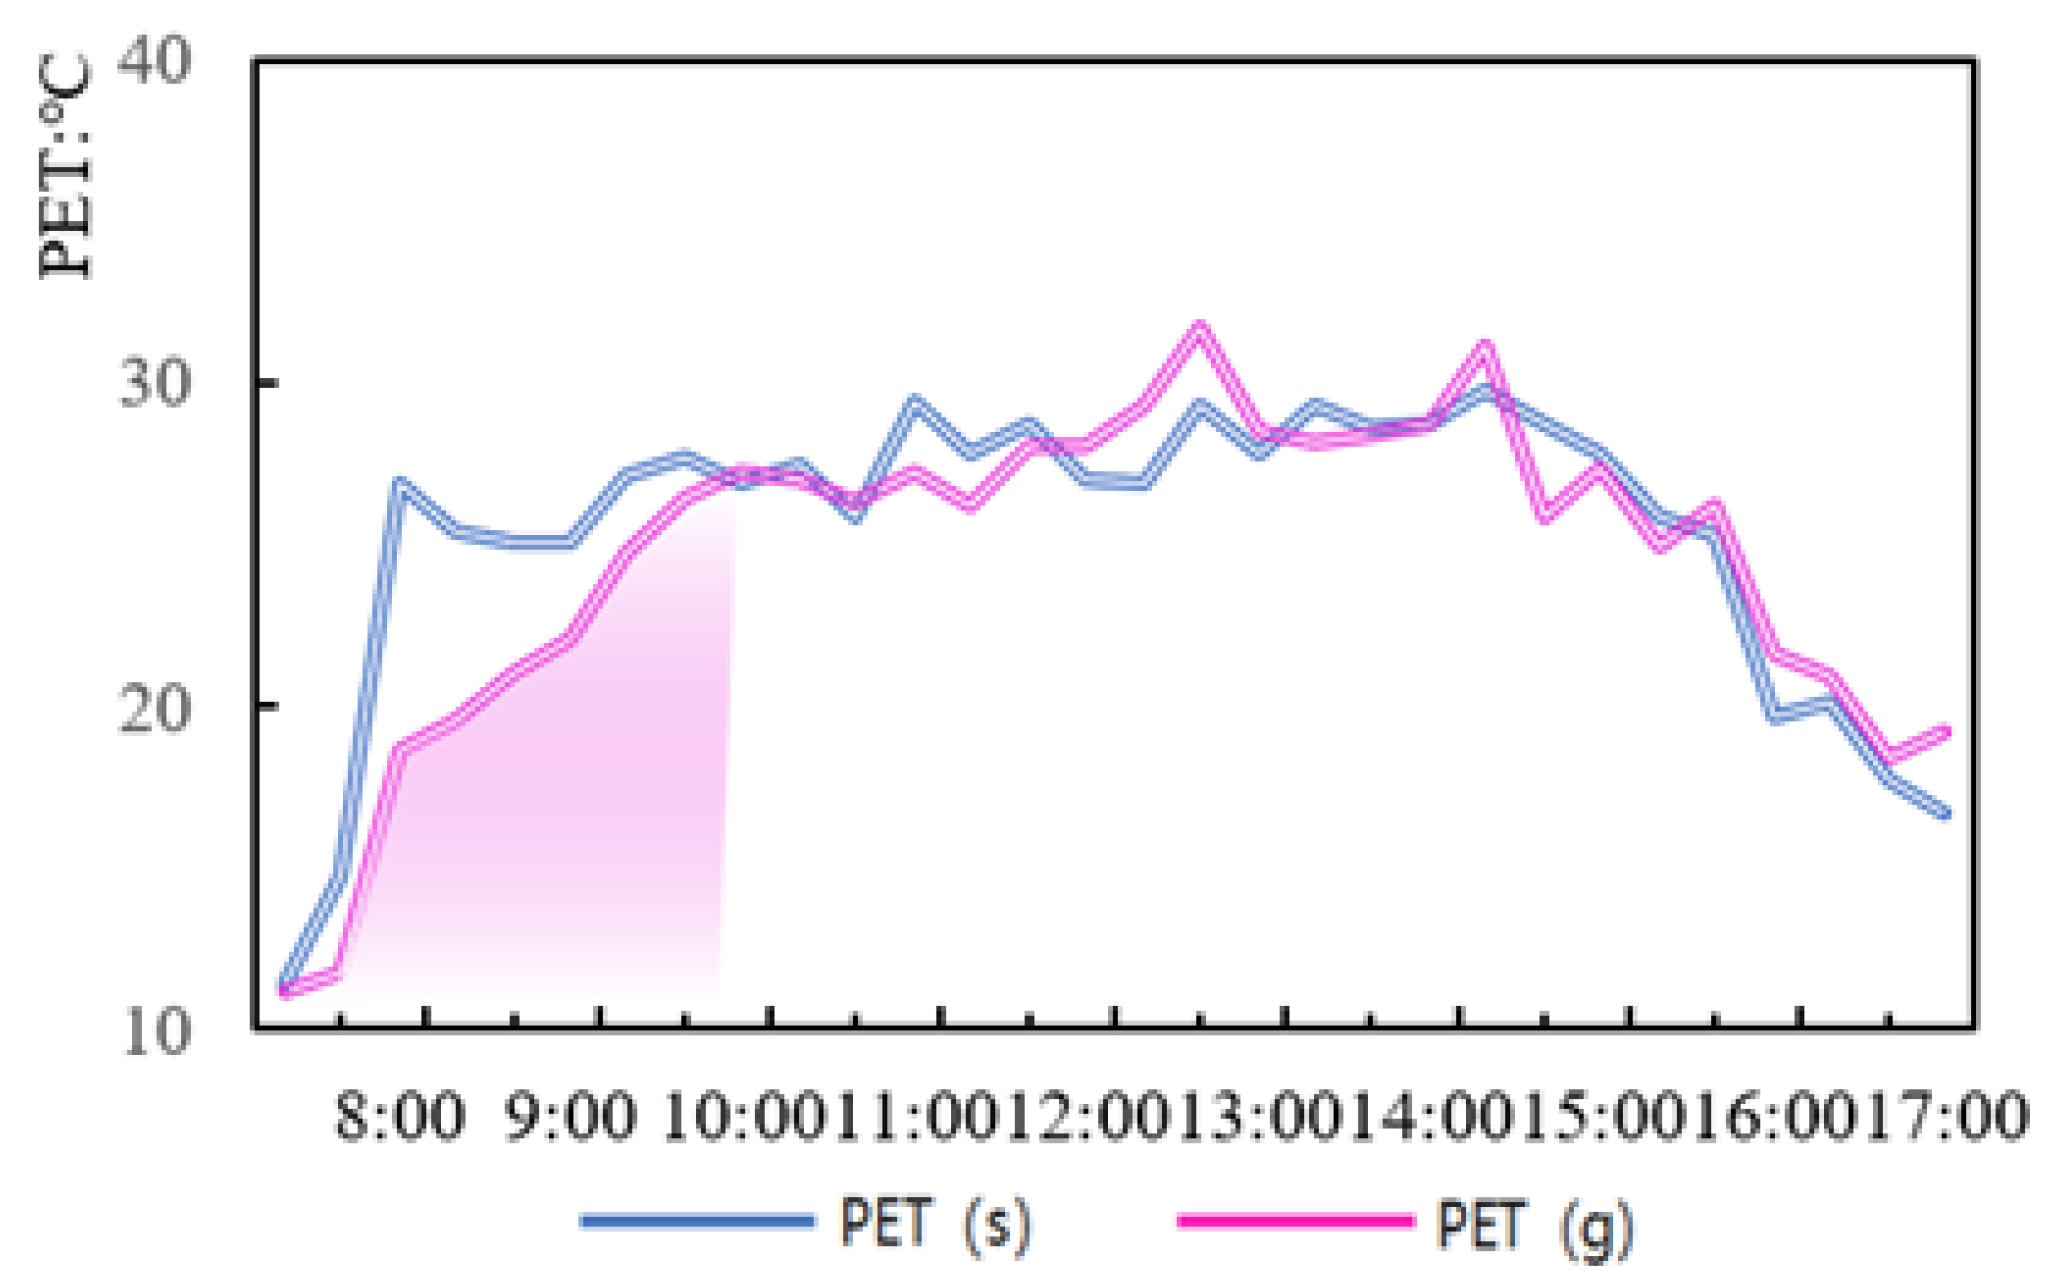
The results of the representative days in summer are shown in
Figure 11, below. There are some deviations in the results of PET (s) and PET (g) during the test time of a whole day: in terms of the overall range, the results of PET (s) are in the range of (42.1 °C, 58.5 °C), and the average result is 52.1 °C. The result range of PET (g) was (37.4 °C, 64.1 °C), the average result was 50 °C, and the average deviation was 2.1 °C. The PET levels were high throughout the day, maintaining a trend of first rising and then falling. According to statistics, the results of PET (g) were low for more than 73.2% of the time, and the maximum deviation reached 10.4 °C at two o′clock in the afternoon.
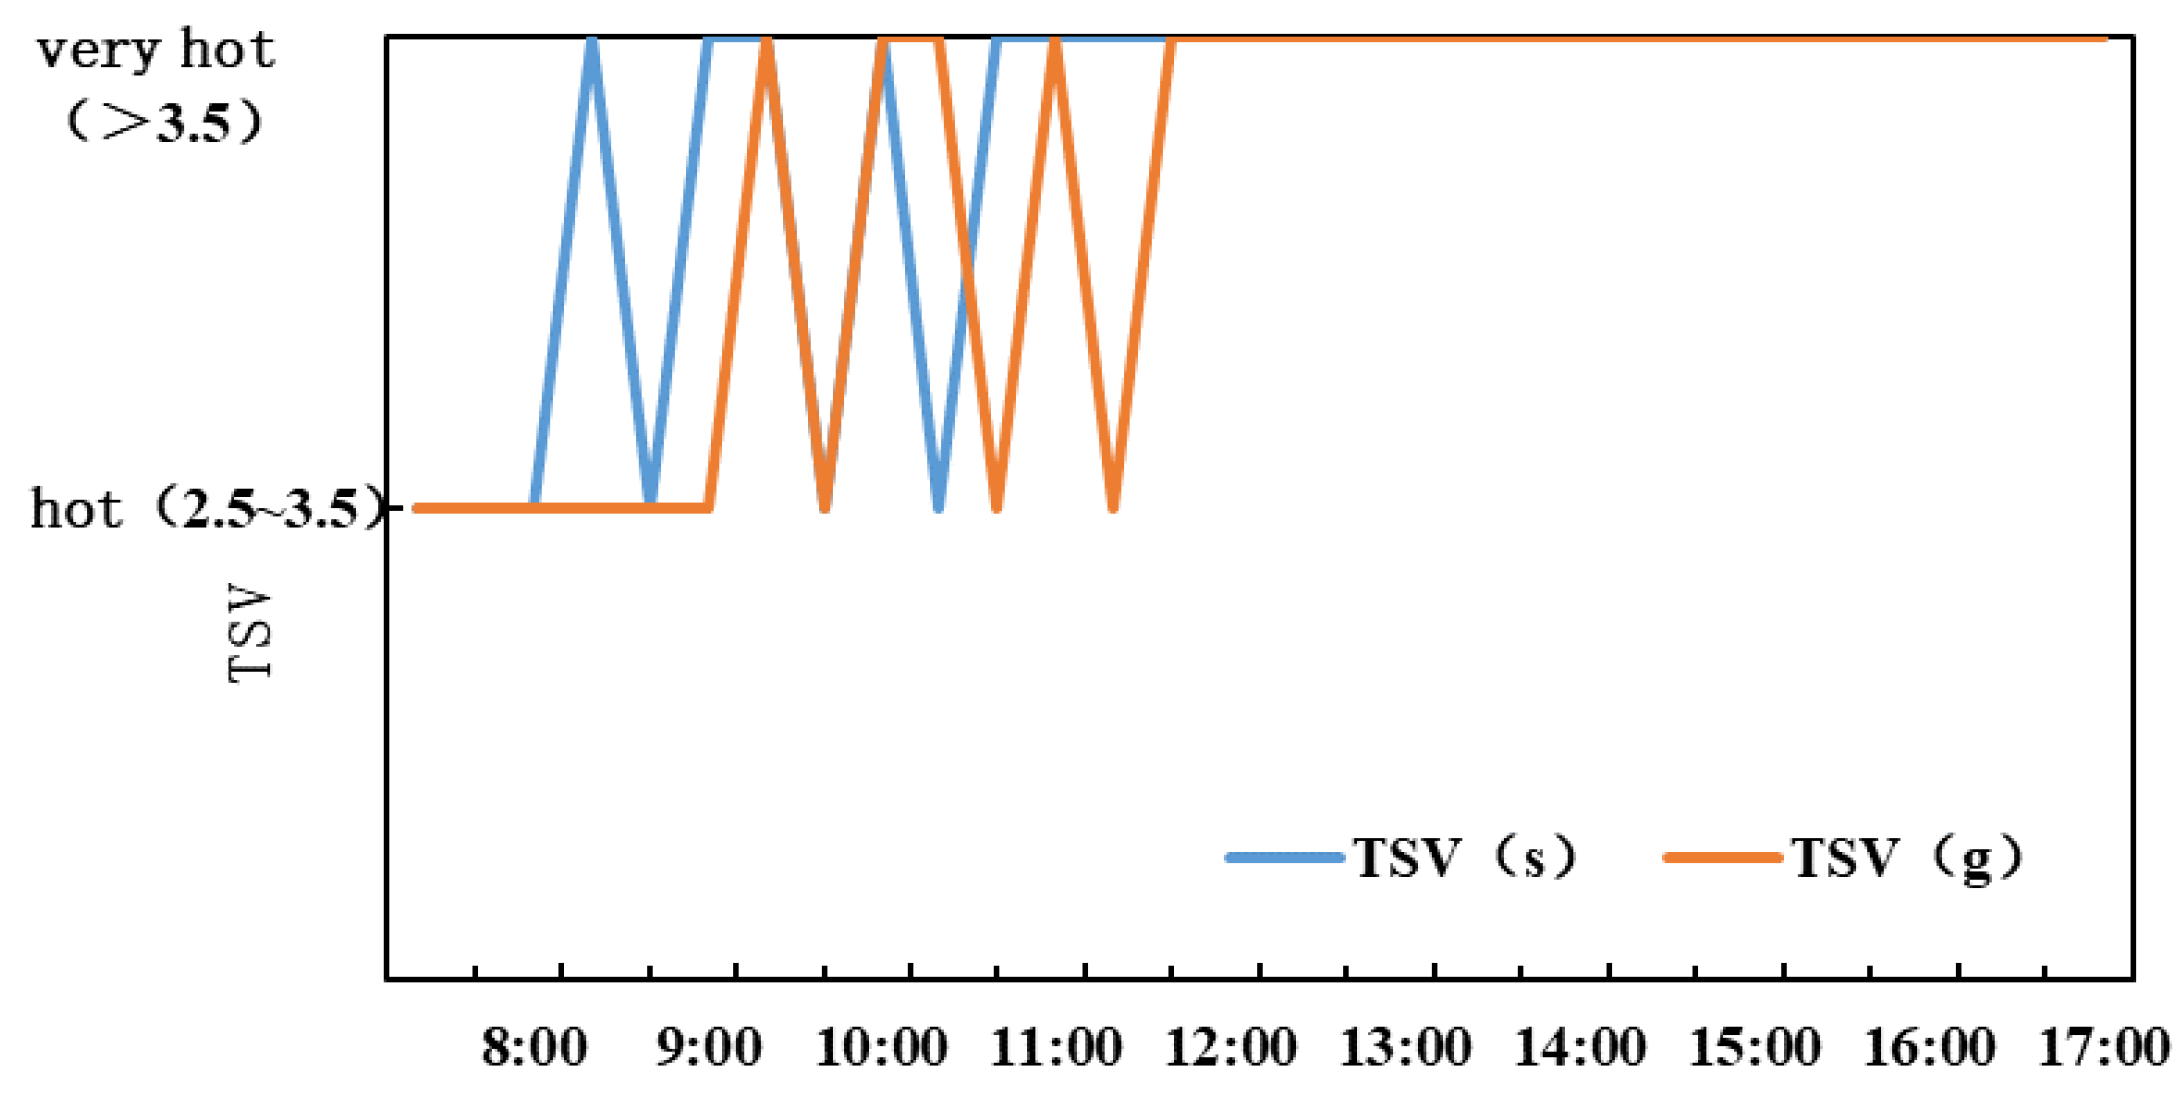
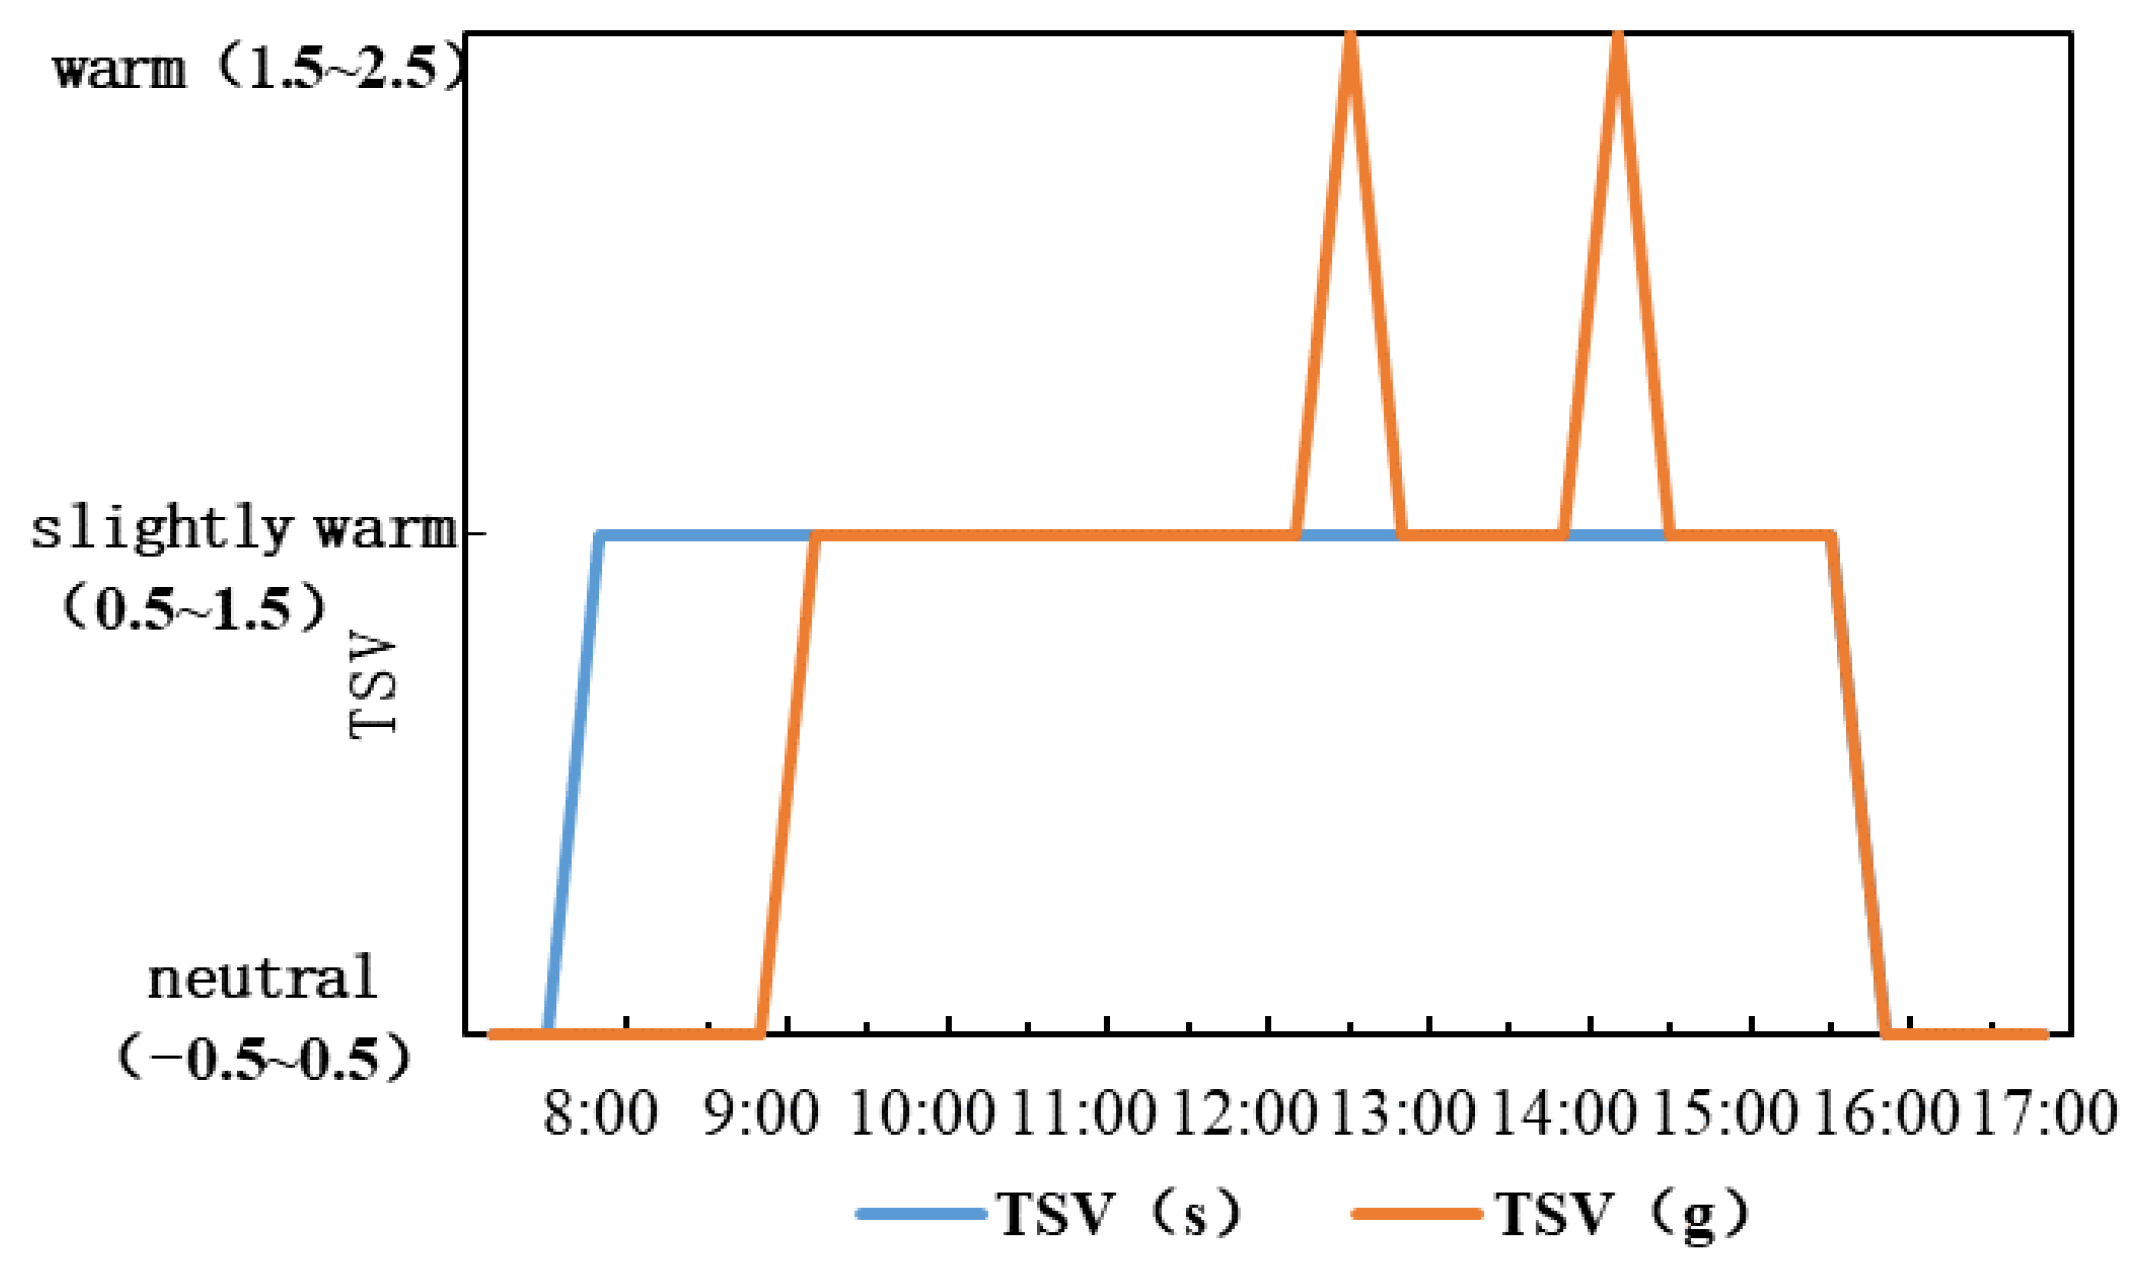
As shown in
Figure 12, the thermal sensation corresponding to this is concentrated between hot and very hot in the morning. At this time, the results of the two methods are different at some time points, and TSV (g) will overestimate people′s thermal sensation between 9 and 12 o′clock. After 12 o′clock, even though there is a large error in PET, due to the high temperature outdoor environment in summer, the thermal sensation of both reaches a very hot level. At this time, the TSV obtained by the globe-thermometer method is accurate.
3.4.2. Statistics and Analysis of PET and TSV Results in the Transition Season
As shown in
Figure 13, below, the results of October 19th are taken as being representative of the transition season. During the test time, the results of PET (s) and PET (g) have an enormous span and a high degree of coincidence, and there is only a significant deviation in a small part of the time. In terms of overall range, there was a significant change in PET levels throughout the day in the morning and evening, with a range of PET (s) results of (11.4 °C, 29.8 °C) and an average of 25.3 °C; the range of PET (g) results was (11.2 °C, 31.7 °C), the average result was 24.5 °C, and the average deviation was 0.8 °C. According to statistics, the deviation was mainly before 9 a.m., and the results of PET (g) were low, about 4 °C lower than PET (s) on average (that is within the time period shown in the shadow of
Figure 13). In the rest of the time, the results of the two sets of data are very close. That is to say, the PET results obtained from the black bulb thermometer data in the transition season are relatively accurate.
The thermal sensation data correspond to
Figure 14 and show that people′s thermal sensation is slightly warm in the whole day under TSV (s) results; TSV (g) underestimates thermal sensation as neutral before 9 a.m. and overestimates thermal sensation as warm in a small number of times in the afternoon; and the results of other times are consistent with TSV (s) results. As can be seen from this, in the transition season, when the temperature is moderate and the wind speed fluctuation is small, the TSV obtained from the black bulb thermometer can be considered to be accurate.
3.4.3. Statistics and Analysis of PET and TSV Results in Winter
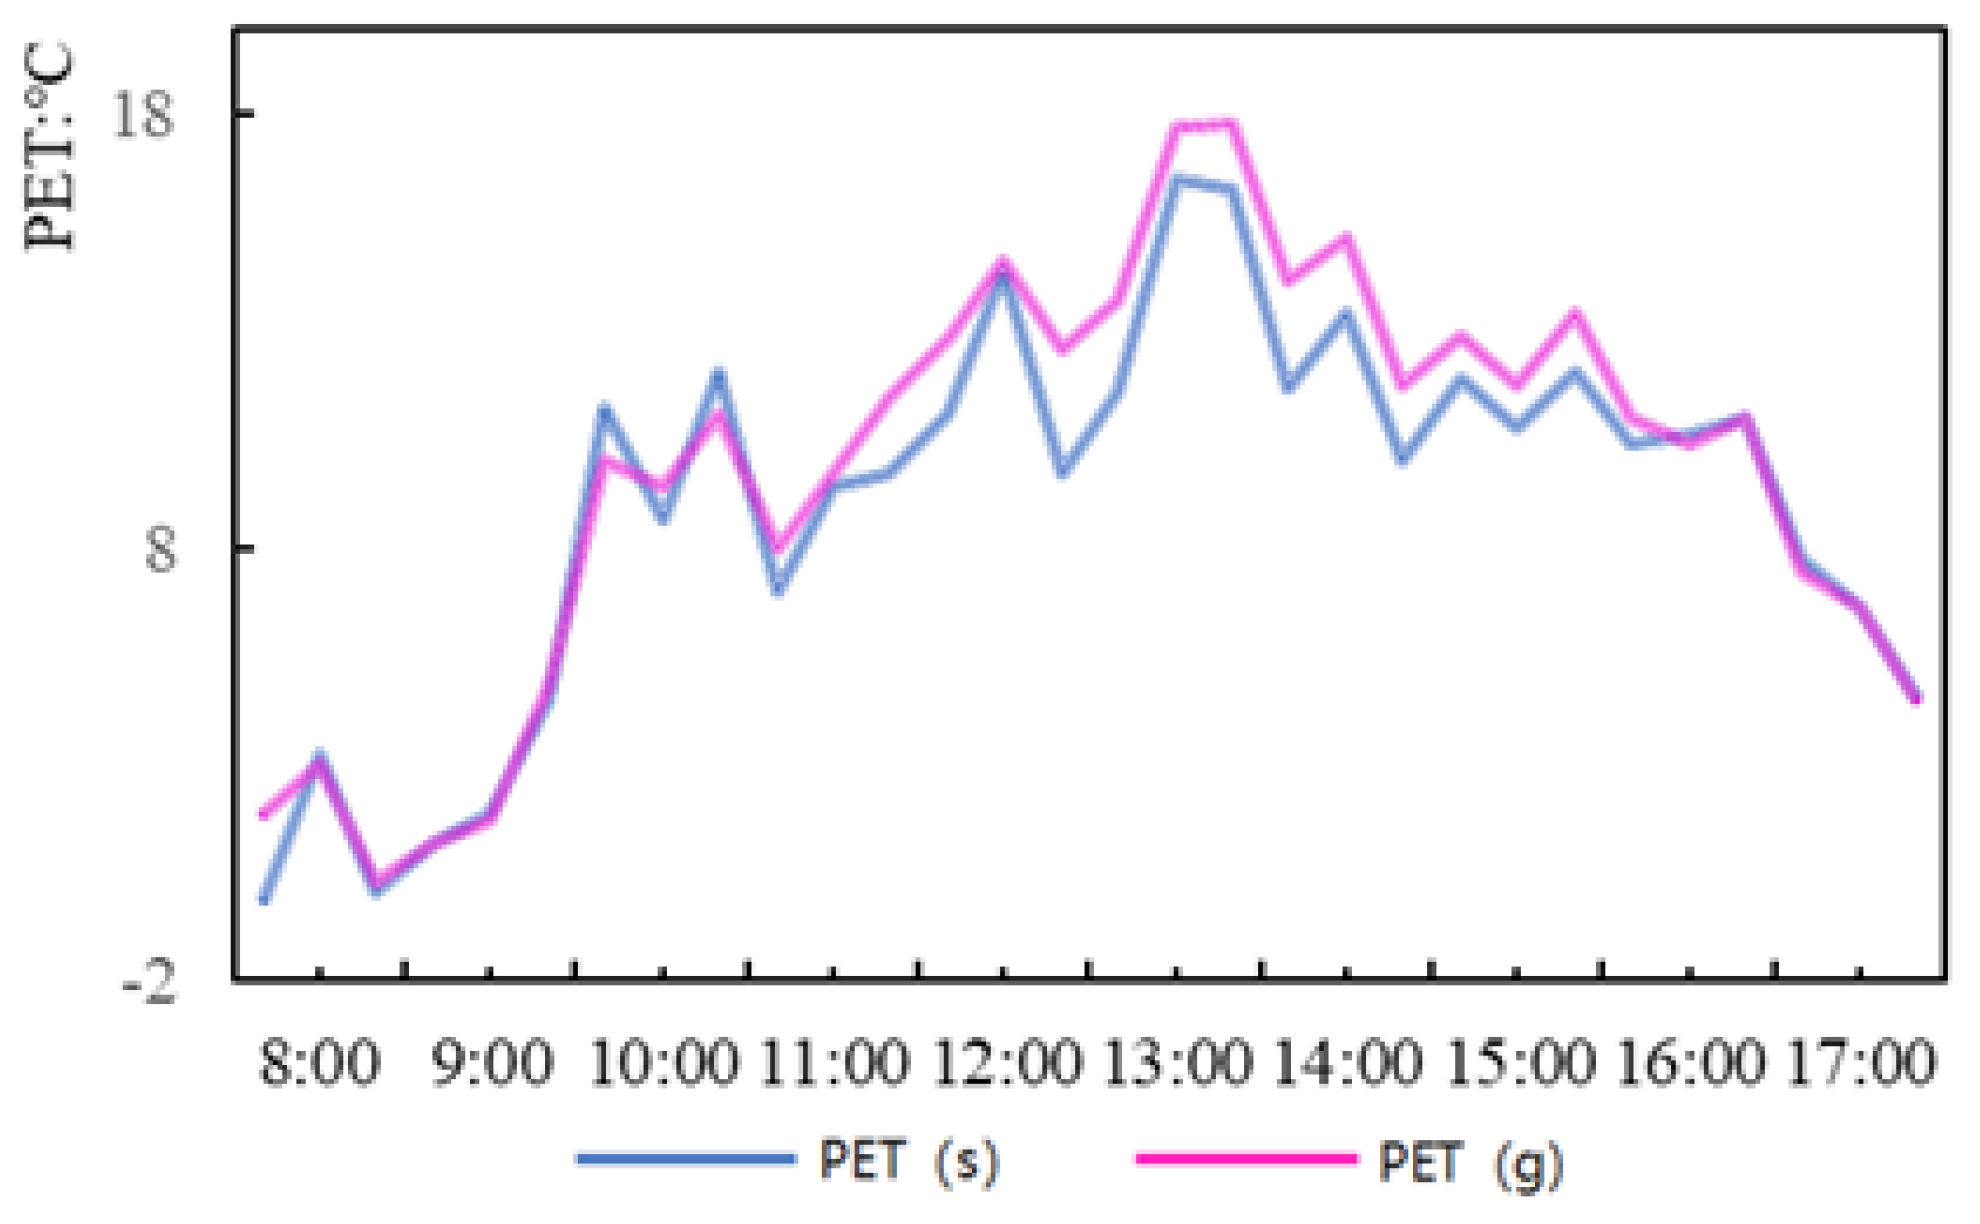
The data of the representative day in winter are shown in
Figure 15, below: the trends of the two kinds of PET on this day are basically coincident, rising from 09:00. From 10:00 to 16:00, the results of PET fluctuate with the change of meteorological parameters, reaching the highest at 13:00, and then declining. The overall PET (s) range was (−0.1 °C, 16.5 °C), with an average result of 9 °C. The PET (g) range was (0.3 °C, 17.8 °C), with an average result of 9.7 °C and an average deviation of 0.7 °C. A detailed analysis of the deviation between PET (g) and PET (s) shows that the PET (g) results are slightly overestimated most of the time. However, the results of the two sets of data are always very close, thus indicating that the deviation of Tmrt obtained by the two methods has little effect on the calculation results of PET.
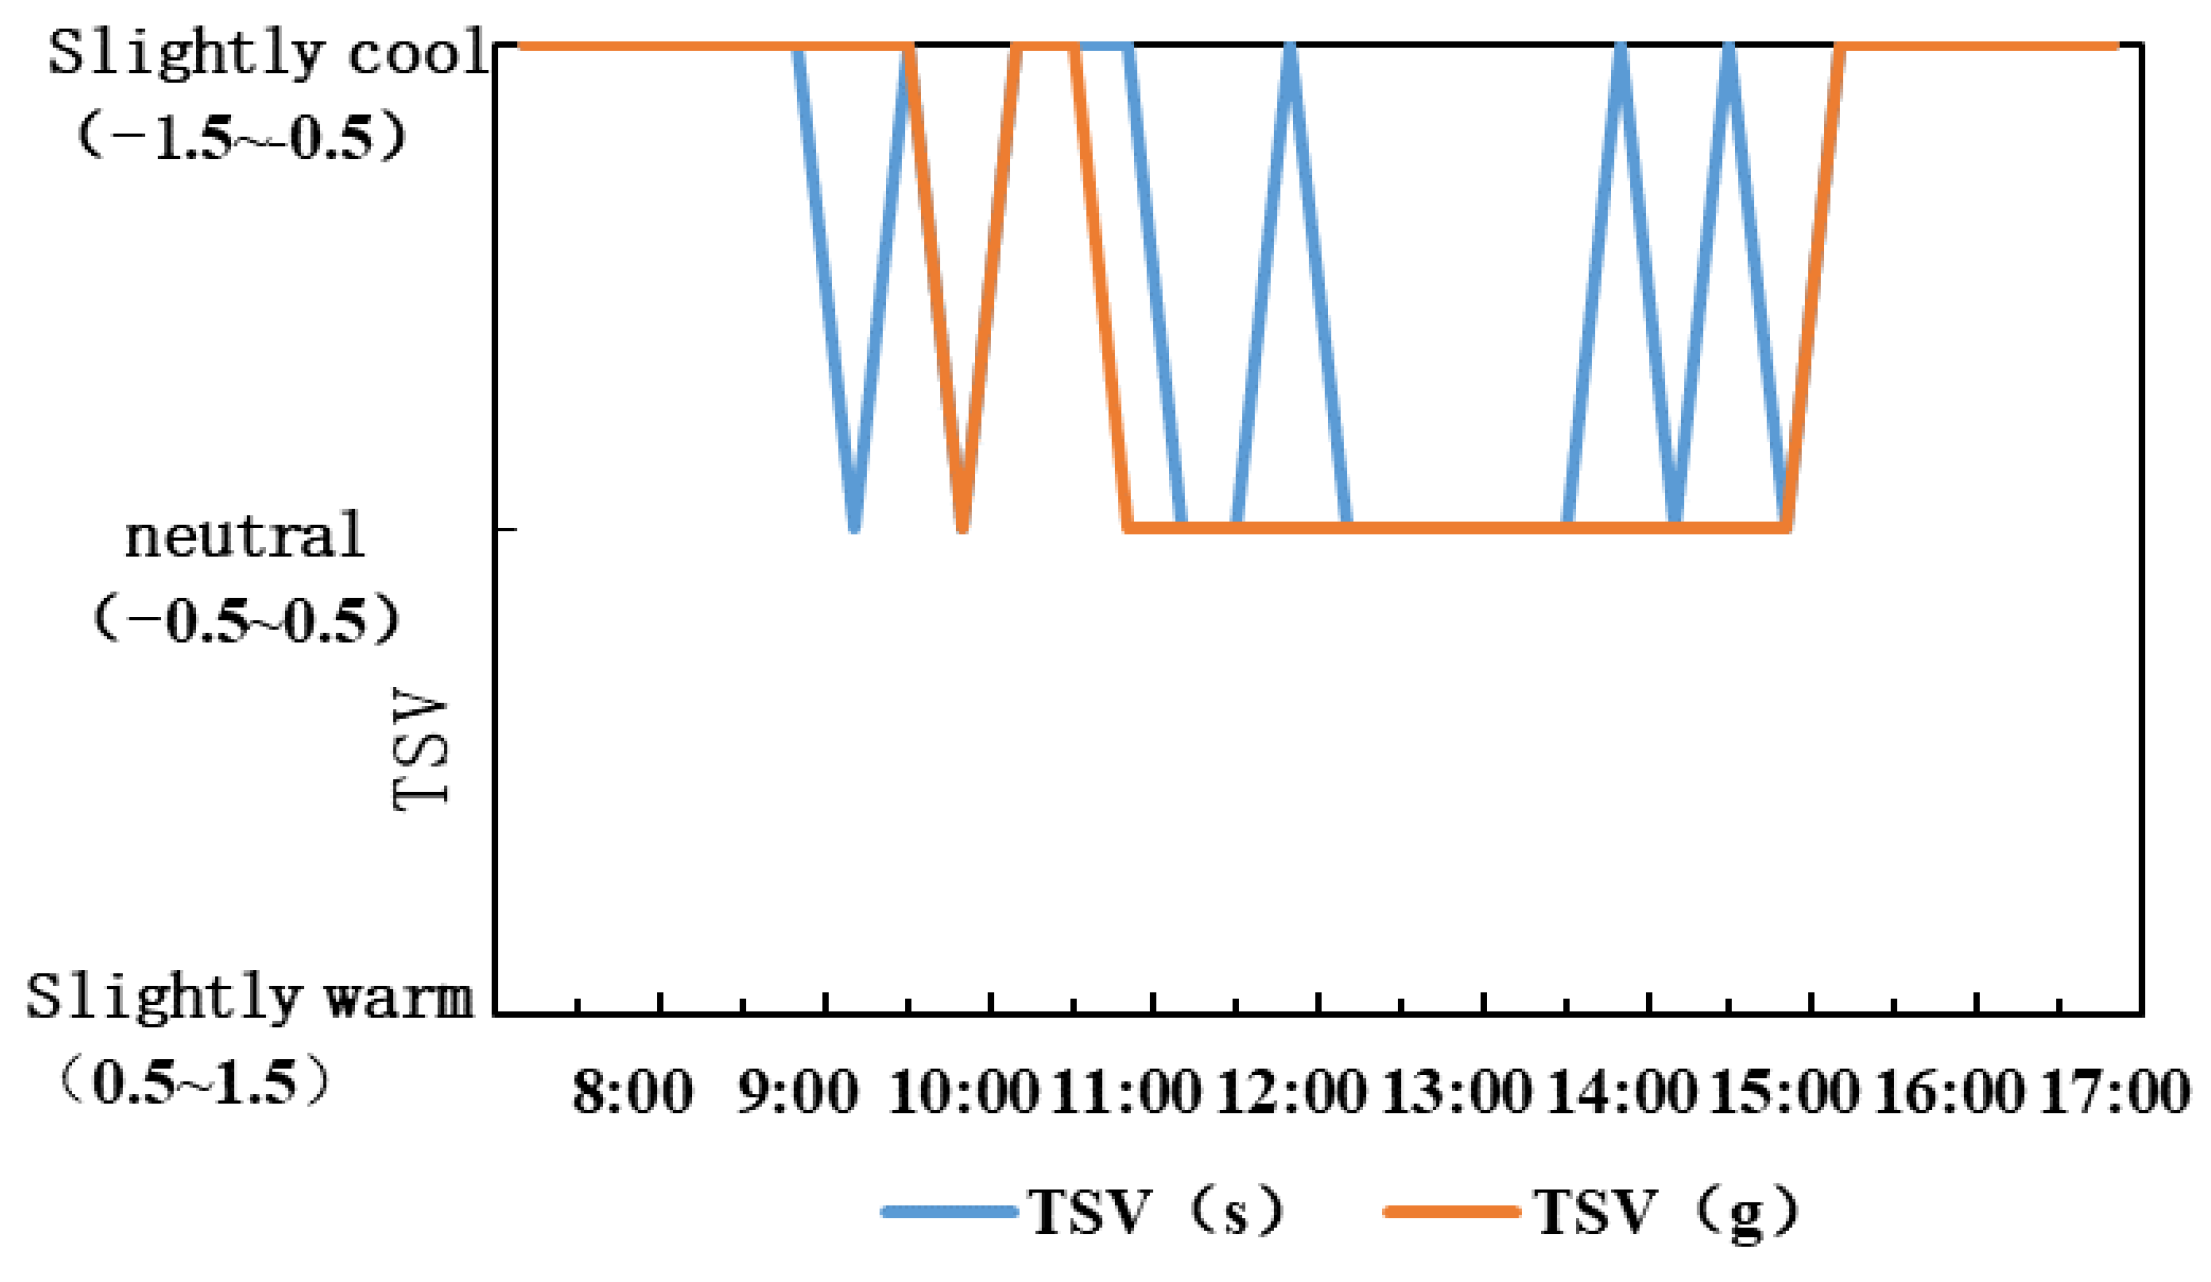
The thermal sensation data correspond to
Figure 16 and show that the TSV (s) and TSV (g) are different at some moments. According to the results of TSV (s), people feel slightly cool in the morning, and as time goes on, the heat sensation will fluctuate between slightly cool and moderate. However, the TSV (g) is moderate from 11 o′clock to 15 o′clock, and the results are overestimated. This means that, in the winter, the TSV results based on the results of the globe-thermometer method will overestimate people′s thermal sensation during some times in the afternoon.
4. Discussion
4.1. Cause Analysis of Tmrt Error Obtained by Black Bulb Thermometer
A comparison of the six-direction radiation method with the globe-thermometer method over several seasons revealed two major problems with the accuracy of the black bulb thermometer: systematic error and fluctuating error. Systematic error refers to the consistent underestimation or overestimation of the calculation results of black bulb thermometer; this has also been reflected in previous studies. Wang et al. studied this in depth and showed that this is related to the material of the spherical shell of the thermometer [
15]. The fluctuating error mainly refers to the fact that, in a short period of time, the Tmrt results calculated by the globe-thermometer method will fluctuate around the data results of the six-direction radiation method, and the fluctuation amplitude varies with the change of meteorological parameters.
It is found that there are many meteorological factors that affect the accuracy of the mean radiation temperature calculated by the black bulb thermometer, and they are intercoupling with each other. When the direct solar radiation is strong, the radiation heat exchange on the surface of the black ball is very large, while the convective heat exchange cannot reach a balance with it in time, due to the existence of wind speed, which is prone to a greater degree of imbalance. Therefore, the corresponding results of Tmrt (g) will have a greater deviation in the environment of high temperature and strong shortwave radiation. The nonlinear change of wind speed directly affects the actual heat transfer effect of the globe thermometer, resulting in the fact that the spherical shell cannot always maintain a state of thermal equilibrium. This insufficient thermal response results in the fluctuation of the black bulb thermometer’s Tmrt calculation results with the instantaneous wind speed. At the same time, when the wind blows to the black ball from one direction, the air velocity near the surface of the ball at different angles is different, and the corresponding convective heat transfer will also be uneven. The results of Tmrt obtained by black bulb thermometer will also have a certain impact. If the wind direction changes constantly during the test, it will be unfavorable to the test results of the black bulb thermometer.
4.2. Applicability and Correction of Globe Thermometer Method under Different Meteorological Parameters
Through the experiment, it is known that the mean radiation temperature obtained by using the black bulb thermometer in various meteorological parameter intervals is not always accurate, and the scope of application is limited. Under the coupling influence of shortwave radiation and wind speed, when the shortwave radiation is below 100 W/m2, the influence of wind speed is relatively weak, and the calculation results of the original formula of the globe-thermometer method are more accurate. However, when the shortwave radiation is above 100 W/m2, the influence of wind speed is gradually obvious, and Tmrt(g) is often inaccurate.
Firstly, referring to the experimental results, we selected the experimental data within the range of shortwave radiation exceeding 100 W/m2 in different seasons and weather as the basic data set to optimize the calculation formula under this working condition. Then it was randomly divided into a training set and test set according to the ratio of 7:3. Taking the calculation result of the six-direction method as the standard, the parameters in the calculation formula of globe thermometer method were modified by the optimization algorithm: (1) Initialize the formula to calculate parameter X. (2) Add random disturbance to X to generate X′. (3) Evaluate whether X′ is better than X, and if so, replace X; otherwise, replace X according to a certain probability. (4) Keep iterating and updating to find the best X to make the result of Tmrt (g) close to the result of Tmrt (s).
The root-mean-square error (RMSE) was used as the evaluation function. The smaller the RMSE value was, the higher the precision of the results was. The verification information is shown in
Table 8, below.
The revised calculation formula is as follows:
where T
g is the black globe temperature in °C; T
a is the air temperature in °C; D is the diameter of the black sphere in m; ε
g is the surface emissivity of the black sphere; and V
a is the wind speed at the height of the black sphere in m/s.
It is verified that the RMSE of the training set and the test set with the modified formula is significantly lower than that with the original formula. After the correction, the accuracy of the data reached more than 90%. Referring to the range of environmental parameters of the measured experimental data, the applicable scenarios of the globe-thermometer method are summarized as follows: in cold regions, when the shortwave radiation is in the range of 100–900 W/m2, the wind speed is lower than 3 m/s, and the shortwave radiation is below 100 W/m2, the original formula is used for calculation; when the shortwave radiation exceeds 100 W/m2, the results calculated by the modified formula are more accurate.
4.3. Optimization of Radiant Heat Transfer Calculation in Outdoor Thermal Comfort Model
The existing outdoor thermal comfort evaluation model for radiation is mainly handled by integrating all the factors affecting radiation heat exchange into a single index, such as mean radiation temperature or black bulb temperature. Take the PET model as an example. The treatment method for outdoor radiation is to integrate all the factors affecting radiation heat transfer into a single index of mean radiation temperature. However, the following problems will arise this way: in the actual outdoor environment, the radiation received by various parts of the human body is uneven, and the unified index in all directions cannot truly reflect the thermal sensation of the human body in the outdoor radiation environment. Secondly, outdoor radiation can be divided into shortwave radiation and longwave radiation, and the existing radiation index cannot completely reflect the outdoor environmental radiation state acting on the human body.
In the calculation model of PET, the formula describing the radiation heat exchange amount, R, is as follows:
where A
DU represents the naked body surface area of the human body, m
2; f
cl represents the surface expansion coefficient after wearing clothes; f
eff represents the effective radiant heat transfer area coefficient of the human body; ε
p represents the emission coefficient of the human body surface; σ is the Stefan–Boltzmann constant, 5.67 × 10
−8 W/(m
−2·K
−4); Tmrt represents the mean radiation temperature, °C; and T
s represents human skin temperature, °C.
The optimization for this calculation is as follows: (1) the radiation heat transfer is split into the shortwave radiation heat transfer RS (W/m2) and the longwave radiation heat transfer RL (W/m2).
The heat exchange of longwave radiation is calculated as follows:
where T
sur represents the average surface temperature of the environment, °C; and T
sk represents the average human skin temperature, °C.
where T
y represents the sky temperature, °C; SVF represents the sky vault visibility; T
i represents the surface temperature of each underlying surface, °C; F
i represents the corresponding angle coefficient of each underlying surface; and the sum of angle coefficients plus SVF is 1.
The shortwave radiation heat transfer is calculated as follows:
where α represents the surface absorptivity of the human body, and its value depends on the skin color and clothing of the human body, taking 0.43 for light color, 0.63 for medium color, and 0.79 for dark color; K
i represents the amount of shortwave radiation in a certain direction of up, down, east, west, south, and north; A
i represents the angle coefficient of the direction of shortwave radiation relative to the human body; and the sum of the angle coefficients of the six directions is 1.
Considering the anisotropy of radiation in mechanism, the calculation of radiation heat transfer is changed from only depending on the mean radiation temperature to calculating the shortwave radiation and longwave radiation heat transfer separately by inputting multi-parameters. The change of calculation formula reduces the error caused by the substitution of a single index, such as a mean radiation temperature or black globe temperature. It can play a better role in the complex outdoor radiation environment, and also provide a basis for further study of the relationship between the change of longwave and shortwave radiation and human thermal sensation and thermal comfort.
4.4. Study Limitation
In this study, a large number of basic studies were carried out on the meteorological factors affecting the difference between the two mean radiation temperatures, so as to analyze the impact of the calculation deviation of the outdoor mean radiation temperature on the thermal comfort index. However, it needs to be acknowledged that there are still insufficiencies in this study, and refinements are still needed in subsequent studies. Firstly, in terms of the correction of the formula for the black bulb thermometer method, the range of some meteorological parameters, such as air temperature and wind speed, is limited by the location and number of experimental data collected. The application scope of the revised formula is relatively limited, and its applicability to other climate regions needs to be verified. Secondly, on the modification of the radiation calculation module of the outdoor thermal comfort model, future research is expected to continue to optimize the human radiation heat transfer calculation model after fully considering the research needs of the outdoor radiation comfort mechanism, so that it can better represent the outdoor human thermal comfort.


