Article

Unusual Enhancement of Midlatitude Sporadic-E Layers in Response to a Minor Geomagnetic Storm

1
Institute of Space Science and Applied Technology, Harbin Institute of Technology (Shenzhen), Shenzhen 518055, China
2
Beijing Institute of Applied Meteorology, Beijing 100044, China
3
Department of Space Physics, School of Electronic Information, Wuhan University, Wuhan 430072, China
*
Author to whom correspondence should be addressed.
Submission received: 28 March 2022 / Revised: 10 May 2022 / Accepted: 11 May 2022 / Published: 16 May 2022
(This article belongs to the Special Issue Mesosphere and Lower Thermosphere)

Abstract

:
This study investigates the variations of middle and low latitude sporadic-E (Es) layers in response to a geomagnetic storm. Es layers are observed by five ionosondes located in the Eastern Asian sector. The critical frequencies of Es layers (foEs) at six stations increased in sequence from high latitude stations to low latitude stations after IMF/Bz turning southward. Lomb–Scargle analysis shows the amplification of semidiurnal oscillation amplitude in the vertical height of Es layers during geomagnetic disturbance. Modeling results of the NCAR Thermosphere-Ionosphere-Electrodynamics General Circulation Model (TIEGCM) show the enhancement of the wind field in the mesosphere and the lower thermosphere (MLT) region. Our study provides evidence that the enhanced wind field in the MLT region during the storm period could result in the enhancement of Es layers at middle and low latitude.

1. Introduction

Sporadic-E layers (Es) are thin dense layers of plasma that appear at the height of the E region ionosphere. Low and middle latitude Es formation is the result of wind shear effects on the meteor-originated metallic ions through collisional and electromagnetic processes in the mesosphere and the lower thermosphere (MLT) region [1,2].
Although it is generally accepted that Es generation is due to wind shear, variations of Es are affected by many factors [1,2]. Lower atmospheric activity, ionospheric electrodynamics and plasma instability, as well as geomagnetic disturbance, all contribute to the day-to-day variability of Es, which leads to the difficulty of Es prediction. The atmospheric waves, i.e., tidal waves and planetary waves, can modulate the height and density of Es layers with periods ranging from a few hours to a few days [3,4]. Atmospheric gravity waves propagating to Es height increase the gradient of wind profile, distort the thin layer of Es and consequently generate electrodynamic instabilities. Due to electrodynamic/plasma instabilities, the typical thin layer Es can evolve into E region field-aligned irregularities, which can be observed as quasi-periodic (QP) echoes by VHF coherent scatter radar or as the Es diffuse echoes in ionograms [5,6].
Geomagnetic storms are driven by temporary disturbances of the Earth’s magnetosphere caused by solar wind shock waves or cloud of magnetic field that interact with the Earth’s magnetic field. Numerous studies have confirmed that the earth’s ionosphere can be significantly influenced through the interaction between the solar wind and the magnetosphere-ionosphere-thermosphere (MIT) system. Different from the distinct F region disturbances due to geomagnetic storms, the impacts on the lower ionospheric region (E and D region) remain unclear. As a great manifestation, Es presents a good chance to study the response of the ionospheric E region to magnetic storms. Previous studies showed confusing conclusions on the behavior of Es layers during geomagnetic active periods. Batista and Abdu [7] investigated Es behavior over Cachoeira Paulista, a station located close to the center of the South American Magnetic Anomaly (SAMA), during a geomagnetic storm period, and found significant enhancements of Es parameters, including both the critical frequency of Es (foEs) and the blanketing frequency of Es (fbEs) after the initiation of geomagnetic disturbance. Maksyutin and Sherstyukov [8] revealed that critical frequency and occurrence of Es layer response to solar and geomagnetic activity level variations can be both positive and negative. Pietrella and Bianchi [9] calculated the occurrence rate of the Es layer over Rome for frequencies foEs greater than a given threshold value fT, P (foEs > fT), (fT = 3, 4, 5, 6, 7, 8, and 9 MHz) and found that P (foEs > fT) did not depend on solar and geomagnetic activities. Abdu et al. [10] investigated the response of a low-latitude Es layer during a magnetically disturbed period and found that the formation and disruption of Es layers were strongly influenced by prompt penetration electric field (PPEF). Zhou et al. [3] studied the correlation between the occurrence rate of Es and Kp index, and discovered that the occurrence rate of Es increased statistically with the enhancement of the Kp index.
In this study, we report a typical event study of variations of Es layers in response to a minor geomagnetic storm by using ionosondes located in the Eastern Asian sector. Compared with other storm events, the duration of the geomagnetic Dst (Disturbance storm-time) staying at the low level is longer. Besides, before this geomagnetic storm, a substorm occurred. By utilizing the wind field from TIEGCM model, we aim at analyzing the possible mechanism that leads to the disturbance of sporadic E layers in middle and low latitude region.

2. Data Sets

The ionosonde chain consists of five ionosondes located at Yakutsk (126.00° E Geographic Longitude (Glon), 62.00° N Geographic Latitude (Glat), 52.65° N Magnetic Latitude (Mlat)), Mohe (122.37° E Glon, 53.50° N Glat, 42.41° N Mlat), Jeju (125.30° E Glon, 33.43° N Glat, 24.04° N Mlat), Wuhan (114.61° E Glon, 30.53° N GLat, 20.68° N Mlat), Hainan (109.13° E Glon, 19.52° N Glat, 8.54° N lLat). Figure 1 presents the Geographical distribution of all stations. Mohe, Wuhan, and Hainan are the integrated component of the Chinese Meridian Project [11]. Data of Yakutsk and Jeju can be downloaded at http://ulcar.uml.edu/DIDBase/ (accessed on 1 July 2013). The critical frequency and virtual height of Es (foEs and h’Es) are first automatically scaled from ARTIST (Automatic Real-Time Ionogram Scaler with True height analysis software and then checked manually. Geomagnetic data are obtained from the OMNI website (https://spdf.gsfc.nasa.gov/pub/data/omni/high_res_omni/, accessed on 4 July 2013).

3. TIEGCM

The thermosphere-ionosphere-electrodynamics general circulation model (TIEGCM), developed at the National Center for Atmospheric Research (NCAR) High-Altitude Observatory (HAO), is a global three-dimensional (3-D) numerical model that simulates the coupled thermosphere/ionosphere system. The model solves the 3-D ion and neutral momentum, energy, and continuity equations on constant pressure levels, with a lower boundary around 97 km, and an upper boundary extending to around 600 km [12,13]. The horizontal grid of the model is 5° × 5° in latitude and longitude. The main inputs of the model include the solar radiation index F107, the 81-day average value of the solar radiation index F107A, and the geomagnetic index Kp, etc., and auroral particle sedimentation and polar convection are also added in the model. Besides, the tidal perturbations calculated by the Global Scale Wave Model (GSWM) [14] are specified at the lower boundary to account for the dynamical coupling between the lower and middle atmosphere and the upper atmosphere. TIECGM can calculate the global distribution of temperature, density and wind field in the range from 97 km to about 600 km.

4. Results

Figure 2a–c show the geomagnetic conditions from 4 July to 8 July 2013, including the SYM-H index, interplanetary magnetic field (IMF/Bz), AE index. We can see from Figure 2a, during this geomagnetic storm event, the sudden storm commencement (SSC) occurred at 14:20 UT on 5 July, and SYM-H reached the maximum of ~30 nT at 19:45 UT on 5 July. Then, SYM-H declined sharply and reached the minimum of ~−80 nT at 06:30 UT on 6 July and remained at the lowest level for a long time, almost for 16 h. After the main phase, the geomagnetic event started to recover at 22:00 UT on 6 July and the SYM-H value recovered to around 0 nT at 18:30 UT on 7 July. Figure 2b demonstrates IMF/Bz turned south at 20:15 UT on 5 July. That IMF/Bz turns south indicates the momentum transfer from the solar wind into the magnetosphere of earth increase obviously. It is worth noting that the AE index variation, as shown in Figure 2c, based on high-latitude magnetograms, represented enhanced substorm activity that began at 00:00 UT on 5 July, just before the geomagnetic storm we studied, and lasted for about 10 h.
Both the blanketing frequency (fbEs) and the critical frequency of Es layer are important parameters for Es layers. However, as shown in Figure 3, the fbEs is not always recorded in ionograms when Es occurs. Thus, we focus on the variation of foEs in this study. Figure 4 demonstrates the observation of foEs at five stations, located at Eastern Asian sector. The red and green curves represent mean and median value of foEs, which are calculated by using the Es data from 30 June to 4 July during the geomagnetically undisturbed period. After the IMF/Bz turning southward (~20:00 UT on 5 July), foEs observed at Yakutsk, Mohe, Jeju, Wuhan, and Hainan, enhanced from high latitude to low latitude in sequence. The beginning times of increases at the five stations were 20:30 on 5 July, 20:45 on 5 July, 23:45 on 5 July, 00:30 on 6 July, 01:00 on 6 July, respectively. Compared to the mean and median values of foEs, the enhancement of foEs resulting from the geomagnetic storm is 3–10 MH, and that of Hainan, located at lower latitude, is the smallest. It is noteworthy that only Yakutsk and Mohe, located at higher latitudes, in addition to the fore-mentioned enhancement, have another increase in foEs before the southern turning of IMF/Bz. This enhancement may relate to the substorm, which began at 00:00 UT on 5 July.
The altitude descent of Es layers is attributed to the global tidal wind system in the MLT region [15]. This means that Es height is a good indicator to demonstrate the tidal influence on Es layers. Figure 5 illustrates the amplitude spectrum of h’Es calculated by Lomb–Scargle analysis for the period of 12 h at different stations. The black dash line indicates the onset of the storm. As seen from Figure 5, semidiurnal amplitude in h’Es shows obvious enhancement after the storm onset, which means the enhanced tidal modulation on Es.

5. Discussion

In the above analysis, we have shown the response of Es layers during a minor geomagnetic disturbed event.
As seen in Figure 4, sequential enhancements of Es layers were observed in latitudinal distributed ionosondes in the Eastern Asian sector over this minor geomagnetic storm. Comparing with mean and median value, the size of the enhanced Es layers during the geomagnetic disturbed period is 3–10 MHz. As widely known, the generation of Es layers is attributed to neutral wind dynamics in the MLT region [1,2], therefore wind is one of the dominant factors that determines the intensity of Es layers.
Owing to the lack of direct wind observations at 100–150 km, we use the TIE-GCM model to calculate wind in this region. Figure 6 shows the simulation result of wind at 100–150 km at these five stations. The left row is for meridional wind, and the right row is for zonal wind. As can be seen from the left row of Figure 6, meridional wind at all stations shows evident growth after IMF/Bz turning south. In addition, Yakutsk and Mohe show enhanced meridional wind at midday on 5 July, which may link to the increase in foEs at these two stations before the major phase of this storm. For zonal wind, all stations present increase at 130–150 km apart from Hainan. Besides, the enhancement of zonal wind, before IMF/Bz turning south, can also be seen in Yakutsk and Mohe, which may be attributed to the substorm event during 5 July, just before this minor storm that we focused on.
Wind dynamic plays a dominant role in the formation of Es layers. However, due to the dearth of wind observations at MLT region, the magnetic influence on wind in MLT region is not well understood. Also, the responding mechanism of Es layers to storm is still a mystery. At high latitudes, Johnson et al. [16] and Johnson and Virdi [17] suggested that the drastic influence of geomagnetic storm was found in the zonal wind with the enhancement of eastward mean flow. At middle latitude, Ma et al. [18] demonstrated that MLT winds turn from poleward to equatorward and have an eastward enhancement during the storms. Goncharenko et al. [19] showed that the meridional wind differences between quiet and storm time are equatorward at heights between 100 and 110 km. Salah and Goncharenko [20] found that when the storm activity is moderate (Kp < 6), there are no strong changes in the winds in the lower thermosphere. However, for intense storms (Kp > 6), the meridional and zonal wind disturbances are greatly enhanced. The previous research demonstrates that the size and duration of the wind changes depended on the intensity and duration of the geomagnetic storm.
The atmospheric disturbance is related to energy input in the polar region. During the period of geomagnetic storms, external energy sources in the auroral zone can create large perturbations in the ionospheric electric fields and the thermospheric circulation. Joule heating is the primary driver of global atmospheric change during storms. The high latitude heating causes temperature increase, which creates a large-scale pressure gradient that drives equatorward flow at altitudes above 120 km. The Coriolis torque acting on the pole-to-equator pressure gradient pressure produces a zonal flow. This physical process may explain our results if Es not so fast, almost coinciding with the onset of this storm. It is noted that, however, the effect of Joule heating needs some time delay with respect to the commencement of the geomagnetic storm. Robinson and Zanetti [21] proposed that the energy input to the ionosphere due to Joule heating increases more rapidly with geomagnetic activity than that occurring due to precipitating particles.
Recently, based on the TIEGCM, Li et al. [22] investigated the reason for the wind disturbance in MLT region during storm, and proposed that the pressure gradient force associated with vertical wind-induced temperature changes and the Coriolis force are the dominant storm-time momentum forcing processes in the MLT at middle latitudes during storm period, while the momentum transfer from high latitudes is not the major momentum source for storm-time MLT wind changes at middle latitudes. Temperature variation (increase or decrease) in the MLT region during the storm period has also been observed by SABER [23]. As shown in Figure 6, MLT wind disturbance expands toward lower latitudes, which agrees with the result of Li et al. [22]. Therefore, we propose that the enhanced wind disturbance expanding from higher latitude to lower latitude leads to the foEs enhancement from higher latitudes to lower latitudes in sequence.
Although the TIEGCM modeling results show wind enhancement during the storm period, the onset time of the enhancement is inconsistent with the beginning time of Es disturbance. Resende et al. [24] proposed that the strong Es layers formation at Boa Vista (2.8° N, 60.7° W, dip 18°) during seven magnetic storms is due to the disturbance dynamo electric field (DDEF). Further, Resende et al. [25] investigated the influence of electric field on Es at equatorial and low latitudes over the Brazilian sector. They found that zonal eastward electric field in the main phase of the magnetic storm can cause an equatorial Es layer in São Luís (2.3° S, 44.2° W, dip~8°), and during the recovery phase, the zonal westward electric field contributes to forming the Es layer in Boa Vista (2.8° N, 60.7° W, dip~18°). However, over Cachoeira Paulista (CXP, 22.41° S, 45° W, dip~35°), the Es layer behavior at Cachoeira Paulista (CXP, 22.41° S, 45° W, dip~35°) far away from equator was not influenced by the electric field at any phase of the magnetic storms. In this study, all stations are far away from the equator where the wind shear dominates Es formation, hence electric field would not be the main factor that contribute the Es intensity.
As presented in Figure 4, the high foEs during the magnetic storm recovery phase also observed at Mohe, Wuhan, and Jeju. Moro et al. [26] revealed that disturbed dynamo electric fields (DDEF) could contribute to variations of the sporadic E during recovery phase in the American equatorial region as well as EIA region. In recent research, Li et al. [22] investigate the MLT variations during storm time by using Thermosphere Ionosphere Mesosphere Electrodynamics General Circulation Model (TIMEGCM). Simulation results indicate that upward vertical winds are produced by the enhanced MLT temperatures as the storm evolves. Sporadic E layer can be significantly enhanced by these vertical winds. Disturbances from the lower atmosphere cannot be excluded. Based on the long-term observations of the Wuhan and Beijing Mesosphere-Stratosphere-Troposphere (MST) radars, the statistic characteristics of the mesospheric vertical winds at midlatitudes are investigated by Zhang et al. [27]. Their results indicated that gravity wave activities are the highest at summer time at Wuhan. As a consequence, occasional enhancement of sporadic E layer can be due to these gravity wave activities. However, we did not find deterministic observational evident for interpreting the high foEs at Mohe, Wuhan, and Jeju.
As shown in Figure 5, there is obviously enhanced semidiurnal oscillation in h’Es during the geomagnetic disturbance period. The modulation effect of atmospheric tides on Es layers has been well accepted [3,4]. Studies of geomagnetic-activity effects on atmospheric tides were also conducted by many scholars [28,29,30,31,32,33], and the results are also conflicting. By using a coupled ionosphere–thermosphere model, Fesen et al. [28,29] and Fesen [30] revealed that at high latitude, tidal amplitudes in both the lower and upper thermosphere increased strongly under increasing levels of geomagnetic condition. From the observations over Millstone Hill, Wand [31] found that the semidiurnal tidal amplitude depressed by 20–50% at attitude from 105 to 115 km during disturbed periods. Based on the measurements in EISCAT, Kunitake and Schlegel [33] reported that diurnal tidal amplitude at 117/120 km enhanced with increasing levels of geomagnetic activity, and the correlation was better for the zonal wind than for the meridional wind. Salah et al. [32] suggested an enhancement of semidiurnal tidal amplitude around 110 km. Pancheva et al. [34] discussed two mechanisms, which may act individually or simultaneously, that contributed to the observed tidal response to the geomagnetic activities. The first one is an in situ generation mechanism, which could be in line with Joule or particle precipitation heating, and the other one is the effect of a geomagnetic storm on the background environment that can modify the upward propagating tides.
Additionally, based on digisonde observations at equatorial and low-latitude stations in South America, Abdu et al. [10,35] investigated the influences of geomagnetic storms on Es layers. They suggested that storm time magnetospheric electric fields penetrating to equatorial latitudes played a significant role in the formation and disruption of Es layers. It was observed that a prompt penetration electric field (PPEF) with westward polarity at nightside ionosphere can contribute to the formation of Es layers, while a PPEF with eastward polarity both at dayside and at nightside can result in the disruption of Es layers. The Earth’s ionospheric responses to PPEF show rapid changes simultaneously, especially at low and equatorial latitudes. Moro et al. [26] analyzed the equatorial electric field in the Es layer formation, in which that this electric field is so strong that the equatorial Es layer is visible in ionograms only. Recently, Moro et al. [36] analyzed the Es layer during the disturbed times, including the different Es layer mechanisms. Note that the effect of the electric field on Es should be prompt and simultaneous in all stations. In this case, however, the enhancements of foEs, as shown in Figure 4, appear in sequence from the high latitude site (Yakutsk) to the low latitude site (Hainan).

6. Summary

From the above analysis, we conclude that geomagnetic activity imposes an effect on the changes in wind structure and tides in the MLT region, resulting in the intensification of Es layers in consequence. Our main findings are summarized as follows:
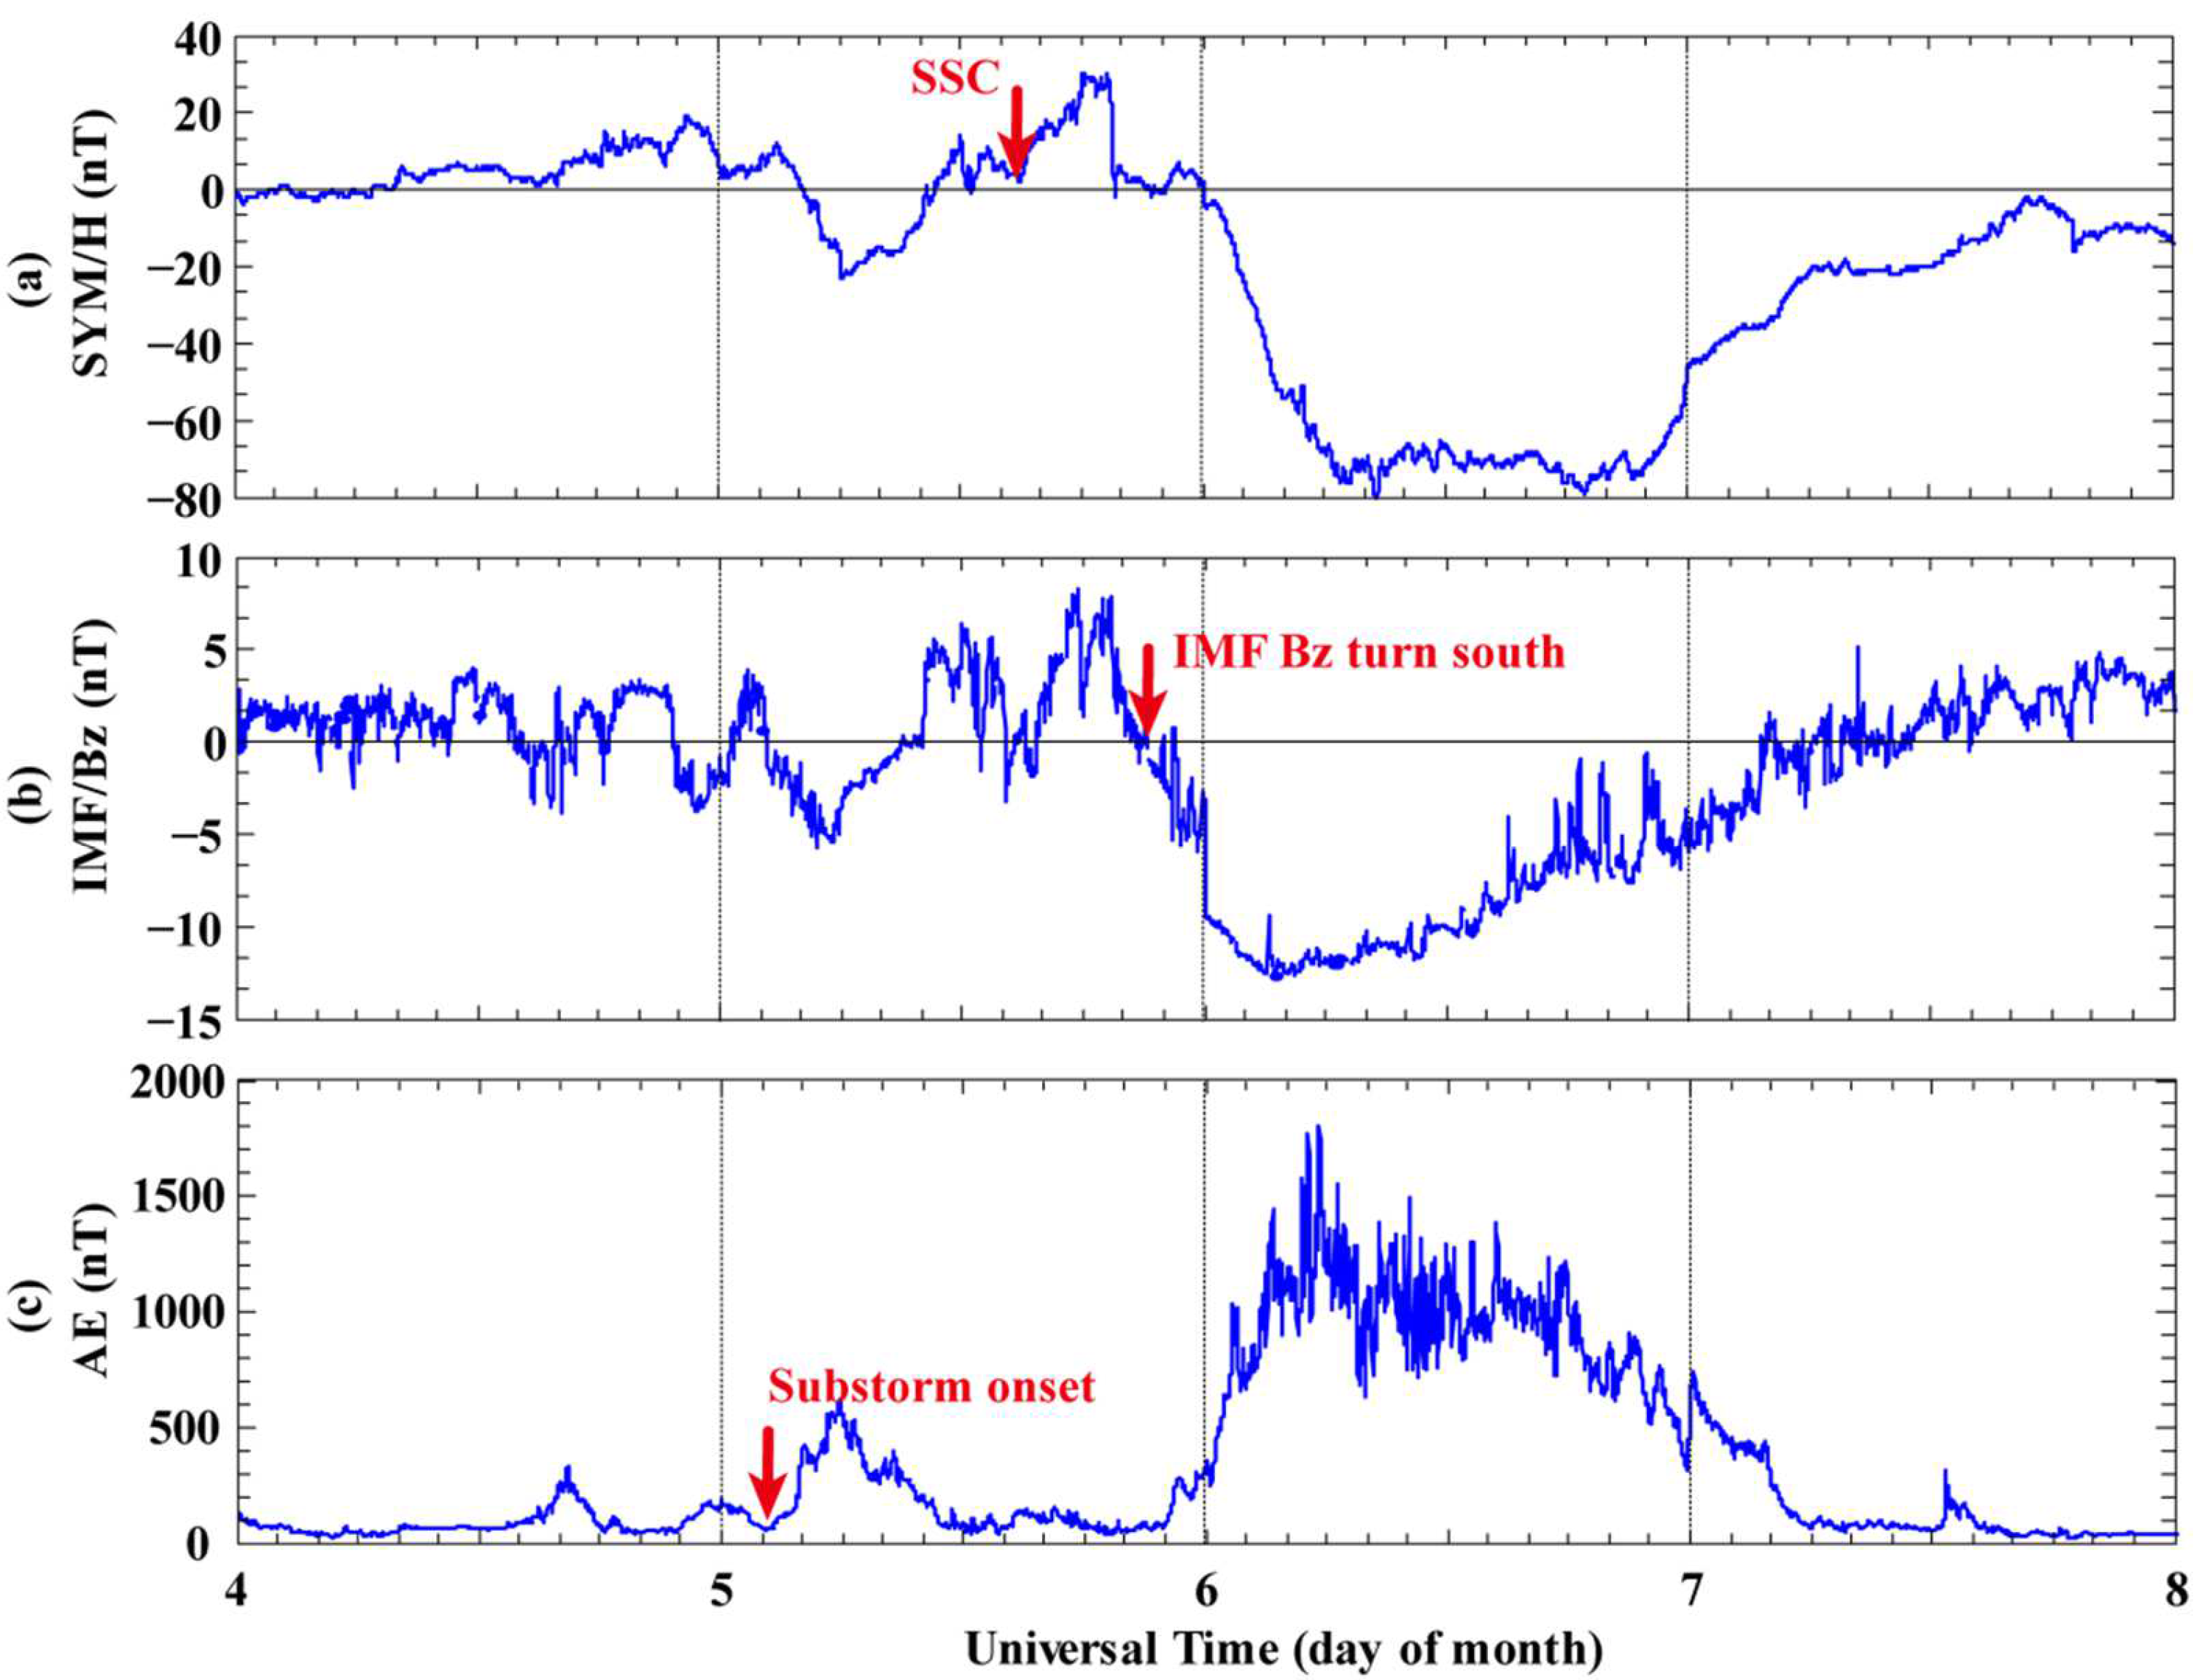
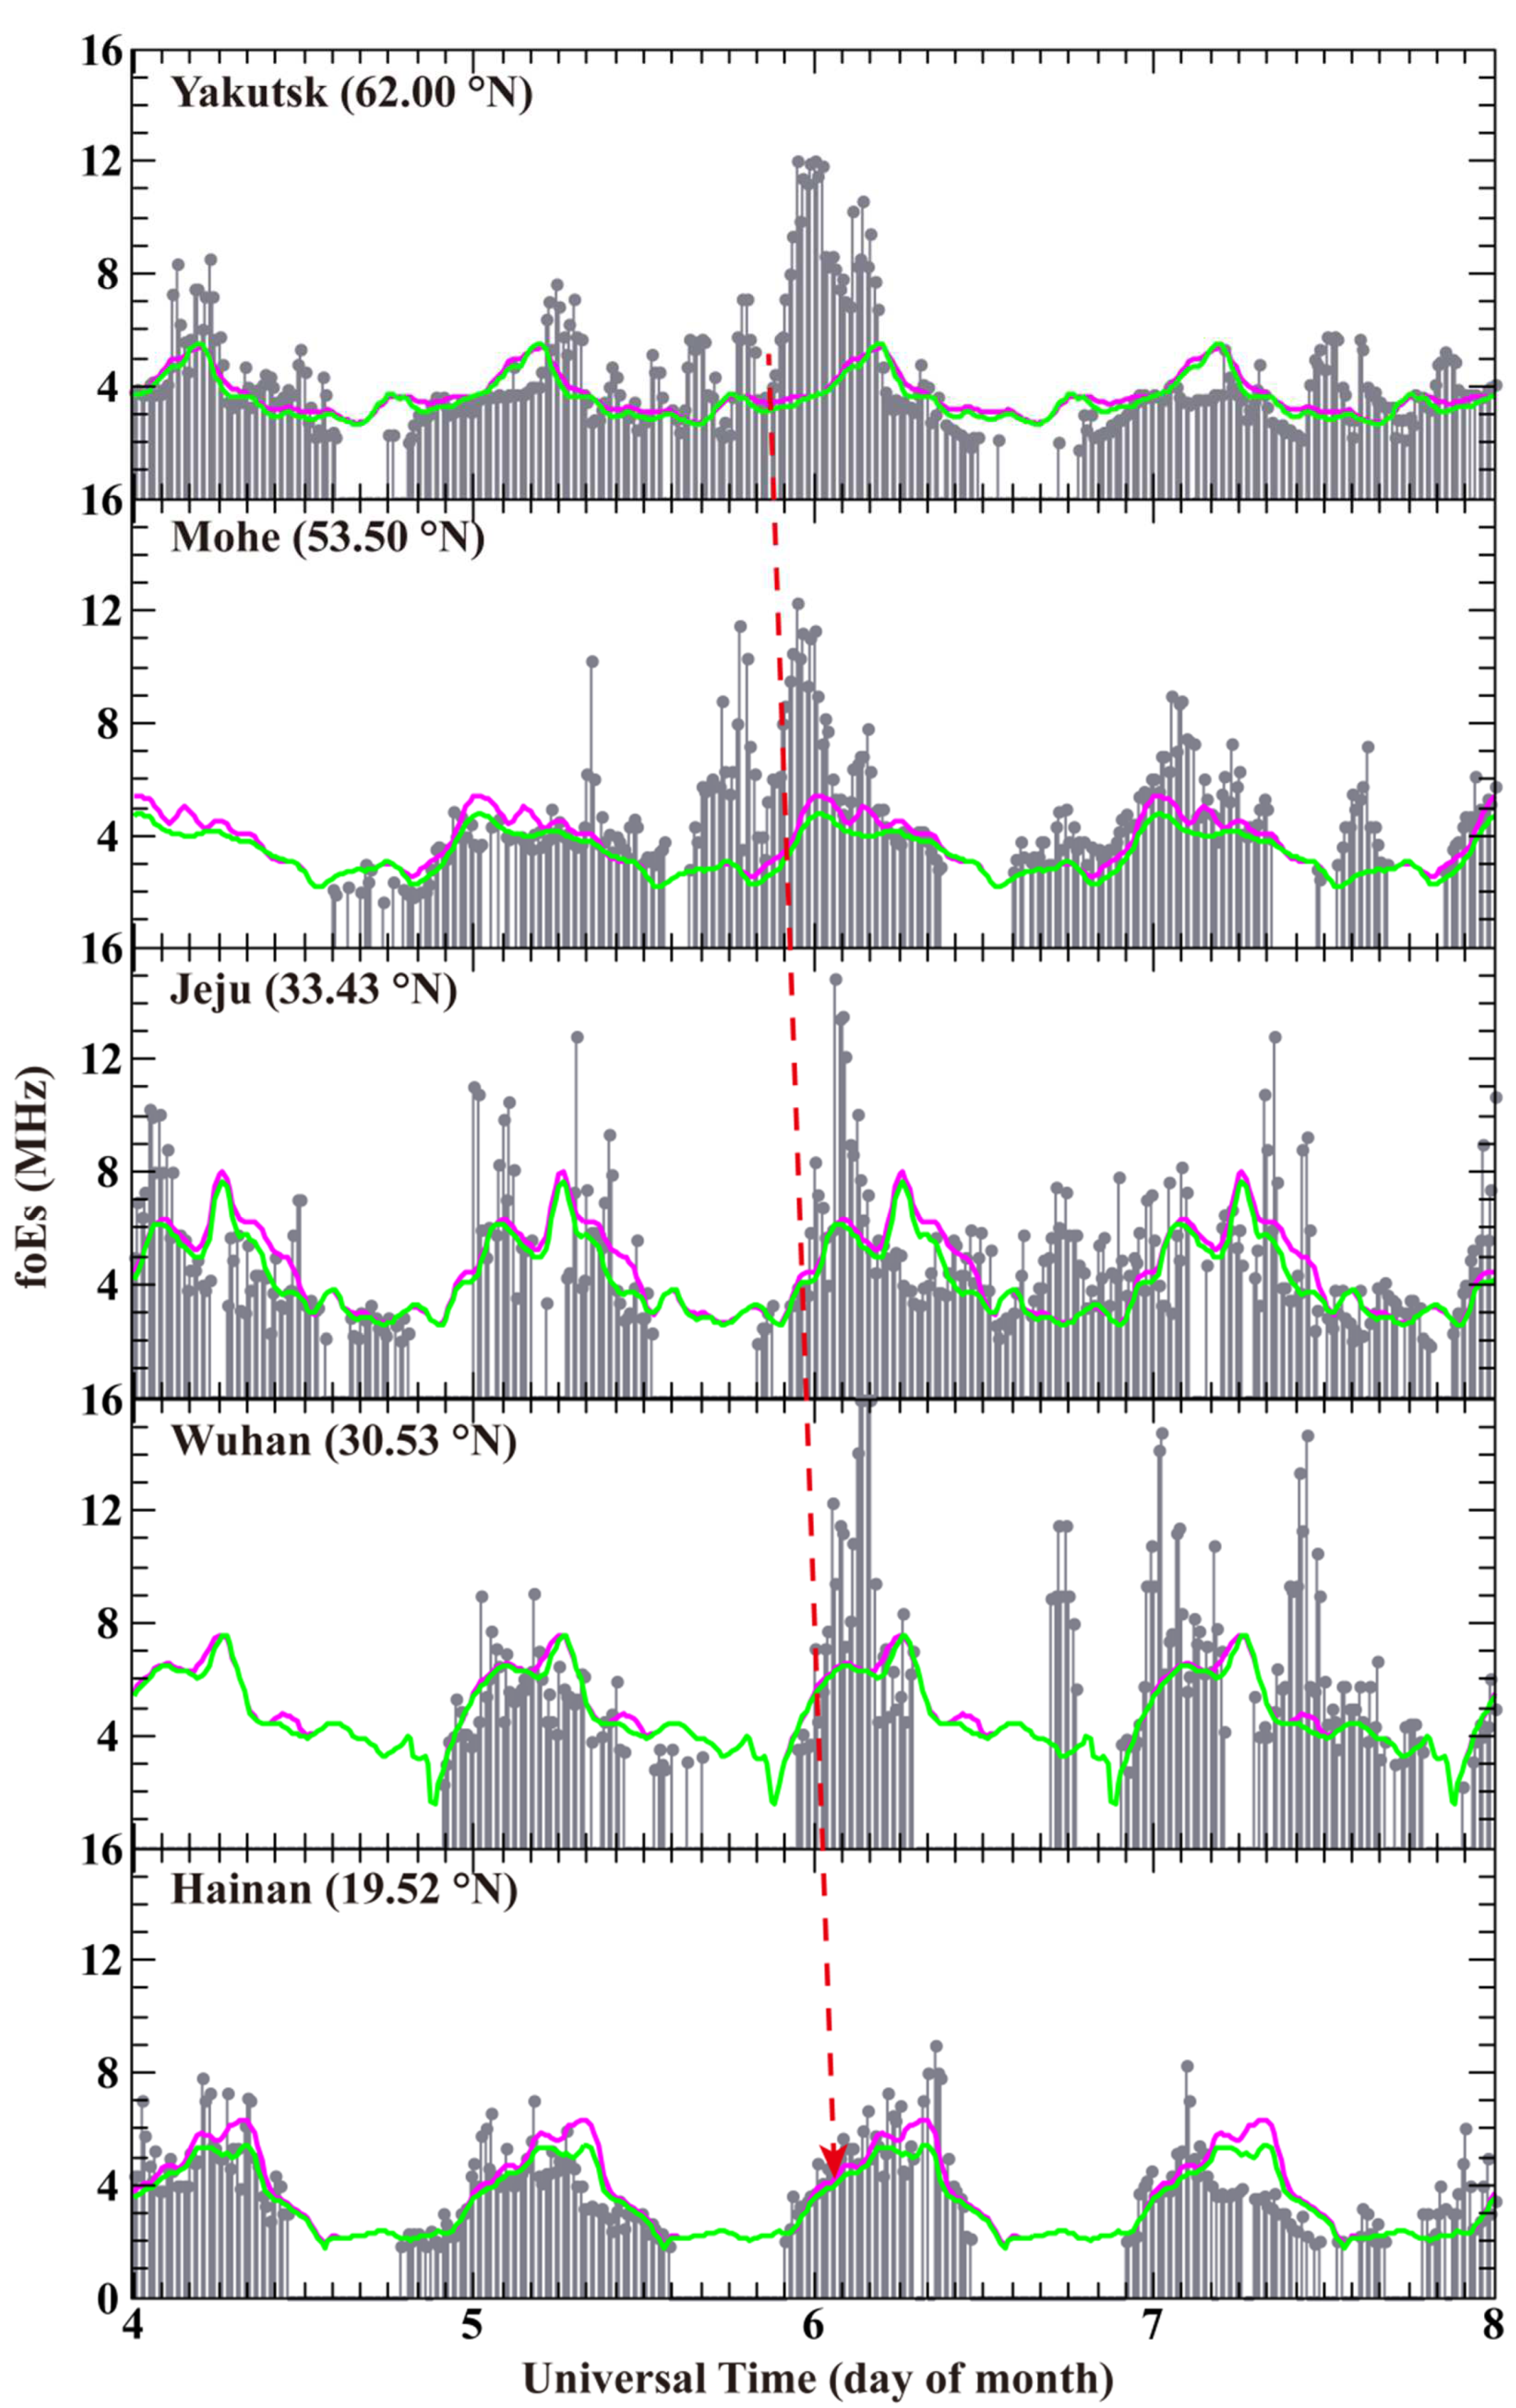
  • After IMF Bz turning southward, foEs observed at five stations exhibit increases from higher latitudes to lower latitudes in sequence.
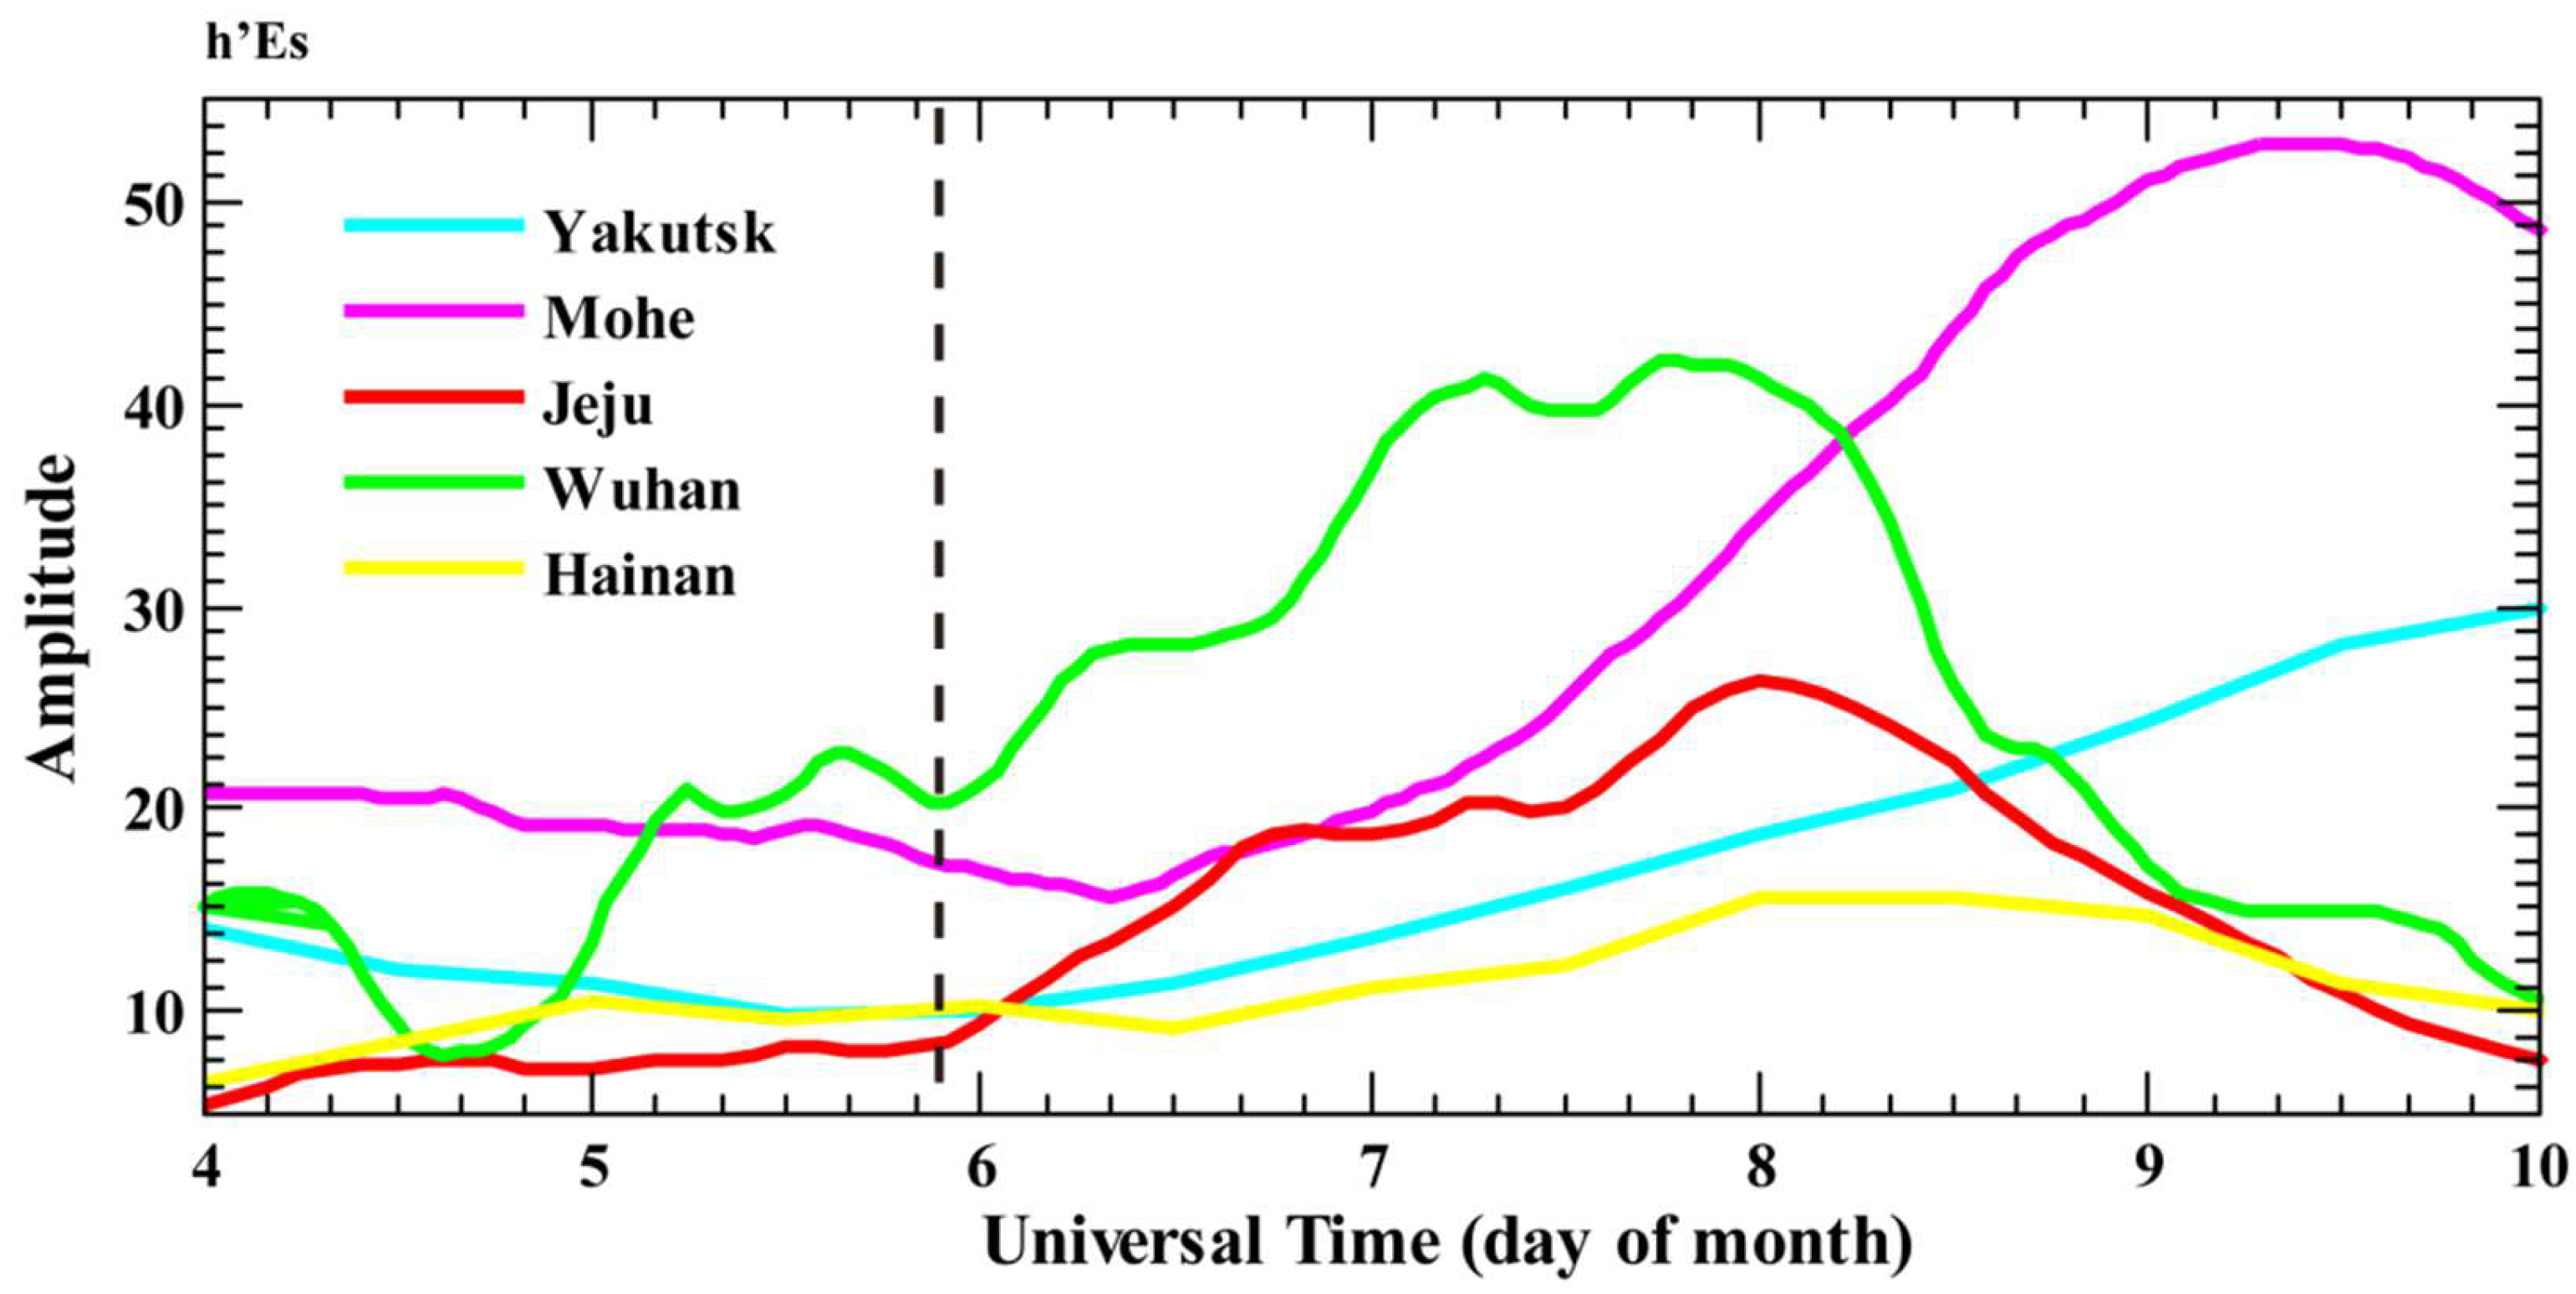
  • Semidiurnal oscillation in h’Es shows amplitude amplification during the geomagnetic storm period.
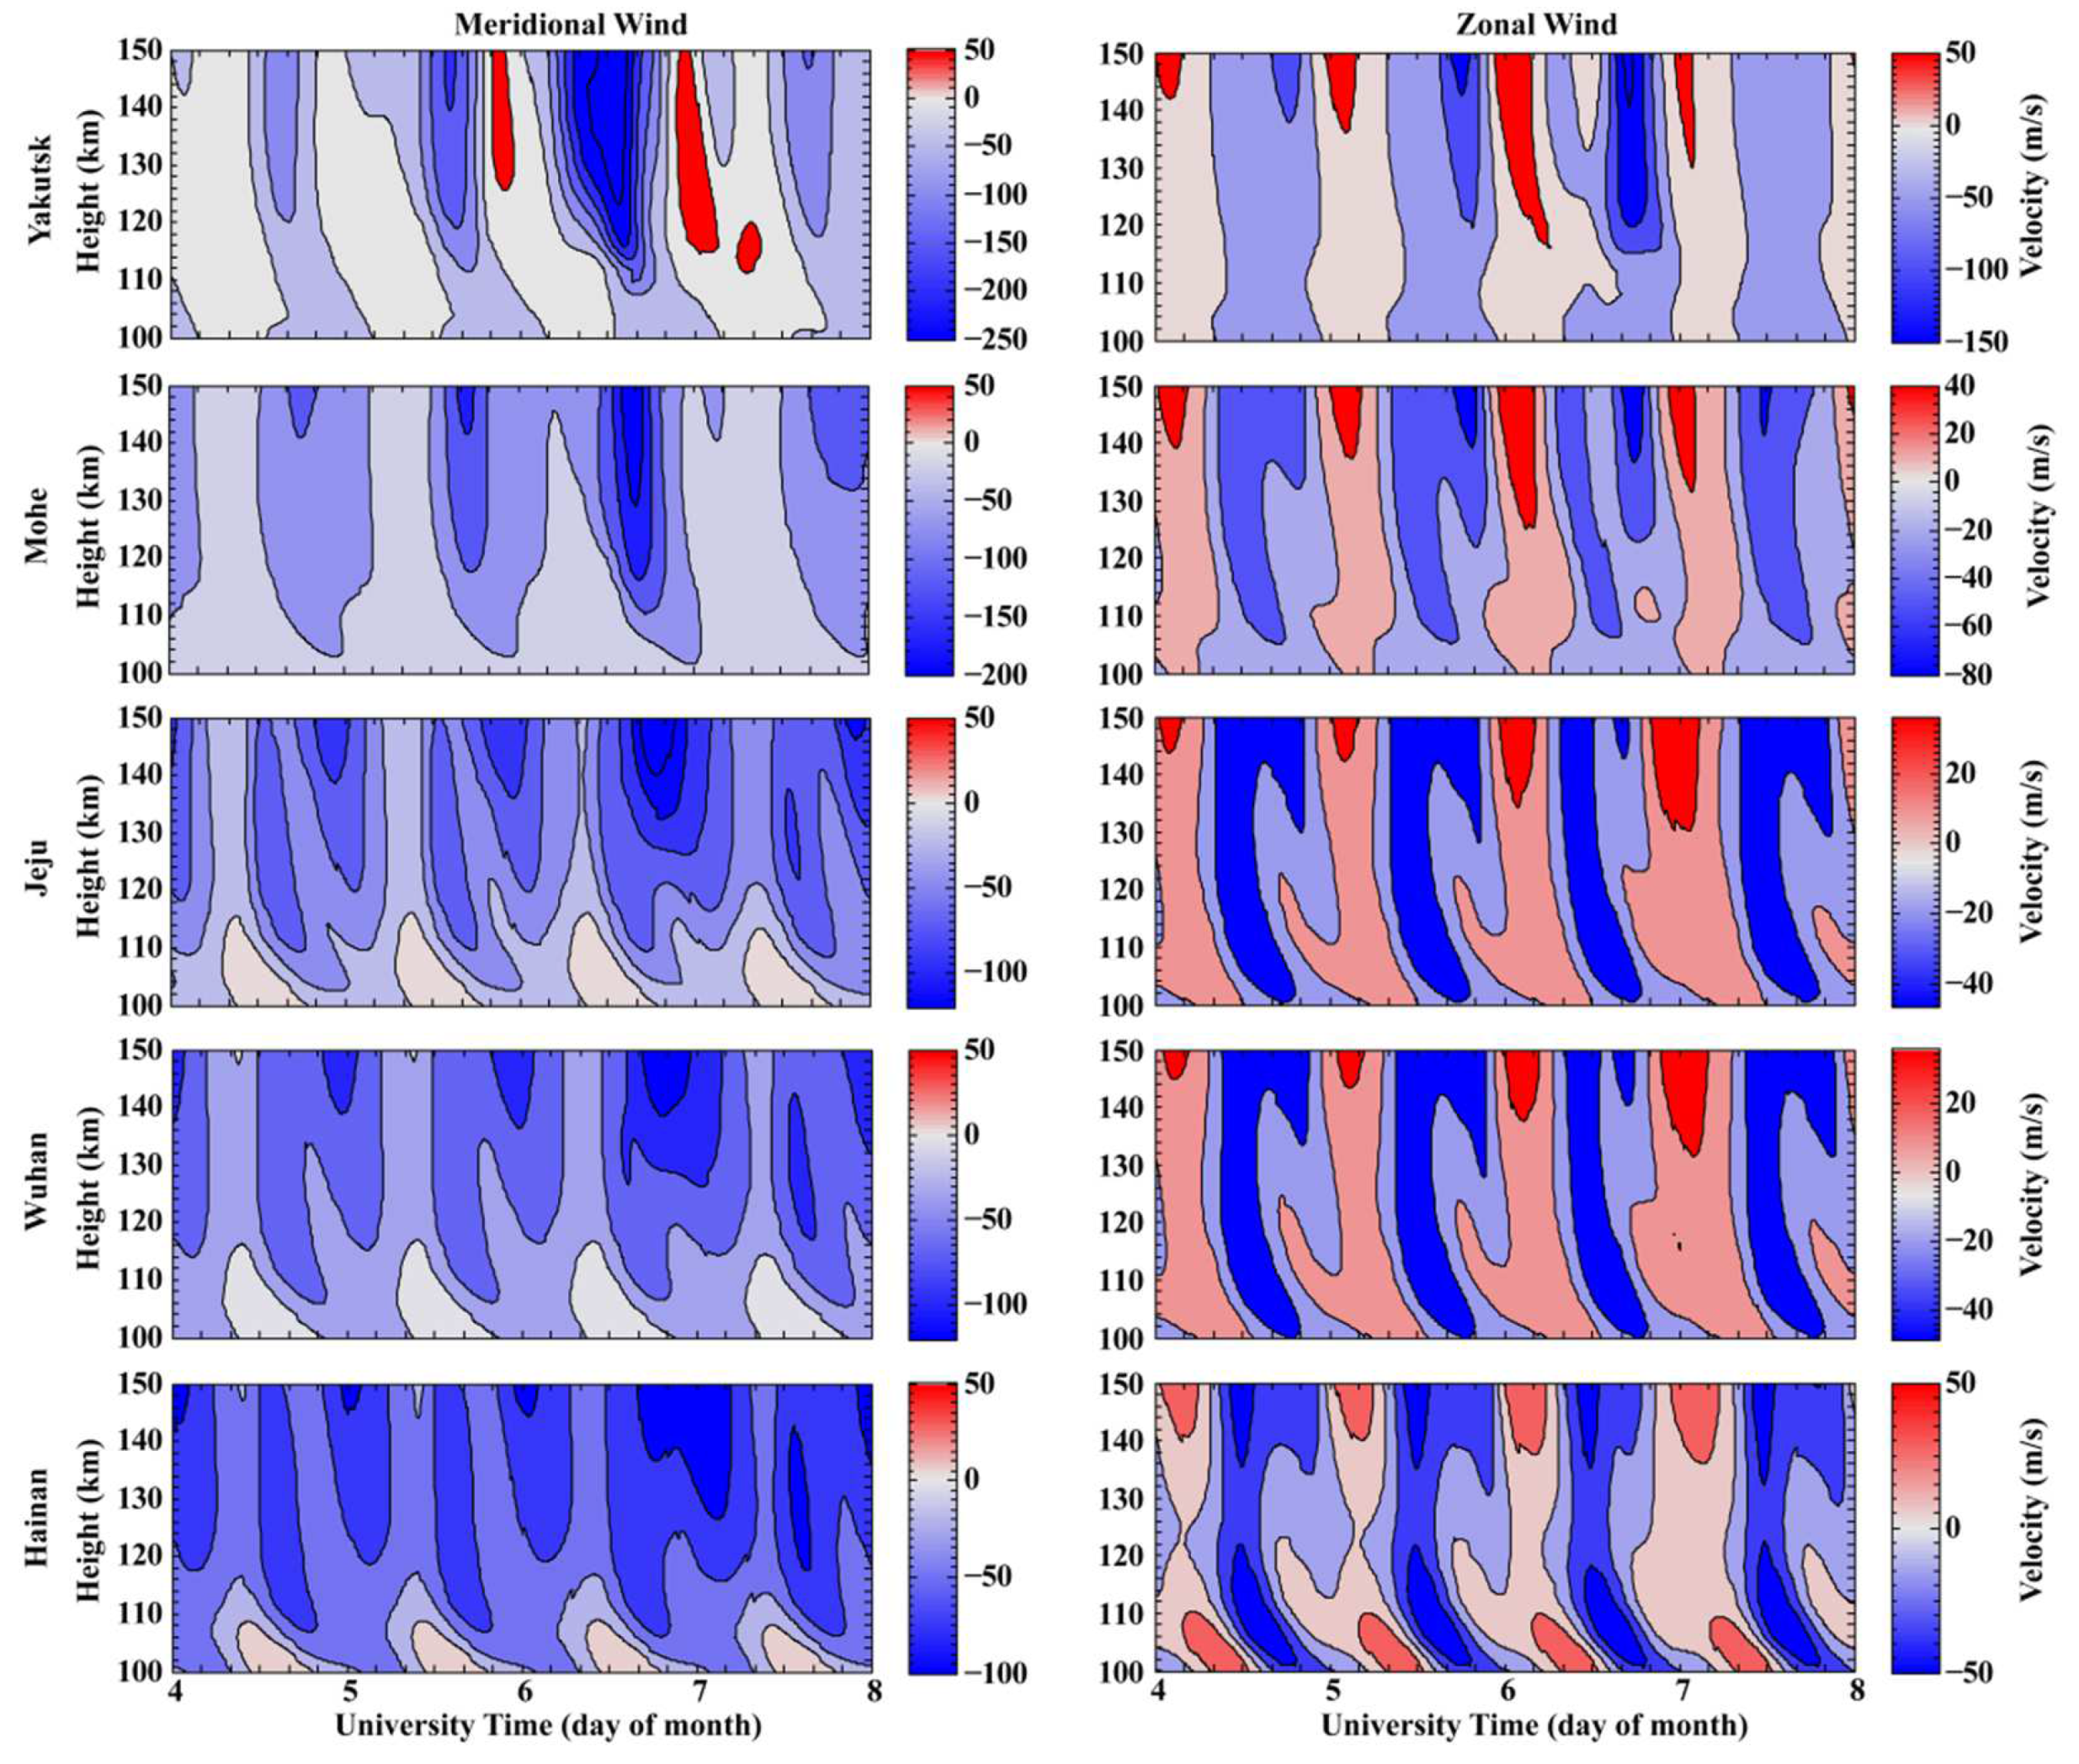
  • TIEGCM simulation results show the disturbance of wind field in MLT region during the storm period and the wind disturbance could result from the pressure gradient force associated with vertical wind-induced temperature changes as proposed by Li et al. [22], which leads to the disturbance of Es layers in consequence.
  • High foEs during the magnetic storm recovery phase also observed at Mohe, Wuhan, and Jeju.

Author Contributions

Methodology and investigation, Q.T.; J.Z.; data curation, and writing—original draft preparation, Q.T.; writing—review and editing, Q.T., Z.D., H.S., Y.L., Z.Z. and X.F.; funding acquisition, H.S. and Z.Z. All authors have read and agreed to the published version of the manuscript.

Funding

This research was funded by the National Natural Science Foundation of China (NSFC grant No.41574146 and 41774162), the National Key R&D Program of China (Grant No. 2018YFC1503506), and the foundation of National Key Laboratory of Electromagnetic Environment (Grant No. 6142403180204).

Institutional Review Board Statement

Not applicable.

Informed Consent Statement

Not applicable.

Data Availability Statement

Mohe, Wuhan, and Hainan stations are provided by the Chinese Meridian Project, which can be downloaded from http://data.meridianproject.ac.cn (accessed on 1 July 2013). Data of Yakutsk, and Jeju stations can be downloaded from https://lgdc.uml.edu/common/DIDBFastStationList (accessed on 1 July 2013). Geomagnetic and solar wind data are obtained from OMNI website (https://spdf.gsfc.nasa.gov/pub/data/omni/high_res_omni/, accessed on 4 July 2013).

Acknowledgments

We acknowledge the use ionosonde dataset provided by the Chinese Meridian Project and the Lowell GIRO Data Center. We also acknowledge the use of NCAR TIEGCM.

Conflicts of Interest

The authors declare no conflict of interest.

References

  1. Axford, W.I. Note on a mechanism for the vertical transport of ionization in the ionosphere. Can. J. Phys. 1960, 39, 1393–1396. [Google Scholar] [CrossRef]
  2. Whitehead, J.D. Recent work on midlatitude and equatorial sporadic E. J. Atmos. Terr. Phys. 1989, 51, 401–424. [Google Scholar] [CrossRef]
  3. Zhou, C.; Tang, Q.; Song, X.; Qing, H.; Liu, Y.; Wang, X.; Gu, X.; Ni, B.; Zhao, Z. A statistical analysis of sporadic E layer occurrence in the midlatitude China region. J. Geophys. Res. Space Phys. 2013, 122, 3617–3631. [Google Scholar] [CrossRef]
  4. Haldoupis, C.; Pancheva, D.; Mitchell, N.J. A study of tidal and planetary wave periodicities present in midlatitude sporadic E layers. J. Geophys. Res. 2004, 109, A02302. [Google Scholar]
  5. Yokoyama, T.; Horinouchi, T.; Yamamoto, M.; Fukao, S. Modulation of the midlatitude ionospheric E region by atmospheric gravity waves through polarization electric field. J. Geophys. Res. 2004, 109, A12307. [Google Scholar] [CrossRef]
  6. Tsunoda, R.T. On the coupling of layer instabilities in the nighttime midlatitude ionosphere. J. Geophys. Res. 2006, 111, A11304. [Google Scholar] [CrossRef] [Green Version]
  7. Batista, I.S.; Abdu, M.A. Magnetic storm associated delayed sporadic E enhancements in the Brazilian Geomagnetic Anomaly. J. Geophys. Res. 1976, 82, 4777–4783. [Google Scholar] [CrossRef] [Green Version]
  8. Maksyutin, S.V.; Sherstyukov, O.N. Dependence of E-sporadic layer response on solar and geomagnetic activity variations from its ion composition. Adv. Space Res. 2005, 35, 1496–1499. [Google Scholar] [CrossRef]
  9. Pietrella, M.; Bianchi, C. Occurrence of sporadic-E layer over the ionospheric station of Rome: Analysis of data for thirty-two years. Adv. Space Res. 2009, 44, 72–81. [Google Scholar] [CrossRef]
  10. Abdu, M.A.; Souza, J.R.; Batista, I.S.; Fejer, B.G.; Sobral, J.H.A. Sporadic E layer development and disruption at low latitudes by prompt penetration electric fields during magnetic storms. J. Geophys. Res. Space Phys. 2013, 118, 2639–2647. [Google Scholar] [CrossRef] [Green Version]
  11. Wang, C. New Chains of Space Weather Monitoring Stations in China. Space Weather 2010, 8, 35–40. [Google Scholar] [CrossRef]
  12. Roble, R.G.; Ridley, E.C.; Richmond, A.D.; Dickinson, R.E. A coupled thermosphere/ionosphere general circulation model. Geophys. Res. Lett. 1988, 15, 1325–1328. [Google Scholar] [CrossRef]
  13. Richmond, A.D.; Ridley, E.C.; Roble, R.G. A thermosphere/ionosphere general circulation model with coupled electrodynamics. Geophys. Res. Lett. 1992, 19, 601–604. [Google Scholar] [CrossRef]
  14. Hagan, M.E.; Burrage, M.D.; Forbes, J.M.; Hackney, J.; Randel, W.J.; Zhang, X. GSWM-98: Results from migrating solar tides. J. Geophys. Res. 1999, 104, 6813–6828. [Google Scholar] [CrossRef]
  15. Christakis, N.; Haldoupis, C.; Zhou, Q.; Meek, C. Seasonal variability and descent of mid-latitude sporadic E layers at Arecibo. Ann. Geophys. 2009, 27, 923–931. [Google Scholar] [CrossRef] [Green Version]
  16. Johnson, R.M.; Wickwar, V.B.; Roble, R.G.; Luhmann, J.G. Lower-thermospheric winds at high latitude: Chatanika radar observations. Ann. Geophys. 1987, 5A, 383–404. [Google Scholar]
  17. Johnson, R.M.; Virdi, T.S. High-latitude lower thermospheric neutral winds at EISCAT and Sondrestrom during LTCS 1. J. Geophys. Res. 1991, 96, 1099–1116. [Google Scholar] [CrossRef]
  18. Ma, G.; Igarashi, K.; Hocke, K. Mid-latitude winds in the mesosphere: A superposed epoch analysis over the geomagnetic storm times. J. Atmos. Sol. Terr. Phys. 2001, 63, 1993–2001. [Google Scholar] [CrossRef]
  19. Goncharenko, L.P.; Salah, J.E.; Foster, J.C.; Huang, C. Variations in lower thermosphere dynamics at midlatitudes during intense geomagnetic storms. J. Geophys. Res. 2004, 109, A04304. [Google Scholar] [CrossRef] [Green Version]
  20. Salah, J.E.; Goncharenko, L.P. Search for geomagnetic storm effects on lower thermospheric winds at midlatitudes. J. Atmos. Sol. Terr. Phys. 2001, 63, 951–963. [Google Scholar] [CrossRef]
  21. Robinson, R.M.; Zanetti, L.J. Auroral energy flux and Joule heating derived from global maps of fieldaligned currents. Geophys. Res. Lett. 2021, 48, e2020GL091527. [Google Scholar] [CrossRef] [PubMed]
  22. Li, J.; Wang, W.; Lu, J.; Yue, J.; Burns, A.G.; Yuan, T.; Chen, X.T.; Dong, W.J. A modeling study of the responses of mesosphere and lower thermosphere winds to geomagnetic storms at middle latitudes. J. Geophys. Res. Space Phys. 2019, 124, 3666–3680. [Google Scholar] [CrossRef]
  23. Sun, M.; Li, Z.; Li, J.; Lu, J.; Gu, C.; Zhu, M.; Tian, Y. Responses of Mesosphere and Lower Thermosphere Temperature to the Geomagnetic Storm on 7–8 September 2017. Universe 2022, 8, 96. [Google Scholar] [CrossRef]
  24. Resende, L.C.A.; Shi, J.K.; Denardini, C.M.; Batista, I.S.; Nogueira, P.A.B.; Arras, C.; Andrioli, V.F.; Moro, J.; Da Silva, L.A.; Carrasco, A.J.; et al. The inflfluence of disturbance dynamo electric fifield in the formation of strong sporadic E layers over Boa Vista, a low-latitude station in the American sector. J. Geophys. Res. Space Phys. 2020, 125, e2019JA027519. [Google Scholar] [CrossRef]
  25. Resende, L.C.A.; Shi, J.; Denardini, C.M.; Batista, I.S.; Picanço, G.A.S.; Moro, J.; Chagas, R.A.J.; Barros, D.; Chen, C.C.; Nogueira, P.A.B.; et al. The impact of the disturbed electric field in the sporadic E (Es) layer development over Brazilian region. J. Geophys. Res. Space Phys. 2021, 126, e2020JA028598. [Google Scholar] [CrossRef]
  26. Moro, J.; Resende, L.C.A.; Denardini, C.M.; Xu, J.; Batista, I.S.; Andrioli, V.F.; Schuch, N.J. Equatorial E region electric fields and sporadic E layer responses to the recovery phase of the November 2004 geomagnetic storm. J. Geophys. Res. Space Phys. 2017, 122, 12517–12533. [Google Scholar] [CrossRef] [Green Version]
  27. Zhang, W.; Chen, G.; Zhang, S.; Gong, W.; Chen, F.; He, Z.; Huang, K.; Wang, Z.; Li, Y. Statistical study of the midlatitude mesospheric vertical winds observed by the Wuhan and Beijing MST radars in China. J. Geophys. Res. Atmos. 2020, 125, e2020JD032776. [Google Scholar] [CrossRef]
  28. Fesen, C.G.; Richmond, A.D.; Roble, R.G. Auroral effects on midlatitude semidiurnal tides. Geophys. Res. Lett. 1991, 18, 412–415. [Google Scholar] [CrossRef]
  29. Fesen, C.G.; Richmond, A.D.; Roble, R.G. Theoretical effects of geomagnetic activity on thermospheric tides. J. Geophys. Res. 1993, 98, 15599–15612. [Google Scholar] [CrossRef]
  30. Fesen, C.G. Geomagnetic activity effects on thermospherictides: A compendium of theoretical predictions. J. Atmos. Sol. Terr. Phys. 1997, 59, 785–803. [Google Scholar] [CrossRef]
  31. Wand, R.H. Geomagnetic activity effects on semidiurnal winds in the lower thermosphere. J. Geophys. Res. 1983, 88, 9243–9248. [Google Scholar] [CrossRef]
  32. Salah, J.E.; Deng, W.; Clark, R. Observed response of the Earth’s lower thermosphere to a major geomagnetic storm. Geophys. Res. Lett. 1996, 23, 575–578. [Google Scholar] [CrossRef]
  33. Kunitake, M.; Schlegel, K. Neutral winds in the lower thermosphere at high latitudes from five years of EISCAT data. Ann. Geophys. 1991, 9, 143–155. [Google Scholar]
  34. Pancheva, D.; Singer, W.; Mukhtarov, P. Regional response of the mesosphere–lower thermosphere dynamics over Scandinavia to solar proton events and geomagnetic storms in late October 2003. J. Atmos. Sol. Terr. Phys. 2007, 69, 1075–1094. [Google Scholar] [CrossRef]
  35. Abdu, M.A.; De Souza, J.R.; Batista, I.S.; Santos, A.M.; Sobral, J.H.A.; Rastogi, R.G.; Chandra, H. The role of electric fields in sporadic E layer formation over low latitudes under quiet and magnetic storm conditions. J. Atmos. Sol. Terr. Phys. 2014, 115–116, 95–105. [Google Scholar] [CrossRef]
  36. Moro, J.; Xu, J.; Denardini, C.M.; Resende, L.C.A.; Da Silva, L.A.; Chen, S.S.; Carrasco, A.J.; Liu, Z.; Wang, C.; Schuch, N.J. Different sporadic-E (Es) layer types development during the August 2018 geomagnetic storm: Evidence of auroral type (Esa) over the SAMA region. J. Geophys. Res. Space Phys. 2022, 127, e2021JA029701. [Google Scholar] [CrossRef]
Figure 1. Geographical distribution of Yakutsk, Mohe, Jeju, Wuhan and Hainan.
Atmosphere 13 00816 g001
Figure 2. The variations of SYM/H index (a), IMF/Bz index (b), AE index (c) from 4 to 8 July 2013.
Atmosphere 13 00816 g002
Figure 3. Example of iongrams at Mohe and Wuhan.
Atmosphere 13 00816 g003
Figure 4. Observation of foEs during magnetic storm between 4 and 8 July 2013. The subplots are aligned from top to bottom according to latitudes. The red and green curves represent mean and median value of foEs, which are obtained from five days before storm (from 1 to 5 July 2013). The red-dashed line with arrow indicates the sequentially enhancement onset of the foEs.
Atmosphere 13 00816 g004
Figure 5. The spectrum of h’Es calculated by Lomb-Scargle analysis for the period of 12 h at different stations from 4 to 10 July 2013. The black dash line indicates the onset of the storm.
Atmosphere 13 00816 g005
Figure 6. Simulation of wind using TIE−GCM model at the height from 100 to 150 km. The left row is for meridional wind, and the right row is for zonal wind.
Atmosphere 13 00816 g006
Publisher’s Note: MDPI stays neutral with regard to jurisdictional claims in published maps and institutional affiliations.

