
A Systematic Review of Drought Indices in Tropical Southeast Asia


1
Faculty of Agricultural Technology, Gadjah Mada University, Yogyakarta 55281, Indonesia
2
Faculty of Applied Biological Sciences, Gifu University, Gifu 501-1193, Japan
*
Author to whom correspondence should be addressed.
Atmosphere 2022, 13(5), 833; https://0-doi-org.brum.beds.ac.uk/10.3390/atmos13050833
Submission received: 14 March 2022
/
Revised: 26 April 2022
/
Accepted: 17 May 2022
/
Published: 19 May 2022
(This article belongs to the Special Issue Advances in Hydrometeorological Ensemble Prediction)
Abstract
:This study systematically reviews the under-researched experience of performance indices to determine extreme hydroclimate in tropical Southeast Asia. The review was conducted by the Preferred Reporting Items for Systematic Review and Meta-Analysis methods with SCOPUS databases. The screening of the articles is based on the inclusion and exclusion criteria encompassing articles published between 2000 and 2021 with solely focused on three extreme hydroclimate indices (standardized precipitation index or SPI, standardized precipitation evapotranspiration index or SPEI, and palmer drought severity index or PDSI) applied in tropical Southeast Asia, and articles form in English. This study found solely 14 of the 532 articles met the criteria and those articles were analyzed thematically and synthesized narratively. The results showed the strengths of indices with the simple data input (SPI and SPEI); those indices are commonly used at the government level in Southeast Asia due to their data availability, which has Viet Nam as the highest (5 articles) number of publications, followed by Malaysia (4 articles), Thailand (3 articles), and Indonesia (2 articles). On the other hand, the sensitivity of SPI and SPEI has the limitation for specific purposes such as in the agricultural sector when applied to Southeast Asia. In the end, we highlighted the potential of future research applying quasi-biennial oscillation and South Western Indian Ocean as well as El Niño Southern Oscillation climate indices.
1. Introduction
Climate change has resulted in increased temperatures in Southeast Asia (SEA) at a rate of 5 percentage points per decade start from 1971 to 2005, with a sharp increase on 1971 and 2005 [1], resulting in increases in extreme hydroclimate events such as drought [2]. In addition, the El Niño phenomenon which is related to the surface condition (cooling and warming) over the pacific tropics ocean and the Indonesian seas, respectively, can enhance the drought severity [3]. Droughts have affected more than 66 million people in SEA, including Indonesia, Viet Nam, Thailand, Cambodia, Singapore, Malaysia, Vietnam, Cambodia, Laos, Brunei Darussalam, Philippines, and Myanmar [4].
Drought events have become more frequent and intense for Indonesia, with 1811, 1961, and 2372 events in 2012, 2014, and 2017, respectively [4]. In Malaysia, the strongest drought and most significant events in the year of El Niño occurred from 1997 to 1998 [5]. Meanwhile, the frequency of drought events with an average severity of 1.5 per year occurred over Cambodia on 1986–1987, 1994, 1997–1998, 2002, and 2005 [6], Laos was recorded from 1966 to 2009 [7], and between 1992–1993 and 2003–2004 for Viet Nam [8]. Thailand is consistently confronted with annual droughts due to an average annual temperature was increased up to 0.85 °C, while the mean annual rainfall was decreased; in 1989–2013, 29 of 72 provinces were damaged by drought [4], as reported by Duan et al. [9] that climate change is the major driver affected on rainfall intensity and amounts.
According to Steinemann et al. [10], drought is a natural disaster that significantly impacts the financial sector, causing losses of up to billions of dollars. It has been identified as the single most important climatic hazard affecting the agricultural sector, impacting both crop production and farm employees [11]. For example, drought exacerbated by the El Nino phenomenon causes rice production was decreased on the island of Java was decreased, drastically [12] and extensive forest fires occurred in Kalimantan and Sumatra [13] during the 2015–2016 El Niño [14]. It makes, Indonesia suffers economic losses up to USD 3.7 billion [3]. Meanwhile, up to USD 9 billion of the overall economy of Malaysia was declined [15], which is RM90 million was losses from crop failure on paddy cultivation [16] and palm oil cultivation were lost up to 1.06 million metric tons during 2015–2016 due to the drought associated with the El Niño event [17]. While the impacts of drought on agriculture sector employment have yet to be quantified among SEA countries, where the agriculture employees for Viet Nam (41%), Philippines (26%), Laos (41%), Cambodia (27%), and Indonesia (31%) [4].
Thus, plans to address this extreme hydroclimate are needed, beginning with a thorough understanding of drought. At present, there is no universally accepted definition of drought [18], which is the mathematical indices is the one way to interpret the severe of drought or is called extreme hydroclimate indices [19] followed by a synthesis of published studies to assess current research and shape future studies. To our knowledge, no study has comprehensively reviewed how indices are used in tropical Southeast Asia and consider with climate variabilities, such as El Niño–Southern Oscillation (ENSO), which has triggered droughts in tropical Asia with the typical climate is equatorial climate region (ECR) and monsoon climate region (MCR) [20], as well as challenges in the integration of drought indices, where climate indices include mechanisms, sensitivity, and parameters [21]. In the end, we present and reviewed the previous studies from 2000 to 2021, highlighting state-of-the-art analysis of drought indices, which commonly used. The following questions guided this review:
- What are the strengths and limitations of drought indices used in tropical Southeast Asia?
- What future research can be expected?
2. Materials and Methods
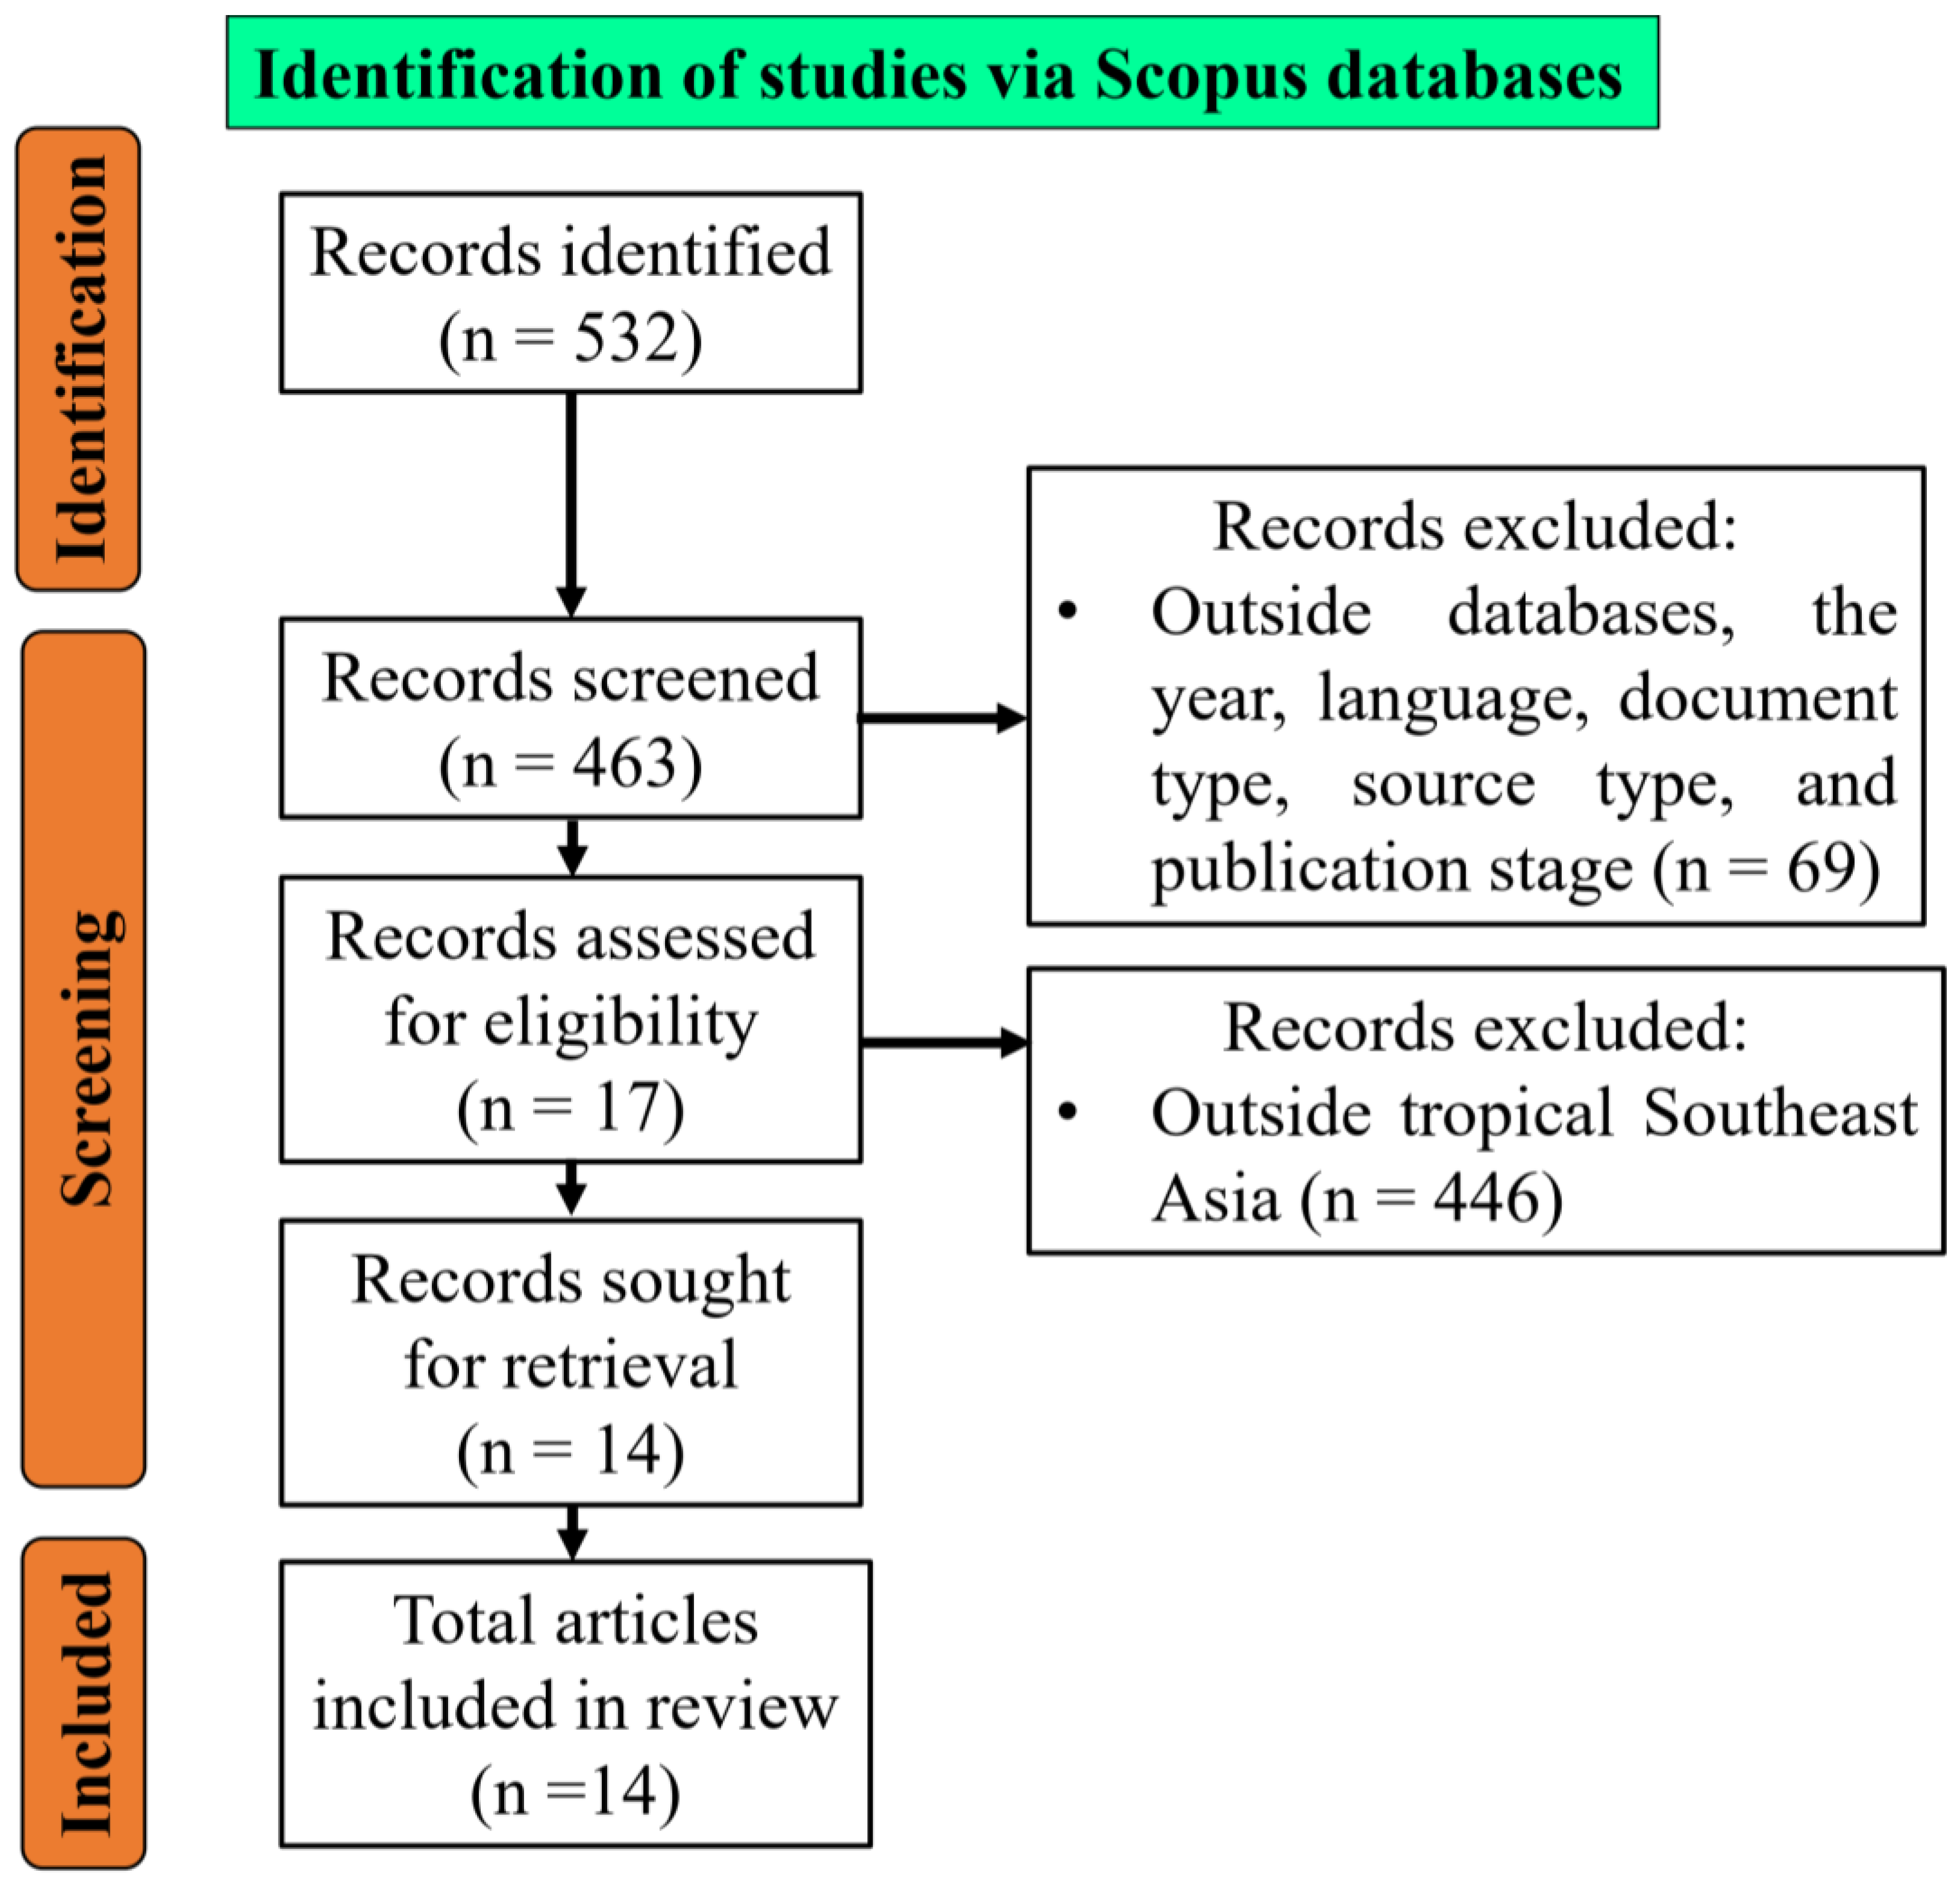
The Preferred Reporting Items for Systematic Reviews and Meta-Analyses (PRISMA) protocol [22] was used for this study as shown in Figure 1. A systematic review consists of some stages are identifying, screening, and synthesizing relevant results to research questions [23] as detail explained below:
2.1. Article Identification
The first stage was focused on identifying the journal references relevant to answering the research questions. The articles were retrieved from Scopus database and published between January 2000 and November 2021 were included. We selected the articles based on title, keywords, and abstract to include desirable results. In total, 552 records were retrieved on 1 December 2021, with the following keywords included in the title, abstract, or keywords (TITLE-ABS-KEY): (‘drought’) AND (‘standardized precipitation index’ OR ‘standardized precipitation evapotranspiration index’ OR ‘palmer drought severity index’ OR ‘SPI’ OR ‘SPEI’ OR ‘PDSI’).
2.2. Article Screening
To minimize the inclusion of undesired articles shown by the Scopus databases, we applied some restrictions such as document type, year, sources, language, and publication stage (see Table 1 for inclusion and exclusion criteria). Furthermore, the title and abstract of the study has been screened; articles solely focused on tropical Asia were retrieved. Lastly, studies not focused on the following drought indices involves SPI, SPEI, and PDSI were excluded.
2.3. Inclusion and Data Synthesis
Data were extracted from the selected studies to answer the research questions; qualitatively and quantitatively analyzed, such as publication year, case studies, tropical climate characteristics, indices used, strengths and limitations, effectiveness and accuracy, and climate indices.
3. Results
3.1. Overview of the Included Records
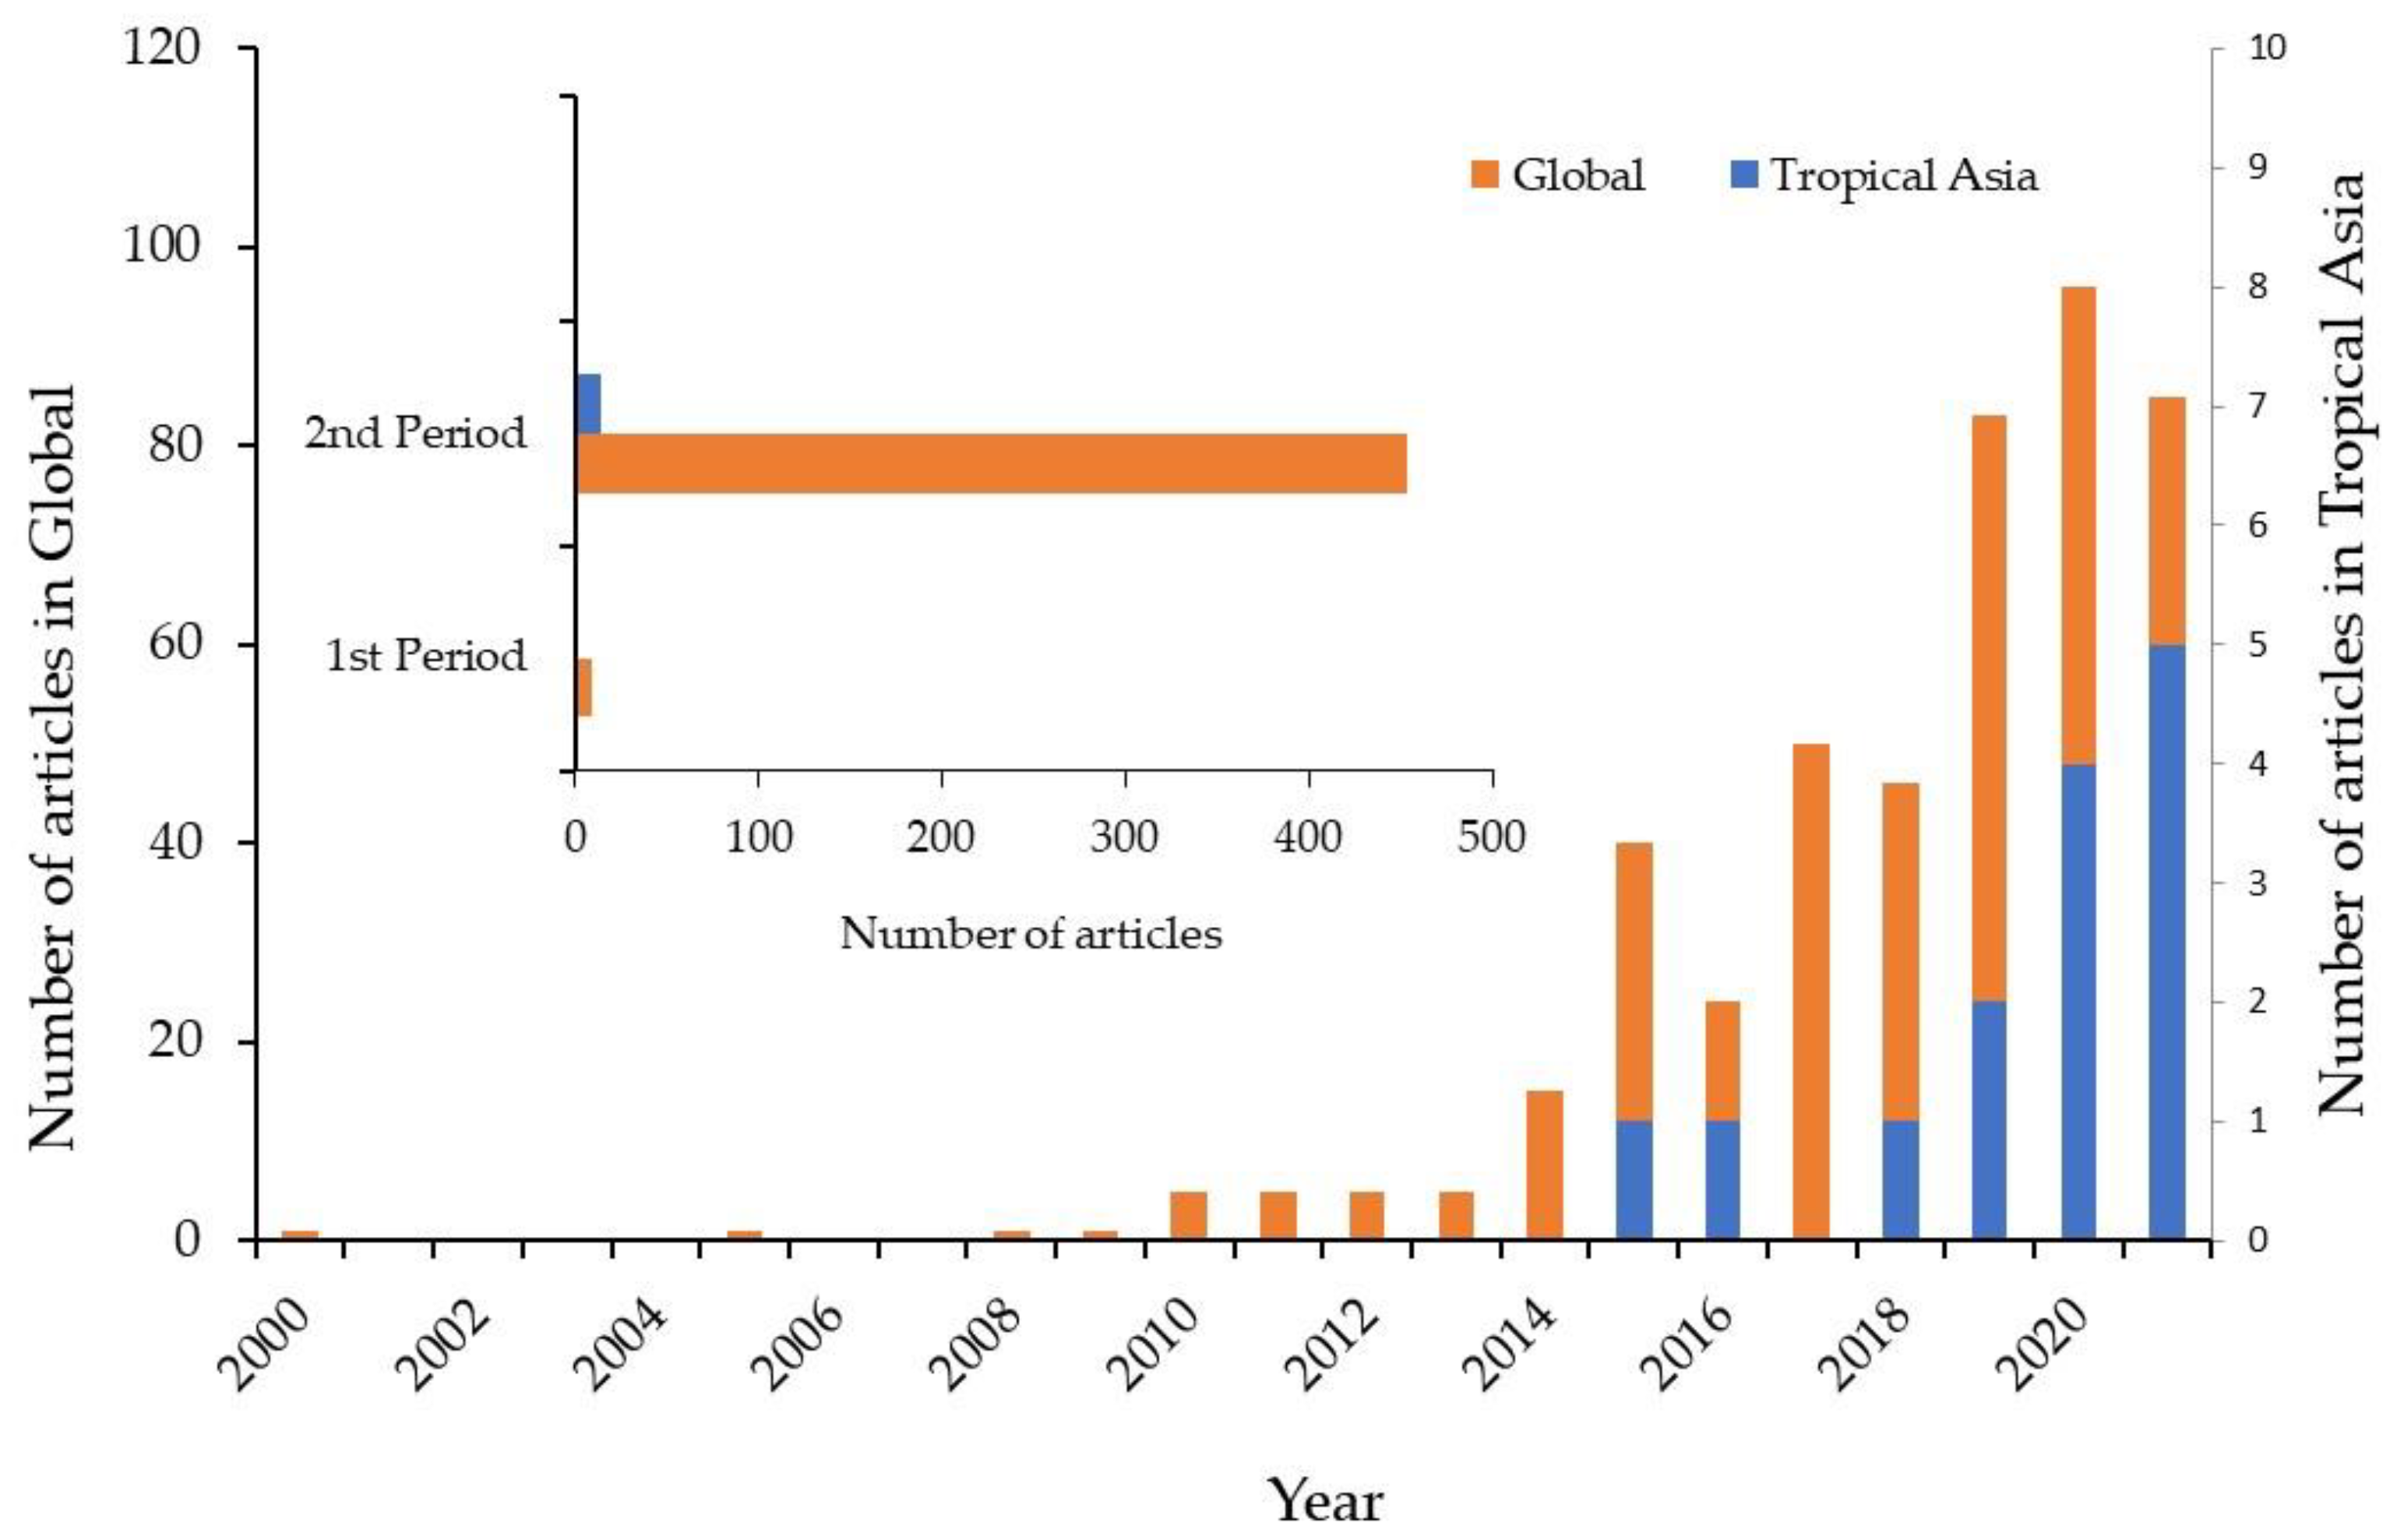
A trend analysis of targeted studies published between 2000 and 2021 on drought indices was conducted. The databases produced 552 articles. The first stage showed that the amount of the article was declined to 463 articles. Then, 17 articles remained in the second stage. Finally, in the last stage, we retrieved 14 articles to analyze. The results show that the number of studies increased from 15 in 2014 to 40 in 2015 after the first stage, annually. In stages 2 and 3, this trend decreased; only one study was published from 2015 to 2018. From 2019 to 2021, however, 11 studies were published. Overall, interest in drought indices has increased in the past decade (Figure 2).
Furthermore, there was an increase between 2015 and 2017 for the number of studies published, possibly related to the El Niño phenomenon during 2016. Since 1900, at least 30 El Niño events have been occurred in tropical Asia, with severe events recorded during 2014–2016 [24]. In the last 20 years, only 11 journals have published more than ten articles. The journal names, corresponding CiteScores, and the publication amounts are shown in Table 2. CiteScore used to determine the performance and achievements of the journal in the Scopus databases.
In this review, each journal published only one relevant study. Atmospheric Research was ranked first with a CiteScore of 8.6, followed by the Journal of Hydrology and Climatic Change with scores of 7.3 and 7.1, respectively. The remaining journals were as follows: Weather and Climate Extremes, Remote Sensing (Switzerland), Hydrological Processes, Natural Hazards, Environmental Earth Sciences, Water (Switzerland), Agricultural Finance Review, Journal of Water and Climate Change, Agriculture and Natural Resources, Engineering and Applied Science Research, and Kyushu University Journal of the Faculty of Agriculture.
3.2. Tropical Asia: Characteristics and Phenomena
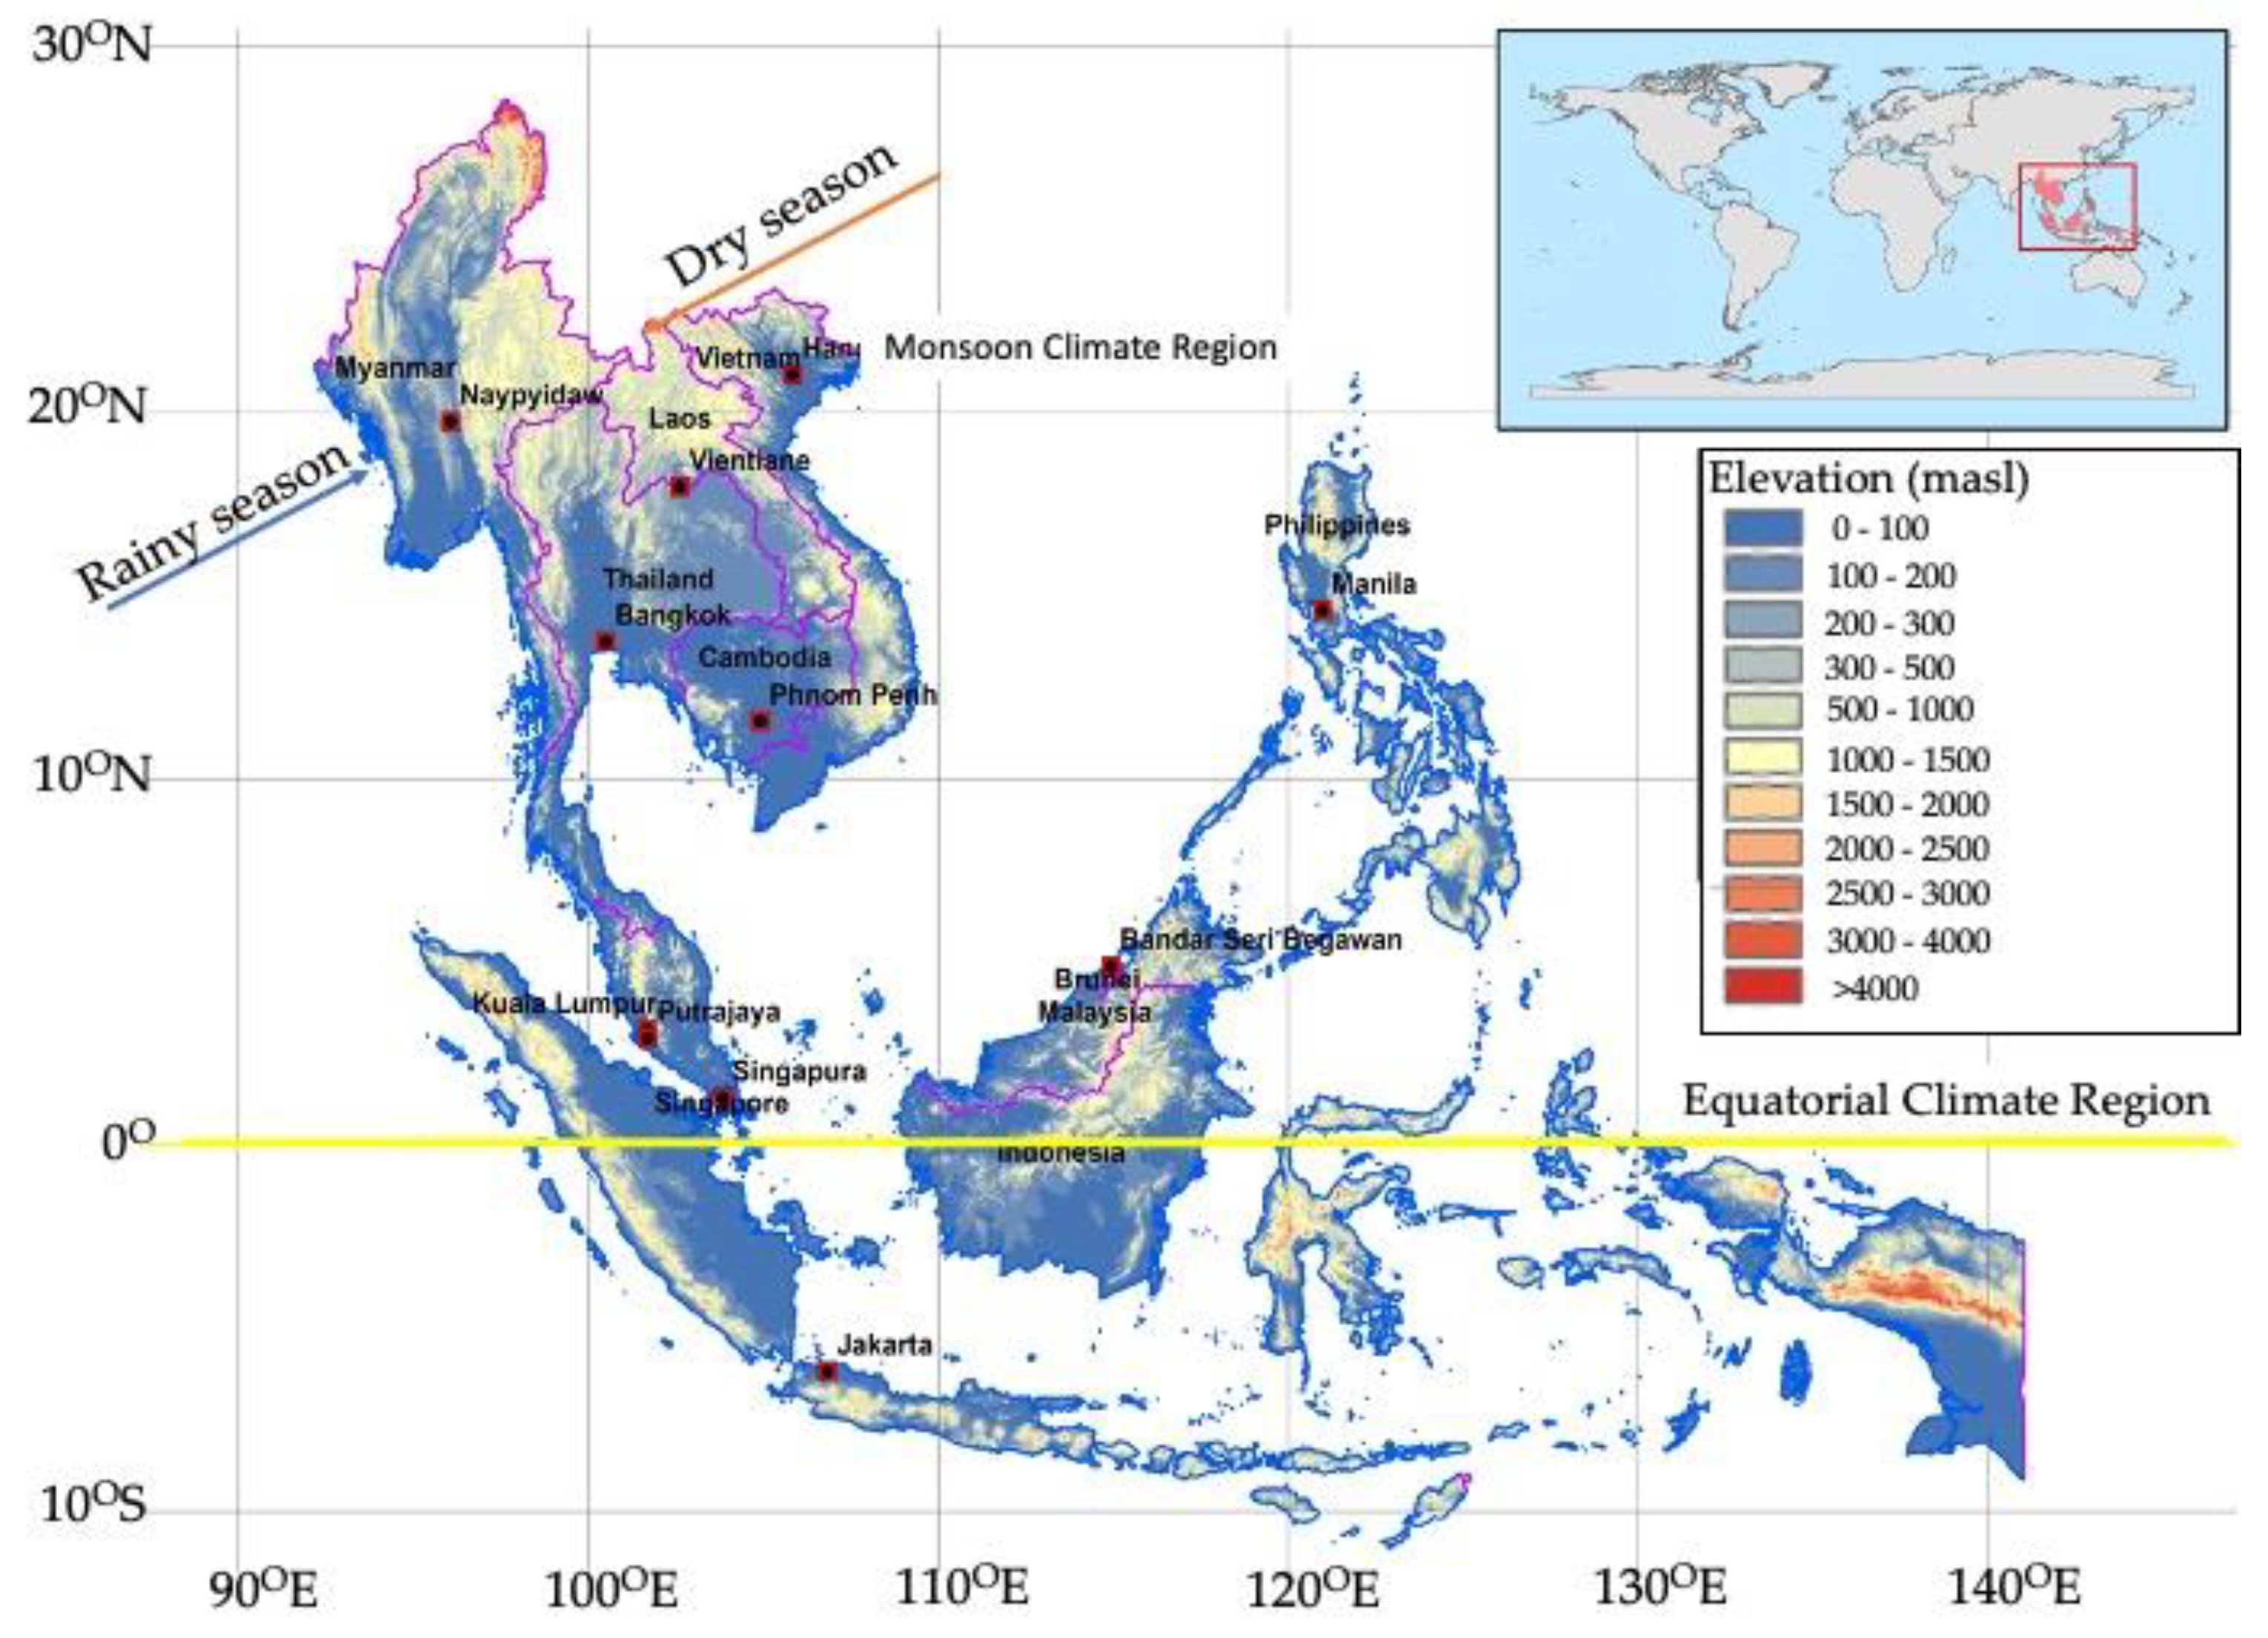
Tropical Asia is divided into the MCR and the ECR due to differences in climate variability, such as temperature, rainfall, crop season, and seasonal progression [20]. The MCR consists of Laos, Thailand, Cambodia, Viet Nam, and Myanmar. Meanwhile, Peninsular Malaysia, Philippines, Brunei Darussalam, Indonesia, and Singapore were included on ECR regions [25]. In this review, Singapore was not included because its total agricultural area is small (approximately 1000 ha), making it atypical for agriculture for SEA [26].
Understanding differences in the annual season between MCR and ECR, such as timing and impacts, is necessary because a little changes of temperature and precipitation pattern, when experienced for a long time, significantly affected for crops [3] in particular, for middle latitudes, the energy of agriculture is partly supplied from the tropics [27].
Some of the included studies assessed the annual season, precipitation, and temperature, as well as factors that cause rainy and dry seasons, and differences between the MCR and ECR. Vietnam and Thailand, located in the MCR, also situated in the center of southwest and northeast monsoons as the main tropical monsoon, which is linked to dry and wet season (Figure 3), when May to October refers to wet season and dry season comes during November–April [28,29]. In annual, the average precipitation of these regions are approximately 1400–2400 mm and can differ by 700–5000 mm, depending on the subregion [21,30,31]. In the dry season, the temperature was increased in June, while the highest rainfall intensity over May–August [32], the average temperature varies between 20.2 °C and 30.6 °C, for December and April, respectively.
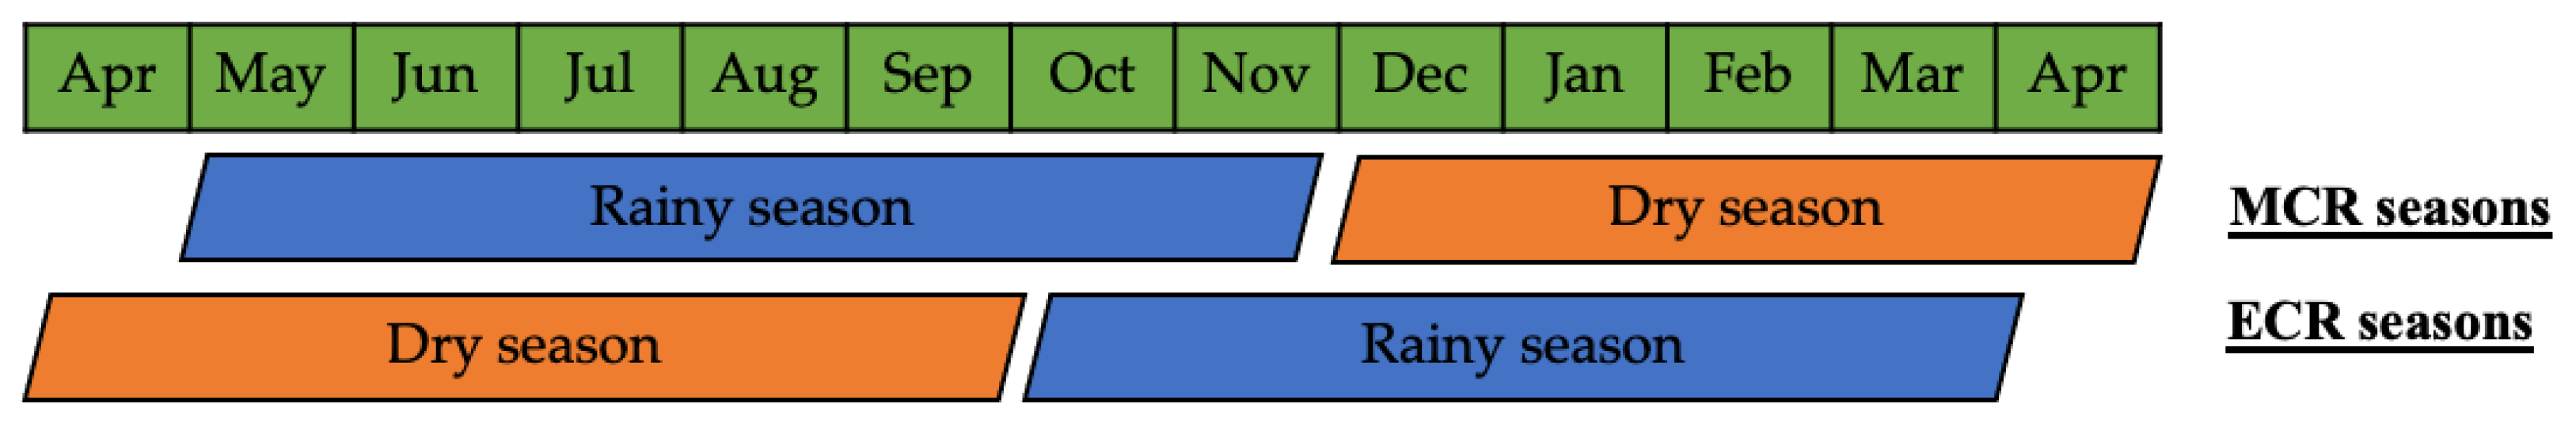
In the ECR, the rainy season starts in November; the northeast monsoon (NEM) starts from December to January as a peak of rainy season, which brings heavy rain and decreased until late March. Meanwhile, June to September as the southwest monsoon (SWM) which causes dry season due to brings less rainfall [5]. For example, the highest average precipitation intensity and temperature are ~2500 mm and 26 °C for Malaysia throughout the year (Tan et al., 2015). Meanwhile, Indonesia has an annual average temperature and precipitation intensity between 22 and 29 °C, and from 1773 to 3710 mm [3]. Differences in the annual season between the MCR and ECR are shown in Figure 4.
The climatic annual cycles in tropical Asia appear balanced between the dry and rainy seasons, and are characterized by humid, warm temperatures, annual mean rainfall intensity between 1000 and 5000 mm. Yet, variations in rainfall intensity and occurrence of rainy days have made it drought vulnerable. The variability of rainfall is major driven by monsoons [19], which show large variability among years of climate variabilities is a response to changes in ocean–atmospheric modes [33]. For instance, April 2016, the MCR and ECR encountered their warmest monthly average temperature since in the mid-20th century recorded [19,32]. These temperatures had impacts on forest fires in Indonesia [14]; paddy production caused by low water levels in the Mekong Delta in Thailand, Viet Nam and Lao PDR [34,35], the Muda River in Malaysia [36], and in Indonesia [37]; and water deficits in rainfed areas of the Philippines [38].
Th sea surface temperature (SST) variability is a main factor of hydroclimate variability especially over the tropical Asia, Pacific Ocean [39] and the Indian Ocean [40]. Furthermore, SST variability has been linked to processes modulating moisture distribution in the troposphere over Pacific and Indian Oceans [41]. Commonly used techniques as well as strengths and limitations of drought indices, and how to evaluate their accuracy and interactions with climate variability modes in the Indian and Pacific are discussed in Section 3.3.
3.3. Indices to Represent Drought
Assessment and monitoring of drought using a drought index is more appropriate than the use of direct hydrometeorological indicators, which are variables used to determine aspects related to drought such as rainfall and temperature. Drought indices are obtained numerically using hydrometeorological inputs and drought indicators. The index is intended to estimate the state of drought (severity and spatiotemporal attributes of a drought event) for a given period. The World Meteorological Organization and the Global Water Partnership [42] have provided 50 indices that have been used practically and theoretically in many drought studies. We found that a frequently used drought index, the SPI, is often used to provide planners and politicians greater decision-making power in SEA.
The SPI is constructed to analyze the drought events based on the long-term rainfall probability distribution using the gamma function. Rainfall is converted to a numerical value, and SPI is defined as standard deviations numbers, when analyzed rainfall deviates from the average for a normally distributed random variable. As a result, it can be used to define drought events in different regions. The indices provide an accurate and reliable estimation of the occurrences, severity, and spatial extent. When rainfall exceeds the long-term average, the SPI increases; when rainfall falls below the average, the SPI decreases. The SPI, not seems other drought indices, is easy to use since it only takes one set of long-term rainfall data [42] and based on normalized data [43], the SPI was explained as below:
where:
- is the rainfall of the selected period during the year ;
- is the mean rainfall (long-term);
- σ is selection period of standard deviation.
SPI is measured by the probability of rainfall for 1–48 months or longer, which is calculated using historical rainfall data. Thus, this index is easy to calculate and can be used for a 3-month timescale for stations with intermittent loss of rainfall. On the other hand, the exclusion of data such as temperature, evapotranspiration, soil water availability, and wind speed as input variables, is a major limitation in producing relevance drought information in a warming climate [43].
The SPEI indices was presented by Vicente-Serrano et al. [44], which rainfall and potential evapotranspiration as the main input. SPEI is measured refers to the non-exceeding probability of the difference between rainfall and PET adjusted using a three-parameter log-logistic distribution that takes into account the general negative value [45]. SPEI uses a three-parameter distribution to capture the deficit value since the humidity deficit is most likely negative in arid and semi-arid areas. In two-parameter as used in SPI, the x variable is lower boundary of zero (0 > x < ∞), which positive values represent in x. For the three-parameter distribution employed in SPEI, x can have any as (γ > x < ∞ ) range, presenting that x can possibly have negative values; γ is the distribution origin variable [46]. As a result, the SPEI indices was recommended to utilize a log-logistics distribution, which accommodates extreme negative values better [47]. The converting of water balance into distribution probabilities was obtained on SPEI indices. Potential evapotranspiration (PET) was calculated using the Thornthwaite equation [45] for this study.
The calculated values are aggregated at different time scales according to:
where:
- is the timescale (months) of the aggregation;
- is the calculation month.
SPEI is similar to SPI mathematically, but it also includes the role of PET, which is calculated using the Thornthwaite equation. The SPEI calculation, in contrast with the SPI, is based on the conversion of the log-logistic distribution of three months rainfall parameters. Since the SPEI is a standard variable, it can be used to compare droughts at various spatial and temporal scales. According to Abramowitz et al. [48], SPEI is defined as:
where:
- for P
- is the probability of exceeding a determined value and is given as:
- while the constants are:
- = 2.515517, = 0.802853, = 0.010328,
- = 1.432788, = 0.189269, = 0.001308.
A constant negative SPEI score, such as the SPI, indicates the drought period as extreme hydroclimate is based on severity, intensity, length, and magnitude [49]. Furthermore, one of SPEI’s strengths is the inclusion of temperature and standardization of the index, which increases its use in all climatic areas; one of SPEI’s limitations is the comparison of drought occurrences in different climatic areas. SPEI, for example, may be more susceptible to evapotranspiration in semi-arid environments, whereas SPEI is more susceptible to rainfall in humid environments [44] and it is not based on a water balance framework and doesn’t include a soil moisture factor to detect agricultural drought [46].
Palmer [50] developed PDSI using data of rainfall, temperature, and soil moisture content as parameters. The PDSI was developed using a 2-layer groundwater balance model to predict soil water availability on a monthly basis using inputs such as temperature, rainfall, and groundwater. Despite its shortcomings [51], the PDSI is widely used over the United States for monitoring drought and wet season conditions.
The PDSI was calculated by subtracting the volume of rainfall required to maintain normal water balance levels from the actual volume of rainfall [51,52]. The PDSI during the dry season is calculated as follows:
where:
- is the moisture anomaly index (or the Z index).
The weights, 0.897 and 1/3, are called duration factors that are empirically derived based on original study areas in central Iowa and western Kansas. It can be seen that the PDSI of a particular month depends on current conditions and also the cumulative patterns of the previous month.
The PDSI is an attempt to minimize the regional drought index by utilizing a basic water balance model; it was favorable since rainfall and temperature, as well as their combined impacts on evapotranspiration, soil moisture, and runoff, were taken into account [51] for drought intensity (Table 3). However, PDSI is not spatially comparable, although this has been partially overcome by PDSI self-calibration [53] and PET estimation using the Thornthwaite method, which has been improved by other algorithms, such as the Penman-Monteith equation. PDSI also has a negative bias in runoff estimation because it assumes that runoff occurs only when all soil layers have been saturated [18], and it has a long lag in identifying development of drought and reducing it [54]. Furthermore, Palmer [55] uses an empirical approach and averages climatic characteristics as well as duration factors in estimating PDSI in multiple areas, which restricts the comparison of PDSI values across climatological areas [56].
To determine the accuracy of each drought index in describing drought occurrences, the SPI and SPEI under different timelines were evaluated in terms of incidence, duration, and onset detection. The ratio of effective identification of past drought cases to the total number of reported drought cases is used to evaluate incident accuracy. For duration accuracy, probability of detection (POD), missed duration, false alarm rate (FAR), and false alarm duration were used, as defined in the Equations (8)–(10):
where a, b, c and d are the respective number of events falling in the categories shown in the following Table 4.
Finally, the accuracy of onset detection is evaluated by the difference between the expected onset found by the index and the actual reported onset using POD and FAR as the metrics to know and analyze the accuracy and assessment of drought [57,58], where early detection is denoted by a negative value, late detection is denoted by a positive value, and magnitude is the number of months. A drought index with a higher POD score, a lower missed duration, a lower FAR score, a lower false alarm duration, and a lower onset error detection will be considered a more effective drought index for tropical Southeast Asia.
4. Discussion
ENSO is a major phenomenon of inter-annual climatic variability that creates extreme weather anomalies in the tropics [59], such as precipitation events and intensities [60]. The huge release of heat and water vapor from the ocean into the atmosphere produces large-scale changes in atmospheric circulation [61], resulting in precipitation and temperature anomalies across the planet [62]. There are two fundamental mechanisms that allow ENSO to alter atmospheric processes in the tropics: The first mechanism involves the east and west circulation of Kelvin and Rossby waves in the tropical troposphere, respectively, induced by El Nino (warming troposphere) and La Nia (cooling troposphere) throughout the central and eastern tropical Pacific regions [63]. This tropical troposphere temperature anomaly affects the temperature and humidity in the planet’s boundary layer, resulting in SST anomalies in the Indian Ocean and tropical Atlantic Ocean due to changes in surface flux [64]. The second mechanism is atmospheric bridging [65], which is related to Walker circulation changes. During an El Nino period, convective activity in the Pacific area shifted eastward, causing an abnormal downward movement over the tropical eastern Indian Ocean, this movement results in ocean warming via increased solar radiation and latent heat flux [66]. Convective displacement also interrupts the Walker circulation’s Atlantic branch, resulting in an abnormal downward movement across the tropical Atlantic Ocean [67].
The least squares model (GLS) has been used to identify connections between drought and climate indexes such as ENSO to assess how large-scale ocean-atmospheric oscillations are connected to drought conditions. He et al. [21] observed that during El Nino periods, climate indexes can be connected to drought indices through SWM and NEM wind modulation, with SPEI and PDSI having a higher influence than SPI. This shows that climatic oscillations can have an impact on local temperature and evapotranspiration, worsening drought patterns. The method utilized to calculate the drought and climate indices, however, is only applicable in peninsular Malaysia. As a result, the empirical connection between drought conditions and atmospheric-ocean oscillations associated with monsoon circulation in the SEA area can be investigated and expanded from seasonal to multi-year empirical forecasts for tropical Asia’s water resource management.
Drought, as a natural hazard, can be extremely harmful. However, its gradual beginning and development allow an opportunity to prevent and reduce its impacts. Drought assessment is important for determining a proper handling; hence, it should be supported and improved. The differences in rainfall and the most widely used temperature-based indexes are highlighted in this study, with the PDSI being the most suitable for drought assessment in the agricultural sector due to the inclusion of soil moisture and PET. However, based on our findings, future studies should examine the application of a drought index in mountainous SEA regions. Malaysia, for example, receives more rainfall than that of the east coast during the NEM, whilst the west coast receives less rainfall during the SWM due to its location on the leeward side of the neighboring mountain ranges of the Indonesian island of Sumatra. Furthermore, an analysis of how the spatiotemporal drought pattern in the tropics is related to monsoons and moisture transport which is influenced by oscillations in the Pacific and Indian Oceans, and focusing not only on ENSO but also on quasi-biennial oscillations (QBO) and the Southwest Indian Ocean (SWIO), which can cause drought in tropical Asia, should be conducted.
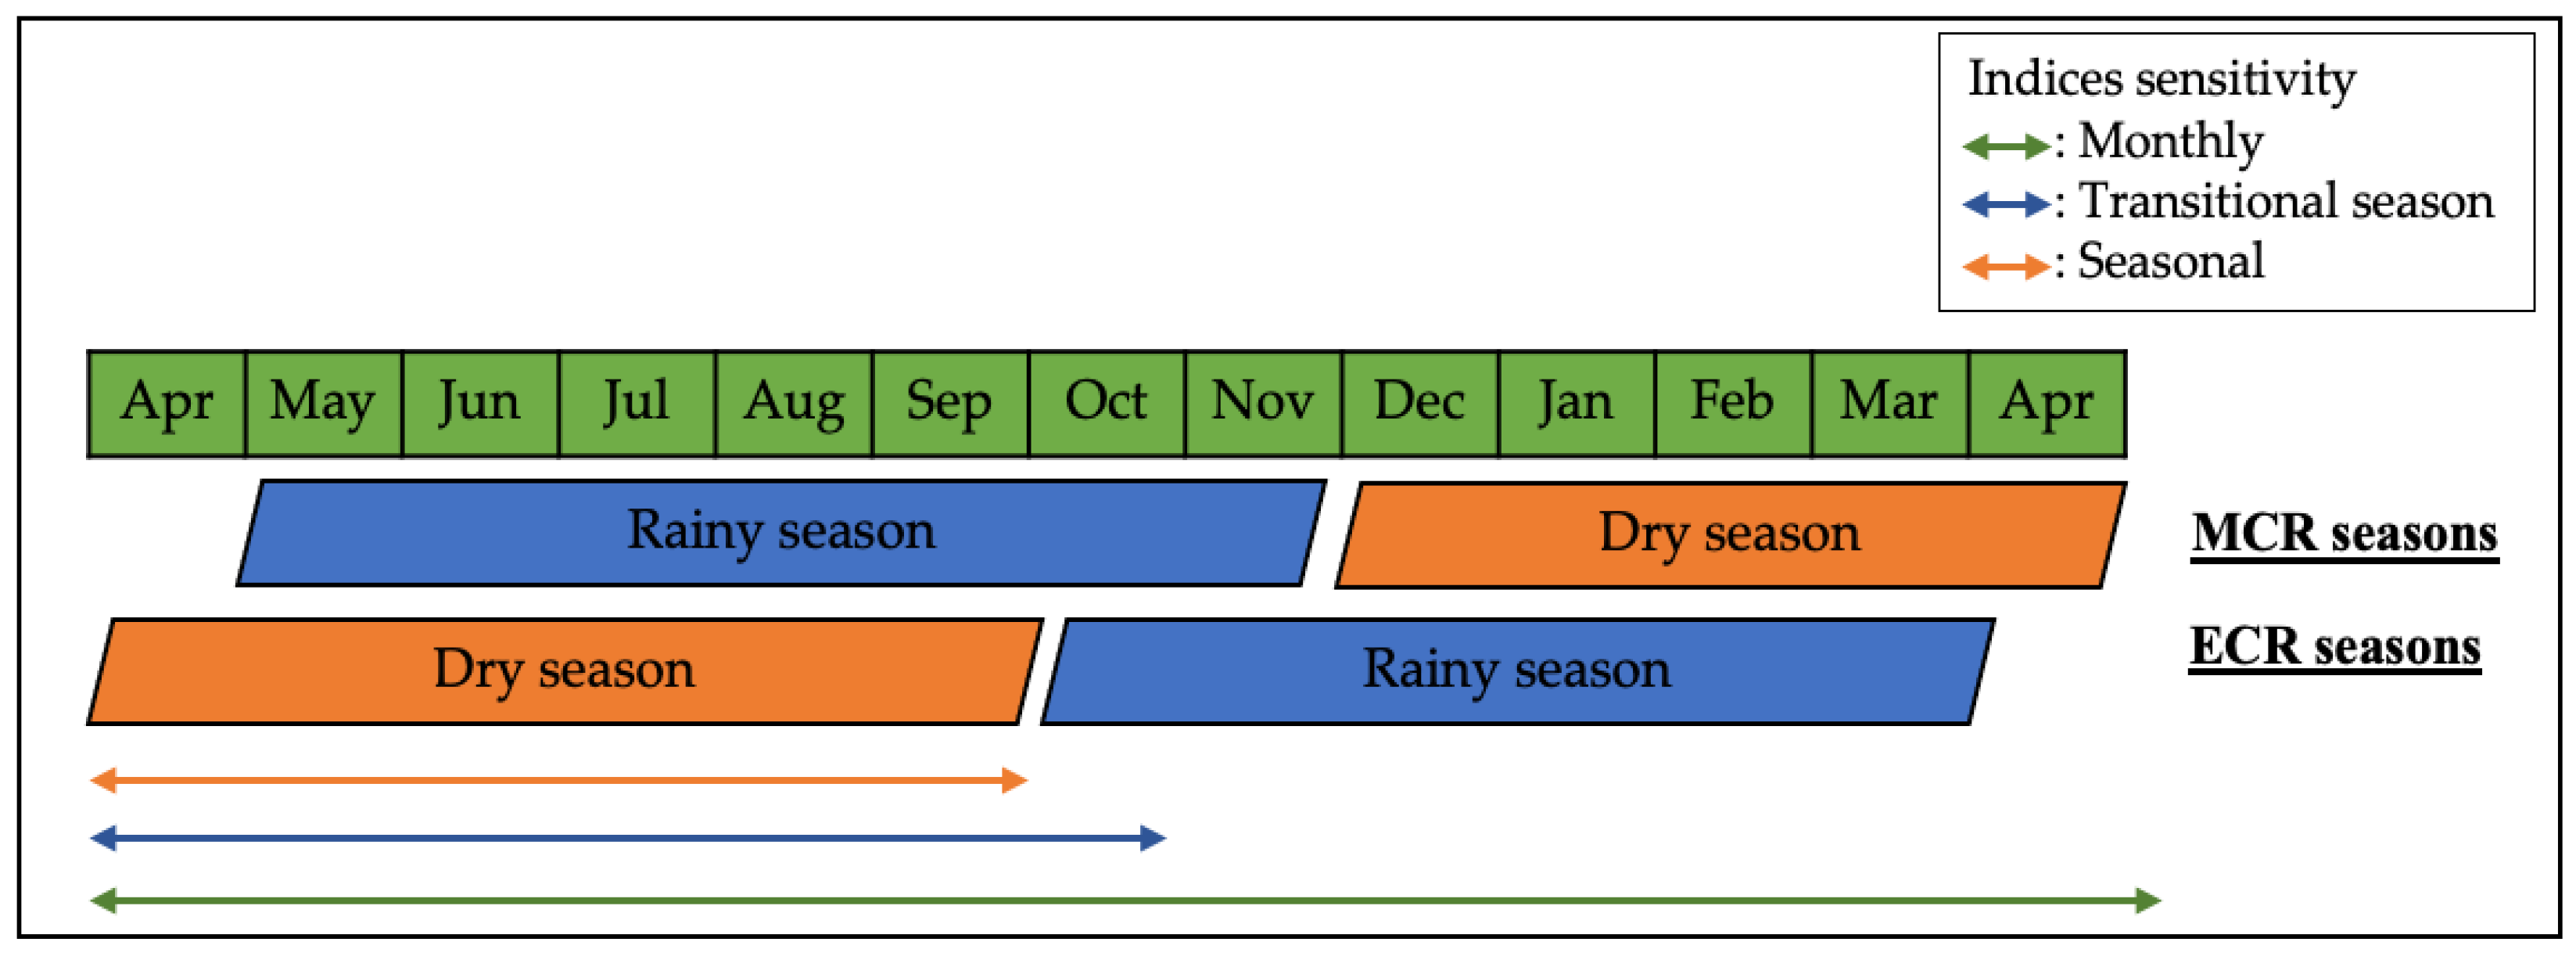
We also highlighted the application of drought indices in terms of temporal sensitivity. The timing of crop sensitivity to weather may vary significantly due to differences in management practices, such as variety and sowing dates, as well as weather conditions, affecting crop growth and development. Here, we propose future evaluation of the sensitivity of indices to monthly, seasonal, and transitional timescales (Figure 5). The use of a single drought index for all aspects should be avoided.
In this scheme, the orange and blue lines, are referred to the ability of SPEI and SPI, where, the input is meteorological parameters (precipitation, temperature, and ET) with the sensitivity limit to season and/or transition of season. For example, the SPI indices could be more sensitive to detect the severity of drought during when the dry season, not in a whole year (except the El-Nino comes) for tropical climate Asia. In addition, refers to meteorological parameters, meteorological drought is often the first occur, most common analyzed, and well documented [68,69]. Nevertheless, the point at which meteorological drought begins to affect other forms of drought is less well known and restricted to areas with good monitoring and observation [70]. Hence, we proposed to know the ability and sensitivity of indices to detect the drought every month as showed in the green line with parameter input encompasses precipitation, soil moisture, and evapotranspiration, which can be referred to as the strength of PDSI indices.
The relationship between meteorological drought and agriculture is complex and depends on many factors and determinants. Furthermore, without detailed hydro-climatic monitoring such as soil moisture, agricultural drought onset with affected on temporal crops sensitivity are difficult to detect and identify. Their inclusion in the assessment of the impact of meteorological drought on agricultural drought may depend on data availability such as long-term climate data, soil moisture, soil properties, and crop phenology information. However, this information is often limited or unavailable outside developed countries, such as in SEA. Therefore, increasing publicly available data will be important.
5. Conclusions
In this review, we highlighted state-of-the-art indices and methods used in the design of drought indices in tropical Asia and identified their strengths and limitations, as well as key research gaps. We also deliberated on new sources of data sets and modeling approaches that will contribute to the implementation of drought indices in a wider geographical context, as well as on a more localized level.
We highlighted several potential avenues of future research, in particular, the sensitivity of indices with specific purposes such as in the agricultural sector. We suggest the following directions to improve these benefits:
- (1)
- Greater emphasis on drought indices, especially in terms of sensitivity that can account for the role of reservoirs, and irrigated and rainfed farmland;
- (2)
- Further analysis of drought and climate indices, not only ENSO, but others such as QBO and SWIO, which may also indicate drought in tropical Asia;
- (3)
- Emphasis on index derivation during critical crop growth periods and dry season peaks using phenological observations; and
- (4)
- Use of modeling to assist in index design considering future hydroclimates.
Hopefully, the newly created Indonesian National Research and Innovation Agency (BRIN) will unite previously autonomous research and development agencies to address these issues with a more comprehensive effort to obtain parameter data observations using remote sensing and in situ data. In addition, use and proper implementation of drought indicators or indices depend on how easily they are interpreted, especially for farmers. Thus, we encourage further data rescue efforts to preserve data at risk of loss due to storage media corruption, as well as the digitization of data into a computer-readable form for easy access. The limitation of this study solely focused on drought as the disaster of extreme hydroclimate, which is another extreme hydroclimate disasters such as floods or flash flooding which commonly occurred in the tropical Southeast Asia and affected on many sectors not reviewed yet.
Author Contributions
Experimental design, data–collection and writing, M.K.Z.; supervision and revision, K.N. All authors have read and agreed to the published version of the manuscript.
Funding
This research was supported by KAKENHI Grand No. JP19H03069 and the Japan Society for the Promotion of Science (JSPS) Grand No. JP20J10806.
Data Availability Statement
The data used in this study are available upon request to the corresponding author.
Conflicts of Interest
The authors declare no conflict of interest.
References
- Caesar, J.; Alexander, L.V.; Trewin, B.; Tse-ring, K.; Sorany, L.; Vuniyayawa, V.; Keosavang, N.; Shimana, A.; Htay, M.M.; Karmacharya, J.; et al. Changes in Temperature and Precipitation Extremes over the Indo-Pacific Region from 1971 to 2005: Changes in CLimate Extremes Over The Indo-Pacific Region. Int. J. Climatol. 2011, 31, 791–801. [Google Scholar] [CrossRef]
- Villafuerte, M.Q.; Matsumoto, J. Significant Influences of Global Mean Temperature and ENSO on Extreme Rainfall in Southeast Asia. J. Clim. 2015, 28, 1905–1919. [Google Scholar] [CrossRef]
- Supari; Tangang, F.; Salimun, E.; Aldrian, E.; Sopaheluwakan, A.; Juneng, L. ENSO Modulation of Seasonal Rainfall and Extremes in Indonesia. Clim. Dyn. 2018, 51, 2559–2580. [Google Scholar] [CrossRef]
- United Nations; Economic and Social Commission for Asia and the Pacific. Ready for the Dry Years: Building Resilience to Drought in South-East Asia: With a Focus on Cambodia, Lao People’s Democratic Republic, Myanmar and Viet Nam; United Nations Publication: Bangkok, Thailand, 2019; ISBN 978-92-1-120787-3. [Google Scholar]
- Suhaila, J.; Deni, S.M.; Wan Zin, W.Z.; Jemain, A.A. Spatial Patterns and Trends of Daily Rainfall Regime in Peninsular Malaysia during the Southwest and Northeast Monsoons: 1975–2004. Meteorol. Atmos. Phys. 2010, 110, 1–18. [Google Scholar] [CrossRef]
- Ministry of Environment. Cambodia’s Initial National Communication under UNFCCC; Ministry of Environment publication: Phnom Penh, Cambodia, 2002. Available online: https://unfccc.int/resource/docs/natc/khmnc1.pdf (accessed on 22 December 2021).
- Lao People’s Democratic Republic. National Adaptation Programme of Action To Climate Change. UNDP, 2009. Available online: https://unfccc.int/resource/docs/napa/laos01.pdf (accessed on 21 December 2021).
- Stojanovic, M.; Liberato, M.L.R.; Sorí, R.; Vázquez, M.; Phan-Van, T.; Duongvan, H.; Hoang Cong, T.; Nguyen, P.N.B.; Nieto, R.; Gimeno, L. Trends and Extremes of Drought Episodes in Vietnam Sub-Regions during 1980–2017 at Different Timescales. Water 2020, 12, 813. [Google Scholar] [CrossRef] [Green Version]
- Duan, W.; He, B.; Nover, D.; Fan, J.; Yang, G.; Chen, W.; Meng, H.; Liu, C. Floods and Associated Socioeconomic Damages in China over the Last Century. Nat. Hazards 2016, 82, 401–413. [Google Scholar] [CrossRef]
- Steinemann, A.C.; Cavalcanti, L.F.N. Developing Multiple Indicators and Triggers for Drought Plans. J. Water Resour. Plann. Manag. 2006, 132, 164–174. [Google Scholar] [CrossRef] [Green Version]
- Sivakumar, B. Water Crisis: From Conflict to Cooperation—An Overview. Hydrol. Sci. J. 2011, 56, 531–552. [Google Scholar] [CrossRef]
- D’Arrigo, R.; Wilson, R. El Niño and Indian Ocean Influences on Indonesian Drought: Implications for Forecasting Rainfall and Crop Productivity. Int. J. Climatol. 2008, 28, 611–616. [Google Scholar] [CrossRef]
- Kusumaningtyas, S.D.A.; Aldrian, E. Impact of the June 2013 Riau Province Sumatera Smoke Haze Event on Regional Air Pollution. Environ. Res. Lett. 2016, 11, 075007. [Google Scholar] [CrossRef]
- Jacox, M.G.; Hazen, E.L.; Zaba, K.D.; Rudnick, D.L.; Edwards, C.A.; Moore, A.M.; Bograd, S.J. Impacts of the 2015–2016 El Niño on the California Current System: Early Assessment and Comparison to Past Events. Geophys. Res. Lett. 2016, 43, 7072–7080. [Google Scholar] [CrossRef]
- Tsegai, D.; Ardakanian, R. Capacity Development to Support National Drought Management Policies for Asia-Pacific Countries; UNW-DPC Publisher: Bonn, Germany, 2015; Available online: https://www.droughtmanagement.info/literature/UNW-DPC_Capacity_Development_to_Support_NDMP_Asia-Pacific_Countries_2015.pdf (accessed on 8 January 2022).
- Awani, A. Farmers in Kelantan to Face RM90mln in Losses Due to Drought. 2014. Available online: https://www.astroawani.com/berita-malaysia/farmers-kelantan-face-rm90mln-losses-due-drought-30159 (accessed on 23 December 2021).
- USDA MALAYSIA: El Nino Takes a Bite Out of 2015/16 Palm Oil Production 2016. Available online: https://ipad.fas.usda.gov/highlights/2016/08/malaysia/index.htm#:~:text=MALAYSIA%3A%20El%20Nino%20Takes%20a,most%20countries%20in%20the%20region (accessed on 23 December 2021).
- Mishra, A.K.; Singh, V.P. A Review of Drought Concepts. J. Hydrol. 2010, 391, 202–216. [Google Scholar] [CrossRef]
- Fung, K.F.; Huang, Y.F.; Koo, C.H.; Soh, Y.W. Drought Forecasting: A Review of Modelling Approaches 2007–2017. J. Water Clim. Chang. 2020, 11, 771–799. [Google Scholar] [CrossRef]
- Venkatappa, M.; Sasaki, N. Datasets of Drought and Flood Impact on Croplands in Southeast Asia from 1980 to 2019. Data Brief 2021, 38, 107406. [Google Scholar] [CrossRef]
- He, Q.; Chun, K.P.; Tan, M.L.; Dieppois, B.; Juneng, L.; Klaus, J.; Fournier, M.; Massei, N.; Yetemen, O. Tropical Drought Patterns and Their Linkages to Large-scale Climate Variability over Peninsular Malaysia. Hydrol. Processes 2021, 35, e14356. [Google Scholar] [CrossRef]
- Page, M.J.; McKenzie, J.E.; Bossuyt, P.M.; Boutron, I.; Hoffmann, T.C.; Mulrow, C.D.; Shamseer, L.; Tetzlaff, J.M.; Akl, E.A.; Brennan, S.E.; et al. The PRISMA 2020 Statement: An Updated Guideline for Reporting Systematic Reviews. BMJ 2021, 88, 105906. [Google Scholar] [CrossRef]
- Tranfield, D.; Denyer, D.; Smart, P. Towards a Methodology for Developing Evidence-Informed Management Knowledge by Means of Systematic Review. Br. J. Manag. 2003, 14, 207–222. [Google Scholar] [CrossRef]
- Allan, R.J.; Gergis, J.; D’Arrigo, R.D. Placing the AD 2014–2016 ‘Protracted’ El Niño Episode into a Long-Term Context. Holocene 2020, 30, 90–105. [Google Scholar] [CrossRef]
- Abatzoglou, J.T.; Dobrowski, S.Z.; Parks, S.A.; Hegewisch, K.C. TerraClimate, a High-Resolution Global Dataset of Monthly Climate and Climatic Water Balance from 1958–2015. Sci. Data 2018, 5, 170191. [Google Scholar] [CrossRef] [Green Version]
- Oliphant, A.J.; Thenkabail, P.S.; Teluguntla, P.; Xiong, J.; Gumma, M.K.; Congalton, R.G.; Yadav, K. Mapping Cropland Extent of Southeast and Northeast Asia Using Multi-Year Time-Series Landsat 30-m Data Using a Random Forest Classifier on the Google Earth Engine Cloud. Int. J. Appl. Earth Obs. Geoinf. 2019, 81, 110–124. [Google Scholar] [CrossRef]
- The Future of Food and Agriculture: Trends and Challenges; FAO (Ed.) Food and Agriculture Organization of the United Nations: Rome, Italy, 2017; ISBN 978-92-5-109551-5. Available online: https://www.fao.org/3/i6583e/i6583e.pdf (accessed on 3 January 2022).
- Homdee, T.; Pongput, K.; Kanae, S. A Comparative Performance Analysis of Three Standardized Climatic Drought Indices in the Chi River Basin, Thailand. Agric. Nat. Resour. 2016, 50, 211–219. [Google Scholar] [CrossRef] [Green Version]
- Kang, H.; Sridhar, V. A near-term drought assessment using hydrological and climate forecasting in the Mekong River Basin. Int. J. Climatol. 2021, 41, E2497–E2516. [Google Scholar] [CrossRef]
- Khadka, D.; Babel, M.S.; Shrestha, S.; Virdis, S.G.P.; Collins, M. Multivariate and Multi-Temporal Analysis of Meteorological Drought in the Northeast of Thailand. Weather Clim. Extrem. 2021, 34, 100399. [Google Scholar] [CrossRef]
- Le, M.-H.; Kim, H.; Moon, H.; Zhang, R.; Lakshmi, V.; Nguyen, L.-B. Assessment of Drought Conditions over Vietnam Using Standardized Precipitation Evapotranspiration Index, MERRA-2 Re-Analysis, and Dynamic Land Cover. J. Hydrol. Reg. Stud. 2020, 32, 100767. [Google Scholar] [CrossRef]
- Hui-Mean, F.; Yusop, Z.; Yusof, F. Drought Analysis and Water Resource Availability Using Standardised Precipitation Evapotranspiration Index. Atmos. Res. 2018, 201, 102–115. [Google Scholar] [CrossRef]
- Tangang, F.; Chung, J.X.; Juneng, L.; Supari; Salimun, E.; Ngai, S.T.; Jamaluddin, A.F.; Mohd, M.S.F.; Cruz, F.; Narisma, G.; et al. Projected Future Changes in Rainfall in Southeast Asia Based on CORDEX–SEA Multi-Model Simulations. Clim. Dyn. 2020, 55, 1247–1267. [Google Scholar] [CrossRef]
- Räsänen, T.A.; Kummu, M. Spatiotemporal Influences of ENSO on Precipitation and Flood Pulse in the Mekong River Basin. J. Hydrol. 2013, 476, 154–168. [Google Scholar] [CrossRef]
- Tran Anh, D.; Van, S.P.; Dang, T.D.; Hoang, L.P. Downscaling Rainfall Using Deep Learning Long Short-term Memory and Feedforward Neural Network. Int. J. Clim. 2019, 39, 4170–4188. [Google Scholar] [CrossRef]
- Fung, K.F.; Huang, Y.F.; Koo, C.H. Coupling Fuzzy–SVR and Boosting–SVR Models with Wavelet Decomposition for Meteorological Drought Prediction. Environ. Earth Sci 2019, 78, 693. [Google Scholar] [CrossRef]
- Suroso; Nadhilah, D.; Ardiansyah; Aldrian, E. Drought Detection in Java Island Based on Standardized Precipitation and Evapotranspiration Index (SPEI). J. Water Clim. Chang. 2021, 12, 2734–2752. [Google Scholar] [CrossRef]
- Stuecker, M.F.; Tigchelaar, M.; Kantar, M.B. Climate Variability Impacts on Rice Production in the Philippines. PLoS ONE 2018, 13, e0201426. [Google Scholar] [CrossRef] [PubMed]
- Daud, N.R.; Akhir, M.F.; Muslim, A.M. Dynamic of ENSO towards Upwelling and Thermal Front Zone in the East Coast of Peninsular Malaysia. Acta Oceanol. Sin. 2019, 38, 48–60. [Google Scholar] [CrossRef]
- Gao, J.; Zhao, H.; Klotzbach, P.J.; Wang, C.; Raga, G.B.; Chen, S. Possible Influence of Tropical Indian Ocean Sea Surface Temperature on the Proportion of Rapidly Intensifying Western North Pacific Tropical Cyclones during the Extended Boreal Summer. J. Clim. 2020, 33, 9129–9143. [Google Scholar] [CrossRef]
- Baldysz, Z.; Nykiel, G.; Latos, B.; Baranowski, D.B.; Figurski, M. Interannual Variability of the GNSS Precipitable Water Vapor in the Global Tropics. Atmosphere 2021, 12, 1698. [Google Scholar] [CrossRef]
- Svoboda, M.D.; Fuchs, B.A.; Integrated Drought Management Programme; World Meteorological Organization; Global Water Partnership; University of Nebraska—Lincoln; National Drought Mitigation Center. Handbook of Drought Indicators and Indices; World Meteorological Organization: Geneva, Switzerland, 2016; ISBN 978-92-63-11173-9. [Google Scholar]
- Daniel, C.E.; Thomas, B.M. Characteristics of 20th Century Drought in the United States at Multiple Time Scales; Atmospheric Science Paper; Climatology Report; Department of Atmospheric Science, Colorado State University: Fort Collins, CO, USA, 1997; Volume 97–2. [Google Scholar]
- Vicente-Serrano, S.M.; Van der Schrier, G.; Beguería, S.; Azorin-Molina, C.; Lopez-Moreno, J.-I. Contribution of Precipitation and Reference Evapotranspiration to Drought Indices under Different Climates. J. Hydrol. 2015, 526, 42–54. [Google Scholar] [CrossRef] [Green Version]
- Thornthwaite, C.W. An Approach toward a Rational Classification of Climate. Geogr. Rev. 1948, 38, 55. [Google Scholar] [CrossRef]
- Vicente-Serrano, S.M.; Beguería, S.; López-Moreno, J.I. A Multiscalar Drought Index Sensitive to Global Warming: The Standardized Precipitation Evapotranspiration Index. J. Clim. 2010, 23, 1696–1718. [Google Scholar] [CrossRef] [Green Version]
- Hernandez, E.A.; Uddameri, V. Standardized Precipitation Evaporation Index (SPEI)-Based Drought Assessment in Semi-Arid South Texas. Environ. Earth Sci 2014, 71, 2491–2501. [Google Scholar] [CrossRef]
- Abramowitz, M.; Stegun, I.A. Handbook of Mathematical Function With Formuas, Graphs, and Mathematical Tables; Applied Matematic Series; U.S. Government Printing Office: Washington, DC, USA, 1964.
- Byakatonda, J.; Parida, B.P.; Kenabatho, P.K.; Moalafhi, D.B. Influence of Climate Variability and Length of Rainy Season on Crop Yields in Semiarid Botswana. Agric. For. Meteorol. 2018, 248, 130–144. [Google Scholar] [CrossRef]
- Palmer, W.C. Keeping Track of Crop Moisture Conditions, Nationwide: The New Crop Moisture Index. Weatherwise 1968, 21, 156–161. [Google Scholar] [CrossRef]
- Alley, W.M. The Palmer Drought Severity Index: Limitations and Asumptions. J. Clim. Appl. Meteorl. 1984, 23, 1101–1109. [Google Scholar] [CrossRef] [Green Version]
- Wells, N.; Goddard, S.; Hayes, M.J. A Self-Calibrating Palmer Drought Severity Index. J. Clim. 2004, 17, 17. [Google Scholar] [CrossRef]
- Burke, E.J.; Brown, S.J.; Christidis, N. Modeling the Recent Evolution of Global Drought and Projections for the Twenty-First Century with the Hadley Centre Climate Model. J. Hydrometeorol. 2006, 7, 1113–1125. [Google Scholar] [CrossRef]
- Hayes, M.J.; Svoboda, M.D.; Wilhite, D.A.; Vanyarkho, O.V. Monitoring the 1996 Drought Using the Standardized Precipitation Index. Drought Mitig. Cent. Fac. Publ. 1999, 31, 429–438. [Google Scholar] [CrossRef] [Green Version]
- Palmer, W.C. Meteorological Drought; Research Paper No. 45; U.S. Weather Bureau: Washington, DC, USA, 1965.
- Guttman, N.B. Comparing the Palmer Drought Index and the Standardized Precipitation Index. J. Am. Water Resour. Assoc. 1998, 34, 113–121. [Google Scholar] [CrossRef]
- Yuan, X.; Wood, E.F. Multimodel Seasonal Forecasting of Global Drought Onset. Geophys. Res. Lett. 2013, 40, 4900–4905. [Google Scholar] [CrossRef]
- Hao, Z.; AghaKouchak, A. A Nonparametric Multivariate Multi-Index Drought Monitoring Framework. J. Hydrometeorol. 2014, 15, 89–101. [Google Scholar] [CrossRef]
- Trenberth, K.E. El Niño Southern Oscillation (ENSO). In Encyclopedia of Ocean Sciences; Elsevier: Amsterdam, The Netherlands, 2019; pp. 420–432. ISBN 978-0-12-813082-7. [Google Scholar]
- Duan, W.; He, B.; Takara, K.; Luo, P.; Hu, M.; Alias, N.E.; Nover, D. Changes of Precipitation Amounts and Extremes over Japan between 1901 and 2012 and Their Connection to Climate Indices. Clim. Dyn. 2015, 45, 2273–2292. [Google Scholar] [CrossRef]
- Zheleznova, I. Atmospheric Circulation Remote Response during Two Types of El Niño in Changing Climate. Geophys. Res. Abstr. 2017, 19, EGU2017-11984. Available online: https://meetingorganizer.copernicus.org/EGU2017/EGU2017-11984.pdf (accessed on 10 January 2022).
- Wang, C.; Deser, C.; Yu, J.-Y.; DiNezio, P.; Clement, A. El Niño and Southern Oscillation (ENSO): A Review. In Coral Reefs of the Eastern Tropical Pacific; Glynn, P.W., Manzello, D.P., Enochs, I.C., Eds.; Coral Reefs of the World; Springer: Dordrecht, The Netherlands, 2017; Volume 8, pp. 85–106. ISBN 978-94-017-7498-7. [Google Scholar]
- Chiang, J.C.H.; Sobel, A.H. Tropical Tropospheric Temperature Variations Caused by ENSO and Their Influence on the Remote Tropical Climate. J. Clim. 2002, 15, 16. [Google Scholar] [CrossRef] [Green Version]
- Yang, S.; Li, Z.; Yu, J.-Y.; Hu, X.; Dong, W.; He, S. El Niño–Southern Oscillation and Its Impact in the Changing Climate. Natl. Sci. Rev. 2018, 5, 840–857. [Google Scholar] [CrossRef]
- Alexander, M.A. The Atmospheric Bridge: The Influence of ENSO Teleconnections on Air–Sea Interaction over the Global Oceans. J. Clim. 2002, 15, 27. [Google Scholar] [CrossRef]
- Klein, S.A.; Soden, B.J.; Lau, N.-C. Remote Sea Surface Temperature Variations during ENSO: Evidence for a Tropical Atmospheric Bridge. J. Clim. 1999, 12, 16. [Google Scholar] [CrossRef] [Green Version]
- Lau, N.-C.; Leetmaa, A.; Nath, M.J. Attribution of Atmospheric Variations in the 1997–2003 Period to SST Anomalies in the Pacific and Indian Ocean Basins. J. Clim. 2006, 19, 3607–3628. [Google Scholar] [CrossRef]
- Archer, E.; Landman, W.; Malherbe, J.; Tadross, M.; Pretorius, S. South Africa’s Winter Rainfall Region Drought: A Region in Transition? Clim. Risk Manag. 2019, 25, 100188. [Google Scholar] [CrossRef]
- Mbiriri, M.; Mukwada, G.; Manatsa, D. Influence of Altitude on the Spatiotemporal Variations of Meteorological Droughts in Mountain Regions of the Free State Province, South Africa (1960–2013). Adv. Meteorol. 2018, 2018, 5206151. [Google Scholar] [CrossRef] [Green Version]
- Watson, A.; Miller, J.; Künne, A.; Kralisch, S. Using Soil-Moisture Drought Indices to Evaluate Key Indicators of Agricultural Drought in Semi-Arid Mediterranean Southern Africa. Sci. Total Environ. 2022, 812, 152464. [Google Scholar] [CrossRef]
Figure 1.
Systematic Reviews and Meta-Analyses diagram.

Figure 2.
Number of studies published from 2000 to 2020.

Figure 3.
The monsoon climatic region and equatorial climatic region in Southeast Asia.

Figure 4.
Differences in the annual seasons of the monsoon climate region (MCR) and equatorial climate region (ECR).
Figure 4.
Differences in the annual seasons of the monsoon climate region (MCR) and equatorial climate region (ECR).

Figure 5.
Timing of index sensitivity. The dry season occurs from April to October in the equatorial climate region (ECR) and December to April in the monsoon climate region (MCR). The green, blue, and orange arrows show the monthly, seasonal, and transitional sensitivity of detection of drought, respectively.


Table 1.
Inclusion and exclusion criteria.
| Inclusion | Exclusion |
|---|---|
| Indexed only in Scopus | Not indexed in Scopus |
| Published in 2000–2021 | Published before 2000 or after November 2021 |
| Language: English | Language: non-English |
| Document type: peer-reviewed journal articles | Review papers; book chapters; editorials; letters; proceedings; unpublished, non-peer-reviewed documents; in press. |
| Focused on three drought indices (SPI, SPEI, and PDSI) | Focused on other indices |
Table 2.
Number of publications from each country.
| No | Country | Number of Publications |
|---|---|---|
| 1 | Viet Nam | 5 |
| 2 | Malaysia | 4 |
| 3 | Thailand | 3 |
| 4 | Indonesia | 2 |
| 5 | Myanmar, Cambodia, Philippines, Brunei Darussalam, and Lao | 0 |
Table 3.
The severity and values of drought indices.
| Drought Category | PDSI Value | SPEI Value | SPI Value |
|---|---|---|---|
| No drought | >−1 | >−0.5 | −0.99~0.99 |
| Mild drought | −1~−2 | −0.5~−1 | 0~−0.99 |
| Moderate drought | −2~−3 | −1~−1.5 | −1.00~−1.49 |
| Severe drought | −3~−4 | −1.5~−2 | −1.50~−1.99 |
| Extreme drought | <−4 | <−2 | <−2 |
Table 4.
Contingency table used in the calculation of the probability of detection and false alarm rate.
Table 4.
Contingency table used in the calculation of the probability of detection and false alarm rate.
| Recorded Dry Months | |||
|---|---|---|---|
| Yes | No | ||
| Index indicated dry months | Yes | a (hit) | b (false alarm) |
| No | c (missed) | d (corrective negative) | |
Publisher’s Note: MDPI stays neutral with regard to jurisdictional claims in published maps and institutional affiliations. |
© 2022 by the authors. Licensee MDPI, Basel, Switzerland. This article is an open access article distributed under the terms and conditions of the Creative Commons Attribution (CC BY) license (https://creativecommons.org/licenses/by/4.0/).
Share and Cite
MDPI and ACS Style
Zaki, M.K.; Noda, K. A Systematic Review of Drought Indices in Tropical Southeast Asia. Atmosphere 2022, 13, 833. https://0-doi-org.brum.beds.ac.uk/10.3390/atmos13050833
AMA Style
Zaki MK, Noda K. A Systematic Review of Drought Indices in Tropical Southeast Asia. Atmosphere. 2022; 13(5):833. https://0-doi-org.brum.beds.ac.uk/10.3390/atmos13050833
Chicago/Turabian StyleZaki, Muhamad Khoiru, and Keigo Noda. 2022. "A Systematic Review of Drought Indices in Tropical Southeast Asia" Atmosphere 13, no. 5: 833. https://0-doi-org.brum.beds.ac.uk/10.3390/atmos13050833
Note that from the first issue of 2016, this journal uses article numbers instead of page numbers. See further details here.