
Evaluation of the Wind Environment around Multiple Urban Canyons Using Numerical Modeling


1
Department of Environmental Engineering, Institute of Climate Change, Mokpo National University, Muan-gun 58554, Korea
2
Department of Environmental Atmospheric Sciences, Pukyong National University, Busan 48513, Korea
3
Supercomputer Center, Pukyong National University, Busan 48513, Korea
4
Department of Environmental Engineering, Daegu University, Gyeongsan 38554, Korea
*
Author to whom correspondence should be addressed.
Atmosphere 2022, 13(5), 834; https://0-doi-org.brum.beds.ac.uk/10.3390/atmos13050834
Submission received: 27 April 2022
/
Revised: 16 May 2022
/
Accepted: 18 May 2022
/
Published: 19 May 2022
(This article belongs to the Special Issue Computational Fluid Dynamics Simulations of Urban Airflow)
Abstract
:This study aimed to evaluate the wind environment in step-up and step-down urban canyons through a computational numerical experiment using the computational fluid dynamics (CFD) model. Spatial structural conditions were considered according to the location of high-rise buildings, and the changing wind patterns inside canyons were compared and analyzed by varying the building heights. Under the step-up to step-down condition, wind velocity inside the canyon weakened, a vertical vortex formed, and vertical air flow separated; additionally, in shallow and deep canyons, wind velocity and detailed flow differed slightly according to each additional condition. For the step-down to step-up condition, the building located in the center appeared to be isolated, and a general wind environment phenomenon consistent with the step-up and step-down structures was observed. However, depending on the isolated area, an additional roof-top canyon was formed, and the wind field in the canyon was found to affect the wind velocity and detailed flow in other canyons. The wind velocity components of the inflow and outflow winds into the canyon differed based on the step-up to step-down or step-down to step-up conditions, and according to the conditions in the first and second canyons. Furthermore, the vertical wind velocity components were greatly affected by the step-up and step-down structures. Accordingly, the height and structural location of the building could affect various phenomena, such as the separation of vortices and air currents inside the canyon, and a variable wind environment was formed according to a series of conditions for the building.
1. Introduction
Industrialization and economic development have concentrated the population influx of certain regions and induced the expansion of urban areas through the creation of various industrial complexes and residential areas. They have also caused rapid land and urban development, leading to an increase in the number of artificial structures. This serves as an opportunity for the application of various urban planning strategies and has also become a major discussion point for the application of compressed urbanization by examining the concept of “New Urbanism” or the “Urban Village”, considering the planned control and sustainability of urban areas [1,2,3,4,5]. Compact cities were first introduced in the late 1980s in developed Western countries. They have been widely implemented since the 1990s, leading to changes in the forms and structures of conventional cities for the efficient use of land by supplementing the connectivity between cities [1,2,5].
Due to these changes in urban forms and structures, relatively high-rise buildings are now located in the centers of development zones, causing numerous issues related to the urban wind environment and thermal environment [3,5,6,7,8,9,10]. In particular, the height difference between neighboring buildings causes the diversification of urban spatial structures, which also serves to further intensify the uncertainty in the prediction of changes in the wind environment. In fact, wind phenomena with anomalous properties such as sudden vortices and building winds are known to inflict discomfort/injuries to pedestrians and affect the durability of buildings [8,11,12,13]. Accordingly, several studies on the wind environment of canyons (formed because of the differences in building heights) based on the conditions of the exterior ratio of buildings have been conducted. In Oke (1988), the characteristics of surface flow according to width are represented by skimming flow (SF), wake interface flow (WIF), and isolated roughness flow (IRF). Other related studies have also examined the effects of the wind environment [14,15], and horizontal and symmetrical flows in canyons have been reported [9,11,12,16]. In addition, many studies have been conducted on vertical airflow characteristics based on height, such as the occurrence of various vortexes in step-up and -down canyons, the formation of attachment points, and changes in flow separation area [17,18,19,20,21,22,23,24,25,26]. Recently, several studies have been conducted on the thermal environment in relation to pollutant evaluation [17,20,23,27]. Under ideal conditions, wind environment evaluations should be continuously presented to provide basic data on wind, such as direction and airflow changes [10,12,15,18,24,25,26,28].
However, additional research is required to reflect various conditions in line with these complex urban structure changes. In particular, the evaluation of the wind environment of multiple canyons occurring in series based on obstacle ratios and building arrangements is currently insufficient. Accordingly, it is necessary to evaluate the wind environment in relation to the formation of multiple canyons and chain changes in airflow as a result of the congregation of buildings and consider external arrangements, such as the step-up and -down of buildings, with different appearance ratios. In this study, we evaluate the wind environment in multiple canyons formed due to the arrangement and height difference of buildings. We compare and analyze wind patterns and changes formed in urban canyons through wind sensitivity experiments focusing on the diversification of urban canyons. In addition, the wind inflow and outflow and the variability of wind velocity components according to the characteristics and conditions of the wind environment that appears according to the structural location of high-rise buildings and the depth of the canyon are considered.
2. Numerical Description
2.1. Computational Fluid Dynamics Model
In this study, computational fluid dynamics (CFD), a specialized form of numerical analysis, was used. Since the development of the initial model by the Argonne National Laboratory in the United States in 1995, this model has been supplemented and improved through continuous feedback from users over the past several decades. The CFD model compensates for the shortcomings of the wind tunnel experiment with temporal and spatial constraints, enabling ultra-high-resolution analysis of local atmospheric flows on a city scale based on computerized numerical experiments. It is a numerical experimental tool that can conduct wind environment sensitivity tests that reflect various factors based on atmospheric conditions with economic efficiency and usefulness.
The CFD model used in this study applied the k-ε turbulence termination method based on the renormalization group (RNG) theory to turbulence parameterization. The Swall function was used to reflect the turbulence boundary layer effect at the wall boundary well [16,25,29,30]. In the case of Reynolds-averaged Navier–Stokes (RANS) governing equations, the Semi-Implicit Method for Pressure-Linked Equations (SIMPLE) algorithm was applied with finite volumetric methods in staggered grid systems, and the flow of three-dimensional non-rotation, non-rotation, and non-compressor was as follows [15,16,17,18,29,30,31,32].
Here, is the -th average velocity component, is the pressure difference from the reference value, is the perturbation component of , is the atmosphere density, and is the molecular viscosity of the atmosphere. The parameterization of Reynolds stress in Equation (1) is shown in (3) and (4).
is the turbulent diffusion coefficient for the momentum, is the Kronecker delta, is the turbulent kinetic energy, and in the RNG turbulence model, is calculated as shown in Equation (4). In addition, is an empirical constant, and the RNG turbulence model of Yakhot et al. (1992) was used to parameterize turbulence. The disappearance term (R) was additionally considered in the extinction rate equation of turbulence kinetic energy [33]. This was to consider the unbalanced strain rate, which differs from the typical standard turbulence model by using different constant values [34]. Equations (5) and (6) were used as equations for turbulence kinetic energy and extinction rate (). , , and are empirical constants, and the stress–strain added to the last term on the right side of Equation (6) is shown in Equations (7) and (8). Equation (9) is the constant value used in the RNG turbulence model [33].
The model used in this study is the same as that used in Hayati and Stoll et al. (2019) [35] and Park and Kim et al. (2020) [25]. Numerous studies have been conducted on numerical analysis at an urban scale, and the models that have been evaluated have been shown to be highly reliable in verifying the consistency of the wind tunnel test and simulation results. Accordingly, the wind environment sensitivity test has been effectively simulated [15,16,17,18,22,23,24,25,27,29]. Kim and Baik (2004) [29], using the same CFD model as this study, showed a very high level of consistency compared to the wind tunnel experiments by Brown and Lawson Jr. et al. (2000) [36]. The model used by Hayati and Stoll et al. (2019) showed good reproduction compared to that of the other CFD models [35]. In particular, Park and Kim et al. (2020) [25] compared the results obtained using the CFD model in the step-up canyon with the measurement results of Addepalli and Pardyjak (2013) [24] and detailed their results. Figure 1 is an excerpt of a part of the verification results, showing the changes in the shallow canyons (SCs) and deep canyons (DCs) by normalizing the vertical wind velocity components. Based on the results, a stagnation point was formed under the influence of the building on the downwind side, causing wind separation under all conditions, and a strong downdraft was found to be dominant at the lower part of the stagnation point. Compared with the measurement results, the main features such as stagnation points, vortices, and vertical airflows were well reproduced using the CFD model. However, the differences according to specific conditions, such as the underestimation of the recirculation area and the suppression of the vortex generated at the bottom of the building on the downwind side of the canyon, were identified through a full review of the above study. Therefore, despite its limitations, the CFD model used in this study appears to be highly reliable for determining overall flow and the reproducibility of main features, making it adequate for wind environment analysis under various conditions.
2.2. Simulation Set-Up
To effectively simulate the wind stream formed and developed in each urban canyon based on the change in the height of the building group, we set the calculation area of the numerical model as a three-dimensional spatial coordinate system, as shown in Figure 2. The vertical distribution suggested by Castro and Apsley (1997) was used as the inflow boundary condition of the CFD model [37]. The initial conditions for wind (, , ), turbulent kinetic energy (), and extinction rate () are as follows.
Here, , , , and represent friction speed, roughness length (=0.05 m), von Karman constant (=0.4), and boundary layer thickness (=1000 m), respectively. is the empirical constant for turbulent kinetic energy and extinction rate (=0.0845) [17,25,27,32]. A uniform grid of 2 m was applied in all directions, and an inflow in the x-increasing direction was assumed in the domain on the scale of x × y × z = 210 × 210 × 80 m. For the buildings in the calculation area, the step-up to step-down condition (Case 1), which is the change in height of both buildings (Bu and Bd) with respect to the central building (Bc), and the step-down to step-up condition (Case 2), which is the height change of the central building (Bc) based on the high-rise buildings (Bu and Bd) on both sides, were applied as experimental conditions, as shown in Figure 2 and Table 1. Furthermore, to evaluate the wind environment of the step-up and step-down canyons formed according to the multiplexing of the buildings, the exterior ratio consisting of the variable vertical height (z) of the buildings in relation to the width (S) of the urban canyon was set for the intensive comparative analysis of the conditions of shallow (z/S = 1.0) and deep (z/S = 2.0) urban canyons.
3. Step-Up to Step-Down Canyons
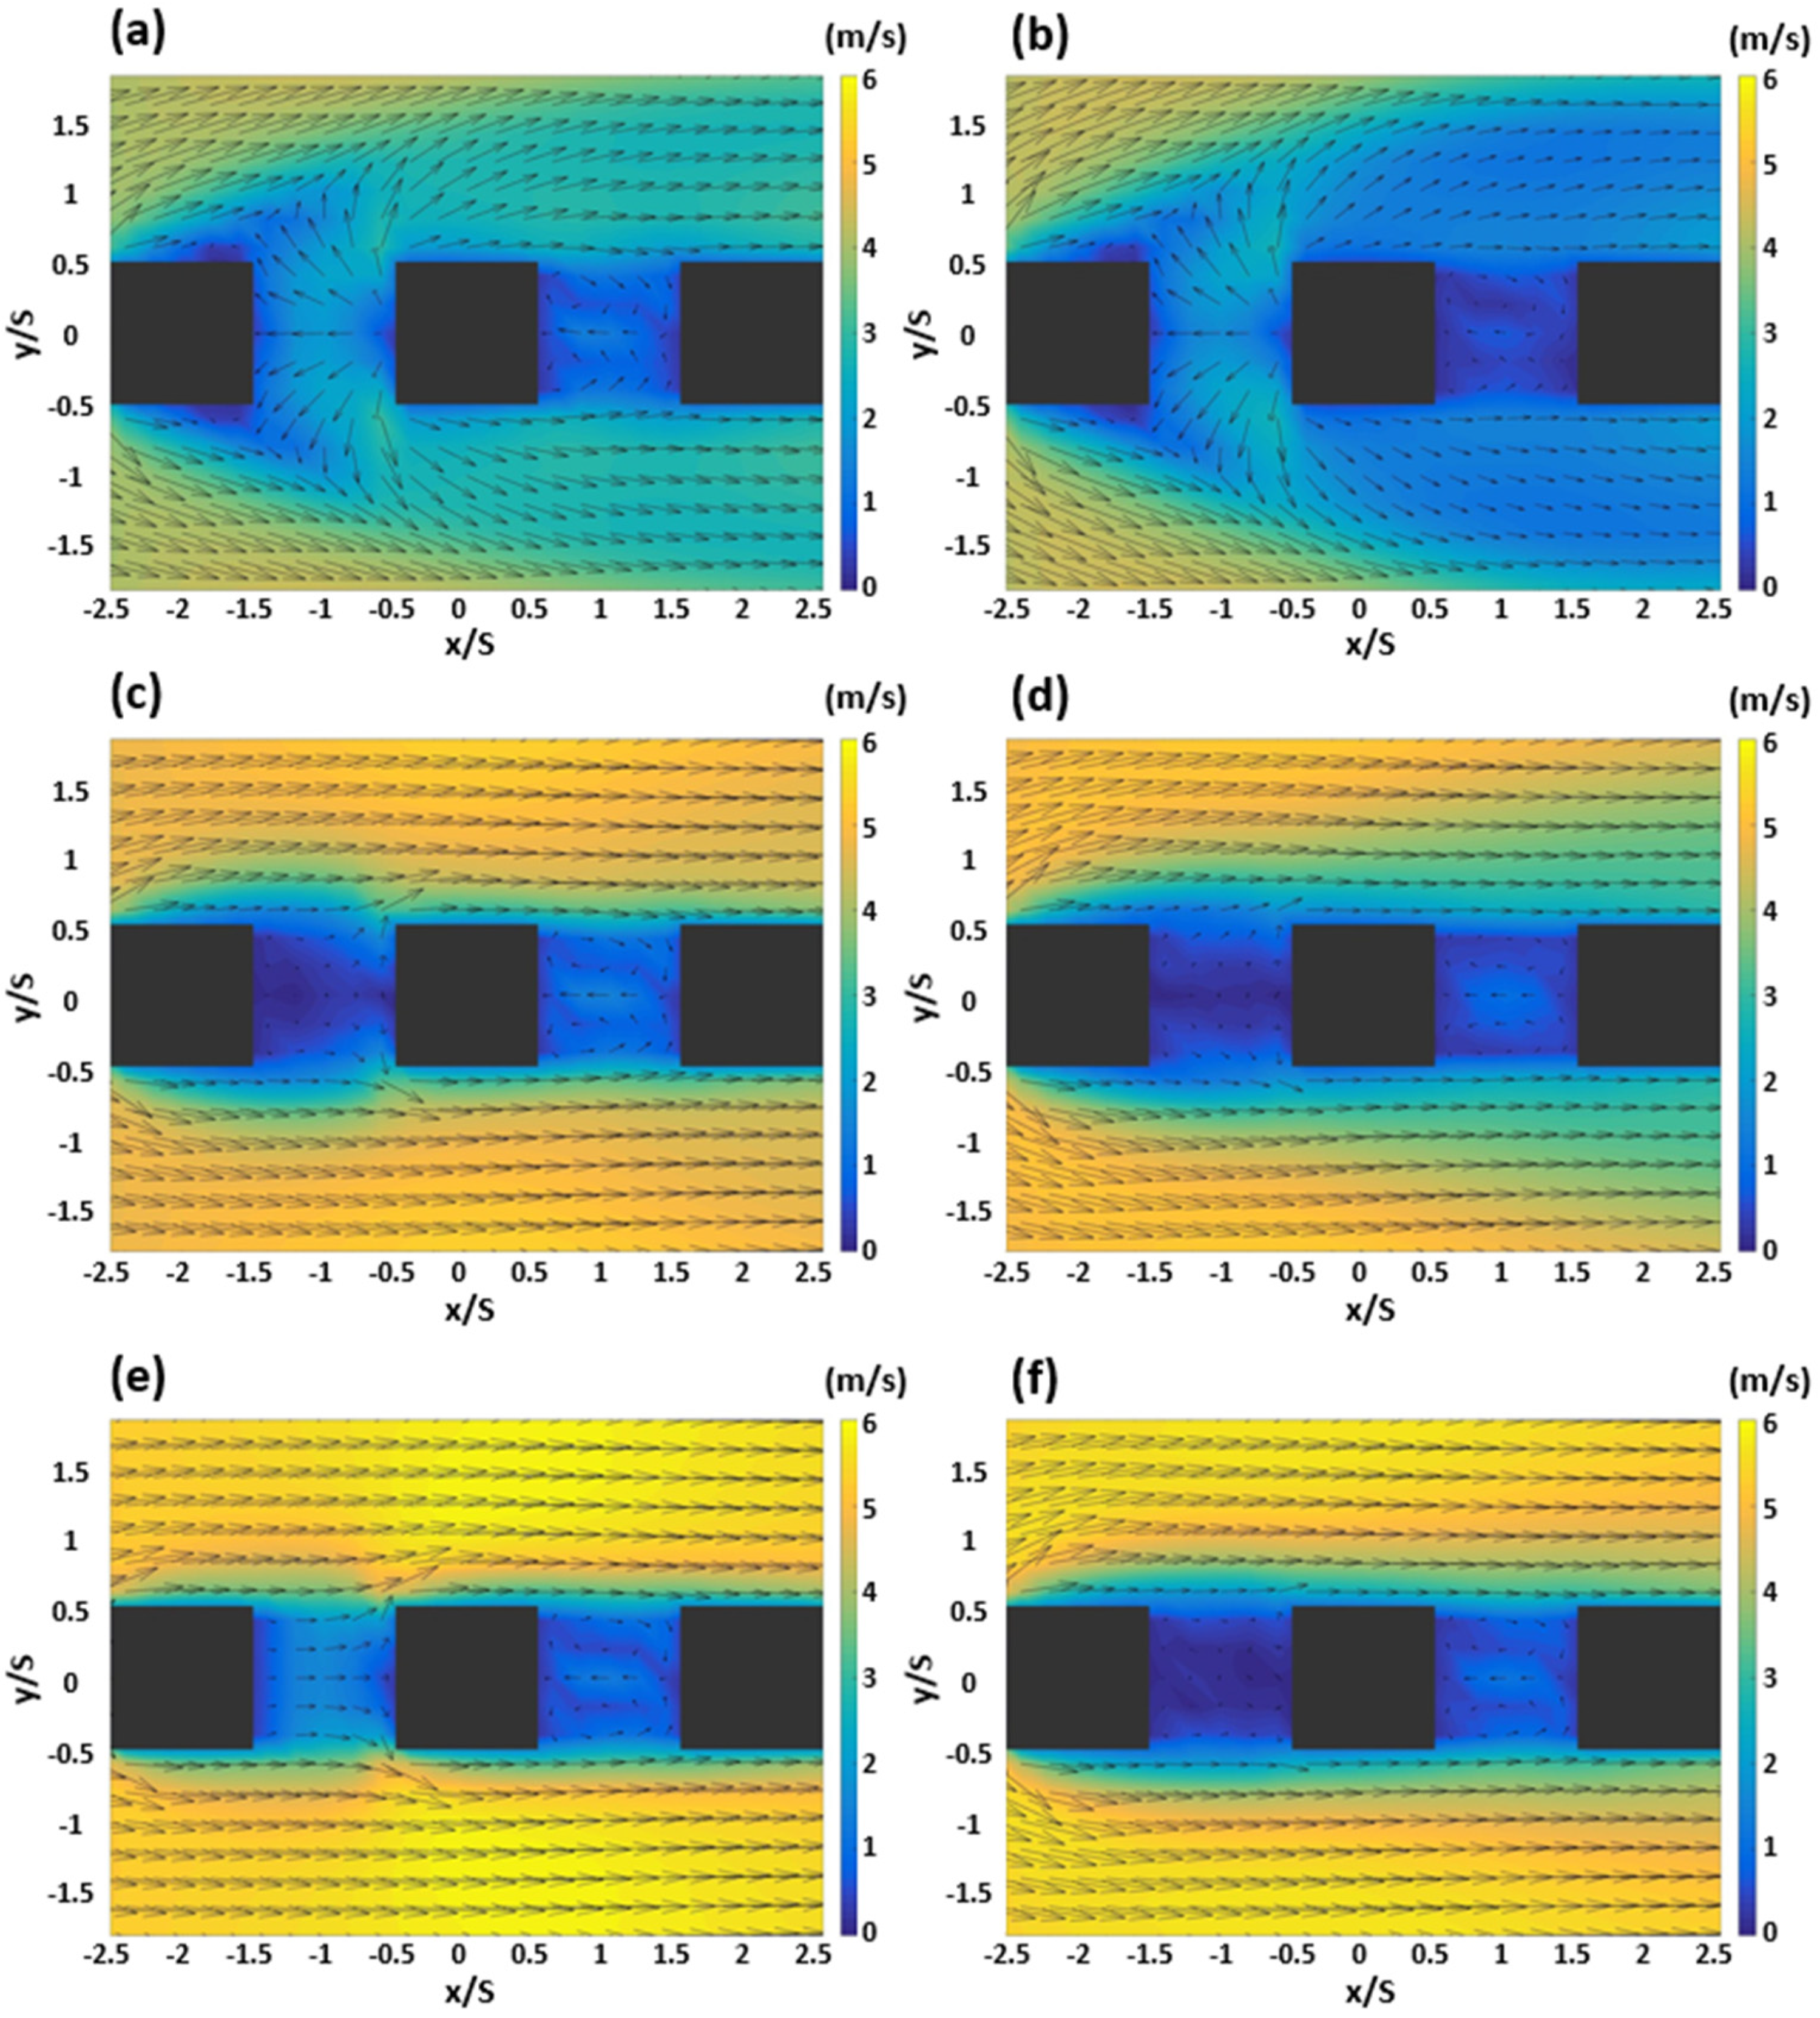
3.1. Horizontal Wind Field and Wind Speed
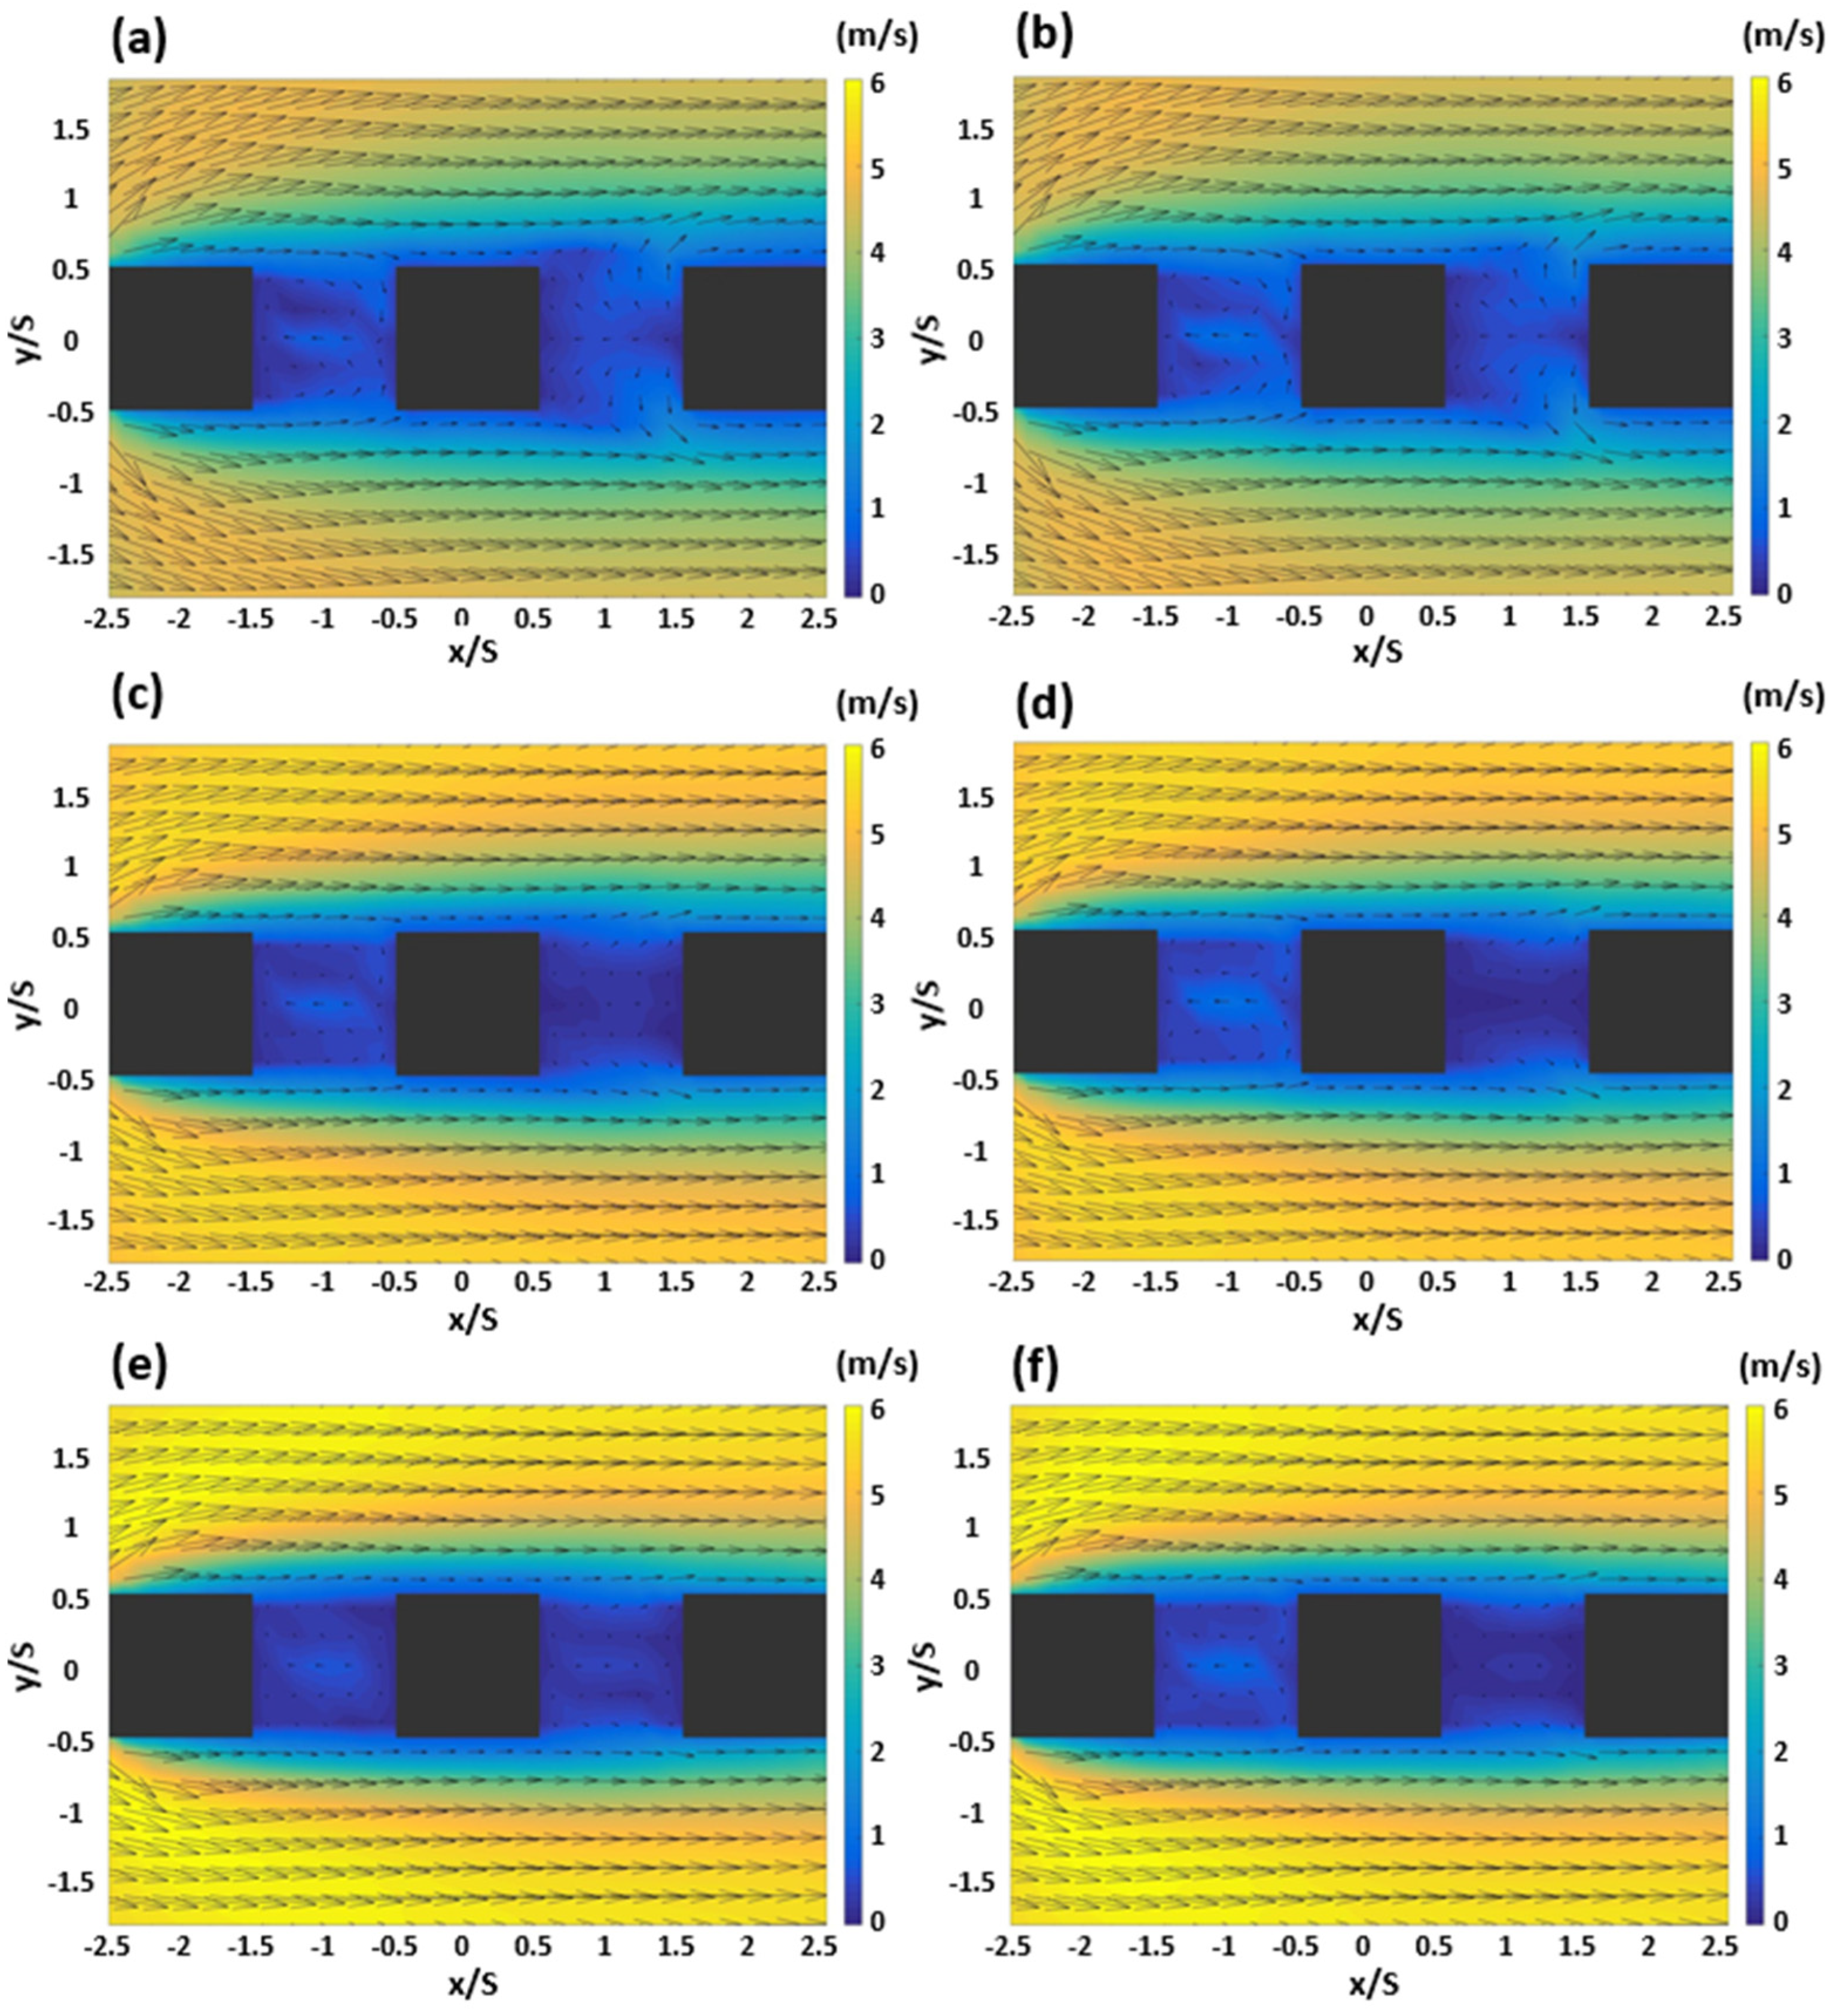
Figure 3 shows the wind field and horizontal wind velocity in the step-up to step-down canyons (Case 1) according to the conditions suggested in the research method. The left panel shows the results in the SCs (z/S = 1.0) and the right panel shows the results in the DCs (z/S = 2.0) under the same conditions. First, in the SCs, the winds bounced off the relatively high-rise Bc building at the z/S = 0.2 point of the first canyon towards the Bu building. Some of these winds escaped to the side of the Bc building and flew into the second canyon, forming a symmetrical portal vortex within the canyon. At z/S = 0.6, the wind velocity in the first canyon was weakened compared to that at z/S = 0.2, and the wind velocity field from the Bu building to the Bc building appeared at the point y/S = 0. In the second canyon, the turning radius of the symmetrical vortex became slightly more pronounced than at the z/S = 0.2 point. In the first canyon at z/S = 1.0, the movement of the wind field confirmed at z/S = 0.6 became stronger depending on the direction of the inflow passing through the roof area. In the second canyon, the shape of the portal vortex was similar to that generated at z/S = 0.2 and 0.6, with little difference in wind velocity. In the DCs, the overall pattern of the lower part was similar to that of the SC, but the wind velocity was relatively weak in the y-axis side area of the Bc building and the second canyon. A similar pattern was also observed at z/S = 0.6 and 1.0. While the wind velocity and wind field at all points were generally similar, the wind velocity and horizontal flow of the wind field were relatively weakened at z/S = 1.0 in the first canyon. The vertical range of the blocking area seemed to increase due to the rise in the height of the Bu and Bd buildings, thereby weakening the surrounding wind velocity. In particular, the SC z/S = 1.0 was greatly affected by the inflow of the roof area, but in the DC, the flow and wind velocity inside the canyon were weakened by various conditions around the canyon.
3.2. Vertical Wind Field and Velocity Component
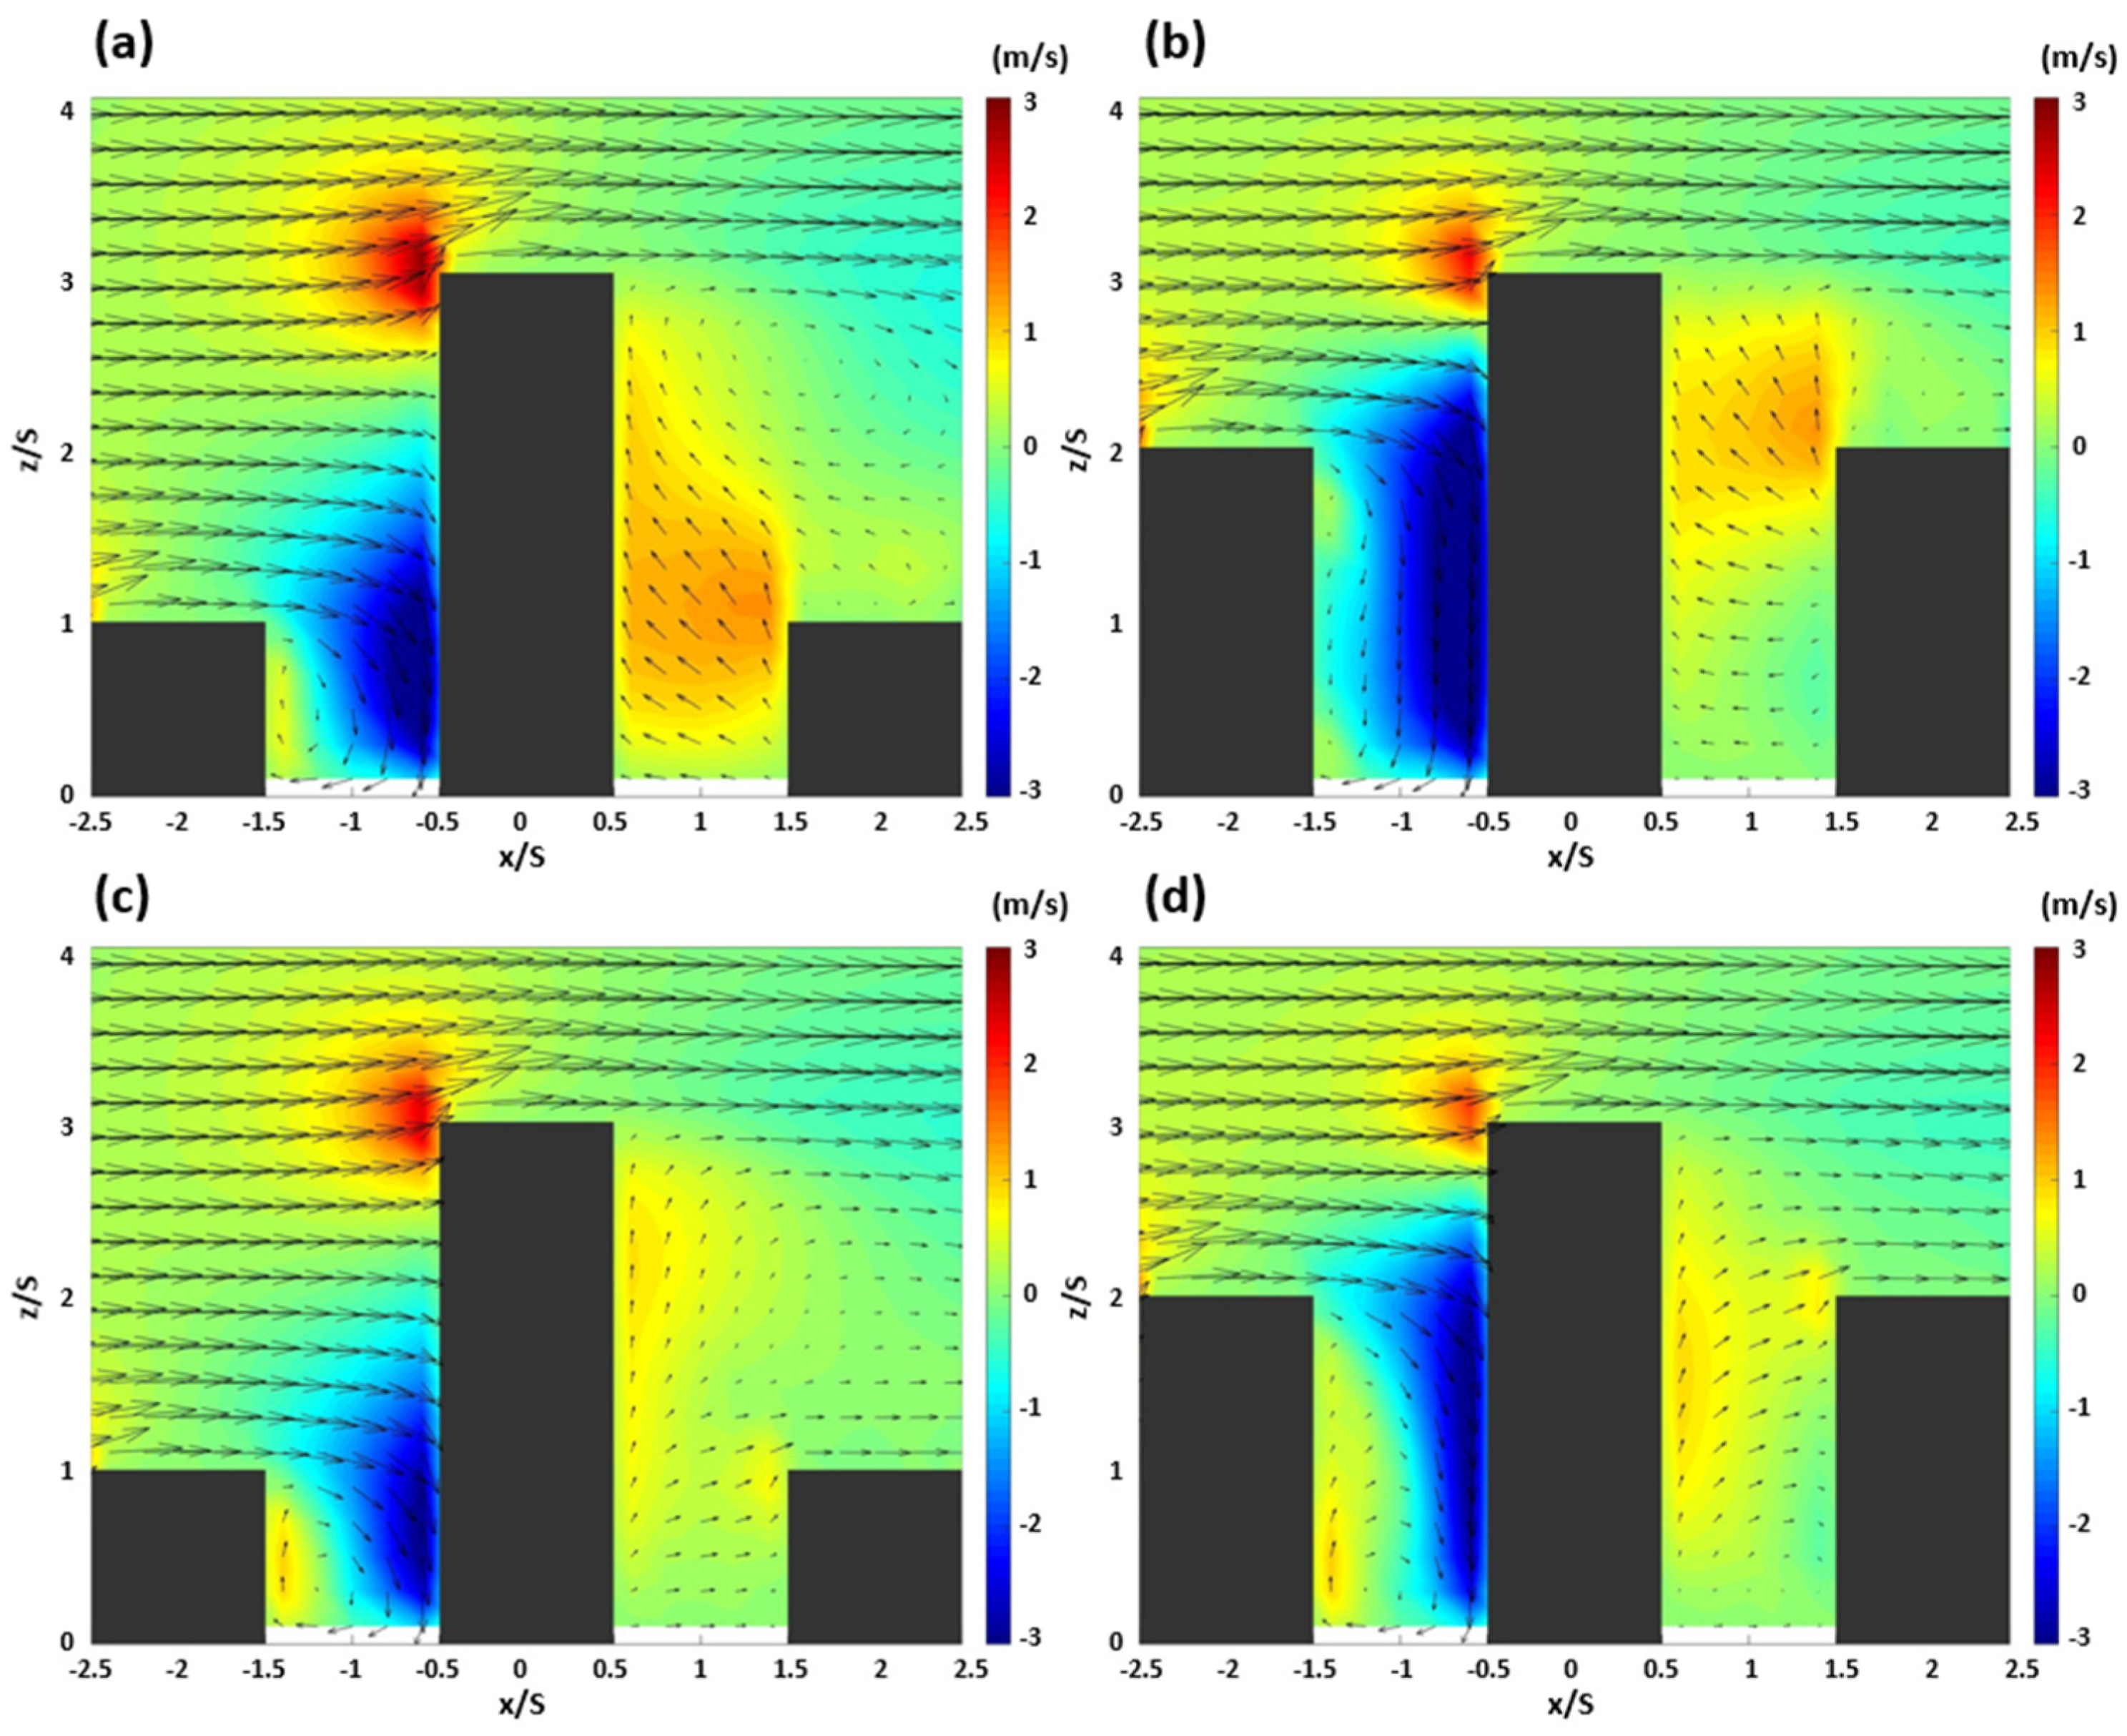
Figure 4 shows the wind field and vertical velocity components (w) at the center and sides of the urban canyon in the x-z section. In the SC, a vertical vortex was created inside the canyon by colliding with the Bc building in the first canyon to form a strong downdraft, and in the upper part, a strong updraft was observed over the roof area of the Bc building. In the side section, the downdraft area inside the canyon was reduced compared to that in the central section, but the updraft generated at the side of the Bu building was relatively strengthened [16,25,26]. In the second canyon, an updraft from the Bd building to the Bc building appeared, and a large-area vortex was formed at the top of the canyon. In the side section, an updraft occurred in the same way as the vertical flow in the central section but, on the x-axis, a wind field from the building Bc towards the building Bd was observed, unlike that in the central section [26,28].
In the central section of the DC, formed as the variable building height increased, the downdraft in the first building canyon became stronger than that in the SC. Due to the expansion of the downdraft area, the flow was separated into the upper and lower areas of the Bu building. Furthermore, in the side section, the flow separation of the area did not occur, and the flow pattern was similar to the side section in the SC. In the second canyon, where the horizontal flow was dominant at the bottom of the canyon, an updraft developed in the roof area of the Bd building, forming a vortex at the lower part of the side section. This suggested that the increased depth of the canyon under the step-up to step-down condition led to the separation of vertical flow and vortex, and in the step-down canyon observed in the second canyon, the wind flowing in from the side seemed to move to the center, colliding with the Bd building to create an updraft towards the Bc building [17,26,28].
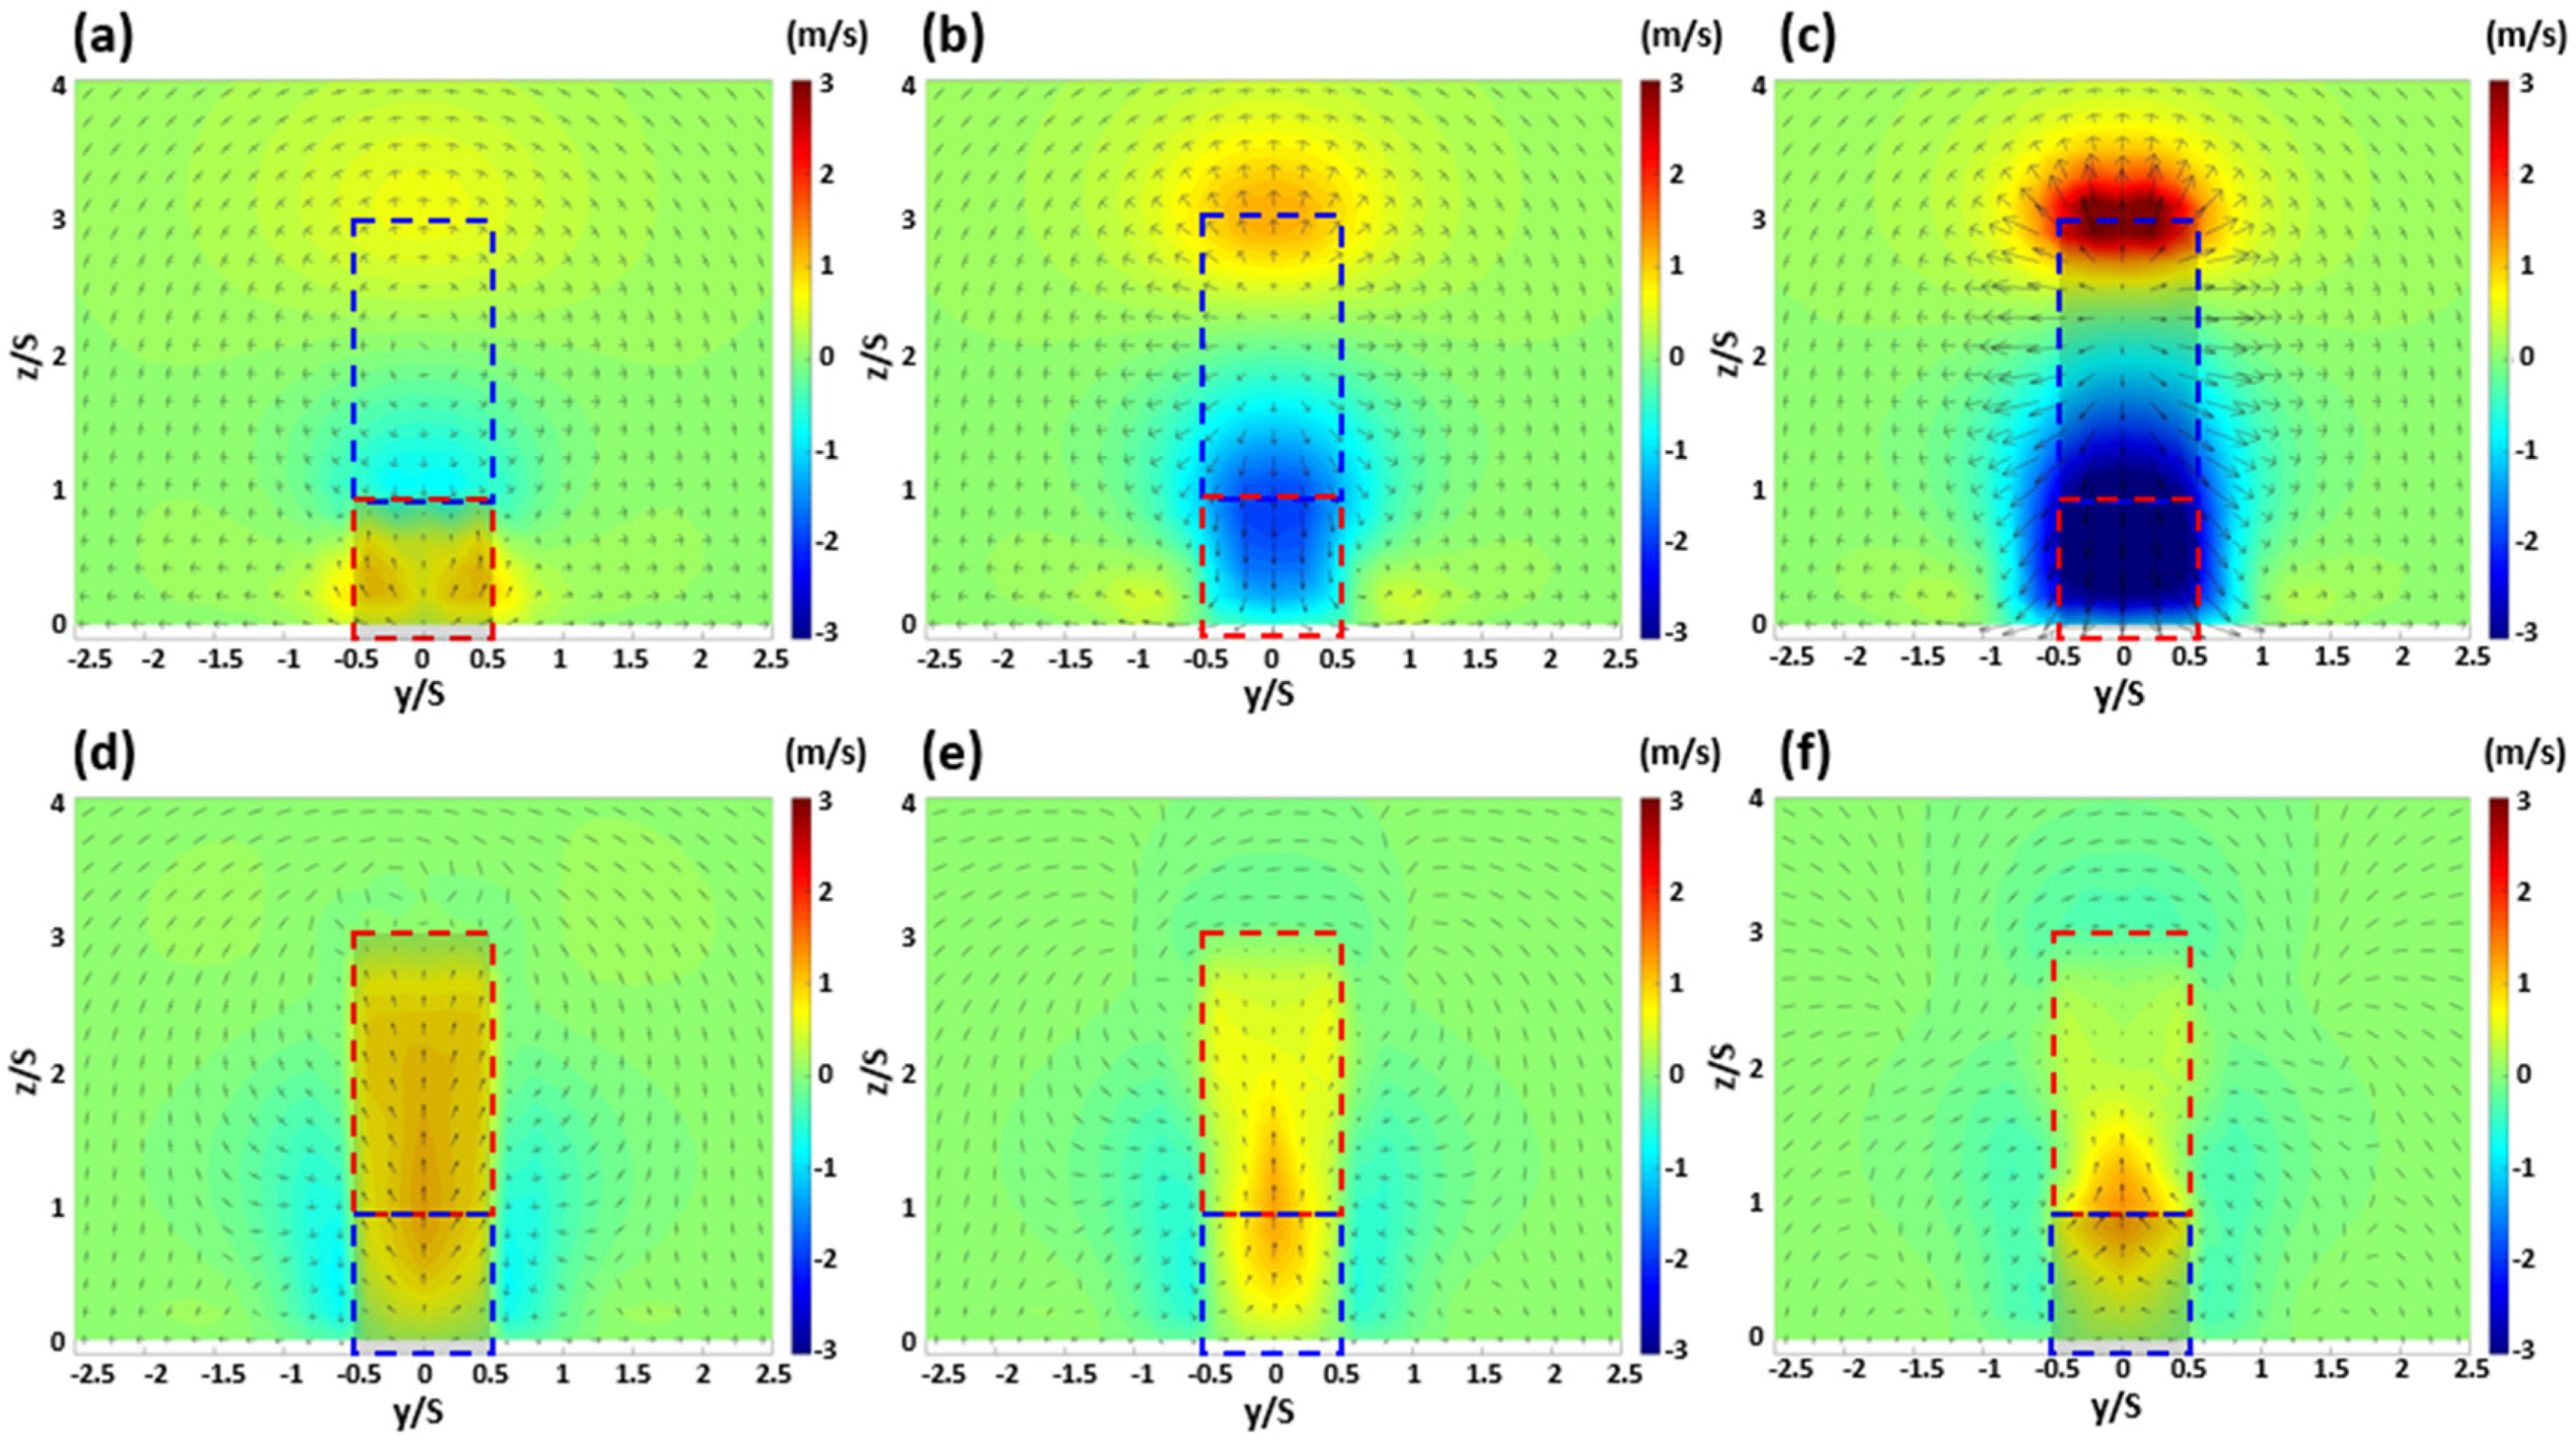
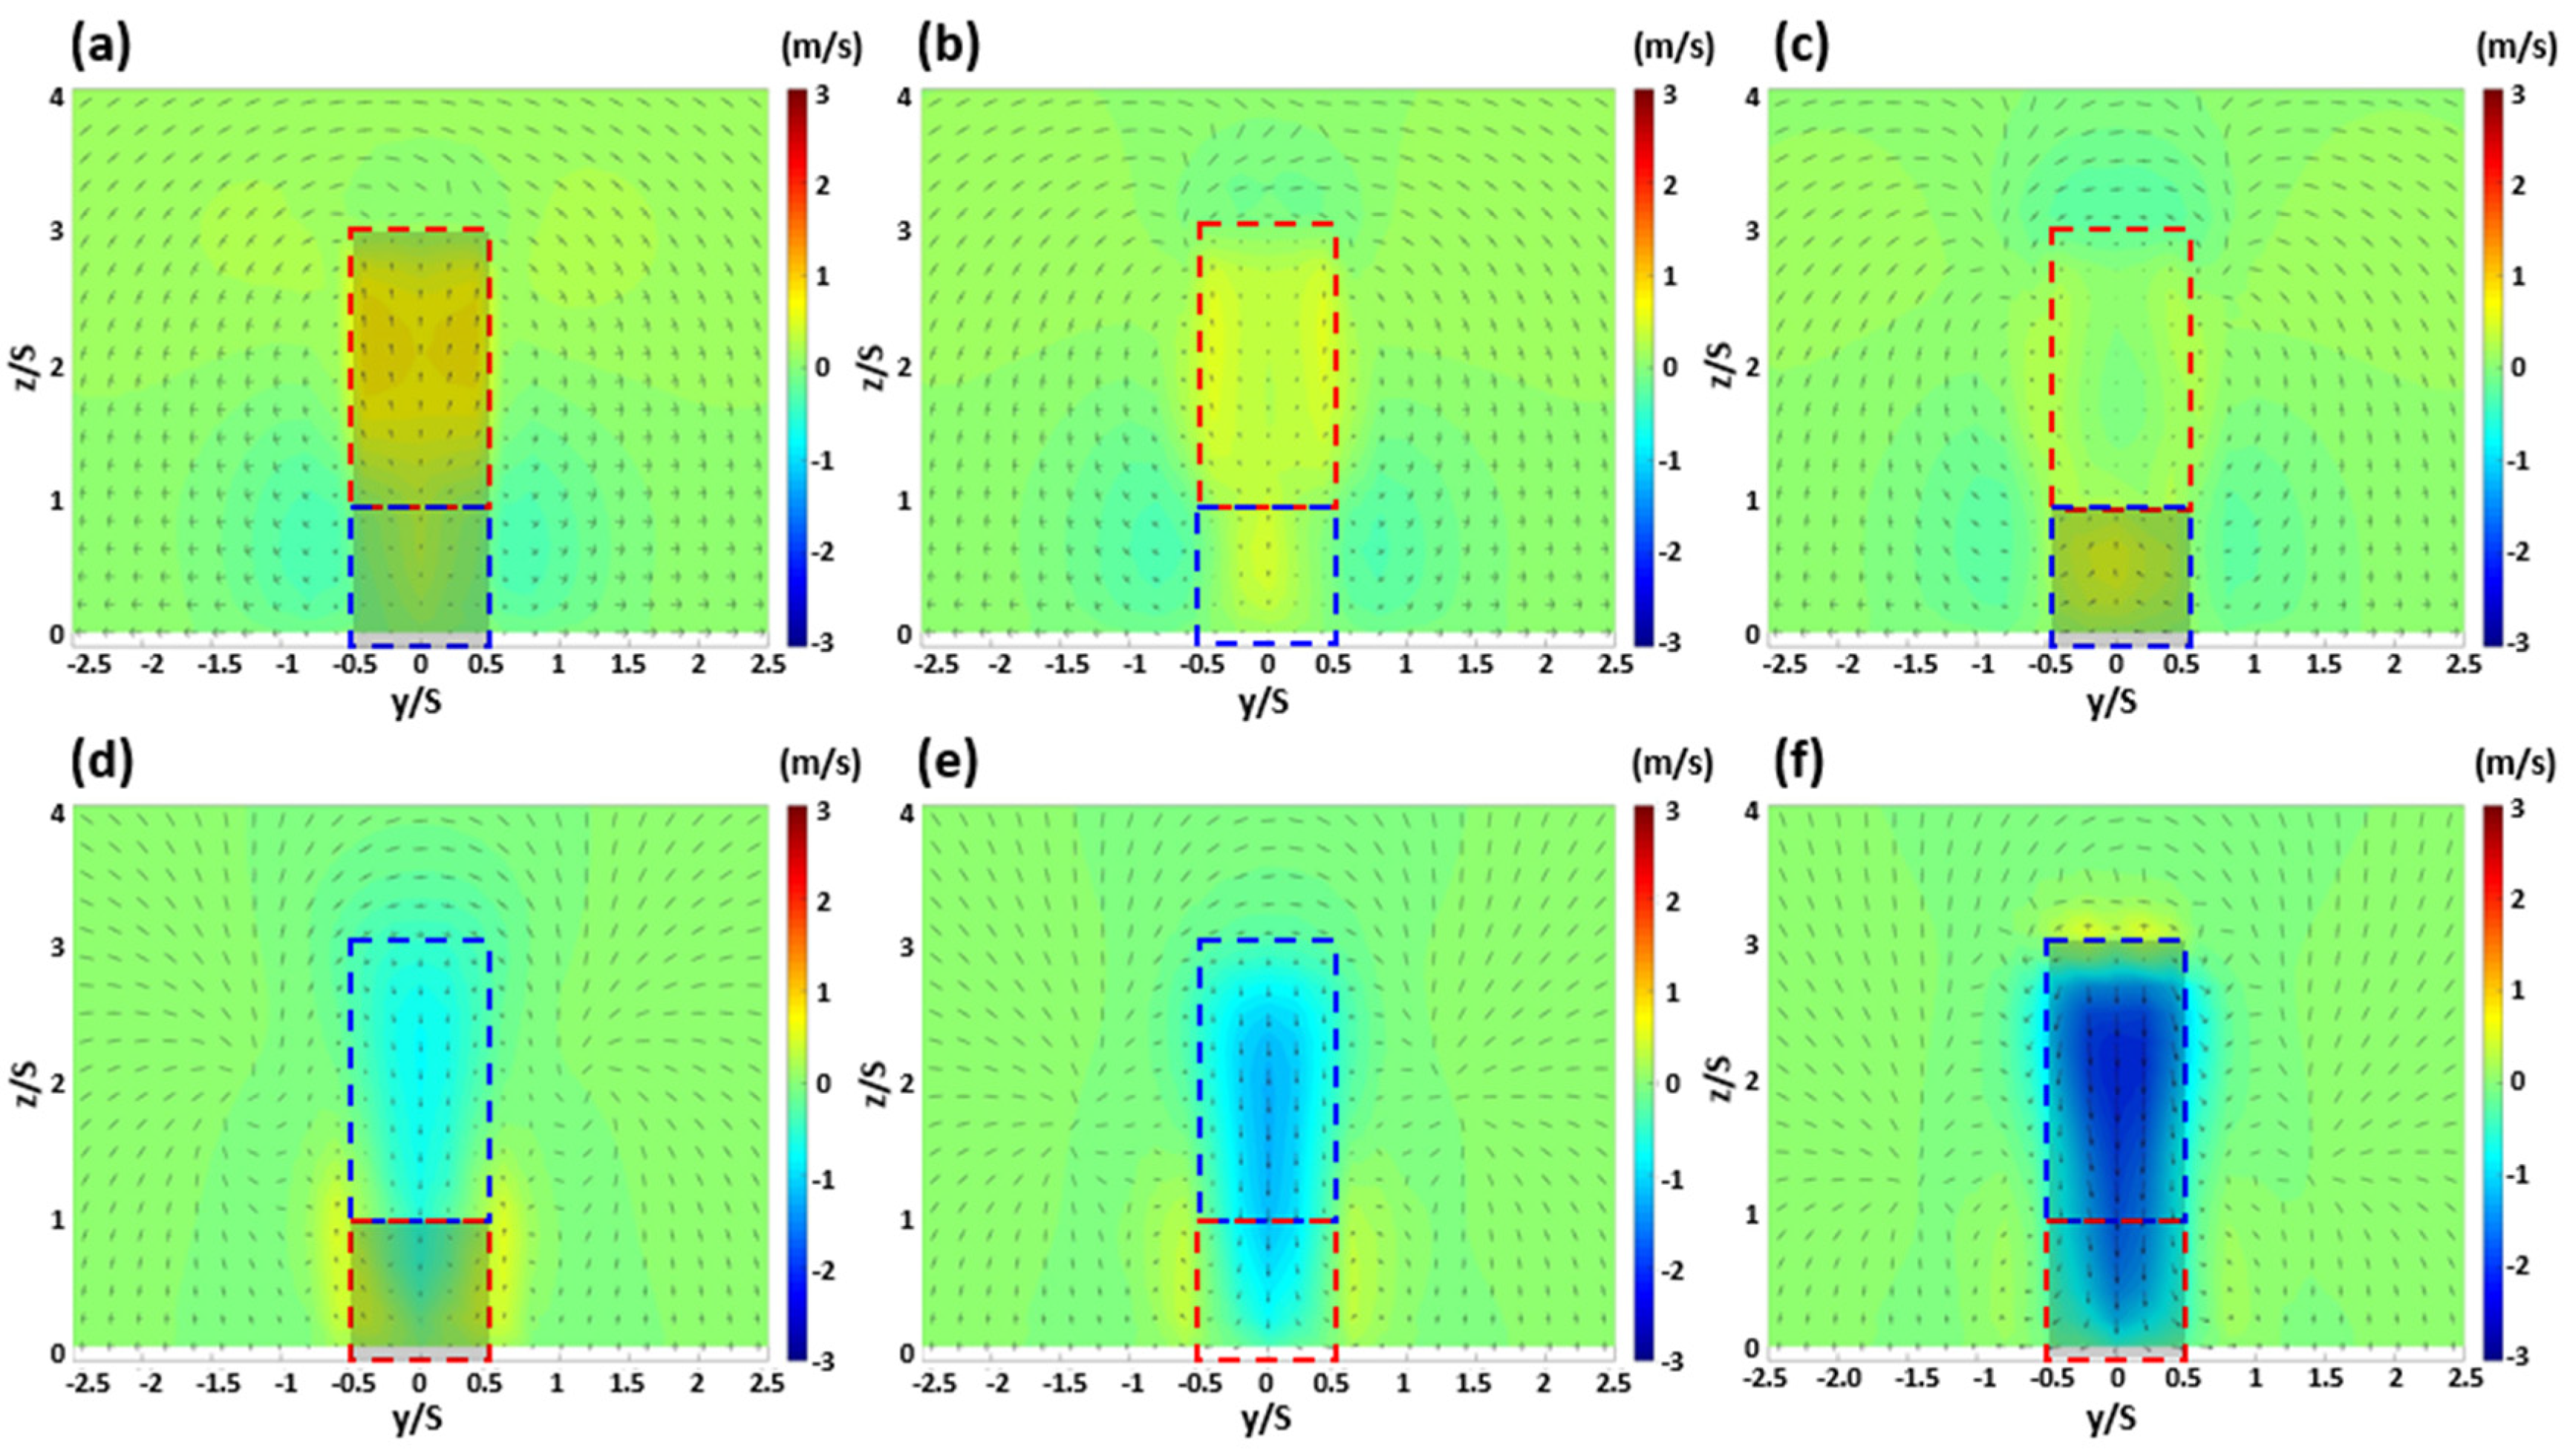
Figure 5 and Figure 6 show the wind field and vertical wind velocity component (w) in the y-z section for each canyon to examine the wind environment change on the y-axis side in SCs and DCs, respectively. In the first canyon of the SC, as seen in Figure 5a, a symmetrical updraft occurred based on the y/S = 0 point in the lower part on the side of the Bu building, with a downdraft generated in the upper part. In the area above the roof area of the Bu building, an upward airflow occurred in the upper part, with a downdraft in the lower part, exhibiting an overall pattern of flow separation. A downdraft was observed throughout the canyon in Figure 5b, depicting the center of the first canyon, with the flow of an updraft in the upper part and a downdraft in the lower part extending along the inflow direction at points above the roof area. In Figure 5c, depicting the side of the Bc building, the flow separation occurred due to collision with the Bc building, generating a strong updraft and downdraft at the top and bottom, respectively. As a result of the strengthening of the air flow, the expansion of the air flow moving out of the canyon area was observed. In the lower panel of Figure 5, depicting the second canyon, an updraft that went up the building surface of the Bc building was generated, and this updraft tended to flow toward the roof area of the Bd building as it approached the Bd building [28]. The portal vortex hitting the Bd building and heading towards the Bc building seemed to have been strengthened by the step-down canyon conditions, clearly generating an updraft [26,28].
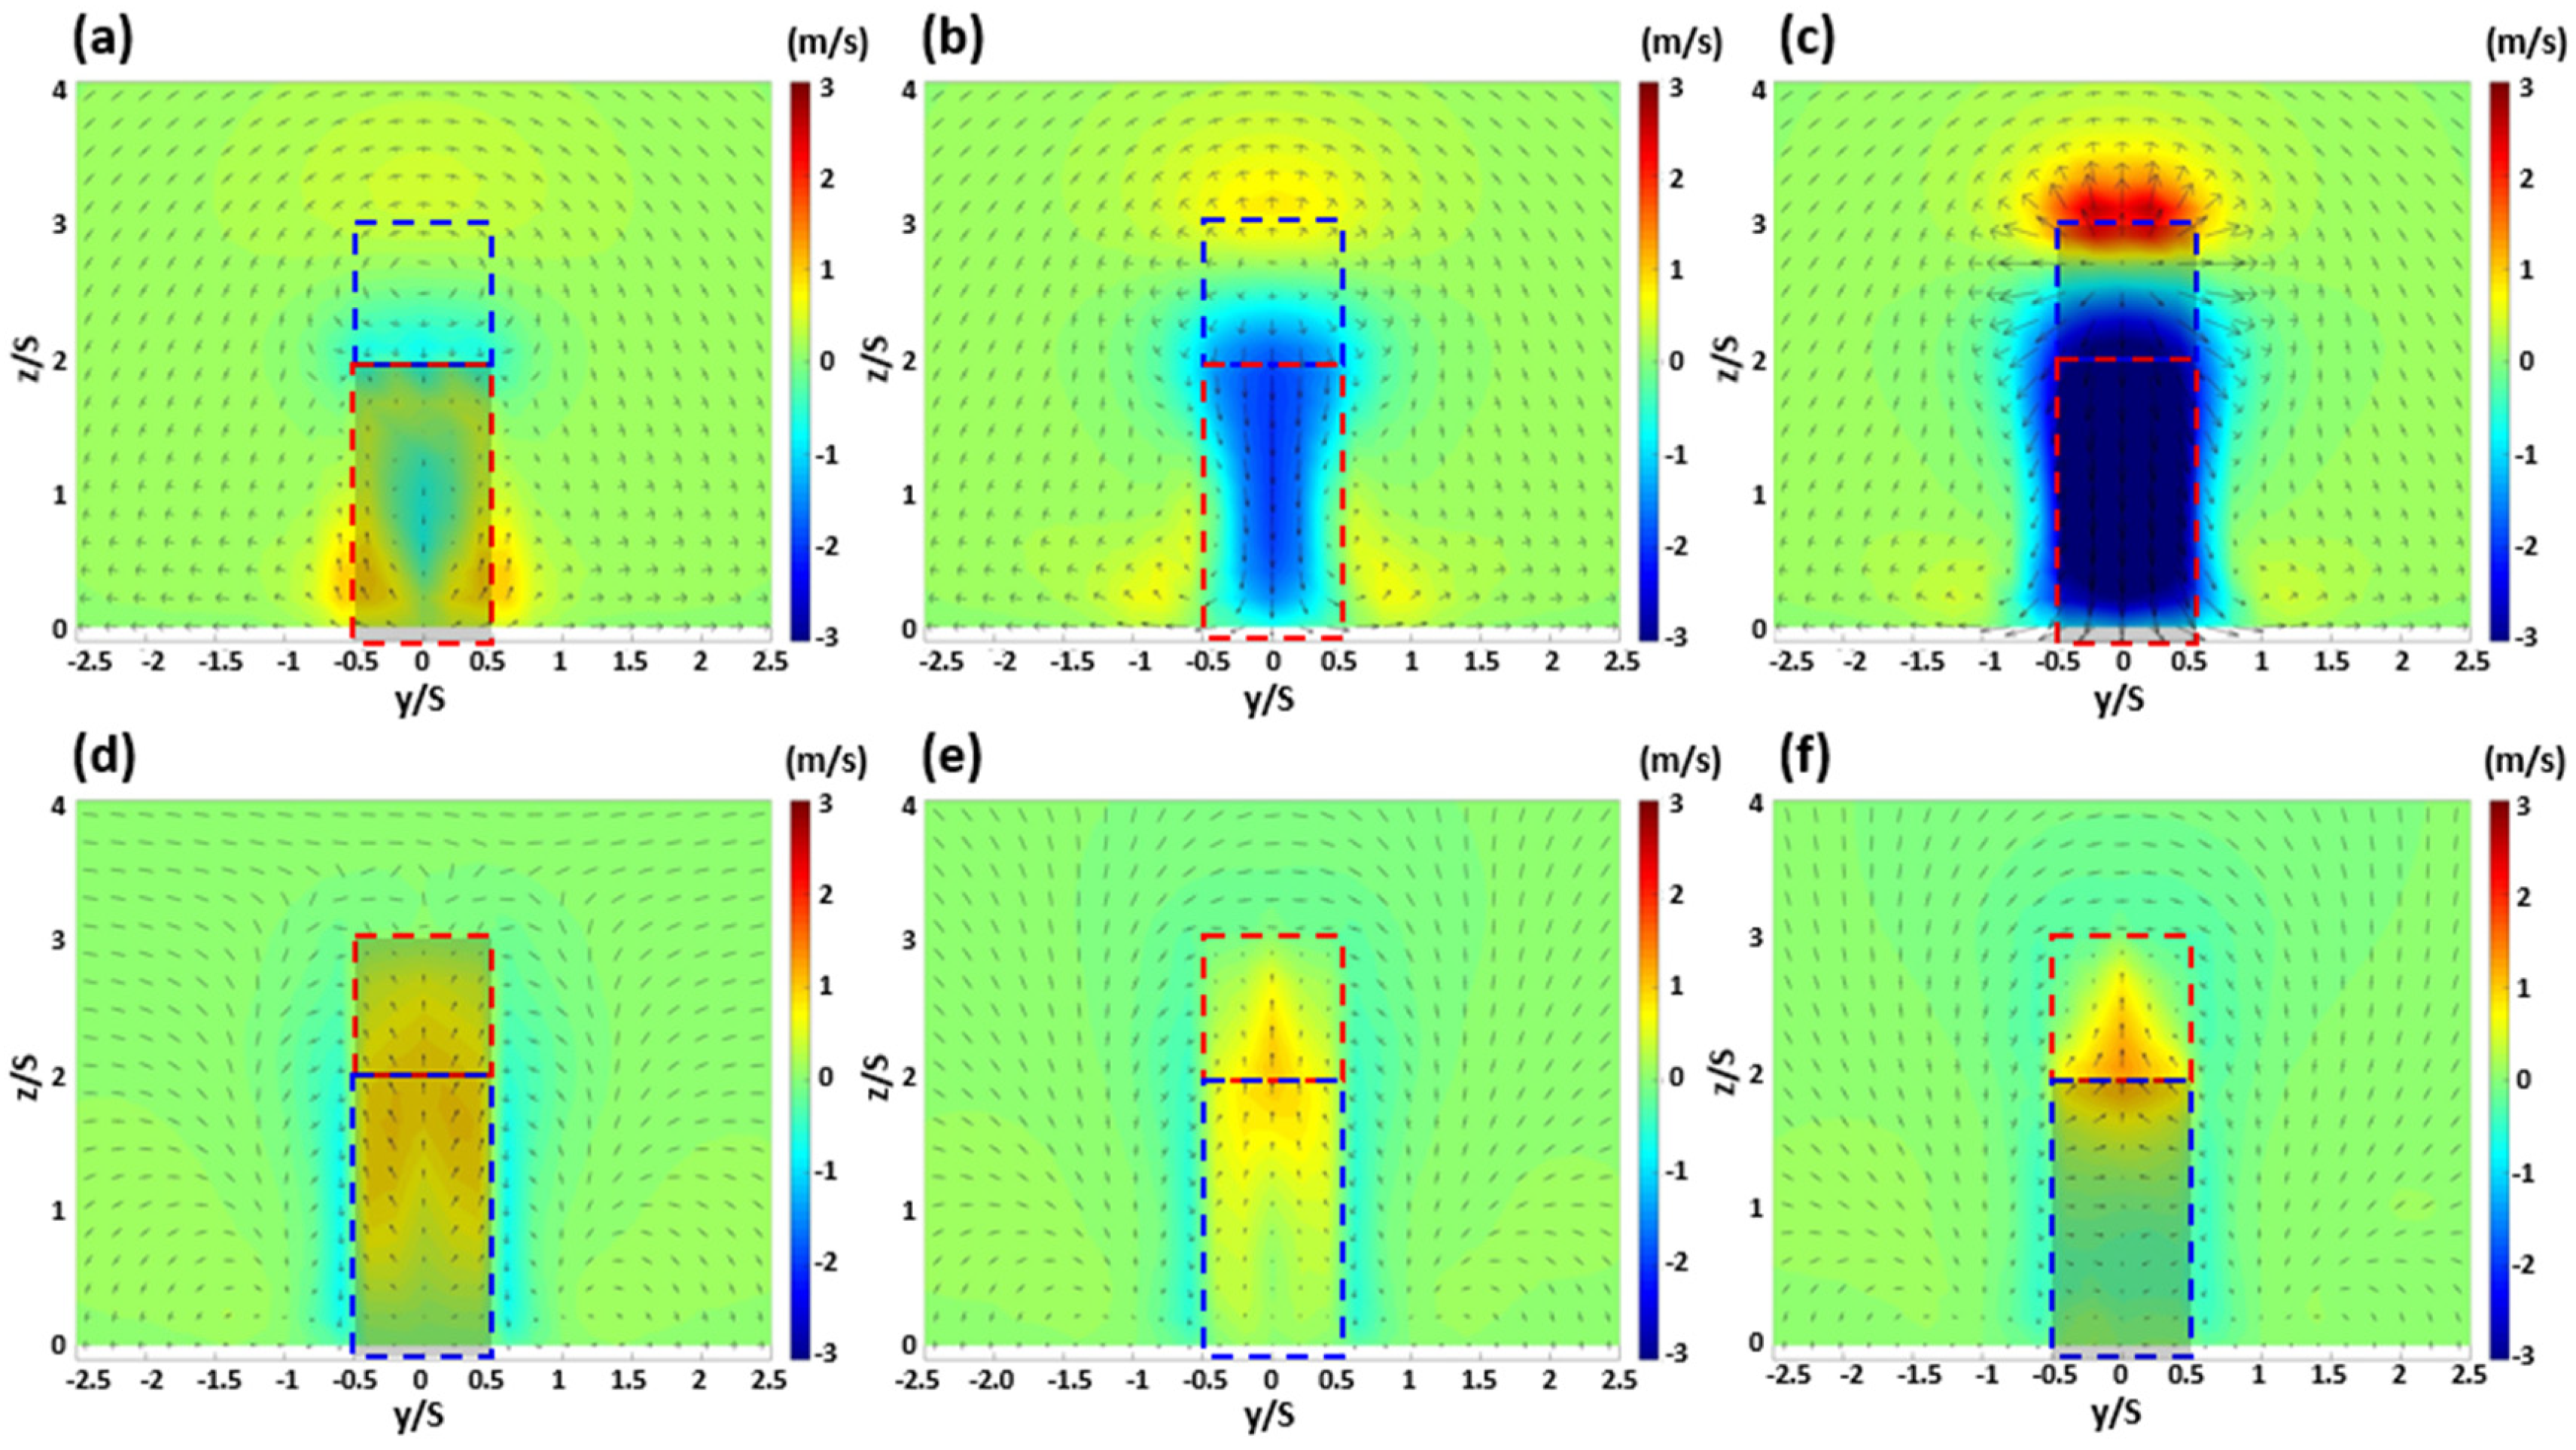
Figure 6 depicts the DC conditions. In Figure 6a, a symmetrical updraft can be observed from the lower part of the Bu building to the side and upper parts with y/S = 0 as the center, and a downdraft in the center. In Figure 6b, depicting the central area of the canyon, an overall downdraft can be observed, and in Figure 6c, a strong downdraft can be observed when the inflow collides with the Bc building and flows into the canyon. In the second canyon, a weak updraft occurred in the lower part on the side of the Bc building, as shown in Figure 6d, but a relatively strong updraft was observed towards the upper part. As shown in Figure 6e,f, an updraft developed around the roof area of the Bd building towards the Bd building. This showed a similar pattern to the SC observed earlier and, in the area below the middle part on the side of the Bd building, horizontal flow was more dominant than vertical flow.
4. Step-Down to Step-Up Canyons
4.1. Horizontal Wind Field and Wind Speed
Figure 7 shows the change in the wind field and wind velocity field under the step-down to step-up condition of Case 2 for shallow and deep canons. First, in the lower canyon of the first canyon, where z/S = 0.2, as shown in Figure 7a, a symmetrical vortex was created based on the y/S = 0 point. In the second canyon, the wind that collided with the Bd building and moved towards the BC building collided again with the BC building, radiating to the outside of the canyon. It flew in the inflow direction depending on the wind direction around the canyon. At z/S = 0.6, as shown in Figure 7c, the pattern was similar to that of z/S = 0.2 in both the first and second building canyons, but the wind velocity field was relatively weakened with a decrease in the wind field radiating outwards from the second canyon, compared to that from the lower part. At z/S = 1.0, of Figure 7e, the complete form of the symmetrical vortex that was created in the lower areas (z/S = 0.2 and 0.6) of the first canyon was lost, which appeared to have been caused by a decrease in the amount of wind flowing into the canyon, as the flow towards the outside of the canyon at those heights became relatively stronger. In the second canyon, the flow inside the canyon appeared similar to the wind field in the first canyon, as the mobility of the wind radiating out of the canyon was reduced compared to that in the lower areas.
In the DC under the same conditions, were z/S = 0.2, as shown in Figure 7b, the wind flowing into the first canyon was relatively more than that in the SC, thereby increasing the wind velocity slightly. This phenomenon was also observed at z/S = 0.6 (Figure 7d) and at z/S = 1.0 (Figure 7f). In the second canyon, SCs and DCs showed similar trends at all points. As in Case 2, under the step-down to step-up condition showing the isolated form of the building, the tendency of the wind field was maintained as the variable building height increased, but the strength of the wind velocity flowing into the first canyon slightly increased.
4.2. Vertical Wind Field and Velocity Component
Figure 8 shows the x-z section of the central section (y/S = 0) and the side sections (y/S = −0.3 and 0.3) of the vertical wind field, as well as the vertical wind velocity components for Case 2. In Case 2, the Bc building was isolated and a roof-top canyon was additionally formed in the roof-top area of the Bc building. In the SC, the wind flowing in from the first canyon of the central section collided with the building Bc and was directed towards the building Bu. As the wind rose along the Bu building, the updraft was dominant in the canyon overall. Considering the horizontal flow on the side of the Bu building and the dominant upward airflow on the side of the Bc building in the canyon on the side section shown in Figure 8c, the updraft was strengthened as the winds gathered towards the center. On the contrary, in the central section of the second canyon, the downdraft appeared to be dominant. The wind that passed over the Bu building was not affected by the low Bc building; it moved towards the Bd building and collided with it, causing a blocking phenomenon as well as a strong downdraft. Due to this phenomenon, updrafts and downdrafts occurred in the side of the second canyon in the direction of the Bc and Bd buildings, respectively. As the characteristics of the first and second canyons were reflected in the roof-top canyon, a vertical vortex as wide as the canyon was formed. In particular, the vertical vortex generated in the roof-top canyon appeared to be similar to the characteristics generated in the general urban canyon conditions [15,18,28]. In the DC shown in Figure 8b,d, the features identified in the SC were found to expand as the depth of the canyon increased. While the rise in the height of the Bc building was shown to reduce the area of the roof-top canyon, thereby reducing the vertical range of the vertical vortex, the central axis of the vortex was found to remain unchanged.
Figure 9 and Figure 10 show the y-z section of each canyon under the Case 2 condition. In the first canyon, under the SC condition shown in the upper panel of Figure 9, an updraft occurred on the side of the Bu building; the updraft, in particular, was relatively strong at the upper part of the building wall. At the midpoint, the updraft was relatively weak. On the side of the Bc building, the wind converged to the y/S = 0 point to generate an updraft, and the vertical flow in the roof area was weakened, resulting in the horizontal flow. In the second canyon shown in the lower panel, an updraft occurred on both sides of the wall of the Bc building, and a downdraft was observed at the center. A downdraft generally developed at the midpoint, and the side of the Bd building was dominated by a relatively strong downdraft, except for an updraft at the upper part [26,35].
Under the DC condition shown in Figure 10, updrafts developed on the sides of the Bu and Bc buildings depending on the wall height in the first canyon shown in the upper panel. In particular, the wind diverged to the outside of the canyon at the sides of the Bu building, and the wind field converging towards the building at the Bc building was observed. In the second canyon shown in the lower panel, all aspects were similar to the SC in Case 2 except for the relatively stronger downdraft. When evaluated comprehensively, the isolation of the low-rise building from the high-rise building in a building group led to an updraft in the first canyon. In the second canyon, a downdraft was dominantly developed by the wind that passed directly over the isolated building from the high-rise building on the upwind side. Furthermore, Figure 9 and Figure 10, which show the wall convergence and divergence of the updraft in the building canyon, support the explanation of the updraft in the step-down canyon condition along with Figure 6 and Figure 7.
Overall, the step-down to step-up condition included all the features shown in the step-up to step-down condition, but the characteristics of the wind environment appearing under certain conditions were weakened in the simulation under the influence of the roof-top canyon formed due to the isolation of the Bc building.
5. Wind Velocity Component in Multiple Canyons
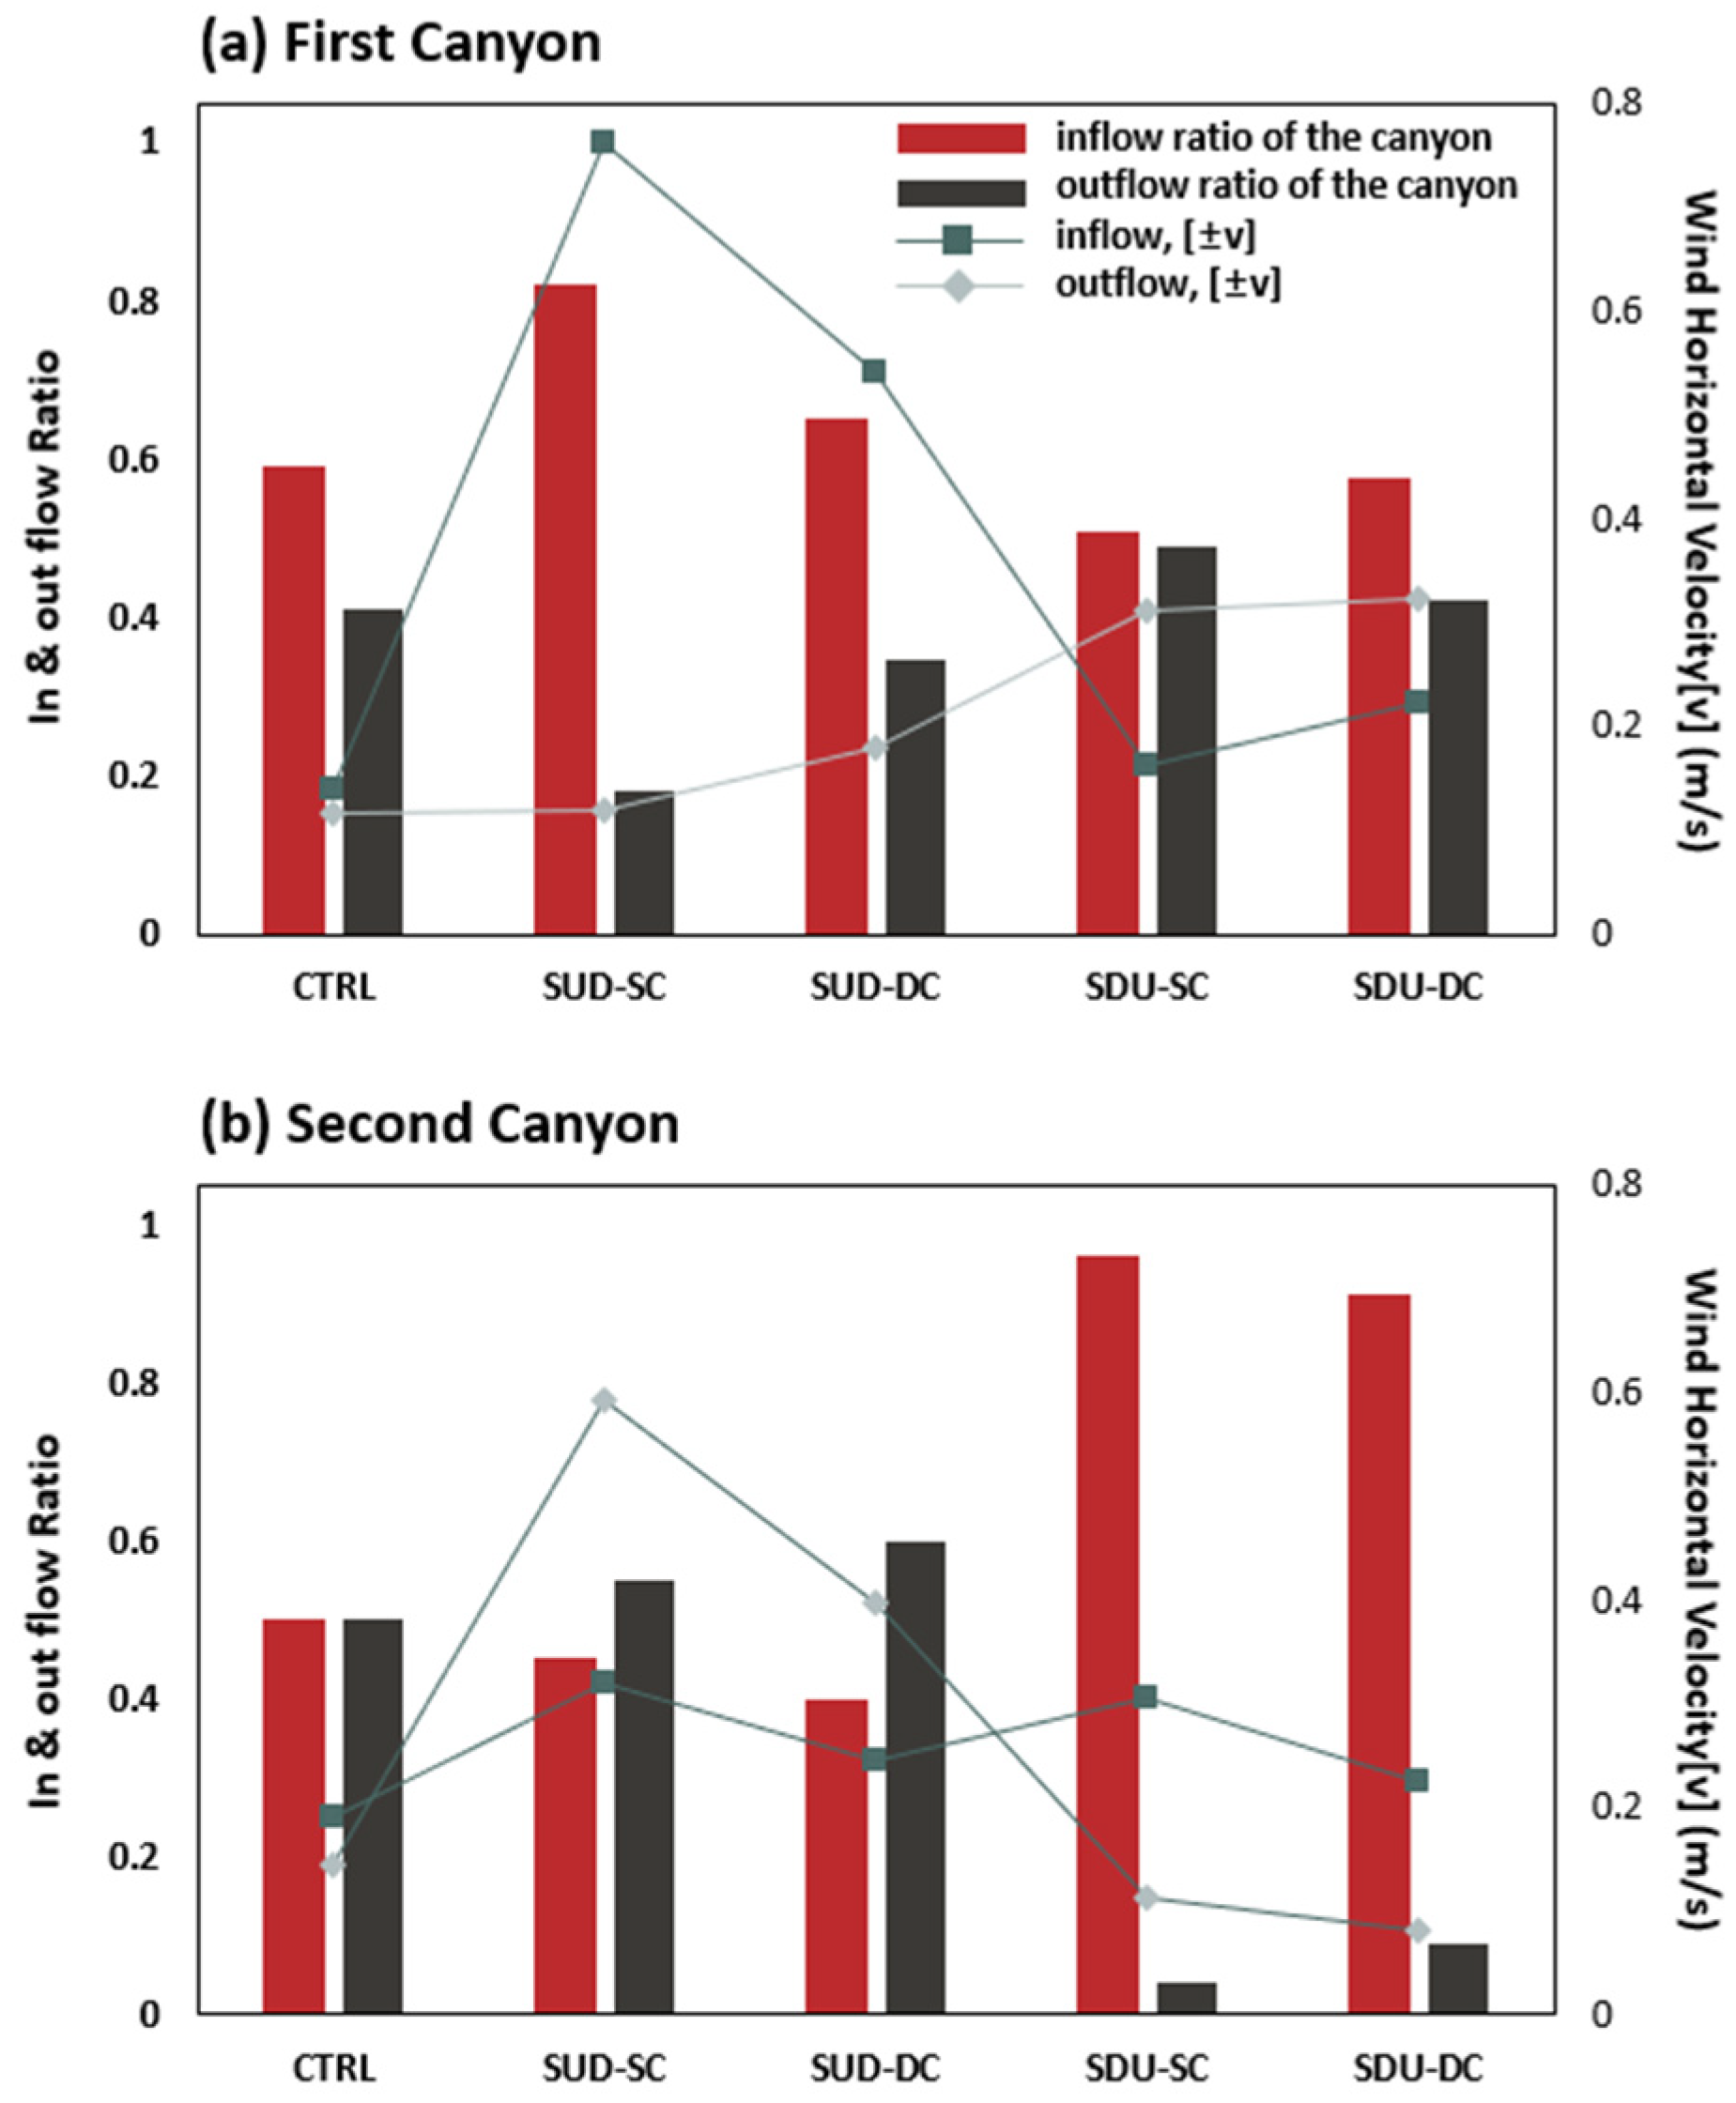
While the increase in the height of the Bc building was shown to reduce the area of the roof-top canyon, thereby reducing the vertical range of the vertical vortex, the central axis of the vortex remained unchanged. Figure 11 shows the ratio of inflow (convergence) and outflow (divergence) winds (maximum = 1.0) and the strength of the horizontal wind velocity components in the canyon as absolute values according to each condition. In the first canyon, the ratio of the inflow wind into the canyon was higher than that of the outflow wind under all conditions, and as for the horizontal velocity components (v), there was no significant difference in the control run (CTRL). However, in Case 1 (Step-up to down, SUD), the inflow wind velocity was greater than the outflow wind velocity in the SC and DC. In addition, in the SC and DC of Case 2 (Step-down to up, SDU), the outflow wind velocity was higher than the inflow wind velocity, and the ratio of inflow and outflow—as well as the horizontal velocity components (v)—showed a large difference under the Case 1 condition compared to the Case 2 condition. In the control run for the second canyon, the wind was stabilized, and the ratio of inflow and outflow and the difference in wind velocity components were not large. Unlike in the first canyon, the outflow ratio of the canyon wind was larger under the Case 1 condition. Considering that the ratio difference was not large in the first canyon, the ratio of the inflow wind was significantly higher under the Case 2 condition. Under all conditions except the control run condition, the trend of the wind velocity components was the opposite to that of the first canyon in terms of their magnitude.
In Figure 12, the ratio of the updraft and downdraft generated inside the canyon and the strength of the vertical wind velocity components are expressed based on [wind vertical velocity = 0 m/s] in terms of direction (+ and −) and magnitude. In Case 1 of the first canyon, the ratio of downdraft was dominant, whereas the ratio of updraft was found to be dominant in Case 2. Overall, the size of the updraft was similar, and it was confirmed that a strong downdraft occurred in Case 1 and a weak downdraft or no draft was formed in Case 2. In the second canyon, the updraft was dominant in Case 1 and the downdraft was dominant in Case 2, and the updrafts were similar under all conditions. In Case 1, a weak downdraft or no draft appeared, and in Case 2 the magnitude of the downdraft was relatively large.
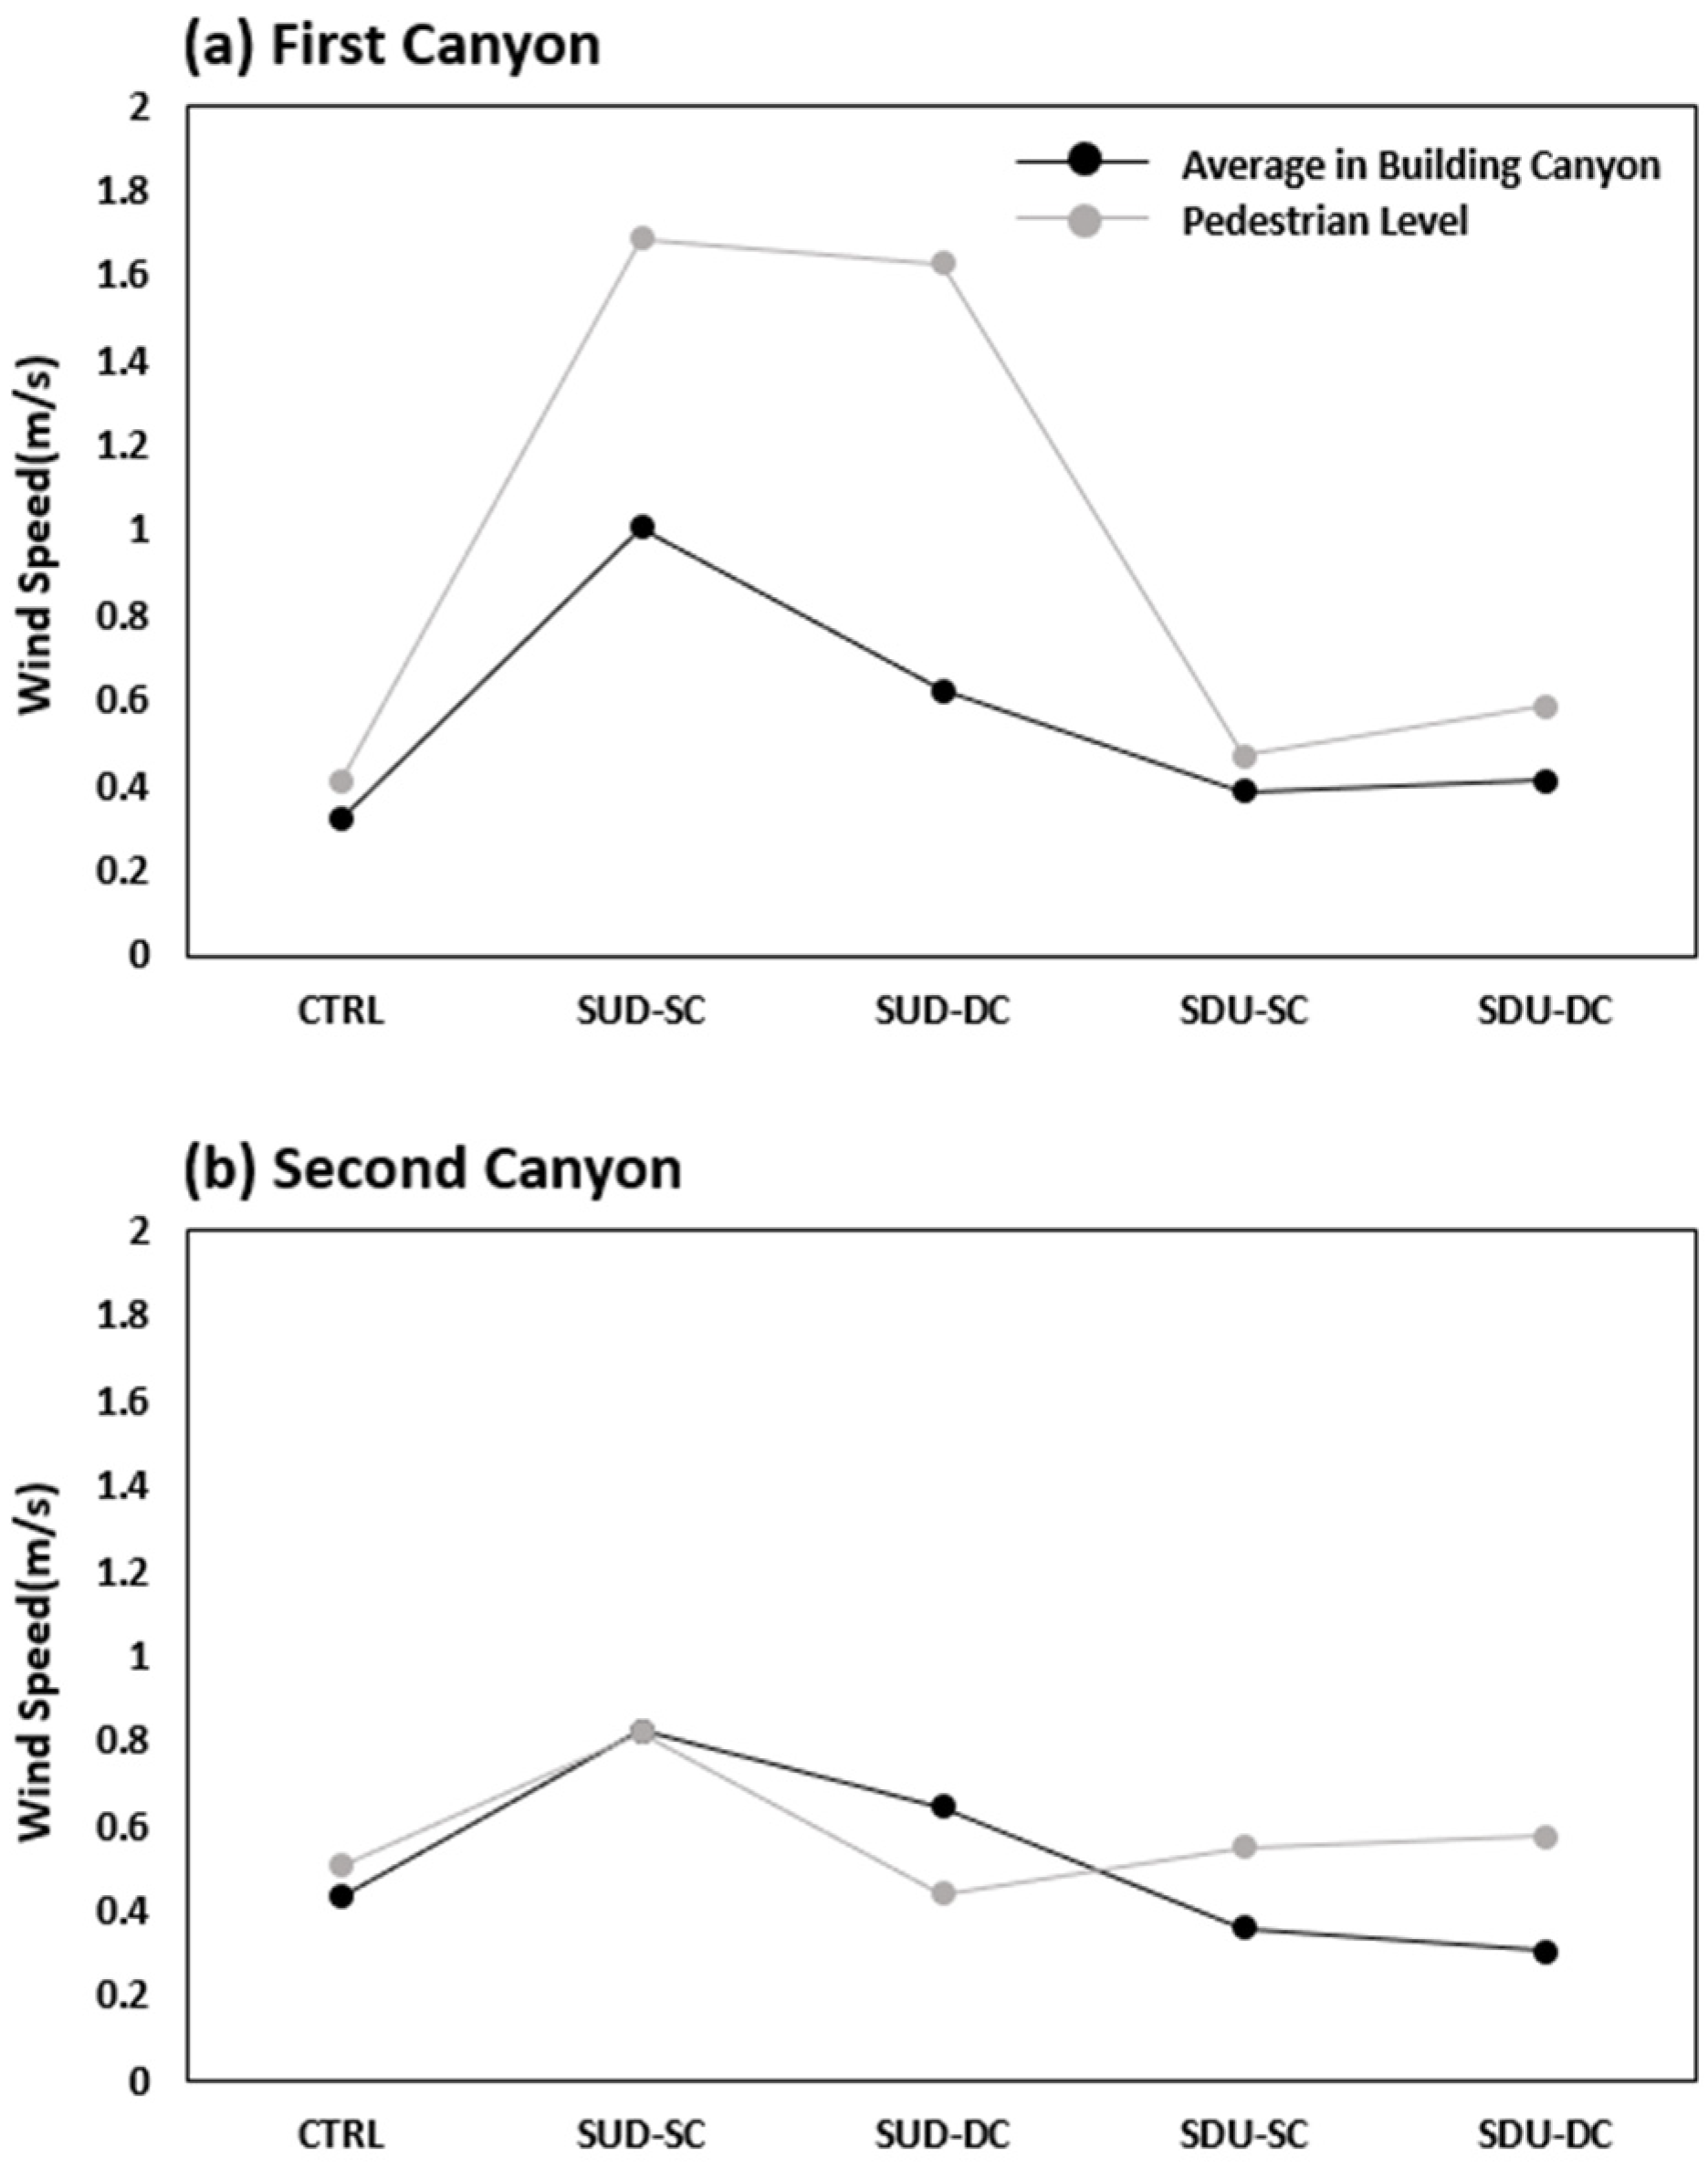
To compare and analyze the overall average wind velocity formed in the urban canyon and the wind velocity change at the pedestrian height (about 2 m), the values according to each condition were expressed as a graph, as shown in Figure 13. In all cases of the first canyon, the wind velocity at the pedestrian level was higher than the average wind velocity in the canyon, with no significant difference between the average wind velocity in the canyon and the wind velocity at the pedestrian level under the control run and Case 2 conditions. Under the Case 2 condition, the wind velocity difference was relatively large and, in particular, the difference was the largest in the DC. In the second canyon, the average wind velocity in the canyon and the wind velocity at the pedestrian level were generally at similar levels in terms of magnitude. Unlike in the first canyon, the wind velocity at the pedestrian level was equal to or lower than the average wind velocity in the canyon of Case 1. When a step-down canyon is formed, the overall wind velocity may decrease and, as in Case 2, the step-down to step-up isolation may lead to the formation of a roof-top canyon as the space of the canyon located within the condition is widened, leading to a decrease in the wind velocity itself.
6. Summary and Conclusions
In this study, we aimed to evaluate the wind environment generated in step-up and step-down urban canyons, formed according to the aspect ratio and structure of the building group in multiple canyons. Accordingly, spatial structural conditions in the step-up to step-down and step-down to step-up forms were evaluated according to the location of high-rise buildings, and computational numerical experiments were performed to compare and analyze wind changes in SCs and DCs by varying the heights of the aspect ratios of the buildings. Using the CFD model as the numerical model, each simulation was performed according to the suggested conditions, demonstrating that the wind environment varied according to the location and height of the fixed high-rise building and the variable buildings.
Under the step-up to step-down condition, the wind velocity inside the canyon weakened towards the upper part of the canyon. With the exception of only the first canyon of the SC, the wind velocity was found to increase in the roof area under the influence of the inflow wind. Additionally, in the first canyon of the SC, a vertical vortex was generated, whereas in the DC vertical flow separation was observed, with a dominant downdraft in all cases. An updraft occurred in the second canyon and, in the DC, the upward flow inside the canyon was weaker than in the SC. Under the step-down to step-up condition, the horizontal flow and wind velocity in the SCs and DCs showed similar patterns. Unlike the step-up to step-down condition, there was no significant difference in wind velocity towards the upper part. In particular, following the isolation of the central building, a tertiary roof-top canyon was formed above the roof of the central building. In the roof-top canyon, the characteristics occurring in both the first and second canyons were observed, and the overall wind velocity was weakened under the step-down to step-up condition compared to that under the step-up to step-down condition due to the formation of this canyon.
As for the inflow and outflow winds of the canyon, the horizontal inflow wind velocity was greater than the horizontal outflow wind velocity in the SC and DC of Case 1 (step-up to down, SUD). In SC and DC of Case 2 (step-down to up, SDU), the horizontal outflow wind velocity was higher than the horizontal inflow wind velocity. Under the Case 1 condition of the second canyon, the ratio of the outflow wind was higher in the canyon, whereas under the Case 2 condition, the ratio of the inflow wind was significantly higher, unlike the smaller difference in the ratio of the first canyon. As for the vertical wind velocity components (w), the flow rate in the canyon was similar under each condition, with similarities in the step-up and step-down canyon structures, but the strength and detailed flow of airflow were different. In addition, while wind speeds were generally similar under all conditions, pedestrian-level wind speeds were relatively high in the first canyon in the SUD condition.
In this study, as the aspect ratio of variable buildings with low heights increased compared to that of high-rise buildings; various phenomena were observed inside the step-up canyon, such as vortices, the domination of specific airflows, and the separation of airflows; and various wind environments were generated according to a series of conditions, such as the isolation of the variable building. Through this, it was possible to evaluate the changes in the wind environment that occurred simultaneously in the canyons formed throughout the urban environment. This suggests the importance of structural arrangement and setting the appearance ratio. Therefore, the appearance ratio and quantification figures of multiple canyons presented in this study is expected to contribute to the basic data for evaluating inflow and outflow winds, vortex formation, and vertical airflow development in varied conditions of urban structures. In addition, this information can help interpret and evaluate the wind environment according to various variable conditions of urban canyons, such as the evaluation of the wind environment isolated from high-rise buildings in the actual urban environment. However, this study was an experimental design under ideal conditions that did not apply the parameters of wind speed, wind pressure, or wind coefficients reflecting actual urban weather. A difference in wind environment conditions is expected when applied to an actual complex urban environment [38,39,40,41,42,43], and further research is needed for a comprehensive understanding of wind dynamics.
Author Contributions
Conceptualization, M.S. and D.-Y.K.; methodology, M.S., J.-I.L., J.-J.K., S.-J.P. and D.-Y.K.; formal analysis, M.S., J.-J.K., S.-J.P., D.K. and D.-Y.K.; writing—original draft preparation, M.S. and D.-Y.K.; writing—review and editing, D.-Y.K.; visualization, M.S., J.-I.L., D.K. and D.-Y.K. funding acquisition, D.-Y.K. All authors have read and agreed to the published version of the manuscript.
Funding
This research was funded by the Institute of Climate Change at Mokpo National University.
Data Availability Statement
Not applicable.
Conflicts of Interest
The authors declare no conflict of interest.
References
- Bibri, S.E.; Krogstie, J.; Kärrholm, M. Compact city planning and development: Emerging practices and strategies for achieving the goals of sustainability. Dev. Built Environ. 2020, 4, 100021. [Google Scholar] [CrossRef]
- Van Der Waals, J. The compact city and the environment: A review. J. Econmic Hum. Geogr. 2000, 91, 111–121. [Google Scholar] [CrossRef]
- Park, K.; Choi, M.J.; Cho, H.-S. The Effects of Urban Compactness on Temperature. J. Environ. Policy Adm. 2017, 25, 1–19. [Google Scholar] [CrossRef]
- Kang, J.E.; Yoon, D.; Bae, H.-J. Evaluating the effect of compact urban form on air quality in Korea. Environ. Plan. B Urban Anal. City Sci. 2017, 46, 179–200. [Google Scholar] [CrossRef]
- Kim, J.S.; Kang, J.E. Effects of Compact Spatial Characteristics on the Urban Thermal Environment. J. Urban Des. Inst. Korea Urban Des. 2018, 19, 21–36. [Google Scholar] [CrossRef]
- Kang, I.H. The strategy of compact city in Japan. Korean Policy Stud. Rev. 2018, 27, 221–244. [Google Scholar]
- Mochida, A.; Lun, I.Y. Prediction of wind environment and thermal comfort at pedestrian level in urban area. J. Wind Eng. Ind. Aerodyn. 2008, 96, 1498–1527. [Google Scholar] [CrossRef]
- Cheong, C.H.; Ryu, S.R. An analysis on the building wind variation in the residential community redestrian area by the planting method. J. Archit. Inst. Korea-Plan. Des. 2013, 29, 253–262. [Google Scholar] [CrossRef]
- Fan, Y.; Wang, Q.; Yin, S.; Li, Y. Effect of city shape on urban wind patterns and convective heat transfer in calm and stable background conditions. Build. Environ. 2019, 162, 106288. [Google Scholar] [CrossRef]
- Zhao, Y.; Li, H.; Kubilay, A.; Carmeliet, J. Buoyancy effects on the flows around flat and steep street canyons in simplified urban settings subject to a neutral approaching boundary layer: Wind tunnel PIV measurements. Sci. Total Environ. 2021, 797, 149067. [Google Scholar] [CrossRef]
- Pancholy, P.P.; Clemens, K.; Geoghegan, P.; Jermy, M.; Moyers-Gonzalez, M.; Wilson, P.L. Numerical study of flow structure and pedestrian-level wind comfort inside urban street canyons. J. R. Soc. N. Z. 2021, 51, 307–332. [Google Scholar] [CrossRef]
- Mittal, H.; Sharma, A.; Gairola, A. A review on the study of urban wind at the pedestrian level around buildings. J. Build. Eng. 2018, 18, 154–163. [Google Scholar] [CrossRef]
- Ku, C.-A.; Tsai, H.-K. Evaluating the Influence of Urban Morphology on Urban Wind Environment Based on Computational Fluid Dynamics Simulation. ISPRS Int. J. Geo-Inf. 2020, 9, 399. [Google Scholar] [CrossRef]
- Oke, T.R. Street design and urban canopy layer climate. Energy Build. 1988, 11, 103–113. [Google Scholar] [CrossRef]
- Son, M.; Kim, D.-Y. Flow characteristics in building canyon by surface flow regimes. J. Korean Soc. Urban Environ. 2020, 20, 9–16. [Google Scholar] [CrossRef]
- Kim, J.J. The effects of obstacle aspect ratio on surrounding flows. Atmos. Korean Meteorol. Soc. 2007, 17, 381–391. [Google Scholar]
- Kim, E.-R.; Park, R.J.; Lee, D.-G.; Kim, J.-J. A Study on the Characteristics of Flow and Reactive Pollutants’ Dispersion in Step-up Street Canyons Using a CFD Model. Atmosphere 2015, 25, 473–482. [Google Scholar] [CrossRef] [Green Version]
- Son, M.; Kim, D.-Y. Numerical analysis of wind velocity components in vertical development vortex. J. Korean Soc. Urban Environ. 2019, 19, 209–216. [Google Scholar] [CrossRef]
- Zheng, H.-Y.; Jin, W.-C.; Lee, S.-H.; Lee, K.-S. Wind Characteristics of Urban Street Canyon at High Rise Building Area. J. Korea Soc. Environ. Restor. Technol. 2012, 15, 9–18. [Google Scholar] [CrossRef]
- Li, Z.; Shi, T.; Wu, Y.; Zhang, H.; Juan, Y.-H.; Ming, T.; Zhou, N. Effect of traffic tidal flow on pollutant dispersion in various street canyons and corresponding mitigation strategies. Energy Built Environ. 2020, 1, 242–253. [Google Scholar] [CrossRef]
- Li, Z.; Zhang, H.; Wen, C.-Y.; Yang, A.-S.; Juan, Y.-H. Effects of height-asymmetric street canyon configurations on outdoor air temperature and air quality. Build. Environ. 2020, 183, 107195. [Google Scholar] [CrossRef]
- Baik, J.-J.; Park, R.-S.; Chun, H.-Y.; Kim, J.-J. A Laboratory Model of Urban Street-Canyon Flows. J. Appl. Meteorol. 2000, 39, 1592–1600. [Google Scholar] [CrossRef]
- Cui, D.; Li, X.; Liu, J.; Yuan, L.; Mak, C.M.; Fan, Y.; Kwok, K. Effects of building layouts and envelope features on wind flow and pollutant exposure in height-asymmetric street canyons. Build. Environ. 2021, 205, 108177. [Google Scholar] [CrossRef]
- Addepalli, B.; Pardyjak, E.R. Investigation of the Flow Structure in Step-Up Street Canyons—Mean Flow and Turbulence Statistics. Boundary-Layer Meteorol. 2013, 148, 133–155. [Google Scholar] [CrossRef]
- Park, S.-J.; Kim, J.-J.; Choi, W.; Kim, E.-R.; Song, C.-K.; Pardyjak, E.R. Flow Characteristics Around Step-Up Street Canyons with Various Building Aspect Ratios. Bound.-Layer Meteorol. 2019, 174, 411–431. [Google Scholar] [CrossRef] [Green Version]
- Addepalli, B.; Pardyjak, E.R. A study of flow felds in step-down street canyons. Envrion. Fluid. Mech. 2015, 15, 439–481. [Google Scholar] [CrossRef]
- Park, S.-J.; Choi, W.; Kim, J.-J.; Kim, M.J.; Park, R.J.; Han, K.-S.; Kang, G. Effects of building–roof cooling on the flow and dispersion of reactive pollutants in an idealized urban street canyon. Build. Environ. 2016, 109, 175–189. [Google Scholar] [CrossRef] [Green Version]
- Voordeckers, D.; Lauriks, T.; Denys, S.; Billen, P.; Tytgat, T.; Van Acker, M. Guidelines for passive control of traffic-related air pollution in street canyons: An overview for urban planning. Landsc. Urban Plan. 2020, 207, 103980. [Google Scholar] [CrossRef]
- Kim, J.-J. A numerical study of the effects of ambient wind direction on flow and dispersion in urban street canyons using the RNG k-ε turbulence model. Atmos. Environ. 2004, 38, 3039–3048. [Google Scholar] [CrossRef]
- Versteeg, H.K.; Malalasekera, W. An Introduction to Computational Fluid Dynamics: The Finite Volume Method, 2nd ed.; Prearson Education Limited: London, UK, 2007; pp. 66–97. [Google Scholar]
- Khawaja, H.; Moatamedi, M. Semi-Implicit Method for Pressure-Linked Equations (SIMPLE)—Solution in MATLAB®. Int. J. Multiphysics 2018, 12, 313–326. [Google Scholar] [CrossRef] [Green Version]
- Patankar, S.V. Numerical Heat Transfer and Fluid Flow, 1st ed.; McGraw-Hill: New York, NY, USA, 1980; pp. 126–131. [Google Scholar] [CrossRef]
- Yakhot, V.; Orszag, S.A.; Thangam, S.; Gatski, T.B.; Speziable, C.G. Development of turbulence models for shear flow by a double expansion technique. Phys. Fluids 1992, 4, 1510–1520. [Google Scholar] [CrossRef] [Green Version]
- Tutar, M.; Oguz, G. Large eddy simulation of wind flow around parallel buildings with varying configurations. Fluid Dyn. Res. 2002, 31, 289–315. [Google Scholar] [CrossRef]
- Hayati, A.N.; Stoll, R.; Pardyjak, E.R.; Harman, T.; Kim, J. Comparative metrics for computational approaches in non-uniform street-canyon flows. Build. Environ. 2019, 158, 16–27. [Google Scholar] [CrossRef]
- Brown, M.J.; Lawson, R.E., Jr.; DeCroix, D.S.; Lee, R.L. Mean flow and turbulence measurements around a 2-D array of buildings in a wind tunnel. In Proceedings of the 11th Joint Confernce on the Applications of Air Pollution Meteorology with the A&WMA, Long Beach, CA, USA, 9 January 2000; pp. 35–40. [Google Scholar]
- Castro, I.P.; Apsley, D.D. Flow and dispersion over topography: A comparison between numerical and laboratory data for two-dimensional flows. Atmos. Environ. 1997, 31, 839–850. [Google Scholar] [CrossRef]
- Razak, A.A.; Hagishima, A.; Ikegaya, N.; Tanimoto, J. Analysis of airflow over building arrays for assessment of urban wind environment. Build. Environ. 2013, 59, 56–65. [Google Scholar] [CrossRef]
- Tominaga, Y.; Shirzadi, M. Wind tunnel measurement of three-dimensional turbulent flow structures around a building group: Impact of high-rise buildings on pedestrian wind environment. Build. Environ. 2021, 206, 108389. [Google Scholar] [CrossRef]
- H’Ng, Y.M.; Ikegaya, N.; Zaki, S.A.; Hagishima, A.; Mohammad, A.F. Wind-tunnel estimation of mean and turbulent wind speeds within canopy layer for urban campus. Urban Clim. 2022, 41, 101064. [Google Scholar] [CrossRef]
- Furtak-Cole, E.; Ngan, K. Predicting mean velocity profiles inside urban canyons. J. Wind Eng. Ind. Aerodyn. 2020, 207, 104280. [Google Scholar] [CrossRef]
- Anup, K.C.; Whale, J.; Urmee, T. Urban wind conditions and small wind turbines in the built environment: A review. Renew. Energy 2019, 131, 268–283. [Google Scholar] [CrossRef]
- Fan, M.; Li, W.; Luo, X.; Shui, Q.; Jing, L.; Gu, Z.; Yu, C. Parameterised drag model for the underlying surface roughness of buildings in urban wind environment simulation. Build. Environ. 2021, 209, 108651. [Google Scholar] [CrossRef]
Figure 1.
Streamlines and contours of the normalized vertical wind component measured by Addepalli and Pardyjak (2013) [24] (a,c) and simulated by Park and Kim et al. (2020) [25] (b,d) in shallow canyons (upper panel) and deep canyons (lower panel).

Figure 2.
Computational domain and buildings configuration.

Figure 3.
Wind field and wind speed of step-up to step-down (Case 1) in the shallow canyons (left panel) and deep canyons (right panel). (a,b) z/S = 0.2; (c,d) z/S = 0.6; (e,f) z/S = 1.0.
Figure 3.
Wind field and wind speed of step-up to step-down (Case 1) in the shallow canyons (left panel) and deep canyons (right panel). (a,b) z/S = 0.2; (c,d) z/S = 0.6; (e,f) z/S = 1.0.

Figure 4.
Wind field and vertical wind component of y/S = 0 (upper panel) and y/S = [0.3 and −0.3] (lower panel) with numerical simulations in the cases of the shallow canyon (a,c) and the deep canyon (b,d).
Figure 4.
Wind field and vertical wind component of y/S = 0 (upper panel) and y/S = [0.3 and −0.3] (lower panel) with numerical simulations in the cases of the shallow canyon (a,c) and the deep canyon (b,d).

Figure 5.
Wind field and vertical wind components of the first canyon (upper panel) and the second canyon (lower panel); x/S = −1.4 (a), −1.0 (b), −0.6 (c), 0.6 (d), 1.0 (e), 1.4 (f) with numerical simulations for step-up to step-down canyons; shallow canyons. The windward buildings (red dotted box); leeward buildings (blue dotted box) of each canyon.

Figure 6.
Wind field and vertical wind components of the first canyon (upper panel) and the second can-yon (lower panel); x/S = −1.4 (a), −1.0 (b), −0.6 (c), 0.6 (d), 1.0 (e), 1.4 (f) with numerical simulations for step-up to step-down canyons; deep canyons. The windward buildings (red dotted box); leeward buildings (blue dotted box) of each canyon.

Figure 7.
Wind field and wind speed of step-up to step-down (Case 1) in the shallow canyons (left panel) and deep canyons (right panel); (a,b) z/S = 0.2; (c,d) z/S = 0.6; (e,f) z/S = 1.0.
Figure 7.
Wind field and wind speed of step-up to step-down (Case 1) in the shallow canyons (left panel) and deep canyons (right panel); (a,b) z/S = 0.2; (c,d) z/S = 0.6; (e,f) z/S = 1.0.

Figure 8.
Wind field and vertical wind component of y/S = 0 (upper panel) and y/S = 0.3 and −0.3 (lower panel) with numerical simulations in the cases of shallow canyons (a,c) and deep canyons (b,d).
Figure 8.
Wind field and vertical wind component of y/S = 0 (upper panel) and y/S = 0.3 and −0.3 (lower panel) with numerical simulations in the cases of shallow canyons (a,c) and deep canyons (b,d).

Figure 9.
Wind field and vertical wind component of the first canyon (upper panel) and the second canyon (lower panel); x/S = −1.4 (a), −1.0 (b), −0.6 (c), 0.6 (d), 1.0 (e), 1.4 (f) with numerical simulations in the case of step-down to step-up canyons; shallow canyons. The windward buildings (red dotted box); leeward buildings (blue dotted box) of each canyon.

Figure 10.
Wind field and vertical wind component of the first canyon (upper panel) and the second canyon (lower panel); x/S = −1.4 (a), −1.0 (b), −0.6 (c), 0.6 (d), 1.0 (e), 1.4 (f) with numerical simulations in the case of step-down to step-up canyons; deep canyons. The windward buildings (red dotted box); leeward buildings (blue dotted box) of each canyon.

Figure 11.
Changes in wind field direction of the inflow and outflow for the in-canyon region with wind horizontal velocity in the (a) first canyons and (b) second canyons.
Figure 11.
Changes in wind field direction of the inflow and outflow for the in-canyon region with wind horizontal velocity in the (a) first canyons and (b) second canyons.

Figure 12.
Changes in magnitude of the updraft and downdraft averaged over the in-canyon region with normalized vertical draft ratio in the (a) first canyons and (b) second canyons.
Figure 12.
Changes in magnitude of the updraft and downdraft averaged over the in-canyon region with normalized vertical draft ratio in the (a) first canyons and (b) second canyons.

Figure 13.
Averages of the windspeed of the in-canyon regions of the (a) first canyons and (b) second canyons.
Figure 13.
Averages of the windspeed of the in-canyon regions of the (a) first canyons and (b) second canyons.


Table 1.
Summary of the experiment conditions of building aspect ratio in urban canyons.
| Experiments | z/S | Appellation (Classification) | ||
|---|---|---|---|---|
| Bu | Bc | Bd | ||
| CTRL | 1.0 | 1.0 | 1.0 | Identical Urban Canyons |
| Step-up to step-down Canyons (Case 1) | 1.0 | 3.0 | 1.0 | Shallow Urban Canyons |
| 2.0 | 3.0 | 2.0 | Deep Urban Canyons | |
| Step-down to step-up Canyons (Case 2) | 3.0 | 1.0 | 3.0 | Shallow Urban Canyons |
| 3.0 | 2.0 | 3.0 | Deep Urban Canyons | |
Publisher’s Note: MDPI stays neutral with regard to jurisdictional claims in published maps and institutional affiliations. |
© 2022 by the authors. Licensee MDPI, Basel, Switzerland. This article is an open access article distributed under the terms and conditions of the Creative Commons Attribution (CC BY) license (https://creativecommons.org/licenses/by/4.0/).
Share and Cite
MDPI and ACS Style
Son, M.; Lee, J.-I.; Kim, J.-J.; Park, S.-J.; Kim, D.; Kim, D.-Y. Evaluation of the Wind Environment around Multiple Urban Canyons Using Numerical Modeling. Atmosphere 2022, 13, 834. https://0-doi-org.brum.beds.ac.uk/10.3390/atmos13050834
AMA Style
Son M, Lee J-I, Kim J-J, Park S-J, Kim D, Kim D-Y. Evaluation of the Wind Environment around Multiple Urban Canyons Using Numerical Modeling. Atmosphere. 2022; 13(5):834. https://0-doi-org.brum.beds.ac.uk/10.3390/atmos13050834
Chicago/Turabian StyleSon, Minu, Jeong-In Lee, Jae-Jin Kim, Soo-Jin Park, Daegi Kim, and Do-Yong Kim. 2022. "Evaluation of the Wind Environment around Multiple Urban Canyons Using Numerical Modeling" Atmosphere 13, no. 5: 834. https://0-doi-org.brum.beds.ac.uk/10.3390/atmos13050834
Note that from the first issue of 2016, this journal uses article numbers instead of page numbers. See further details here.