Article

Evaluation of Hydrological Simulation in a Karst Basin with Different Calibration Methods and Rainfall Inputs

1
College of Architecture and Civil Engineering, Guangxi University, Nanning 530004, China
2
Guangxi Provincial Engineering Research Center of Water Security and Intelligent Control for Karst Region, College of Architecture and Civil Engineering, Guangxi University, Nanning 530004, China
3
Key Laboratory of Disaster Prevention and Structural Safety of Ministry of Education, College of Architecture and Civil Engineering, Guangxi University, Nanning 530004, China
4
School of Water Conservancy and Civil Engineering, Northeast Agricultural University, Harbin 150030, China
*
Author to whom correspondence should be addressed.
Submission received: 26 April 2022 / Revised: 11 May 2022 / Accepted: 19 May 2022 / Published: 20 May 2022
(This article belongs to the Section Atmospheric Techniques, Instruments, and Modeling)

Abstract

:
Accurate hydrological simulation plays an important role in the research of hydrological problems; the accuracy of the watershed hydrological model is seriously affected by model-parameter uncertainty and model-input uncertainty. Thus, in this study, different calibration methods and rainfall inputs were introduced into the SWAT (Soil and Water Assessment Tool) model for watershed hydrological simulation. The Chengbi River basin, a typical karst basin in Southwest China, was selected as the target basin. The indicators of the NSE (Nash efficiency coefficient), Re (relative error) and R2 (coefficient of determination) were adopted to evaluate the model performance. The results showed that: on the monthly and daily scales, the simulated runoff with the single-site method calibrated model had the lowest NSE value of 0.681 and highest NSE value of 0.900, the simulated runoff with the multi-site method calibrated model had the lowest NSE value of 0.743 and highest NSE value of 0.953, increased correspondingly, indicating that adopting the multi-site method could reduce the parameter uncertainty and improve the simulation accuracy. Moreover, the NSE values with IMERG (Integrated Multisatellite Retrievals for Global Rainfall Measurement) satellite rainfall data were the lowest, 0.660 on the monthly scale and 0.534 on the daily scale, whereas the NSE values with fusion rainfall data processed by the GWR (geographical weighted regression) method greatly increased to 0.854 and 0.717, respectively, and the NSE values with the measured rainfall data were the highest, 0.933 and 0.740, respectively, demonstrating that the latter two rainfall inputs were more suitable sources for hydrological simulation.

1. Introduction

Hydrological modelling is an important tool to explore the hydrological regularity of watersheds. Accurate hydrological simulation using hydrological modelling is helpful to solve the existing or future hydrological problems in the basin. For example, with regard to water-resource management issues, applying hydrological models to simulate the hydrological process in the basin under a changing environment thereby identified the temporal and spatial evolution law of the water-cycle and water-balance factors in the basin, which help in making regional adaptive management decisions of water resources. Importantly, the basis of such an exploration of evolution law is based on the understanding of the existing hydrological response in the basin, which requires more accurate hydrological simulation. At present, the distributed hydrological models and semi-distributed hydrological models are more widely used. Compared with the traditional lumped hydrological models, the distributed hydrological models particularly consider the inhomogeneity of the underlying surface and rainfall distribution; therefore, the hydrological process in the basin can be reflected more accurately and thoroughly. Typical distributed hydrological models commonly used in hydrological simulation include the SWAT (Soil and Water Assessment Tool) model [1,2], TOPMODEL (Topographic Driven model) [3,4], SHE (System Hydrologique European) model [5,6], VIC (Variable Infiltration Capacity) model [7,8], etc. Since the SWAT model is considered to have a strong physical foundation, it has been widely used to research water-resource management [9], hydrological impacts under a changing environment [10], and non-point source pollution [11]. The development of GIS (geography information systems) and RS (remote sensing) provides more data support to the SWAT model for hydrological process and response research in different basins [12]. Recent advances in SWAT-model applications are shown in the simulation of runoff in data-scarce areas [13], rainfall–runoff modeling using remotely sensed data [14], forecasting extreme weather events [15], etc. Although the distributed hydrological models can better describe the hydrological process in the basin, due to the abstraction and generalization of the original complex hydrological process, uncertainty inevitably exists in the model, affecting the simulation results. The uncertainty of hydrological models mainly originates from model inputs, model parameters, and the model structure [16]. Karst basins are characterized by underground drainage systems with sinkholes and caves; the complex geometry of such a network of conduits affects the surface and groundwater flow, causing the rainfall–runoff process in karst basins to be different from other non-karst basins [17]. Current research on hydrological simulation in karst areas mostly focus on the improvement of model structure. Nikolaidis et al. [18] modified the SWAT model, linking a reservoir model with it to simulate the hydrologic and chemical response of karst in the Koiliaris River basin in Crete. Zhou et al. [17] coupled the XAJ (Xinanjiang) model and a two-reservoir-based karst model for simulating the rainfall–runoff processes in the karst-dominated Lijiang River basin. Geng et al. [19] modified the SWAT model by replacing the single-reservoir model in the groundwater module with a three-reservoir model to depict the constraints of multiple media on the groundwater discharge in the karst system and effectively improved the simulation accuracy of daily runoff. However, few studies pay attention to the influence of the calibration method of model parameters or the input of rainfall data on the hydrological simulation accuracy in karst basins.
Most of the existing studies use the single-site method to calibrate the parameters [20]. Such a method uses data from only one station, so it cannot reflect the spatial and temporal variation in the physical characteristics of the basin. Therefore, some scholars have studied the multi-site calibration method and found that the multi-site calibration method could determine the parameter values that are more reasonable to the local condition [21] and reveal differences in hydrological behavior in different parts of the basin [22]. However, comparing the simulation results by a single-site calibration method and multi-site calibration method, the results by the multi-site calibration method have not been greatly improved [21,23].
In addition, the uncertainty of using rainfall data as a model input greatly affects the hydrological-simulation results. Most studies uniquely use the measured rainfall data [24,25,26]. In recent years, with the development of satellite remote-sensing technology, satellite data can better reflect the spatial distribution characteristics of rainfall [27,28] and are applied to hydrological simulation [29,30]. Zhao et al. [31] assessed the hydrological utility of four satellite rainfall products in the Yellow River source region of China and found that IMERG-F (Integrated Multisatellite Retrievals for Global Rainfall Measurement Final Run) had an improved hydrological utility compared to TMPA 3B42V7 (Tropical Rainfall Measurement Mission Multisatellite Rainfall Analysis 3B42 version 7). Jiang and Bauer-Gottwein [32] conducted rainfall–runoff modeling over 300 catchments across China to investigate the performance of IMERG (Integrated Multisatellite Retrievals for Global Rainfall Measurement), and the result showed that IMERG gave an acceptable performance in rainfall estimates and transformation of rainfall into runoff across China, but the performance varied across climate regions and topography, and it performed better in arid regions. Some studies fused satellite rainfall data with measured rainfall data, showing substantial improvement over only satellite data-based runoff modeling after fusion [33].
To sum up, the influence of model calibration methods or the rainfall data on model uncertainty is rarely studied in karst basins, limited by the influence of local land use, topography, and climatic features; the conclusions in other types of basin are not necessarily applicable to karst basins. In karst areas, schemes of calibration methods and rainfall inputs that can achieve better hydrological simulation results need to be explored. Therefore, the goal of this study is to investigate the influence of different calibration methods and rainfall inputs on hydrological simulation in the karst area and to optimize better schemes. The results from this study may help to optimize hydrological simulation in karst areas and thereby provide a scientific basis for water resources management of karst basins. Admittedly, the main limitation is the single fusion method for rainfall data, and more detailed studies on this aspect should be conducted in the future.

2. Materials

2.1. Overview of Study Area

Located in Baise City of Guangxi (106°21′ E–106°48′ E, 23°50′ N–24°45′ N), the Chengbi River basin is a typical karst area in Southwest China, belonging to the Youjiang River system in the Pearl River basin. The Chengbi River basin covers an area of 2087 km2, bounded by Haokun-Nonglin; the upper part of the basin is divided into typical karst landforms (e.g., sinkholes, karst windows, and underground streams), and the lower part has a hilly landform. There are three hydrometric stations and nine rainfall stations in the Chengbi River basin, and their detailed distribution is shown in Figure 1. Specific information such as the location, elevation, and record length of each station are shown in Table 1.
The Chengbi River basin has a subtropical monsoon climate: it is hot and rainy in summer, mild and rainy in winter, and has an average annual temperature of 22.1 °C. There is no significant difference in humidity between winter and summer, and the relative average humidity is 76%. The rainfall is frequent in the basin and unevenly distributed throughout the year. There is relatively more rainfall from May to September, accounting for about 87%. Rainfall is the main water source in the basin. Due to frequent and concentrated heavy rainfalls, as well as the karst landform, the basin is prone to flood disasters.

2.2. Model and Data

The SWAT (Soil and Water Assessment Tool) model is a distributed watershed hydrological model developed by the agricultural research center of the USDA (the United States Department of Agriculture) in the 1990s. With a strong physical foundation, it is often used in the simulation research of runoff, non-point source pollution, and scenario change. Data on the DEM, land cover, soil type, and meteorology and hydrology are needed to drive it.

2.2.1. DEM Data

The DEM (Digital Elevation Model) is one of the key elements for hydrological simulation. The resolution of the DEM has a significant influence on the simulation effect of the model. Therefore, the DEM data used in this study were from the GDEMV2 (Global Digital Elevation Model Version 2) with a resolution of 30 m downloaded from the geospatial data cloud (www.gscloud.cn/research, accessed on 1 May 2020). The DEM of the Chengbi River basin can be observed in Figure 1, the data of which have been spliced, clipped, coordinate-transformed, and processed by ArcGIS software (developed by Environmental Systems Research Institute in Redlands, CA, USA).

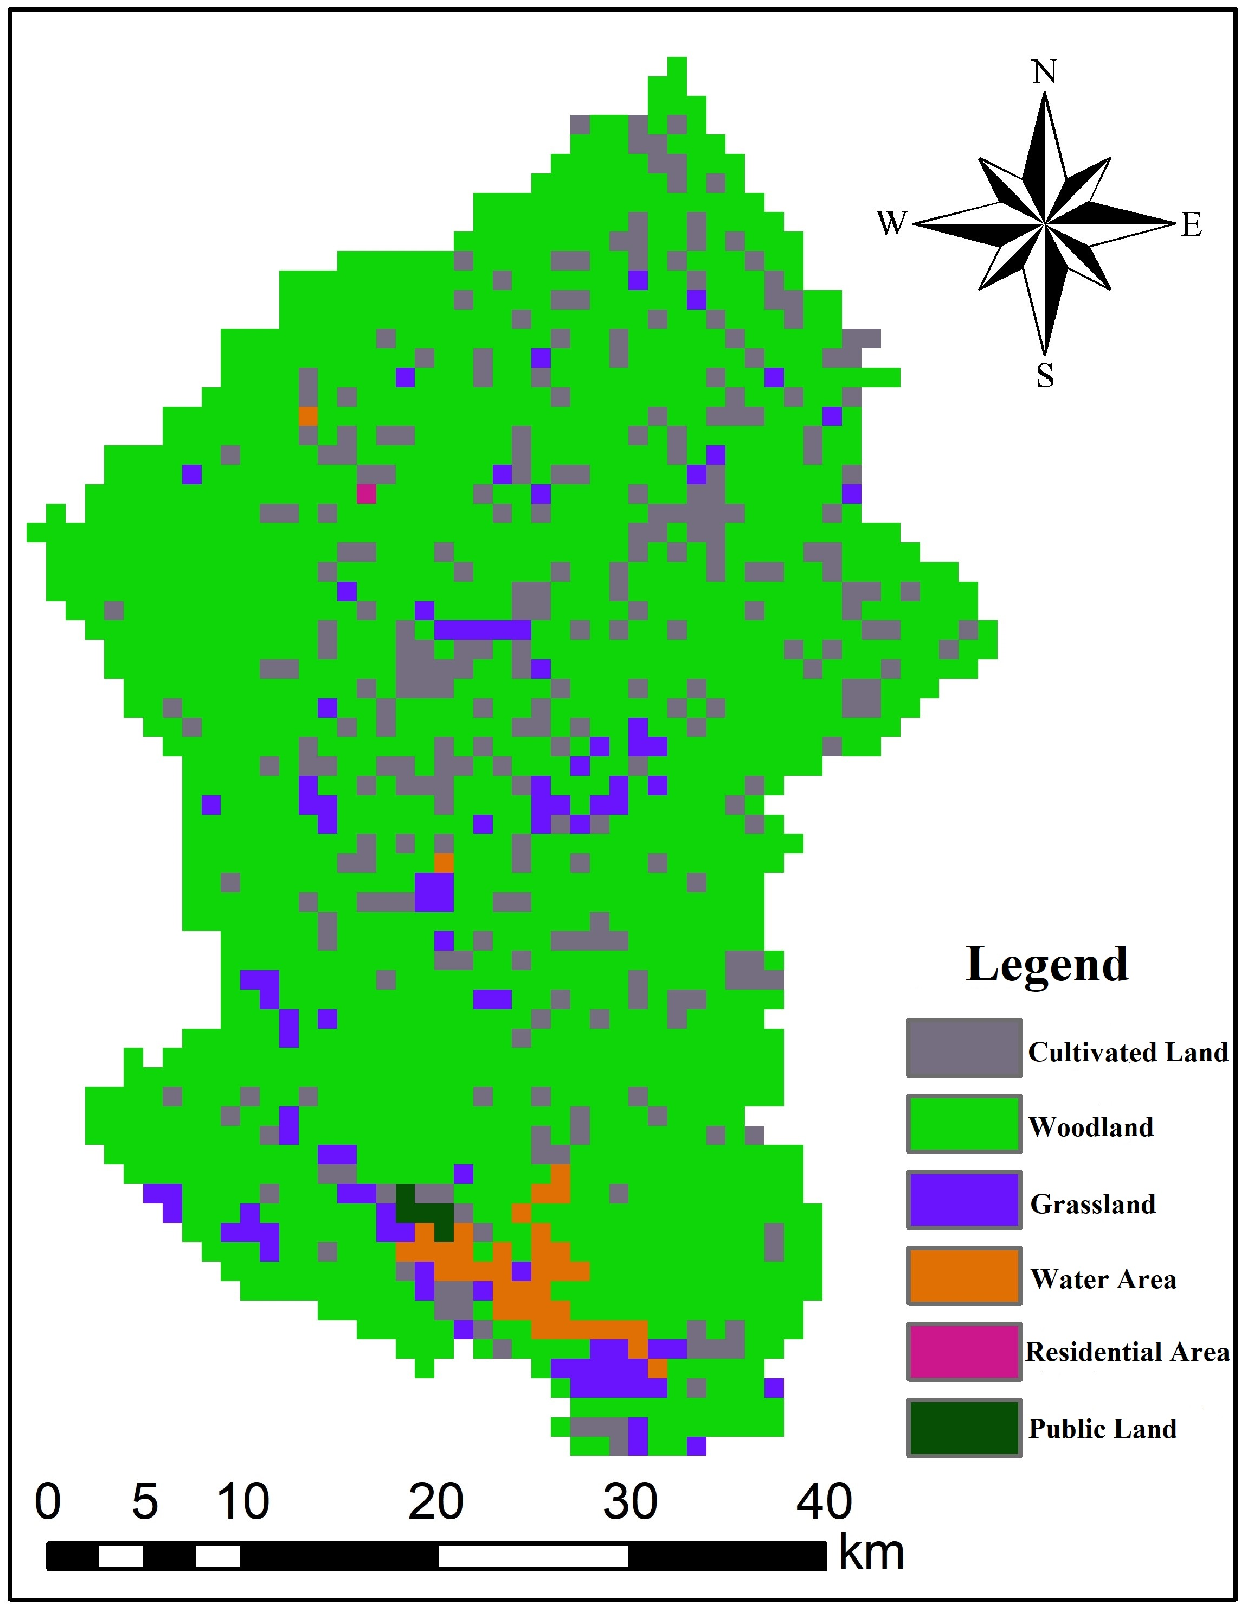
2.2.2. Land Cover Data
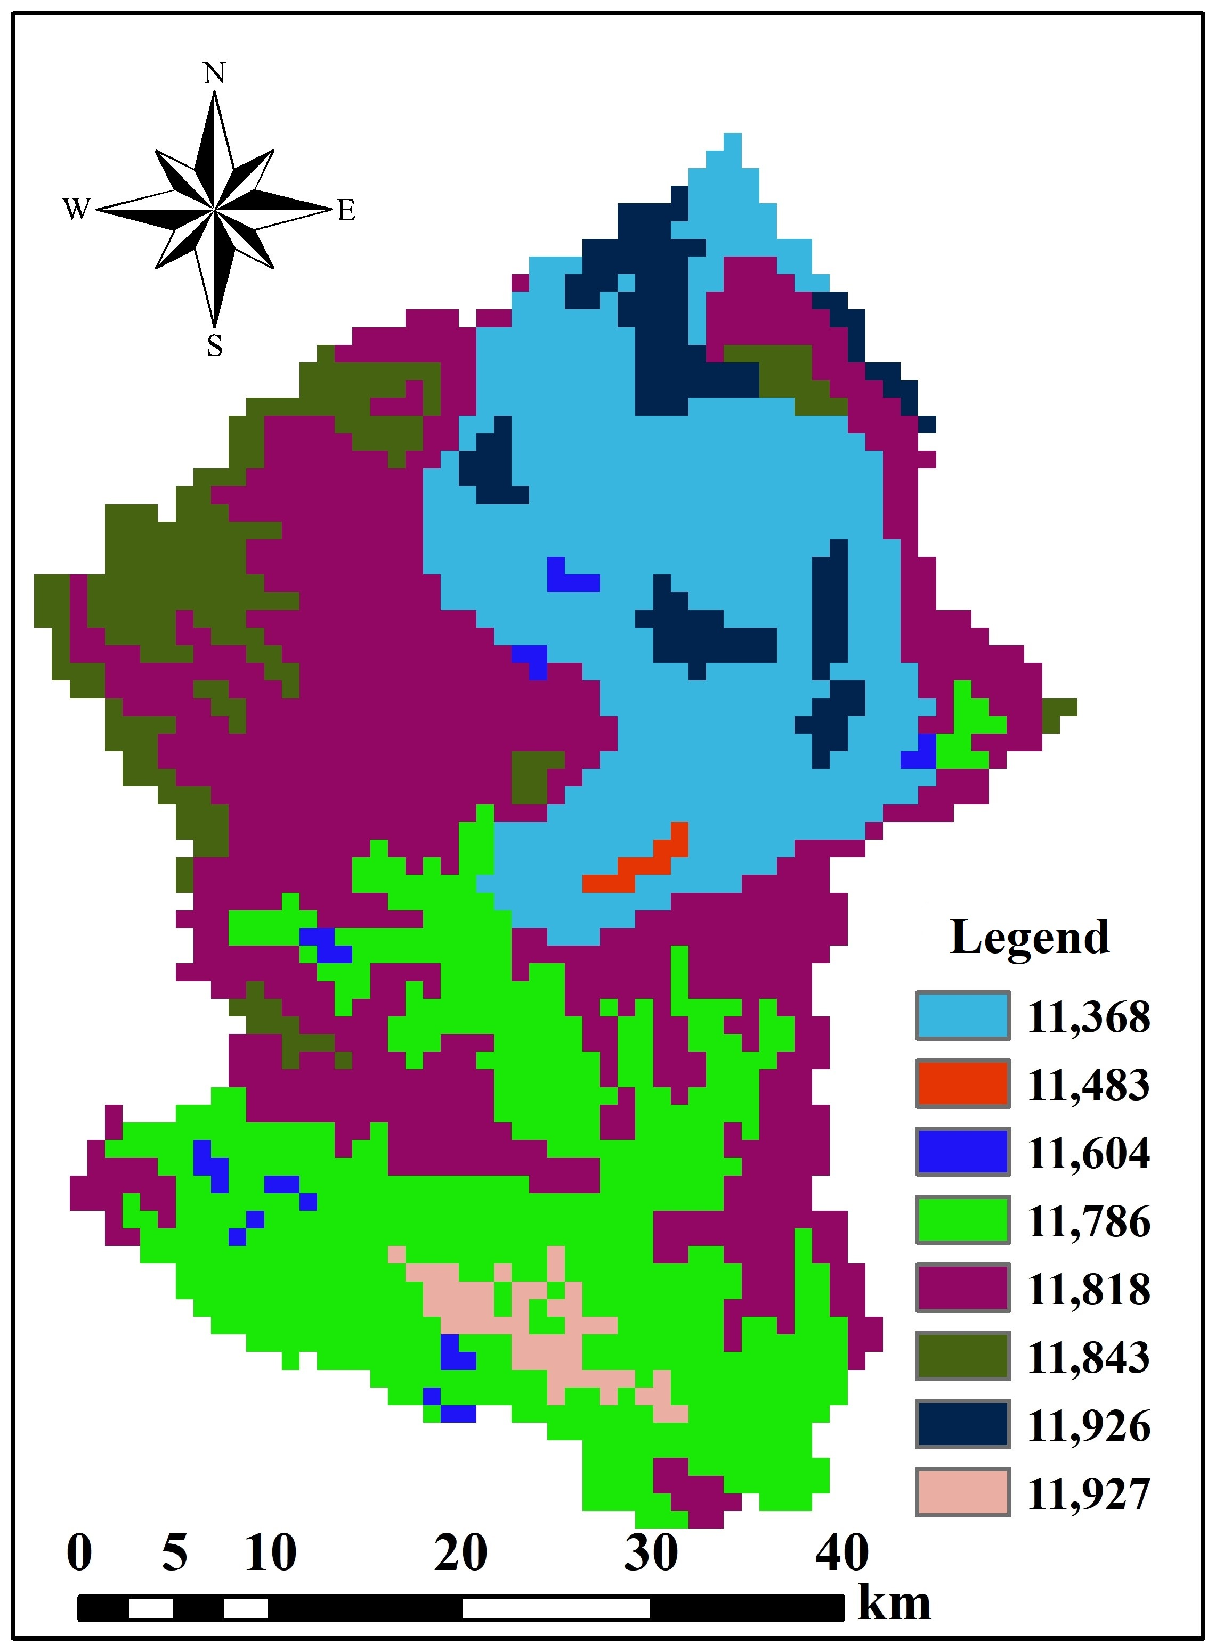
The land cover data in 2015 with a 1 km resolution were downloaded from the Resource and Environment Science and Data Center of the Chinese Academy of Sciences (http://www.resdc.cn/, accessed on 1 May 2020). There are 12 secondary land-cover types in the Chengbi River basin, but these cannot be identified in the SWAT model. Therefore, the above-12 land-cover types were reclassified into 6 types that are available in the SWAT model. The distribution of reclassified land-cover types in the Chengbi River basin is shown in Figure 2.

2.2.3. Soil Data

Soil data represent an important basis for HRU (Hydrologic Response Unit) division in the SWAT model. The soil data were downloaded from the HWSDv1.2 database (Harmonized World Soil Database) (http://www.fao.org/harmonized-world-soil-database-v12/en/, accessed on 1 May 2020) with a resolution of 1 km. The existing soil database in the SWAT model is constructed according to the soil types of the United States of America, which are quite different from the soil in China. Therefore, it was necessary to establish a soil database suitable for the study area according to the requirements of the SWAT model. SPAW software was used to calculate three property parameters of the soil, namely SOL_BD, SOL_AWC, and SOL_K, and other parameters could be obtained from the HWSD database. The soil distribution of the Chengbi River basin is shown in Figure 3.

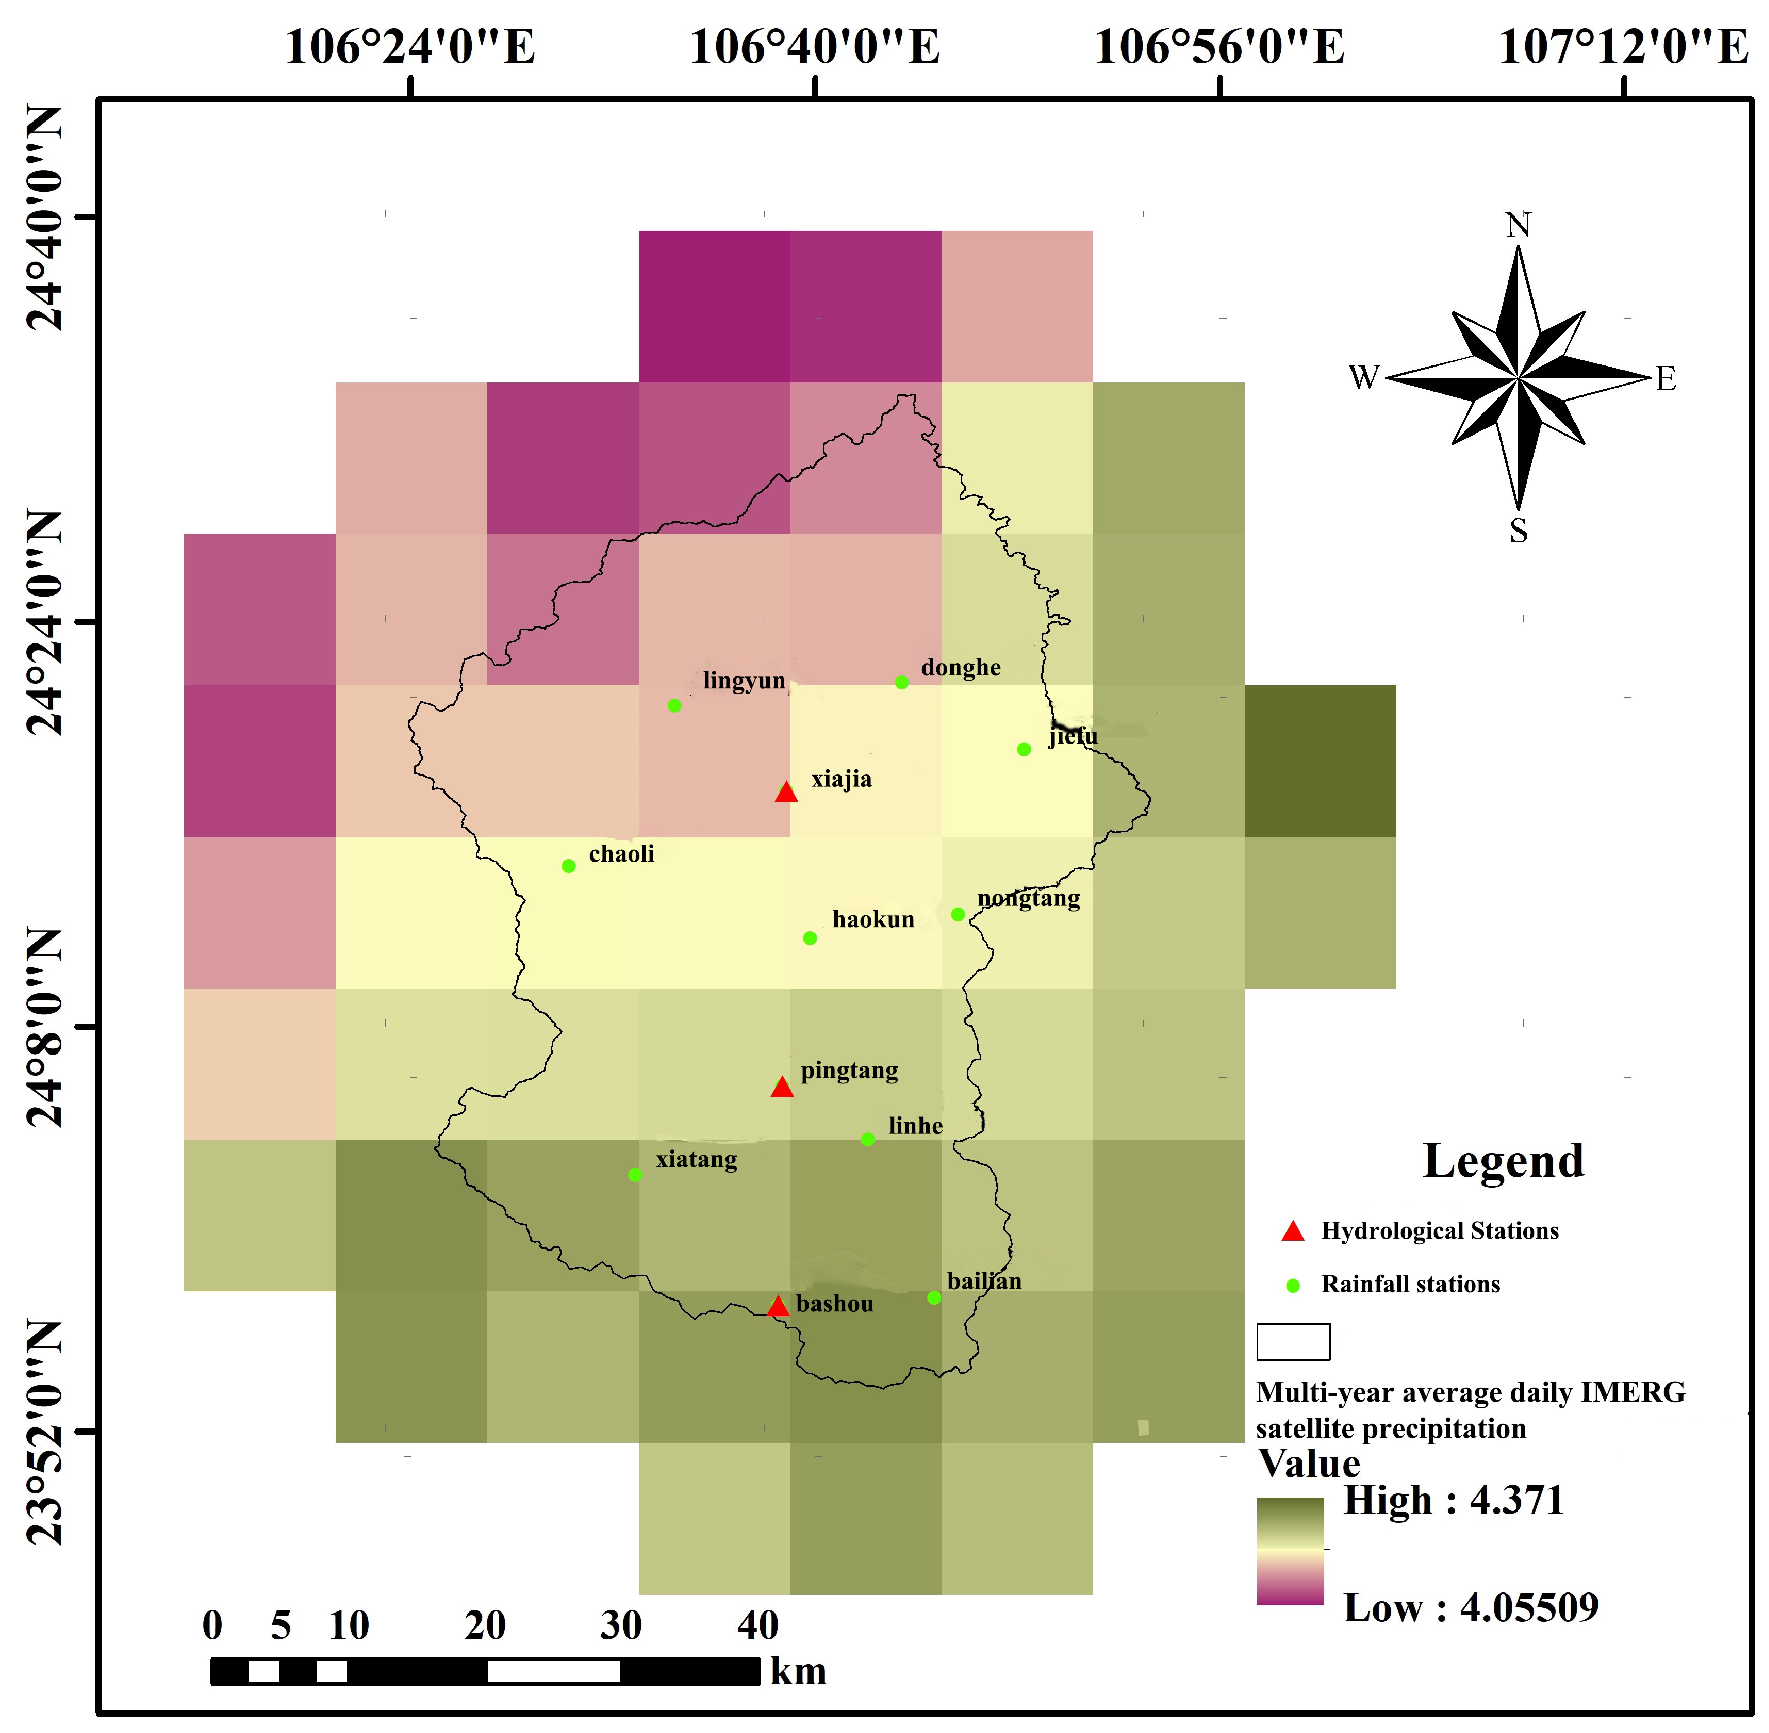
2.2.4. Meteorological and Hydrological Data

As an important simulation basis, the rainfall data significantly impact the accuracy of the model. Regarding the uncertainty of the rainfall data, the following three representative rainfall data were used in this study for runoff simulation: the station measured rainfall data, IMERG satellite rainfall data, and GWR (geographical weighted regression) fusion rainfall data.
The station-measured rainfall data were obtained from 12 rainfall stations in the Chengbi River basin, including Lingyun, Haokun, Pingtang, Xiatang, Chaoli, Bailian, and so on. Through the Chengbi River Reservoir Authority, the daily rainfall data from January 2002 to August 2018 were collected.
The adopted IMERG satellite rainfall data were the IMERG Final Run product (IMERG-F) downloaded from NASA’s official website (https://pmm.nasa.gov/data-access/downloads/gpm, accessed on 1 May 2020), which were corrected by the ground stations on a monthly scale. The rainfall data are at a 0.1° × 0.1° resolution and on a daily scale ranging from 1 January 2014 to 31 August 2018. As the Chengbi River basin is small and the number of grids is limited, it was necessary to expand a buffer area outside the Chengbi River basin and mask it with ArcGIS. The areal rainfall distribution of the Chengbi River basin included the buffer area, and the number of grids was 55. The IMERG satellite rainfall data of 12 rainfall stations and the centers of 55 grids in the study area were extracted by the Extract Multi Value to Points tool of the software ArcGIS. The multi-year average daily rainfall of the IMERG satellite in the Chengbi River basin is shown in Figure 4.
The fusion rainfall data were fused by the GWR method and were on a monthly scale ranging from 1 January 2014 to 31 August 2018. The proportional index method was used to downscale the rainfall data in this study; thus, the hydrological simulation could be conducted on the daily scale for comparable research.
Other meteorological data, such as the solar radiation, wind speed, air temperature, and relative humidity, were provided by data from the Baise station downloaded from the China Meteorological Data Service Center. They were on a daily scale ranging from January 2002 to August 2018. Meanwhile, the daily runoff data of the Chengbi River basin from January 2002 to August 2018 were collected from the Chengbi River Reservoir Authority, providing a reference for the evaluation of model performance. These are summarized in Table 2.

2.3. Evaluation Criteria

The following three key indicators were selected to evaluate the model performance: NSE (Nash efficiency coefficient), Re (relative error), and R2 (coefficient of determination). The calculation formulas are as follows:
N S E = 1 i = 1 n ( Q m e a , i Q s i m , i ) 2 i = 1 n ( Q m e a , i Q m e a ¯ ) 2
R 2 = i = 1 n ( Q m e a , i Q m e a ¯ ) ( Q s i m , i Q s i m ¯ ) 2 i = 1 n ( Q m e a , i Q m e a ¯ ) 2 i = 1 n ( Q s i m , i Q s i m ¯ ) 2
R e = i = 1 n Q s i m , i Q mea i = 1 n Q m e a , i
where Q m e a , i represents the measured runoff series, Q s i m , i represents the simulated runoff series, Q m e a , i ¯ and Q s i m , i ¯ represent the mean value of the measured runoff and the simulated runoff, respectively. Re represents the reliability of the simulation results. If Re > 0, it indicates overestimation; otherwise, it indicates underestimation. If | R e | < 10 , it means that the simulated value is very close to the measured value, if 10 < | R e | < 15 , it means that the simulated value matches well with the measured value, and if 15 < | R e | < 25 , it means that then error of simulated value is acceptable. R2 reflects the degree of linear correlation between the measured runoff value and the simulated runoff value, and the value range is [0,1]. The closer R2 is to 1, the stronger the linear correlation between the measured runoff and simulated runoff, and vice versa. NSE describes the fitting degree between the measured runoff and the simulated runoff, based on the model performance categories proposed by Moriasi et al. [34]; its evaluation criteria are shown in Table 3.

3. Methods

3.1. Construction and Calibration of Hydrological Model

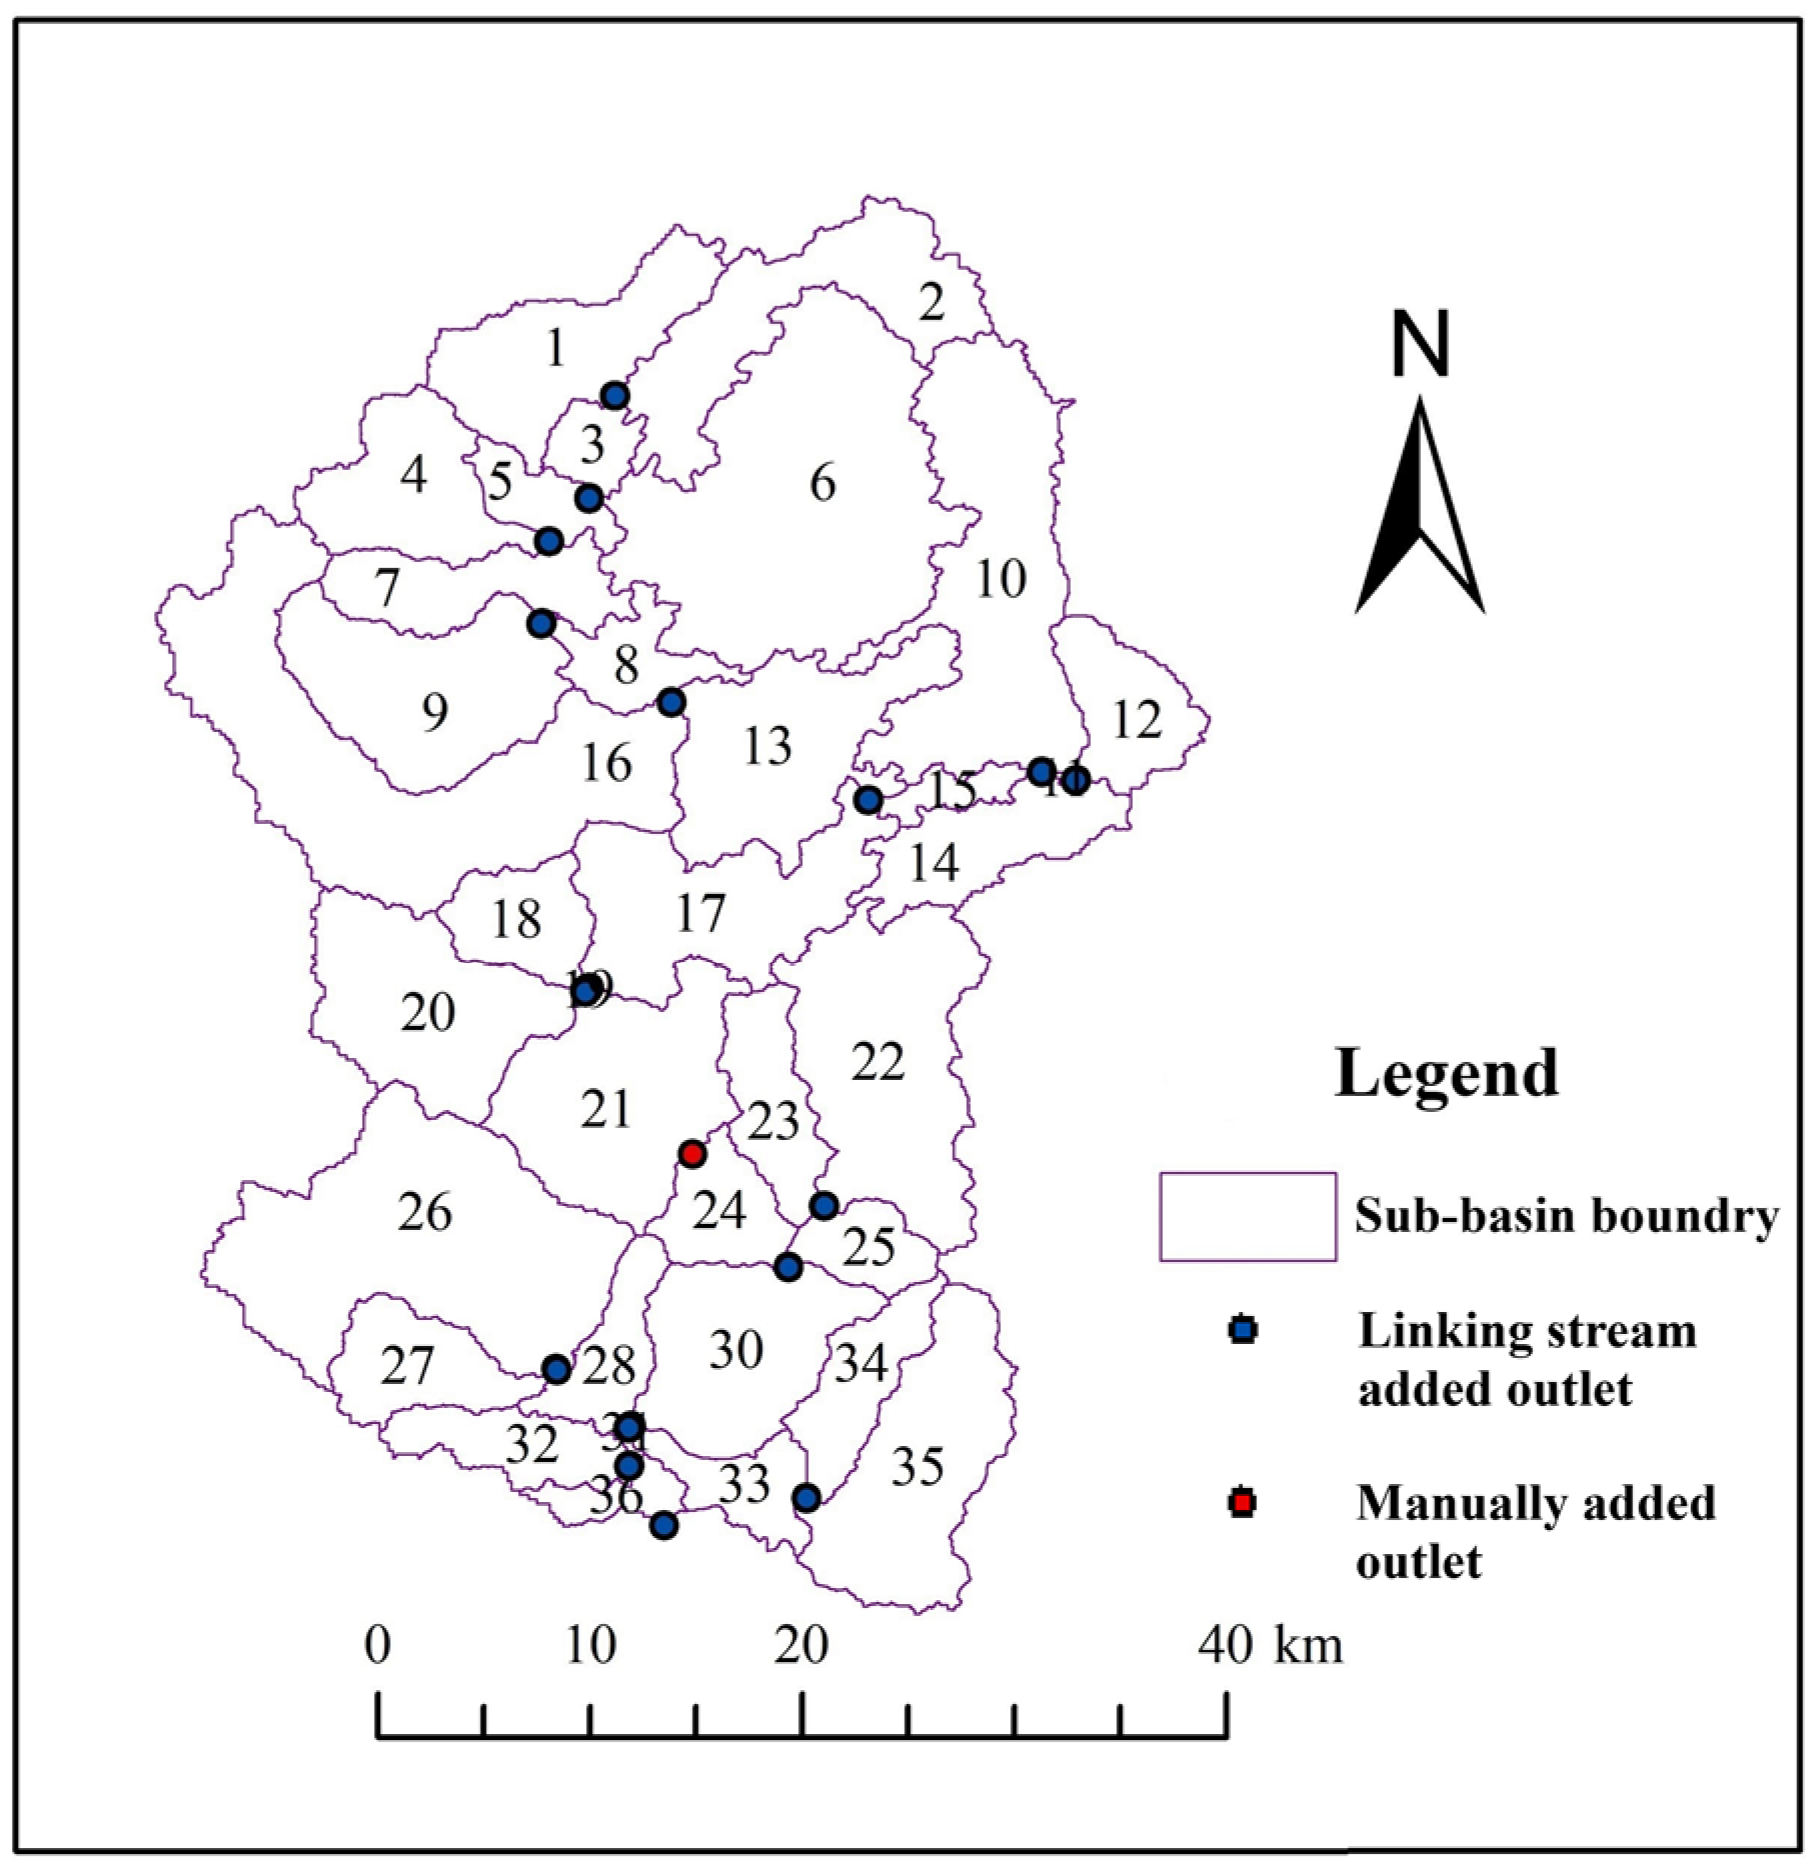
3.1.1. Construction of the SWAT Model

The SWAT model can be used to simulate the hydrological cycle process composed of the HRUs (hydrologic response units). The hydrological simulation of each HRU can be regarded as the joint effects of a single soil type and a single land-cover type. According to the water balance equation, the SWAT model separately carries out hydrological simulation for each HRU first (such as evapotranspiration, runoff deducted evaporation, surface runoff, interflow, and subsurface runoff), and then accumulates the simulation results of the HRUs in each sub-basin. Finally, the runoff at the total outlet of the basin converged by the river network from each sub-basin can be calculated.
After the meteorological data (rainfall, relative humidity, air temperature, wind speed, and solar radiation), hydrological data (runoff), and spatial data (DEM data, soil type, land cover, water system, and station location) were prepared, the SWAT project was established in ArcGIS software.
(1) Firstly, the basin was spatially discretized. According to the DEM data, the river network and the basin were automatically generated. After depression filling, the flow directions and flow accumulation grids were calculated for division of the river network and the boundary of the basin. Zhao [35] studied the impact of the number of the sub-basins with the same parameters on the simulation accuracy of the SWAT model, and he concluded that when the number of the sub-basins is between 25 and 40, the hydrological response of the model is the most sensitive. Therefore, after iterative calculation and debugging, the threshold was finally set at 3000 ha. The study area was divided into 37 sub-basins, as shown in Figure 5.
(2) Secondly, the sub-basins were divided into the HRUs, which are the smallest hydrological units with the same hydrological conditions according to the types of the land cover, soil, and slope. Before division, the land cover, soil, and slope needed to be reclassified. According to the research of Xiao [36] on the threshold of the HRU, the thresholds of the land cover, soil, and slope were all set at 10%. The 37 sub-basins in the Chengbi River basin were further divided into 151 HRUs.
(3) Thirdly, the meteorological data were loaded. Data of solar radiation, wind speed, air temperature, and relative humidity were of Baise station downloaded from the China Meteorological Data Service Center. The station-measured rainfall data were used in model calibration. The measured rainfall data, IMERG satellite rainfall data, and GWR fusion rainfall data were used in runoff simulation for the comparison of model performance.
(4) Finally, after the above steps, that is, once the division of the sub-basins, the division of the HRUs, and the upload and edit of the input files were completed, the SWAT model could be brought into operation. The preheating period of the model was set from 1 January 2002 to 31 December 2002, the calibration period was set from 1 January 2003 to 31 December 2006, and the validation period was set from 1 January 2007 to 31 December 2017.

3.1.2. Calibration of the SWAT Model

The Chengbi River basin is a typical karst basin in Southwest China. The developed karst landforms and the multiple underlying surface structures add further complications to the hydrological simulation process. Parameter calibration is the key step to improve the simulation accuracy. To optimize the calibration, the single-site method and the multi-site method were separately applied to calibrate the SWAT model.
Sensitivity analysis of the relevant parameters was required before calibration. The Sufi-2 algorithm in SWAT-CUP software was used for sensitivity analysis and parameter calibration. There were 22 main parameters for hydrological simulation in the SWAT model. The following 13 parameters were selected for calibration: R__CN2, V__ALPHA_BF, V__GW_DELAY, V__GWQMN, V__ESCO, R__SOL_BD, V__CH_N2, V__REVAPMN, R__SOL_K, V__CH_K2, V__GW_REVAP, R__SOL_AWC, and V__ALPHA_BNK, which were sensitive for hydrological simulation referring to the research [37,38,39] on the SWAT model in the Chengbi River basin before.
The runoff data ranging from 2013 to 2017 of the Bashou hydrometric station, at the outlet of the basin, were used in the calibration of the single-site method. The runoff data of all three hydrometric stations in the basin, Xiajia, Pingtang, and Bashou, were used in the calibration of the multi-site method. The principle of parameter calibration is from upstream to downstream and from a monthly scale to a daily scale.
The specific steps of multi-site calibration on the monthly scale are as follows:
(1)
Firstly, the runoff result preliminarily simulated by the initial parameters of the SWAT model was loaded into a new SWAT-CUP project.
(2)
Secondly, the runoff of the upstream Xiajia station was calibrated. The four parameters given by the software, R__CN2, V__ALPHA_BF, V__GW_DELAY, and V__GWQMN, were calibrated in File Par_inf.txt of Calibration Inputs, and other inputs could refer to the handbook of SWAT-CUP2012. When these inputs were completed, the first calibration was conducted by clicking the Calibrate button.
(3)
Thirdly, R2 and NSE were checked in File Summary_Stat.txt of Calibration Outputs. If they did not meet the requirements, the value ranges of each parameter in File Best_Par.txt of Calibration Inputs were loaded in File Par_inf.txt for the second calibration, and the value ranges were kept within the recommended ranges from SWAT-CUP software. R2 and NSE were repeatedly checked until they met the requirements, and then the iteration ended.
(4)
Finally, after the above four parameters had been calibrated, a new parameter was added in File Par_inf.txt, and the above steps were repeated until all the 13 parameters had been calibrated. Based on the ranges for the 13 parameters, parameters were calibrated according to the above steps with Pingtang and Bashou in sequence.
The calibration of the single-site method was similar to that of the multi-site method. The difference was that in the fourth step, only the runoff data of Bashou Station was used. The daily scale calibrations were similar to the monthly ones. The difference was that the runoff data were at different time scales.

3.2. Preparation of Multi-Source Rainfall Data

3.2.1. Fusion and Correction

Of the three representative rainfall data required for the study, both the station-measured rainfall data and IMERG satellite rainfall data could be directly downloaded, while the fusion one required further processing. Referring to the studies on fusion and correction methods of remote-sensing data [40,41,42,43,44], the GWR method, which has a good correction effect and is simple to apply, was chosen to be used. GWR is a spatial regression model based on variable parameters proposed by Professor Fotheringham of British University. It is an improvement and extension from the OLS (Ordinary Least Square) method, embedding spatial relations into general linear regression, thus enabling the study of spatial heterogeneity among variables. The technical route is as follows: firstly, calculate the difference between the measured rainfall of 12 rainfall stations and the corresponding IMERG satellite rainfall, and then take the position coordinates (x, y) as the independent variable and the difference as the dependent variable to estimate the differences of 1 × 1 km-resolution grid by GWR in ArcGIS software; finally, add the differences obtained by GWR to the corresponding IMERG satellite rainfall to obtain the fusion rainfall value of the study area.
The specific calculation steps are as follows:
(1)
At the m rainfall station, e m is the difference between the measured rainfall P G m of this rainfall station and the satellite rainfall P S m . at the corresponding location.
e m = P G m P S m
(2)
Based on the e m , the difference of the 1 × 1 km-resolution grid in the study area e n was calculated by GWR.
e n = f ( P G 1 P S 1 , P G 2 P S 2 , , P G i P S i )
(3)
Add the e n to the corresponding 1 × 1 km-resolution-grid IMERG satellite rainfall, and the result is the GWR fusion rainfall P .
P = P S n + e n

3.2.2. Downscaling Method

After GWR processing, the monthly fusion rainfall data are available, and the daily fusion rainfall data still need to be achieved. Among the research on downscaling, the proportional index method is widely used. Jin [45] used the proportional index method to scale down the annual rainfall data of the TRMM satellite to the monthly scale. Sun et al. [46] used the proportional index method to scale down the monthly rainfall data of the TRMM satellite to the daily scale. According to the above research, the proportional index method is used to scale down the monthly fusion rainfall data by GWR to a daily scale.
The specific calculation steps are as follows:
(1)
Firstly, the proportional indexes of the original daily IMERG rainfall to the corresponding monthly IMERG rainfall from 2014 to 2018 were calculated:
F r a c t i o n i = I M E R G i d a y / i = 1 n I M E R G i d a y
where I M E R G i d a y is the original IMERG satellite rainfall of day i, the denominator is the cumulant of IMERG rainfall of the corresponding month. F r a c t i o n i is the rainfall proportional index of each day i to the corresponding month ranging from 2014 to 2018, added up to 1 each month.
(2)
Then, the proportional index F r a c t i o n i was multiplied to the monthly fusion rainfall for the corresponding daily fusion rainfall.

4. Results

4.1. Sensitivity Analysis

The SUFI-2 algorithm of SWAT-CUP was used for the parameter-sensitivity analysis in this study. The indexes of parameters sensitivity are the t-stat and p-value. A larger absolute value of the t-stat indicated greater sensitivity; the closer the p-value to zero, the greater the significance [47]. By comparing these indexes, 13 sensitive parameters were finally selected for calibration and validation. The values of these indexes and the sensitivity rank of each parameter are shown in Table 4.
As seen from Table 3, SOL_AWC, the available water capacity of the soil layer, is the most sensitive parameter. The second most sensitive parameter is ESCO, and it affects the soil evaporation process; with the decrease in the ESCO value, the evaporation of deep soil water increases. The third most sensitive parameter is GW_DELAY, followed by ALPHA_BNK and CH_K2. Other parameters shown in Table 3 also influenced the simulated runoff.

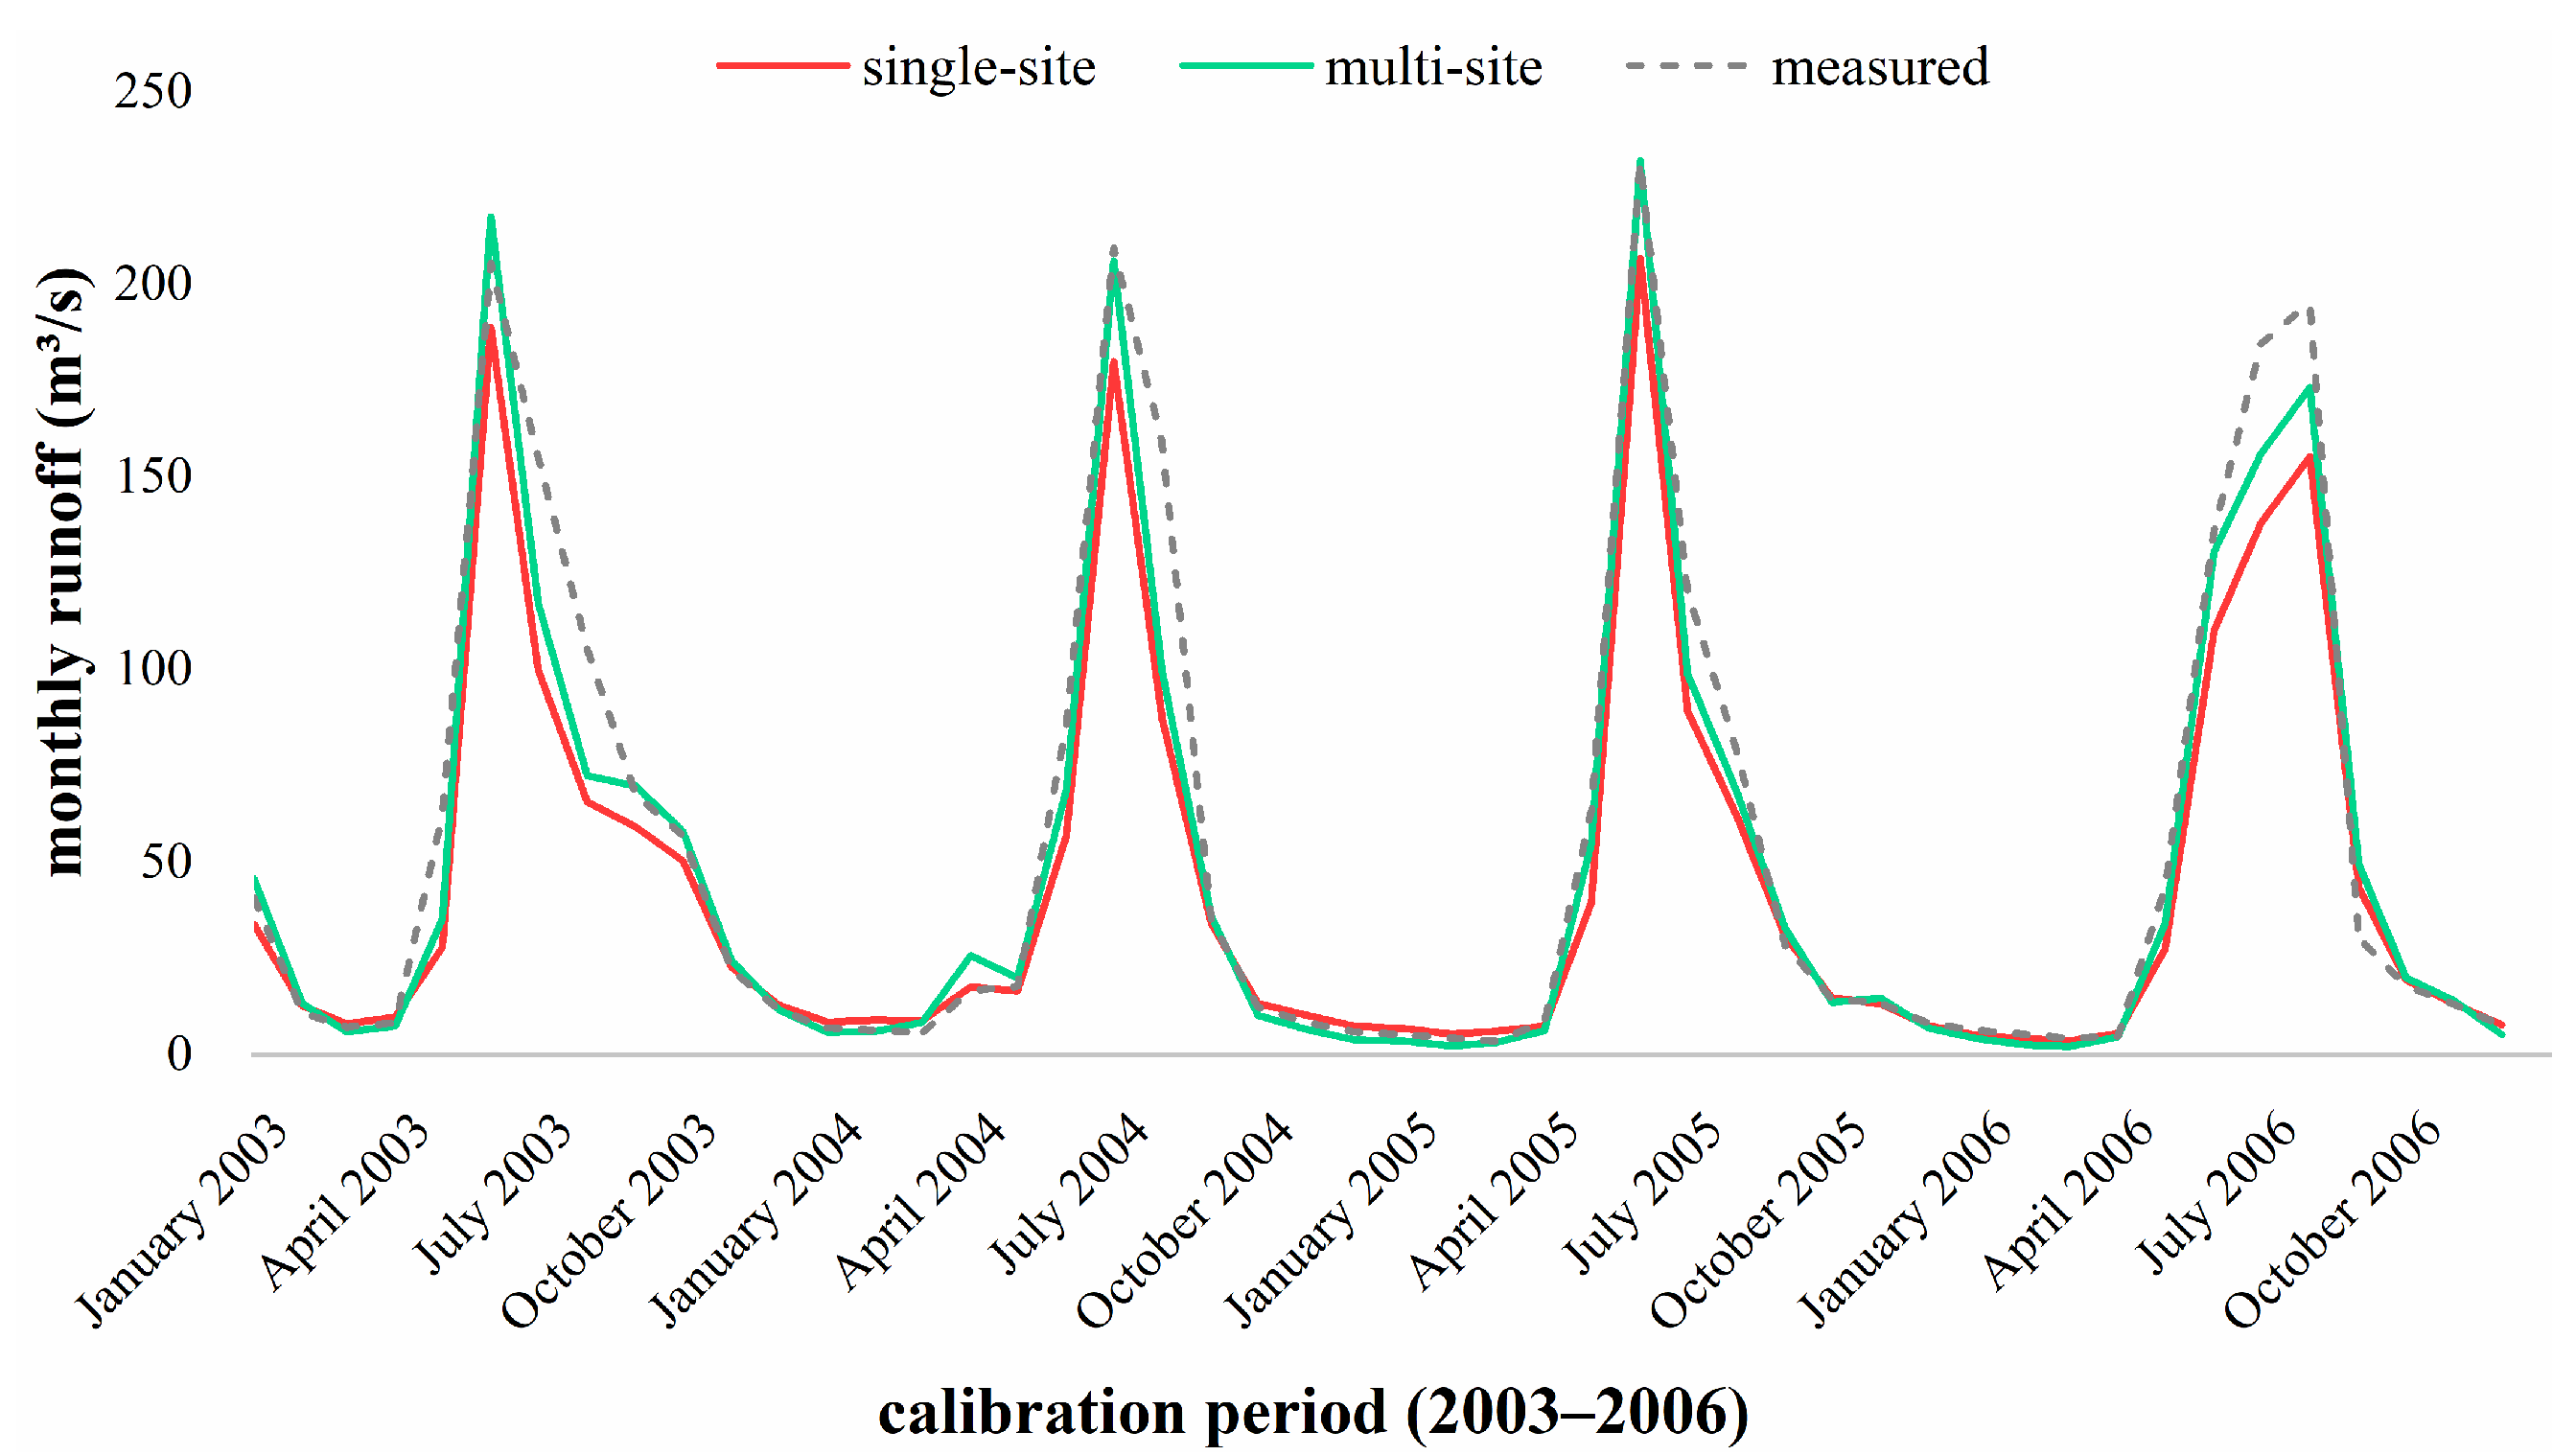
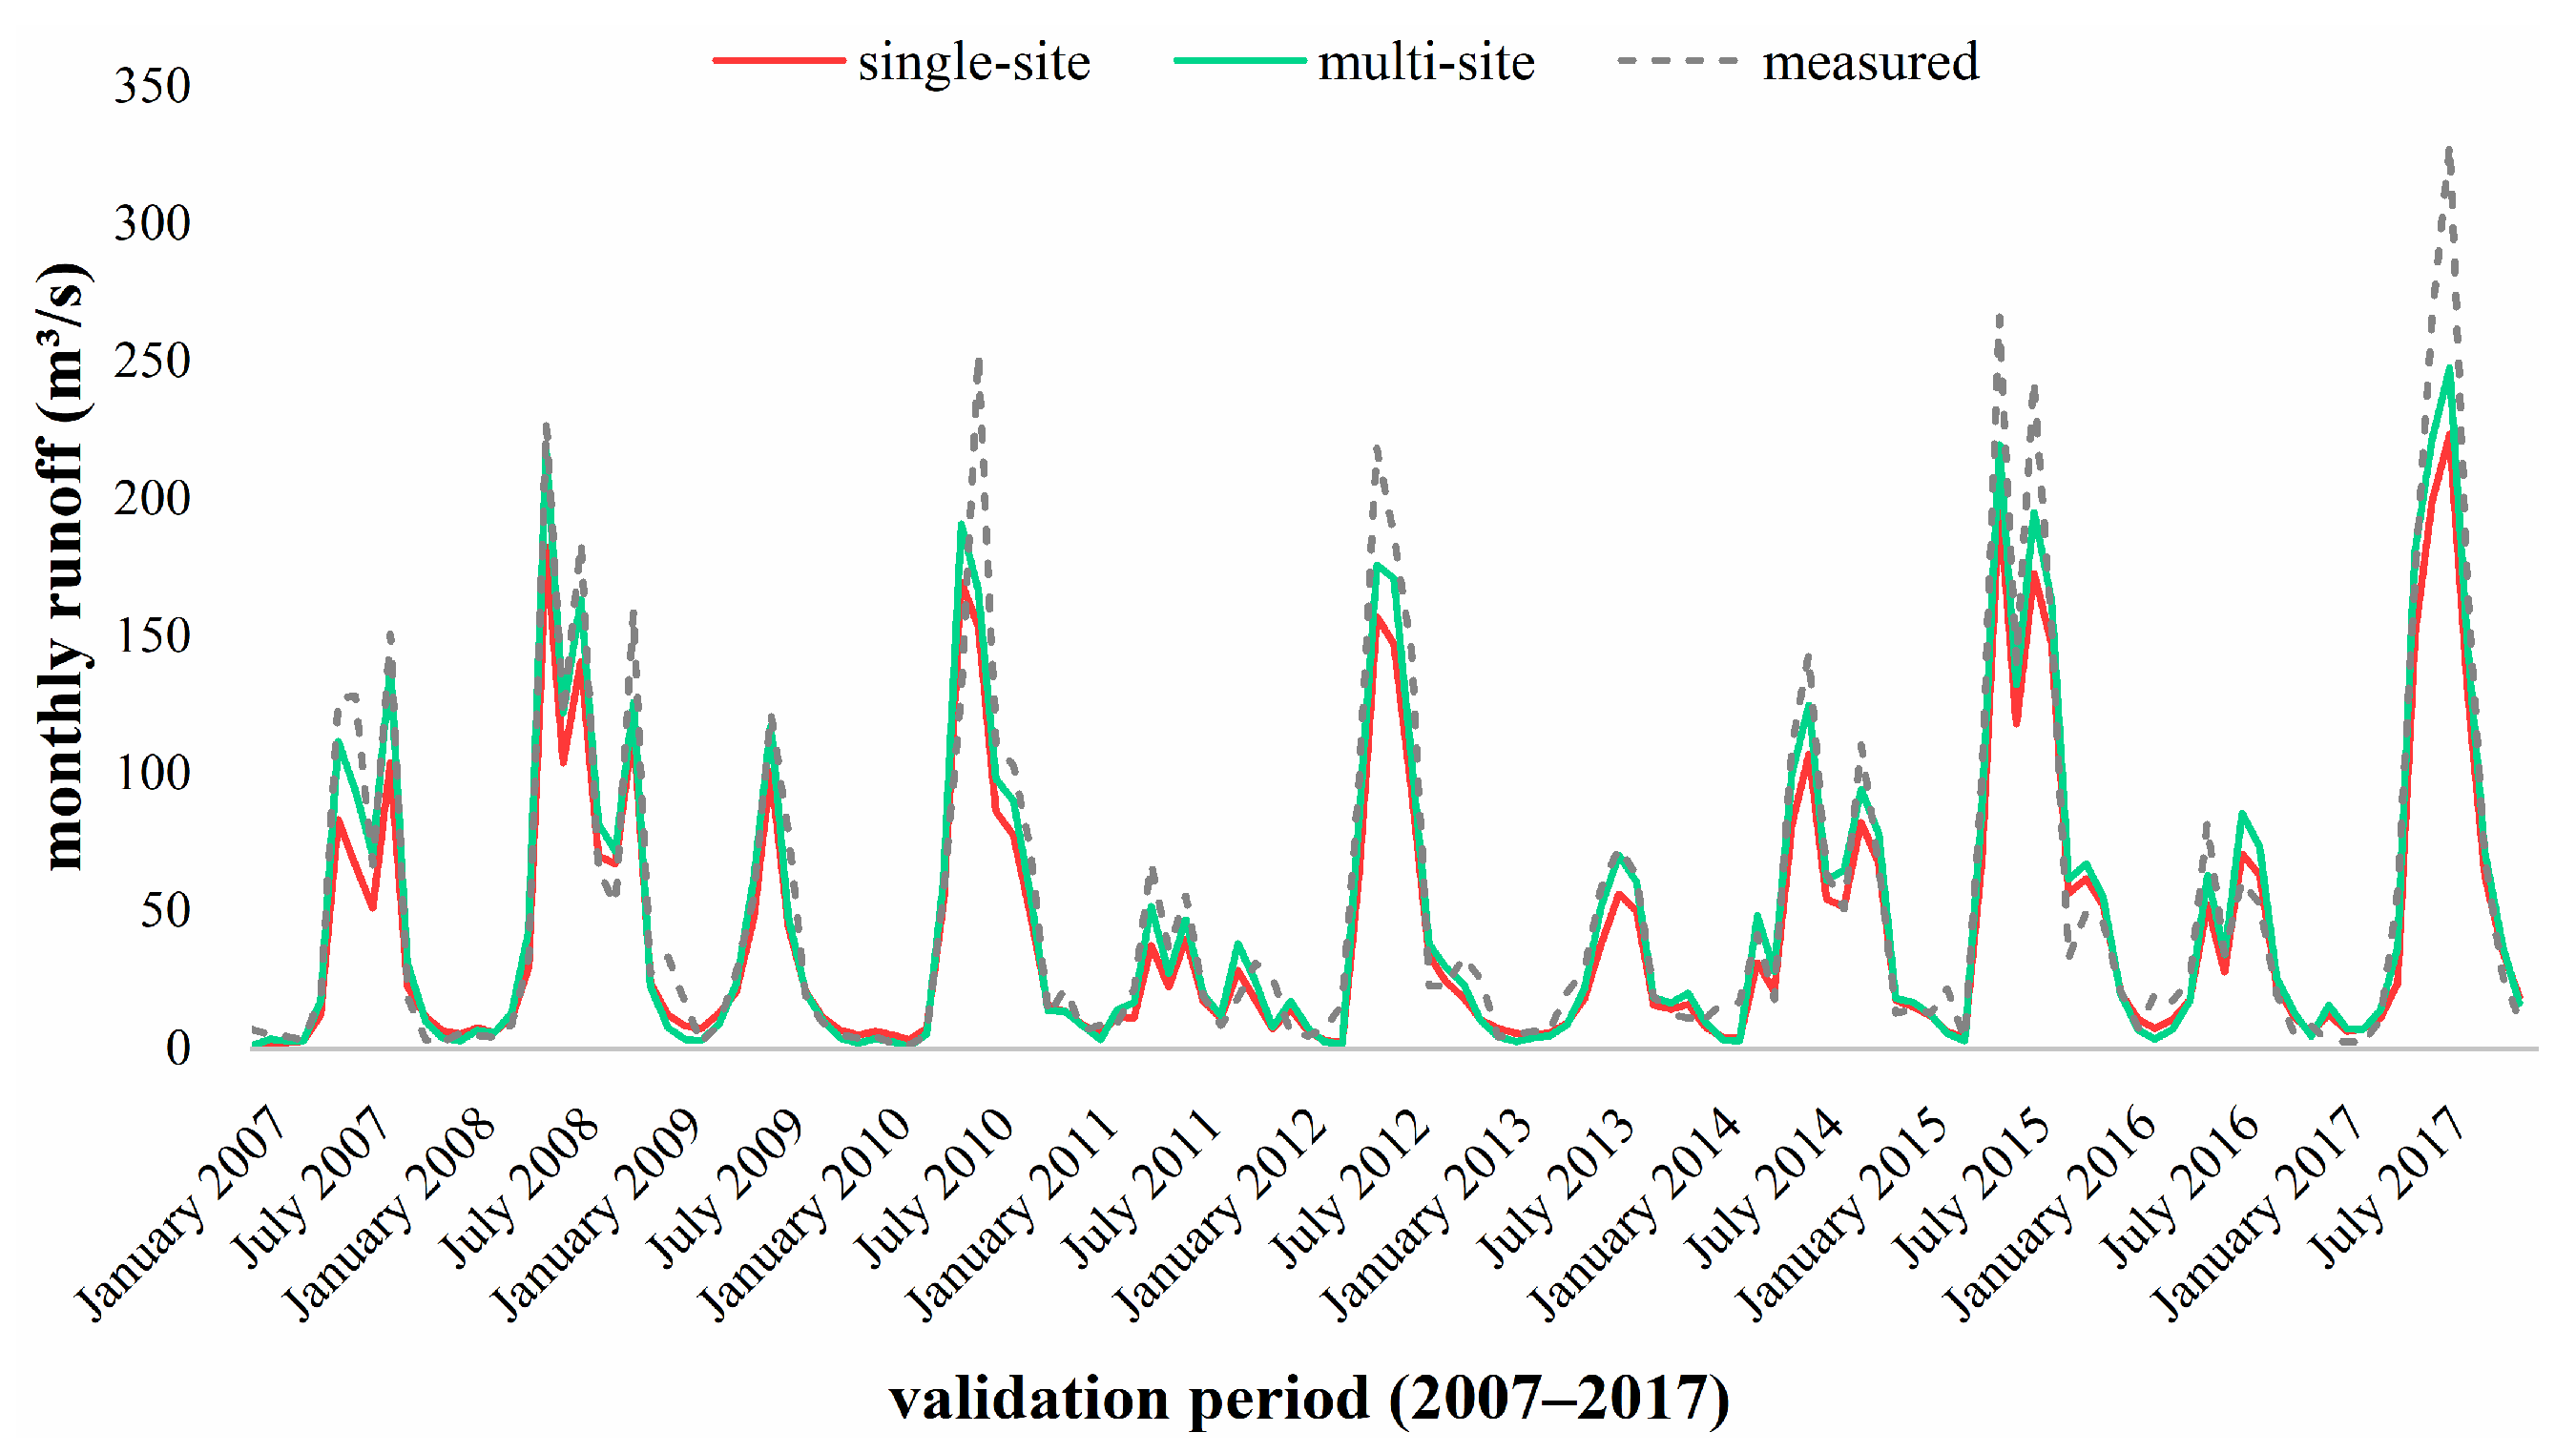
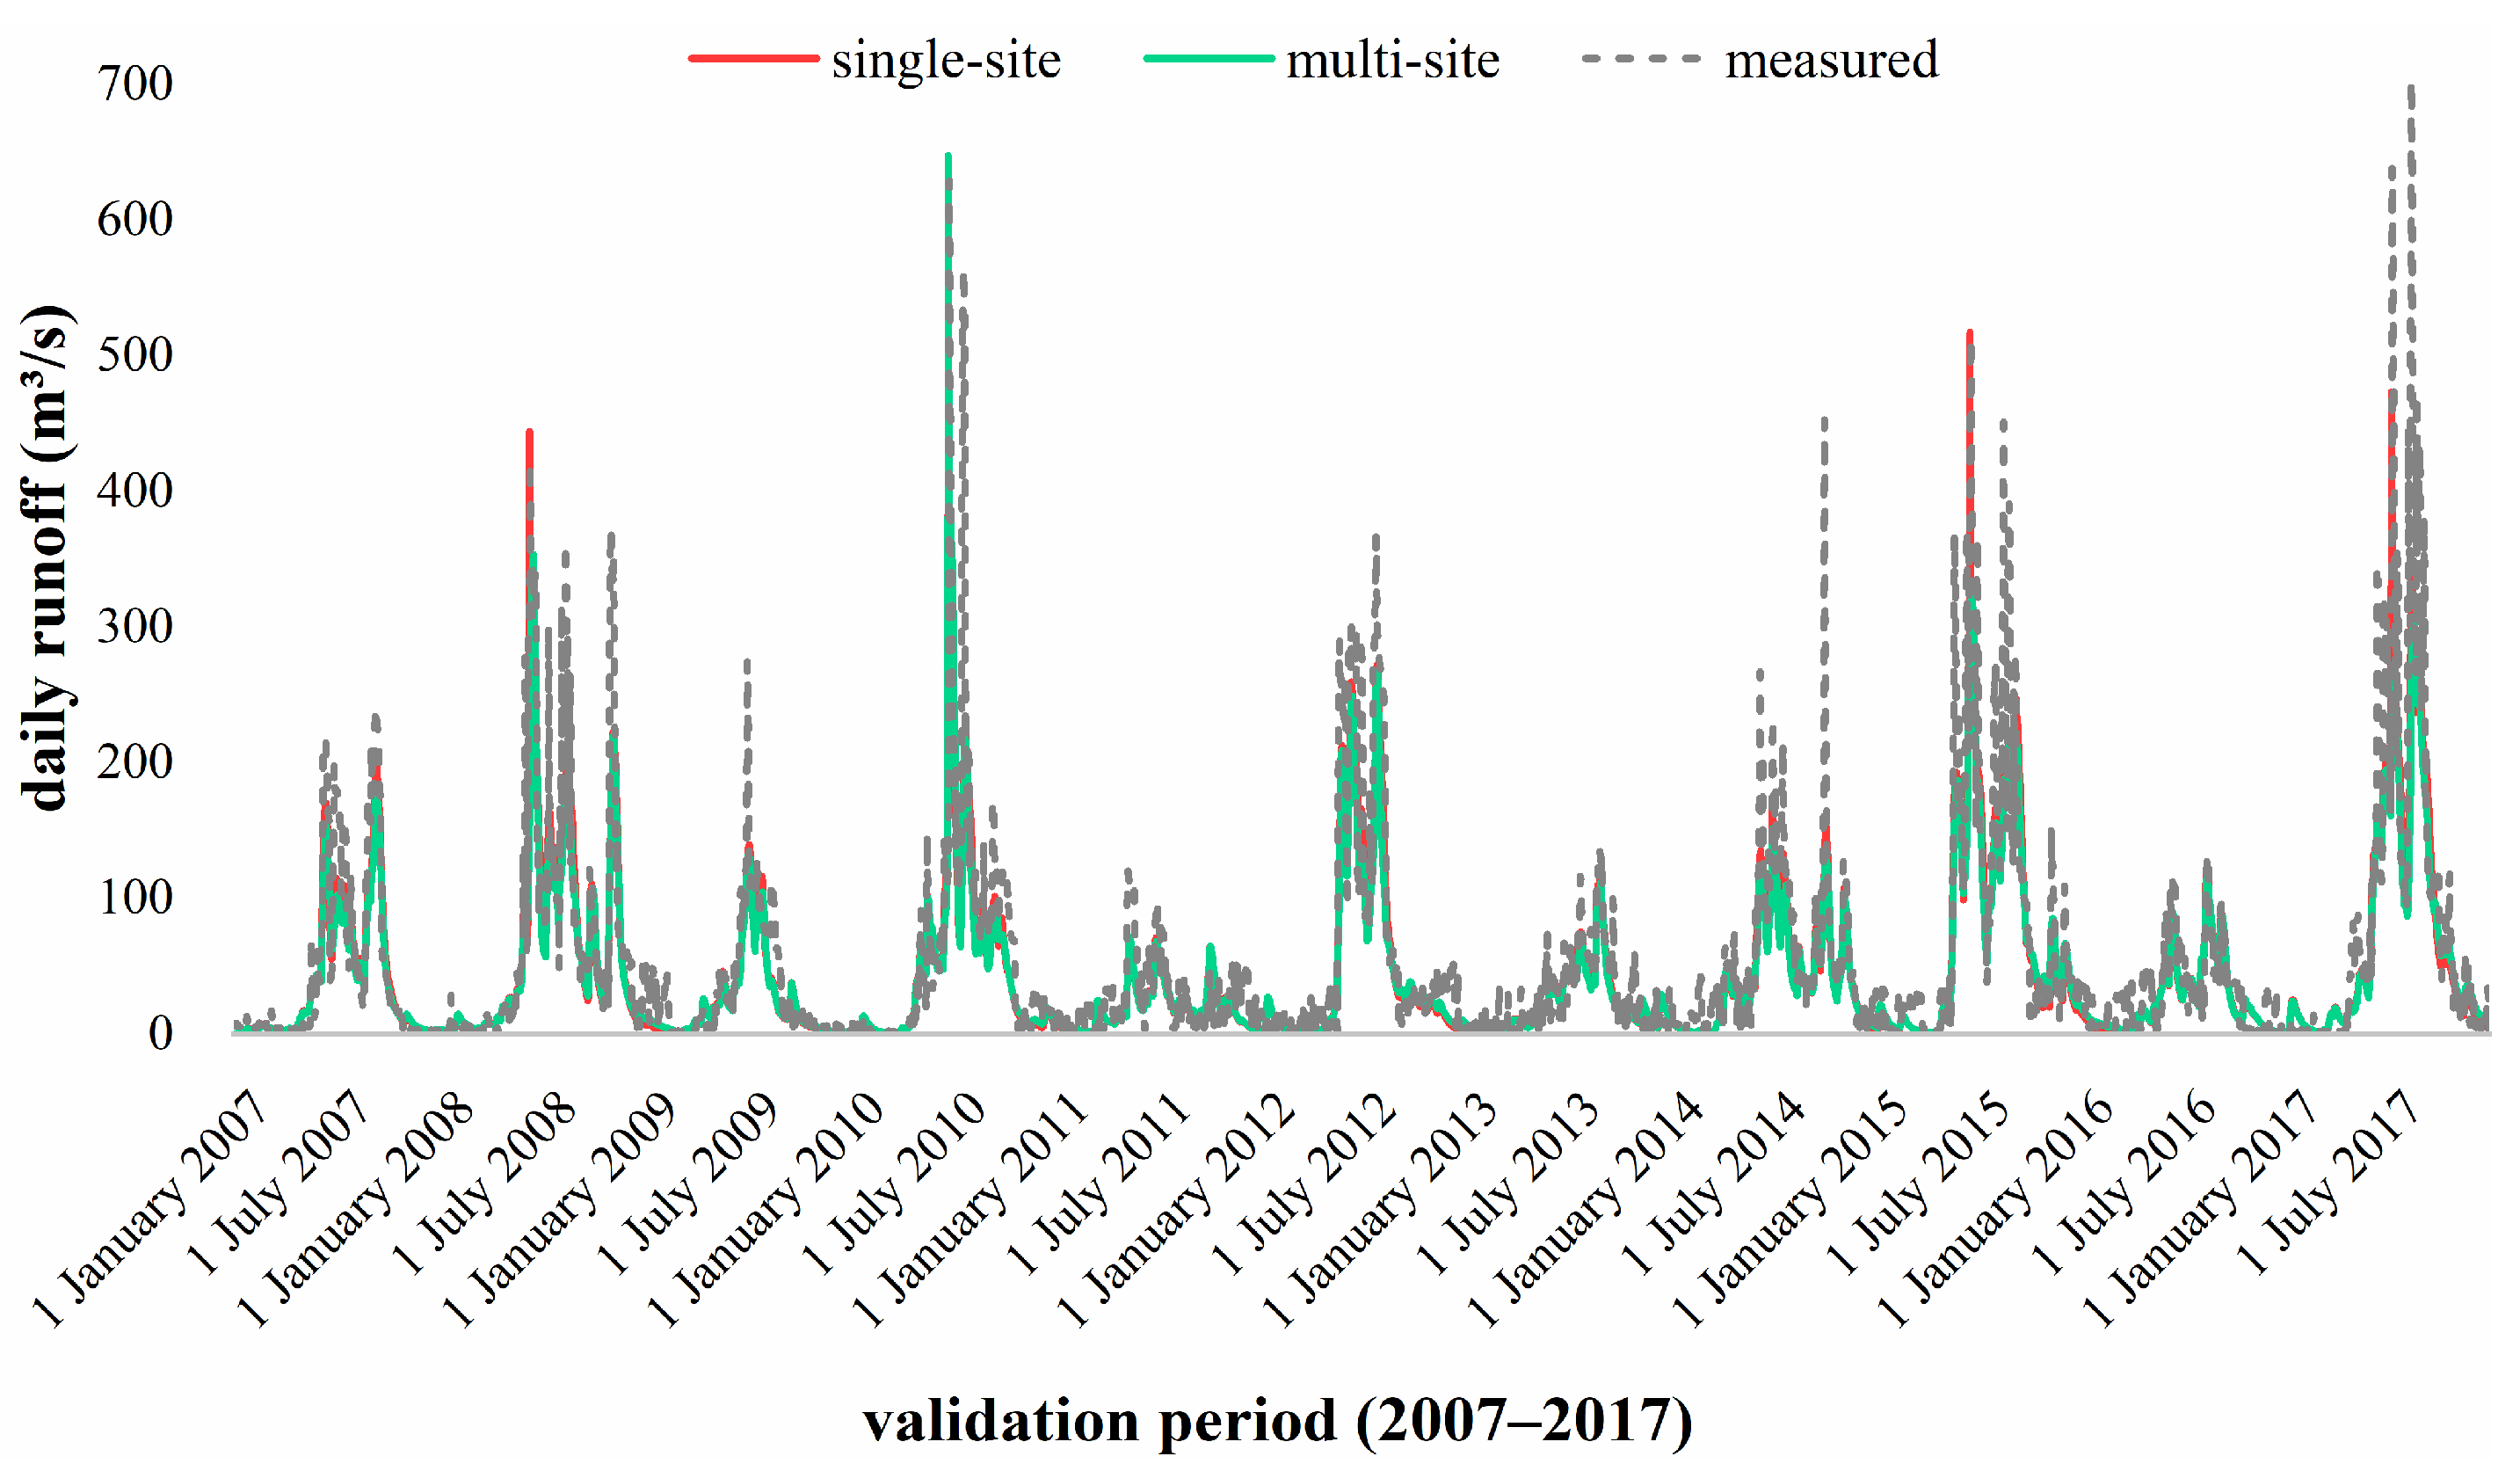
4.2. Comparison of Different Calibration Methods

The parameters calibrated by the single-site and multi-site methods were input into the SWAT model separately, and the SWAT model was re-run with monthly-scale measured rainfall data to obtain simulated monthly runoff corresponding to different calibrating methods. They were compared with the measured runoff collected from the hydrometric stations; the results during the calibration period 2003–2006 are shown in Figure 6, and the results during the validation period 2007–2017 are shown in Figure 7. In combination with Figure 6 and Figure 7, the results indicate that both the single-site and multi-site calibration methods successfully drove the model for runoff simulation on the monthly scale, and the SWAT model behaves well in the study area after calibration. The runoff values simulated by single-site calibrated models and multi-site calibrated models were generally similar to the hydrological hydrograph of the measured values. However, noticeable differences could be seen for the extreme values of the simulation results. Although there are overestimates and underestimates, the annual extreme values of the simulated runoff with the multi-site calibration model are closer to the measured values than those with the single-site calibration model.
Table 5 exhibits the values of evaluation indicators of simulation accuracy. According to the evaluation criteria mentioned in Section 2, the single-site and multi-site methods both achieved outstanding performance for the calibration and the validation periods, with the NSE values ranging from 0.867 to 0.953, higher than 0.75, at the Very Good grade. In addition, the R2 and NSE values of the simulated runoff with the multi-site calibration model are slightly higher than those with the single-site calibration model; both in the calibration period and in the validation period, the increase in the values indicates the increase in simulation accuracy. This beneficial effect could also be reflected by the Re, which, of the simulated runoff with the multi-site calibration model, are closer to zero. Overall, the rules deduced by the values of the validation period remain consistent with the rules of the calibration period; the multi-site calibration model achieved a better statistical performance. This also coincides with the simulation curves in Figure 6 and Figure 7.
Due to the inhomogeneous spatial distribution of geographical features over the basin, the data from a single site used in calibration cannot well represent the whole basin. The uncertainty of parameters could be reduced by adding more sites in calibration. On the monthly scale, the simulation accuracy was improved through using the multi-site calibration method.
The parameters calibrated by the single-site and multi-site methods were input into the SWAT model separately, and the SWAT model was re-run with the daily-scale measured rainfall data to obtain simulated daily runoff corresponding to different calibrating methods. They were compared with the measured runoff collected from the hydrometric stations; the results during the calibration period 2003–2006 are shown in Figure 8, and the results during the validation period 2007–2017 are shown in Figure 9. The runoff curves simulated with the single-site calibration model and multi-site calibration model could basically reflect the rise and fall and cyclical change of the measured runoff. However, some underestimations of the peak values appeared in both simulated curves; for example, in the flood seasons of 2003, 2005, and 2008, the peak values were significantly lower than the measured values. In the flood season of 2008, the extreme value of the simulated runoff from the single-site calibration method was slightly overestimated. Overall, compared to the monthly runoff process, the fitting degree between the daily simulated discharge curves and the daily measured discharge curves decreased.
Table 6 exhibits the values of evaluation indicators of simulation accuracy. On the daily scale, the NSE values of the single-site method and multi-site method in the calibration and validation periods declined corresponding to those on the monthly scale. Among them, the NSE values of the single-site method and the multi-site method in the validation period are 0.681 and 0.743, lower than 0.75, dropping a grade. It may be caused by the increased cumulative errors of the model due to the longer time series of the daily-scale data. Comparing the performances of the two methods on the daily scale, the multi-site calibrated model still achieved better simulation performance.

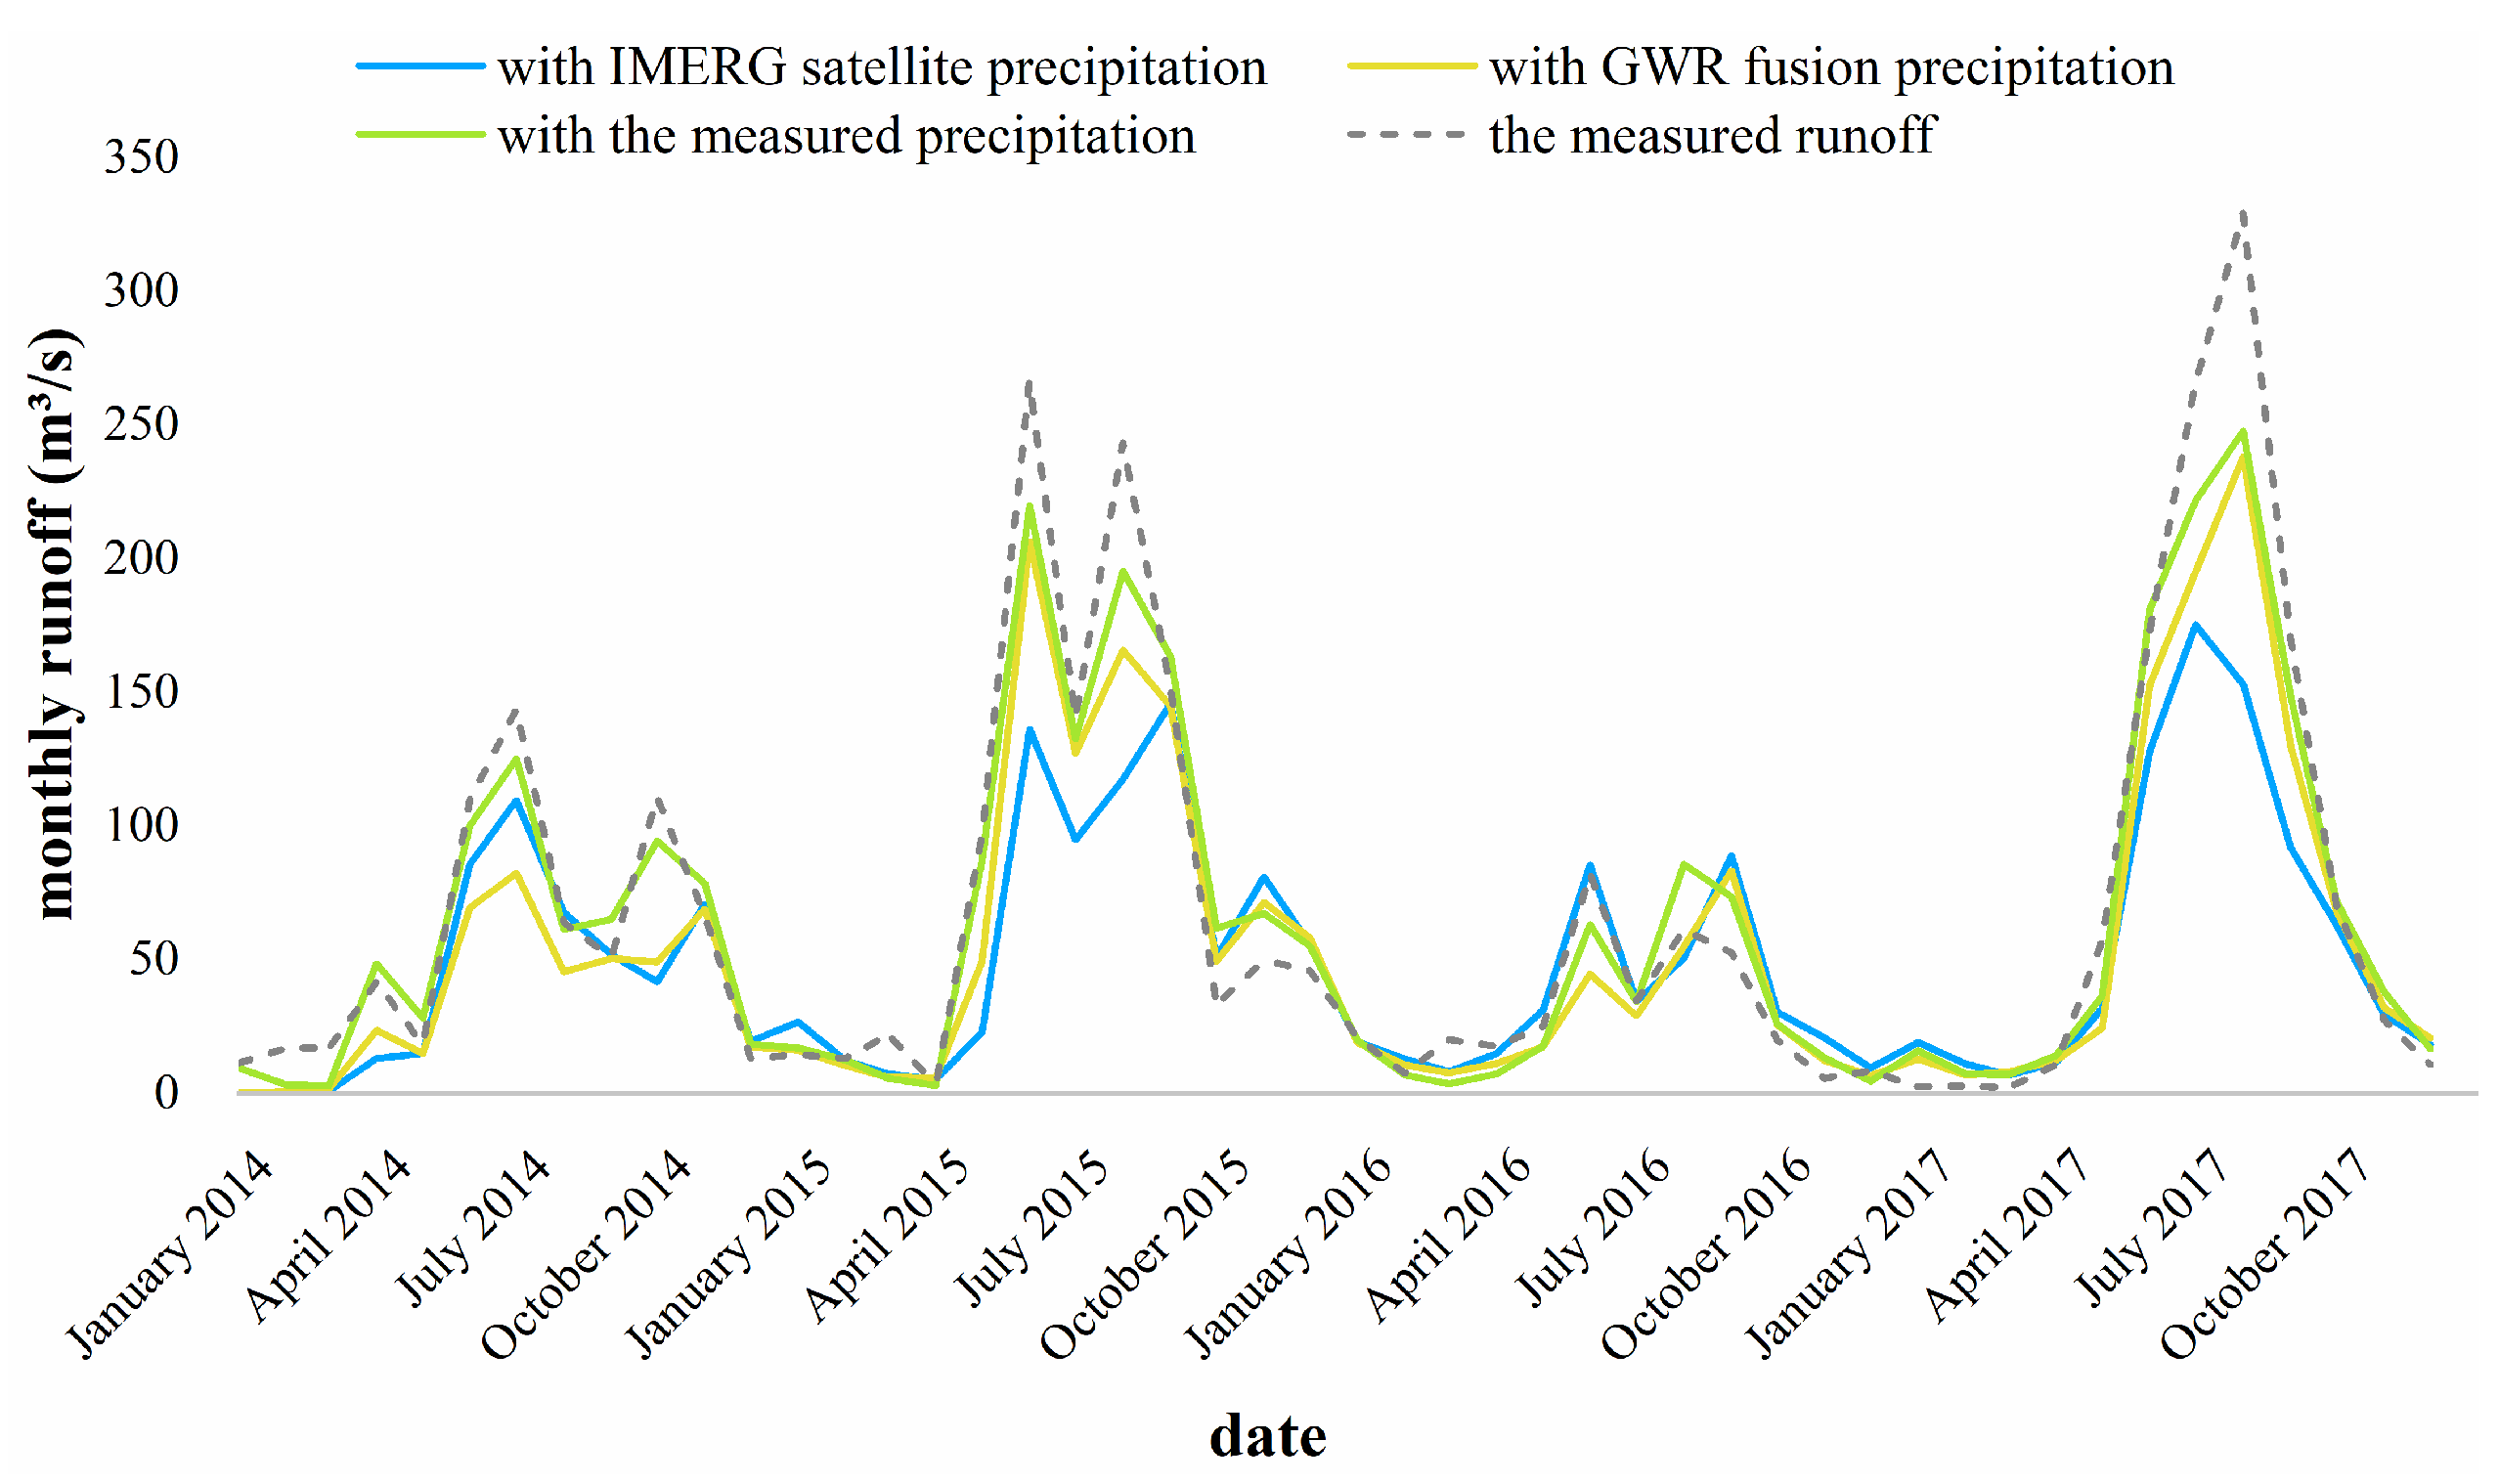
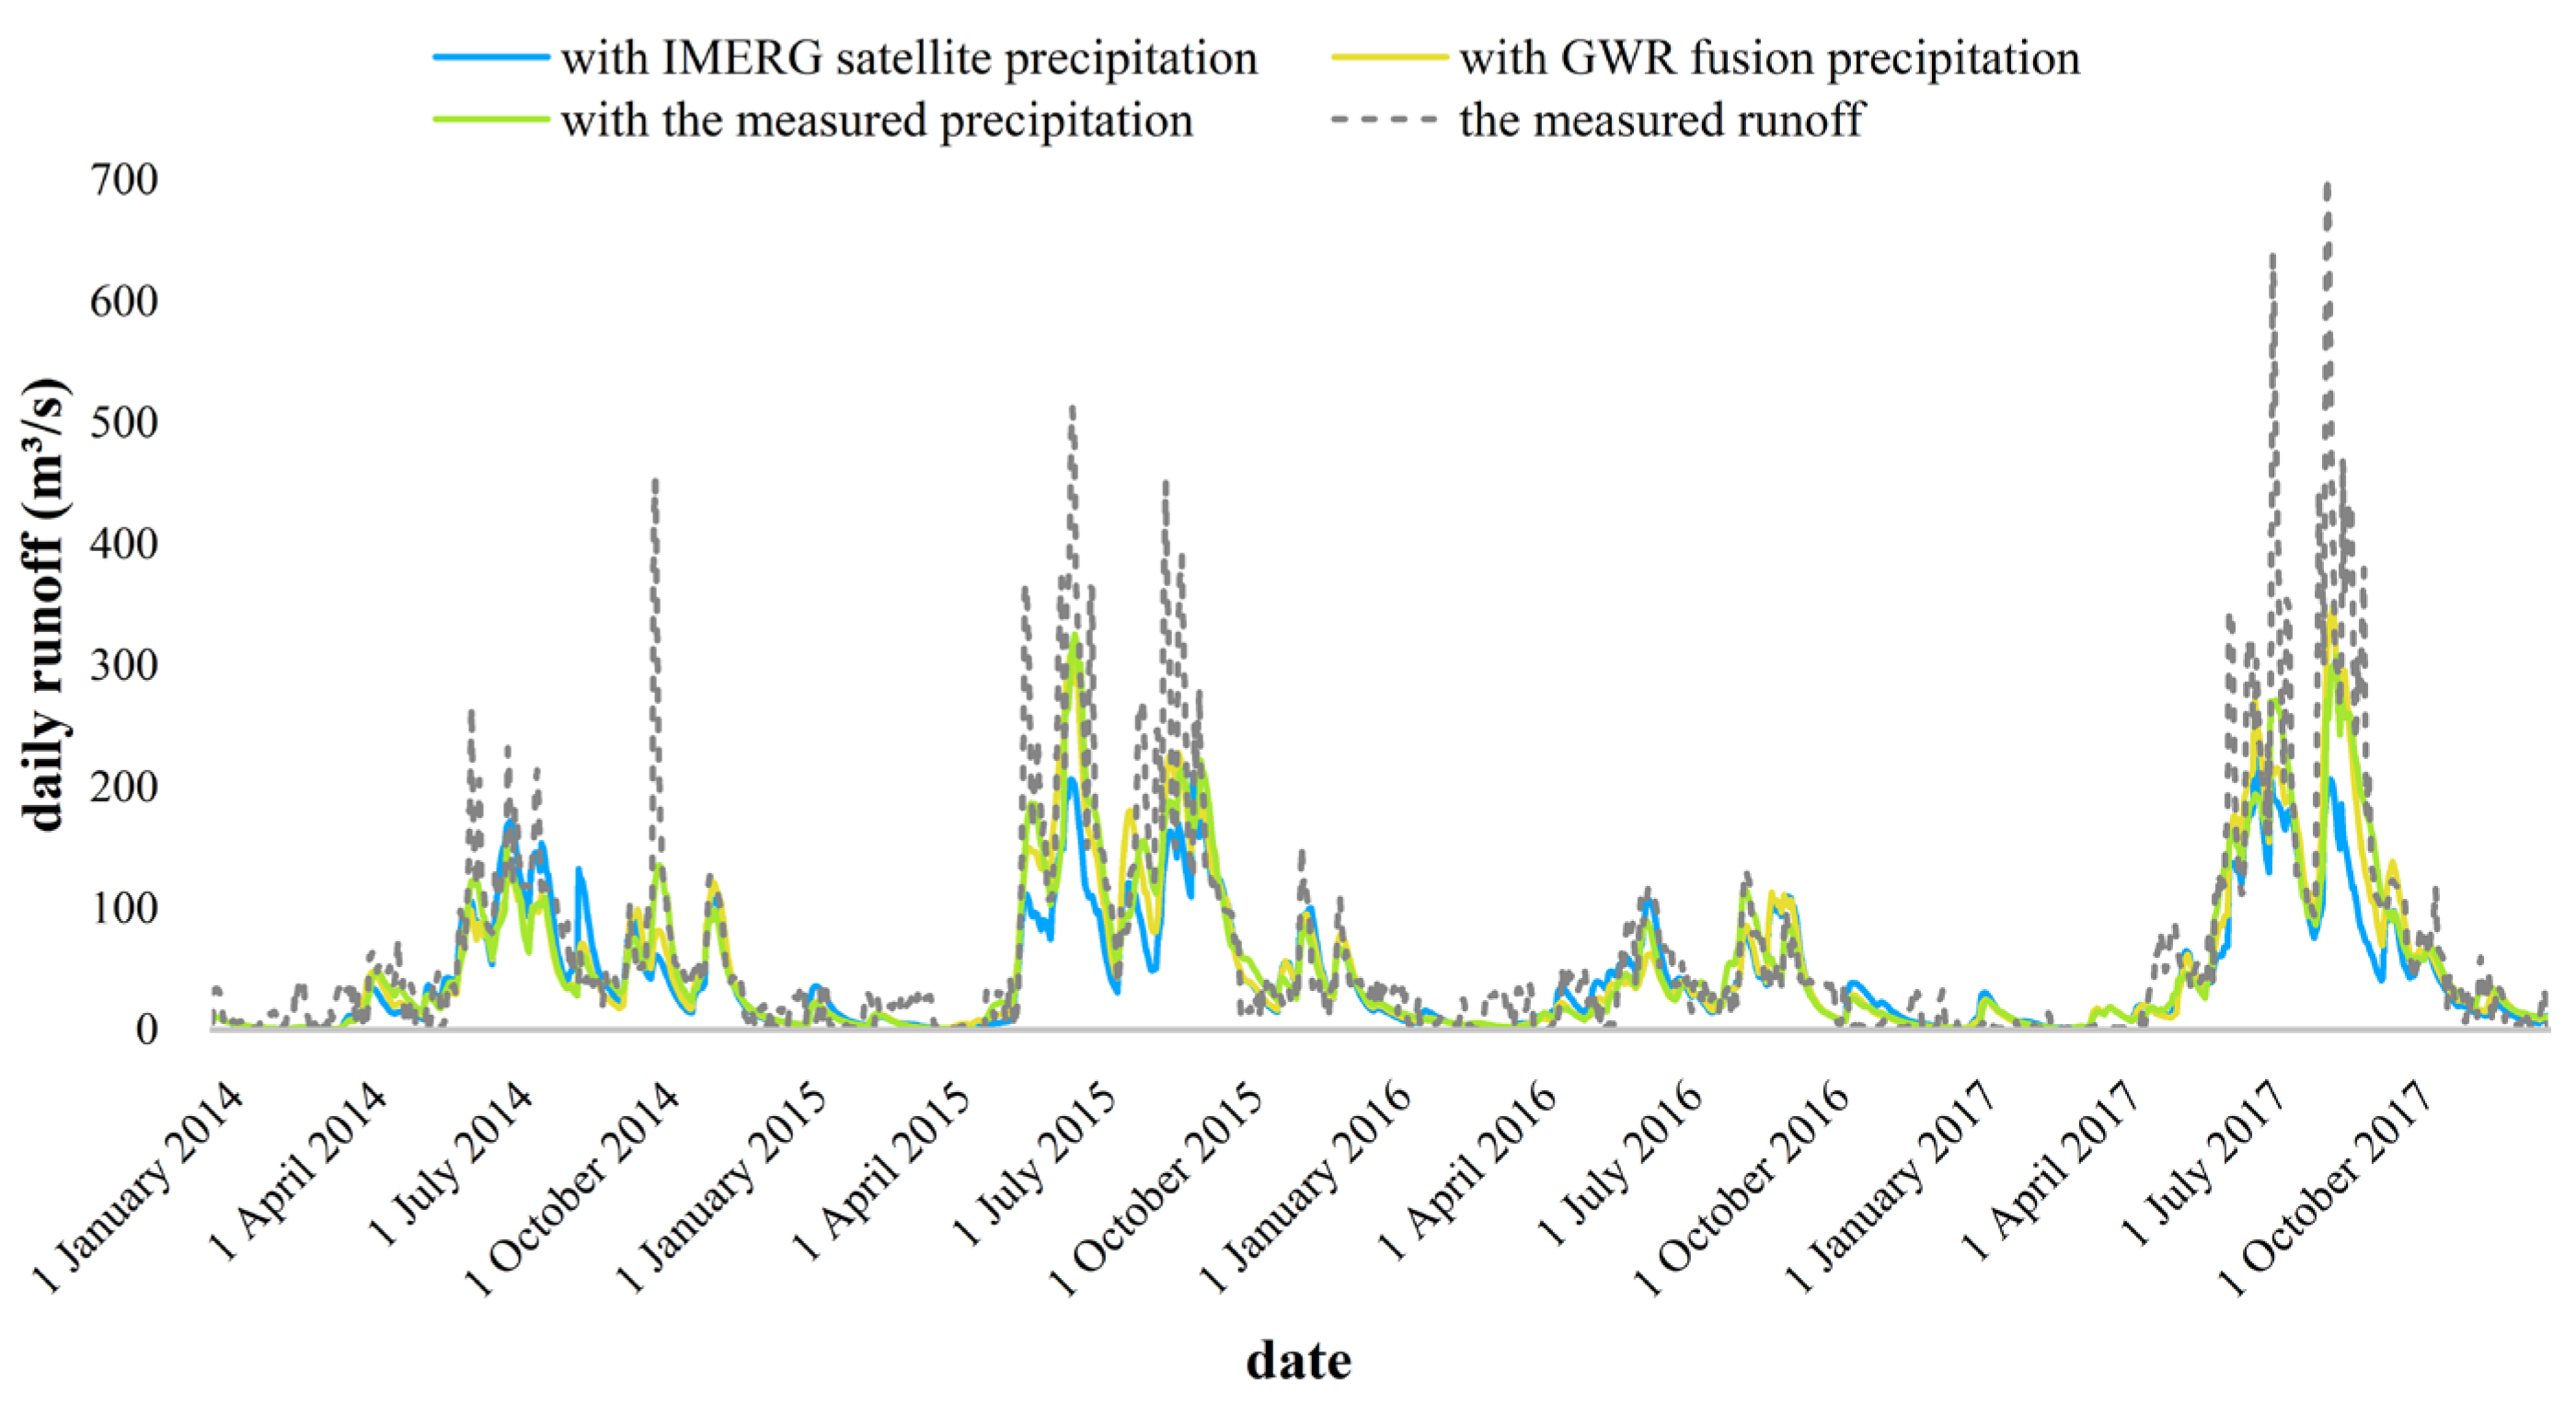
4.3. Comparison of Different Rainfall Inputs

According to the results of different calibration methods, the model calibrated by the multi-site method had better performance. Therefore, for comparing the simulation results of different rainfall data, the SWAT model was firstly calibrated by the multi-site method, and then the measured rainfall data of the rainfall stations, IMERG satellite rainfall data, and GWR fusion rainfall data were input into the calibrated model for runoff simulation in the validation period. They were compared with the measured runoff collected from the hydrometric stations; the results on the monthly scale are shown in Figure 10, the results on the daily scale are shown in Figure 11, and the corresponding values of evaluation indicators of simulation accuracy are shown in Table 7.
In general, on both a monthly and daily scale, the accuracy of GWR fusion rainfall data and the measured rainfall data were greatly improved compared with IMERG satellite rainfall data; they were more suitable for hydrological simulation in karst areas, and the measured rainfall data performed better. In practical application, the satellite rainfall data need to be fusion-processed first. As for areas lacking the measured rainfall data, the fusion rainfall data is a good alternative scheme.
On the monthly scale, comparing the model performances of different rainfall data with figures of simulated runoff and values of evaluation indicators, the results showed that the original IMERG satellite rainfall data performed worst, with the lowest NSE value of 0.660, lower than 0.75, at the Good grade, while GWR fusion rainfall data and the measured rainfall data outperformed it, with the NSE values of 0.854 and 0.933, higher than 0.75, at the Very good grade, indicating that larger error exists in original satellite rainfall data, causing larger uncertainty in hydrological simulation. The uncertainty could be reduced by the GWR fusion method, and the simulation effect was obviously improved. Comparing the model performances of GWR fusion rainfall data and the measured rainfall data, it could be found that the simulation accuracy of the measured rainfall data was higher, indicating that the measured rainfall data of the rainfall stations still represented the most reliable data source in hydrological simulation.
On the daily scale, generally speaking, compared with the monthly scale, the values of R2 and NSE decreased and the absolute values of Re increased correspondingly, which indicates that model performance of multi-source rainfall data on a daily scale was slightly worse than that on a monthly scale. Specifically, the simulation effect of IMERG satellite rainfall data was still the worst, with the NSE value of 0.534, lower than 0.65, at the Satisfactory grade, while GWR fusion rainfall data and the measured rainfall data performed better, with the NSE values of 0.717 and 0.740, between 0.65 and 0.75, at the Good grade. Comparing the three rainfall inputs, similar conclusions to that on the monthly scale could be inferred. That is, the original IMERG satellite rainfall data had larger uncertainty when applied to hydrological simulation, after GWR fusion processing, uncertainty could be reduced, and the simulation effect could be obviously improved. According to ranges of evaluation indicators, the simulation accuracy of GWR fusion rainfall data could reach the same level as that of the measured rainfall data. Moreover, comparing the specific values of the evaluation indicators, the simulation accuracy of the measured rainfall data was the best.

5. Discussion

Determination of more accurate simulation schemes is important when the hydrological model is applied in karst basins with heterogeneous physical properties and irregular complex flow patterns [48]. In this study, after conducting single-site and multi-site calibration, the model performance was analyzed. With different rainfall inputs driving the model, the calibration methods and rainfall inputs were combined to explore their effects on the hydrological simulation in karst areas.
Comparing the runoff values simulated by the single-site calibration method and multi-site calibration method through runoff graphs and indicators of accuracy evaluation, it was found that the simulation accuracy of the multi-site calibration method was always better than that of the single-site calibration method, whether on the daily or monthly scale, in the calibration period or validation period. Similar to previous studies [21,22,49], more reasonable parameters were obtained through a multi-site calibration method. Therefore, the hydrological simulation effect was also improved. Due to the equifinality [50] of different model parameters [51], it was inaccurate to simulate the hydrological process only using the data of the general outlet of the basin for model calibration. By increasing the number of hydrometric stations used in calibration and introducing the data of sub-basin stations, the spatial heterogeneity could be better reflected, and the simulation accuracy of the hydrological process could be improved through the multi-site calibration method.
Comparing the simulated runoff values with multi-source rainfall data in the Chengbi River basin benefited from the basis that the model was more accurately calibrated by the multi-site method at first; the NSE values of the simulated runoff with the three rainfall inputs were all higher than 0.5 on the monthly and daily scales. In addition, the results showed that the measured rainfall data performed best, followed by GWR fusion rainfall data; IMERG satellite rainfall data performed worst among the three. Using satellite rainfall data became popular in hydrology research because of its advantages such as easy access, extensive coverage, and uniform spatial and temporal distribution, but as indirect data, errors are inevitable [32,52], which meant that satellite rainfall data directly inputted into the hydrological model for simulation was not accurate enough. In this study, the simulation accuracy of GWR fusion rainfall data was greatly improved compared to that of IMERG satellite rainfall data and was close to that of the measured rainfall data on the daily scale, indicating that fusion processing was necessary to improve the data accuracy and achieve better simulation results. The GWR method could integrate spatial variables such as the geographical location, topography, and vegetation into spatial rainfall estimation, reflecting the spatial nonstationary of these data [53], and could thus enhance the reliability and reduce the uncertainty. As the measured rainfall data were the real rainfall data measured directly, did not include the error incurred by satellite observation, and were not influenced by the topography, climate, rain intensity, and other factors, it showed the optimal simulation performance.
The possibility of optimizing the hydrological model and improving the simulation accuracy was discussed from two aspects of model calibration and rainfall data inputs in this study. The results showed that the multi-site calibration method could improve the simulation accuracy, and the measured rainfall data represented the most reliable data source; such a hydrological simulation scheme with high accuracy was optimized in the basin. Moreover, the simulation performance of GWR fusion rainfall data was also satisfactory. Therefore, attention should be paid to the rational use of satellite data in the process of seeking alternatives, especially in lacking data areas. The focus of the next research is how to better fuse and correct the satellite data to obtain stable and better simulation performance.
In this study, the hydrological model was optimized by combining calibration methods and rainfall data inputs; the multi-site calibration method and fusion rainfall data were innovatively used in the Chengbi River basin, and the simulation results were compared through various evaluation indicators. However, due to the limitation of the area of the basin (there are only three hydrometric stations in the Chengbi River basin), it is difficult to further investigate the influence of the spatial relationships of hydrometric stations on the multi-site calibration method. Further research should be carried out in a larger basin. In addition, more fusion methods for satellite data are worth trying.

6. Conclusions

The calibration of model parameters and the rainfall data inputs greatly affect the accuracy of hydrological simulation. Therefore, in this study, the SWAT model was established in a karst basin to evaluate the simulation effects of different calibration methods and different rainfall inputs.
The results of different calibration methods showed that the multi-site calibration method outperformed the single-site calibration method on both monthly and daily scales. The results of different rainfall inputs showed that the simulation accuracy of original IMERG satellite rainfall data was the lowest and that of the fused rainfall data processed by GWR was greatly improved on the monthly and daily scale. The simulation accuracy of the measured rainfall data was the highest.
In general, the model simulation accuracy could be improved by improving the model calibration method and the input of rainfall data. The multi-site method for parameter calibration could improve the simulation effect of the SWAT model and increase the simulation accuracy compared with the single-site method. The simulation accuracy of the fusion rainfall data processed by the GWR method was higher than that of IMERG satellite rainfall data and was close to that of the measured rainfall data. Through this study, a hydrological simulation scheme suitable for the karst basin was selected, which provided reference for subsequent research and also provided alternative schemes for hydrological simulation in other lacking data areas.

Author Contributions

Conceptualization, C.M., X.C., X.L. and Y.R.; methodology, X.C., X.L. and Y.W.; software, Y.W.; validation, X.C. and Y.W.; formal analysis, X.L. and Y.R.; investigation, S.L. and Z.X; resources, C.M.; data curation, X.C.; writing—original draft preparation, X.C. and Y.W.; writing—review and editing, X.L. and Y.R.; visualization, X.C.; supervision, C.M. and Z.X.; project administration, C.M. and Z.X.; funding acquisition, C.M. and Z.X. All authors have read and agreed to the published version of the manuscript.

Funding

This research was supported by the National Natural Science Foundation of China (51969004 and 51979038), the Interdisciplinary Scientific Research Foundation of Guangxi University (Grant No.2022JCC028), and the Innovation Project of Guangxi Graduate Education (YCBZ2019022).

Institutional Review Board Statement

Not applicable.

Informed Consent Statement

Not applicable.

Data Availability Statement

The data that support the findings of this study are available from the corresponding author upon reasonable request.

Conflicts of Interest

The authors declare no conflict of interest.

References

  1. Chawanda, C.J.; Arnold, J.; Thiery, W.; van Griensven, A. Mass balance calibration and reservoir representations for large-scale hydrological impact studies using SWAT. Clim. Change 2020, 163, 1307–1327. [Google Scholar] [CrossRef]
  2. Jakada, H.; Chen, Z.H. An approach to runoff modelling in small karst watersheds using the SWAT model. Arab. J. Geosci. 2020, 13, 1–18. [Google Scholar] [CrossRef]
  3. Gumindoga, W.; Rientjes, T.H.M.; Haile, A.T.; Dube, T. Predicting streamflow for land cover changes in the Upper Gilgel Abay River Basin, Ethiopia: A TOPMODEL based approach. Phys. Chem. Earth 2014, 76–78, 3–15. [Google Scholar] [CrossRef]
  4. Park, D.; Fan, H.J.; Zhu, J.J.; Oh, S.E.; Um, M.J.; Jung, K. Evaluation of reliable digital elevation model resolution for TOPMODEL in two mountainous watersheds, South Korea. Appl. Sci. 2019, 9, 3690. [Google Scholar] [CrossRef] [Green Version]
  5. Paparrizos, S.; Maris, F. Hydrological simulation of Sperchios River basin in Central Greece using the MIKE SHE model and geographic information systems. Appl. Water Sci. 2017, 7, 591–599. [Google Scholar] [CrossRef] [Green Version]
  6. Ramteke, G.; Singh, R.; Chatterjee, C. Assessing impacts of conservation measures on watershed hydrology using MIKE SHE model in the face of climate change. Water Resour. Manag. 2020, 34, 4233–4252. [Google Scholar] [CrossRef]
  7. Hengade, N.; Eldho, T.I.; Ghosh, S. Climate change impact assessment of a river basin using CMIP5 climate models and the VIC hydrological model. Hydrol. Sci. J. 2018, 63, 596–614. [Google Scholar] [CrossRef]
  8. Maza, M.; Srivastava, A.; Bisht, D.S.; Raghuwanshi, N.S.; Bandyopadhyay, A.; Chatterjee, C.; Bhadra, A. Simulating hydrological response of a monsoon dominated reservoir catchment and command with heterogeneous cropping pattern using VIC model. J. Earth Syst. Sci. 2020, 129, 1–16. [Google Scholar] [CrossRef]
  9. Krysanova, V.; White, M. Advances in water resources assessment with SWAT—An overview. Hydrol. Sci. J. 2015, 60, 771–783. [Google Scholar] [CrossRef] [Green Version]
  10. Khoi, D.N.; Suetsugi, T. Impact of climate and land-use changes on hydrological processes and sediment yield—A case study of the Be River catchment, Vietnam. Hydrol. Sci. J. 2014, 59, 1095–1108. [Google Scholar] [CrossRef]
  11. Akhavan, S.; Abedi-Koupai, J.; Mousavi, S.F.; Afyuni, M.; Eslamian, S.S.; Abbaspour, K.C. Application of SWAT model to investigate nitrate leaching in Hamadan-Bahar Watershed, Iran. Agric. Ecosyst. Environ. 2010, 139, 675–688. [Google Scholar] [CrossRef]
  12. Akoko, G.; Le, T.H.; Gomi, T.; Kato, T. A Review of SWAT model application in Africa. Water 2021, 13, 1313. [Google Scholar] [CrossRef]
  13. Dutta, P.; Sarma, A.K. Hydrological modeling as a tool for water resources management of the data-scarce Brahmaputra basin. J. Water Clim. Change 2021, 12, 152–165. [Google Scholar] [CrossRef] [Green Version]
  14. Dile, Y.T.; Ayana, E.K.; Worqlul, A.W.; Xie, H.; Srinivasan, R.; Lefore, N.; You, L.Z.; Clarke, N. Evaluating satellite-based evapotranspiration estimates for hydrological applications in data-scarce regions: A case in Ethiopia. Sci. Total Environ. 2020, 743, 140702. [Google Scholar] [CrossRef]
  15. Ji, G.X.; Lai, Z.Z.; Xia, H.B.; Liu, H.; Wang, Z. Future runoff variation and flood disaster prediction of the Yellow River Basin based on CA-Markov and SWAT. Land 2021, 10, 421. [Google Scholar] [CrossRef]
  16. Moges, E.; Demissie, Y.; Larsen, L.; Yassin, F. Review: Sources of Hydrological Model Uncertainties and Advances in Their Analysis. Water 2021, 13, 28. [Google Scholar] [CrossRef]
  17. Zhou, Q.; Chen, L.; Singh, V.P.; Zhou, J.; Chen, X.; Xiong, L. Rainfall-runoff simulation in karst dominated areas based on a coupled conceptual hydrological model. J. Hydrol. 2019, 573, 524–533. [Google Scholar] [CrossRef]
  18. Nikolaidis, N.P.; Bouraoui, F.; Bidoglio, G. Hydrologic and geochemical modeling of a karstic mediterranean watershed. J. Hydrol. 2013, 477, 129–138. [Google Scholar] [CrossRef]
  19. Geng, X.X.; Zhang, C.P.; Zhang, F.E.; Chen, Z.Y.; Nie, Z.L.; Liu, M. Hydrological modeling of karst watershed containing subterranean river using a modified SWAT model: A case study of the Daotian River Basin, southwest China. Water 2021, 13, 3552. [Google Scholar] [CrossRef]
  20. Hu, P.; Cai, T.J.; Sui, F.X.; Duan, L.L.; Man, X.L.; Cui, X.Q. Response of runoff to extreme land use change in the permafrost region of northeastern China. Forests 2021, 12, 1021. [Google Scholar] [CrossRef]
  21. Bai, J.W.; Shen, Z.Y.; Yan, T.Z. A comparison of single- and multi-site calibration and validation: A case study of SWAT in the Miyun Reservoir watershed, China. Front. Earth Sci. 2017, 11, 592–600. [Google Scholar] [CrossRef]
  22. Nkiaka, E.; Nawaz, N.R.; Lovett, J.C. Effect of single and multi-site calibration techniques on hydrological model performance, parameter estimation and predictive uncertainty: A case study in the Logone catchment, Lake Chad basin. Stoch. Environ. Res. Risk Assess. 2018, 32, 1665–1682. [Google Scholar] [CrossRef] [Green Version]
  23. Gong, Y.W.; Shen, Z.Y.; Liu, R.M.; Hong, Q.; Wu, X. A comparison of single- and multi-gauge based calibrations for hydrological modeling of the Upper Daning River watershed in China’s Three Gorges Reservoir Region. Hydrol. Res. 2012, 43, 822–832. [Google Scholar] [CrossRef]
  24. Azgin, S.T.; Celik, F.D. Evaluating surface runoff responses to land use changes in a data scarce basin: A case study in Palas Basin, Turkey. Water Resour. 2020, 47, 828–834. [Google Scholar] [CrossRef]
  25. Sadeghi, S.; Saghafian, B.; Najarchi, M. Assessment of impacts of change in land use and climatic variables on runoff in Tajan River Basin. Water Supply 2020, 20, 2779–2793. [Google Scholar] [CrossRef]
  26. Zhang, D.J.; Lin, Q.Y.; Chen, X.W.; Chai, T. Improved curve number estimation in SWAT by reflecting the effect of rainfall intensity on runoff generation. Water 2019, 11, 163. [Google Scholar] [CrossRef] [Green Version]
  27. Nepal, B.; Shrestha, D.; Sharma, S.; Shrestha, M.S.; Aryal, D.; Shrestha, N. Assessment of GPM-Era satellite products’ (IMERG and GSMaP) ability to detect precipitation extremes over mountainous country Nepal. Atmosphere 2021, 12, 254. [Google Scholar] [CrossRef]
  28. Lu, C.X.; Ye, J.; Fang, G.H.; Huang, X.F.; Yan, M. Assessment of GPM IMERG satellite precipitation estimation under complex climatic and topographic conditions. Atmosphere 2021, 12, 780. [Google Scholar] [CrossRef]
  29. Jiang, D.J.; Wang, K. The role of satellite-based remote sensing in improving simulated streamflow: A review. Water 2019, 11, 1615. [Google Scholar] [CrossRef] [Green Version]
  30. Setti, S.; Maheswaran, R.; Sridhar, V.; Barik, K.K.; Merz, B.; Agarwal, A. Inter-comparison of gauge-based gridded data, reanalysis and satellite precipitation product with an emphasis on hydrological modeling. Atmosphere 2020, 11, 1252. [Google Scholar] [CrossRef]
  31. Zhao, C.X.; Ren, L.L.; Yuan, F.; Zhang, L.M.; Jiang, S.H.; Shi, J.Y.; Chen, T.; Liu, S.Y.; Yang, X.L.; Liu, Y.; et al. Statistical and hydrological evaluations of multiple satellite precipitation products in the Yellow River Source Region of China. Water 2020, 12, 3082. [Google Scholar] [CrossRef]
  32. Jiang, L.G.; Bauer-Gottwein, P. How do GPM IMERG precipitation estimates perform as hydrological model forcing? Evaluation for 300 catchments across Mainland China. J. Hydrol. 2019, 572, 486–500. [Google Scholar] [CrossRef]
  33. Nourani, V.; Gkeku, H.; Gichamo, T. Ensemble data-driven rainfall-runoff modeling using multi-source satellite and gauge rainfall data input fusion. Earth Sci. Inform. 2021, 14, 1787–1808. [Google Scholar] [CrossRef]
  34. Moriasi, D.N.; Arnold, J.G.; Van Liew, M.W.; Bingner, R.L.; Harmel, R.D.; Veith, T.L. Model evaluation guidelines for systematic quantification of accuracy in watershed simulations. Trans. ASABE 2007, 50, 885–900. [Google Scholar] [CrossRef]
  35. Zhao, M.M. Quantitative evaluation of the impact of the number of different sub-basins on the flood simulation accuracy of the distributed hydrological model of the basin. Water Resour. Plan. Des. 2019, 5, 48–50. [Google Scholar]
  36. Xiao, J.C. Non-Point Source Pollution Model: SWAT User Application Guide; Geological Publishing House: Beijing, China, 2010. [Google Scholar]
  37. Lin, Y.T. Impact of Land Use Change on Waterdhed Runoff Based on SWAT Model; Guangxi University: Nanning, China, 2018. [Google Scholar]
  38. Zhu, X.R. Study on Response of Extreme Runoff under Changing Environment in the Karst Basin; Guangxi University: Nanning, China, 2019. [Google Scholar]
  39. Qin, J.K. Applicability of IMERG Satellite Precipitation Data in Runoff Simulation in Karst Area; Guangxi University: Nanning, China, 2019. [Google Scholar]
  40. Chen, F.R.; Li, X. Evaluation of IMERG and TRMM 3B43 monthly precipitation products over mainland China. Remote Sens. 2016, 8, 472. [Google Scholar] [CrossRef] [Green Version]
  41. Wang, S.; Wang, D.; Huang, C. Evaluating the applicability of GPM satellite precipitation data in Heihe River Basin. J. Nat. Resour. 2018, 33, 1847–1860. [Google Scholar]
  42. Jin, X.; Shao, H.; Zhang, C.; Yan, Y. The applicability evaluation of three satellite products in Tianshan Mountains. J. Nat. Resour. 2016, 31, 2074–2085. [Google Scholar]
  43. Ma, Z.Q.; Xu, J.T.; Zhu, S.Y.; Yang, J.; Tang, G.Q.; Yang, Y.J.; Shi, Z.; Hong, Y. AIMERG: A new Asian precipitation dataset (0.1 degrees/half-hourly, 2000–2015) by calibrating the GPM-era IMERG at a daily scale using APHRODITE. Earth Syst. Sci. Data 2020, 12, 1525–1544. [Google Scholar] [CrossRef]
  44. Tan, W.; Zeng, C.; Shen, H.; Tian, L. Gaussian process regression algorithm based method for merging daily-scale IMERG and gauge precipitation data:a case of Hubei Province. J. Cent. China Norm. Univ. Nat. Sci. Ed. 2020, 54, 439–446. [Google Scholar]
  45. Jin, C.P. Research on Space Downscaling Calibration and Application of TRMM Satellite Rainfall Data; Guangxi University: Nanning, China, 2018. [Google Scholar]
  46. Sun, L.; Hao, Z.; Wang, J.; Ioan, N.; Ousmane, S. Assessment and correction of TMPA products 3B42RT and 3B42V6. J. Hydraul. Eng. 2014, 45, 1135–1146. [Google Scholar]
  47. Muleta, M.K.; Nicklow, J.W. Sensitivity and uncertainty analysis coupled with automatic calibration for a distributed watershed model. J. Hydrol. 2005, 306, 127–145. [Google Scholar] [CrossRef] [Green Version]
  48. Shi, P.; Zhou, M.; Qu, S.M.; Chen, X.; Qiao, X.Y.; Zhang, Z.C.; Ma, X.X. Testing a conceptual lumped model in Karst Area, southwest China. J. Appl. Math. 2013, 2013, 1–10. [Google Scholar] [CrossRef]
  49. Wang, S.; Zhang, Z.; Sun, G.; Strauss, P.; Guo, J.; Tang, Y.; Yao, A. Multi-site calibration, validation, and sensitivity analysis of the MIKE SHE Model for a large watershed in northern China. Hydrol. Earth Syst. Sci. 2012, 16, 4621–4632. [Google Scholar] [CrossRef] [Green Version]
  50. Wu, L.; Liu, X.; Chen, J.L.; Yu, Y.; Ma, X.Y. Overcoming equifinality: Time-varying analysis of sensitivity and identifiability of SWAT runoff and sediment parameters in an arid and semiarid watershed. Environ. Sci. Pollut. Res. 2022, 29, 31631–31645. [Google Scholar] [CrossRef]
  51. Vigiak, O.; Malago, A.; Bouraoui, F.; Vanmaercke, M.; Poesen, J. Adapting SWAT hillslope erosion model to predict sediment concentrations and yields in large Basins. Sci. Total Environ. 2015, 538, 855–875. [Google Scholar] [CrossRef]
  52. Luo, X.; Wu, W.Q.; He, D.M.; Li, Y.G.; Ji, X. Hydrological simulation using TRMM and CHIRPS precipitation estimates in the lower Lancang-Mekong River Basin. Chin. Geogr. Sci. 2019, 29, 13–25. [Google Scholar] [CrossRef] [Green Version]
  53. Zeng, Y.; Tan, W.; Wang, C.; Chen, Z. Spatial downscaling of TRMM 3B43 precipitation data based on GWR model in Karst Mountainous Area of Guizhou Province. J. Arid. Meteorol. 2018, 36, 10. [Google Scholar]
Figure 1. Location of the Chengbi River basin and distribution of the stations.
Atmosphere 13 00844 g001
Figure 2. Land-cover distribution map in the Chengbi River basin.
Atmosphere 13 00844 g002
Figure 3. Soil distribution map of the Chengbi River basin.
Atmosphere 13 00844 g003
Figure 4. Multi-year average daily rainfall of the IMERG satellite.
Atmosphere 13 00844 g004
Figure 5. Division of sub-basins in the Chengbi River basin.
Atmosphere 13 00844 g005
Figure 6. Monthly simulated runoff during the calibration period.
Atmosphere 13 00844 g006
Figure 7. Monthly simulated runoff during the validation period.
Atmosphere 13 00844 g007
Figure 8. Daily simulated runoff during the calibration period.
Atmosphere 13 00844 g008
Figure 9. Daily simulated runoff during the validation period.
Atmosphere 13 00844 g009
Figure 10. Monthly runoff simulation results of multi-source rainfall data.
Atmosphere 13 00844 g010
Figure 11. Daily runoff simulation results of multi-source rainfall data.
Atmosphere 13 00844 g011
Table 1. Detailed information of stations in the Chengbi River basin.
StationElevation (m)Latitude (°)Longitude (°)Record Length (Year)
Donghe100424.360106.7242002–2018
Lingyun68924.345106.5742002–2018
Jiefu68924.316106.8042002–2018
Xiajia59224.289106.6482002–2018
Chaoli80124.239106.5042002–2018
Nongtang88324.207106.7612002–2018
Haokun40824.192106.6632002–2018
Pingtang31424.094106.6452002–2018
Linhe24524.059106.7012002–2018
Xiatang20624.036106.5482002–2018
Bailian27723.955106.7452002–2018
Bashou26323.950106.6422002–2018
Table 2. Meteorological and hydrological data.
Data TypesSpecific TypesData Sources
Rainfall dataThe station measured rainfallChengbi River Reservoir Authority
IMERG satellite rainfallNASA
The fusion rainfall dataGWR method,
proportional index method
Other meteorological dataSolar radiation, wind speed, air temperature,
relative humidity
China Meteorological Data Service Center
Hydrological datadaily runoffChengbi River Reservoir Authority
Table 3. Evaluation criteria of NSE.
GradesVery GoodGoodSatisfactoryUnsatisfactory
Values1.0 ≥ NSE > 0.750.75 ≥ NSE > 0.650.65 ≥ NSE > 0.50NSE ≥ 0.50
Table 4. Sensitive parameters with t-stat and p-value.
Parameter NameDescriptiont-Statp-ValueRank
R__SOL_AWC.solAvailable water capacity of the soil layer−19.190.001
V__ESCO.hruSoil evaporation compensation factor14.610.002
V__GW_DELAY.gwGroundwater delay−8.550.003
V__ALPHA_BNK.rteBaseflow alpha factor for bank storage4.310.004
V__CH_K2.rteEffective hydraulic conductivity in the main channel alluvium3.320.005
V__GWQMN.gwThreshold depth of water in the shallow aquifer required for return flow to occur−2.750.016
V__GW_REVAP.gwGroundwater “revap” coefficient−1.740.097
R__SOL_BD(..).solMoist bulk density0.680.508
R__CN2.mgtSCS runoff curve number0.640.539
V__ALPHA_BF.gwBaseflow alpha factor−0.620.5410
V__CH_N2.rteManning’s “n” value for the main channel−0.540.5911
V__REVAPMN.gwThreshold depth of water in the shallow aquifer for “revap” to occur0.410.6812
R__SOL_K(..).solSaturated hydraulic conductivity0.300.7613
Table 5. Values of evaluation indicators of monthly simulated runoff with different calibration methods.
Monthly ScaleSingle-Site Calibration MethodMulti-Site Calibration Method
Calibration periodR20.9600.963
NSE0.9000.953
Re−0.191−0.095
Validation periodR20.9420.944
NSE0.8670.926
Re−0.197−0.079
Table 6. Values of evaluation indicators of daily simulated runoff with different calibration methods.
Daily ScaleSingle-Site Calibration MethodMulti-Site Calibration Method
Calibration periodR20.8760.887
NSE0.8220.856
Re−0.215−0.186
Validation periodR20.6970.800
NSE0.6810.743
Re−0.218−0.187
Table 7. Values of evaluation indicators of simulated runoff with different rainfall inputs.
Time ScaleIMERG Satellite RainfallGWR Fusion RainfallThe Measured Rainfall
MonthlyR20.8090.9320.956
NSE0.6600.8540.933
Re−0.262−0.206−0.063
DailyR20.6790.7910.821
NSE0.5340.7170.740
Re−0.325−0.238−0.223
Publisher’s Note: MDPI stays neutral with regard to jurisdictional claims in published maps and institutional affiliations.

