Article

Monthly Precipitation Collected at Hirosaki, Japan: Its Tritium Concentration and Chemical and Stable Isotope Compositions

1
Graduate School of Health Sciences, Hirosaki University, 66-1 Honcho, Hirosaki 036-8564, Japan
2
Institute of Radiation Emergency Medicine, Hirosaki University, 66-1 Honcho, Hirosaki 036-8564, Japan
3
School of Health Sciences, Hirosaki University, 66-1 Honcho, Hirosaki 036-8564, Japan
4
Department of Helical Plasma Research, National Institute for Fusion Science, National Institutes of Natural Sciences, Toki 509-5292, Japan
5
Institute for Space Earth Environmental Research, Nagoya University, Furo-cho, Chikusa-ku, Nagoya 464-8601, Japan
6
Faculty of Education, University of the Ryukyus, Okinawa 903-0213, Japan
*
Author to whom correspondence should be addressed.
Present address: Fuji Electric Co., Ltd., 1 Fujimachi, Hino, Tokyo 191-8502, Japan.
Present address: Center for Radiation Research and Education, Nagasaki University, 1-12-4 Sakamoto, Nagasaki 852-8523, Japan.
Submission received: 9 April 2022 / Revised: 13 May 2022 / Accepted: 19 May 2022 / Published: 23 May 2022

Abstract

:
Monthly precipitation samples were collected at Hirosaki, Aomori Prefecture from January 2018 to December 2020 to measure the ion species and stable hydrogen and oxygen isotope ratios in order to understand the regional properties. The tritium concentration ranged from 0.28 to 1.20 Bq/L, with mean values (±S.D.) of 0.52 ± 0.18, 0.67 ± 0.25 and 0.63 ± 0.21 Bq/L in 2018, 2019 and 2020, respectively. This concentration level was almost the same as for Rokkasho, Aomori Prefecture. The tritium concentration had clear seasonal variation: high in the spring and low in the summer. This trend was thought to arise from seasonal fluctuations in the atmospheric circulation. On the other hand, the pH tended to be low, and the electrical conductivity (EC) tended to be high from the winter to the spring. The ion components, which major ion species contained in sea salt, also tended to be high in the winter, and these components had a strong influence on EC. The d-excess values were high in the winter and low in the summer, and when this trend was considered from the viewpoint of the wind direction data in Hirosaki, these dust components were attributed to the northwest monsoon in the winter to the spring coming from the Asian continent.

1. Introduction

Water is one of the essential materials for living organisms, and it occurs as rain and in the oceans, rivers and atmosphere of the earth. Earth’s ecosystems are maintained by the circulation of water. Water consists of two hydrogen atoms and one oxygen atom. The former has three isotopes, which are hydrogen-1 (1H), deuterium (2H) and tritium (3H), and these isotopes are present not in only water but in numerous chemical compounds. Tritium is a radio isotope (half-life, 12.3 years) that emits beta rays at a maximum energy of 18.6 keV [1].
Tritium is naturally and artificially produced mainly through three pathways. The first is natural tritium that is produced constantly through the nuclear interaction of cosmic rays with nitrogen and oxygen in the atmosphere, which most commonly produces tritiated hydrogen gas (HT) that is subsequently oxidized to tritiated water (HTO) and deposited by precipitation onto the earth’s surface. Secondly, in the late 1950s to the early 1960s, large amounts of artificial tritium were released into the atmosphere by atmospheric nuclear weapons tests. As a result, the amount of tritium in the environment increased to about 240 EBq, which was more than 200 times the natural amount [2]. The concentration of tritium in precipitation was immediately raised by the anthropogenic tritium, but by the end of the 20th century, it had returned to the level it was at before the atmospheric nuclear weapons tests [3]. As air-masses of high concentrations of tritium are transported from the stratosphere to the troposphere, the tritium from these tests has been used to trace global atmospheric circulation.
Finally, nuclear facilities have released tritium into the environment during normal operations and as a result of accidents [4]. In Japan, the accident that occurred at the Fukushima Daiichi Nuclear Power Station in March 2011 released radioactive substances, some containing tritium, into the environment [5,6,7,8]. The released tritium deposited on the ground and the ocean through atmospheric dispersion and precipitation. Long-term concerns remain about their effects on the terrestrial and marine environments and living organisms. Large amounts of water were used to cool the molten reactor fuel at the site of the accident, and it has been treated in decontamination activities; but the treated water still contains various radionuclides, including tritium, and it is being stored in tanks on-site [9]. However, the storage space is limited, and the Japanese government has decided to release the treated water into the sea at controlled concentrations [10]. Therefore, it is important to monitor the tritium concentration of environmental water samples before and after such a release for the assessment of the effects on the environment and living organisms [11].
Another type of nuclear facility that releases tritium is a spent fuel reprocessing plant. A commercial spent nuclear fuel reprocessing plant is located at the Rokkasho village in eastern Aomori Prefecture, which is in the process of being put into operation, and when it starts to operate, tritium will be released into the environment. Therefore, monitoring of the environment, including the precipitation, is regularly being carried out in the Rokkasho area [12].
The tritium concentration in precipitation is monitored all over the world [3,13,14,15], and some reports specifically for Japan have appeared [12,16,17,18,19]. In addition, there are some reports providing tritium concentrations with chemical and stable isotope compositions to clarify the regional properties in Japan [16,17]. This is useful tool for understanding the regional dynamics of precipitation chemistry [20,21,22,23]. In this paper, the tritium concentration, ions and stable hydrogen and oxygen isotope ratios in the monthly precipitation from 2018 to 2020 are reported to clarify the regional properties.

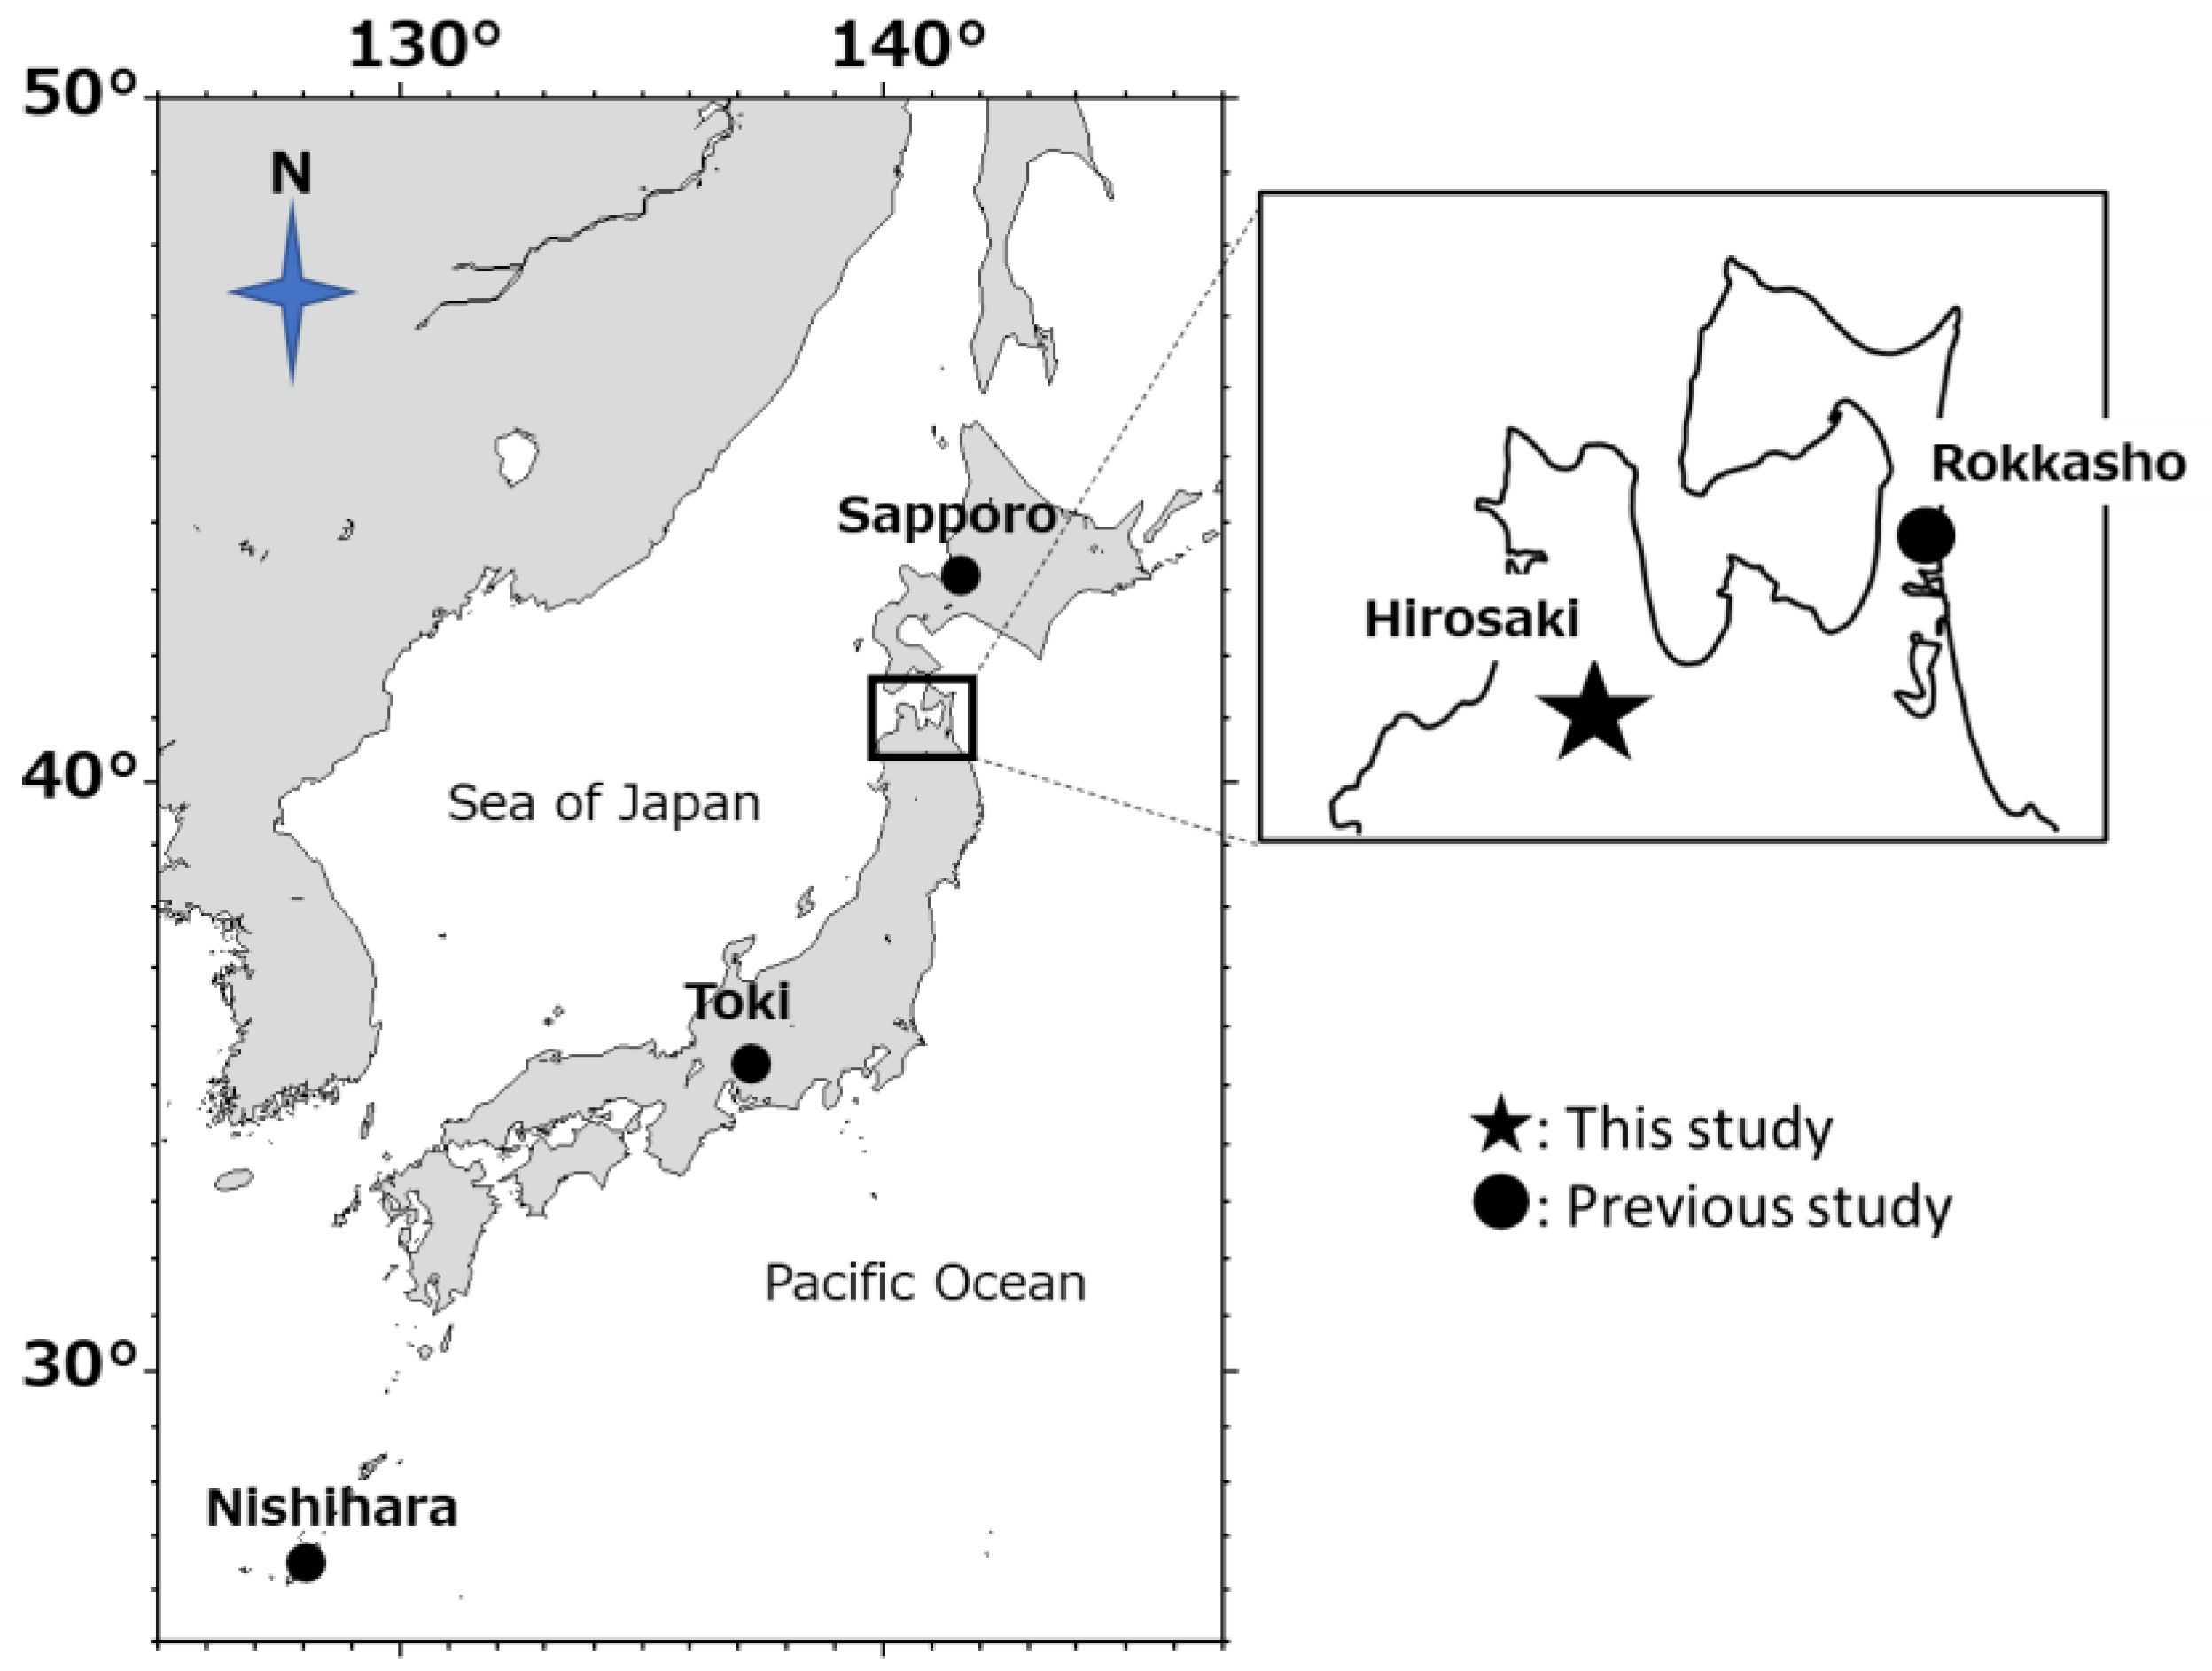
2. Materials and Methods

The sampling locations are shown in Figure 1. Hirosaki City is located in the southern part of the Tsugaru Plain, about 31 km from the Sea of Japan. The Japan Meteorological Agency provides the average weather conditions at the Hirosaki AMeDAS (Automated Meteorological Data Acquisition System) site (40°37′ N, 140°27′ E). According to the AMeDAS data from 2018 to 2020 [23] regarding the average temperature in Hirosaki City, January was the month of the minimum average temperature (−0.3 °C), and August was the month of the maximum (25.2 °C). May was the month of the minimum average precipitation (72.3 mm), and August was the month of the maximum (173.2 mm). The main wind directions during the whole year were from the SE and SSW (Figure 2).
Monthly precipitation samples were collected on the rooftop of a building (7F) on the Hirosaki University campus, which is centrally located in Hirosaki City (40°35′ N, 140°46′ E). The samples were collected using a rain/snow sampler (ST-1F, Suntecno, Saitama, Japan). A 10 L polyethylene container was used as the collection container. The pretreatment and analysis have been reported elsewhere [16]. Briefly, after collection, the samples were weighed, and the pH and electrical conductivity (EC) were measured using a pH meter (B-211, Horiba, Kyoto City, Japan) and an EC meter (E-771, Horiba, Japan), respectively. A part of the sample was filtered using a 0.45 µm membrane filter (DISMIC 25CS045AS, Advantec, Tokyo, Japan), which was to be used for the measurements of the ion components and the stable isotope ratios. The analytical precision was better than ±0.1% for the pH and ±2% for the EC, respectively. Another portion of about 1000 mL was first distilled, and 800 mL of the distilled sample water was electrolyzed to about 55 mL to enrich its tritium content; this was done with a commercially available tritium condensation apparatus (TRIPURE XZ001, De Nora Permelec Ltd., Fujisawa, Japan) [16]. The electrolyzed tritium-enriched sample was distilled again. After the second distillation, 50 mL of the water sample was taken into a 145 mL low-diffusion polyethylene vial. Next, Ultima Gold LLT (Perkin Elmer, Waltham, MA, USA) was added as a cocktail agent, and the sample was mixed well. After mixing, the sample vials were stored for at least 5 days in a low-background liquid scintillation counter (LSC; LSC-LB5, Hitachi, Tokyo, Japan), and the tritium radioactivity measurements were carried out for 1000 min (50 min counting, 10 repetitions per cycle, 2 cycles per sample). The minimum detection level (MDL) of this procedure was around 0.04 Bq/L. The relative uncertainty of this measurement was less than 9%. The measured values were corrected for radioactive decay to the middle of the sampling period.
The ion concentration and stable hydrogen and oxygen isotope ratios were also measured for the precipitation samples. The ion concentrations were measured using ion chromatography (930 Compact IC Flex, Eco IC, Metrohm, Herisau, Switzerland). The relative uncertainty of the anions and cations analysis was less than 5.3%. The stable isotope analyses of hydrogen (δD) and oxygen (δ¹⁸O) were done using a cavity ring-down spectroscopy isotopic water analyzer (Model L2130-i, Picaro Inc. Sunnyvale, CA, USA) with a CTC analytics auto-sampler (HTC-PAL, Leap Technologies, Carrboro, NC, USA). The measurement precision was better than ±1.5% for δD and was ±0.15% for δ¹⁸O.

3. Results and Discussions

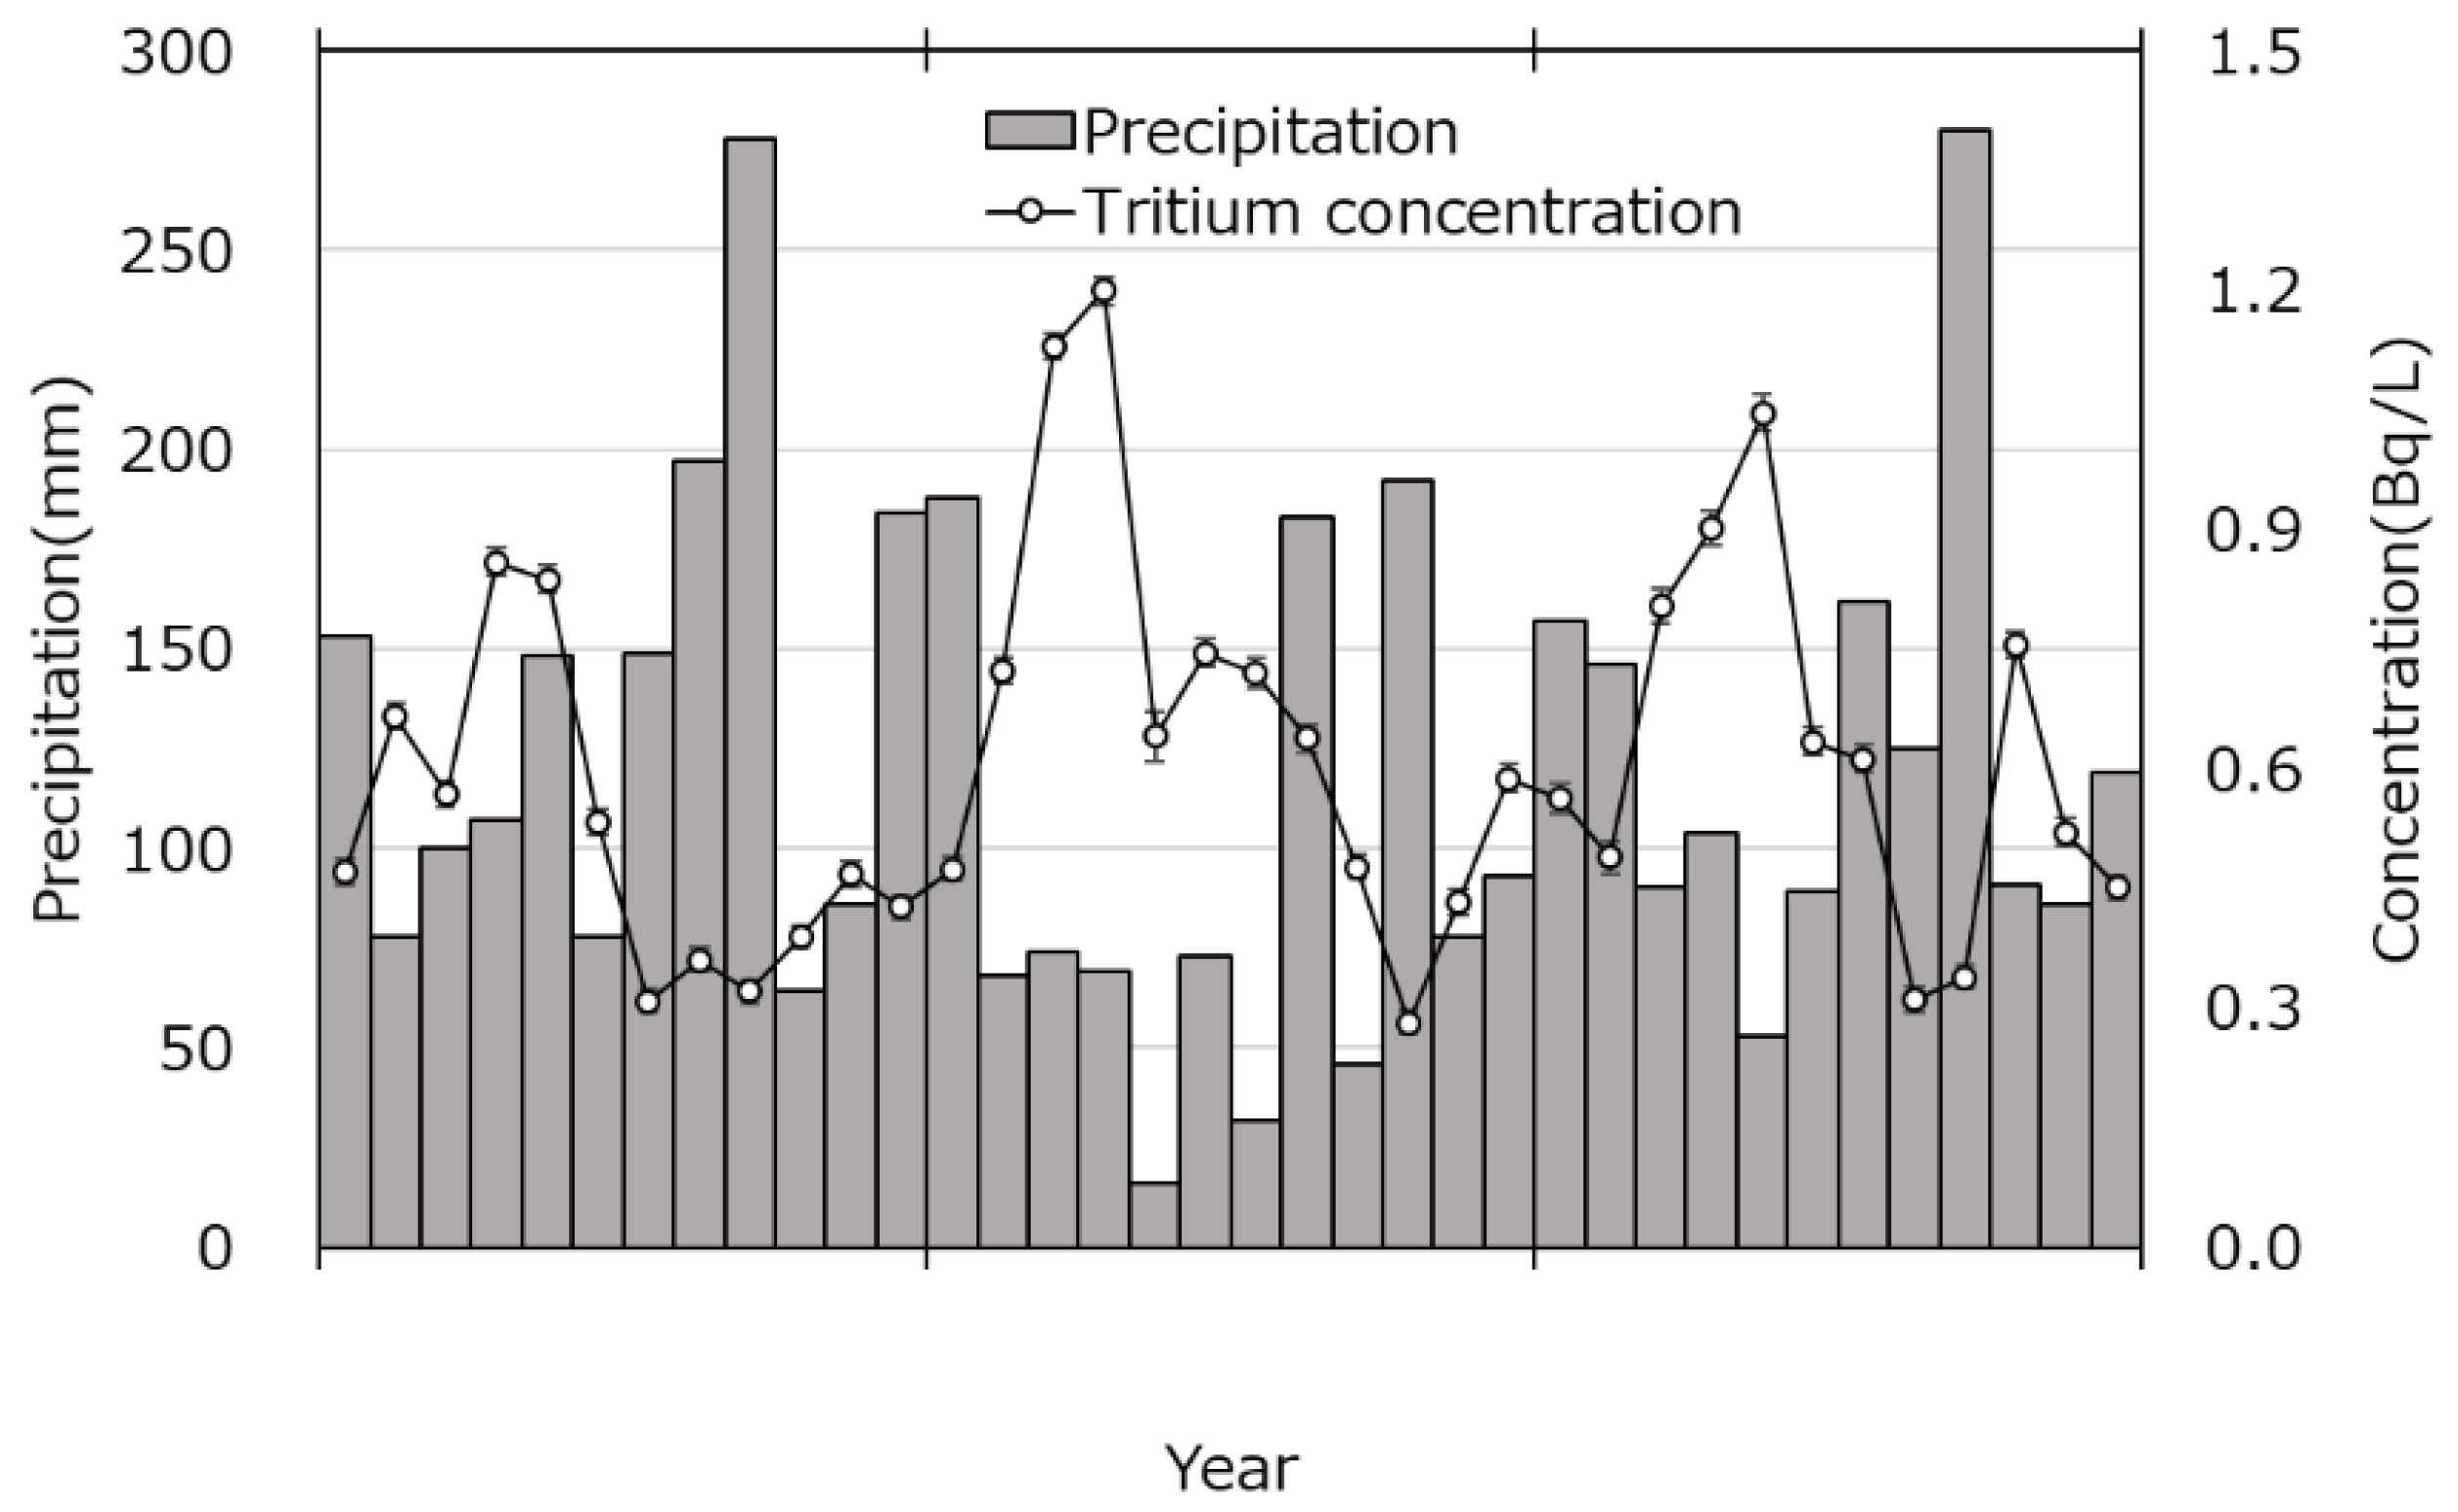
3.1. Regional Characteristics of Tritium Concentration

Figure 3 summarizes the seasonal trends in the precipitation and tritium concentration at Hirosaki from January 2018 to December 2020. The total annual precipitation levels were 1622 mm, 1112 mm and 1502 mm in 2018, 2019 and 2020, respectively. The tritium concentration ranged from 0.28 to 1.20 Bq/L. It tended to be high in the early spring from April to May and low in the summer from June to August, and the concentration fluctuations were small during the autumn to the winter from September to February. This trend has also been seen in other areas in Japan [2,12,16,17,18,19], which is called the spring peak. During this time, the part of the stratosphere atmosphere with a high tritium concentration flows into the troposphere atmosphere due to seasonal fluctuations in the atmospheric circulation in the mid-latitude region of the Northern Hemisphere [3,24]. In addition, the air mass in the spring is transported from East Asia as the northwest monsoon; the environmental tritium level in east Asia is higher than that in Japan [25,26]. According to Akata et al. [12], the concentration of tritium in the precipitation from 2001 to 2005 FY at Rokkasho (141°21′ E, 40°57′ N) was 0.18 Bq/L to 1.23 Bq/L—about the same level as for Hirosaki City. This range was lower than that in Sapporo (0.24 to 1.59 Bq/L (43°8′ N, 141°14′ E)) from 2015 to 2019 [16] and higher than that in Toki (0.10 to 0.61 Bq/L (35°19′ N, 137°10′ E; see the map in Figure 1)) from 2013 to 2017 [17] and in Nishihara (0.05 to 0.27 Bq/L (26°14′ N, 127°46′ E; see the map in Figure 1)) from 2016 to 2017 [18]. Other papers have reported that the tritium concentration in the precipitation varies depending on the sampling location and latitude [3,18,27], and the present results also showed this latitude effect. This trend is caused by the difference in the amount of tritium produced naturally in the upper atmosphere and the difference in the speed at which the stratospheric atmosphere is transported to the tropospheric atmosphere. The monthly mean tritium concentrations in the precipitation collected at Hirosaki during 2018–2020 are summarized in Table 1. These values were similar to the mean concentration in the monthly precipitation at Rokkasho from 2001 to 2005 FY. Thus, those values can be used as the monthly background values for estimating the contribution of released tritium from the nuclear fuel reprocessing plant and the Fukushima Daiichi Nuclear Power Plants.

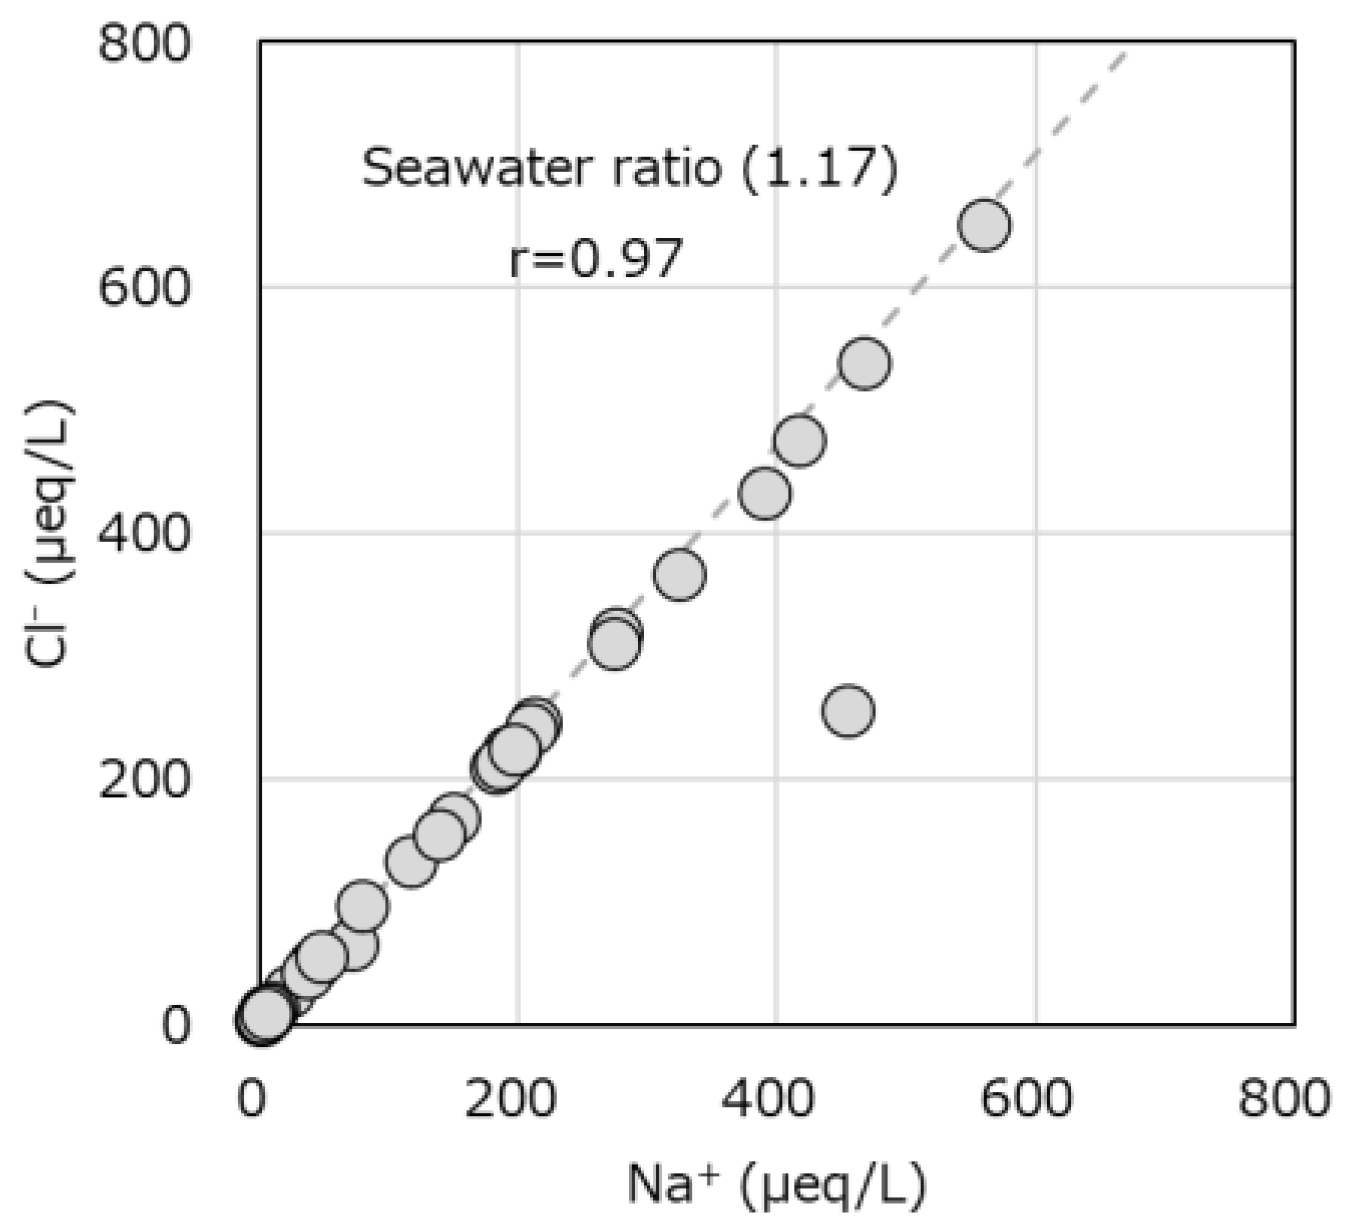
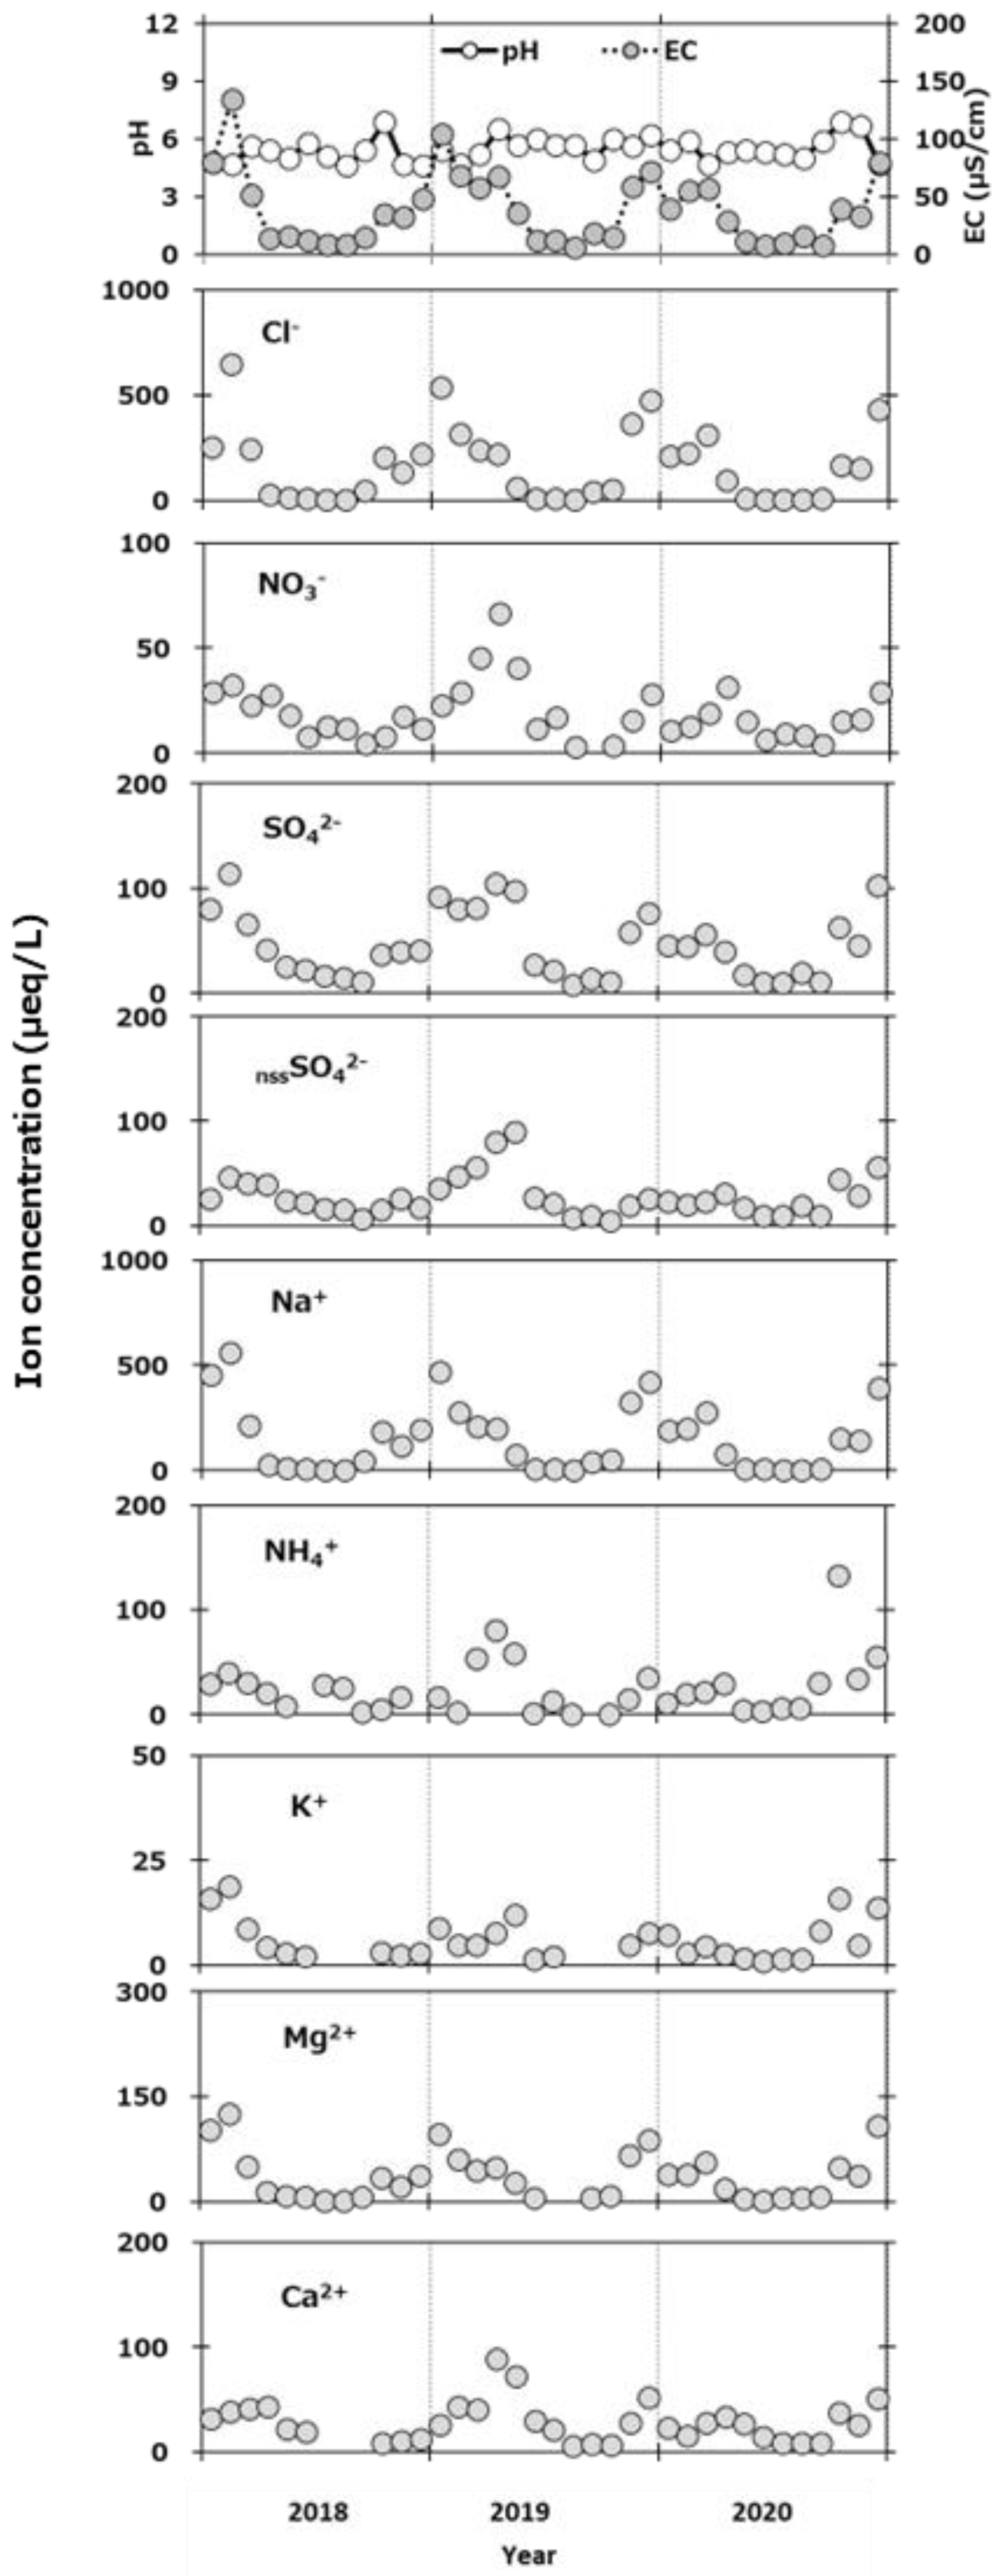
3.2. Chemical Characteristics of Precipitation

Figure 4 shows the relationship between the total anions and cations, and it was a linear relationship. In addition, Figure 5 shows the relationship between the sodium ions and chlorine ions, and the ratio of the sodium ions to the chlorine ions was almost the same (1.17), indicating that the precipitation was derived from the seawater [16,19,28]. In Figure 5, one point deviated significantly from the line. Since the magnesium ion values measured at the same time did not fluctuate significantly, the chloride ions taken in as sea salt particles were considered to have escaped as chlorine gas.
Figure 6 shows the measured pH for three anions (Cl, NO3, SO₄2−) and five cations (Na+, NH4+, K+, Mg2+, Ca2+) in the monthly precipitation. In addition, the non-sea salt sulfate (nssSO42−) was calculated by the following formula based on Na+, which is a tracer derived from sea salt. If the concentration ratio of SO₄2− and Na+ does not match the concentration ratio in the seawater, it means that the SO₄2− is of non-sea-salt origin [28].
nssSO42− = SO42− − (SO42−/Na+)sea × Na+
The pH ranged from 4.6 to 6.9, and in the winter, the pH was 5.0 or less, which was lower than in the other seasons. The EC ranged from 6 to 134 µS/cm and tended to be higher in the winter than in the other seasons. The anion concentrations of Cl, SO42− and NO3 ranged from 3.5 to 649.7 µeq/L, 10 to 113.9 µeq/L and 3.2 to 66.8 µeq/L, respectively. The cation concentrations of Na+, NH4+, K+, Mg2+ and Ca2+ were 1.9 to 561.4 µeq/L, 0.5 to 132.7 µeq/L, 0.8 to 18.8 µeq/L, 0.6 to 125.6 µeq/L and 6.1 to 88.6 µeq/L, respectively. The Cl, SO42−, Na+ and Mg2+ concentrations tended to be high in the winter and low in the summer. Cl, SO42−, Na+ and Mg2+ are major ionic components contained in sea salt, and it was considered that these species have a strong influence on the EC. It has been reported in the Sapporo area that the pH is low, the EC is high and the ionic component contained in the sea salt is high in the winter [15]. It could also be seen that NO3, NH4+, nssSO42−, SO42− and Ca2+ tended to be high in spring. The correlation coefficient of each ion can be seen in Table 2, and the symbol represents a significance higher than 95%. From this table, a high correlation was observed between NH4+ and nssSO42 and between Ca2+ and NO3 (p < 0.05), and from that finding, the presence of (NH4)2SO4 and Ca(NO3)2 was predicted. It has been reported that the NH4+ concentration is high in Beijing from the winter to the end of the summer, and this ammonia combines with sulfuric acid in the atmosphere to form salts such as (NH4)2SO4, which have been observed as fine particles [29]. In addition, Ca(NO3)2 is one of the components of the soil dust called yellow sand [30], and its presence was considered to be the result of fine particles coming from mainland China on the monsoon, which is a seasonal wind from the WSW and SW directions in the spring that blows to Hirosaki. This phenomenon is also observed in the cities of Sapporo and Toki [16,17].

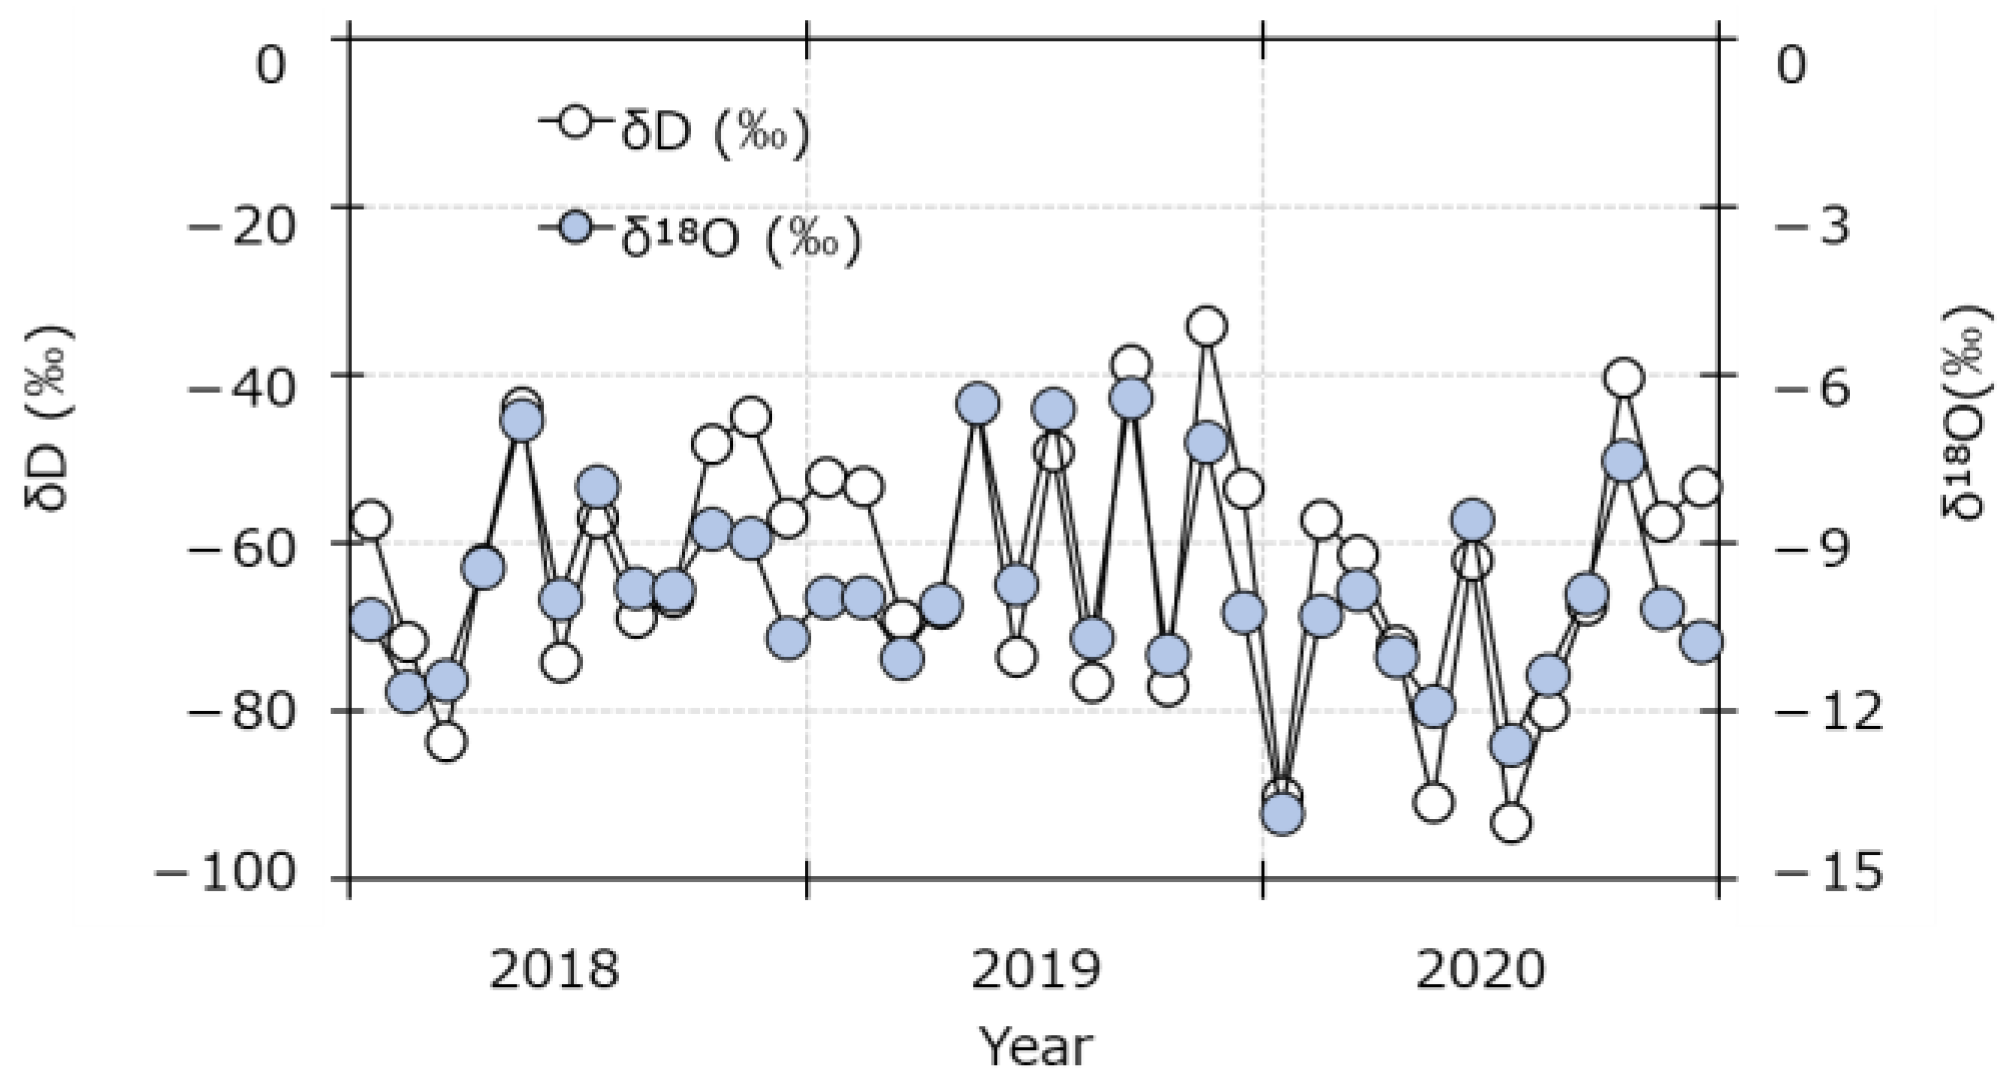
3.3. Stable Isotope Composition in Precipitation

The isotope ratios of δD and δ18O ranged from −93.06 to −33.13‰ and from −13.80 to −6.48‰, respectively, and they showed similar movements throughout the year (Figure 7). As in other reports [17,31], δD and δ18O had a good correlation, following the relationship known as the Global Meteoric Water Line (GMWL).
δD = 8.0 × δ18O + 10
Figure 8 shows the relationship between δD and δ18O, and the expression δD = 7.3 × δ18O + 9.1 was obtained, which was close to the GMWL. In addition, the intercept d-excess was obtained by the following formula, and the sea area or region from which the water vapor that is the basis of the precipitation has evaporated can be estimated from this value [31].
d-excess = δD − 8.0 × δ18O
As reported by Hasegawa et al. [32], the plotted values obtained for Hirosaki tended to be slightly above the GMWL. This deviation was predicted to be due to the winter precipitation that included rapidly evaporated water, which was due to the influence of the northwest monsoon carrying dry air [14,15,33,34]. In addition, Figure 9 shows the relationship between the d-excess and temperature in the monthly precipitation at Hirosaki. The d-excess was high in the winter and low in the summer, indicating that there was an inverse correlation between the d-excess and temperature. The d-excess in the dry air is known to lead to high values; it causes a large dynamic separation [34], which has also been predicted to be associated with the northwest monsoon carrying dry air from the Asian continent.

4. Conclusions

From January 2018 to December 2020, precipitation was collected every month in Hirosaki City, Aomori Prefecture, Japan. From the measurements of the collected samples, the background value of the tritium concentration and tritium characteristics in the precipitation was investigated. The tritium concentration in the precipitation ranged from 0.28 to 1.20 Bq/L. That level was almost the same as that found in another part of Aomori Prefecture, Rokkasho village, where a commercial nuclear fuel reprocessing plant is located. It was found that the value in Hirosaki was lower than that in Sapporo (farther north) and higher than that in Toki (in the central west) and Nishihara (in the southwest), and the latitude effect was remarkable. The tritium concentration in the precipitation at Hirosaki was high in the spring and low in the summer. This phenomenon was predicted to be due to the seasonal fluctuations in the atmospheric circulation. The pH tended to be low, and the EC tended to be high from the winter to the spring. In addition, large amounts of Cl, SO42−, Na+ and Mg2+ were contained in the winter, which were from sea salt. These components strongly affected the EC, and similar behaviors were also observed in Sapporo. The ions of NO3, NH4+, nssSO42−, SO42− and Ca2+ in the precipitation tended to be high in the spring, and a high correlation was seen between NH4+ and nssSO42− and between Ca2+ and NO3 (p < 0.05). From this, the presence of (NH4)2SO4 and Ca(NO3)2 was predicted, and CaSO4 (which is one of the components of the yellow sand that blows from the Asian continent in the spring), NH4NO3 and (NH4)2SO4 were also observed in Toki and Sapporo. The d-excess tended to be high in the winter and low in the summer, and based on the wind direction data for Hirosaki, this was due to the northwest monsoon in the winter to the spring.
From these data, the monthly background values were obtained to assess the contribution of tritium released from the Rokkasho nuclear fuel reprocessing plant and the Fukushima Daiichi Nuclear Power Station.

Author Contributions

Conceptualization, H.K., N.A. and M.T.; methodology, H.K., N.A. and M.T.; validation, H.K., N.A., K.O. and N.O.; formal analysis, H.K., N.A., M.T., K.O., N.O. and N.K.; investigation, H.K., N.A., K.O., N.O., R.N., T.S., Y.S., Y.T. and M.H.; resources, N.A.; data curation, H.K., N.A., K.O. and N.O.; writing—original draft preparation, H.K. and N.A.; writing—review and editing, H.K., N.A., M.T., H.T. and M.H.; visualization, H.K. and N.A.; supervision, N.A. and H.T.; project administration, N.A.; funding acquisition, N.A. All authors have read and agreed to the published version of the manuscript.

Funding

This work was funded by the NIFS Collaborative Research Program (NIFS21KNWA003) and the JSPS KAKENHI (Grant Numbers: 17K00559 and 21H03607).

Institutional Review Board Statement

Not applicable.

Informed Consent Statement

Not applicable.

Data Availability Statement

Not applicable.

Acknowledgments

The authors express their thanks to all the persons who supported the installation of the precipitation samplers and the observation equipment, carried out the monthly sampling and made the sample measurements in this research study. The authors would like to thank Chutima Kranrod and Eka Djatnika Nugraha (Hirosaki University) for the support of our field survey and experiments.

Conflicts of Interest

The authors declare no conflict of interest.

References

  1. Okada, S.; Momoshima, N. Overview of tritium: Characteristics, sources, and problems. Health Phys. 1993, 65, 595–609. [Google Scholar] [CrossRef] [PubMed]
  2. Momoshima, N.; Okai, T.; Kaji, T.; Takashima, Y. Distribution and transformation of various chemical forms of tritium in the environment. Radiochim. Acta 1991, 54, 129–132. [Google Scholar] [CrossRef]
  3. Morishima, H.; Kawai, H.; Koga, T.; Niwa, T. The trends of global tritium precipitations. J. Radiat. Res. 1985, 26, 283–312. [Google Scholar] [CrossRef] [PubMed]
  4. Baojie, N.; Sheng, F.; Man, J.; Laishun, W.; Muyi, N.; Jiye, Z.; Zhiyi, Y.; Fengchen, L. Anthropogenic tritium: Inventory, discharge, environmental behavior and health effects. Renew. Sustain. Energy Rev. 2021, 135, 110188. [Google Scholar]
  5. Machida, M.; Iwata, A.; Yamada, S.; Otosaka, S.; Kobayashi, T.; Funasaka, H.; Morita, T. Estimation of temporal variation of discharged tritium from port of Fukushima Dai-ichi Nuclear Power Plant: Analysis of the temporal variation and comparison with released tritium from Japan and major nuclear facilities worldwide. Trans. At. Energy Soc. Japan 2022, 21, 33–49. [Google Scholar] [CrossRef]
  6. Matsumoto, T.; Maruoka, T.; Shimoda, G.; Obata, H.; Kagi, H.; Suzuki, K.; Yamamoto, K.; Mitsuguchi, T.; Hagino, K.; Tomioka, N.; et al. Tritium in Japanese precipitation following the March 2011 Fukushima Daiichi Nuclear Plant accident. Sci. Total Environ. 2013, 445, 365–370. [Google Scholar] [CrossRef]
  7. Ueda, S.; Hasegawa, H.; Kakiuchi, H.; Ochiai, S.; Akata, N.; Hisamatsu, S. Nuclear accident-derived 3H in river water of Fukushima Prefecture during 2011–2014. J. Environ. Radioact. 2015, 146, 102–109. [Google Scholar] [CrossRef]
  8. Querfeld, R.; Pasi, A.; Shozugawa, K.; Vockenhuber, C.; Synal, H.; Steier, P.; Steinhauser, G. Radionuclides in surface waters around the damaged Fukushima Daiichi NPP one month after the accident: Evidence of tritium release into the environment. Sci. Total Environ. 2019, 689, 451–456. [Google Scholar] [CrossRef]
  9. Normile, D. The trouble with tritium. Science 2014, 346, 1278. [Google Scholar] [CrossRef]
  10. MIXT. Important Stories on Decommissioning Fukushima Daiichi Nuclear Power Station, Now and in the Future. 2021. Available online: https://www.meti.go.jp/english/earthquake/nuclear/decommissioning/pdf/pamph2021_en.pdf (accessed on 18 May 2022).
  11. Yonglong, L.; Jingjing, Y.; Di, D.; Bin, S.; Xiaojie, Y. Monitoring long-term ecological impacts from release of Fukushima radiation water into ocean. Geogr. Sustain. 2021, 2, 95–98. [Google Scholar]
  12. Akata, N.; Kakiuchi, H.; Shima, N.; Iyogi, T.; Momoshima, N.; Hisamatsu, S. Tritium concentrations in the atmospheric environment at Rokkasho, Japan before the final testing of the spent nuclear fuel reprocessing plant. J. Environ. Radoact. 2011, 102, 837–842. [Google Scholar] [CrossRef] [PubMed]
  13. Tadros, C.V.; Hughes, C.E.; Crawford, J.; Hollins, S.E.; Chisari, R. Tritium in Australian precipitation: A 50 year record. J. Hydrol. 2014, 513, 262–273. [Google Scholar] [CrossRef]
  14. Jin, Z.; Wang, Y.; Li, F.; Qian, L.; Hu, Y.; Shi, Y. Stable isotopes and chemical characteristics of precipitation in Hangzhou and Huzhou, East China. Environ. Sci. Pollut. Res. 2019, 26, 23717–23729. [Google Scholar] [CrossRef]
  15. Xu, Z.; Wu, Y.; Liu, W.; Liang, C.S.; Ji, J.; Zhao, T.; Zhang, X. Chemical composition of rainwater and the acid neutralizing effect at Beijing and Chizhou City, China. Atmos. Res. 2015, 164, 278–285. [Google Scholar] [CrossRef]
  16. Akata, N.; Kakiuchi, H.; Tanaka, M.; Ishikawa, Y.; Kurita, N.; Furukawa, M.; Hegedüs, M.; Kovács, T.; Gusyev, M.; Sanada, T. Isotope and chemical composition of monthly precipitation collected at Sapporo, northern part of Japan during 2015–2019. Fusion Eng. Des. 2021, 168, 112434. [Google Scholar] [CrossRef]
  17. Akata, N.; Tanaka, M.; Iwata, C.; Kato, A.; Nakada, M.; Kovács, T.; Kakiuchi, H. Isotope composition and chemical species of monthly precipitation collected at the site of a fusion test facility in Japan. Int. J. Environ. Res. Public Health 2019, 16, 3883. [Google Scholar] [CrossRef] [Green Version]
  18. Nakasone, S.; Ishimine, A.; Shiroma, Y.; Tanaka, M.; Akata, N.; Kakiuchi, H.; Sanada, T.; Furukawa, M. Recent tritium concentration of monthly precipitation in Japan. Radiat. Prot. Dosim. 2019, 184, 334–337. [Google Scholar] [CrossRef]
  19. Hayashi, Y.; Momoshima, N.; Maeda, Y.; Kakiuchi, H. Relation between tritium concentration and chemical composition in rain at Fukuoka. J. Radioanal. Nucl. Chem. 1999, 239, 517–522. [Google Scholar] [CrossRef]
  20. Chengcheng, X.; Guodong, L.; Jie, M.; Yuchuan, M.; Wen, L.; Yue, H. Characteristics of hydrogen and oxygen stable isotopes in precipitation and the environmental controls in tropical monsoon climatic zone. Int. J. Hydrogen Energy 2019, 44, 5417–5427. [Google Scholar]
  21. Jeerapong, L.; Kimpei, I.; Supapap, P. Isotopic temporal and spatial variations of tropical rivers in Thailand reflect monsoon precipitation signals. Hydrol. Process 2021, 35, e14068. [Google Scholar] [CrossRef]
  22. Ryunosuke, U.; Hiroshi, O.; Hiroko, O.; Naoya, K.; Daisuke, A.; Takanori, N. Geochemical and stable isotope characteristics of urban heavy rain in the downtown of Tokyo, Japan. Atmos. Res. 2017, 194, 109–118. [Google Scholar]
  23. Japan Meteorological Agency. Automated Meteorological Data Acquisition System (AMeDAS). 2021. Available online: http://www.data.jma.go.jp/gmd/risk/obsdl/index.php (accessed on 3 February 2021).
  24. Tanaka, M.; Uda, T. Variation of atmospheric tritium concentration in three chemical forms at Toki, Japan: 2004-12. Radiat. Prot. Dosim. 2015, 167, 187–191. [Google Scholar] [CrossRef] [PubMed]
  25. Matsuoka, N.; Hirai, E.; Tagomori, H.; Momoshima, N.; Takashima, Y. Meteorological analysis of tritium concentrations in rain water in Fukuoka. Sci. Total Environ. 1994, 145, 197–205. [Google Scholar] [CrossRef]
  26. Okamura, M.; Hirai, E.; Matsuoka, N. Recent variation of tritium concentrations. J. Hydrol. 1993, 35, 87–93. (In Japanese) [Google Scholar]
  27. Takashima, Y. Environmental Tritium—Its behavior and utilization. Radioisotopes 1991, 40, 520–530. (In Japanese) [Google Scholar] [CrossRef] [Green Version]
  28. Suzuki, K.; Endo, Y. Sea salt originated material in winter precipitation and weather condition. Seppyo 1994, 56, 233–241. (In Japanese) [Google Scholar]
  29. Ianniello, A.; Spataro, F.; Esposito, I.; Hu, M.; Zhu, T. Chemical characteristics of inorganic ammonium salts in PM2.5 in the atmosphere of Beijing (China). Atmos. Chem. Phys. 2011, 11, 10803–10822. [Google Scholar] [CrossRef] [Green Version]
  30. Mizobata, A.; Ito, N. Chemical modification of kosa particles. Earozorukenkyu 1995, 10, 127–134. (In Japanese) [Google Scholar]
  31. Craig, H. Isotope variations in meteoric waters. Science 1961, 133, 1702–1703. [Google Scholar] [CrossRef]
  32. Hasegawa, H.; Akata, N.; Kawabata, H.; Sato, T.; Chikuchi, Y.; Hisamatsu, S. Characteristics of hydrogen and oxygen stable isotope ratios in precipitation collected in a snowfall region, Aomori Prefecture, Japan. Geochem. J. 2014, 48, 9–18. [Google Scholar] [CrossRef] [Green Version]
  33. Dansgaard, W. Stable isotopes in precipitation. Tellus 1964, 16, 436–468. [Google Scholar] [CrossRef]
  34. Tanoue, M.; Ichiyanagi, K. Deuterium excess in precipitation and water vapor origins over Japan: A review. J. Jap. Assoc. Hydrol. 2016, 46, 101–115. (In Japanese) [Google Scholar]
Figure 1. Location of the present sampling point (Hirosaki City) and of the previously reported sampling points (the cities of Sapporo, Rokkasho, Toki and Nishihara).
Atmosphere 13 00848 g001
Figure 2. Frequency of the wind directions measured at Hirosaki City (2018 to 2020).
Atmosphere 13 00848 g002
Figure 3. Tritium concentrations in the precipitation and the monthly precipitation amounts at Hirosaki City (2018 to 2020).
Atmosphere 13 00848 g003
Figure 4. Relationship between the total anions and cations in the monthly precipitation at Hirosaki City (2018 to 2020).
Atmosphere 13 00848 g004
Figure 5. Relationship between the Na+ and Cl concentrations in the monthly precipitation at Hirosaki City (2018 to 2020).
Atmosphere 13 00848 g005
Figure 6. pH, EC and ion levels in the monthly precipitation collected in Hirosaki City (2018 to 2020).
Atmosphere 13 00848 g006
Figure 7. Trends of δD and δ18O in the precipitation measured at Hirosaki City (2018 to 2020).
Atmosphere 13 00848 g007
Figure 8. Relationship between δD and δ18O in the monthly precipitation at Hirosaki City, and a plot of the global meteoric water line (GMWL).
Atmosphere 13 00848 g008
Figure 9. Variations in the d-excess and temperature in the monthly precipitation at Hirosaki City (2018 to 2020).
Atmosphere 13 00848 g009
Table 1. The monthly mean tritium concentrations in the precipitation at Hirosaki City (2018 to 2020).
MonthPrecipitation (Bq/L)
January0.50 ± 0.04
February0.63 ± 0.10
March0.83 ± 0.23
April0.99 ± 0.15
May0.84 ± 0.17
June0.64 ± 0.08
July0.55 ± 0.17
August0.44 ± 0.14
September0.38 ± 0.04
October0.48 ± 0.20
November0.47 ± 0.04
December0.49 ± 0.07
Table 2. Correlation coefficients of each ion in the precipitation.
Na+NH₄+K+Mg2+Ca2+ClNO₃SO₄2−
NH₄+0.26
K+0.670.65
Mg2+0.980.340.76
Ca2+0.380.620.480.43
Cl0.970.970.600.950.37
NO₃0.440.540.400.470.900.43
SO₄2−0.820.560.750.860.790.810.80
nssSO₄2−0.690.620.700.740.870.680.860.98
p < 0.05.
Publisher’s Note: MDPI stays neutral with regard to jurisdictional claims in published maps and institutional affiliations.

