Article

Resource-Based Industries and CO2 Emissions Embedded in Value Chains: A Regional Analysis for Selected Countries in Latin America

by
Eduardo Rodrigues Sanguinet
1,2,3,*,
Carlos Roberto Azzoni
2 and
Augusto Mussi Alvim
3
1
Instituto de Economía Agraria, Facultad de Ciencias Agrarias y Alimentarias (FCAA), Universidad Austral de Chile, Valdivia 5090000, Chile
2
Núcleo de Economia Regional e Urbana (NEREUS-USP), Faculdade de Economia, Administracao e Contabilidade (FEA-USP) Universidade de Sao Paulo, São Paulo 05508-010, Brazil
3
Escola de Negócios, Pontifícia Universidade Católica do Rio Grande do Sul (PUCRS), Porto Alegre 90619-900, Brazil
*
Author to whom correspondence should be addressed.
Submission received: 11 April 2022 / Revised: 7 May 2022 / Accepted: 16 May 2022 / Published: 24 May 2022

Abstract

:
This paper analyzes the relative content of CO2 emissions embedded in regional supply chains in four different countries in Latin America: Brazil, Chile, Colombia, and Mexico. We estimate both the trade in value-added (TiVA) and the CO2 content embedded in interregional and foreign exports, mapping the relative intensity of CO2 emission levels on value chains. For that, we applied an inter-regional input-output model to determine the interplay between the CO2 emission embedded in goods of resource-based industries and their linkages with other economic industries, revealing a map of CO2 emissions on trade in value-added trade from a subnational dimension. The main result reveals an interregional dependence, indicating a higher level of embedded CO2 on value-added in each regional economy for resource-based industries, usually intense in CO2 emissions. This finding has considerable implications for the sustainable development goals of these subnational areas, as the spatial concentration of production leads to an unbalanced regional capacity for promoting reductions in CO2 emissions along with value chains.

1. Introduction

The regional natural resource endowment significantly influences carbon-based emissions embedded in tradable goods and services [1]. The abundant natural resource in Latin American countries links these production and trade patterns to the supply of raw materials, with a relatively low level of value-added for both domestic and global value chains [2,3,4]. In relation to global GDP, Latin America and the Caribbean (LAC) accounted for 7.5% in 2015 (Brazil: 38.2%; Chile: 4.1%; Colombia: 5.9%; Mexico: 20.5%). Exports represented, on average, 28% of the world’s GDP [5]. In LAC, this share amounts to, on average, 21.7%, with important participation in trade based on natural resources (Brazil: 64.2%; Chile: 52.4%; Colombia: 74.2%; Mexico: 33.0%).
For instance, resource-intensive sectors are responsible for a significant share of CO2 emissions worldwide, giving resource-intensive countries a key role in global warming [6]. In recent years, especially in commodities cases, there has been an increased dependence on exports of low processing raw materials, increasing the implicit amount of CO2 from pollution-intensive economic industries through tradable goods in the international market. [7,8,9]. Furthermore, considering the economic geography of countries, natural resources are mainly concentrated in peripherical low-income regions, while the main areas of intermediate consumption are in large business centers [10,11,12,13,14,15,16,17].
Empirical evidence has focused on estimating the global CO2 flows embedded in trade with less attention to the role of subnational value chains. [18,19,20,21,22,23]. In this regard, at the subnational level, regional inequalities have a relevant role in determining the input-output networks, inducing both the direct and indirect generation of CO2 emissions. Consequently, these structural linkages could influence the development of sustainable alternatives for resource-based industries to reduce CO2 emissions. Moreover, input-output interdependencies among subnational regions are an essential analytical tool to provide evidence on how local economies are linked through value chains, directly and indirectly incorporating CO2 into the domestic and international trade [24,25,26,27,28,29].
The intensity of CO2 emissions from resource-based industries is well discussed in the literature [30,31,32]. However, the role of interregional linkages and cross-sector transfers of value-added and embedded CO2 in trade between resource industries and the rest of the regional and national industry structure has not been studied, even within the growing literature on global value chains [33,34,35,36]. In this regard, the first aim of this paper is to analyze the direct and indirect interplay between resource and non-resource industries, computing measures of interregional trade and the international exports from Brazil, Chile, Colombia, and Mexico. In a complex economic structure, sectors or regions are not isolated entities. Therefore, it is crucial to consider the cross-sectoral interdependence of the CO2 embedded in trade among industries [7]. By employing a multisectoral interregional framework, it is possible to identify the spatial-defined patterns of the trade in value-added (TiVA) and CO2-based multiplier effects from intersectoral trade. In addition, it is possible to find the main mechanisms in how the final demand is spatially connected in a specific country [34,35,37]. The second objective is to analyze the regional dimension of the location of resource-based industries and the potential of spreading implicit CO2 emissions through the regional supply chain, which can increase–and determine–the polluting profile of Latin American economies [18,38,39,40,41].
Furthermore, the regional analysis of the selected value chains’ CO2 linkages provides a clear portrait of the relative intensity of CO2 emissions in the subnational production networks for sustainable competitiveness in Latin America, well-known for resource-based dependency [42,43]. In this regard, this paper advances in providing evidence on the role of interregional linkages in terms of CO2 emissions embedded in production and trade-direct and indirectly-into goods and services in the regional supply chain for selected Latin American countries, focusing on the geographic dimension of the resource-based value chains. Brazil, Mexico, Chile, and Colombia have in common a strong dependence of natural resource endowments in value integration chains [38,40,44].
This study contributes to the literature by adding the subnational perspective to case studies with persistent regional disparities and dependence on natural resource-based industries. Generally, Latin American economies have economic clusters that concentrate most on productive local diversification, while poor and peripheral areas are dependent on sectors with low value-added. With this, our empirical strategy adds an integrated approach to the economics of natural resources and their linkages with the rest of the industries. Furthermore, the environmentally extended analysis of subnational supply chains makes it possible to assess the trade-offs associated with trade flows in production networks and CO2 emissions, building a picture of economic and environmental interdependence. In addition, we emphasize the role of inter-industry linkages, which can generate value along subnational supply chains. Specifically, the content of value-added and CO2 emissions transferred from resource sectors to resource and non-resource industries is evaluated from a spatial point of view. This makes it possible to identify the degree of environmental and economic responsibilities and interdependencies.
To estimate the relative intensity of intersectoral linkages of the resource-based industries’ CO2 emissions embedded in trade, the TiVA and the content of CO2 emissions for six selected value chains: (1) Agriculture; (2) Mining; (3) Low-medium-tech manufacturing; (4) High-tech manufacturing; (5) Business services; and (6) Other sectors are calculated. Therefore, we account for the direct and indirect effects of regional trade imbalances within an IO framework, tracking resource-based and non-resource spatial defined-value chains CO2 linkages. First, we calculate the TiVA and hence the CO2 emission content in the trade flows. Then, we use a multiscalar approach to compute the role of regional natural resources endowments integration in both domestic (between subnational regions) and global value chains (from the subnational areas to global markets), expanding the analytical input-output economic-environmental scope [41,42].
The paper is structured as follows: Section 2 presents different dimensions of regional disparities in the four countries, considering their geography of natural resources and spatial economic structures. Section 3 discusses the main aspects of the adopted methodology. Section 4 presents the results of the empirical exercise, and Section 5 discusses the main findings of the document, including suggestions for public policy.

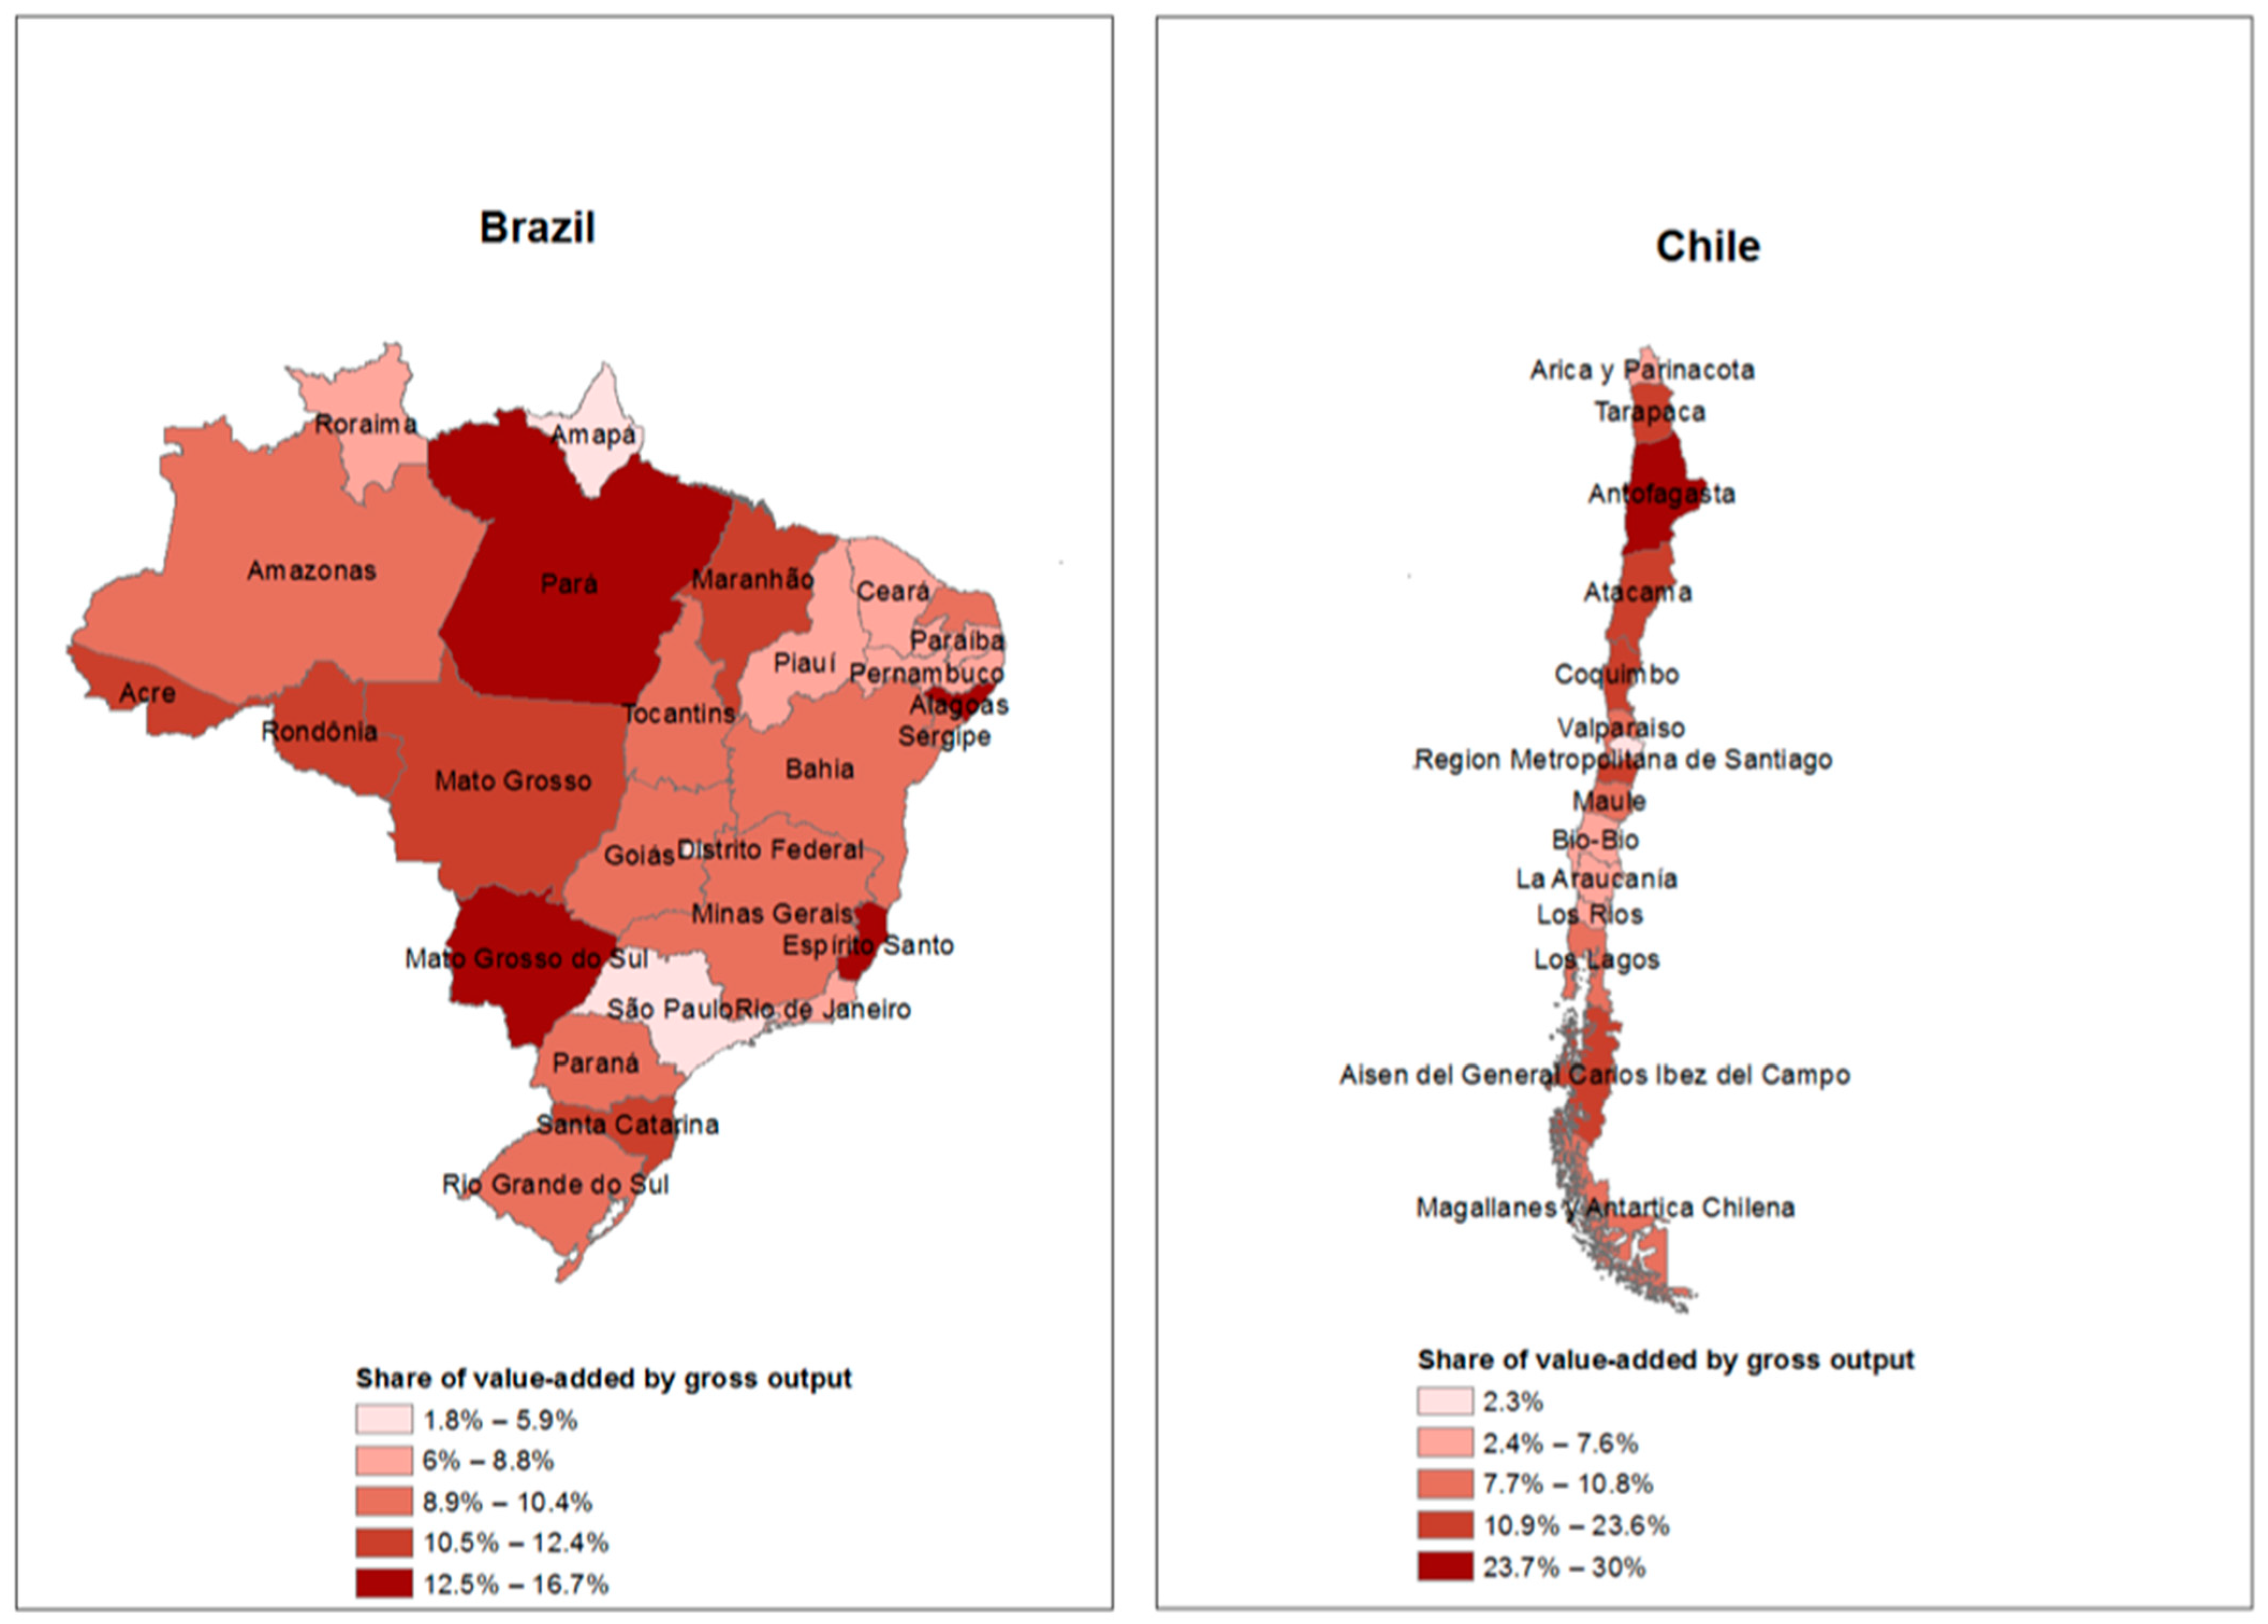
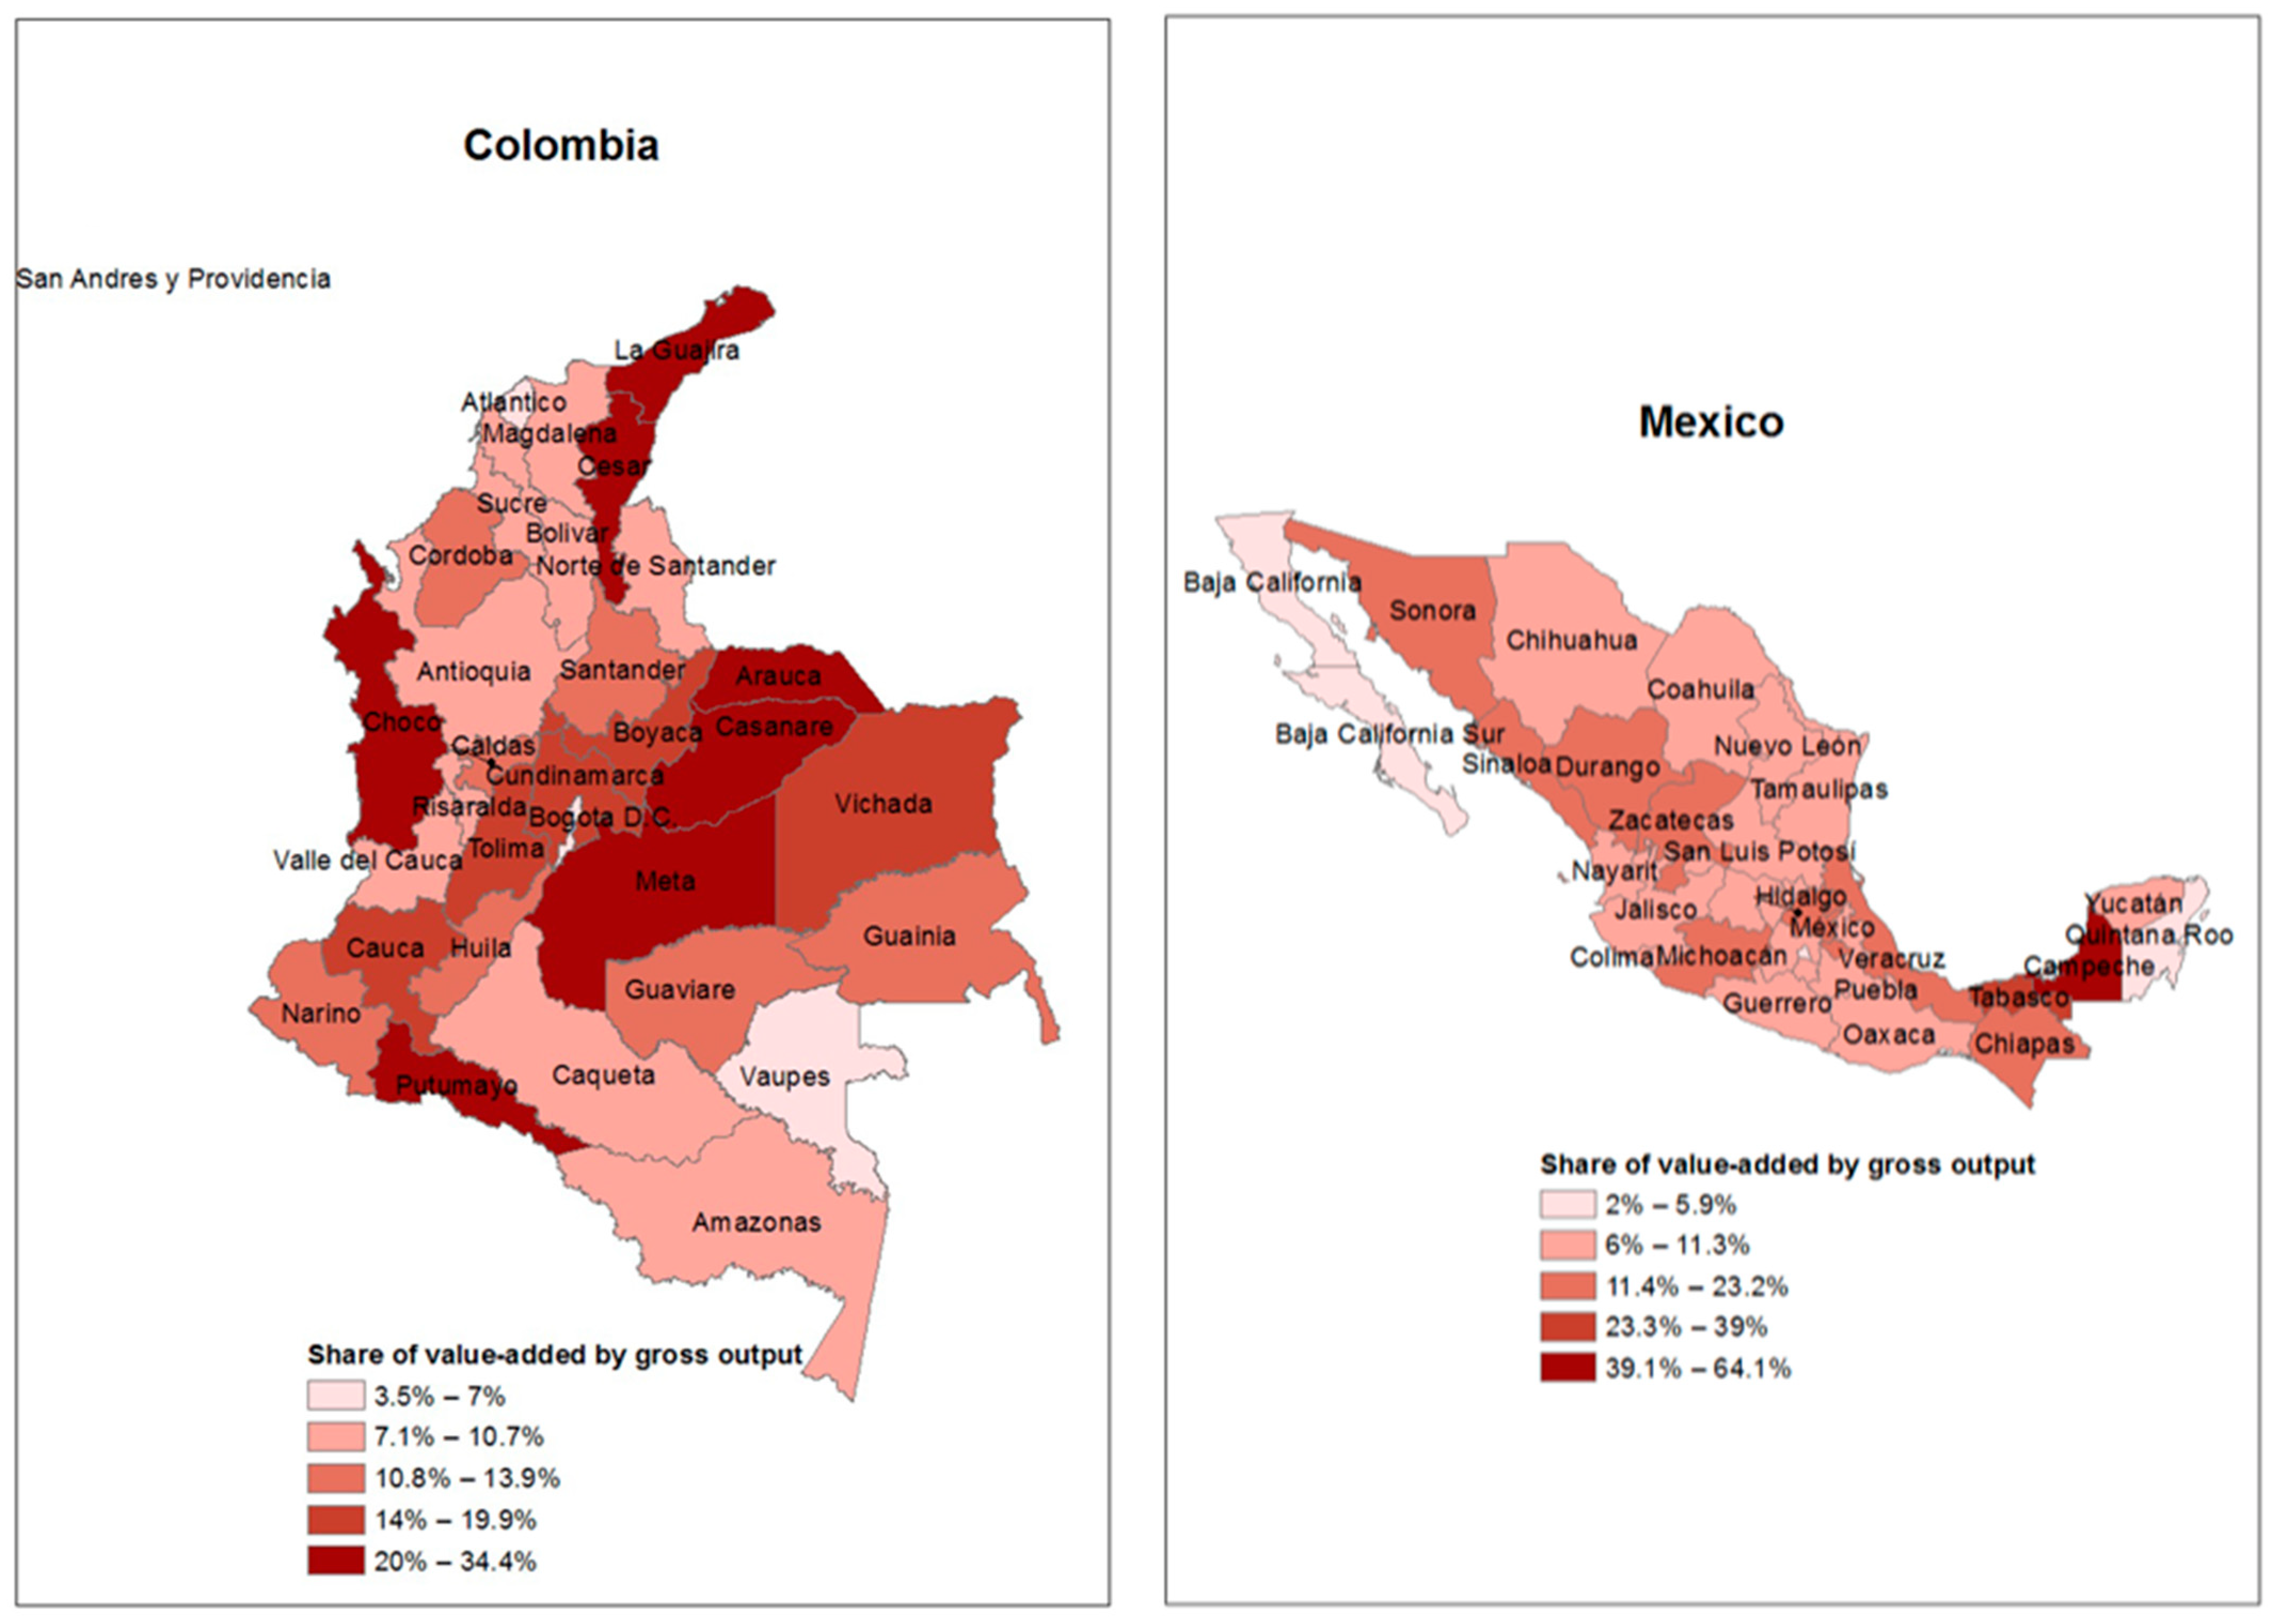
2. Geography of Resource-Based Industries in Selected Latin American Countries

In this study, regional input-output tables were used to analyze the impact of CO2 content directly and indirectly embedded in production and trade. The regionalization of IO matrices requires integrating a broad set of quantifiable dimensions of economic systems under different geographic spatial units of analysis. In this regard, four countries are selected due to the availability of regional IO tables. We consider the case of Brazil, Chile, Colombia and Mexico, whose interregional matrices were estimated by the Regional and Urban Economics Lab of the University of Sao Paolo (Brazil). Although these countries do not represent the entirety of LAC, they are relevant cases of regional studies, as they present subnational inequalities related to the participation of resource-based sectors in different domestic economic centers. Table 1 summarizes the relative participation of these four countries in LAC.
Moreover, using data from four interregional input-output (IRIO) tables, this section shows the main results from the economic geography of Brazil, Chile, Colombia, and Mexico, providing a general picture of the resource-based industries’ location.
Overall, Latin America extends from a wide equatorial zone in the north to a narrow subarctic area in the South, with climatic conditions favoring economic development based on exploiting natural resources. Furthermore, Figure 1 shows the share of value-added of resource-based sectors in relation to the total gross product in each country. The geography of resources associated with climatic factors–such as average temperature and precipitation levels–favors the development of agricultural-related activities. The abundance of mineral reserves allows countries to supply local production chains and international partners. Moreover, the meat industry plays a relevant economic role in pasture zones, especially in Brazil. Even regions with extreme climatic conditions, such as the cold in southern Chile and the higher elevations of the Andes that limit agricultural production, allow for the harboring of marketable native species in addition to extensive areas for grazing, generating inputs for the clothing industry.
The relative importance of resource industries is regionally located in each country due to the spatial distribution of resources. In the Brazilian case, factors associated with the increase in the volume and price of international demand for raw materials since the 2000s, basically minerals, oil, coal, and the meat industry, prompted an increase in national specialization in these activities. The mining economy contributes significantly to the value-added of the states of Pará (North) and Espírito Santo (Southeast), while agribusiness accounts for a good part of the value-added in the Cerrado of Mato Grosso do Sul state (Midwest) in the vanguard of grain and meat exports and the exploration of sugar cane in Alagoas (Northeast).
The main resource-based economic driver in Chile is mining industry. The country is considered the world’s largest producer of copper (in addition to lithium and iodine). It has an important position in other agricultural products such as fruits and lithium carbonate. The primary mines are mainly located in the northern part of Chile, such as Antofagasta, Tarapacá, and the Atacama. In the extreme south of the country, the region of Magallanes focuses mainly on domestic supply, and extractive activities have a significant economic role. Agriculture and forestry are also economically important, especially in the central-south axis, as in O’Higgins, Maule, and Aysen.
In Colombia, the resource-based economy is responsible for the largest share of the regional output, as shown in chart c. The coffee industry stands out, mainly in Antioquia, Valle del Cauca, and Cundinamarca. Moreover, Colombian agriculture, mining and floriculture have an important contribution to the total value-added generated at the subnational level. Activities related to livestock stand out in the Caribbean region, contributing to the meat industry and regional exports.
In Mexico, most states with high development and economic diversification are concentrated in the North, while the least developed ones are further south. There is an important contribution to the national GDP in agricultural industries in Jalisco, Michoacán, and Veracruz. In southern Mexico, the state of Campeche stands out for its high GDP per capita and the relative share of activities in the petrochemical and natural gas industry and fishing and agroindustry.
Input-output linkages have been considered a relevant element in explaining regional differences in countries’ economic development. The leading economic centers of countries tend to be the main demanders of natural resources produced in less industrialized areas. In this sense, it becomes relevant to understand the potential of the linkages of resource sectors with the remaining local and global economies since the intensity in relative pollution generated by these sectors can impose considerable complications on sustainable regional development at the subnational level. In countries rich in natural resources, endowments, extractive and agricultural industries often play a central economic role and have several links with other sectors of the economy. Such aspects challenge the sustainable development path in each country. Intersectoral strategies could enable more remarkable environmental preservation and carbon footprint reduction without undoing economic losses. The next section details the methodological procedures adopted to estimate the intersectoral and interregional contributions of resource industries to the rest of each national economy.

3. Methodology

We are interested in estimating the relative content of CO2-based pollution incorporated in the value chains, encompassing the input-output linkages between natural resource industries and all economic sectors. For this, we have considered two large sectoral groups: (1) resource-based and (2) non-resource-based industries. The classification used is shown in Table 2.
Our empirical exercise focuses on calculating both the regional value-added and the CO2 content in trade to identify the spatial configuration of domestic supply chains and their relative polluting intensity (Table S1). Specifically, we have counted the direct and indirect content embedded in production for meeting the final demand from a subnational perspective (Figure 2).

3.1. Estimation Procedure

In this study, the social accounting dataset is used–a variation of the social accounting matrix or SAM–where revenues (income) and expenses from intersectoral and interregional relationships are shown in order to represent the national economic system. The data are provided by the official statistical agencies of each country-the tables of resources and uses (TRU). The extension of the national matrices for a regional structure was estimated by the Regional and Urban Economics Lab (NEREUS) of the University of São Paulo using the hybrid method Interregional Input-Output Adjustment System (IIOAS), which guarantees consistency with the information from the national input-output matrix. Different applications with the IIOAS method were carried out for different regional contexts, such as in [45,46,47,48,49]. In this regard, the data used in the study seek to capture the specificities present in the productive structure of each region of the countries analyzed. Therefore, the final structure given by the data provides a comprehensive and consistent record of national income accounting relationships across different sectors and regions. It is based on a fundamental principle of general equilibrium of economic systems, in which each revenue (income) has a corresponding expenditure. The framework provides a comprehensive record of a regional economy’s intersectoral and interregional relationships, including intermediate and final demand linkages. For our purposes, the framework offers the advantage of explicitly linking consumption and foreign trade patterns to the intersectoral framework of intermediate demand. In addition, the model allows for an environmental extension, in which the intensive use of CO2 generated and transferred through intersectoral relationships is accounted for to meet interregional (domestic) and international (exports) final demand. The input-output models with environmental extension are consolidated in the economic literature of socio-environmental accounting and provide the basis for determining the relationship between production systems and their impact on the generation of contaminants and production networks [14,18,34,50,51,52,53,54,55,56,57,58,59].
We first compute the trade in value-added (TiVA) throughout value chains based on extending the global value chain (GVC) approach to an interregional (subnational) input-output system [7,60,61,62]. We have adopted a demand-driven perspective [27,63,64,65], entertaining the idea that the use of intermediate inputs can affect the production process other than the trade in final goods, leveraging the promotion of linkages throughout the supply value chain.
Formally, let us consider an interregional input-output model (IRIO) for each country with J industries groups (labeled as i ,   j ), R subnational regions ( r ,   s ), and U final demand components to attend the interregional domestic ( U r , U s ) and foreign ( U R o W ) consumption, as represented by Table 3. The model is based on the main fundamentals of the general equilibrium of a social accounting matrix (SAM), recording the interrelationships of a regional economy, including intermediate uses and final demand. For our purposes, the IRIO structure offers the advantage of linking consumption and interregional trade patterns to the interindustry structure of intermediate demand at the subnational (interregional) level.
Within an IO framework, the intermediate consumption from an industry i to j , from a subnational region R to another region S , is represented by z ij RS ; A is the technical coefficients’ matrix equal to the ratio between z and the industrial output x j , A = Z x ^ 1 . We can represent the intermediate and final demand as follows. Therefore, the aggregated regional gross output can be expressed as follows:
x = Z + F i = A x + F i
where F is the final demand, and i is a summation vector of ones. This relationship can be expressed as:
x = I A 1 F i = L F i
where L = I A 1 is the well-known Leontief matrix. The IRIO system allows us to analyze the specific regional and industrial interdependencies in terms of linkages and input-output value chains networks. In a formal way, one could estimate the gross output for two sectors (supposing label 1 refers to resource-based industries and label J ( J = 1 , , J ) as non-resource industries) for two regions (R and S) considering the relationship between the Leontief matrix and the final demand F:
x 1 R x j R x 1 S x j S = L 11 R R L 1 j R R L 11 R S L 1 j R S L j 1 R R L j j R R L j 1 R S L j j R S L 11 S R L 1 j S R L j 1 S R L j j S S L j 1 S R L j j S R L j j S S L j j S S Interregional   Leontief f 1 R R f 1 R S f 1 R , R o W f j R R f j R S f j R , R o W f 1 S R f 1 S S f 1 S , R o W f j S R f j S S f j S , R o W Exports Final   demand i
For our empirical purposes, we are interested in estimating the subnational bilateral trade in both value-added and CO2 terms. For example, the value-added generated by a set of resource industries (let us call “sectoral group 1”) and embedded in all industries’ final demand for both interregional and exports destinations can be expressed as follows:
va 1 R = v ^ 1 L F i
where v ^ 1 is a diagonal vector of value-added coefficients for region R and the sectoral group 1 , with zeros elsewhere ( v ^ 1 = v 1 R 0 ). Equation (4) considers the total value-added for attending to all final demand; that is, the sum of all industries computing both interregional (between subnational regions) and global demand (exports). Besides, following [49,60,62], we can measure the interdependence between the value-added and CO2 regional content of a specific sectoral group directly and indirectly embedded in the trade flows of another sectoral group. Our application also considers the trade flows for different geographical scales, accounting separately to trade for interregional and foreign destinations. We deal with that by treating both U RS and U R , RoW components separately from the F matrix.
Thus, for an origin region R , the trade-based measure can be estimated by considering the relevant components of each vector, i.e., value-added and both U components of the final demand. From region R, the value-added content generated by the sectoral group 1 (for example, the set of resource-based industries) that is direct and indirect embedded in the interregional final demand of sectoral group j can be expressed as follows:
va 1 j RS = v ^ 1 R I A 1 0 f j R S U R i
For foreign destinations, we computed the domestic production embedded in exports’ final demand as suggested by Haddad et al. (2020). The value-added of industry 1 in region R that is embedded in exports of region 2 can be expressed according to:
va 1 j R , RoW = v ^ 1 R I A 1 0 f j R , R o W U R o W i
According to the same estimation procedure, we have counted the CO2 content embedded from one value chain group in another, replacing the value-added coefficients, v ^ , by the CO2 industry-level intensity represented by φ ^ , as it is given by:
φ s = P s x s
where P s represents the total emissions and x s the total output of each industry. Therefore, φ is the vector representing the direct emissions of each industry in the IRIO model. The total direct and indirect CO2 emissions are measured by multiplying the diagonalized vector φ ^ by the Leontief inverse matrix. In this regard, from sector 1 of region 1 to the final demand of an industry j located in the subnational region r , the amount of implicit emissions embedded in trade (EET) can be measured as:
EET 1 j RS = φ ^ 1 R I A 1 0 f j R S i
Similarly, the implicit CO2 emissions embedded in foreign trade exports can be measured as follows:
EET 1 j R , row = φ ^ 1 R I A 1 0 f j r o w U R o W i
In this regard, we could map how much of the CO2 emissions generated by the resource industries are directly and indirectly incorporated into the trade of both resource and non-resource sectoral groups.
Finally, the last stage was estimating an index representing the relative polluting intensity among value chains. Herein, we are interested in estimating the trade-offs between embedded CO2 emissions from resource-based industries into seven selected value chains (computing for two large sectoral groups, i.e., resource-based, and non-resources industries). Therefore, a relative intensity index was calculated, computing the CO2 emissions content in relation to the VA bilateral trade that flows at the subnational level, following [49,61]. Specifically, the index was measured as the ratio of VA trade in relation to all VA traded inside each country divided by the ratio of CO2 trade in relation to all CO2 traded inside the whole economy. In other words, we first calculated two ratios and, thus, divided one by the other. Formally, let us consider the relative importance of each interregional transfer of both VA and CO2 in each bilateral trade flow from a region R to another region S , as follows:
RPI 1 j RS = va 1 j R , s va EET 1 j R , s EET
We calculated the average of each ratio for both trade sides (seller and buyer). In specific, let us consider the average of R P I R . for each region R , computing separately the seller side average (i.e., from R to all other regions S = 1 , , S , computing the VA exports in relation to CO2 exports). Further, the same average from the buyer side (i.e., from regions S to region R, computing the trade volumes of VA and CO2 imported) is calculated. Formally, for a region R in a country with n subnational regions, the final index can be measured as follows:
R P I R = RPI RS n RPI SR n
where n is the number of subnational regions in each country. In this regard, we have computed, on average, the interplay among VA and CO2 trade flows between all subnational regions inside each country as intensities values. Values greater than 1 indicate that bilateral trade is more intense in implicit CO2 emissions than traded VA, suggesting that the flow along the supply chain is intense in CO2-based pollution. Values less than 1 indicate the opposite.

3.2. Data

We use four interregional input-output tables estimated by the NEREUS-USP, with the industrial and regional structure described as follows: (1) Brazil–67 sectors, 27 regions, base year 2015, in BRL millions. (2) Chile–12 sectors, 15 regions, base year 2014, in CLP thousands. (3) Mexico–42 sectors, 33 regions, base year 2013, in MXN millions. (4) Colombia–54 sectors, 33 regions, base year 2015, in COP billions. We harmonized the sectoral structure of each IO table with the sectors associated with the six defined value chains. The sectoral emissions data on the production side were obtained from the EORA national IO tables [67], which consider the EDGAR database estimates. Although restrictive for the regional analysis, we assume that the sectoral coefficients are the same for all regions of each country. Table 4 shows the total emissions for each of the six value chains for each national economy included in this study. In general, we observe that the resource sectors (agri-food, mining, and resource-based manufacturing) contribute, on average, 33% of national emissions in Brazil (28%), Chile (47%), Colombia (33%), and Mexico (23%). These differences are explained by the relative importance of the sectors that make up each country’s value chain.

4. Empirical Results

This section has three parts. First, we analyze the interplay between resource and non-resource-based industries, accounting for the CO2 and value-added embedded in production and trade between industries in each country. Second, we analyze the geography of the regional supply chain, identifying the main regional sources of VA and CO2 directly and indirectly embedded in trade flows. Finally, we explore the relative polluting network at the subnational level, mapping the regions and value chains with greater environmental responsibility in each country.

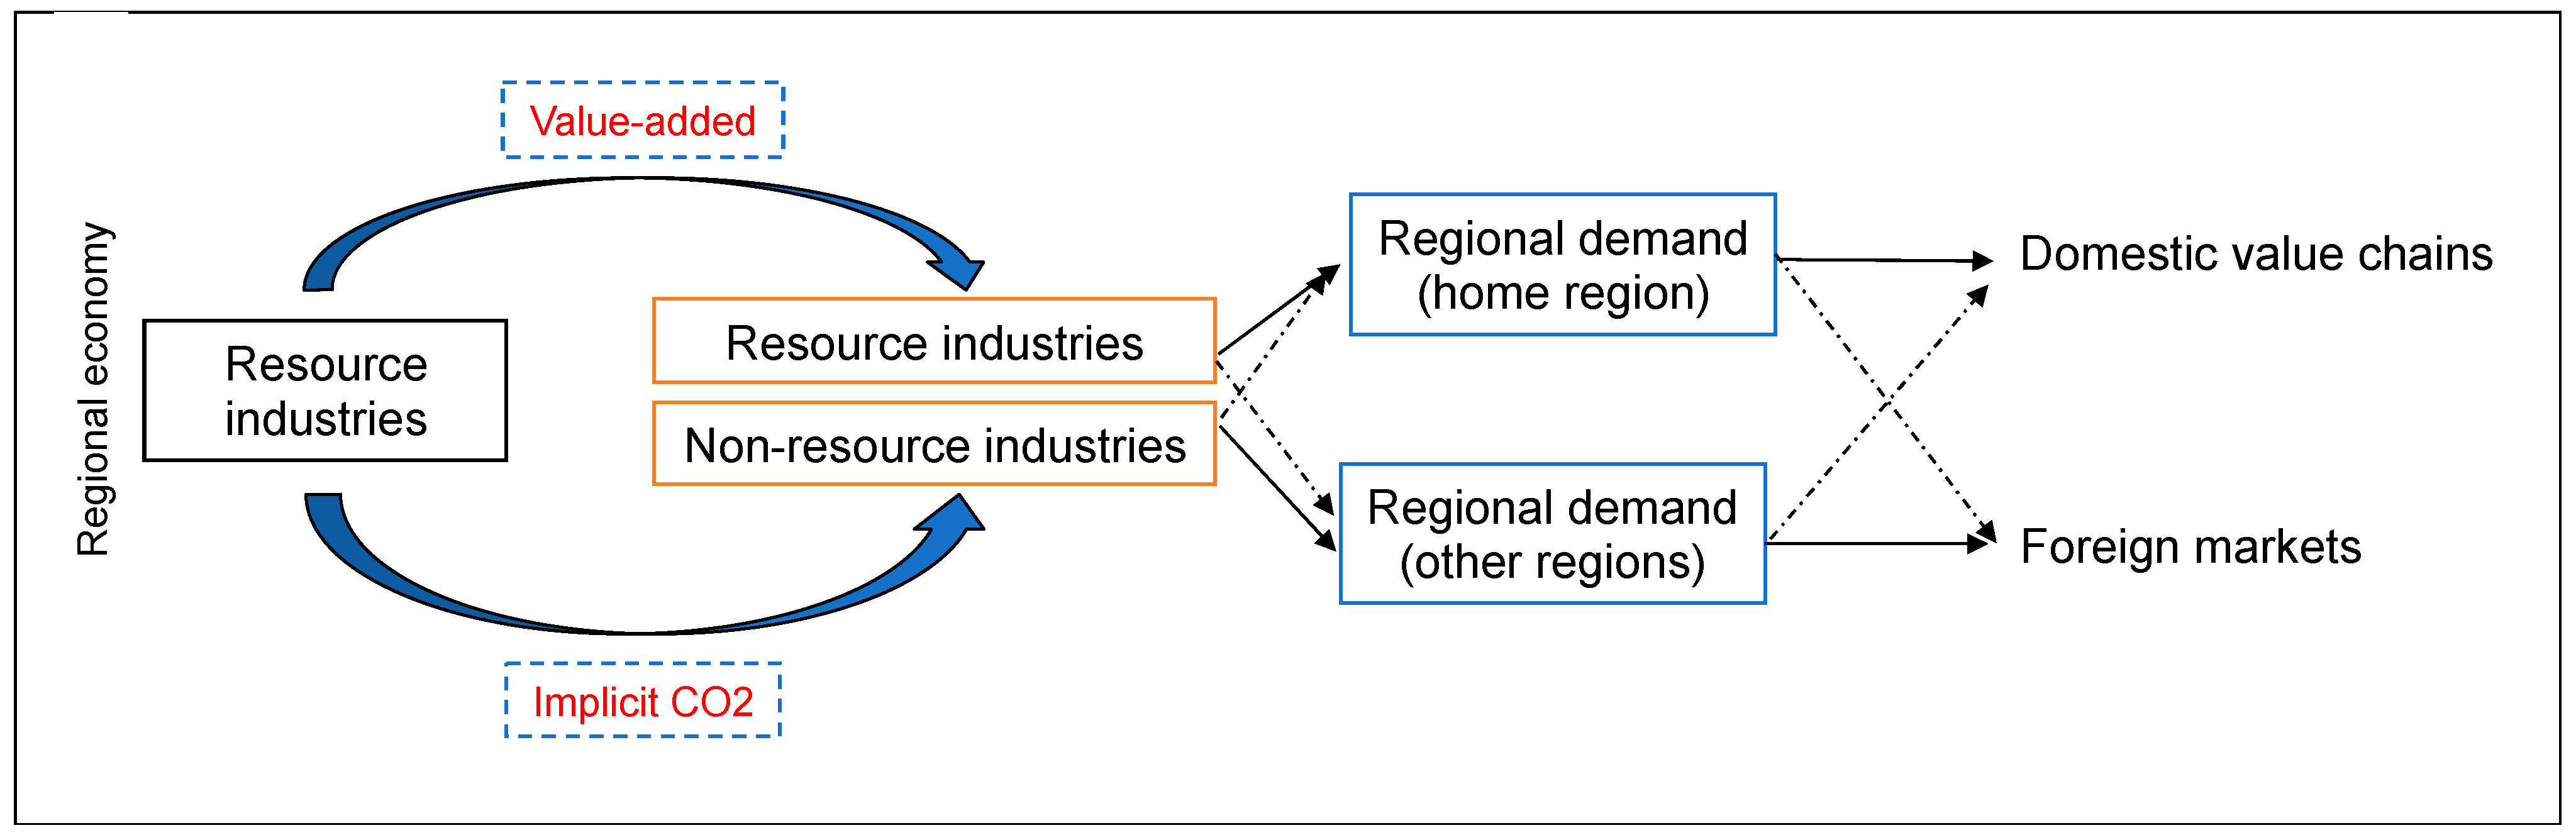
4.1. Interplay between Resource and Non-Resource Industries

Table 5 shows the interindustry TiVA from the resource and non-resource industries to meet the whole economy final demand (for both inter-regional and export destinations) for all countries analyzed. It is interesting to note that the resource-based industries (usually primary sectors or directly linked to them) –present lower levels of VA. Nevertheless, these same industries are responsible for the highest shares of the CO2 embedded in the trade for each sector and country. For example, 23% of the VA trade for meeting the final demand comes from the resource-based sectors in Colombia, while this share in Mexico and Chile is around 18% and 7% in Brazil. Given the upstream position along with the value chain, the manufacturing, and services business sectors have the larger VA shares– accounting for the non-resource industries.
Table 6 shows the relative content of VA and CO2 transferred from the resource-based industries to the interregional (domestic) and foreign exports’ final demand in all industries for each country. In general, intersectoral transfers from resource-based activities account for 48% of the total domestic trade (interregional) in Brazil, 36% in Colombia, 47% in Mexico and only 7% in Chile. It is interesting to observe that the low contribution of VA from resource-based industries to intragroup final demand–i.e., from resource VA to resource industries’ final demand–highlights the agro-export and resource-dependent profile of the Chilean economy. At the same time, in countries such as Brazil and Mexico, the value-added of resource industries is outstanding, contributing significantly to the national (and regional) gross domestic product.
However, when we contrast this intra-sectoral relationship by accounting for the implicit content of CO2, the results point to the potential for domestic embedded of this greenhouse gas. More than half of the carbon incorporated in Brazil, Colombia, and Mexico is absorbed by their own economies (domestic demand). The exception is Chile, which embeds 31% of the CO2 emissions domestically and exports the rest internationally, confirming the country’s level of trade openness compared to the rest of Latin America. The lower part of Table 5 shows intersectoral transfers from resource industries to meet the final demand of non-resource-based sectoral groups. Again, attention is drawn to the importance of domestic (subnational) value chains, which have much of the value-added generated by resource-based sectors. Intersectoral demand from manufacturing industries and service sectors responds to the sectoral pattern of results.
Accounting for the TiVA from resource-based industries to attend the final demand of non-resource-based industries represents almost two-thirds of the total trade in Brazil and Colombia, while representing 46% and 44% for Chile and Mexico, respectively. This pattern indicates that the carbon footprint of inter-industry relations points to a considerable degree of responsibility on the domestic demand side. In other words, input-output relationships between sectors and subnational regions are essential drivers of CO2 emissions in resource-based industries in source regions–generally poorer and specialized areas. The relative share of VA and CO2 in exports is smaller than the total embedded domestically consumed in all countries. Consequently, the spatial organization of the regional supply chain is a relevant element to determine the origin and destination of CO2 emissions generated by the production and trade in each analyzed country.
While the empirical literature has focused on accounting for CO2 embedded in international trade, our paper points out the importance of including the regional (or local) dimension of supply chains. The proposed estimation method defines the local value-added content embedded in interregional flows (domestic chains) and exports (destined to global chains). The analyses of vertical specialization allow identifying market opportunities to add more value to production and increase sustainable regional trade competitiveness [68]. The decomposition shows the value-added content of the resource and non-resource-based industries embedded in interregional and international exports, describing the structure of selected value chains. The following section extends this technique to compute the CO2 embedded in the trade of goods in value chains.

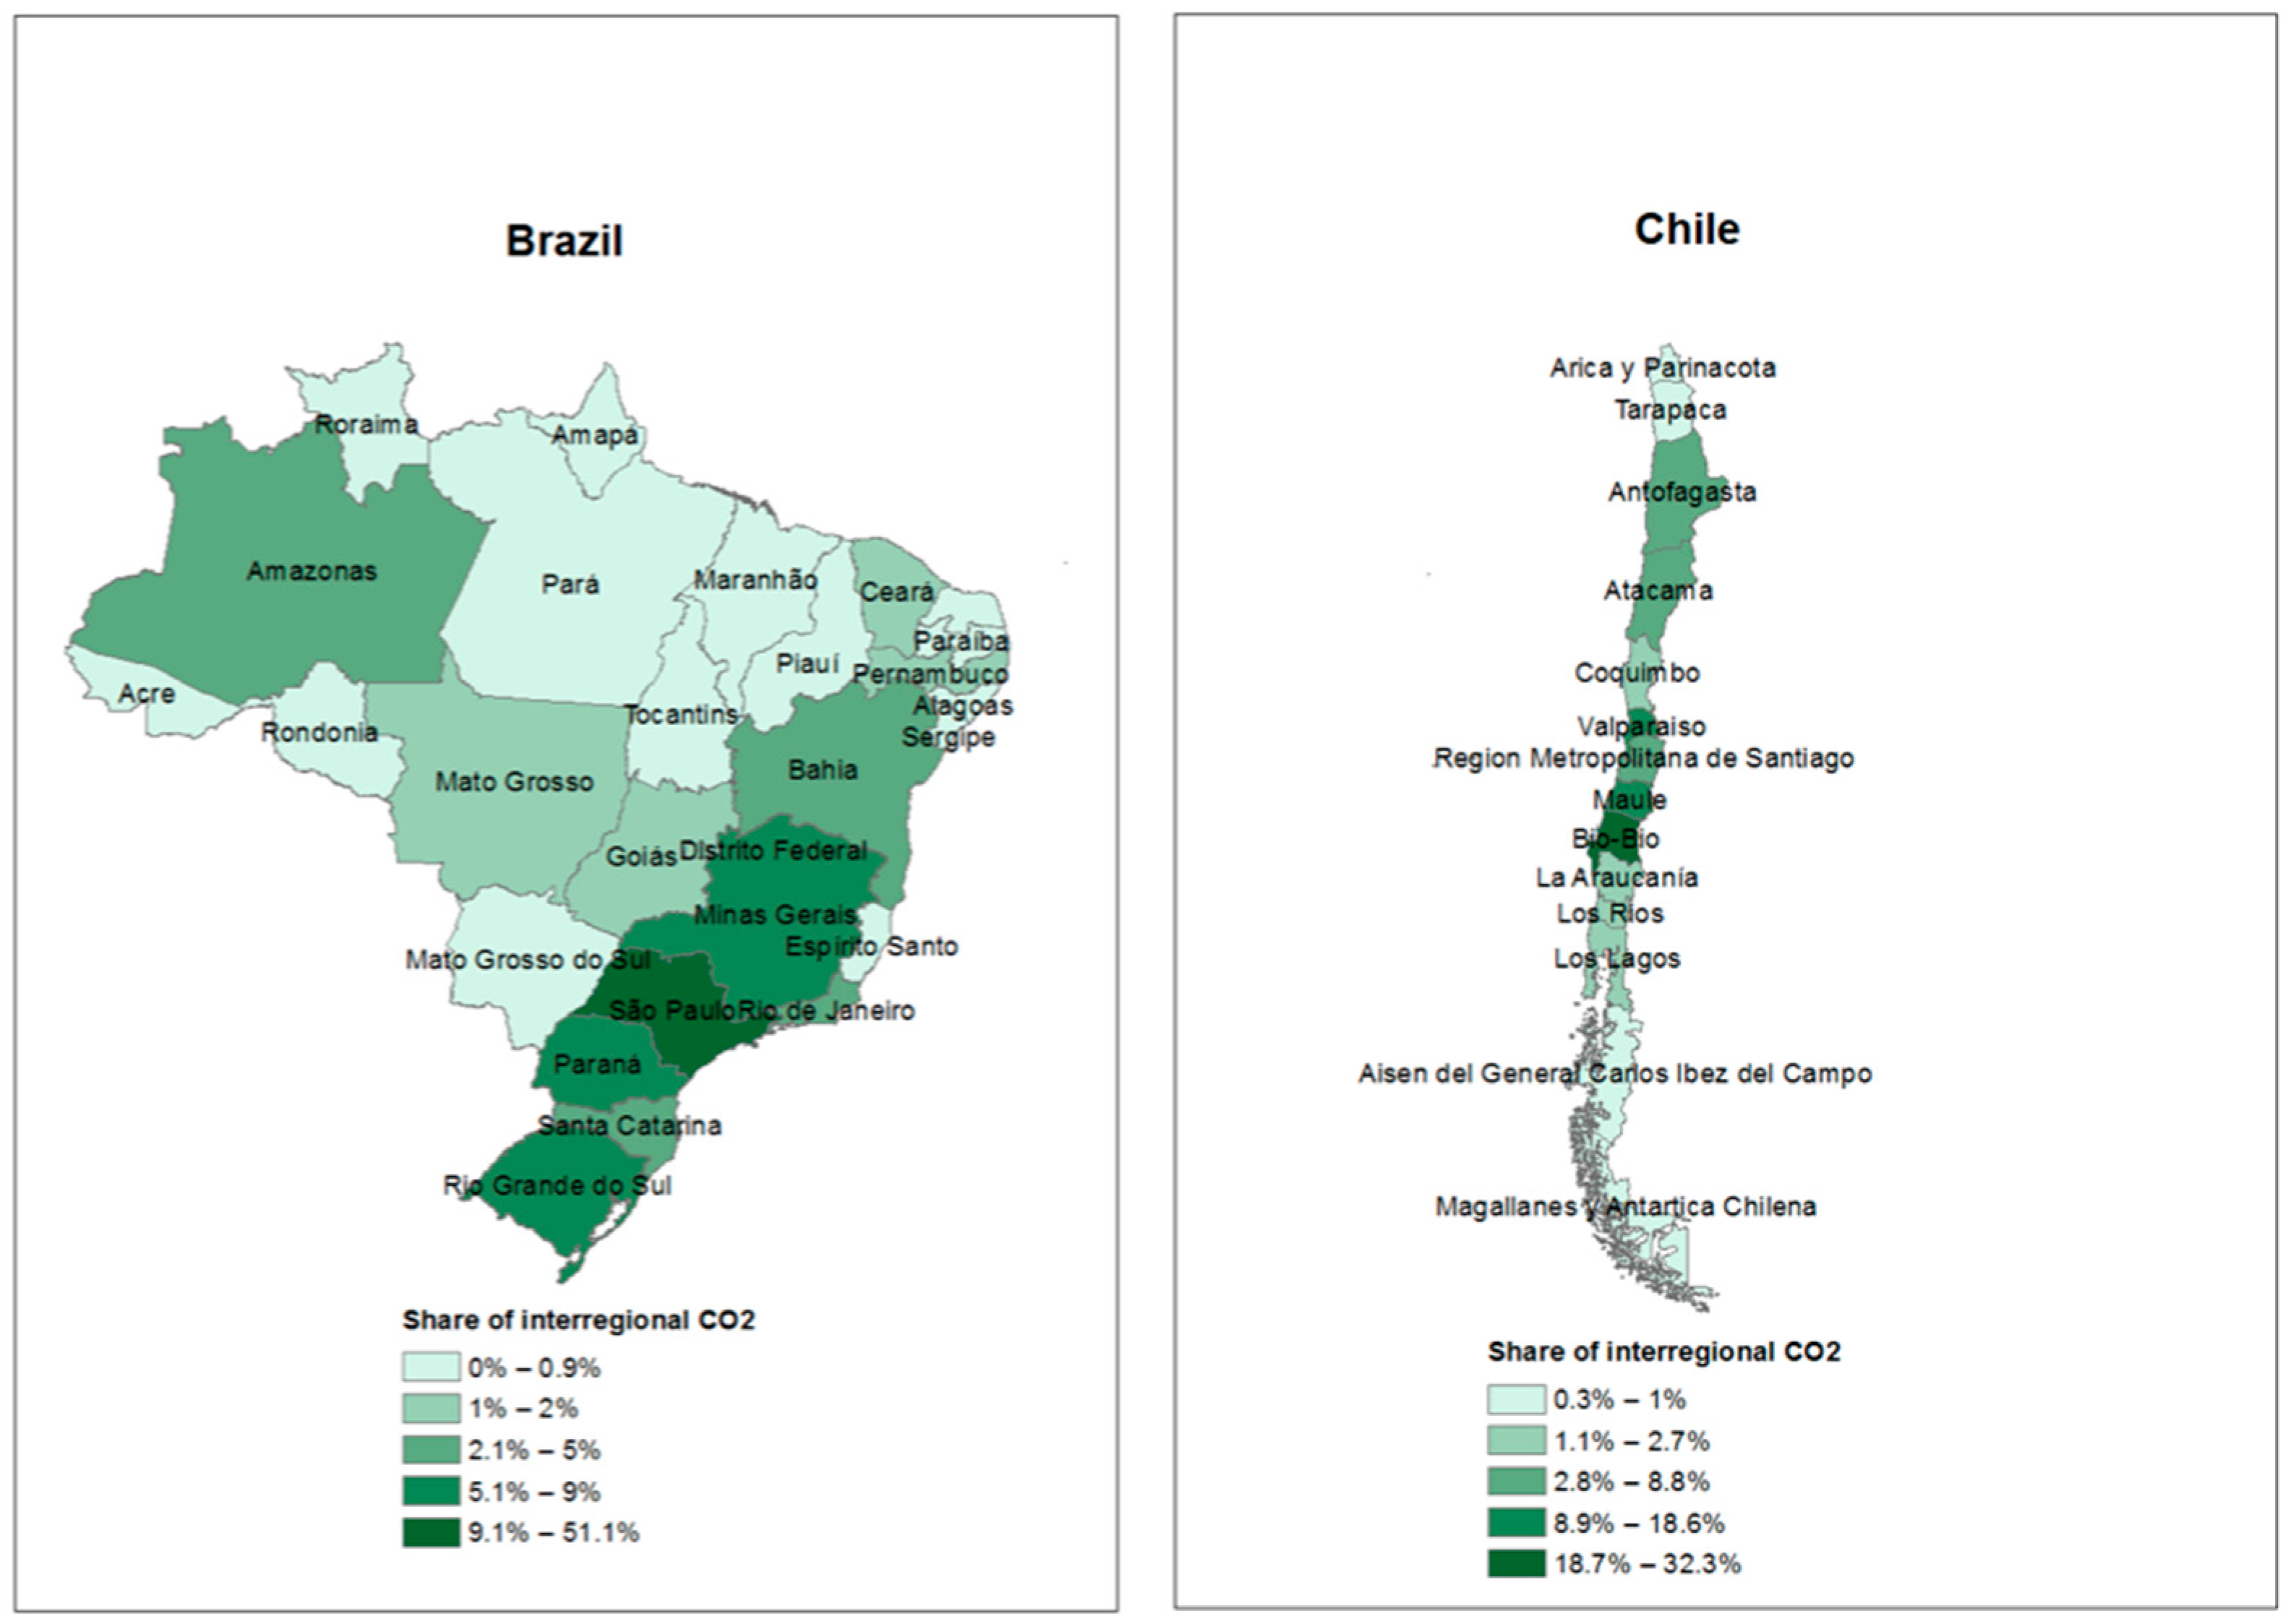
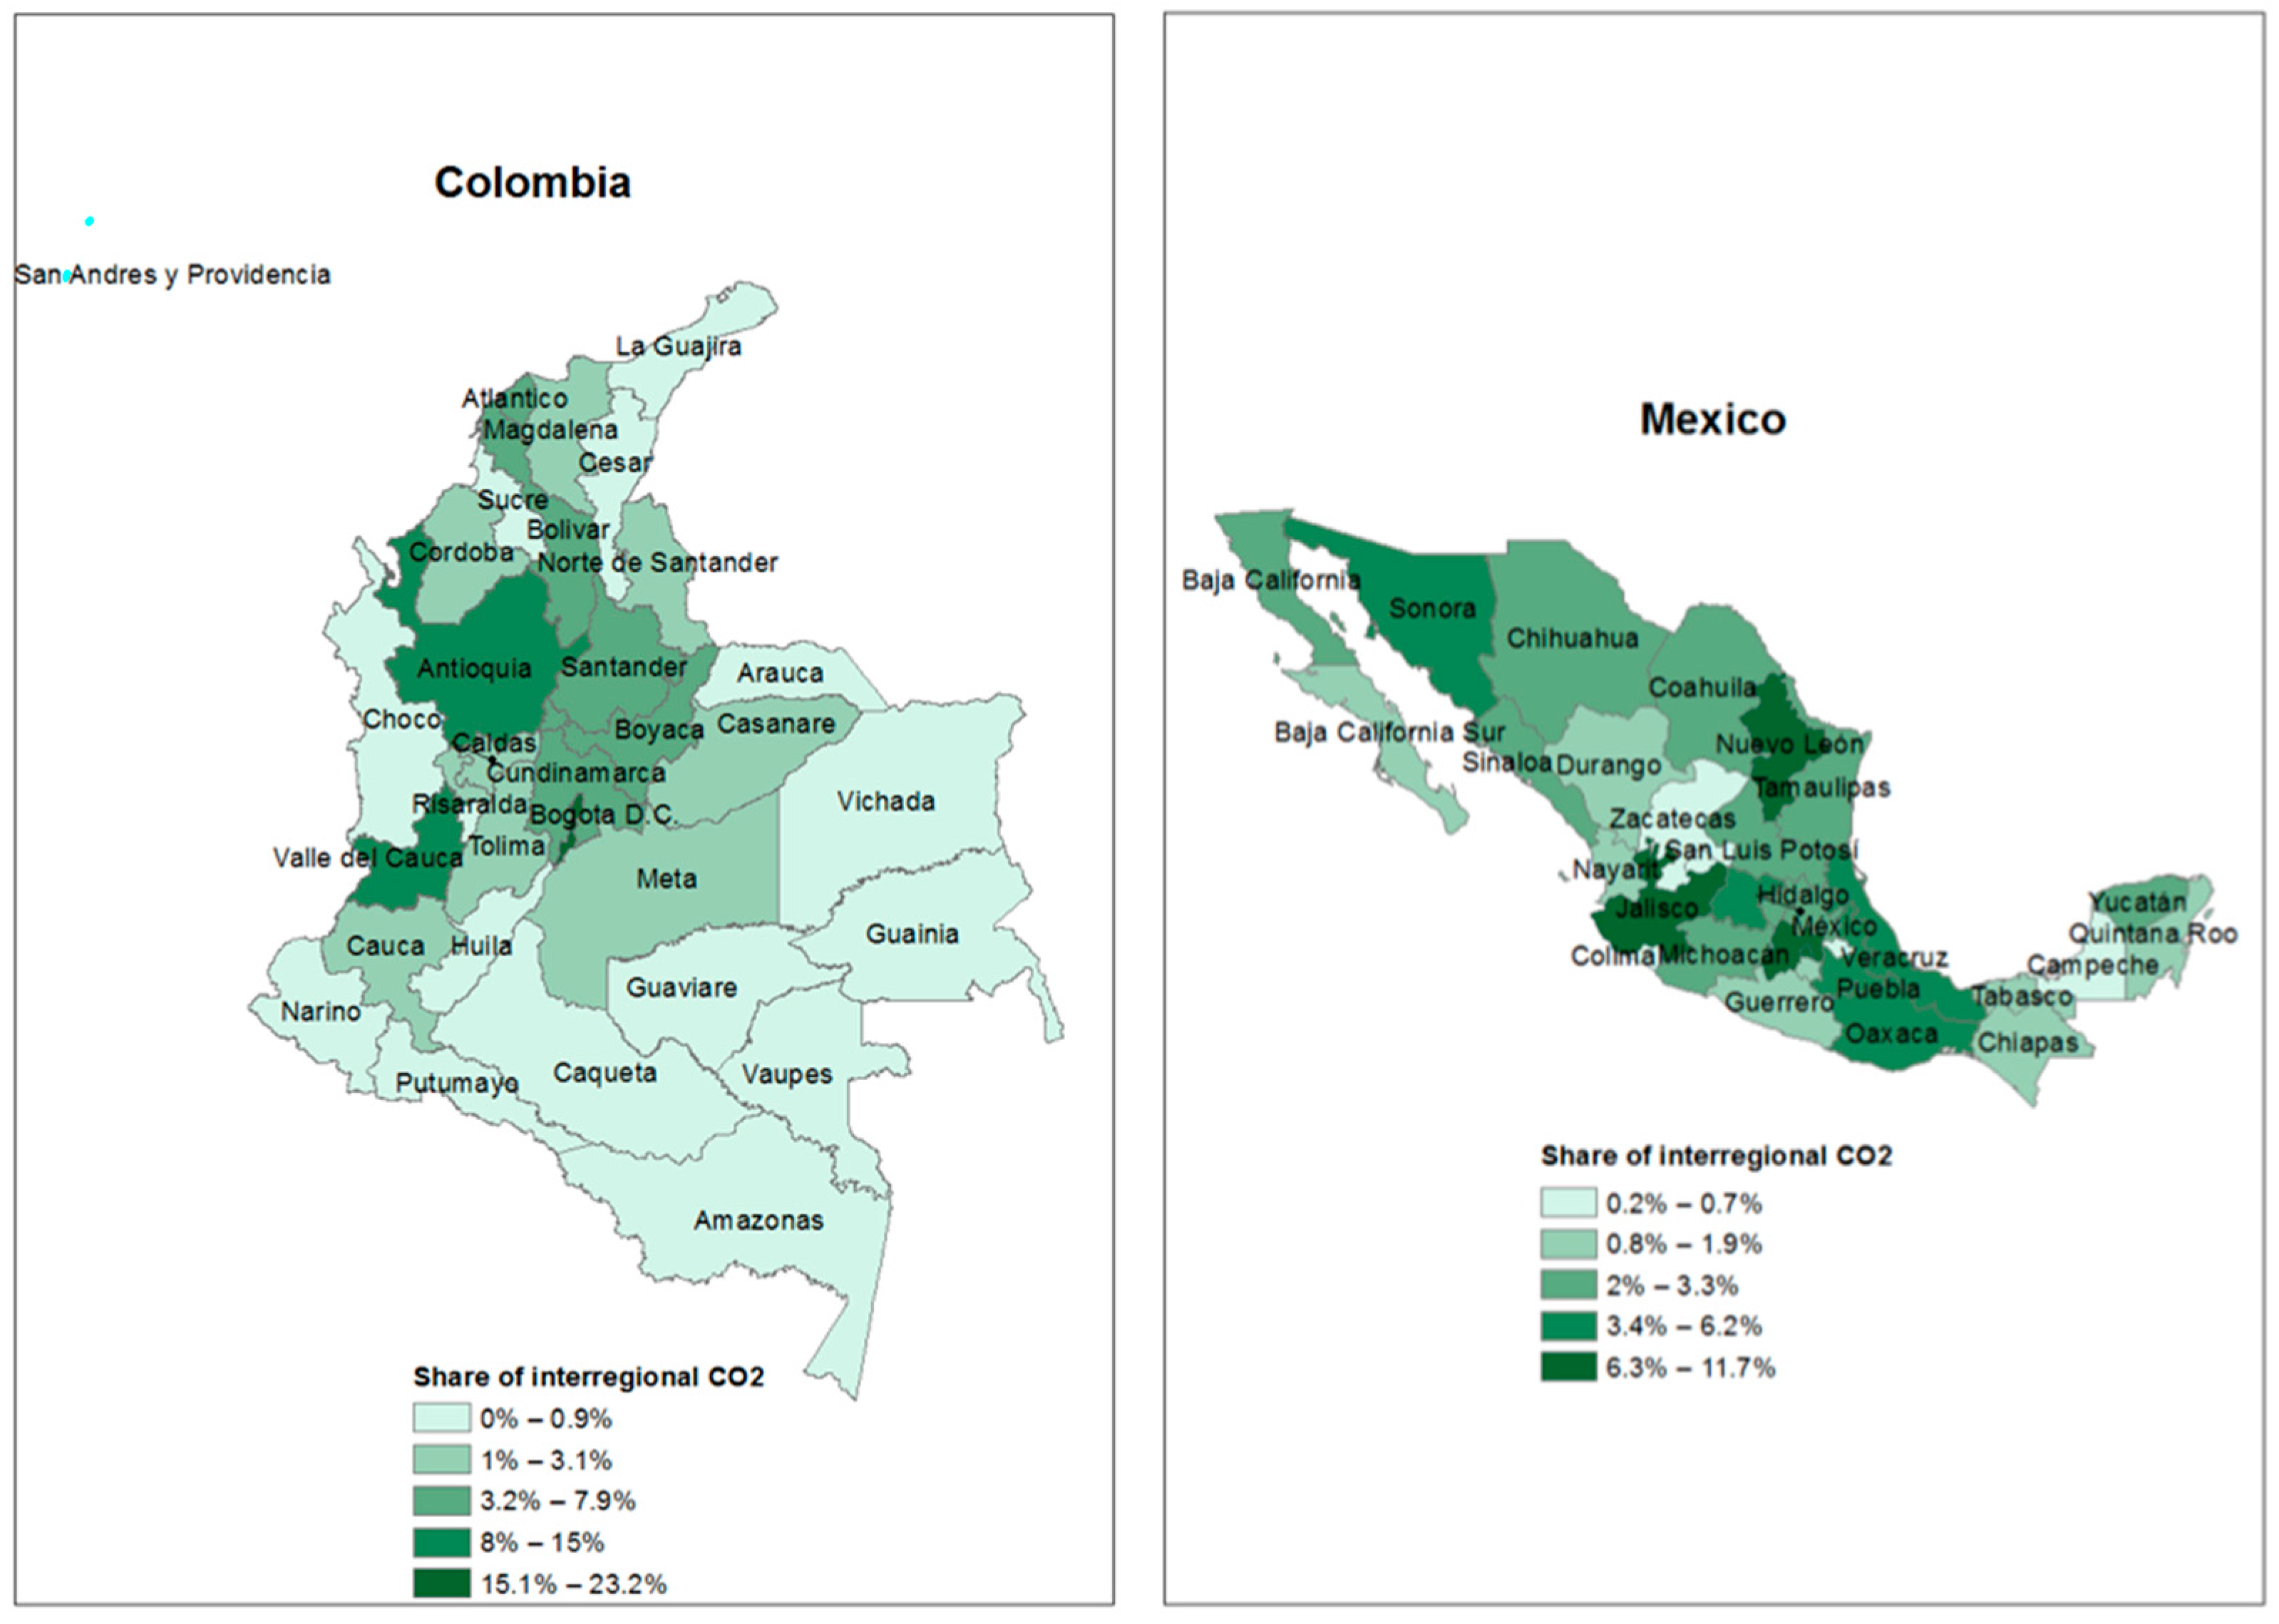
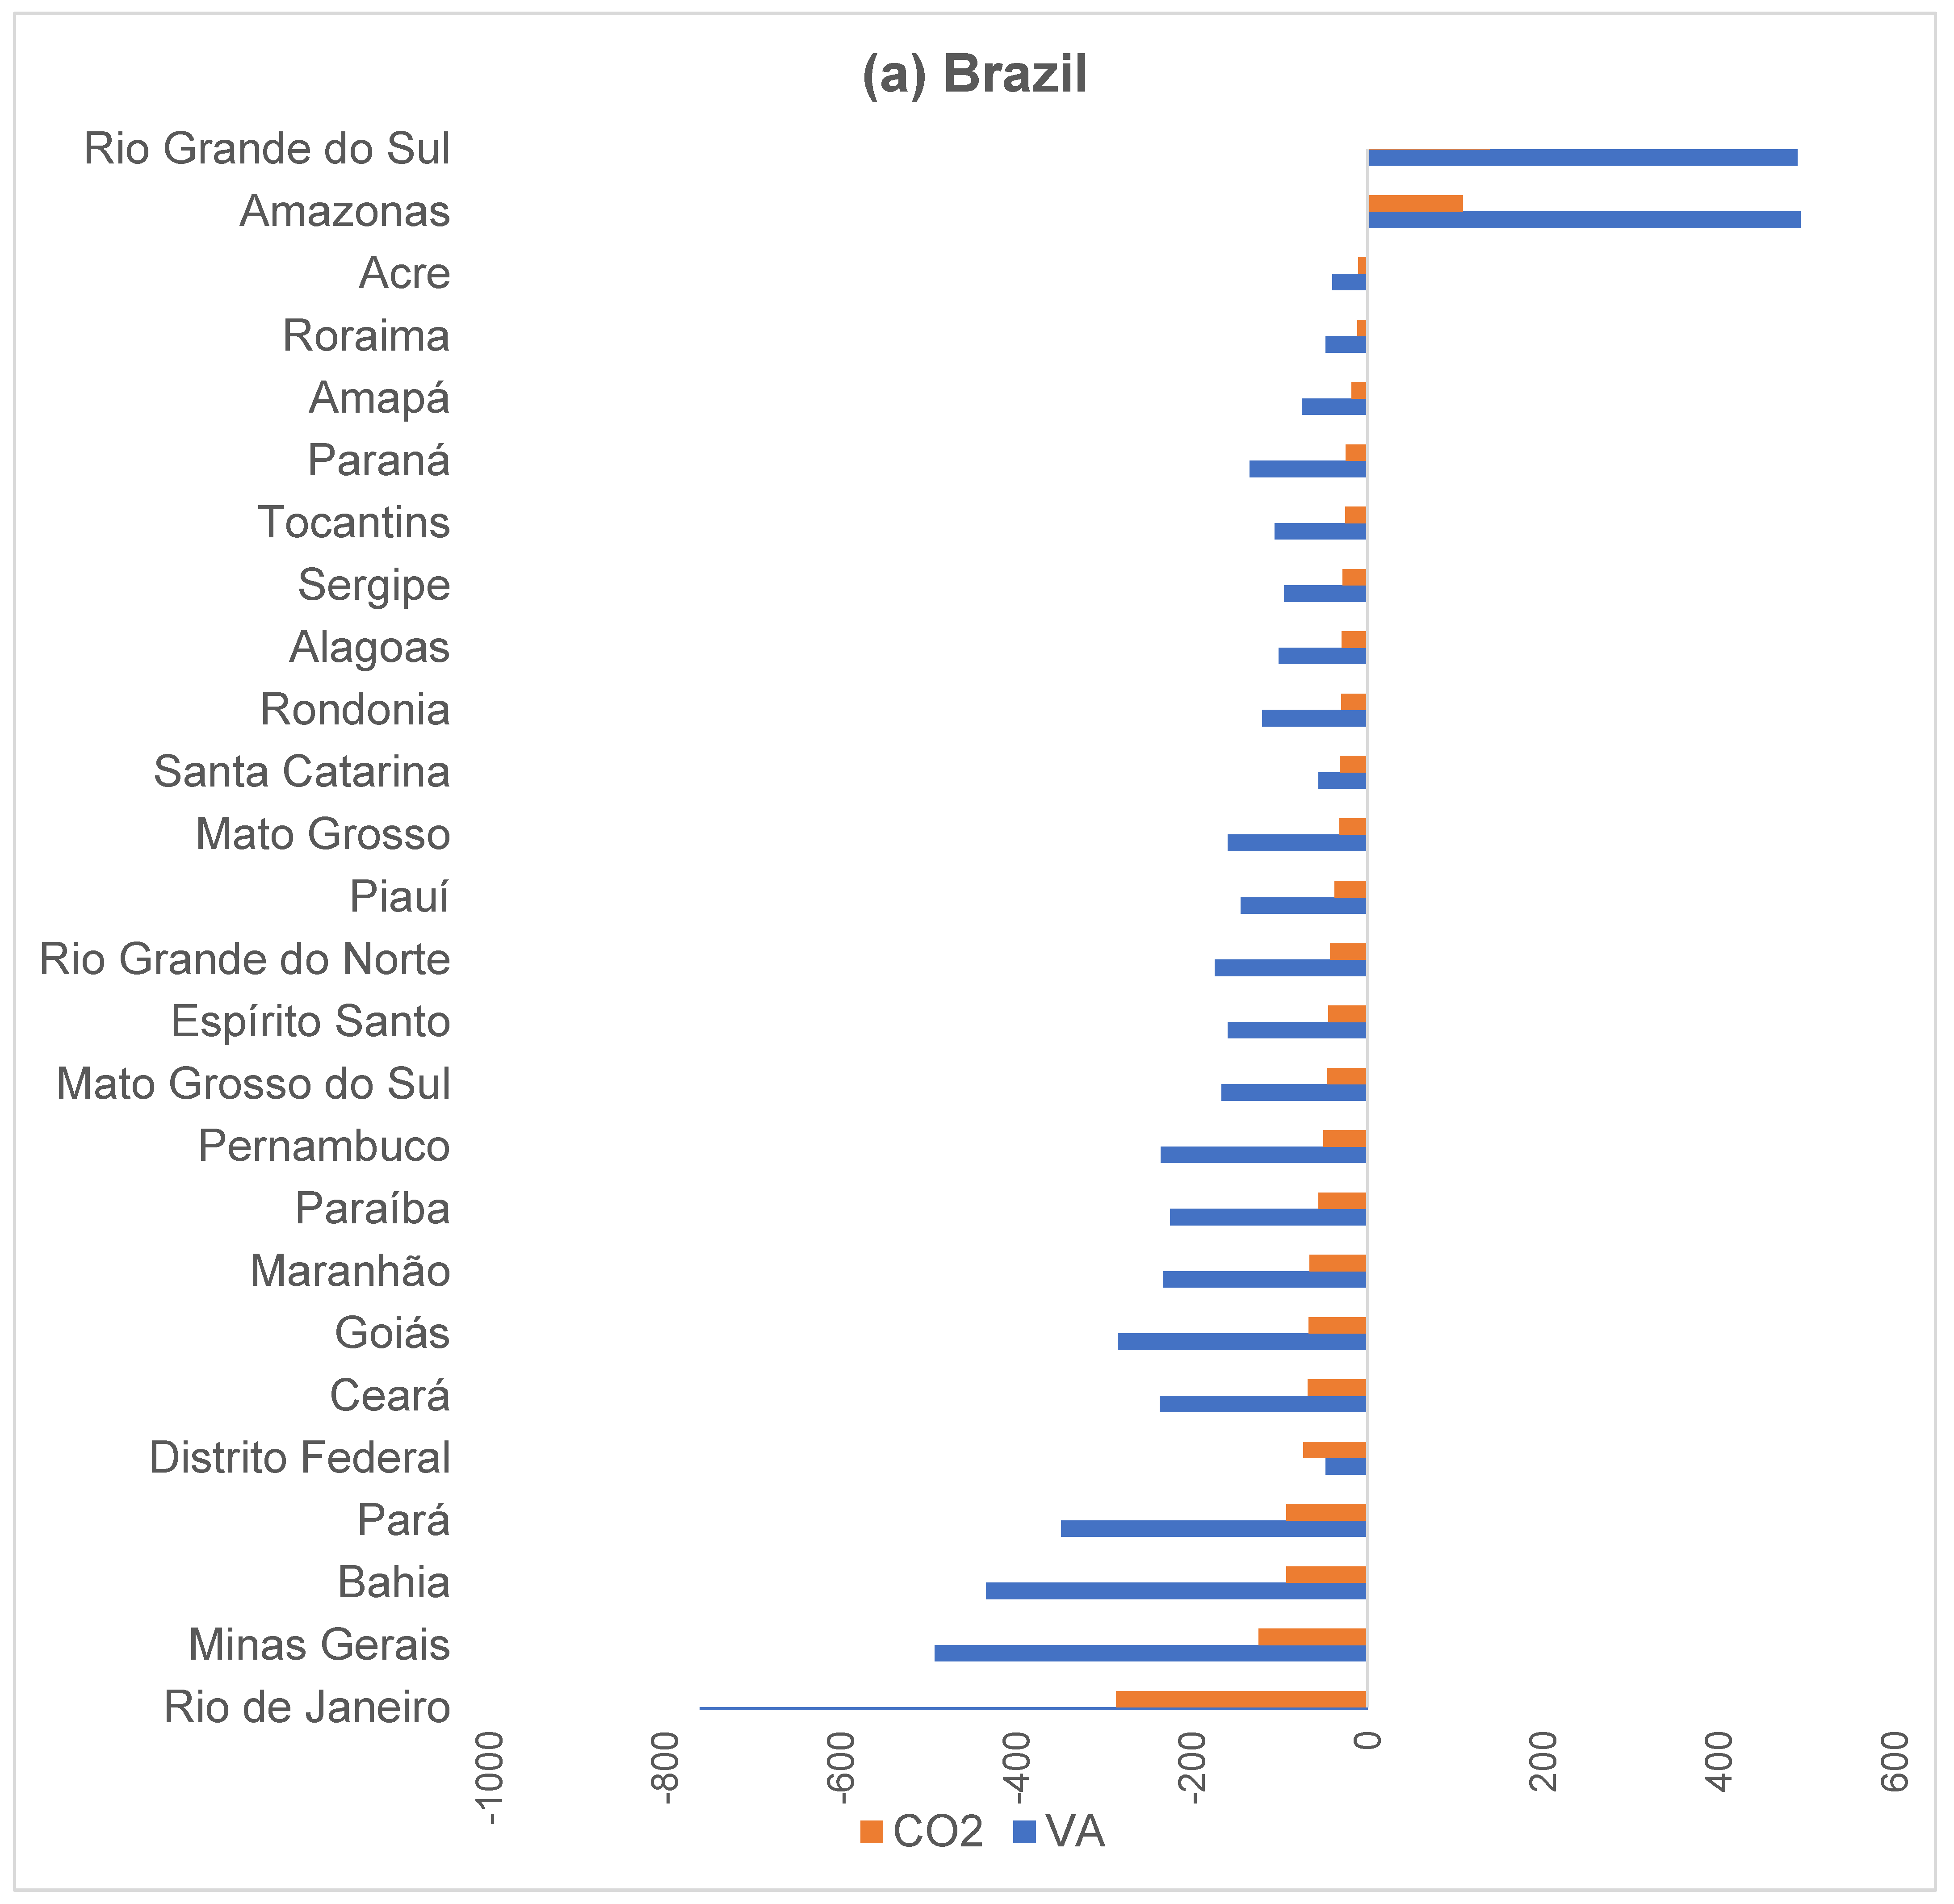
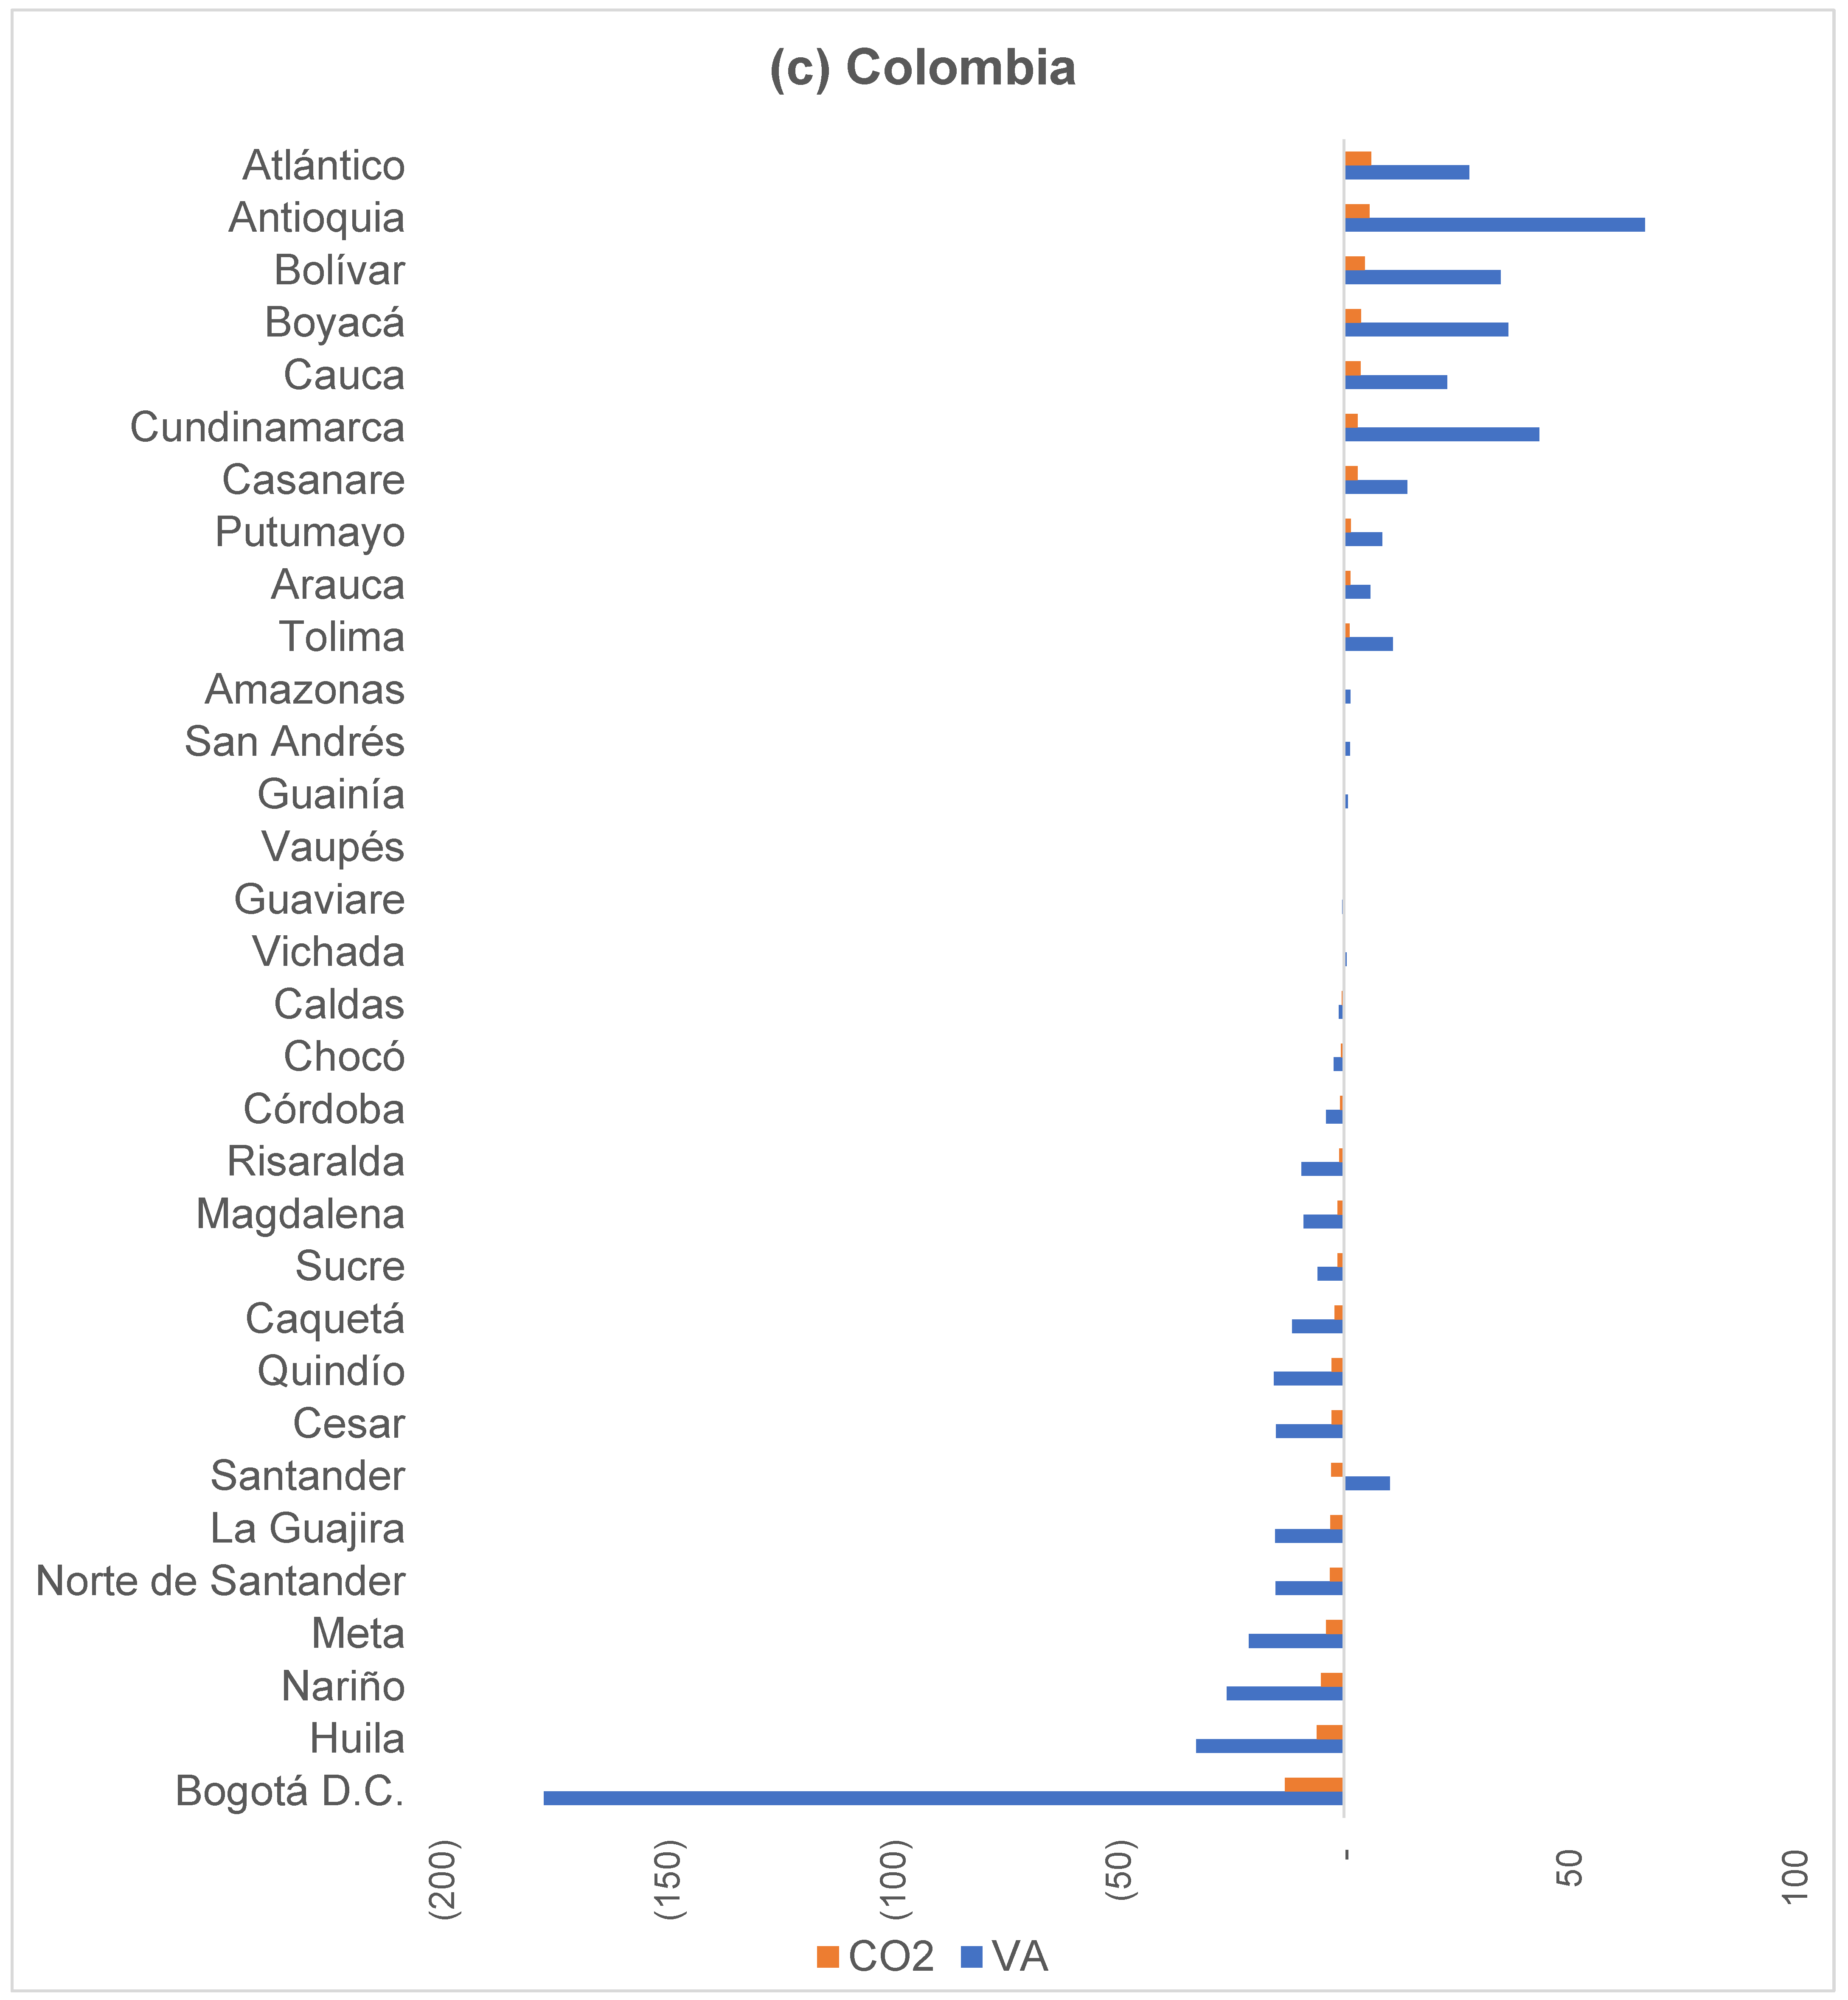
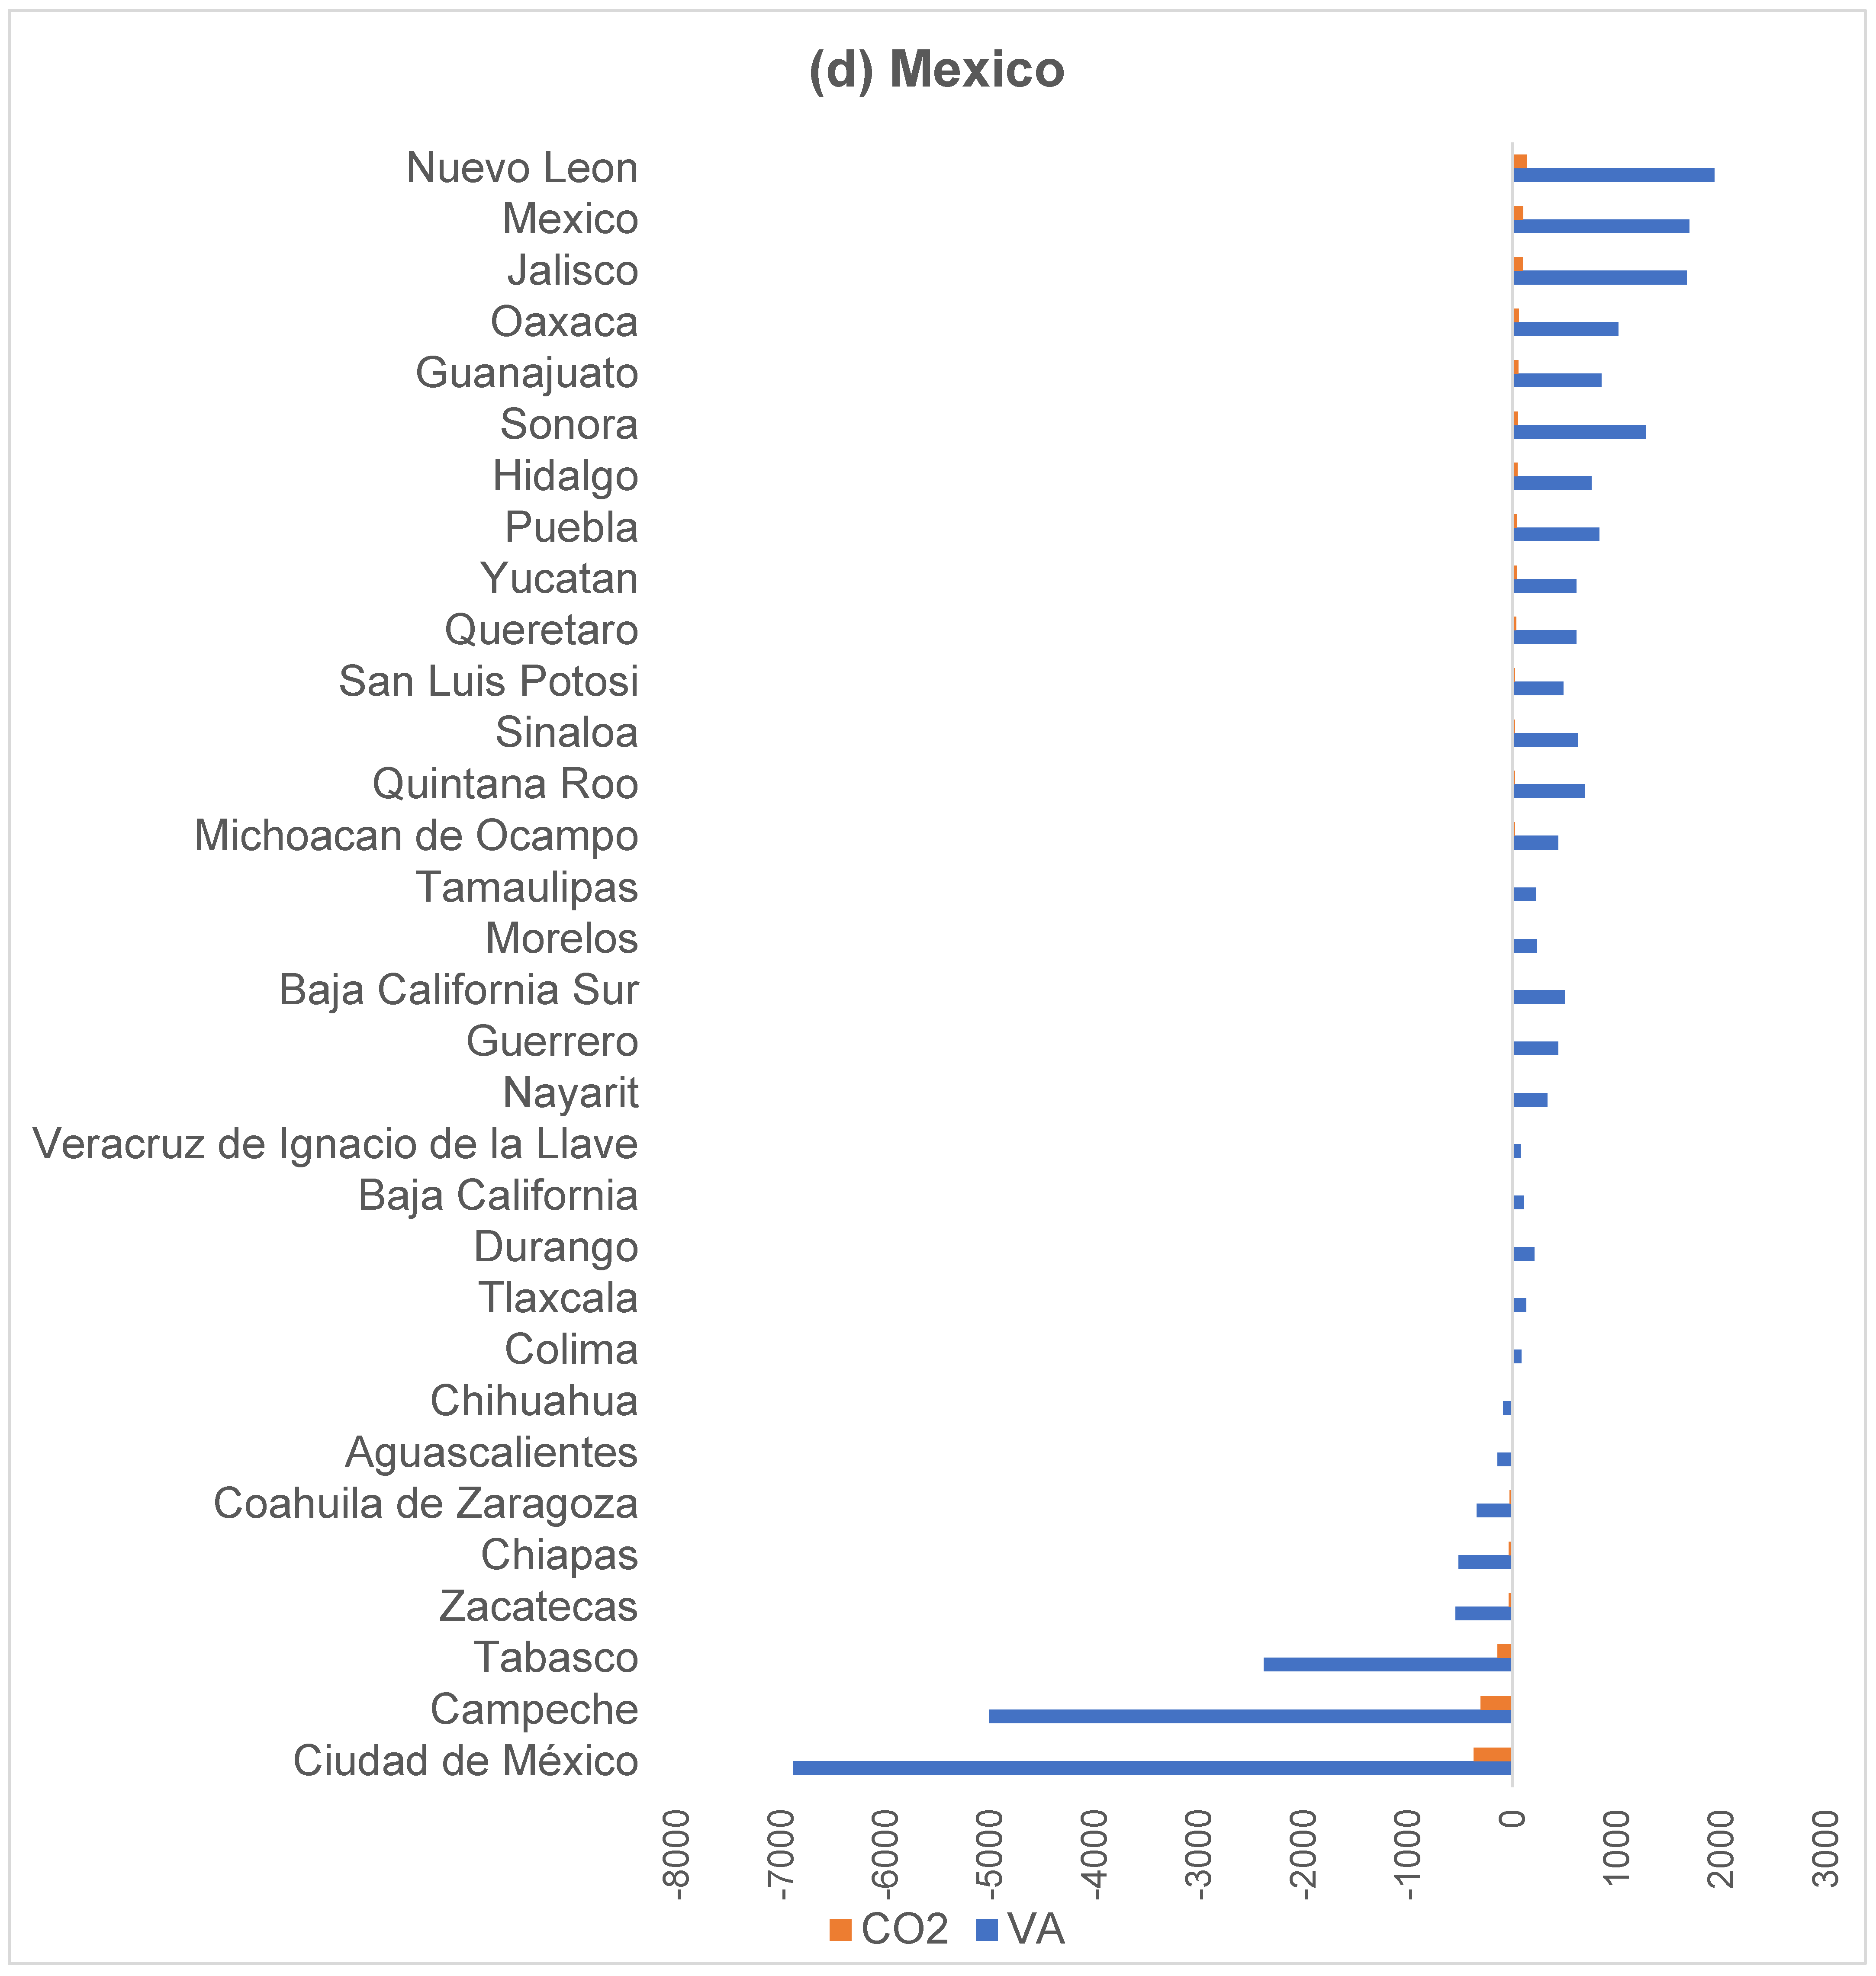
4.2. Spatial Organisation of Interregional VA and CO2 Transfers

In the previous section, the contribution of VA and CO2 in subnational transfers suggests that domestic demand is responsible for most of the emissions generated by economic industries in the entire economic system. Furthermore, the economic importance of resource-based industries and the backward and forward chaining patterns suggest that it is crucial to understand the spatial organization of domestic value chains to understand the environmental responsibility standards of the CO2 emitted and embedded in value chain networks internally.
To provide a better picture of the interregional transfers of both VA and CO2, Figure 3 shows the main subnational origins of the CO2 implicit content from the resource industries embedded in the final interregional demand of the non-resource-based sectors. It was possible to map the results obtained from estimating the implicit trade flows of CO2 in each region of origin to picture the geography of the main subnational origins. On analyzing the shares of implicit CO2 shipments from each origin to all domestic destinations, it is observed that the total amount of CO2 emissions in interregional exports is proportional to the regional economic importance. This is due to the intermediate demand for inputs, which reflects the capacity to embed potentially pollution-intensive inputs.
The regions specialized in exploiting natural resources play an important role in internal environmental accounting. In Brazil, the State of São Paulo–the most prosperous–which has an economic diversification that ranges from the primary to the service business sectors –incorporates the largest share of emissions in the country. In Chile, the Biobío Region is an area whose main economic activities are forestry and fishing, secondary (food) agriculture, manufacturing and services, and the metal industries. This regional economic profile helps to understand the relative importance as a provider of intermediate inputs intense in CO2 transferred to other subnational areas. Traditionally, Antioquia has been Colombia’s first export department, with its regional economy focused on mining, cattle ranching, agriculture, and forest products, mainly wood. These resource sectors account for a significant part of regional production and trade, distinguishing the region as intense in polluting activity. The capital Bogotá is the most prosperous and diversified region in the country. The linkages with the other regions dominate the demand for interregional intermediate inputs revealed in the high relative percentage of emissions incorporated into domestic trade. In Mexico, the State of Nuevo Leon concentrates its activities in the petrochemical, food, and manufacturing industries, which shows the predominance of potentially CO2-intensive productive activities.
Figure 4 shows the regional net balances of interregional transfers of both VA and CO2. The measure is related to the origin regions of the VA and the CO2 emissions of the resource-based industries embedded in the final demand of the non-resource-based industries. Values above one indicate that the regions are net exporters of VA and CO2, while values below one indicate that the regions are net importers. In general, the geographic distribution of positive and negative balances reveals a spatial pattern of transfers from intense regions in natural resources to more diversified and industrialized regions–usually the leading economic centers of each country. In particular, the spatial organization of trade balances in resource sectors indicates the spatial location of natural resource-intensive export activities and the main economic business centers that demand intermediate inputs in each country.
The results reveal that the implicit transfers of CO2 are directly influenced by the geographic architecture of the domestic production chains. While input-output linkages networks between regions and sectors are decisive for the flow of goods and services required for production, they indirectly influence the carbon footprint at the subnational level. At the same time, the distribution of non-resource-based industries that incorporate VA and CO2 originated in resource-based peripheral regions, revealing an unequal economic and regional pattern.
Resource-based industries tend to be in the subnational peripheries of each country, while the principal regional agglomerations seem to be more diversified, industrialized and with a greater supply of service sectors that incorporate VA and emissions from primary sectors. In Brazil, the states of São Paulo, Rio Grande do Sul and Amazonas (states with substantial relative participation in agribusiness and industrialized) are the leading net exporters of VA and CO2 embedded in goods, while Pará, Bahia, Minas Gerais and Rio de Janeiro are net importers. In the Chilean case, the results highlight the regions specializing in food production and mining for export-which also contributes considerably to meeting domestic demand-as net exporters of VA and CO2 that are absorbed by the demand of other regions. This is the case of the Del Biobio, Del Maule, and Del Valparaíso regions, which stand out for the interregional shipments of high levels of VA and CO2 from the resource industries to meet the final demand of the non-resource sectors. The economic core of this country, represented by the Metropolitan Region of Santiago, is a clear case of an intermediary importer of the VA and the emissions generated by the intense regions in the exploitation of natural resources, which are later commercialized internally and externally. A similar pattern occurs in Colombia, where the departments of Valle del Cauca, Atlántico, Antioquia and Bolívar, intense in the resource industry, are responsible for VA’s central intermediate subnational transfers of CO2 to other economic centers. The Bogotá region-the country’s leading business center-is a net importer of the pollution incorporated in the regions of origin of both VA and carbon.

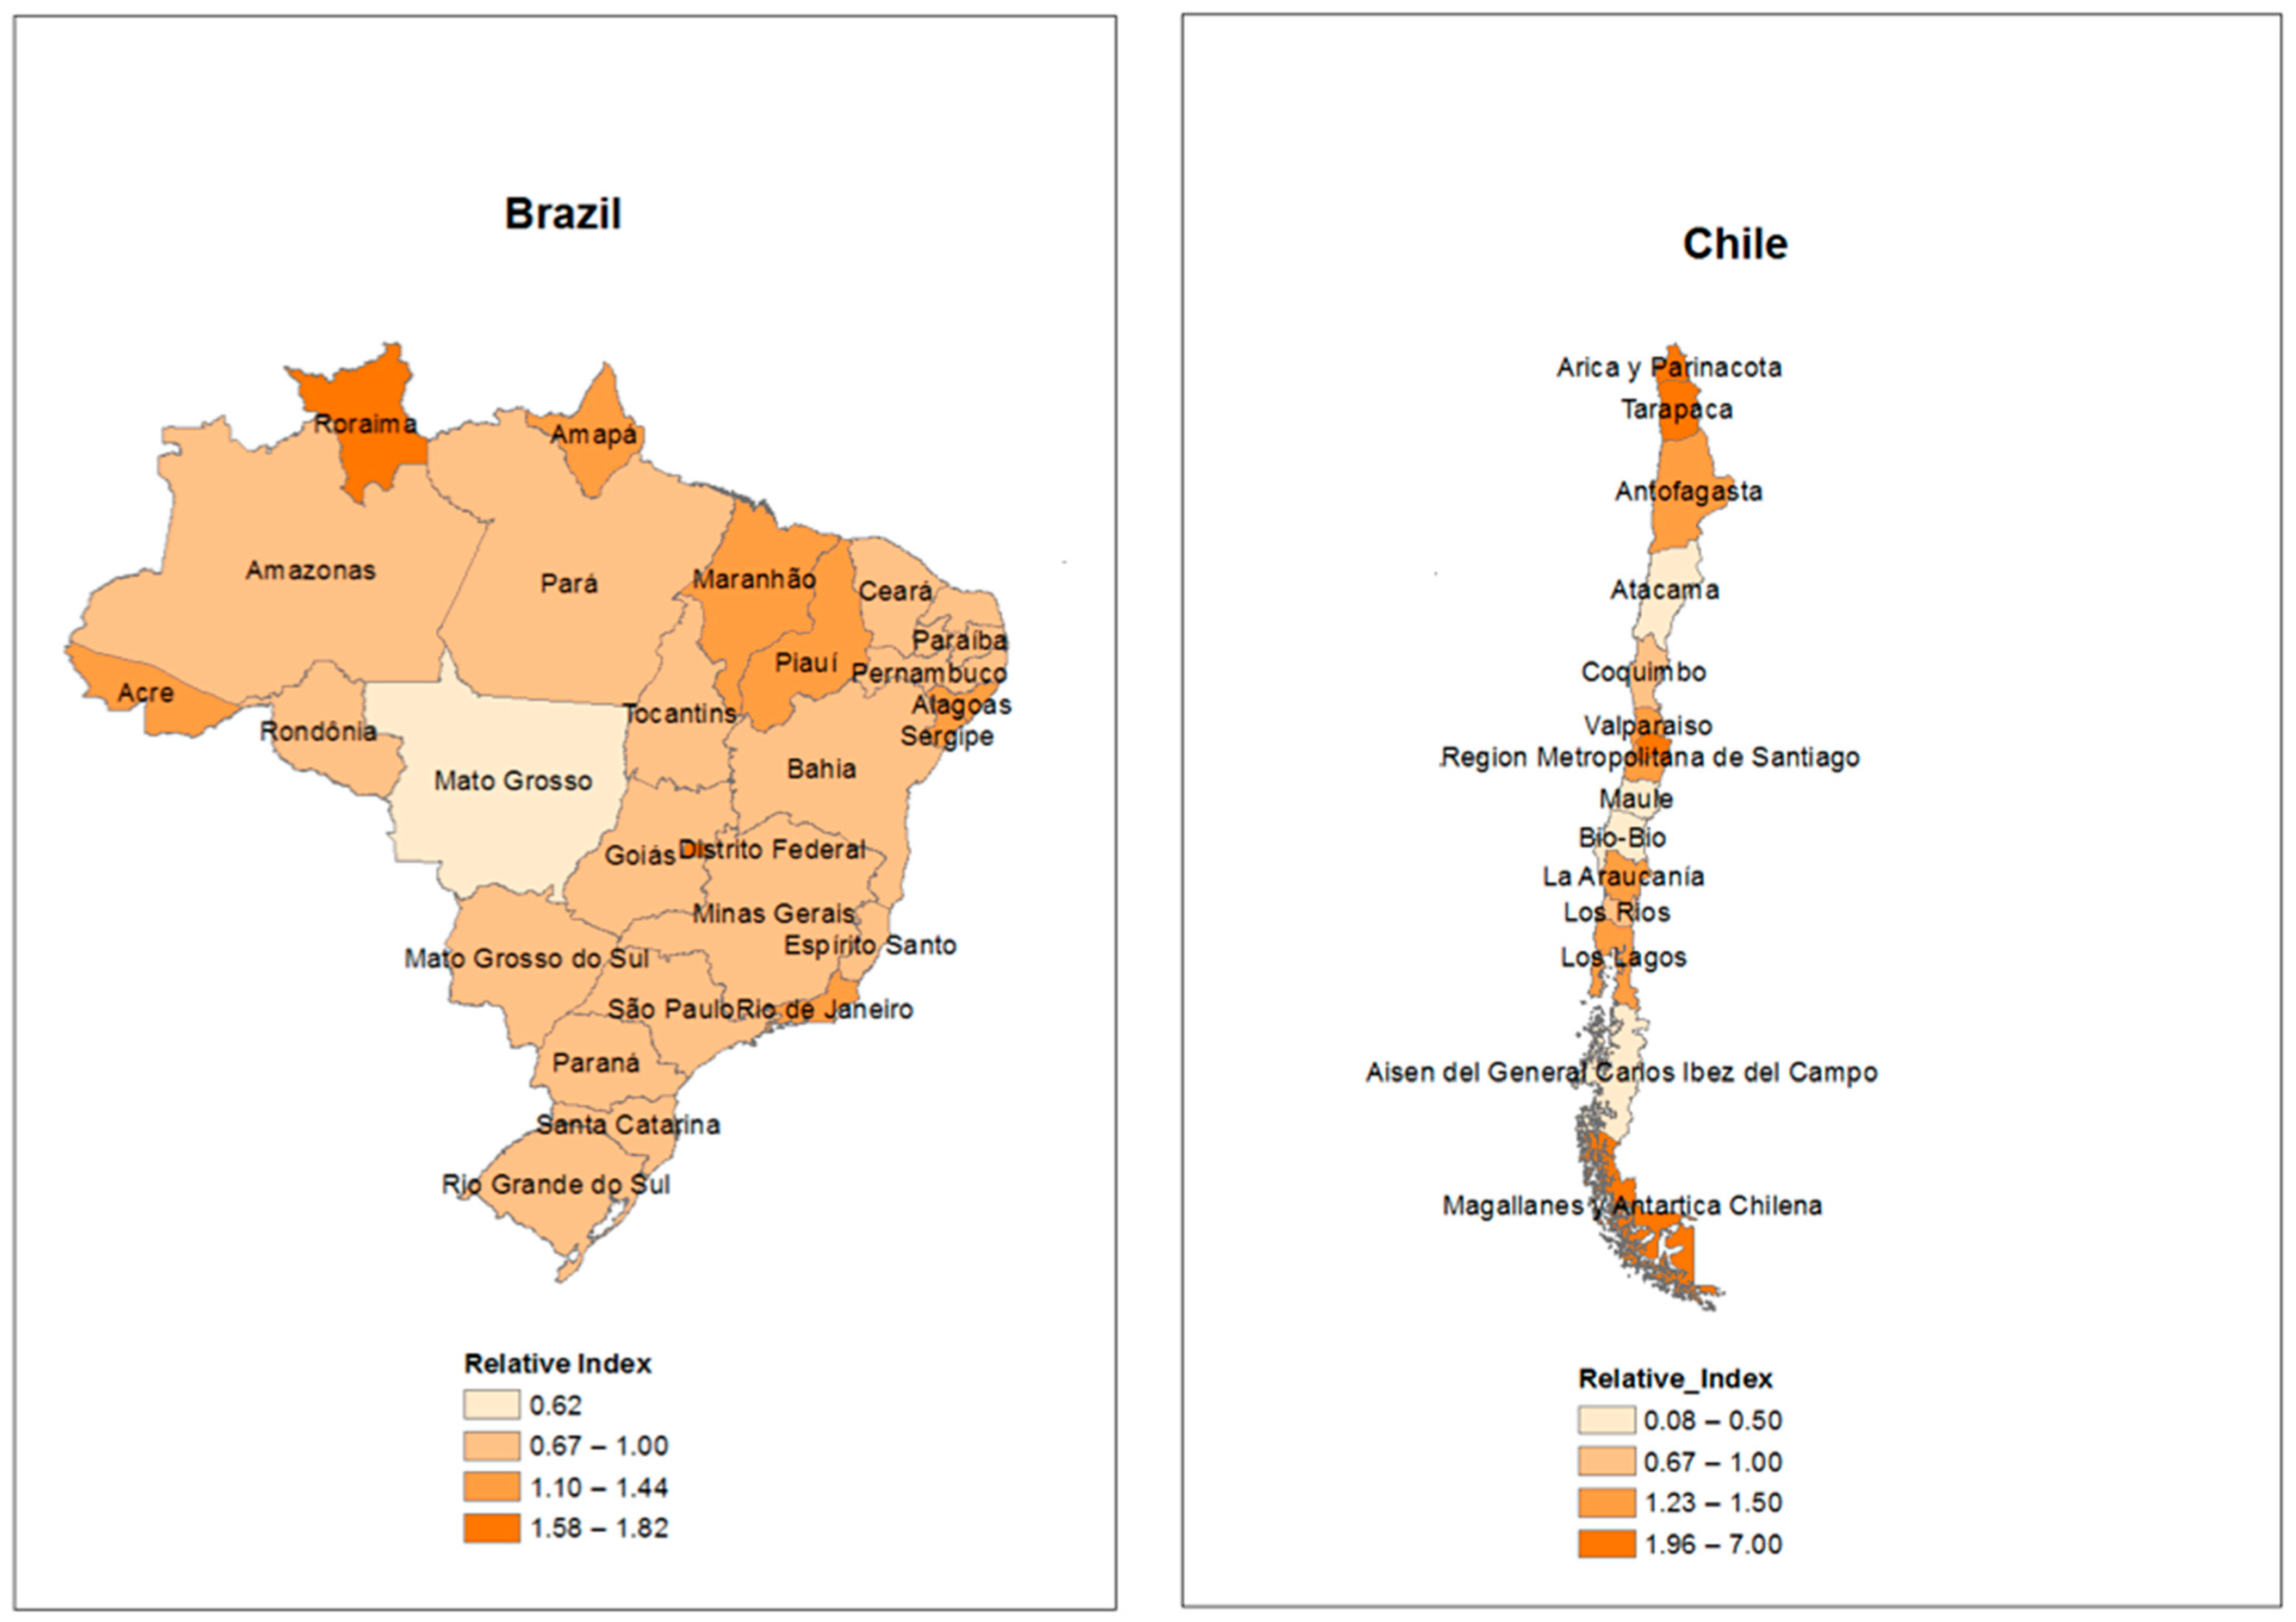
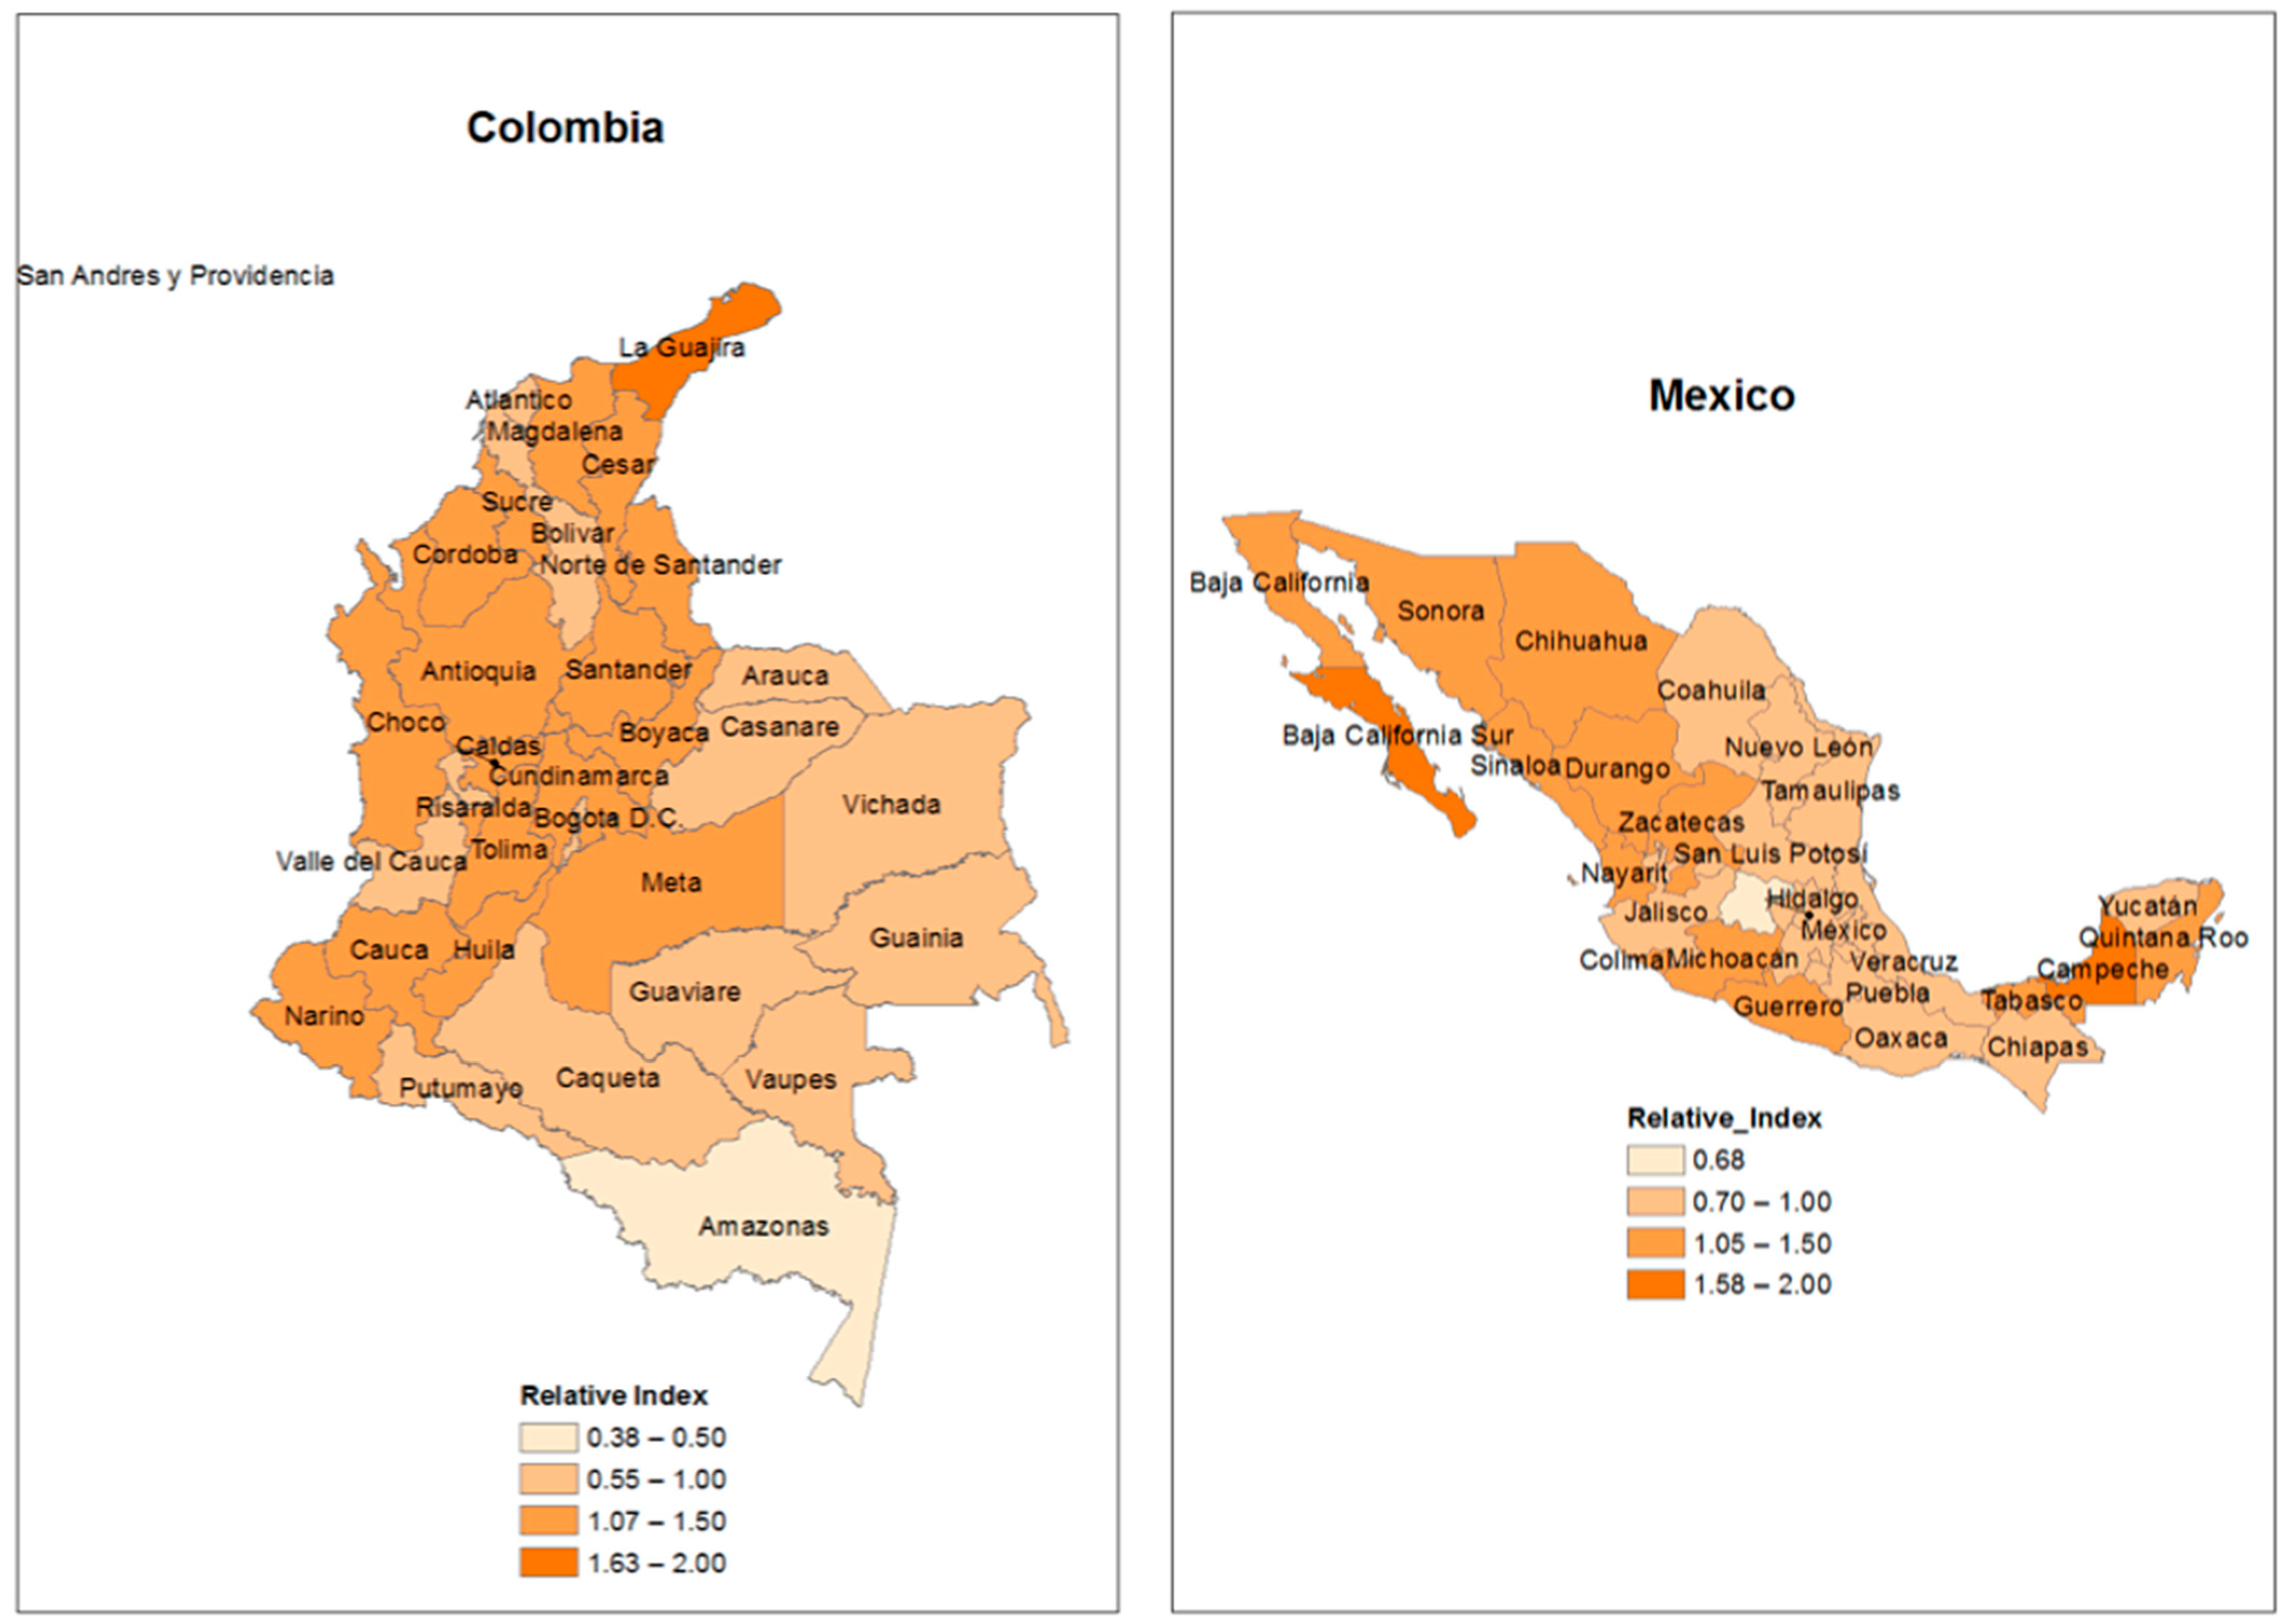
4.3. Relative CO2 Emission Intensity in Value Chains at the Subnational Level

In this section, we analyze the results of the CO2-based pollution intensity index embedded in the value chains of each subnational region of Brazil, Chile, Colombia, and Mexico. The maps in Figure 5 show the results for each region: values greater than one indicate that the region is a relatively intense source of implicit CO2 emissions among interregional VA trade–from resource industries to non-resource sectors. Overall, the spatial distribution of CO2 emissions is relatively dependent on the location of regions intense in the exploitation of natural resources. The results indicate that the transfer of VA and CO2 emissions incorporated in interregional flows is relatively concentrated for each country’s demand and supply sides. Peripheral regions, especially those specializing in agriculture and mining, emit CO2 at a greater intensity than their relative contribution from VA generated and transferred to other subnational areas. This implies greater environmental responsibility, with considerable distortions concerning the potential to generate VA locally. In other words, these regions transfer relatively carbon-intensive VA, increasing the carbon footprint absorbed within the country through domestic value chains.
The spatial distribution of CO2 intensity concerning trade in VA implies that the interregional transmission of pollution-intensive intermediate inputs is regionally localized due to the production of resource-based industries. As a result, economic compensation does not always occur in the same proportion as the generation of local VA, which implies unequal opportunities for sustainable regional development. Nevertheless, the general trend revealed by the calculated index is that the countries’ total emissions assign a relevant role to domestic interregional final consumption. In this regard, the resource-dependent regions are an important driver of the implicit flows of CO2 within each country. This implies a need to consider the regional organization of local value chains when building strategies that seek to make value and trade flow between internal areas more sustainable.
Small regional economies in Northern Brazil stand out for being sources of high levels of CO2 compared to VA generated and embedded in trade. As areas specializing in exporting natural resources, mainly mining, they present a profile of intense interregional transfers in pollution (CO2), with environmental responsibility on the supply side. At the same time, the importing states of this pollution content also have a relevant role, as they demand intense intermediate inputs in pollution. In this sense, the country’s subnational economic structure is centered on the south-southeast axis, in which states demand intermediate inputs from peripheral zones.
In the Chilean case, the extreme southern regions are relatively small in terms of productive structure, implying higher implicit emissions in the interregional VA trade. The southern region of Magallanes y de la Antarctica Chilena stands out as the one that, in relative terms, incorporates more emissions in relation to the locally generated VA, transferring the content of intense trade in pollution to the rest of the country. This region has comparative advantages in the mining sectors (especially oil, gas, and coal) and agriculture, which, given the geographical isolation area, allows the expansion of productive activity in these sectors. The high rate is explained by the supply side, in which the region transfers relatively CO2-intensive VA to other areas of the country. Next, the Metropolitan Region of Santiago stands out, which, in addition to specializing in the technology and services sectors, also stands out for its primary production. In relative terms, RMS transfers high levels of VA to the rest of the country, while the implicit CO2 content follows such a concentrated architecture of local production networks.
Local resource economies in Colombia present the most balanced results compared to other countries, as a large set of regions (departments) are not very intense in CO2 in relation to the VA generated and transferred internally. The highlights are the poor regions of La Guajira, Huilla and Cesar, with indices ranging from 1.45 to 1.69. These departments provide inputs based on resources absorbed by the intermediate demand of the other departments, with a relative level of implicit CO2. On the other hand, in the Mexican case, Campeche, Baja California Sur and Sonora are the most intense in CO2 embedded in interregional trade, highlighting resource-based regions that contribute to the amount of carbon footprint generated and absorbed inside the country.
Finally, the maps in Figure 5 suggest that the contribution of all resource sector groups to interregional (subnational) flows of non-resource industries favor the generation of CO2 emissions in each of the four countries. A consequence of this increase in the importance of resource sectors for total carbon emissions is a masked responsibility of intersectoral demand for the generation of pollution in the poorest regions (intensive in natural resources). Although there is a geographic concentration of production in the most value-added sectors, the flows of intermediate inputs between subnational regions considerably increase the internal carbon footprint, which has consequences for the sustainable matrix of each country.

5. Final Remarks and Policy Implications

Peripheral regional economies have faced several challenging issues, notably their over-reliance on resource-based sectors such as agriculture, mining, and key chained sectors. However, current trends in climate change, a specific look at the CO2-based polluting intensity of economic activities, and other facts, such as natural disasters, have generated a discussion about the main challenges that can convert local economies into able spaces towards sustainable development. In this sense, focusing on the Latin American case, known for its specialized economic profile in primary-exporting sectors, this study highlighted the regional role of the intensity of CO2 emissions originated from resource activities and transferred through subnational production networks.
Considering both VA and CO2 trade measures, we provided evidence that the use of intermediate inputs can affect the production process other than the trade in final goods, leveraging the promotion of linkages throughout the domestic supply chain, including the polluting perspective. We accounted for the relationship between the value-added and CO2 from resource and non-resource-based industries and the final demand, encompassing the interplay among the value-added and emissions from resource-based industries and the final demand sectoral setting. The main result suggests an interregional dependence that implies that resource sectors, generally intense in pollution, generate more CO2 emissions in proportion to the value-added generated in each regional economy, which has considerable implications for the sustainable development goals of these subnational areas.
Inter-regional transfers of CO2 emissions in trade have an essential role in trade, influencing the total regional CO2 generation. The general results indicate some spatial patterns in terms of pollution intensity in trade. First, there is a space associated with primary-exporting regions with lower value-added shares in trade while being intense in pollution. These areas tend to benefit from the lower connectivity costs associated with their domestic trade and international export activities, providing primary inputs intense in implicit CO2 generated and traded, which are then processed in other subnational regions or other global trading partners. Another profile is dominated by subnational regions strongly linked to domestic chains as important providers and demanders of goods and services in an articulated way. Second, intermediate regions, dependent on resources and industrial capacity, are less intense in implicit CO2− based pollution, as they manage to generate more regional value-added. Third, in each country analyzed, a dense productive area is connected to local and global markets, which has diversified industrial capacity in technological and human capital-intensive sectors that can internalize the value-added. However, despite having a more ecological and less polluting industrial profile, these same regions are also economic areas that demand intense CO2 inputs produced in peripheral areas of each country, with a masked environmental responsibility. This locational pattern raises the discussion on how intersectoral linkages can be important drivers for generating emissions at the domestic level, especially in countries competitive in natural resource goods. Fundamentally, this third group includes the main diversified and globally connected regions, such as the dense agglomerations of São Paulo in Brazil, Santiago in Chile, Bogotá in Colombia, and Ciudad de Mexico in Mexico.
For policy purposes, the results make it possible to assess the dependence on natural resources for Latin American development. In recent years, there has been an increase in commodity trade, starting in 2000–2003, which considerably increased the share of natural resource goods in the export agenda of many countries in Latin America. However, in addition to the fact that these sectors generate lower levels of value-added for subnational regions, they have the aggravating factor of being relatively intense in the generation of CO2, which can imply problems in meeting sustainable regional development goals. Although our results showed an internally heterogeneous pattern of dependence on natural resources, regions with less diversified economic bases faced more significant disruption with the collapse of commodity prices. Two potential problems for resource regions considering a possible new cycle of expansion of exports of natural resource goods can be appointed. First, resource regions may not internalize the benefits of investments in these sectors because the income generated can be absorbed by other regions and forward sectors in the value chain due to the architecture of the regional supply chain. Second, the level of environmental responsibility of regions specializing in emission-intensive resource-based sectors may limit sustainable and clean development alternatives. Thus, from a regional point of view, it is relevant to design effective strategies to change the intensity of emissions from resource sectors that promote less polluting implicit trade levels and interregional and international IO linkages networks.
At the same time, it is crucial to consolidate policies to encourage and maintain an effective supply chain for less pollution-intensive inputs. For this, an essential condition is to create cleaner energy matrices, which allow green technologies that can reduce pollution intensity by traded value-added [69]. Furthermore, in terms of local development, it is essential to create structures that allow local economies to generate greater levels of value-added to commercialized goods and services, facilitating the capture of value at the territorial level. Foster agglomeration economies regionally that allow increasing the value-added generated locally. The distortion of regional emission and emission intensity impacts the achievement of the emission reduction target and the emission reduction basis, as the targets are usually based on the emission of a given year. Therefore, governments must assign concrete targets according to local specificities, whether productive or linkages.
Finally, an essential limitation of the study is worth mentioning, which considers equivalent sectoral coefficients, regardless of the region of origin of the emissions content. In this sense, given the regional differences in terms of climatic conditions or local economic structure, the assumption of coefficient equivalence is strong and may imply relatively different conclusions. Consequently, the latter approach can underestimate the content of CO2 emissions in certain regions. However, we consider that does not considerably change the main regional implications since the location of resource-based economic activity is fundamentally dependent on the geography of natural resources, which, in turn, is consistent with the sectoral and regional results of the economic variables of the input-output model (e.g., value-added, and gross output). Therefore, the regional concentration of resource-based activities compared to the location of other activities, such as industry and the commercial sectors and services business industries, is consistent with the study’s results and principal conclusions. Despite being conservative, the results indicate an intense level of pollution within the production networks in subnational areas dependent on natural resources. In any case, our empirical evidence suggests the importance of advancing the formulation of regional statistics that allow approaching the issue of carbon-based emissions from a subnational and sectoral point of view. This suggestion is more important for Latin America since the domestic demand of each country reveals itself as one of the main areas of consumption of both generated VA and implicit emissions, with considerable consequences for the design and formulation of mitigation and control strategies for the polluting nature of production chains.

Supplementary Materials

The following supporting information can be downloaded at: https://0-www-mdpi-com.brum.beds.ac.uk/article/10.3390/atmos13060856/s1, Table S1: Regional Structure.

Author Contributions

Conceptualization, E.R.S. and C.R.A.; methodology, E.R.S.; validation, A.M.A., C.R.A. and E.R.S.; formal analysis, E.R.S.; writing—review and editing, E.R.S. and A.M.A.; supervision, C.R.A.; project administration, E.R.S.; funding acquisition, E.R.S. All authors have read and agreed to the published version of the manuscript.

Funding

This research was funded by the Conselho Nacional de Desenvolvimento Científico e Tecnológico (CNPq)–Ministério de Ciencia e Tecnologia (grant number 150779/2020-8).

Institutional Review Board Statement

Not applicable.

Informed Consent Statement

Not applicable.

Data Availability Statement

Not applicable.

Acknowledgments

The authors are grateful and thanks the Regional and Urban Economics Lab at the University of São Paulo (NEREUS-USP) for support through the researchers’ group which built the interregional input–output matrix used in this study. Furthermore, we are particularly grateful for the financial support from the Conselho Nacional de Desenvolvimento Científico (CNPq).

Conflicts of Interest

The authors declare no conflict of interest.

References

  1. Rehman, A.; Ma, H.; Ozturk, I.; Murshed, M.; Dagar, V. The dynamic impacts of CO2 emissions from different sources on Pakistan’s economic progress: A roadmap to sustainable development. Environ. Dev. Sustain. 2021, 23, 17857–17880. [Google Scholar] [CrossRef]
  2. Deng, Q.; Alvarado, R.; Toledo, E.; Caraguay, L. Greenhouse gas emissions, non-renewable energy consumption, and output in South America: The role of the productive structure. Environ. Sci. Pollut. Res. 2020, 27, 14477–14491. [Google Scholar] [CrossRef] [PubMed]
  3. Tillaguango, B.; Alvarado, R.; Dagar, V.; Murshed, M.; Pinzón, Y.; Méndez, P. Convergence of the ecological footprint in Latin America: The role of the productive structure. Environ. Sci. Pollut. Res. 2021, 28, 59771–59783. [Google Scholar] [CrossRef]
  4. Alvarado, R.; Tillaguango, B.; Dagar, V.; Ahmad, M.; Işık, C.; Méndez, P.; Toledo, E. Ecological footprint, economic complexity and natural resources rents in Latin America: Empirical evidence using quantile regressions. J. Clean. Prod. 2021, 318, 128585. [Google Scholar] [CrossRef]
  5. World Bank Data. Popular Indicators Data, 1 January 2022. 2022. Available online: https://databank.worldbank.org/indicator/NY.GDP.MKTP.CD/1ff4a498/Popular-Indicators (accessed on 4 April 2022).
  6. Jahanger, A.; Usman, M.; Murshed, M.; Mahmood, H.; Balsalobre-Lorente, D. The linkages between natural resources, human capital, globalization, economic growth, financial development, and ecological footprint: The moderating role of technological innovations. Resour. Policy 2022, 76, 102569. [Google Scholar] [CrossRef]
  7. Haddad, E.A.; Araújo, I.F. The internal geography of services value-added in exports: A Latin American perspective. Pap. Reg. Sci. 2021, 100, 713–744. [Google Scholar] [CrossRef]
  8. Brenes, E.R.; Camacho, A.R.; Ciravegna, L.; Pichardo, C.A. Strategy and innovation in emerging economies after the end of the commodity boom—Insights from Latin America. J. Bus. Res. 2016, 69, 4363–4367. [Google Scholar] [CrossRef]
  9. Vianna, A.C.; Mollick, A.V. Threshold effects of terms of trade on Latin American growth. Econ. Syst. 2021, 45, 100882. [Google Scholar] [CrossRef]
  10. Azzoni, C.R.; Haddad, E.A. Regional disparities. In Oxford Handbook of the Brazilian Economy; Amann, E., Azzoni, C.R., Baer, W., Eds.; Oxford University Press: Oxford, UK, 2018; pp. 1–27. [Google Scholar]
  11. Aroca, P.; Azzoni, C.; Sarrias, M. Regional concentration and national economic growth in Brazil and Chile. Lett. Spat. Resour. Sci. 2018, 11, 343–359. [Google Scholar] [CrossRef]
  12. Guerrero, O.A.; Castañeda, G.; Trujillo, G.; Hackett, L.; Chávez-Juárez, F. Subnational sustainable development: The role of vertical intergovernmental transfers in reaching multidimensional goals. Socio-Econ. Plan. Sci. 2021, 101155. [Google Scholar] [CrossRef]
  13. Wang, Z.; Su, B.; Xie, R.; Long, H. China’s aggregate embodied CO2 emission intensity from 2007 to 2012: A multi-region multiplicative structural decomposition analysis. Energy Econ. 2020, 85, 104568. [Google Scholar] [CrossRef]
  14. Kanemoto, K.; Moran, D.; Hertwich, E. Mapping the carbon footprint of nations. Environ. Sci. Technol. 2016, 50, 10512–10517. [Google Scholar] [CrossRef] [PubMed]
  15. Sanguinet, E.R.; Alvim, A.M.; Atienza, M.; Fochezatto, A. The subnational supply chain and the COVID-19 pandemic: Short-term impacts on the Brazilian regional economy. Reg. Sci. Policy Pract. 2021, 13, 158–186. [Google Scholar] [CrossRef]
  16. Guilhoto, J.M.; Hewings, G.J.D. Revival: Structure and Structural Change in the Brazilian Economy (2001); Taylor and Francis: Abingdon-on-Thames, UK, 2017; Volume 2, pp. 1–390. [Google Scholar]
  17. Sanguinet, E.R. Regional inequality and CO2 emissions-based trade across value chains networks: A multiscalar analysis from Brazilian states. Reg. Stud. Reg. Sci. 2022, 9, 135–148. [Google Scholar] [CrossRef]
  18. Wang, H.; Pan, C.; Zhou, P. Assessing the role of domestic value chains in China’s CO2 emission intensity: A multi-region structural decomposition analysis. Environ. Resour. Econ. 2019, 74, 865–890. [Google Scholar] [CrossRef]
  19. Wang, F.; Sun, X.; Reiner, D.M.; Wu, M. Changing trends of the elasticity of China’s carbon emission intensity to industry structure and energy efficiency. Energy Econ. 2020, 86, 104679. [Google Scholar] [CrossRef]
  20. Liu, Q.; Long, Y.; Wang, C.; Wang, Z.; Wang, Q.; Guan, D. Drivers of provincial SO2 emissions in China—Based on multi-regional input-output analysis. J. Clean. Prod. 2019, 238, 117893. [Google Scholar] [CrossRef]
  21. Zheng, H.; Zhang, Z.; Wei, W.; Song, M.; Dietzenbacher, E.; Wang, X.; Meng, J.; Shan, Y.; Ou, J.; Guan, D. Regional determinants of China’s consumption-based emissions in the economic transition. Environ. Res. Lett. 2020, 15, 074001. [Google Scholar] [CrossRef]
  22. Zheng, J.; Mi, Z.; Coffman, D.; Milcheva, S.; Shan, Y.; Guan, D.; Wang, S. Regional development and carbon emissions in China. Energy Econ. 2019, 81, 25–36. [Google Scholar] [CrossRef]
  23. Meng, B.; Wang, J.; Andrew, R.; Xiao, H.; Xue, J.; Peters, G. Spatial spillover effects in determining China’s regional CO2 emissions growth: 2007–2010. Energy Econ. 2017, 63, 161–173. [Google Scholar] [CrossRef]
  24. Piorski, K.A.O.D.S.; Xavier, C. Especialização em recursos naturais e cadeias globais de valor (1995 e 2009). Econ. Soc. 2017, 27, 89–127. [Google Scholar] [CrossRef] [Green Version]
  25. Atienza, M.; Arias-Loyola, M.; Phelps, N. Gateways or backdoors to development? Filtering mechanisms and territorial embeddedness in the Chilean copper GPN’s urban system. Growth Chang. 2021, 52, 88–110. [Google Scholar] [CrossRef]
  26. Hanaka, T.; Kanemoto, K.; Kagawa, S. Multi-perspective structural analysis of supply chain networks. Econ. Syst. Res. 2021, 1883552. [Google Scholar] [CrossRef]
  27. Meng, B.; Peters, G.P.; Wang, Z.; Li, M. Tracing CO2 emissions in global value chains. Energy Econ. 2018, 73, 24–42. [Google Scholar] [CrossRef] [Green Version]
  28. Duan, Y.; Jiang, X. Visualizing the change of embodied CO2 emissions along global production chains. J. Clean. Prod. 2018, 194, 499–514. [Google Scholar] [CrossRef]
  29. Acquaye, A.; Feng, K.; Oppon, E.; Salhi, S.; Ibn-Mohammed, T.; Genovese, A.; Hubacek, K. Measuring the environmental sustainability performance of global supply chains: A multi-regional input-output analysis for carbon, sulphur oxide and water footprints. J. Environ. Manag. 2017, 187, 571–585. [Google Scholar] [CrossRef] [PubMed]
  30. Clarke-Sather, A.; Qu, J.; Wang, Q.; Zeng, J.; Li, Y. Carbon inequality at the sub-national scale: A case study of provincial-level inequality in CO2 emissions in China 1997–2007. Energy Policy 2011, 39, 5420–5428. [Google Scholar] [CrossRef]
  31. Li, Z.; Shao, S.; Shi, X.; Sun, Y.; Zhang, X. Structural transformation of manufacturing, natural resource dependence, and carbon emissions reduction: Evidence of a threshold effect from China. J. Clean. Prod. 2019, 206, 920–927. [Google Scholar] [CrossRef]
  32. Chen, J.; Yuan, H.; Tian, X.; Zhang, Y.; Shi, F. What determines the diversity of CO2 emission patterns in the Beijing-Tianjin-Hebei region of China? An analysis focusing on industrial structure change. J. Clean. Prod. 2019, 228, 1088–1098. [Google Scholar] [CrossRef]
  33. Mudambi, R.; Puck, J. A global value chain analysis of the “regional strategy” perspective. J. Manag. Stud. 2016, 53, 1076–1093. [Google Scholar] [CrossRef] [Green Version]
  34. Zhang, Z.; Zhu, K.; Hewings, G. A multi-regional input–output analysis of the pollution haven hypothesis from the perspective of global production fragmentation. Energy Econ. 2017, 64, 13–23. [Google Scholar] [CrossRef] [Green Version]
  35. Liu, C.; Zhao, G. Can global value chain participation affect embodied carbon emission intensity? J. Clean. Prod. 2021, 287, 125069. [Google Scholar] [CrossRef]
  36. Yan, Y.; Wang, R.; Zheng, X.; Zhao, Z. Carbon endowment and trade-embodied carbon emissions in global value chains: Evidence from China. Appl. Energy 2020, 277, 115592. [Google Scholar] [CrossRef]
  37. Meng, L.; Guo, J.; Chai, J.; Zhang, Z. China’s regional CO2 emissions: Characteristics, inter-regional transfer and emission reduction policies. Energy Policy 2011, 39, 6136–6144. [Google Scholar] [CrossRef]
  38. Ulucak, R.; Khan, S.U.-D. Determinants of the ecological footprint: Role of renewable energy, natural resources, and urbanization. Sustain. Cities Soc. 2020, 54, 101996. [Google Scholar] [CrossRef]
  39. Ahmed, Z.; Zafar, M.W.; Ali, S. Danish Linking urbanization, human capital, and the ecological footprint in G7 countries: An empirical analysis. Sustain. Cities Soc. 2020, 55, 102064. [Google Scholar] [CrossRef]
  40. Baloch, M.A.; Wang, B. Analyzing the role of governance in CO2 emissions mitigation: The BRICS experience. Struct. Chang. Econ. Dyn. 2019, 51, 119–125. [Google Scholar] [CrossRef]
  41. Jiang, J.; Ye, B.; Liu, J. Research on the peak of CO2 emissions in the developing world: Current progress and future prospect. Appl. Energy 2019, 235, 186–203. [Google Scholar] [CrossRef]
  42. Perobelli, F.S.; Faria, W.R.; Vale, V.D.A. The increase in Brazilian household income and its impact on CO2 emissions: Evidence for 2003 and 2009 from input–output tables. Energy Econ. 2015, 52, 228–239. [Google Scholar] [CrossRef]
  43. Vale, V.A.; Perobelli, F.S.; Chimeli, A. International trade, pollution, and economic structure: Evidence on CO2 emissions for the North and the South. Econ. Syst. Res. 2017, 30, 1361907. [Google Scholar] [CrossRef]
  44. Jiang, X.; Guan, D.; López, L.A. The global CO2 emission cost of geographic shifts in international sourcing. Energy Econ. 2018, 73, 122–134. [Google Scholar] [CrossRef]
  45. Haddad, E.A.; Porsse, A.A.; Rabahy, W. Domestic tourism and regional inequality in Brazil. Tour. Econ. 2013, 19, 173–186. [Google Scholar] [CrossRef] [Green Version]
  46. Santos, G.; Haddad, E.A.; Hewings, G.J. Energy policy and regional inequalities in the Brazilian economy. Energy Econ. 2013, 36, 241–255. [Google Scholar] [CrossRef] [Green Version]
  47. Haddad, C.G.E., Jr.; Nascimento, T. Matriz Interestadual de Insumo-Produto para o Brasil: Uma aplicacao do Método IIOAS. RBERU. 2017. Available online: https://revistaaber.org.br/rberu/article/view/271 (accessed on 25 December 2021).
  48. Haddad, E.A.; Mengoub, F.E.; Vale, V.A. Water content in trade: A regional analysis for Morocco. Econ. Syst. Res. 2020, 32, 565–584. [Google Scholar] [CrossRef]
  49. Valbuena GJ, P.; Ricciulli, D.; Bonet, J.; Haddad, E.; Araújo, I.; Perobelli, F. Regional differences in the economic impact of lockdown measures to prevent the spread of COVID-19: A case study for Colombia. Cuad. Econ. 2021, 40. [Google Scholar] [CrossRef]
  50. Mardones, C.; Lipski, M. A carbon tax on agriculture? A CGE analysis for Chile. Econ. Syst. Res. 2019, 32, 262–277. [Google Scholar] [CrossRef]
  51. Román, R.; Cansino, J.M.; Rueda-Cantuche, J.M. A multi-regional input-output analysis of ozone precursor emissions embodied in Spanish international trade. J. Clean. Prod. 2016, 137, 1382–1392. [Google Scholar] [CrossRef]
  52. Xu, Y.; Dietzenbacher, E. A structural decomposition analysis of the emissions embodied in trade. Ecol. Econ. 2014, 101, 10–20. [Google Scholar] [CrossRef]
  53. Haberl, H.; Wiedenhofer, D.; Virág, D.; Kalt, G.; Plank, B.; Brockway, P.; Fishman, T.; Hausknost, D.; Krausmann, F.; Leon-Gruchalski, B.; et al. A systematic review of the evidence on decoupling of GDP, resource use and GHG emissions, Part II: Synthesizing the insights. Environ. Res. Lett. 2020, 15, 065003. [Google Scholar] [CrossRef]
  54. Liu, J.; Murshed, M.; Chen, F.; Shahbaz, M.; Kirikkaleli, D.; Khan, Z. An empirical analysis of the household consumption-induced carbon emissions in China. Sustain. Prod. Consum. 2021, 26, 943–957. [Google Scholar] [CrossRef]
  55. Wang, Z.; Cui, C.; Peng, S. How do urbanization and consumption patterns affect carbon emissions in China? A decomposition analysis. J. Clean. Prod. 2019, 211, 1201–1208. [Google Scholar] [CrossRef]
  56. Su, B.; Ang, B.W.; Li, Y. Input-output and structural decomposition analysis of Singapore’s carbon emissions. Energy Policy 2017, 105, 484–492. [Google Scholar] [CrossRef]
  57. Zhang, L.; Liu, B.; Du, J.; Liu, C.; Li, H.; Wang, S. Internationalization trends of carbon emission linkages: A case study on the construction sector. J. Clean. Prod. 2020, 270, 122433. [Google Scholar] [CrossRef]
  58. Zhu, K.; Guo, X.; Zhang, Z. Reevaluation of the carbon emissions embodied in global value chains based on an inter-country input-output model with multinational enterprises. Appl. Energy 2022, 307, 118220. [Google Scholar] [CrossRef]
  59. Duan, Y.; Ji, T.; Yu, T. Reassessing pollution haven effect in global value chains. J. Clean. Prod. 2021, 284, 124705. [Google Scholar] [CrossRef]
  60. Chen, W.; Los, B.; McCann, P.; Ortega-Argilés, R.; Thissen, M.; van Oort, F. The continental divide? Economic exposure to Brexit in regions and countries on both sides of the Channel. Pap. Reg. Sci. 2018, 97, 25–54. [Google Scholar] [CrossRef] [Green Version]
  61. Zhang, W.; Liu, Y.; Feng, K.; Hubacek, K.; Wang, J.; Liu, M.; Jiang, L.; Jiang, H.; Liu, N.; Zhang, P.; et al. Revealing Environmental Inequality Hidden in China’s Inter-regional Trade. Environ. Sci. Technol. 2018, 52, 7171–7181. [Google Scholar] [CrossRef]
  62. Los, B.; Timmer, M.P.; De Vries, G.J. Tracing value-added and double counting in gross exports: Comment. Am. Econ. Rev. 2016, 106, 1958–1966. [Google Scholar] [CrossRef] [Green Version]
  63. Wang, Z.; Zhang, Y.; Niu, M.; Fan, Z. How important is domestic and foreign demand for China’s income growth by business function? Econ. Syst. Res. 2020, 33, 316–335. [Google Scholar] [CrossRef]
  64. Meng, B.; Fang, Y.; Guo, J.; Zhang, Y. Measuring China’s domestic production networks through trade in value—Added perspectives. Econ. Syst. Res. 2017, 29, 48–65. [Google Scholar] [CrossRef]
  65. Timmer, M.P.; Miroudot, S.; De Vries, G.J. Functional specialisation in trade. J. Econ. Geogr. 2019, 19, 1–30. [Google Scholar] [CrossRef] [Green Version]
  66. Karlsson, C.; Andersson, M.; Norman, T.; Hewings, G.J.D.; Oosterhaven, J. Handbook of Research Methods and Applications in Economic Geography; Edward Elgar Publishing Ltd.: Cheltenham, UK, 2015; pp. 369–390. [Google Scholar]
  67. Lenzen, M.; Moran, D.; Kanemoto, K.; Geschke, A. Building Eora: A global multi-region input–output database at high country and sector resolution. Econ. Syst. Res. 2013, 25, 20–49. [Google Scholar] [CrossRef]
  68. Gereffi, G. Economic upgrading in global value chains. In Handbook on Global Value Chains; Ponte, S., Gereffi, G., Raj-Reichert, G., Eds.; Edward Elgar Publishing Ltd.: Cheltenham, UK, 2019; pp. 240–254. [Google Scholar] [CrossRef]
  69. Variar, A.G.; Ramyashree, M.S.; Ail, V.U.; Sudhakar, K.; Tahir, M. Influence of various operational parameters in enhancing photocatalytic reduction efficiency of carbon dioxide in a photoreactor: A review. J. Ind. Eng. Chem. 2021, 99, 19–47. [Google Scholar] [CrossRef]
Figure 1. Value-added share of resource-based industries in total gross regional output. Note: The maps of the four analyzed countries are presented, with the regional aggregation adopted in the study. The upper left map refers to the Brazilian states, the upper right to the Chilean regions, the lower left to the Colombian departments, and the lower right to the Mexican states.
Atmosphere 13 00856 g001aAtmosphere 13 00856 g001b
Figure 2. Empirical strategy scheme.
Atmosphere 13 00856 g002
Figure 3. Share of CO2 content embedded in interregional trade (from regional source). Note: The maps of the four analyzed countries are presented, with the regional aggregation adopted in the study. The upper left map refers to the Brazilian states, the upper right to the Chilean regions, the lower left to the Colombian departments, and the lower right to the Mexican states.
Atmosphere 13 00856 g003aAtmosphere 13 00856 g003b
Figure 4. Net balances of VA and CO2 in trade. Note: The graphs of the four analyzed countries are presented, with the regional aggregation adopted in the study. (a) Brazilian states, (b) Chilean regions, (c) Colombian departments, and (d) Mexican states.
Atmosphere 13 00856 g004aAtmosphere 13 00856 g004bAtmosphere 13 00856 g004cAtmosphere 13 00856 g004d
Figure 5. Regional index of CO2-based polluting intensity (by regional source). Note: The maps of the four analyzed countries are presented, with the regional aggregation adopted in the study. The upper left map refers to the Brazilian states, the upper right to the Chilean regions, the lower left to the Colombian departments, and the lower right to the Mexican states.
Atmosphere 13 00856 g005aAtmosphere 13 00856 g005b
Table 1. Socioenvironmental indicators for selected LA countries 1.
IndicatorCountry
Name
2000(%)2005(%)2010(%)2015(%)
Population, total (in thousands)Brazil1753.4%1863.3%1963.4%2043.3%
Population, total (in thousands)Chile150.3%160.3%170.3%180.3%
Population, total (in thousands)Colombia400.8%430.8%450.8%480.8%
Population, total (in thousands)Mexico991.9%1061.9%1142.0%1222.0%
Selected Countries in Latin America3296.3%3516.3%3726.4%3926.4%
Population in Latin America (in millions)5209100.0%5565100.0%5834100.0%6160100.0%
Surface area (thousands sq. km)Brazil8.541.7%8.541.7%8.541.7%941.7%
Surface area (thousands sq. km)Chile0.83.7%0.83.7%0.83.7%13.7%
Surface area (thousands sq. km)Colombia1.15.6%1.15.6%1.15.6%15.6%
Surface area (thousands sq. km)Mexico2.09.6%2.09.6%2.09.6%29.6%
Selected Countries in Latin America12.460.6%12.460.6%12.460.6%12.460.6%
Surface area in Latin America (thousands sq. km)20100.0%20100.0%20100.0%20100.0%
Forest area (thousands sq. km)Brazil5.554.3%5.354%5.253%5.053%
Forest area (thousands sq. km)Chile0.21.6%0.22%0.22%0.22%
Forest area (thousands sq. km)Colombia0.66.2%0.66%0.66%0.66%
Forest area (thousands sq. km)Mexico0.76.7%0.77%0.77%0.77%
Selected Countries in Latin America7.068.7%6.869%6.668%6.569%
Forest area in Latin America (thousands sq. km)10100.0%10100%10100%9100%
CO2 emissions (metric tons per capita)Brazil1.8-1.8-1.8-2.5-
CO2 emissions (metric tons per capita)Chile3.2-3.4-3.9-4.3-
CO2 emissions (metric tons per capita)Colombia1.5-1.4-1.4-1.7-
CO2 emissions (metric tons per capita)Mexico3.9-4.1-4.1-3.8-
Selected Countries in Latin America (average)2.6 2.7 2.8 3.1
CO2 emissions in Latin America (metric tons per capita)2.4-2.5-2.6-2.9-
GDP (current billions US$)Brazil65,54528.6%89,16331.1%166,70038.6%245,60438.2%
GDP (current billions US$)Chile77863.4%12,2964.3%17,2394.0%26,0544.1%
GDP (current billions US$)Colombia99894.4%14,5625.1%23,2405.4%38,1115.9%
GDP (current billions US$)Mexico70,79130.9%87,74830.6%90,00520.8%131,53520.5%
Selected Countries in Latin America (current billions US$)154,11067.2%203,76971.2%297,18368.8%441,30568.7%
GDP in Latin America (current billions of US$)229,189100.0%286,324100.0%431,835100.0%642,694100.0%
Note: 1 The CO2 emissions measure (metric tons per capita) is relative to each country, therefore, the relative percentage is omitted.
Table 2. Large selected industrial groups (value chains considered).
Selected Value ChainsNatural Resources Industrial Classification
1Agri-food value chainsResource-based
2Mining value chainsResource-based
3Resource-based manufacturing value chainsResource-based
4Non-resource-based manufacturing value chainsNon-resource based
5Business services value chainsNon-resource based
6Other services value chainsNon-resource based
Table 3. An interregional IO table with R regions and J industries (groups). Source: Authors’ elaboration based on [66].
EndogenousExogenous
Intermediate ConsumptionFinal DemandTotal Demand
Intermediate Demand Region 1, Sector 1 Region R, Sector JHouseholdInvestmentGovernmentStock VariationExports
Region 1, Sector 1 z 11 11 z 1 j 1 R f 1 H H 1 f 1 I N V 1 f 1 G O V 1 f 1 V A R R f 1 E X P R x 1 1
Region R, Sector j z j 1 R 1 z j j R R f j H H R f j I N V R f j G O V R f j V A R R f j E X P R x j ^ R
Imports ( m ) m 1 m j m H H R m I N V R m G O V R m V A R
Value-added ( v ) v 1 1 v j R
Output ( x ) x 1 1 x j R
Table 4. Total CO2 emissions (Gg) from EDGAR database.
Selected VCBrazil(%)Chile(%)Colombia(%)Mexico(%)
Agri-food value chains168,10419%28074%12,93316%33,6587%
Mining value chains76581%36505%54597%22,9805%
Resource-based manufacturing value chains67,0448%29,63738%811610%53,27711%
Non-resource-based manufacturing value chains69,8608%14,56918%66398%66,96714%
Business services value chains239,83628%776710%15,74619%199,59641%
Other services value chains318,48837%20,38526%32,79740%115,90624%
Total870,991100%78,815100%81,689100%492,385100%
Source: EORA National IO tables.
Table 5. TiVA measures 1: From selected Value Chains to meet the final demand (domestic and foreign).
Value ChainsBrazil(%)Chile(%)Colombia(%)Mexico(%)
Agri-food1554.24%49011%10618%98652%
Mining210.56%1604%203%49,33511%
Resource-based manufacturing842.30%1072%112%16,6874%
Non-resource manufacturing922.52%138732%41%69,21116%
Business Services108529.63%100423%25242%82,22419%
Other value chains222460.76%117227%21035%205,21847%
Total3661100.00%4319100%603100%432,540100%
1 (1) Brazil 2015 BRL millions. (2) Chile 2014 CLP thousands. (3) Colombia 2015 COP billions. (4) Mexico 2013 MXN millions.
Table 6. Interplay in VA 1 and CO2 emissions trade (from industries’ groups).
Trade-Related MeasureBrazil(%)Chile(%)Colombia(%)México(%)
Resource to resource industries
Domestic TiVA168,92148%11337%22,37136%761,68347%
VA exports183,28852%15,45293%39,32664%868,04153%
Total TiVA352,209100%16,585100%61,697100%1,629,724100%
Domestic CO2 62,78155%323631%704756%25,44651%
CO2 exports51,01845%722269%553344%24,24549%
Total CO2113,799100%10,458100%12,580100%49,691100%
Resource to non-resource industries
Domestic TiVA12,70273%51546%188579%31,42544%
VA exports462327%59554%50321%40,28956%
Total TiVA17,324100%1110100%2388100%71,714100%
Domestic CO2306172%323631%31475%174345%
CO2 exports121928%722269%10525%212855%
Total CO24280100%10,458100%419100%3871100%
1 (1) Brazil 2015 BRL millions. (2) Chile 2014 CLP thousands. (3) Colombia 2015 COP billions. (4) Mexico 2013 MXN millions. CO2 emissions in Gg/$.
Publisher’s Note: MDPI stays neutral with regard to jurisdictional claims in published maps and institutional affiliations.

