3.1. Effects of Vibrations
The online particle classifiers EEPS and reference SMPS size distributions and total particle count were in general agreement during a co-location exercise during the UFIREG Quality Assurance Program [
25]. The EEPS, normally used for engine exhaust measurement, uses, however, electrometers as opposed to condensation particle counter, and exhibits a higher detection limit as well as zero drift of units of thousands of particles per cm
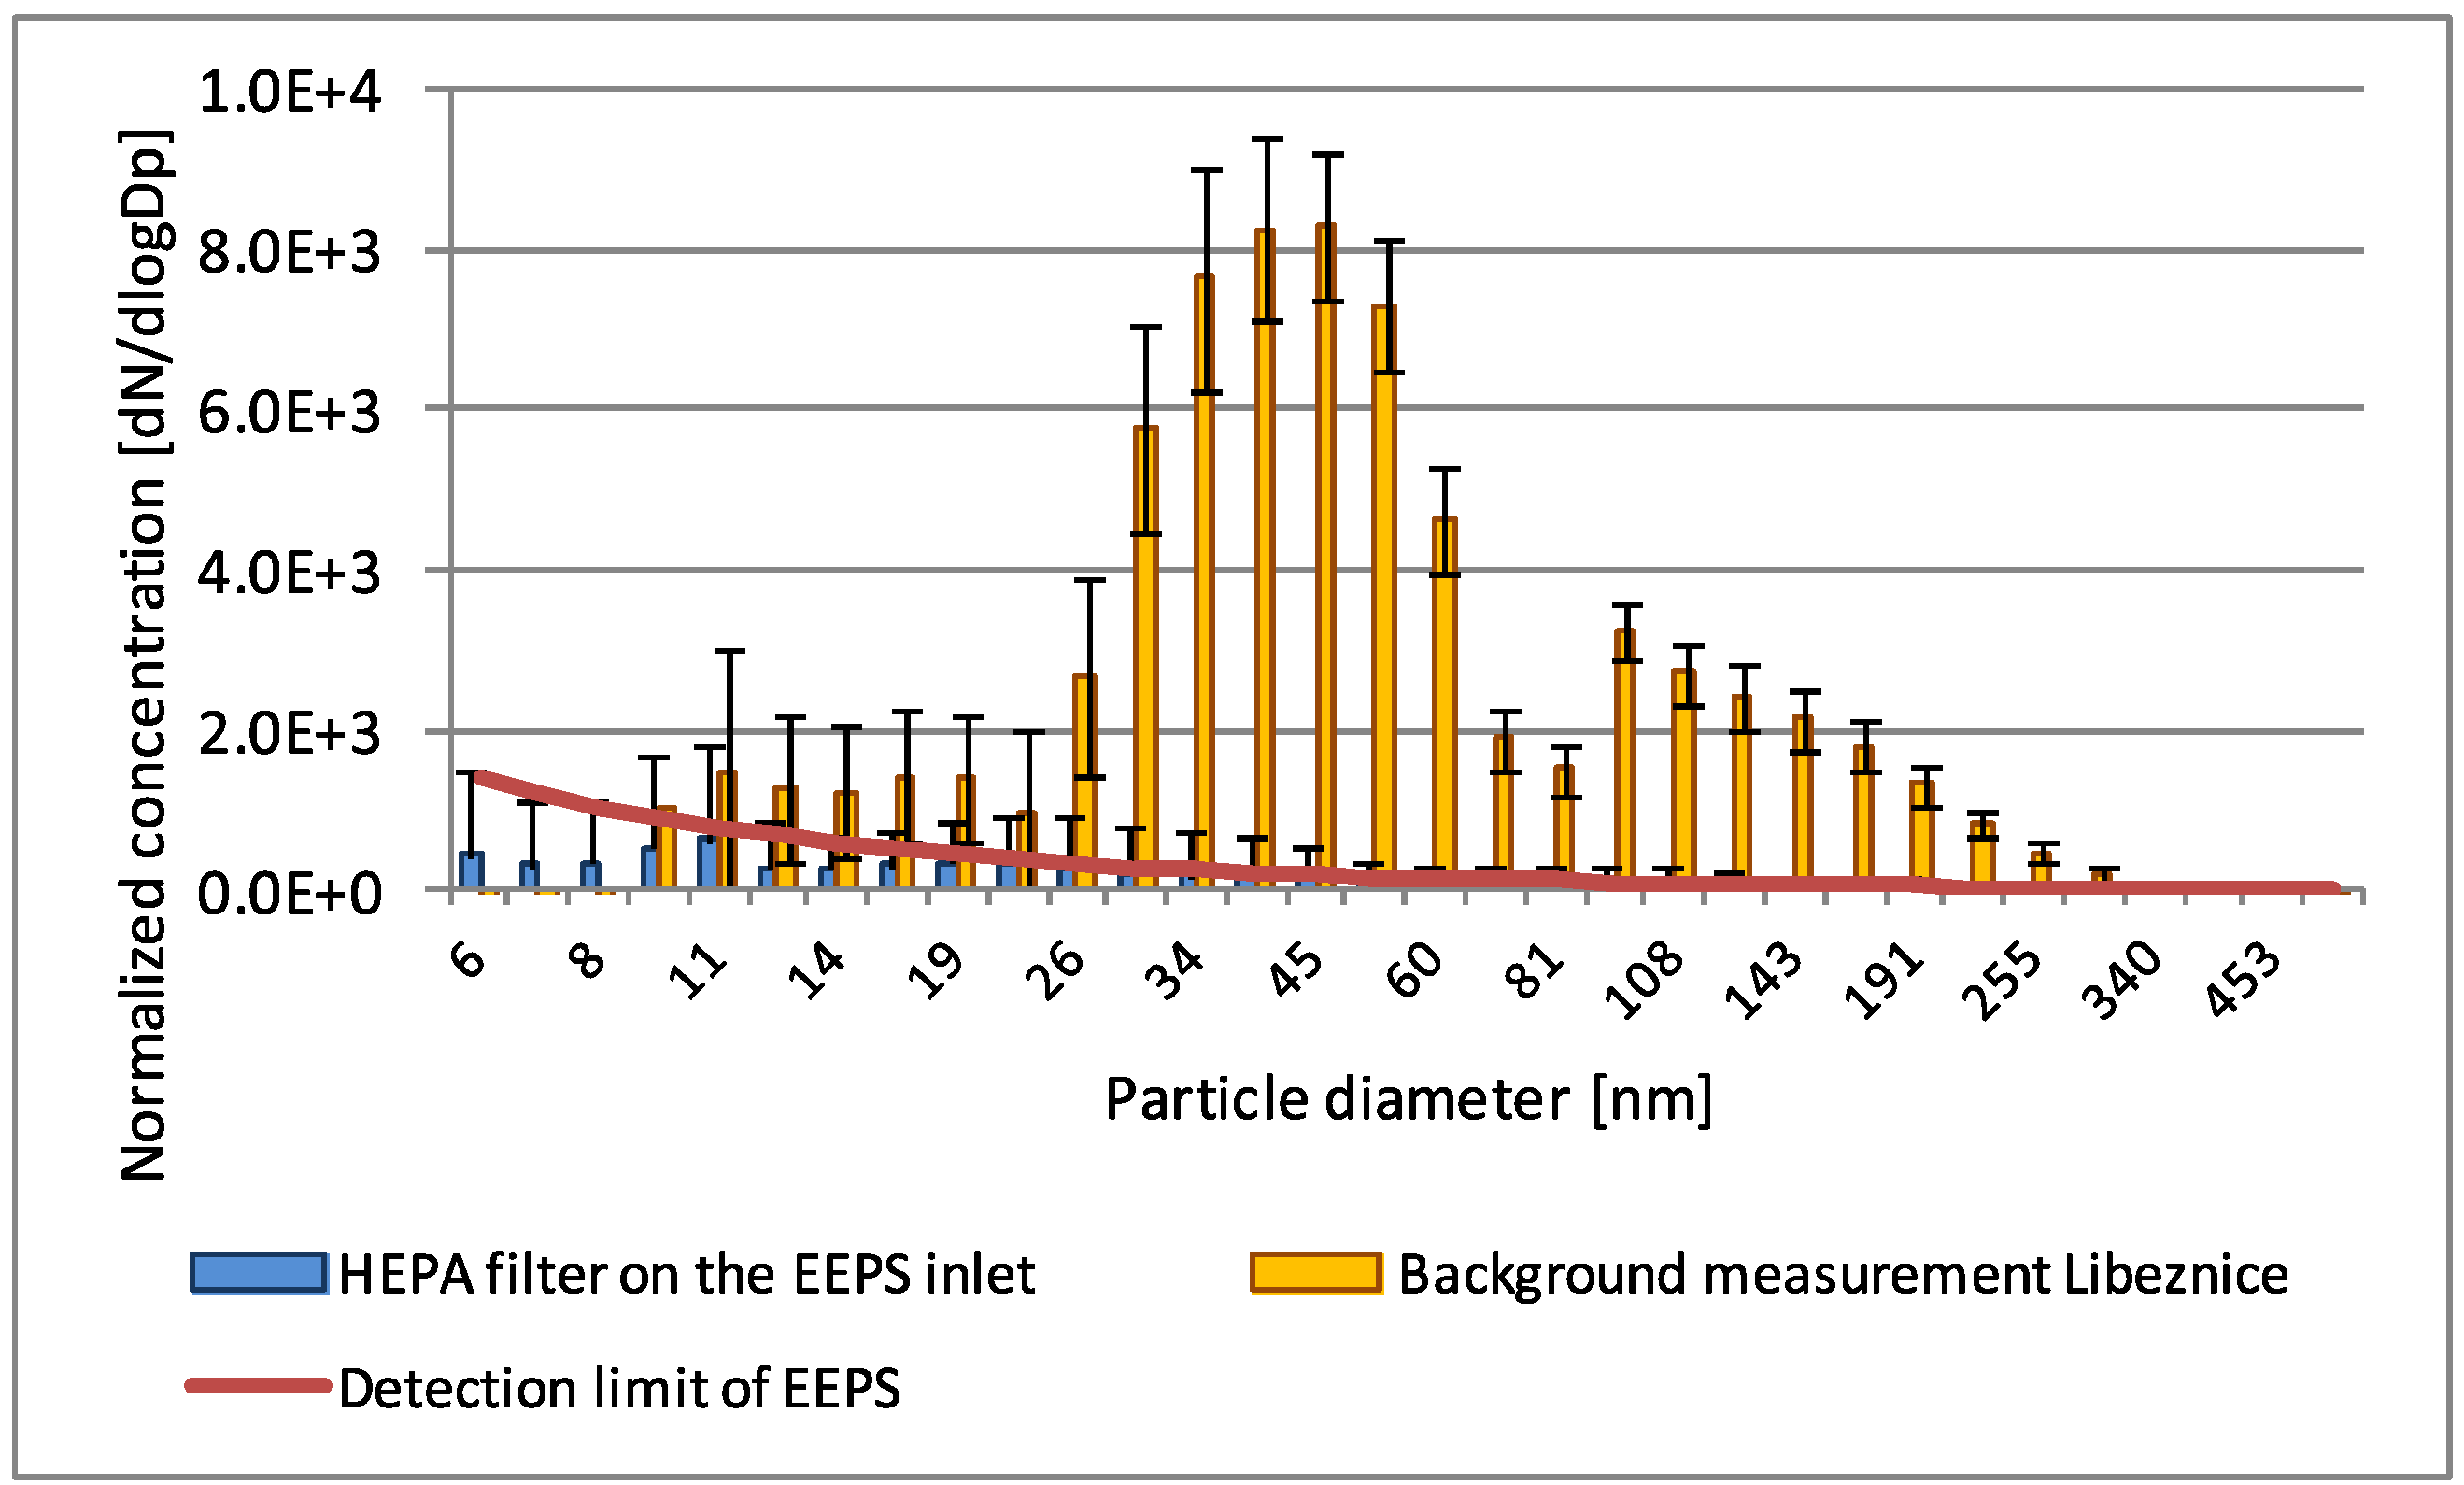
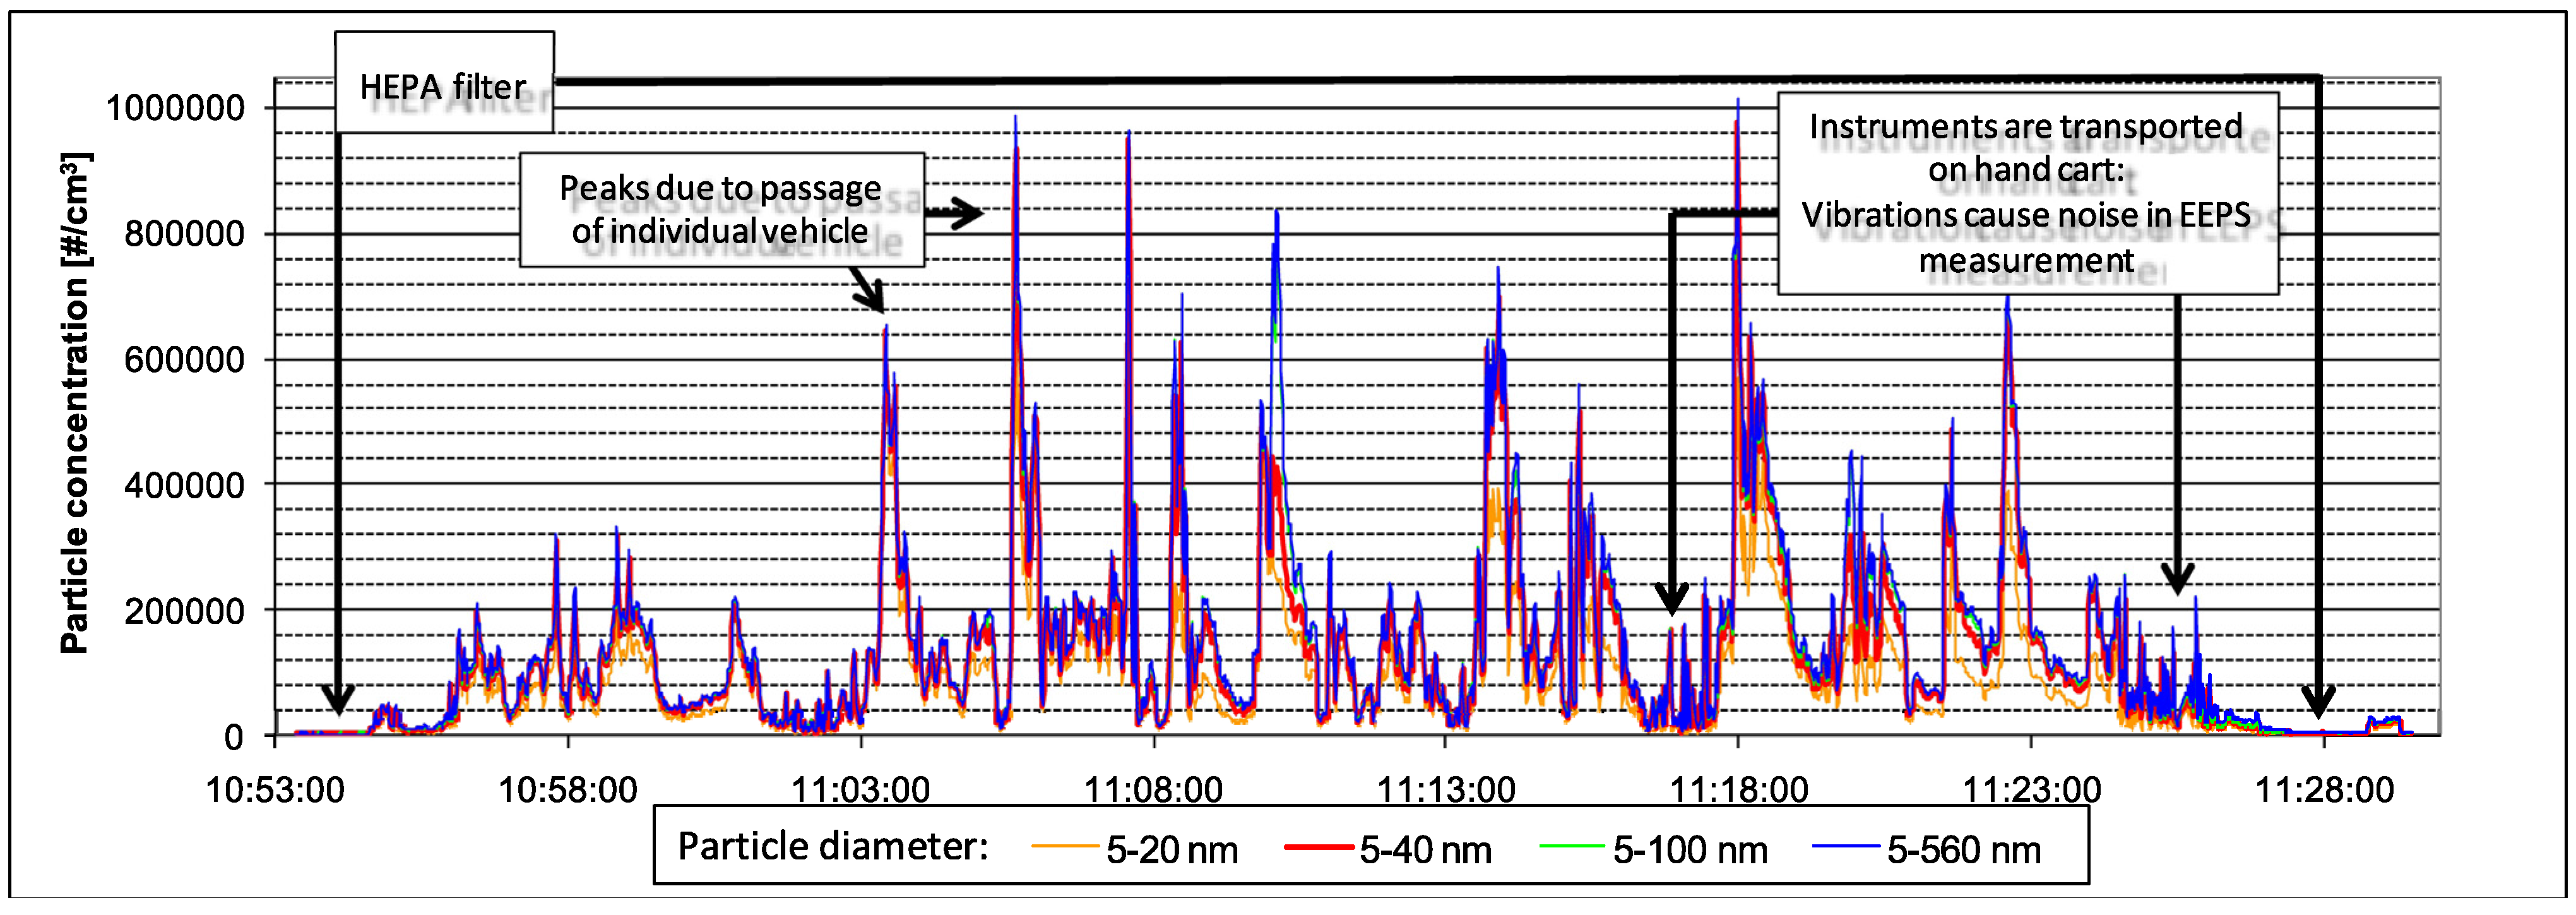
3, which may be significant at ambient levels. This drift was determined by periodically placing a HEPA filter on the EEPS inlet and recording the “zero” size distribution, which was then subtracted from all measured size distributions (
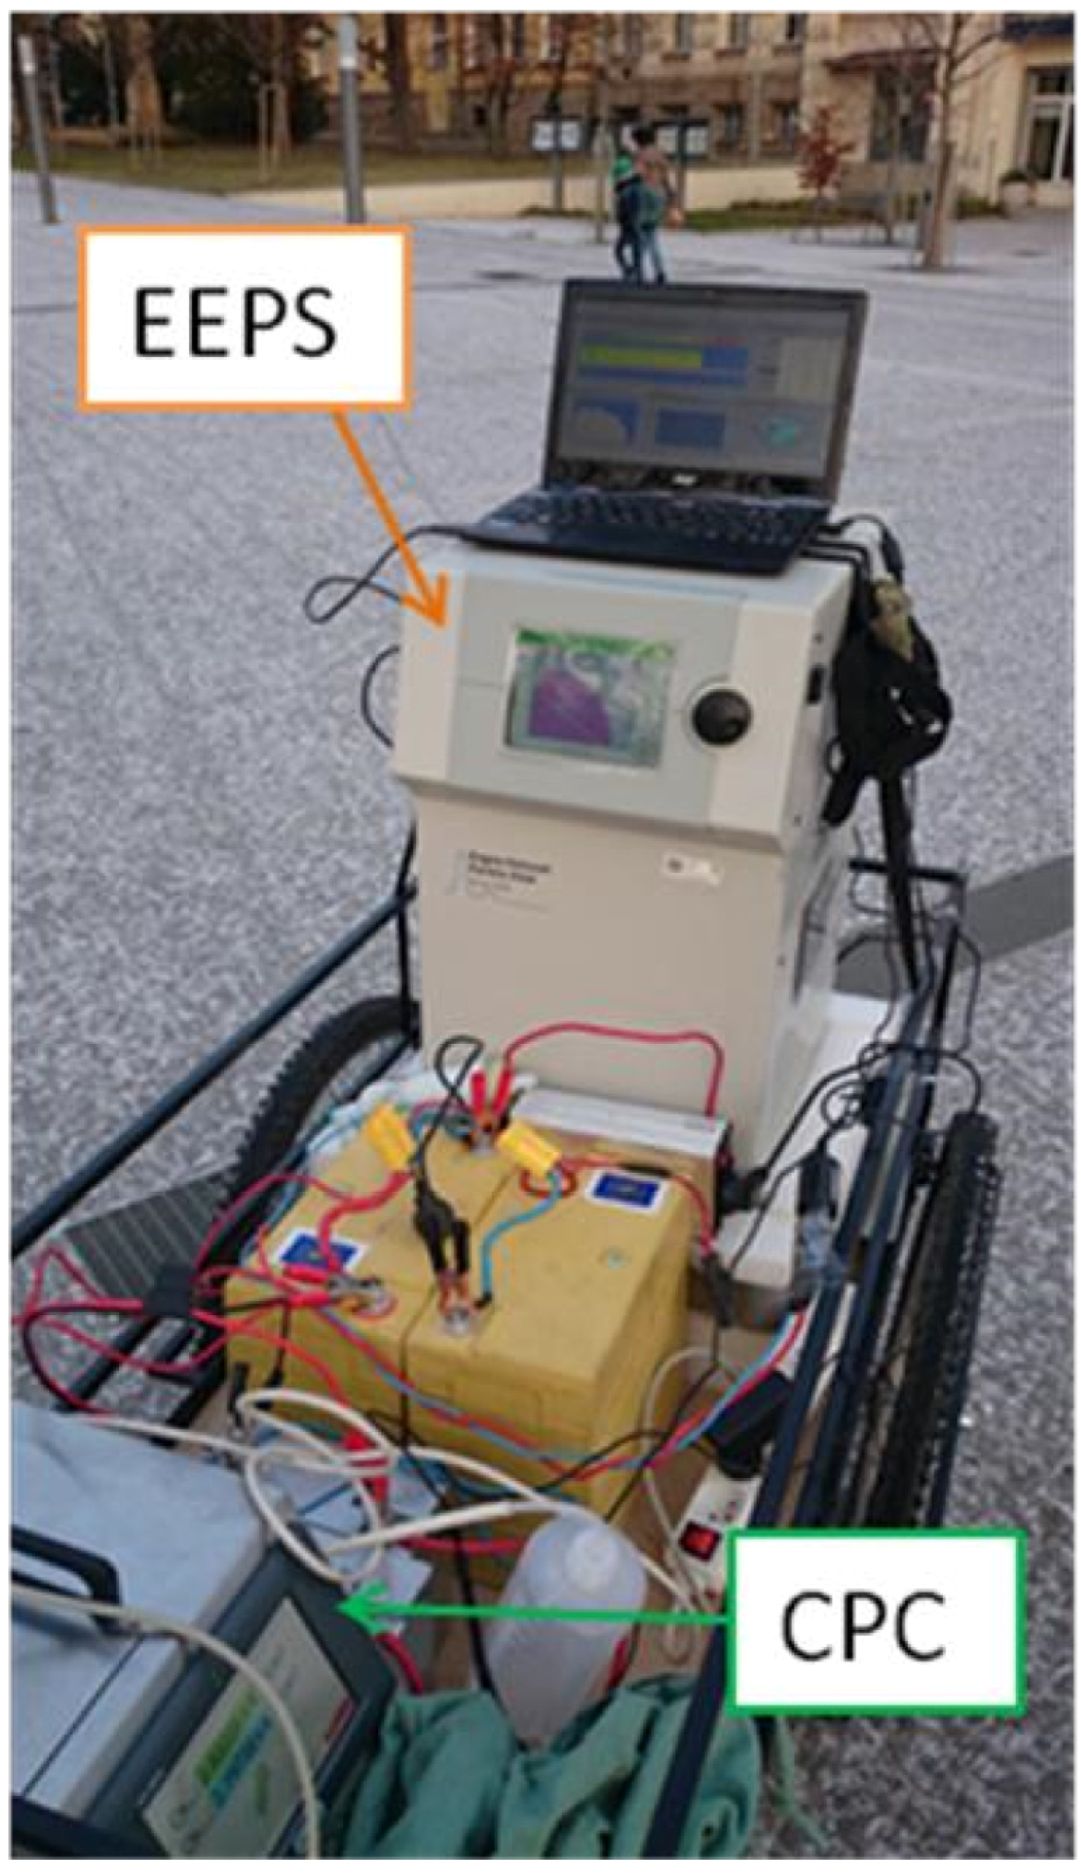
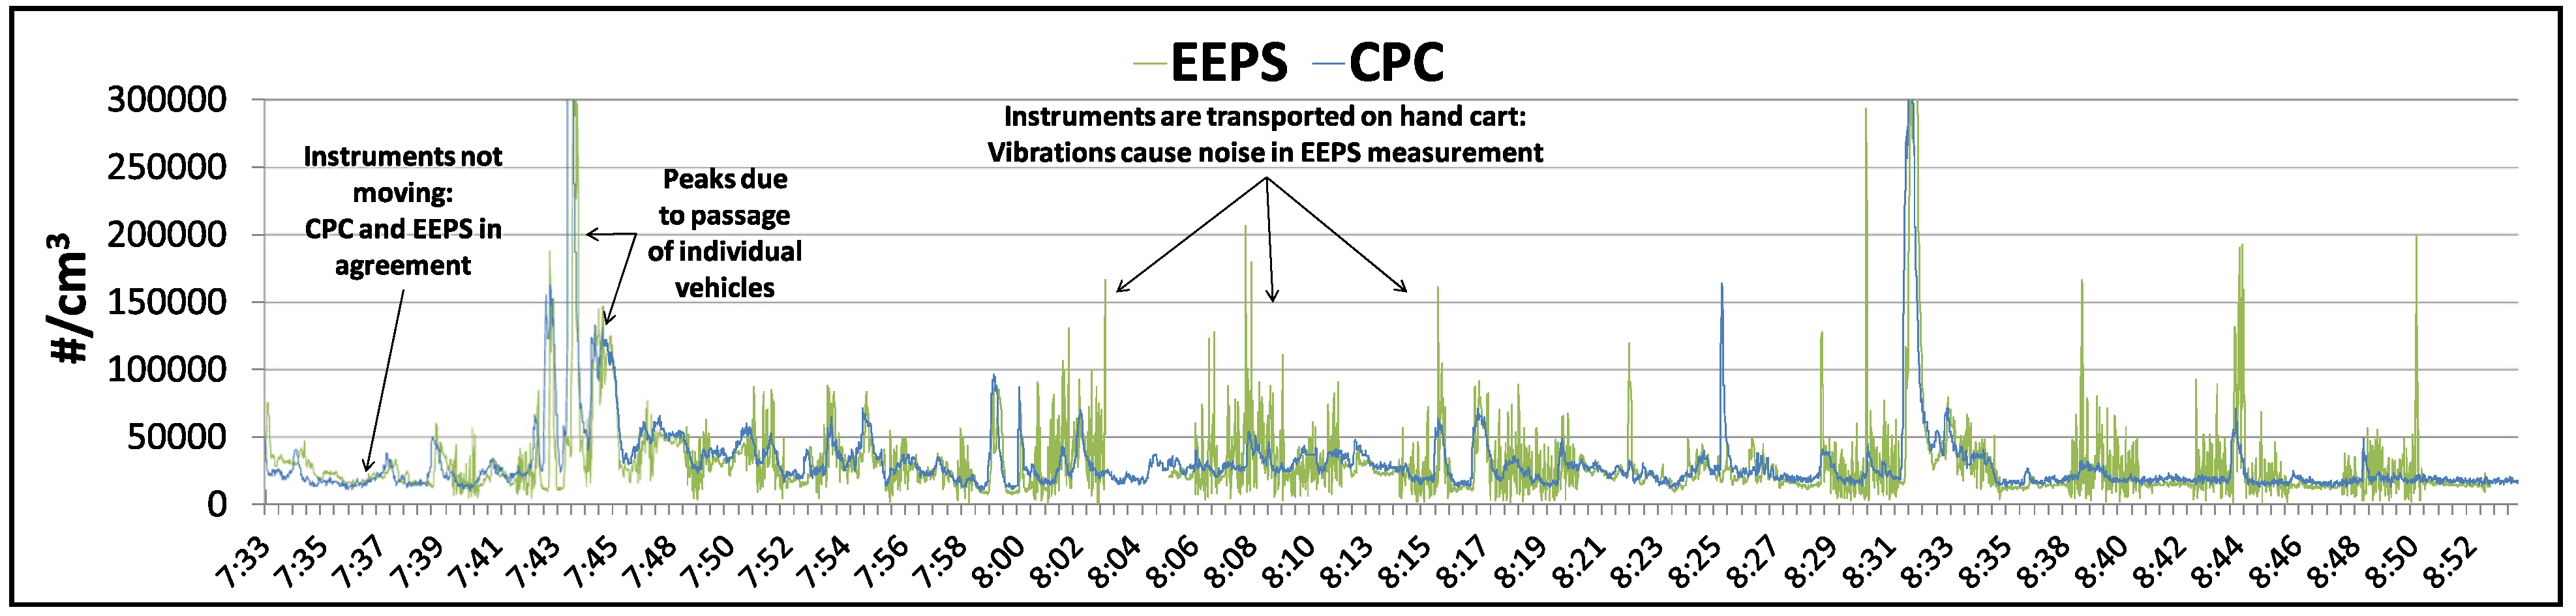
Figure 3). In addition, during the operation of a handcart, the EEPS was exposed to different vibrations than those encountered in the vehicle, resulting in increased noise. While this noise could be suppressed by improved suspension system (designed for the mass of the handcart as opposed to the mass of a vehicle), the effects of vibrations on EEPS measurement artifacts are not well quantified, and a decision was made to treat the data while moving and for about 10 s afterwards as indicative only. For this reason, EEPS data were considered to be quantitative only at standstill, and were frequently compared against the UF-CPC data. The effects of instrument travel on the measurement noise are shown in
Figure 4.
Figure 3.
Comparison of manufacturer-supplied detection limit of EEPS, instrument electrometer noise (High-efficiency particulate arrestance (HEPA) filter on EEPS inlet) and the lowest measured number concentrations (Libeznice background) with standard deviations. The data representing the lowest measured concentration among campaigns (4.2 × 10³ #/cm3, Libeznice background—best dispersion conditions) show that particles with diameter >25 nm are well above the detection limit. Concentrations measured on the other sites were several times/orders of magnitude higher. Measured concentrations were above detection limit of the instrument.
Figure 4.
Comparison of particle number concentrations measured by CPC and EEPS; EEPS noise due to handcart vibration during its movement to another measurement stop and measurement stops are indicated on 30 January, EEPS and CPC are in agreement in total particle counts.
Figure 4.
Comparison of particle number concentrations measured by CPC and EEPS; EEPS noise due to handcart vibration during its movement to another measurement stop and measurement stops are indicated on 30 January, EEPS and CPC are in agreement in total particle counts.
Measurements were carried out with one or two mobile apparatuses, which were pulled around the site making one-minute or longer stops at various places of interest. Measurements always took several hours, involving both peak and off-peak traffic, so that the intensity of traffic emissions was changing over the course of measurement. Presented concentrations include particles with electric mobility diameter between 5–100 nm. Distributions include all measured sizes and demonstrate a very small contribution of particles larger than 100 nm to the total particle counts.
3.2. Sporilov—Effects of Distance from Major Roads
Measurements in Sporilov were performed within weekdays on 20 February, and 6, 12 and 26 March 2014 with one mobile apparatus. Sporilov is a part of Prague with very high traffic load.
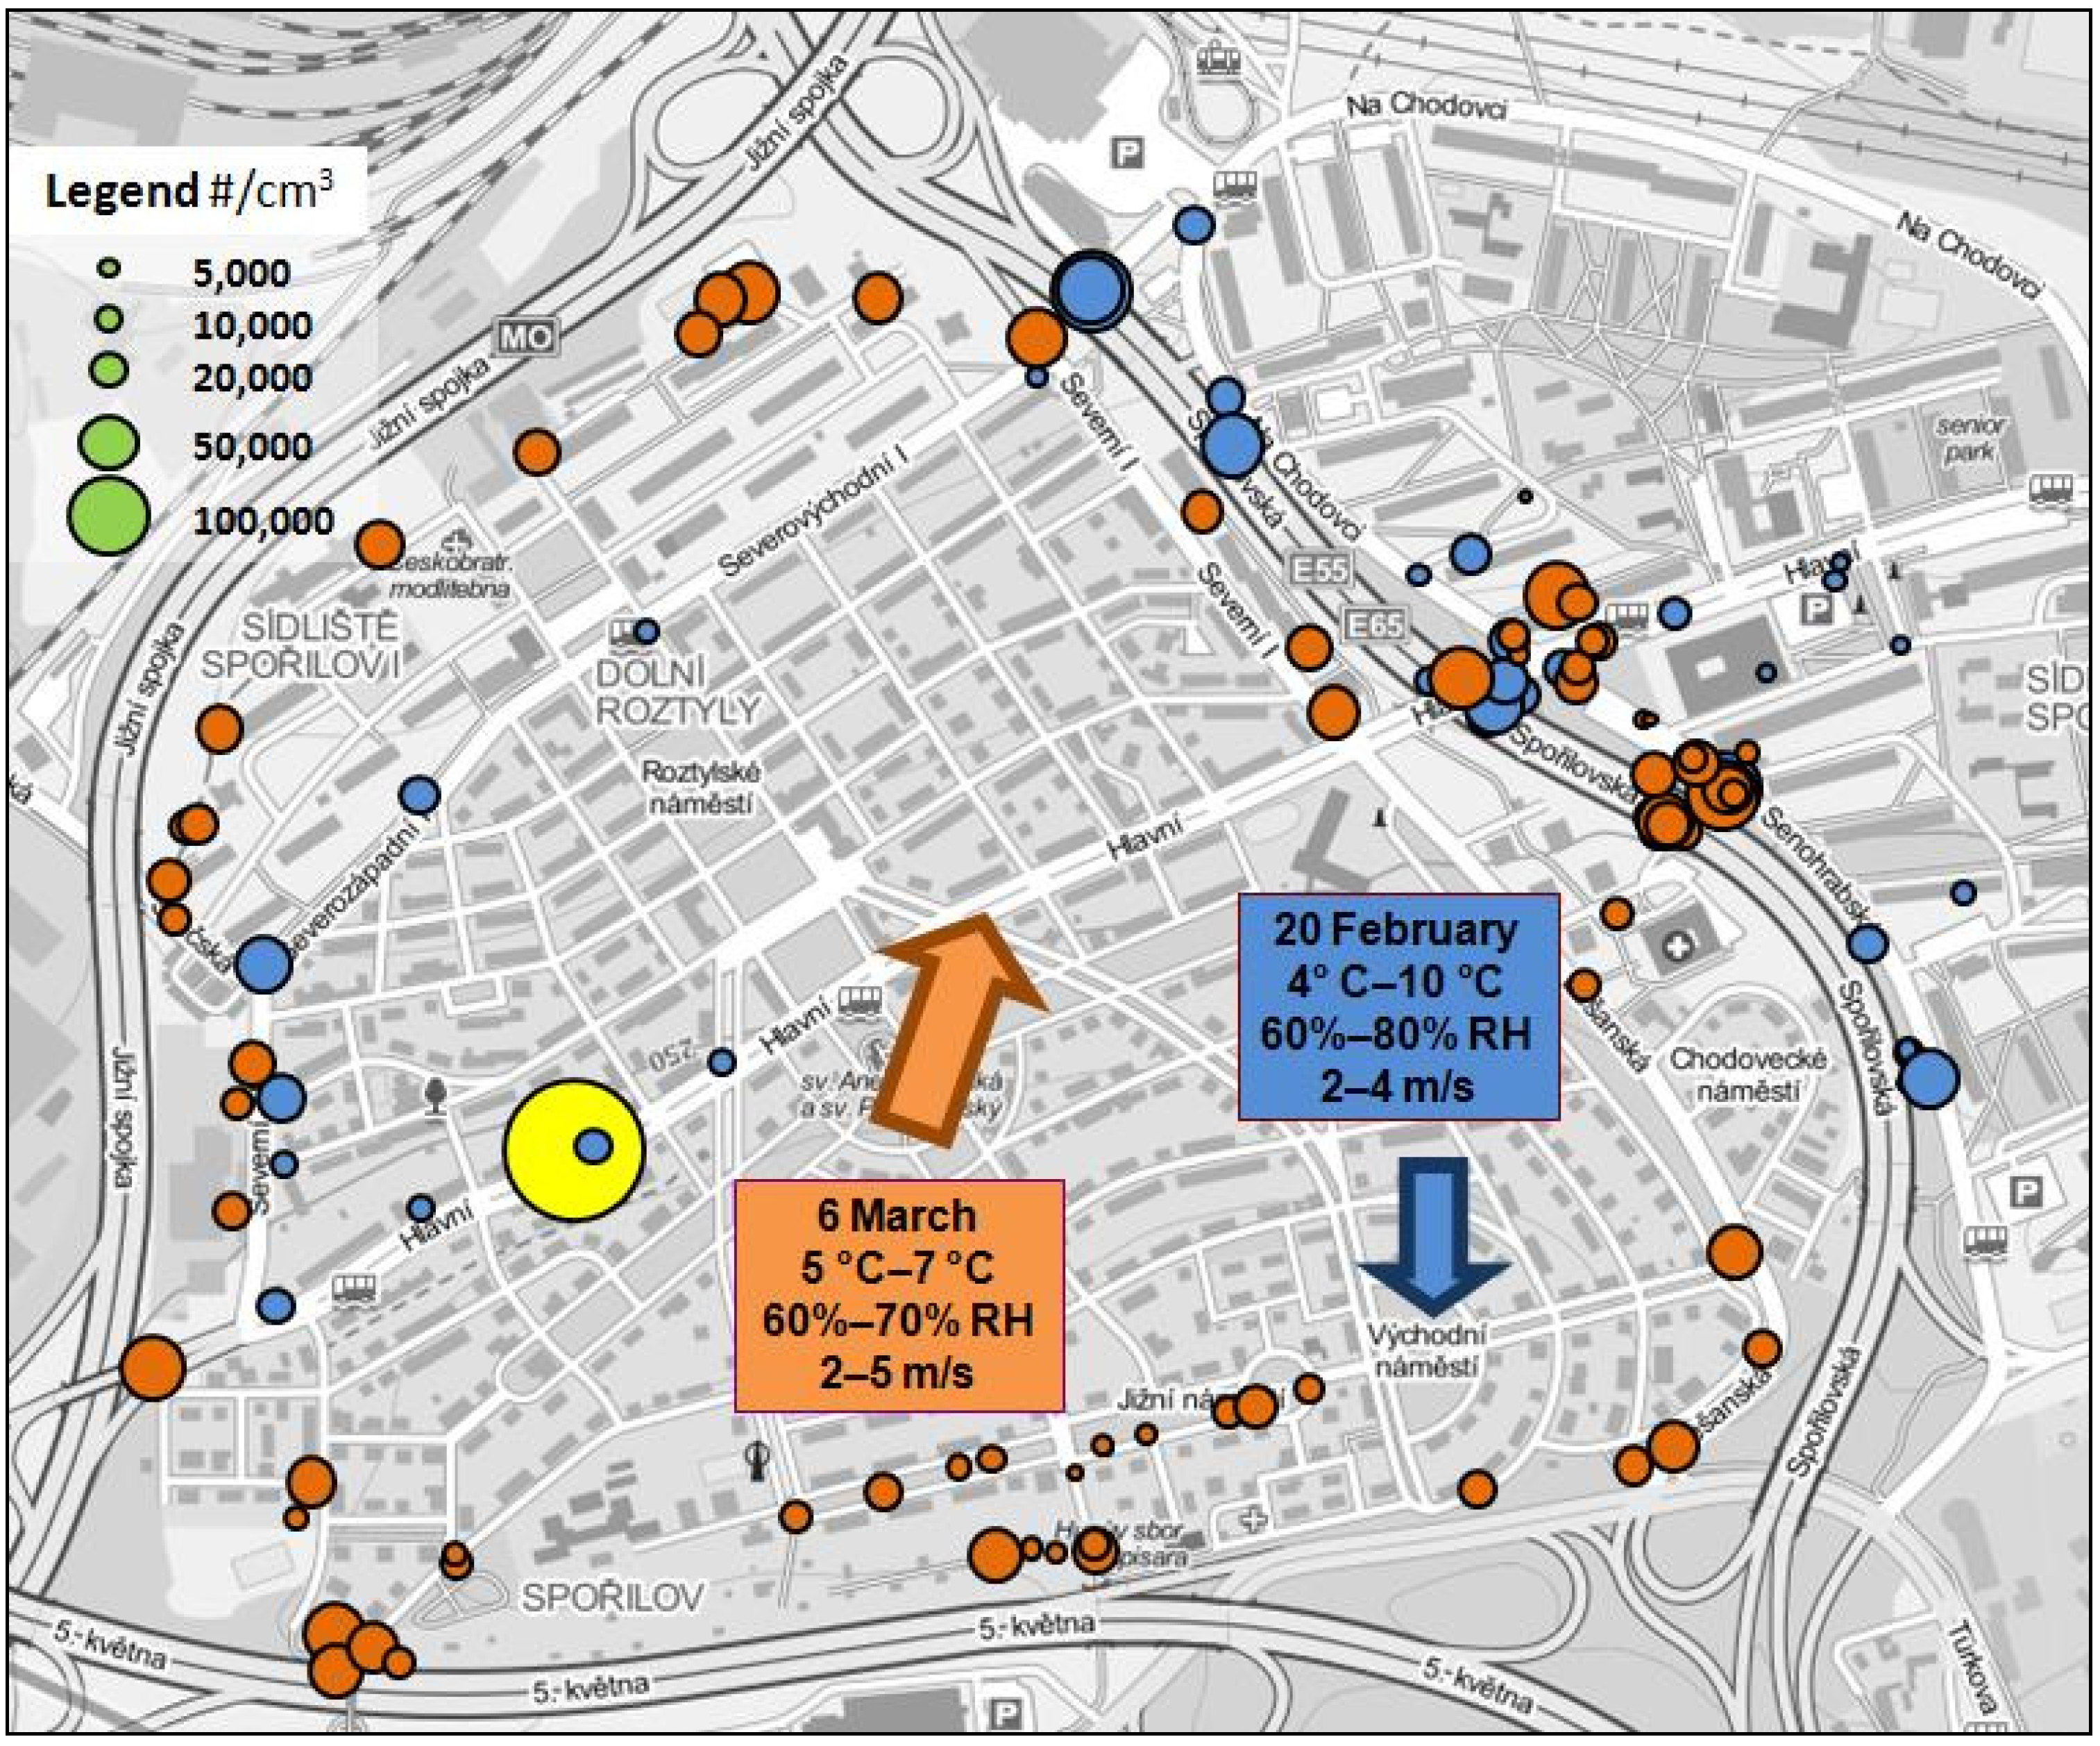
Morning and afternoon traffic peaks were recorded on 6 March (7:15–11:15 a.m.) and 20 February (1:15–6:00 p.m.), respectively. During both days the wind was stable and moderate (
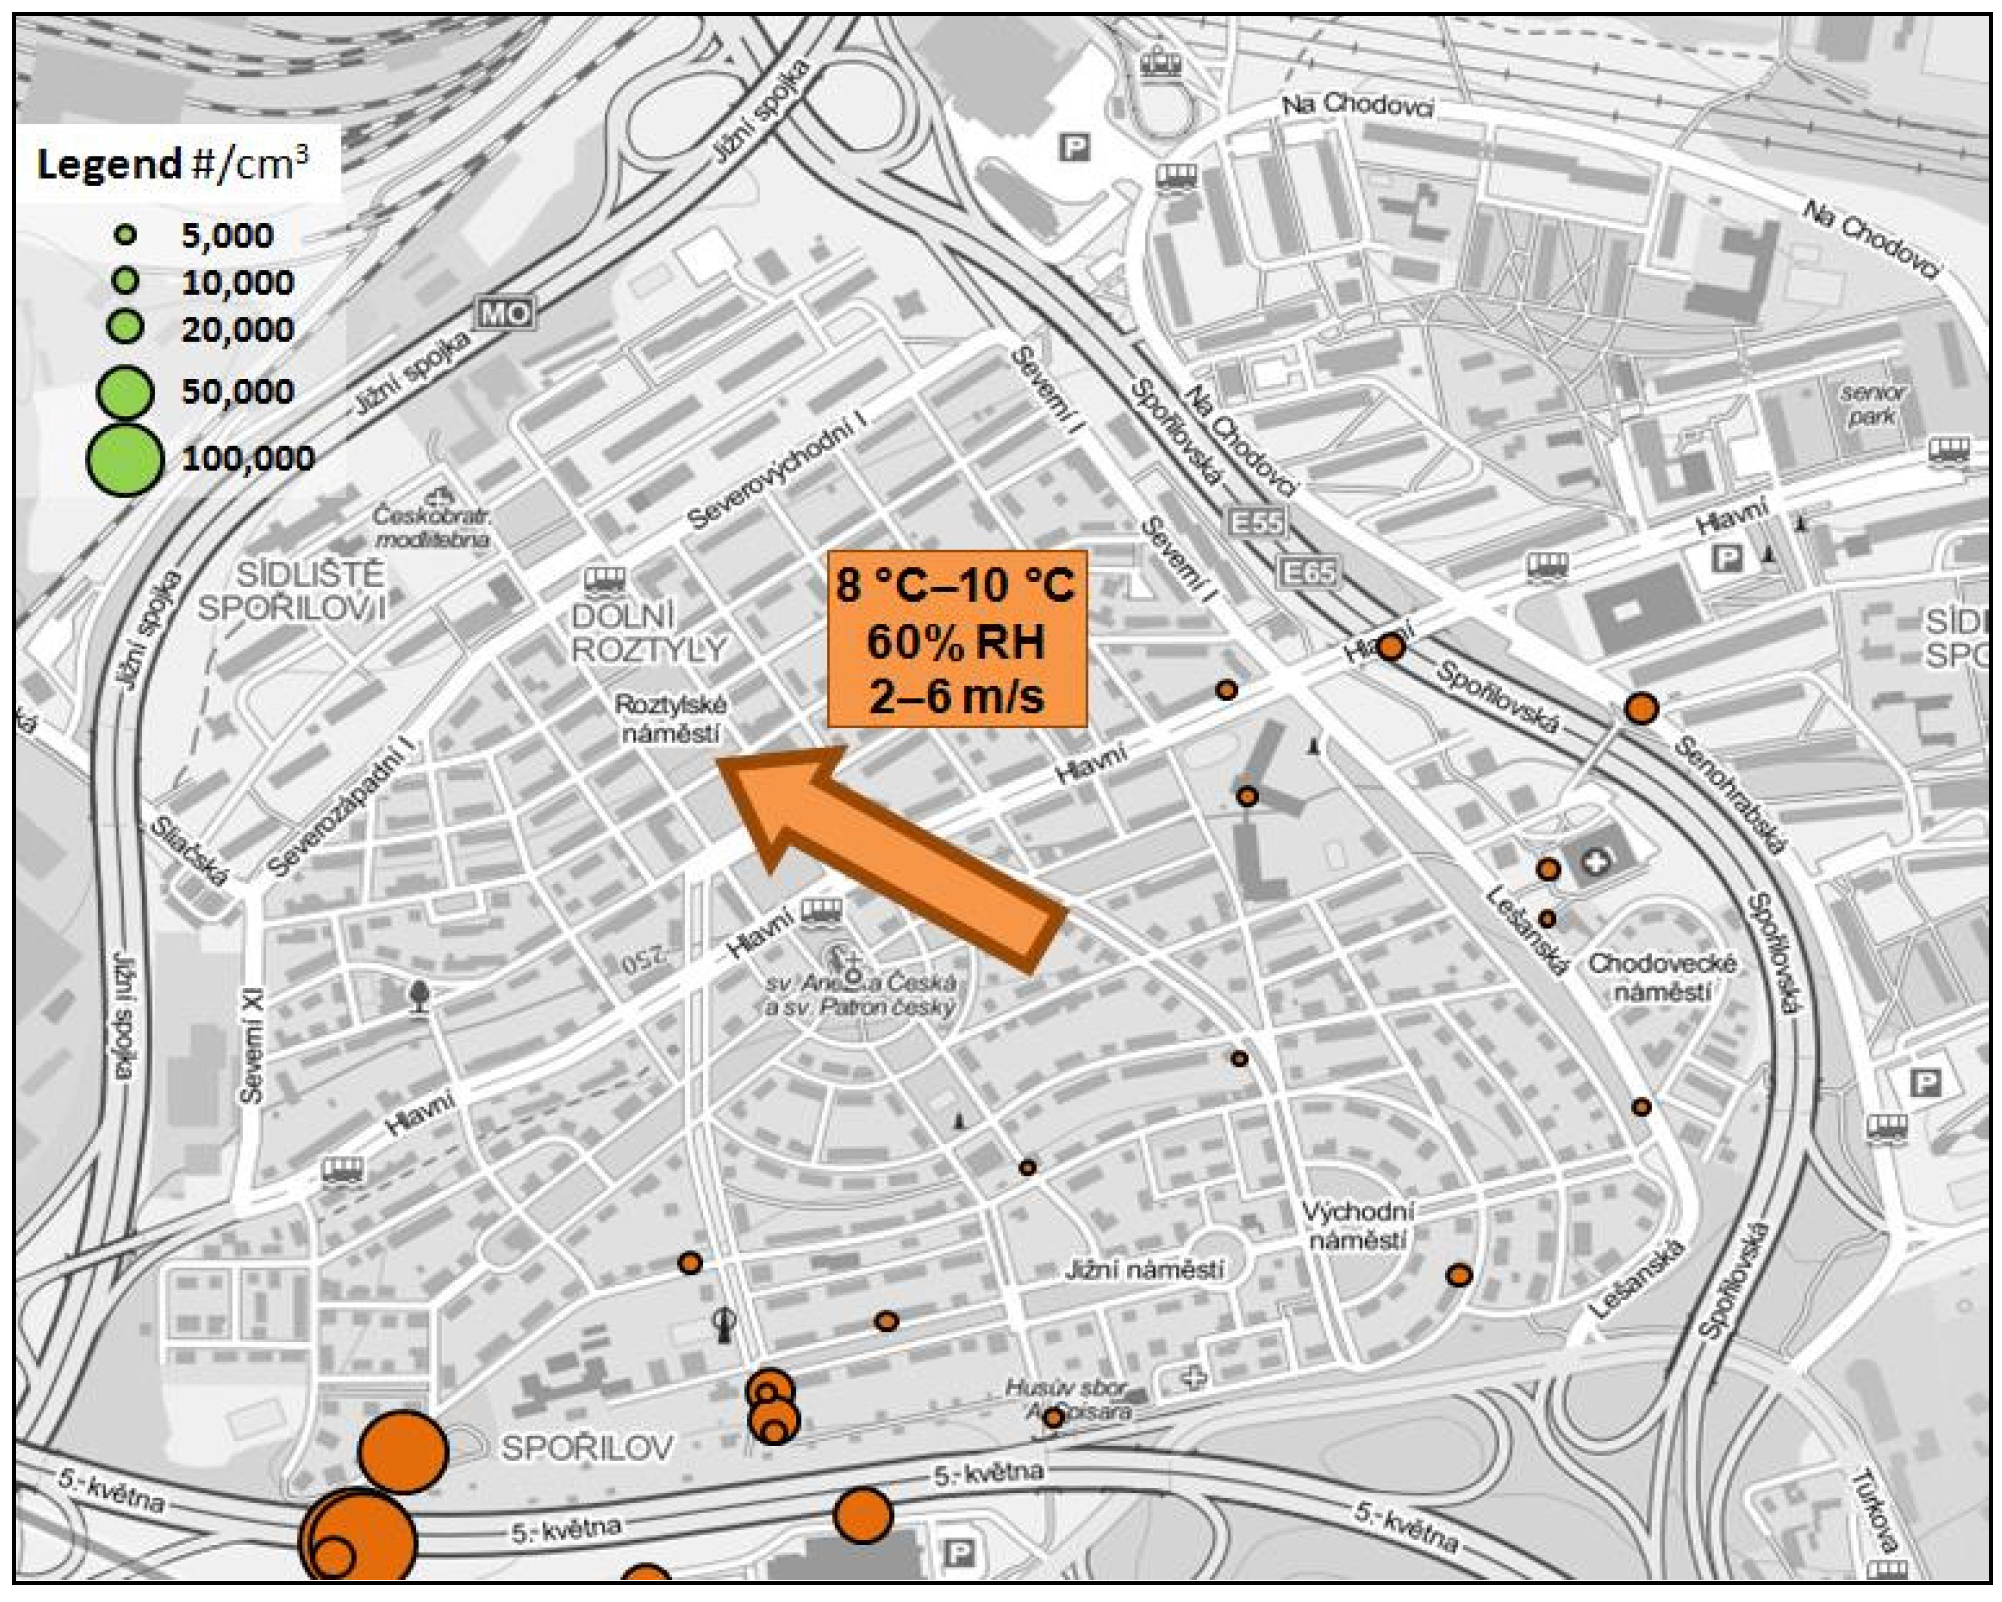
Figure 5). Near the road,
circa 50 m away from the road, averaged concentrations were 3.4 × 10
4 #/cm
3 (median 2.3 × 10
4 #/cm
3) and 3.1 × 10
4 #/cm
3 (median 3.1 × 10
4 #/cm
3) for 20 February and 6 March, respectively. Further from the main roads the concentration decreased to average values 1.2 × 10
4 #/cm
3(median 9 × 10
3 #/cm
3) on 20 February and 1.5 × 10
4 #/cm
3 (median 1.3 × 10
4 #/cm
3) on 6 March. Anomalous value 3.3 × 10
5 #/cm
3 in the middle of building area was caused by a passing scooter. This value was not involved in average and median calculation (
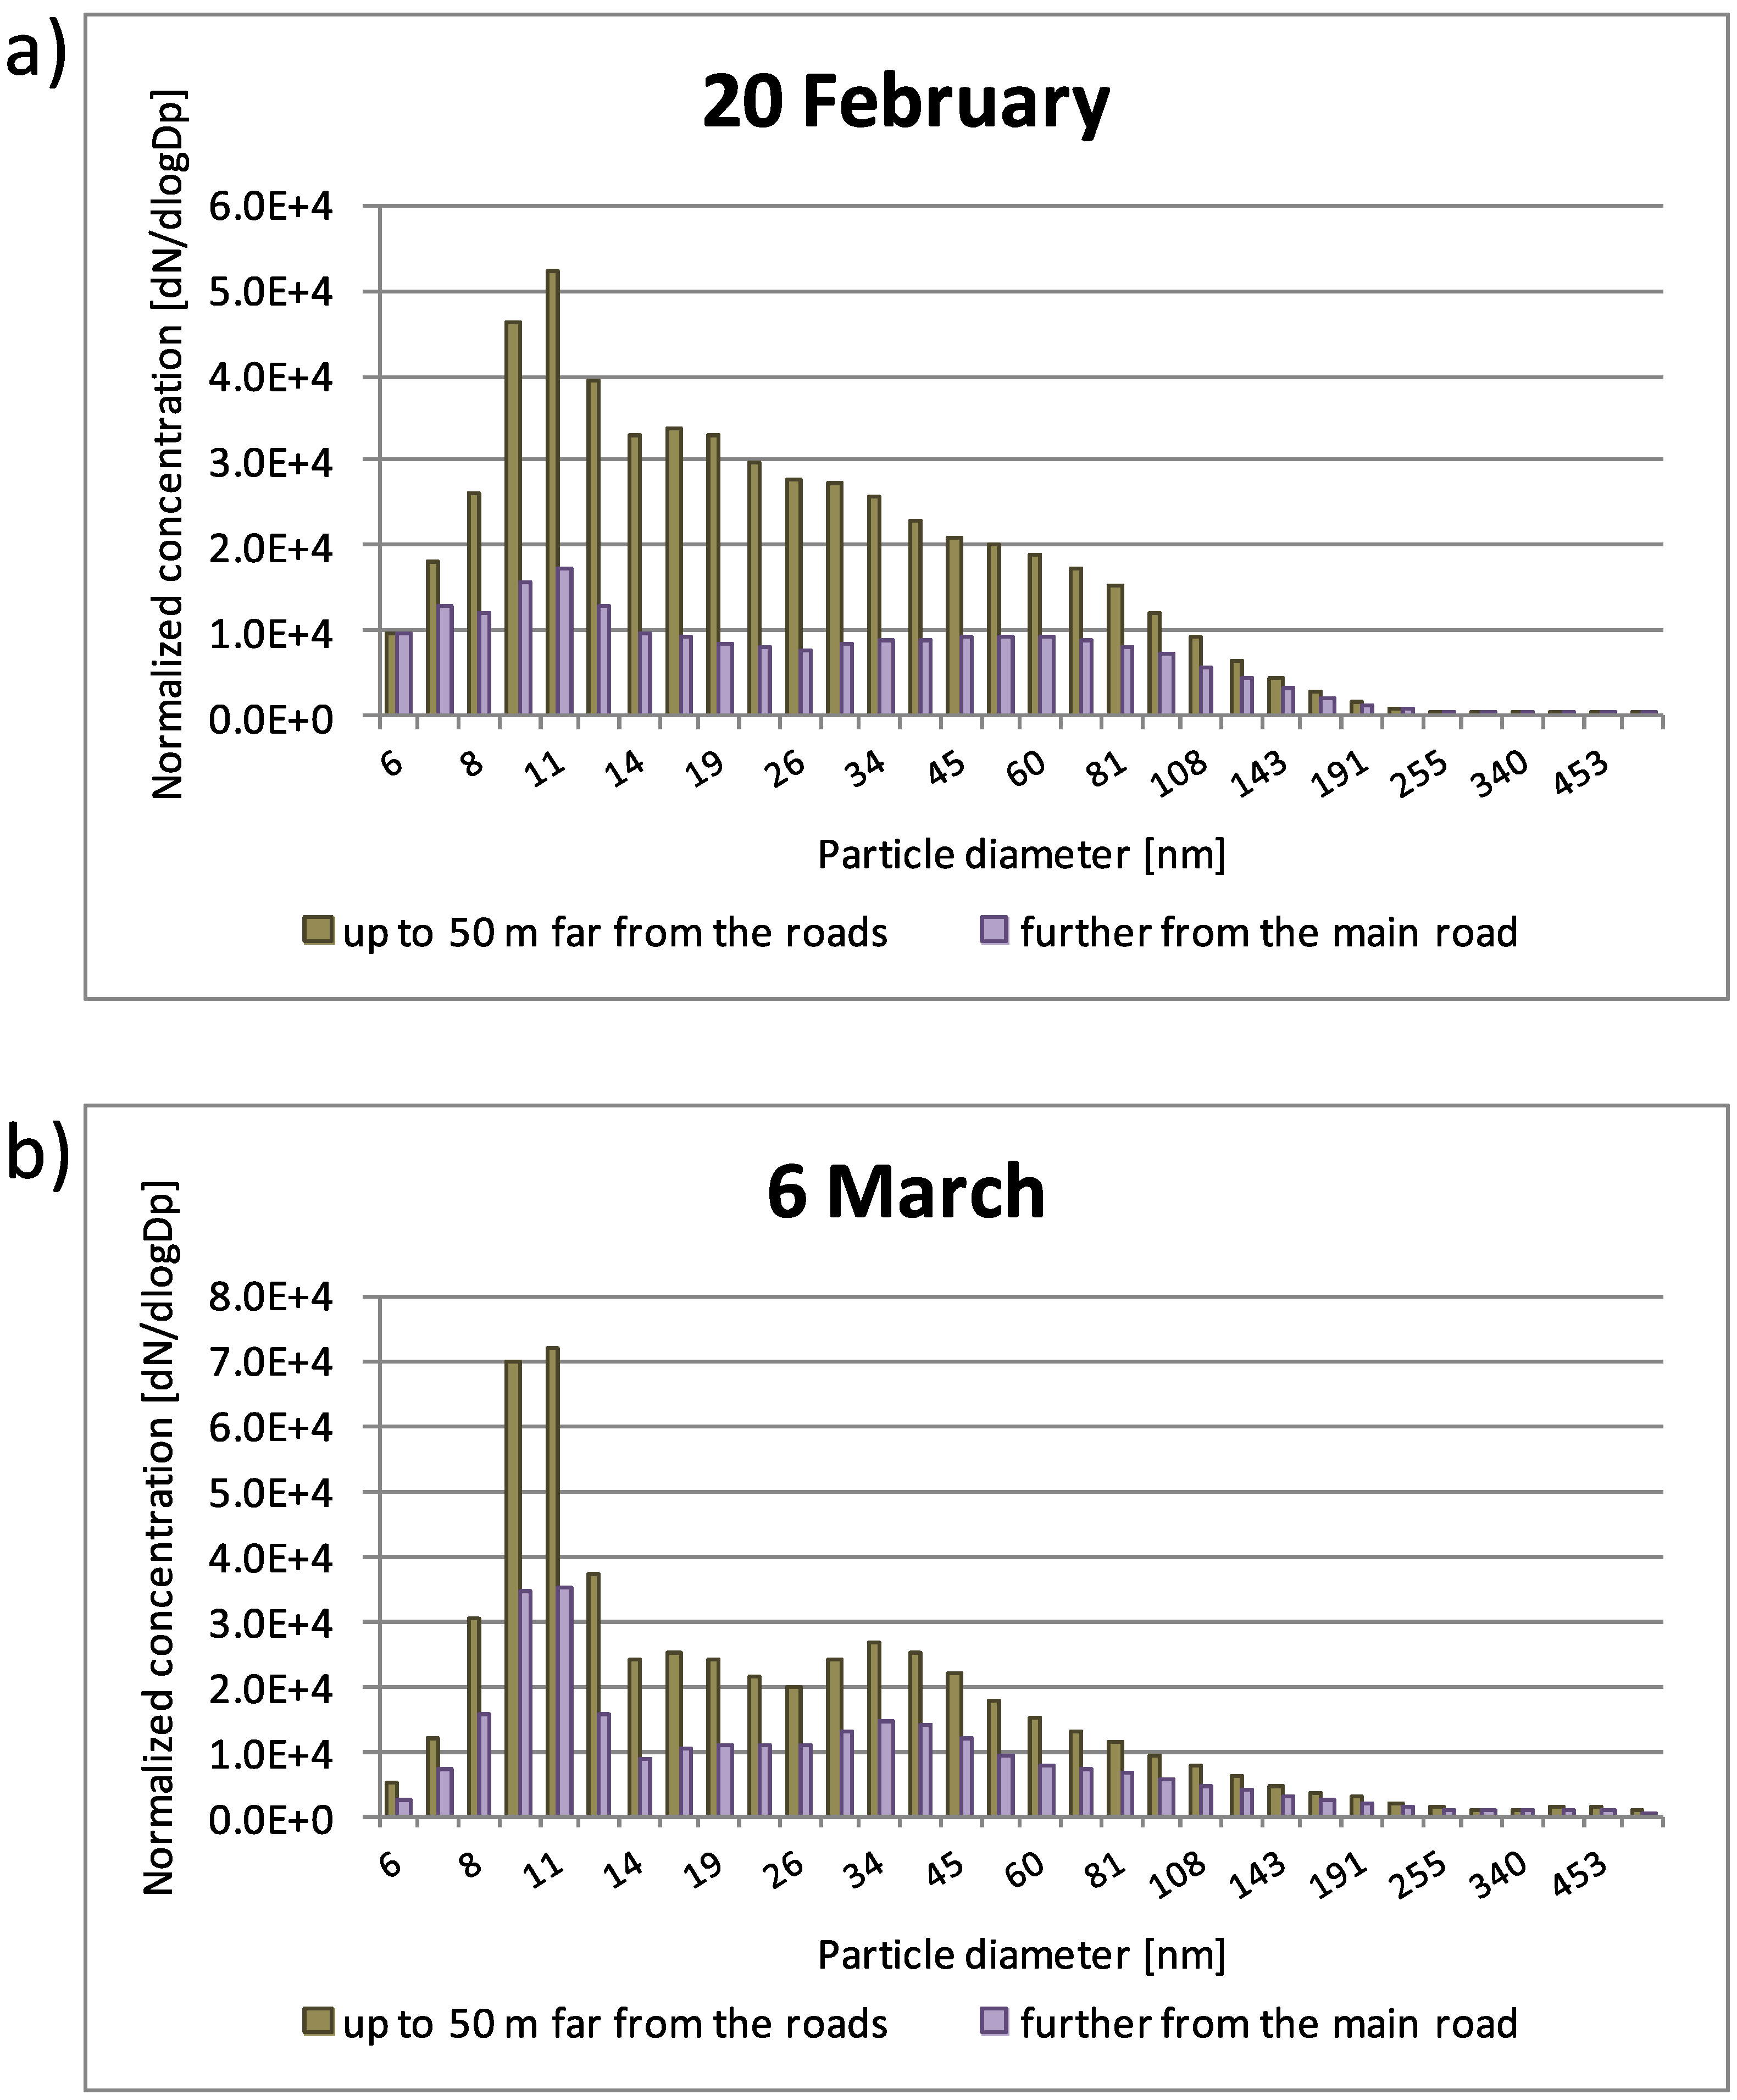
Figure 5). Distributions for both days are shown in
Figure 6. There are strong peaks in particle concentration for 10 nm particles and less visible for particles with 40 nm diameter.
Figure 5.
Measured average UFP concentrations and meteorological conditions in Sporilov on 20 February—blue, 6 March—orange. There can be seen substantial difference between higher concentrations measured closed to main roadways and lower concentrations measured deeper in a housing estate. Anomalous concentration due to scooter passing was indicated as a yellow dot; Map sources: Mapy.cz, Seznam.cz a.s.
Figure 6.
Particle number distribution measured in Sporilov on 20 February (a) and 6 March (b) according to distance from the main road. The highest peaks for both measurements were observed in 10 nm diameter particles, the second smaller peaks were formed in 20 and 40 nm particles for 20 February and 6 March, respectively. Similarity in distributions near and away from the main roadways and relative shift of smaller particles to larger ones in places further from the main roadways in comparison with places near the roadways indicated that particles measured deeper in a housing estate had a traffic origin.
3.3. Sporilov—Effects of Wind Direction
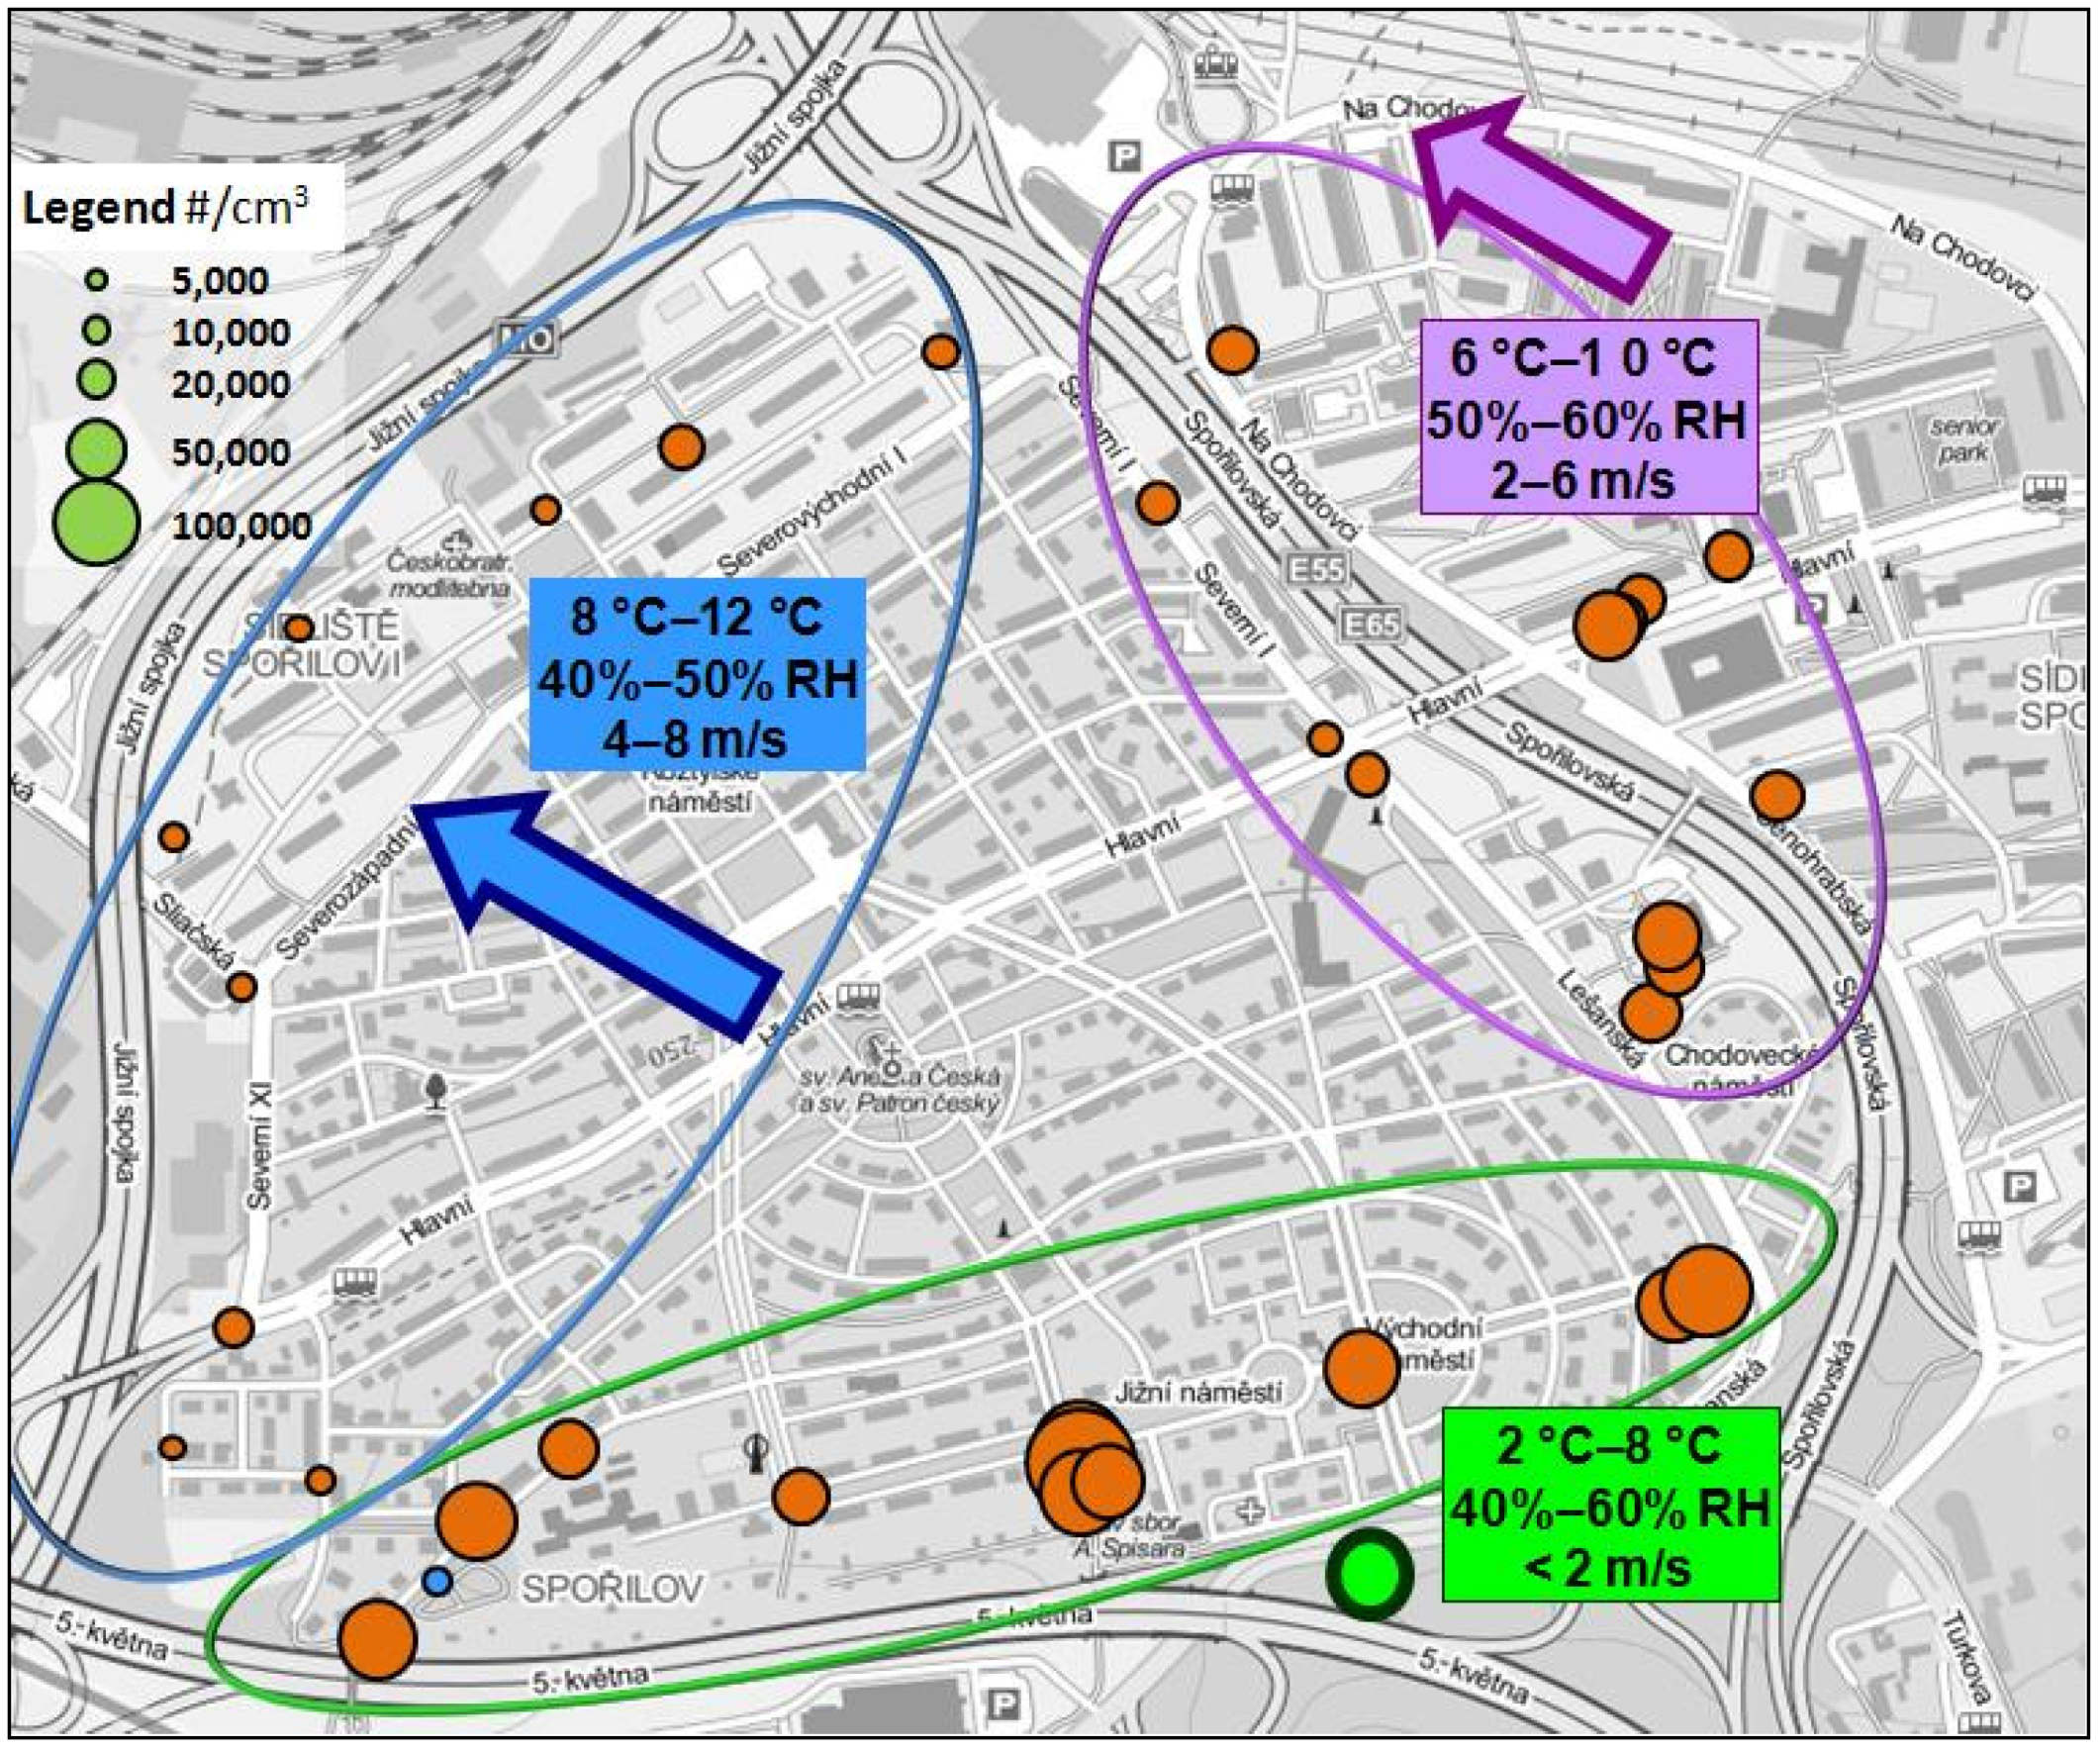
Measurement on 12 March was performed from 7:20 a.m. to 11:30 a.m. During this campaign the temperature and wind velocity gradually increased. Along with better dispersion condition, measured concentrations were decreasing. Meteorological conditions were recognized as the main determinant of number concentrations. Data were divided into three datasets: measurement 7:20–8:30 a.m. windless condition, 8:30–10:00 a.m. moderate wind along a main road, and 10:00–11:30 a.m. measurements upwind from a major road where the emissions were blown away (
Figure 7). Windless condition, while traffic culminated, led to averaged concentration 8.9 × 10
4 #/cm
3 (median 8.6 × 10
4 #/cm
3), distance from a main road was between 10–200 m. Moderate wind along a main road resulted in averaged concentration 3.8 × 10
4 #/cm
3 (median 3.5 × 10
4#/cm
3), distance from a main road was between 50–170 m. Situation when emissions were blown away occurred after 10:00 a.m., under this condition, concentrations were the lowest with average 1.3 × 10
4 #/cm
3 (median 1.0 × 10
4 #/cm
3), however, still above the Prague urban background of 7.3 × 10
3 #/cm
3 [
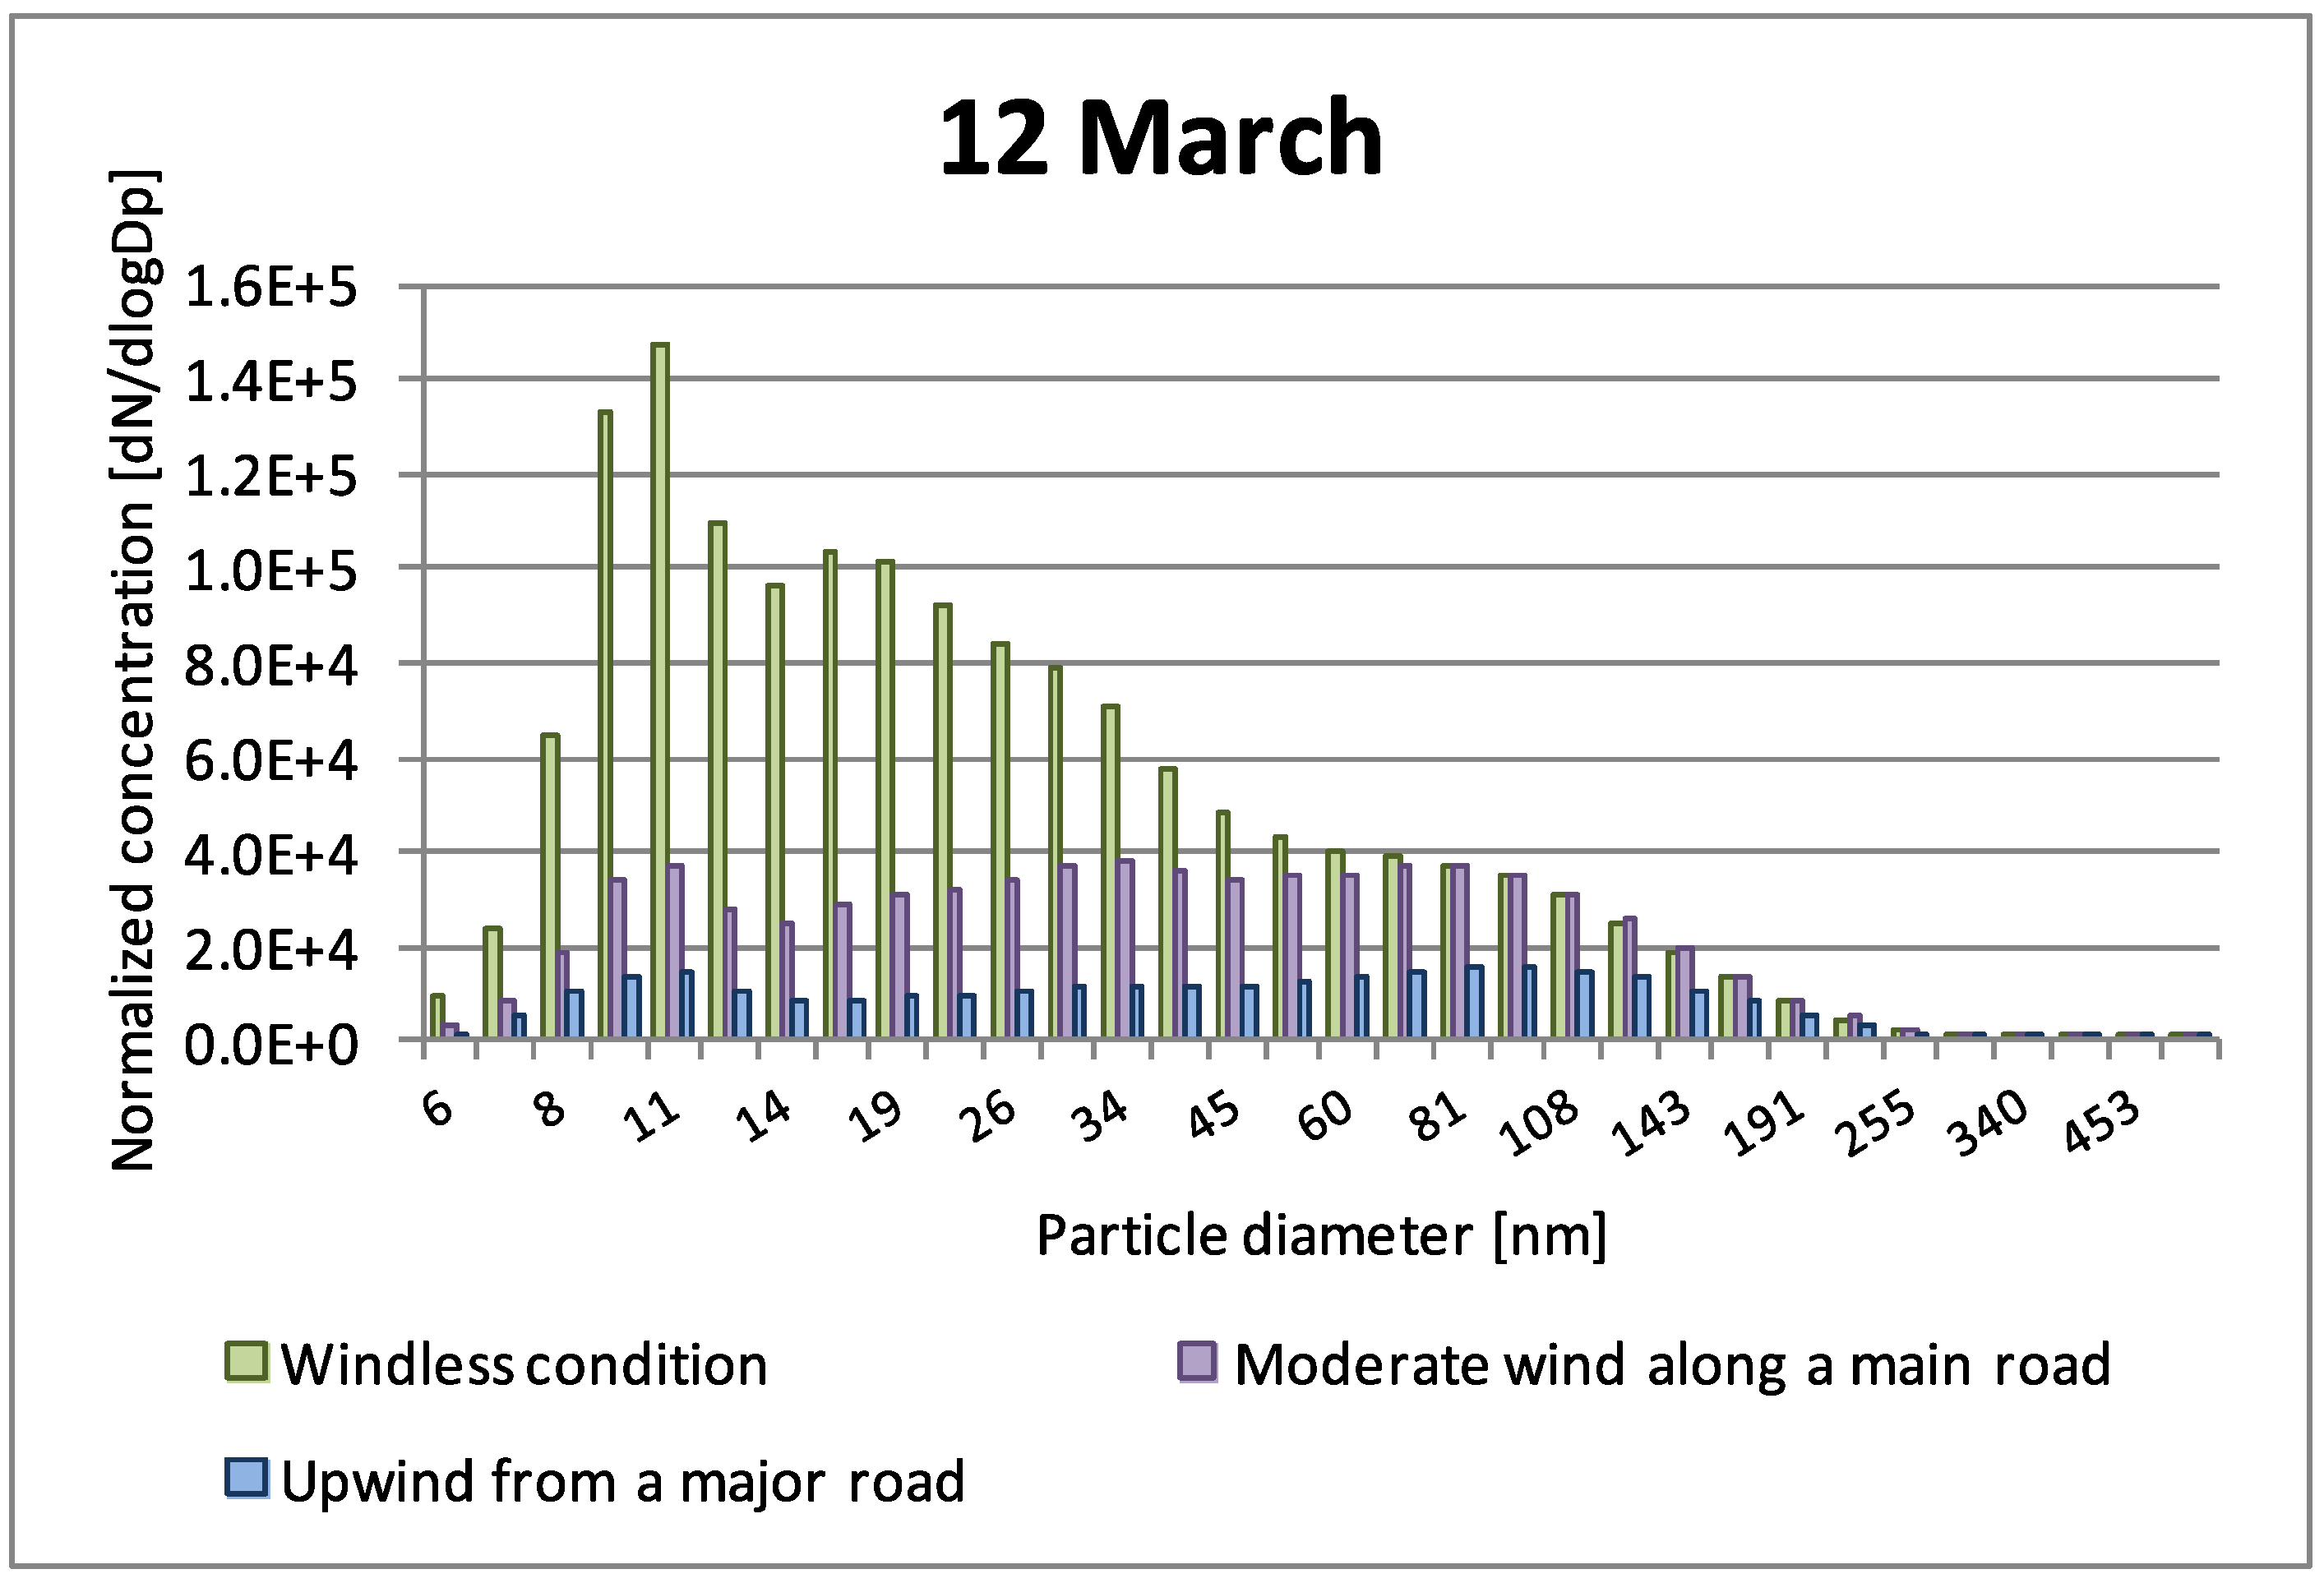
29]. Particle number distributions have been changing with dispersion conditions. The highest peak seen under windless condition with maximum around 11 nm particles decreased and an almost imperceptible peak in bigger sizes (
ca. 100 nm) increased in comparison with the peak in smaller sizes (
Figure 8).
Figure 7.
Measured average UFP concentrations within changing meteorological conditions in Sporilov on 12 March; during windless conditions, the highest averaged concentrations were measured in a building estate. Along with increasing wind speed measured particle number concentrations were gradually decreasing. Even within good dispersion conditions the particle number concentrations exceeded Prague background. Dots in a green ellipse represent measurement between 7:20–8:30 a.m.; purple, 8:30–10:00 a.m.; and blue, and 10:00–11:30 a.m.; Map sources: Mapy.cz, Seznam.cz a.s.
Figure 8.
Particle number distribution within changing meteorological conditions in Sporilov on 12 March. Within windless condition a particle number distribution showed similar patter as measured on other days (20 February and 26 March;
Figure 3) close to main roadways although this measurements involving places even further from the main roadway. Along with increasing wind speed relative proportion of smallest particles decreased while larger particles increased relatively.
3.4. Sporilov—Effects of Truck Acceleration Hotspot
Additional measurement was performed on 26 March from 10:45 a.m. to 1:20 p.m. after dilution of morning inversion. The highest concentrations, with a peak of 1.0 × 10
6 #/cm
3, were measured on the footbridge over a freeway. The eastbound section of the freeway is traveled by trucks, which have made a transit through Prague, often through extended periods of heavy congestion, entered the freeway on a ramp located just west of the footbridge, and are accelerating from the ramp while negotiating an incline. Earlier simulation of such conditions in an engine laboratory by this group [
23] has demonstrated that extended low load leads to the cooling of the combustion chamber and of the exhaust system, which in turn results in worsened combustion, formation of deposits within the engine and the exhaust system, and loss of efficiency of catalytic devices due to low exhaust temperature. When such engine is subsequently operated at higher load, the deposits are driven off, and the emissions of particulate matter and temporarily increased; the emissions of carcinogenic polyaromatic hydrocarbons are increased an order of magnitude during such conditions over a stabilized high load operation.
The concentrations on the footbridge, nominally in hundreds of thousands of particles per cubic cm, were fluctuating, with peaks attributed to the passage of individual vehicles (
Figure 9). The concentrations decreased markedly with the distance from the freeway to around 5.0 × 10
4 #/cm
3 50 meters away from the main road. Except for this acceleration site and related main road, the concentrations were relatively low thanks to good dispersion condition, average 7.0 × 10
3 #/cm
3, median 6.0 × 10
3 #/cm
3 (
Figure 10). Distributions are shown in
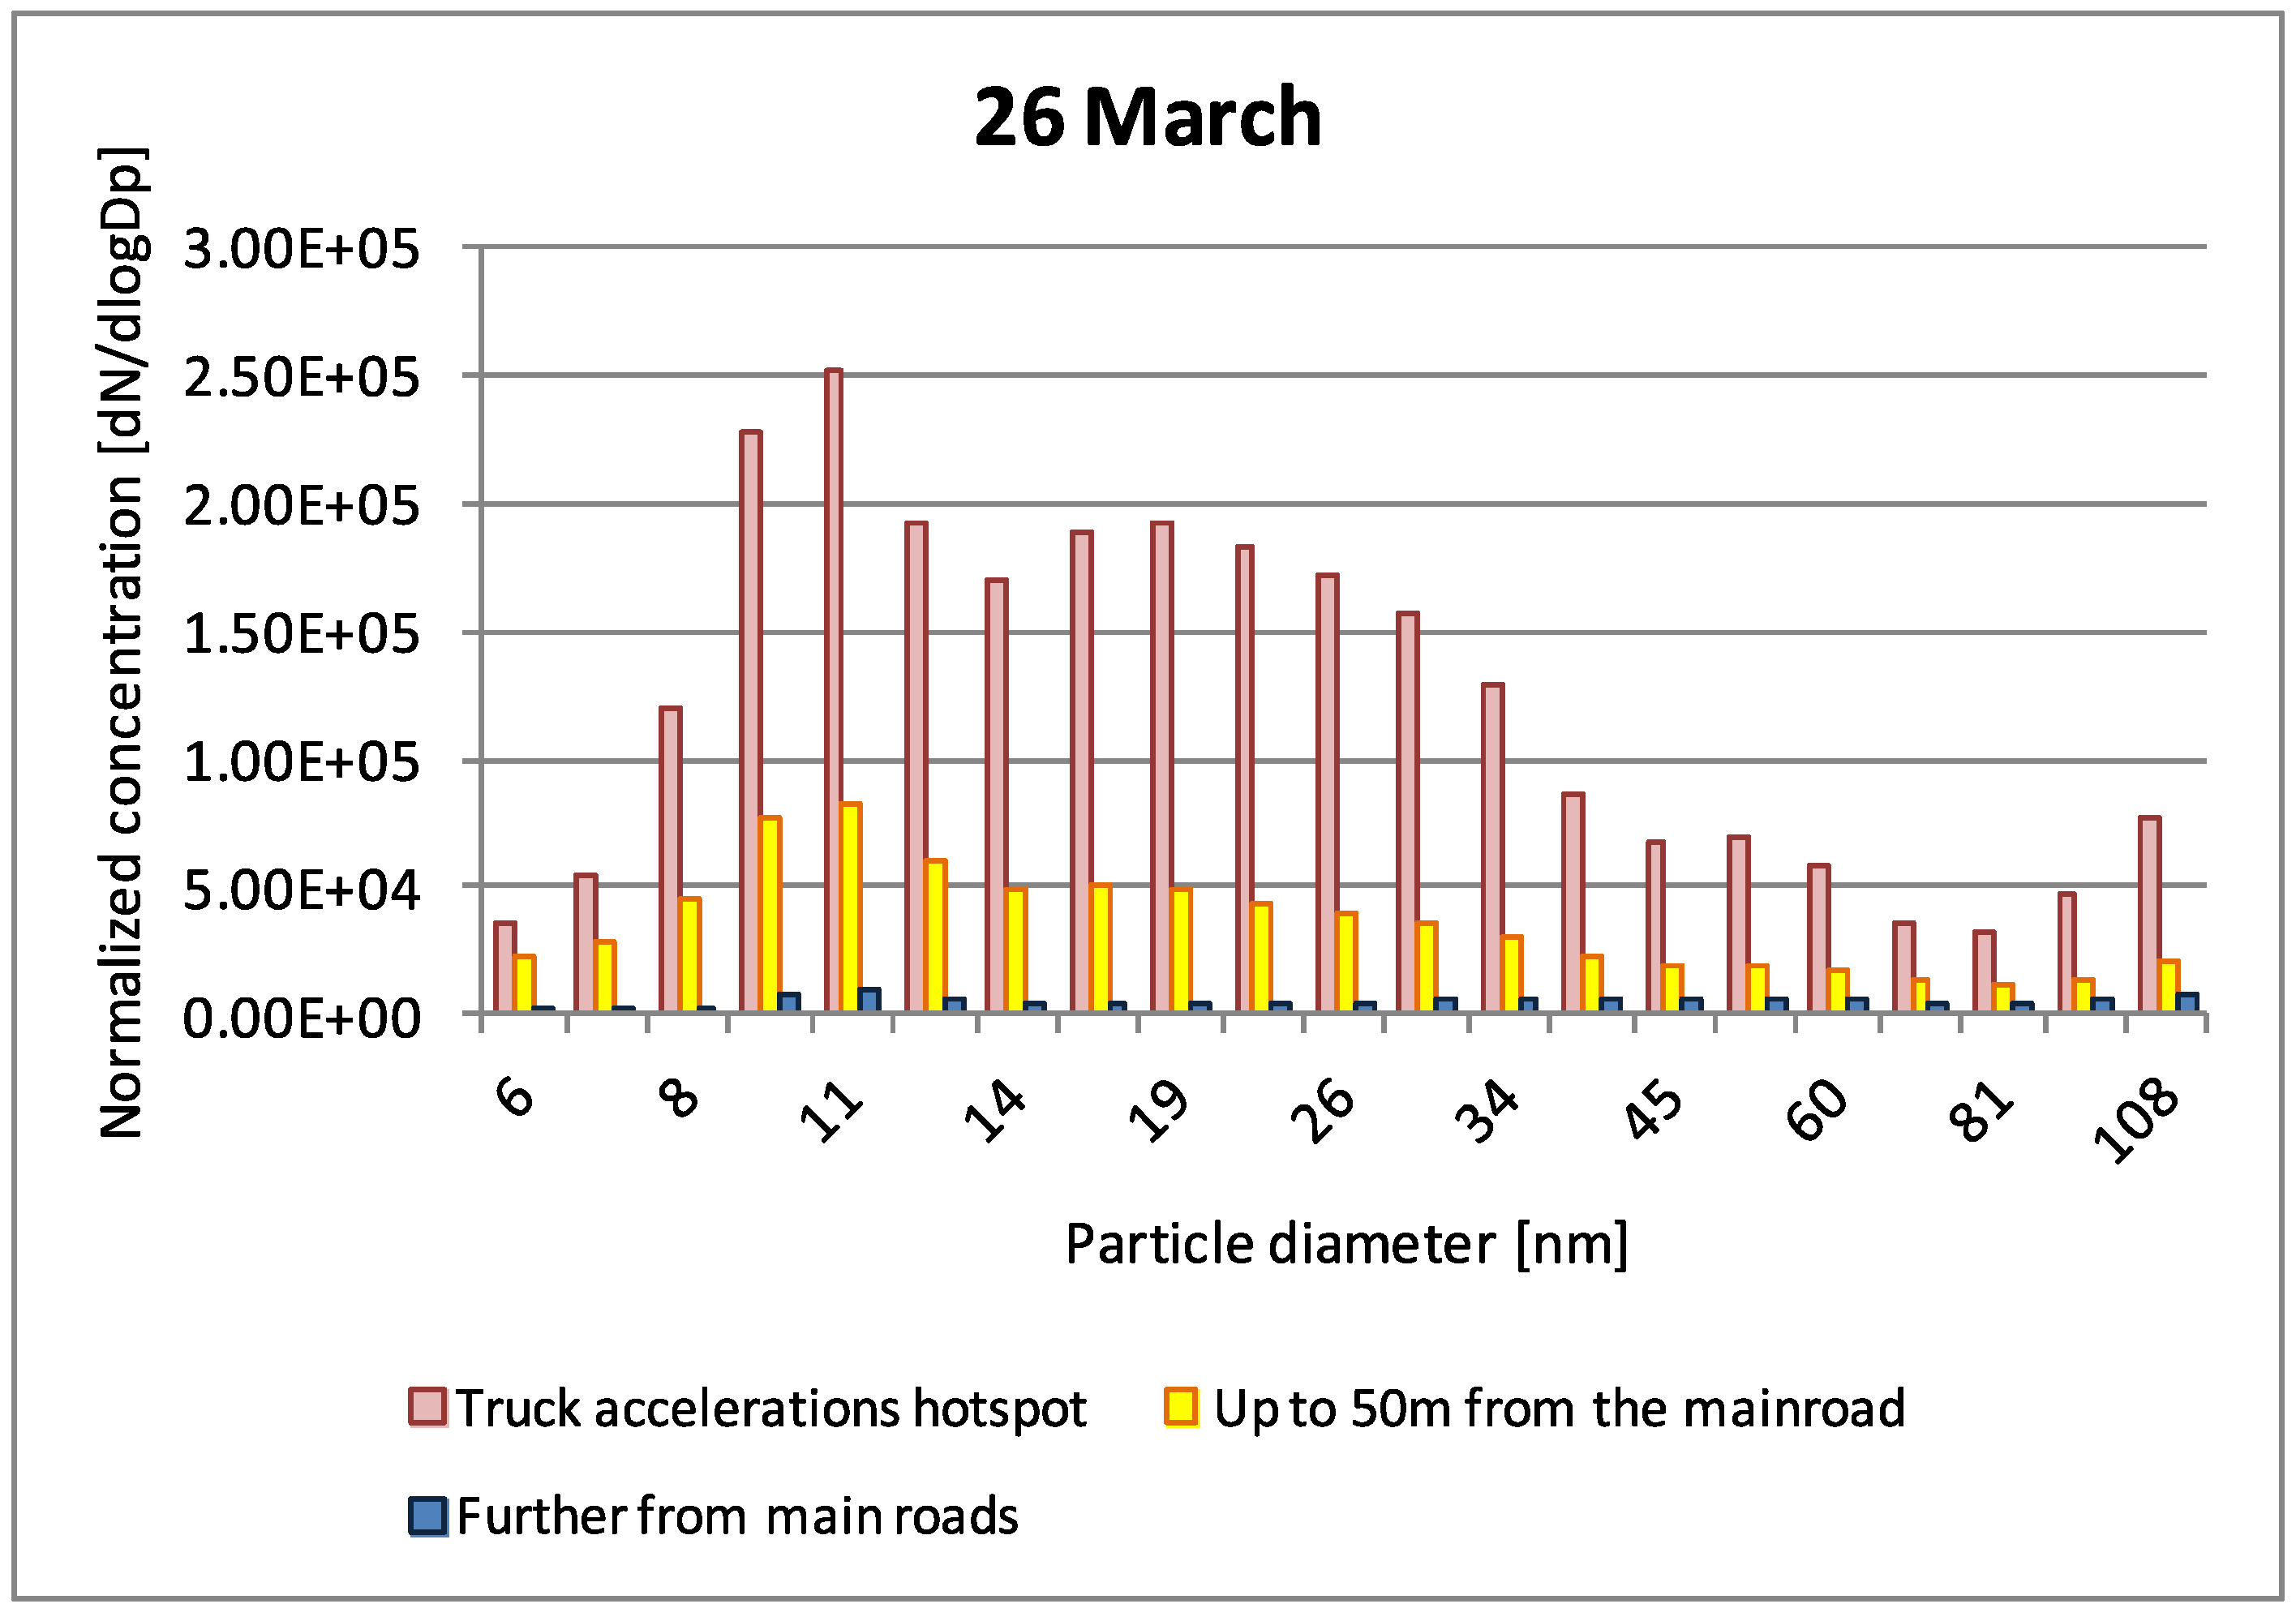
Figure 11. A bimodal distribution (10 nm and 20 nm peaks) was observed for site on/around the footbridge, with concentrations decreasing with the distance from the road. Farther places had low particle concentration, even though a peak in 10 nm particles was still noticeable. These results contain only particles in range 5–100 nm; instrument channels counting larger particles were affected by a measurement artifact (a dog hair lodged on an EEPS electrometer).
Figure 9.
Number particle concentration time course within hotspot measurement in Sporilov on 26 March. Truck acceleration is peculiar for this measurement site. Additionally, before the trucks reach this place, they often spend some time in congestion. Under congestion condition extended low load leads to the cooling of the combustion chamber and of the exhaust system, which in turn results in worsened combustion, formation of deposits within the engine and the exhaust system, and loss of efficiency of catalytic devices due to low exhaust temperature. When such engine is subsequently operated at higher load, the deposits are driven off, and the emissions of particulate matter and temporarily increased.
Figure 10.
Measured average UFP concentrations near a hotspot and around in Sporilov on 26 March; High concentrations measured on a footbridge over a freeway were a result of emissions from truck accelerations after extended periods of heavy congestion. Impact of this hotspot can be seen in a near buildup area. Due to good dispersion conditions majority locations of housing estate showed low concentrations. Map sources: Mapy.cz, Seznam.cz a.s.
Figure 11.
Particle number distributions near a hotspot and around according to distance from the hotspot and a main road measured in Sporilov on 26 March; Truck accelerations hotspot showed bimodal distribution with peaks at 10 and 20 nm. There should probably be another peak in larger particles; however, those data are not available because of the contamination of the corresponding instrument channels. Particles concentrations decreased with the distance from the road (up to 50 m), while the size distribution pattern remained similar. Farther places had low particle concentrations, even though a peak in 10 nm particles is still noticeable.
3.5. Libeznice
Measurement was performed during morning traffic peak on 15 May 2014 (6:20–8:15). Particles with diameter <10 nm were excluded because of periodically recurring artifact affecting the smallest two channels, resembling a nucleation event, which was considered improbable. Actual concentrations varied from tens of thousands to hundreds of thousands with peaks exceeding a million particles in cubic centimeter after passing of a high emitting vehicle. Average concentrations are plotted in
Figure 12 and were 2.7 × 10
4 #/cm
3 (median 2.5 × 10
4 #/cm
3) next to the main road. Further from the main road, the number concentrations decreased rapidly to 7.5 × 10
3 #/cm
3 at 100 m and 4.5 × 10
3 #/cm
3 at 150 m.
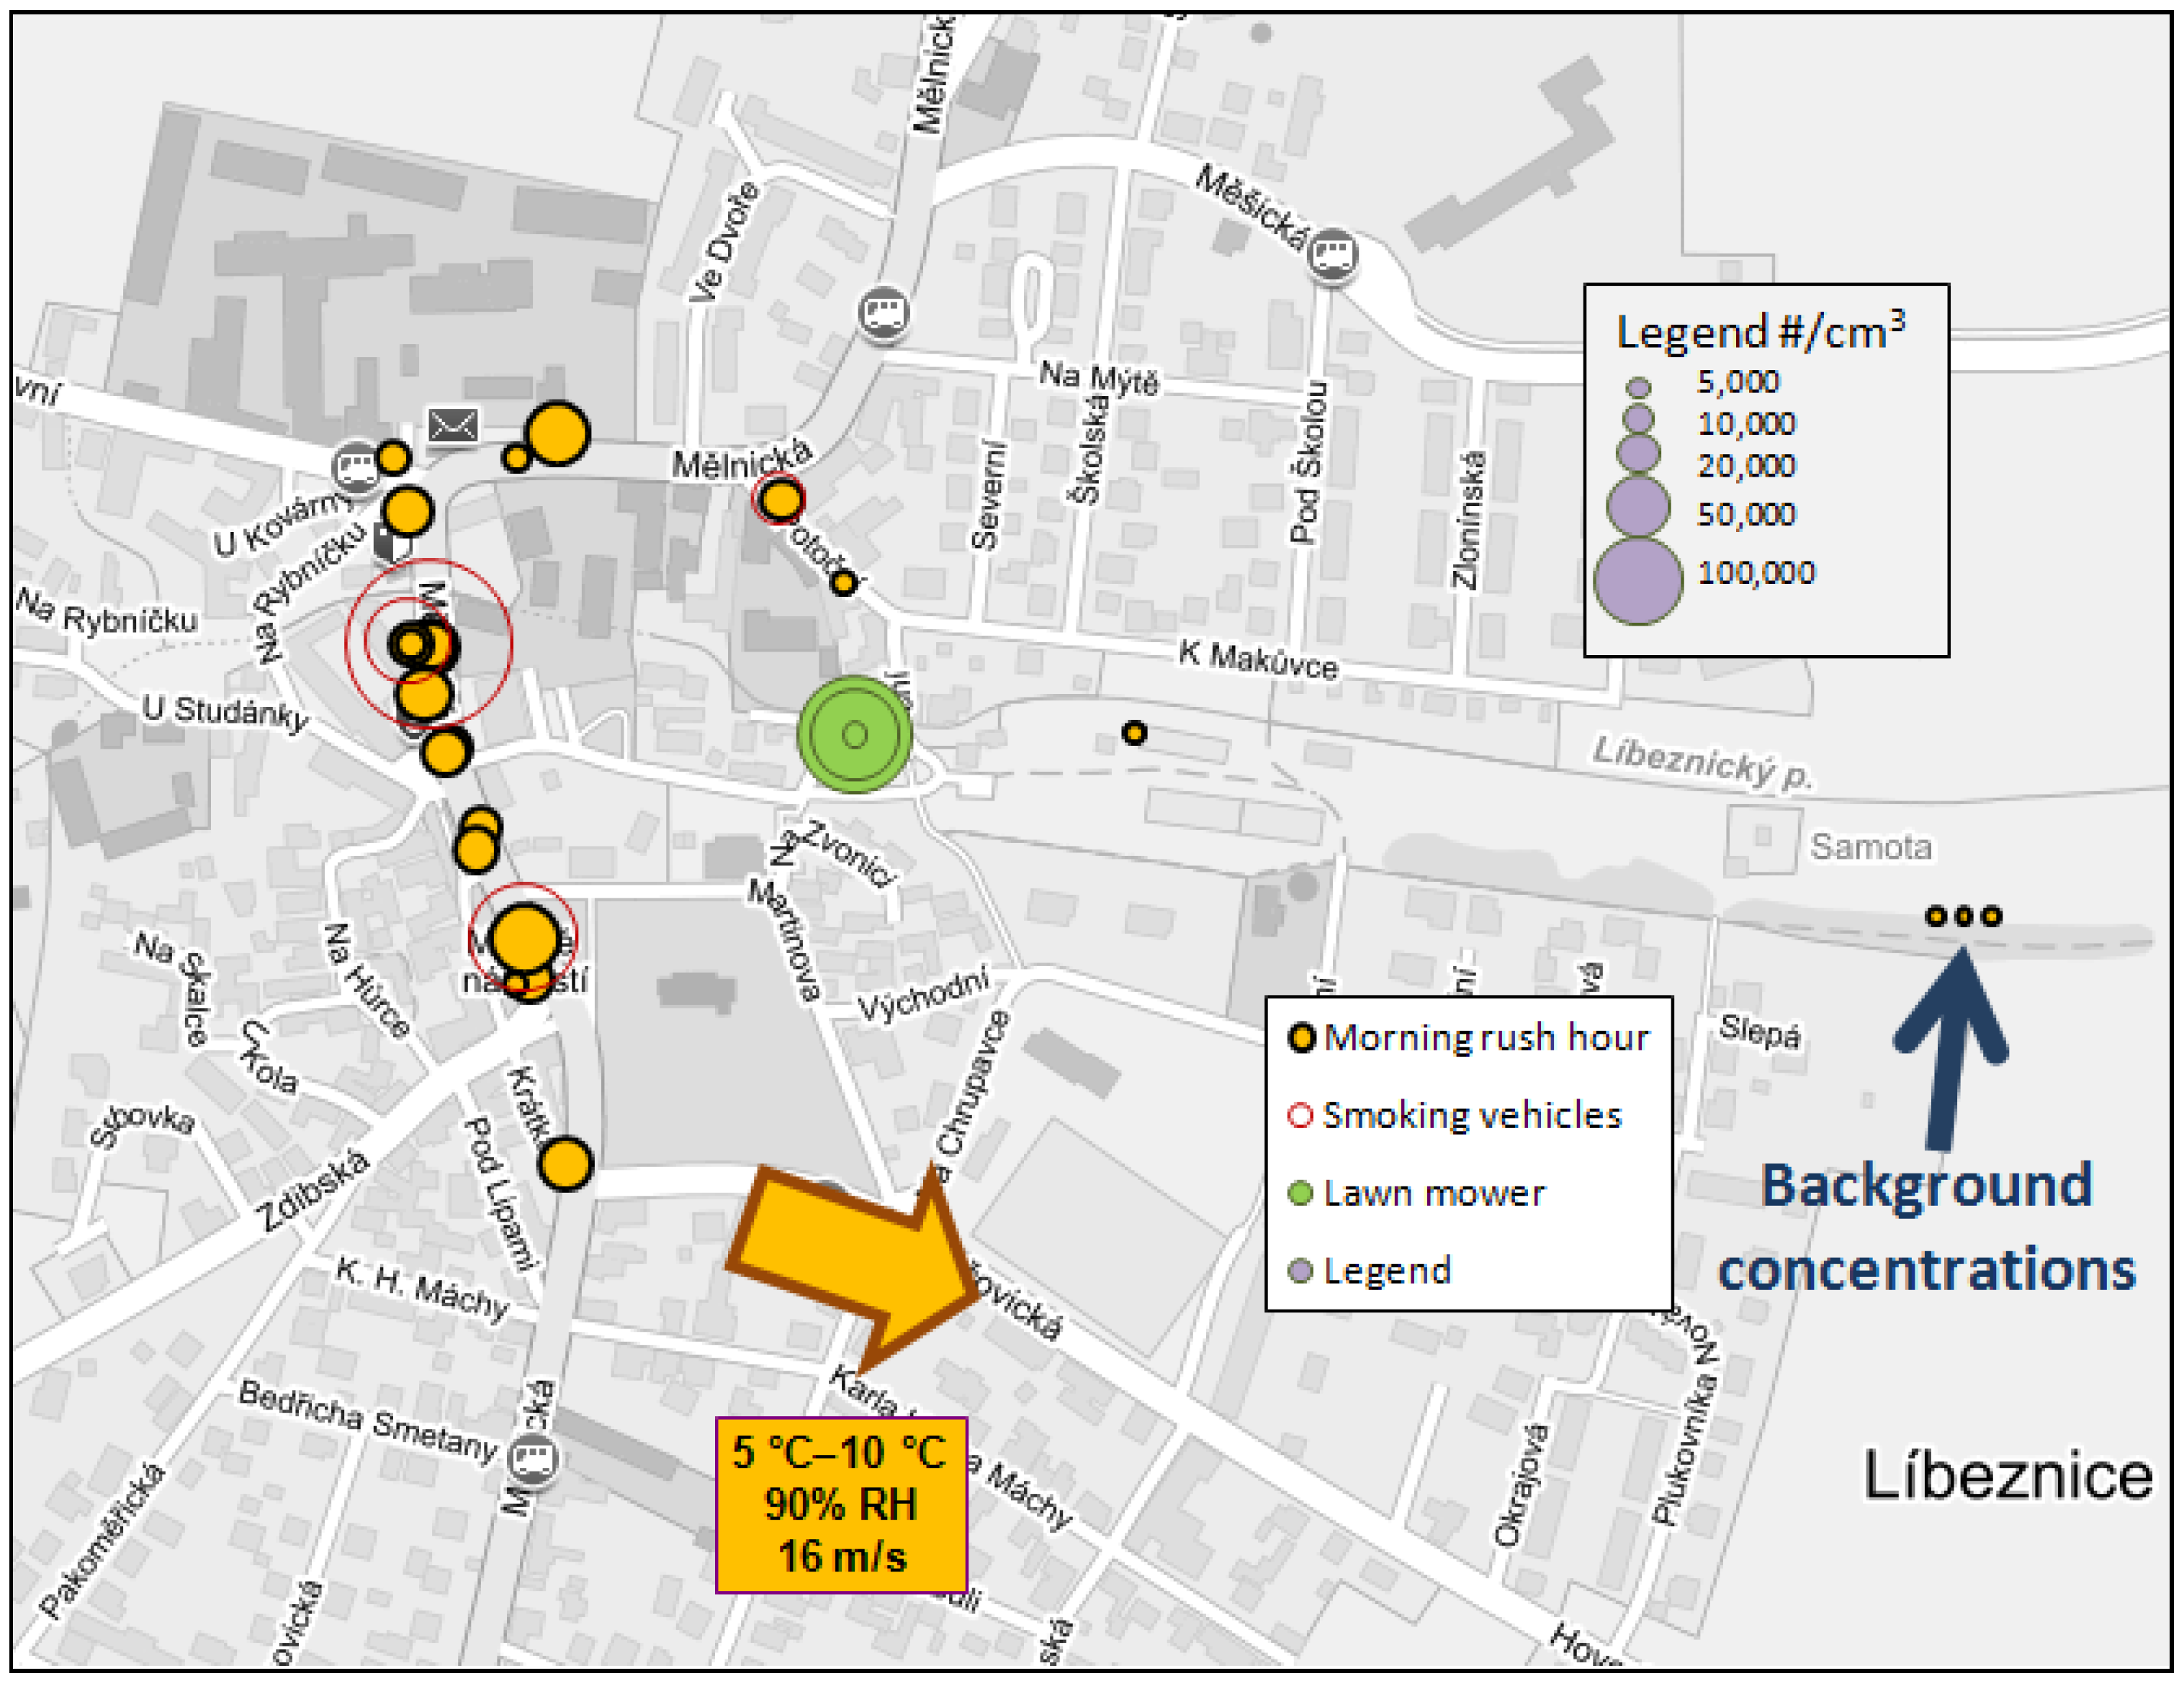
A local and temporary hotspot was created by a small riding lawnmower. Lawnmowers are powered by gasoline engines with no electronic controls and no exhaust after treatment, and are, up to 19 kW power, not subject to any limit on particle emissions. As such, they can be a considerable source of particle emissions in residential neighborhoods. Further, the particles are emitted in the immediate vicinity of the operator, and therefore could pose significant health risk to the workers using such equipment on a regular basis.
The concentrations of particles were in the order of hundreds of thousands of particles per cm
3 circa ten meters away from the mower (
Figure 12), a higher than expected value considering favorable dispersion conditions. Background concentration was measured in the outskirts between rapeseed fields, concentration were around 3.8 × 10
3 #/cm
3.
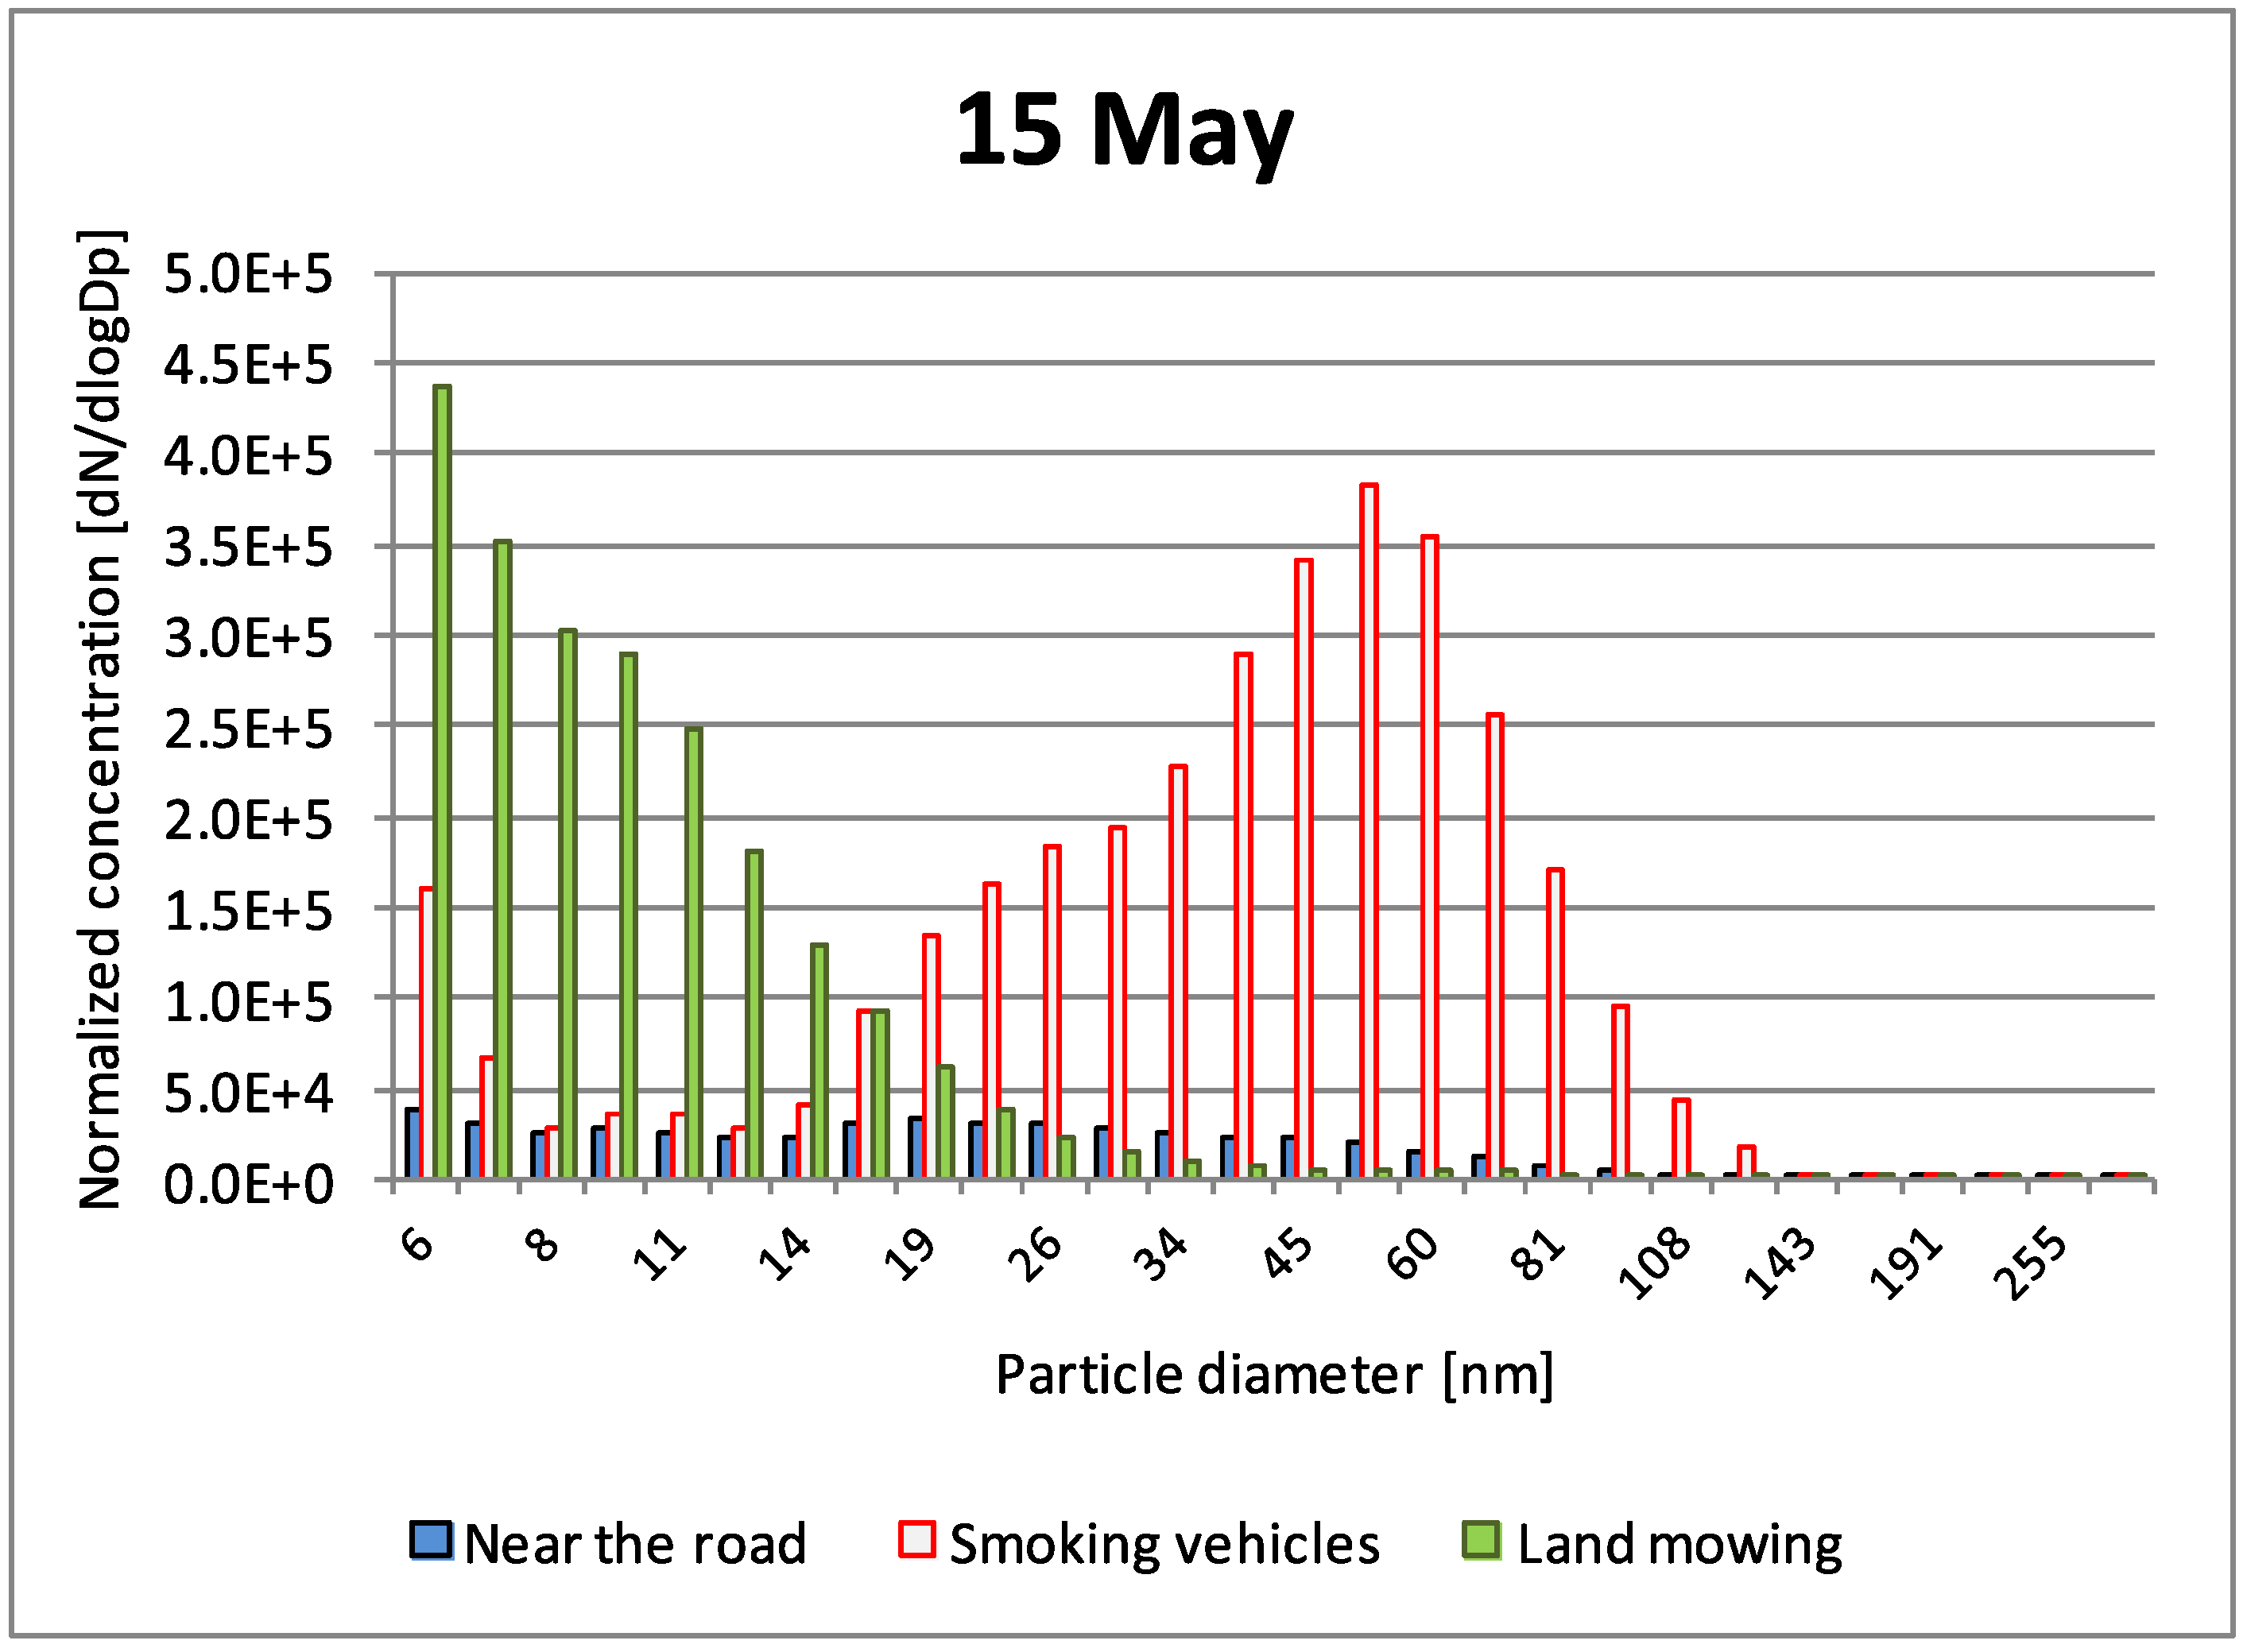
Number distributions revealed difference between two sources of excess emissions: smoking vehicles and a lawn mower (
Figure 13). Smoking vehicles (automobiles, buses and trucks typically in unsatisfactory technical condition) emitted particles with larger diameter, which is consistent with the visual observation of smoke. The lawn mower was responsible for similar amount of particles by count, but those particles were much smaller than the wavelength of the visible light and therefore practically invisible.
Figure 12.
Measured average UFP concentrations and meteorological conditions on15 May in Libeznice; UFP number concentrations closed to a main road were higher than concentrations measured further from the main road. Attention should be paid to concentrations measured near riding lawn mower (green dots), which are comparable with concentrations measured within passing smoking vehicle (red rings). Operating lawn mower created temporary local UFP hotspot. Lawnmowers are powered by gasoline engines with no electronic controls and no exhaust after-treatment, which are, up to 19 kW power, not subject to any limit on particle emissions. Particles with diameter <10 nm were excluded because of periodically recurring artifact affecting the smallest two channels, resembling a nucleation event, which was considered improbable; Map sources: Mapy.cz, Seznam.cz a.s.
Figure 13.
Particle number distribution measured in Libeznice on 15 May according to source of particles (road traffic excluding high emitters, smoking vehicles, lawn mower). Smoking vehicles emitted particles with larger diameter, which is consistent with the visual observation of smoke. The lawn mower is responsible for similar amount of particles by count, but those particles are much smaller than the wavelength of the visible light and therefore practically invisible. Particles with diameter <10 nm were excluded because of periodically recurring measurement artifacts affecting the smallest two channels.
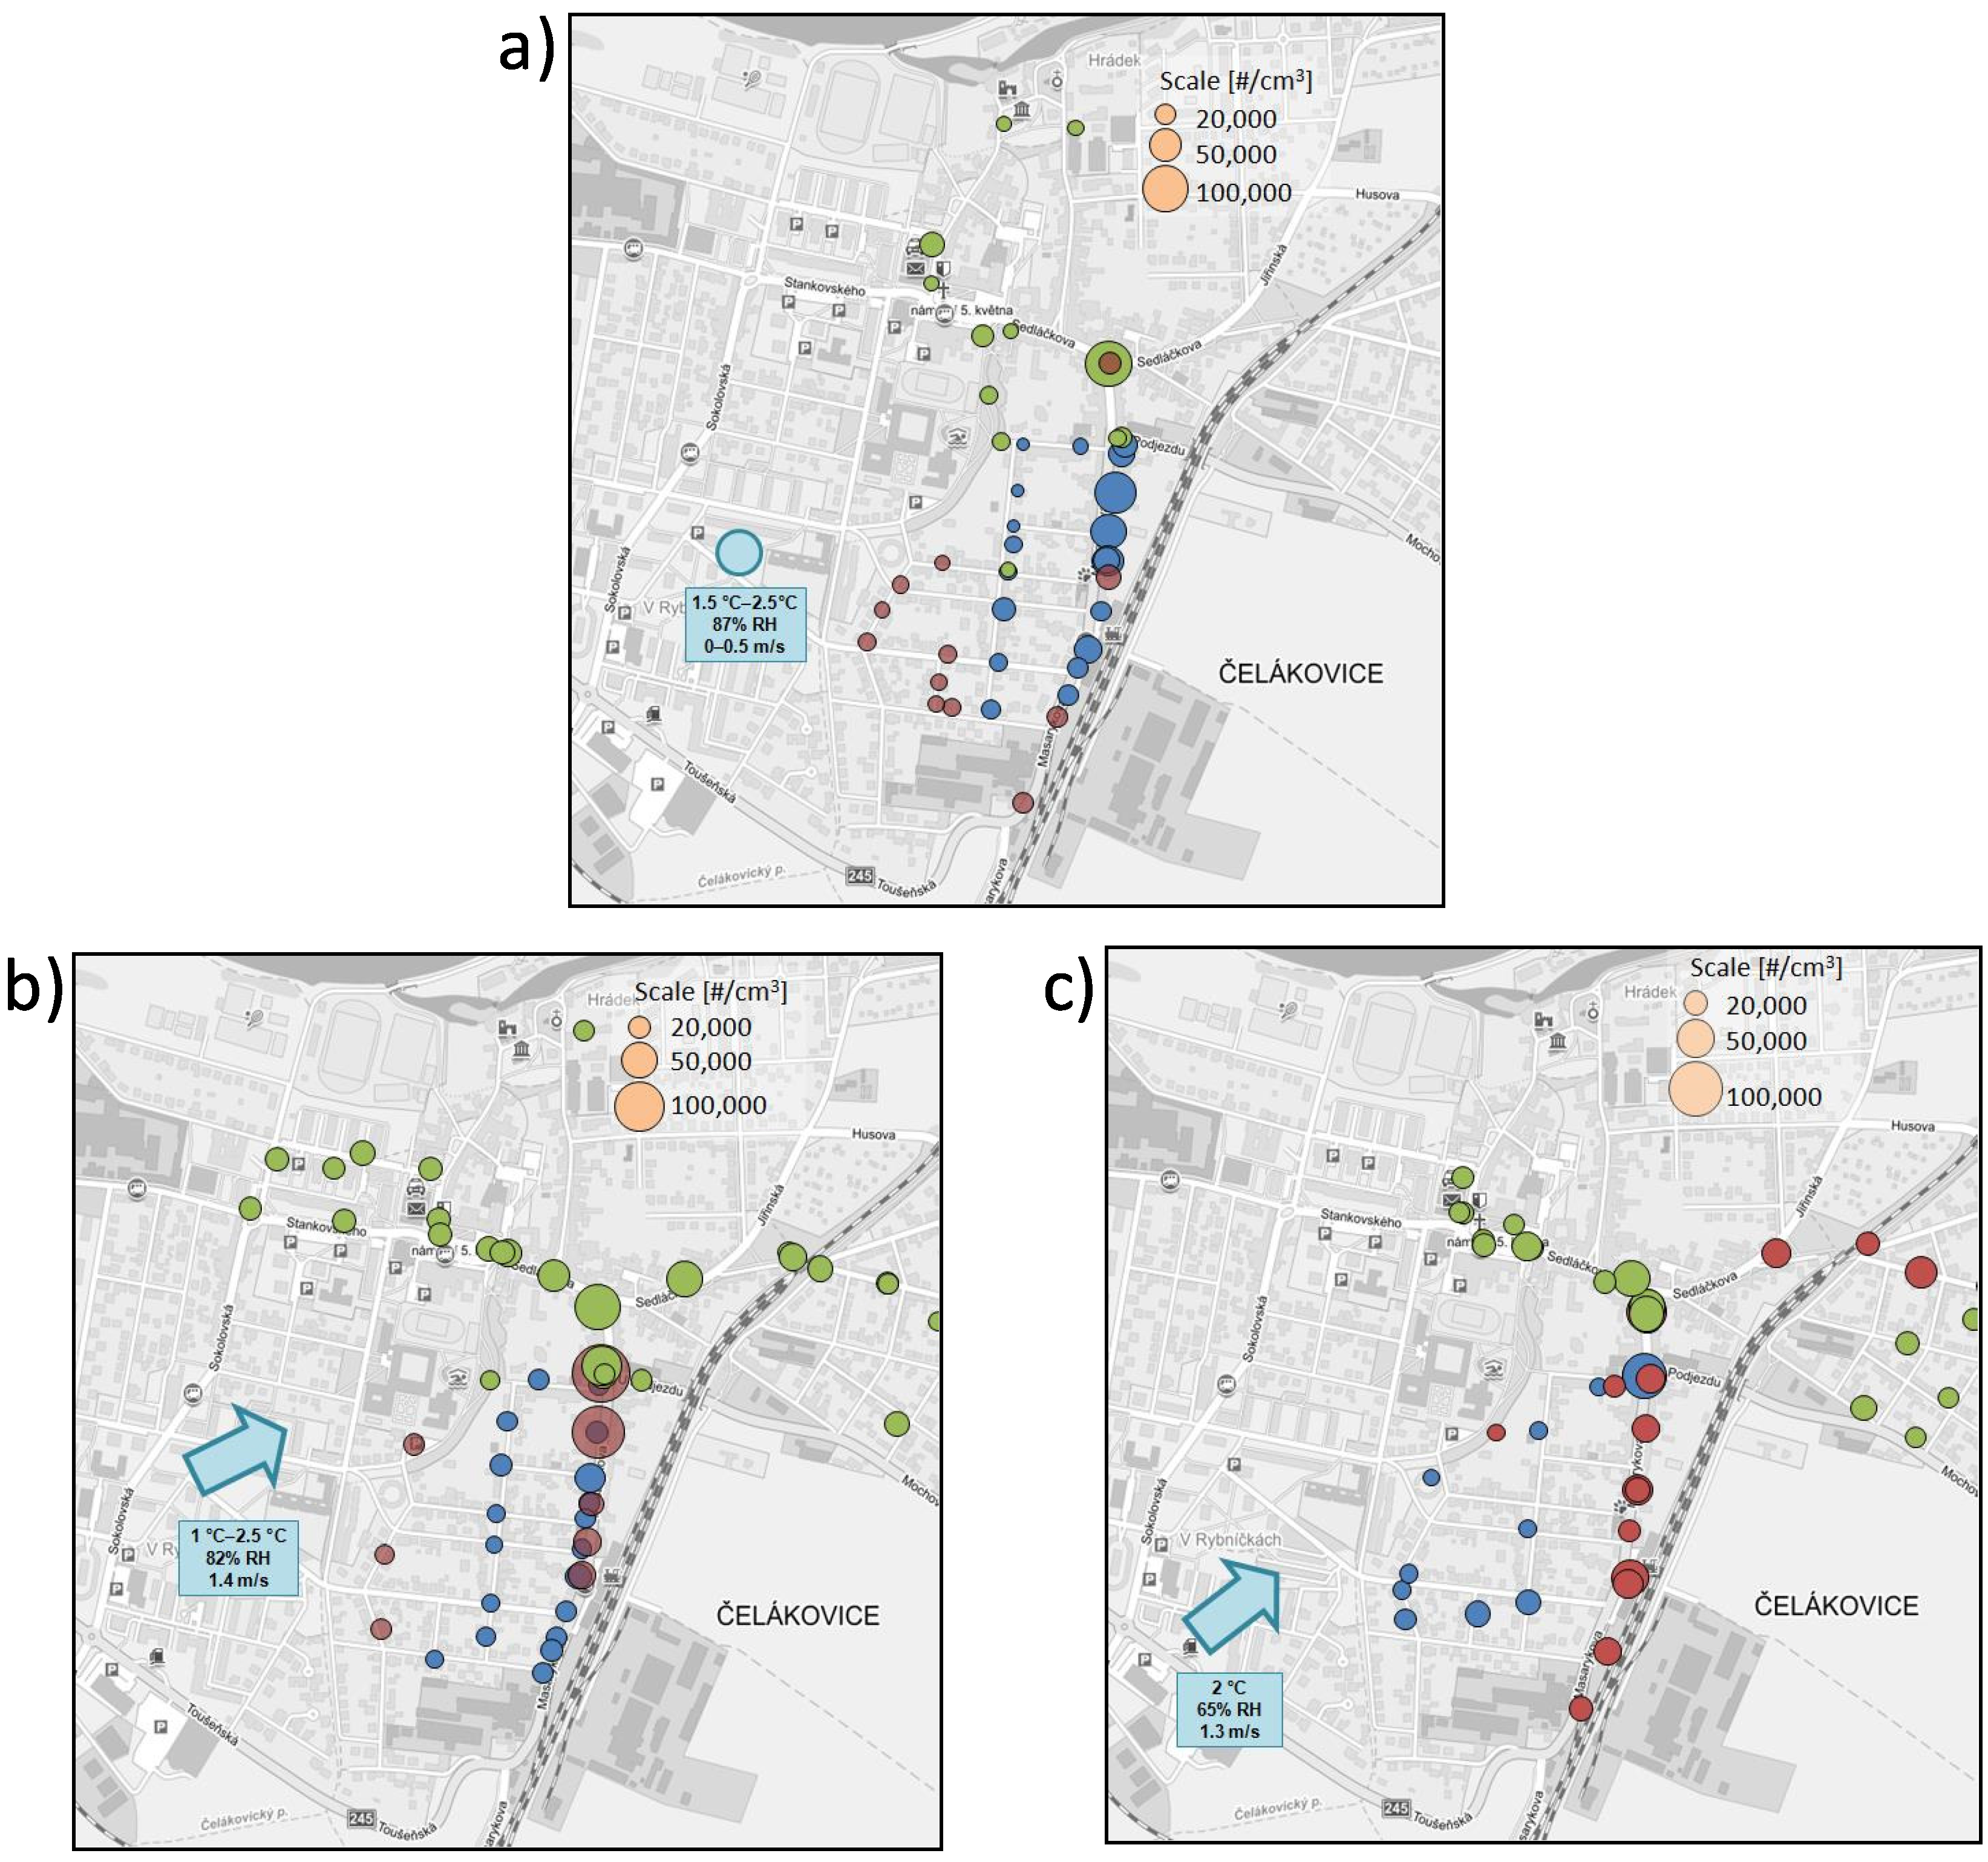
3.6. Celakovice
Measurement in Celakovice city was carried out with two mobile apparatuses measuring in parallel; the first apparatus equipped with EEPS and CPC measured concentrations next to the main road, the second measured further form the road (ca. 100–150 m). Measurements were performed on two days, 30 January (morning and afternoon measurement) and 3 February (all day measurement). Data presented herein comprise all measured particles (5–500 nm) due to inconsistence results obtained from CPC and EEPS. On 3 February, particle number concentrations from the EEPS were consistently lower by about 6500 #/cm3 compared to the CPC during campaign on 3 February, an offset attributed to an erroneous zeroing of the EEPS. As CPC can be considered the ultimate source of total particle number concentrations, total counts calculated from EEPS size distributions were corrected for the zero drift to match the CPC. The UF-CPC measures particles with diameter between 4 nm–10 µm, while the EEPS range is 5–500 nm; difference in instrument ranges on the upper end was considered to be insignificant because vast majority of the urban particles, from particle number concentration point of view, fell within the EEPS range. However, we were not able to reconstructed particle number distribution due to the shifted zero offset on 3 February, therefore distribution is presented only for 30 January measurement.
During traffic peaks concentrations next to the road varied around 2 × 10
4 #/cm
3 with typical peaks after passing older vehicles around 4 × 10
4 #/cm
3; together average particle number concentrations for morning traffic peaks were 3.6 × 10
4 #/cm
3 (median 3.0 × 10
4 #/cm
3) on 30 January and 3.2 × 10
4 #/cm
3 (median 2.0 × 10
4 #/cm
3) on 3 February. Maximal measured concentration, more than 5 × 10
5 #/cm
3, occurred after the passages of high emitters (a tractor and several automobiles) The influence of the main road was not noticeable at 150 m from the road, where the concentrations were mainly around 1.5 × 10
4 #/cm
3 or lower (
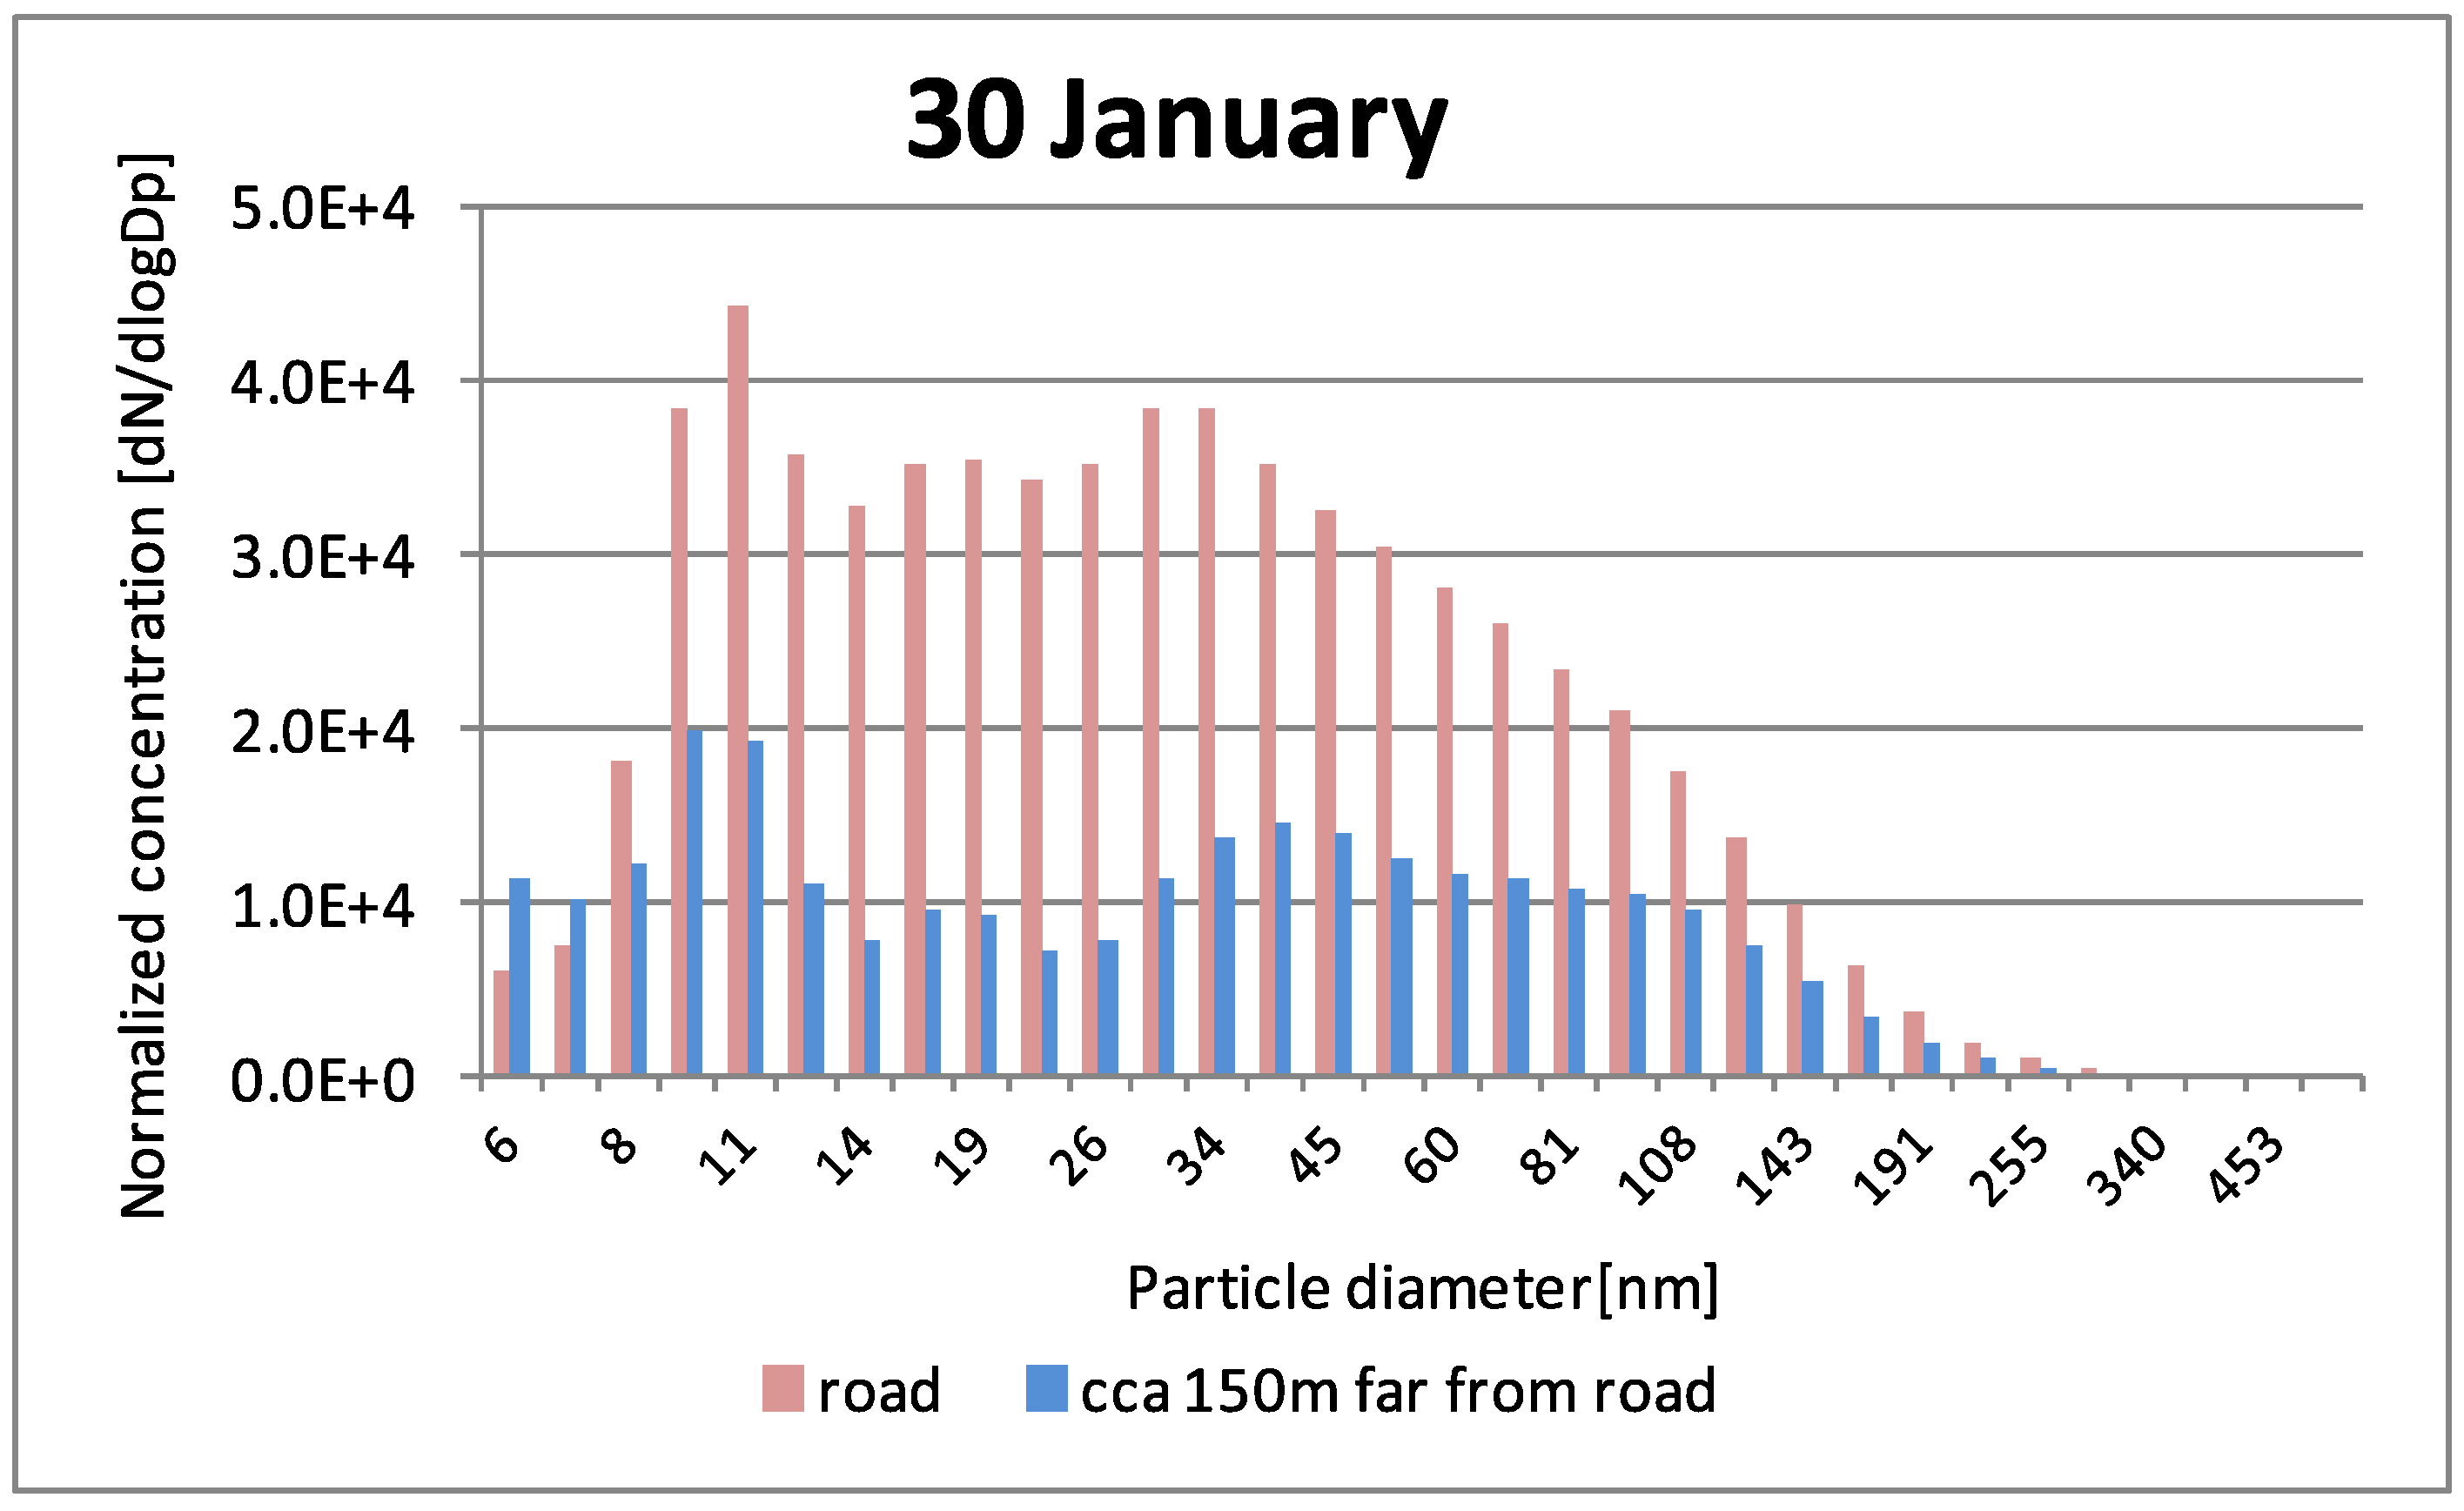
Figure 14). Particle number distributions measured next to the road on 30 January and 150 m away from the road are shown in (
Figure 15) and are similar for both places. It suggests that traffic, even in small city with low traffic load, is a key contributor to the ambient UFP concentrations.
Figure 14.
Simultaneous particles number concentration measurements with two mobile apparatuses. Dot colors indicate time intervals. The first apparatus measured closed to a main road while the second measured parallel away from the main road. Concentrations along main roads were elevated in comparison with places further from the road. (a) Particle number concentrations 30 January; simultaneous measurement at 7:30–8:00 a.m. blue points, 8:00–8:20 a.m. red points, and 8:20–9:00 a.m. green points.(b) Particle number concentrations on 3 February; simultaneous measurement at 6:45–7:20 a.m. blue points, 7:20–7:35 a.m. red points, and 7:35–9:00 a.m. green points.(c) Particle number concentrations on 3 February; simultaneous measurement at 5:10–5:15 p.m. blue points, 5:15–5:50 p.m. red points, 5:50–6:30 p.m. green points; Map sources: Mapy.cz, Seznam.cz a.s.
Afternoon traffic peak was measured on 3 February, while one apparatus stayed on an intersection and the second operated away from the main road. The intersection represents a hotspot of the Celakovice city, it is the part of the main road and many cars have to slow down or stop and then accelerate to common city speed. Average particle number concentration was 6.1 × 10⁴ #/cm3 (median 5.7 × 10⁴ #/cm3) next to the intersection. The apparatus measured away from the crossroad (ca. 150–250 m) measured average concentration 1.4 × 10⁴ #/cm3 (median 1.2 × 10⁴ #/cm3) during the traffic peak.
Figure 15.
Particle number distributions during simultaneous measurement by two instruments sets, one near the main road, the second
ca. 150 m away from the road on 30 January, 7:30–8:00 a.m., corresponding to blue dots in
Figure 14a. Concentrations measured away from a main road in Celakovice had similar distribution as particles measured next to the main road.
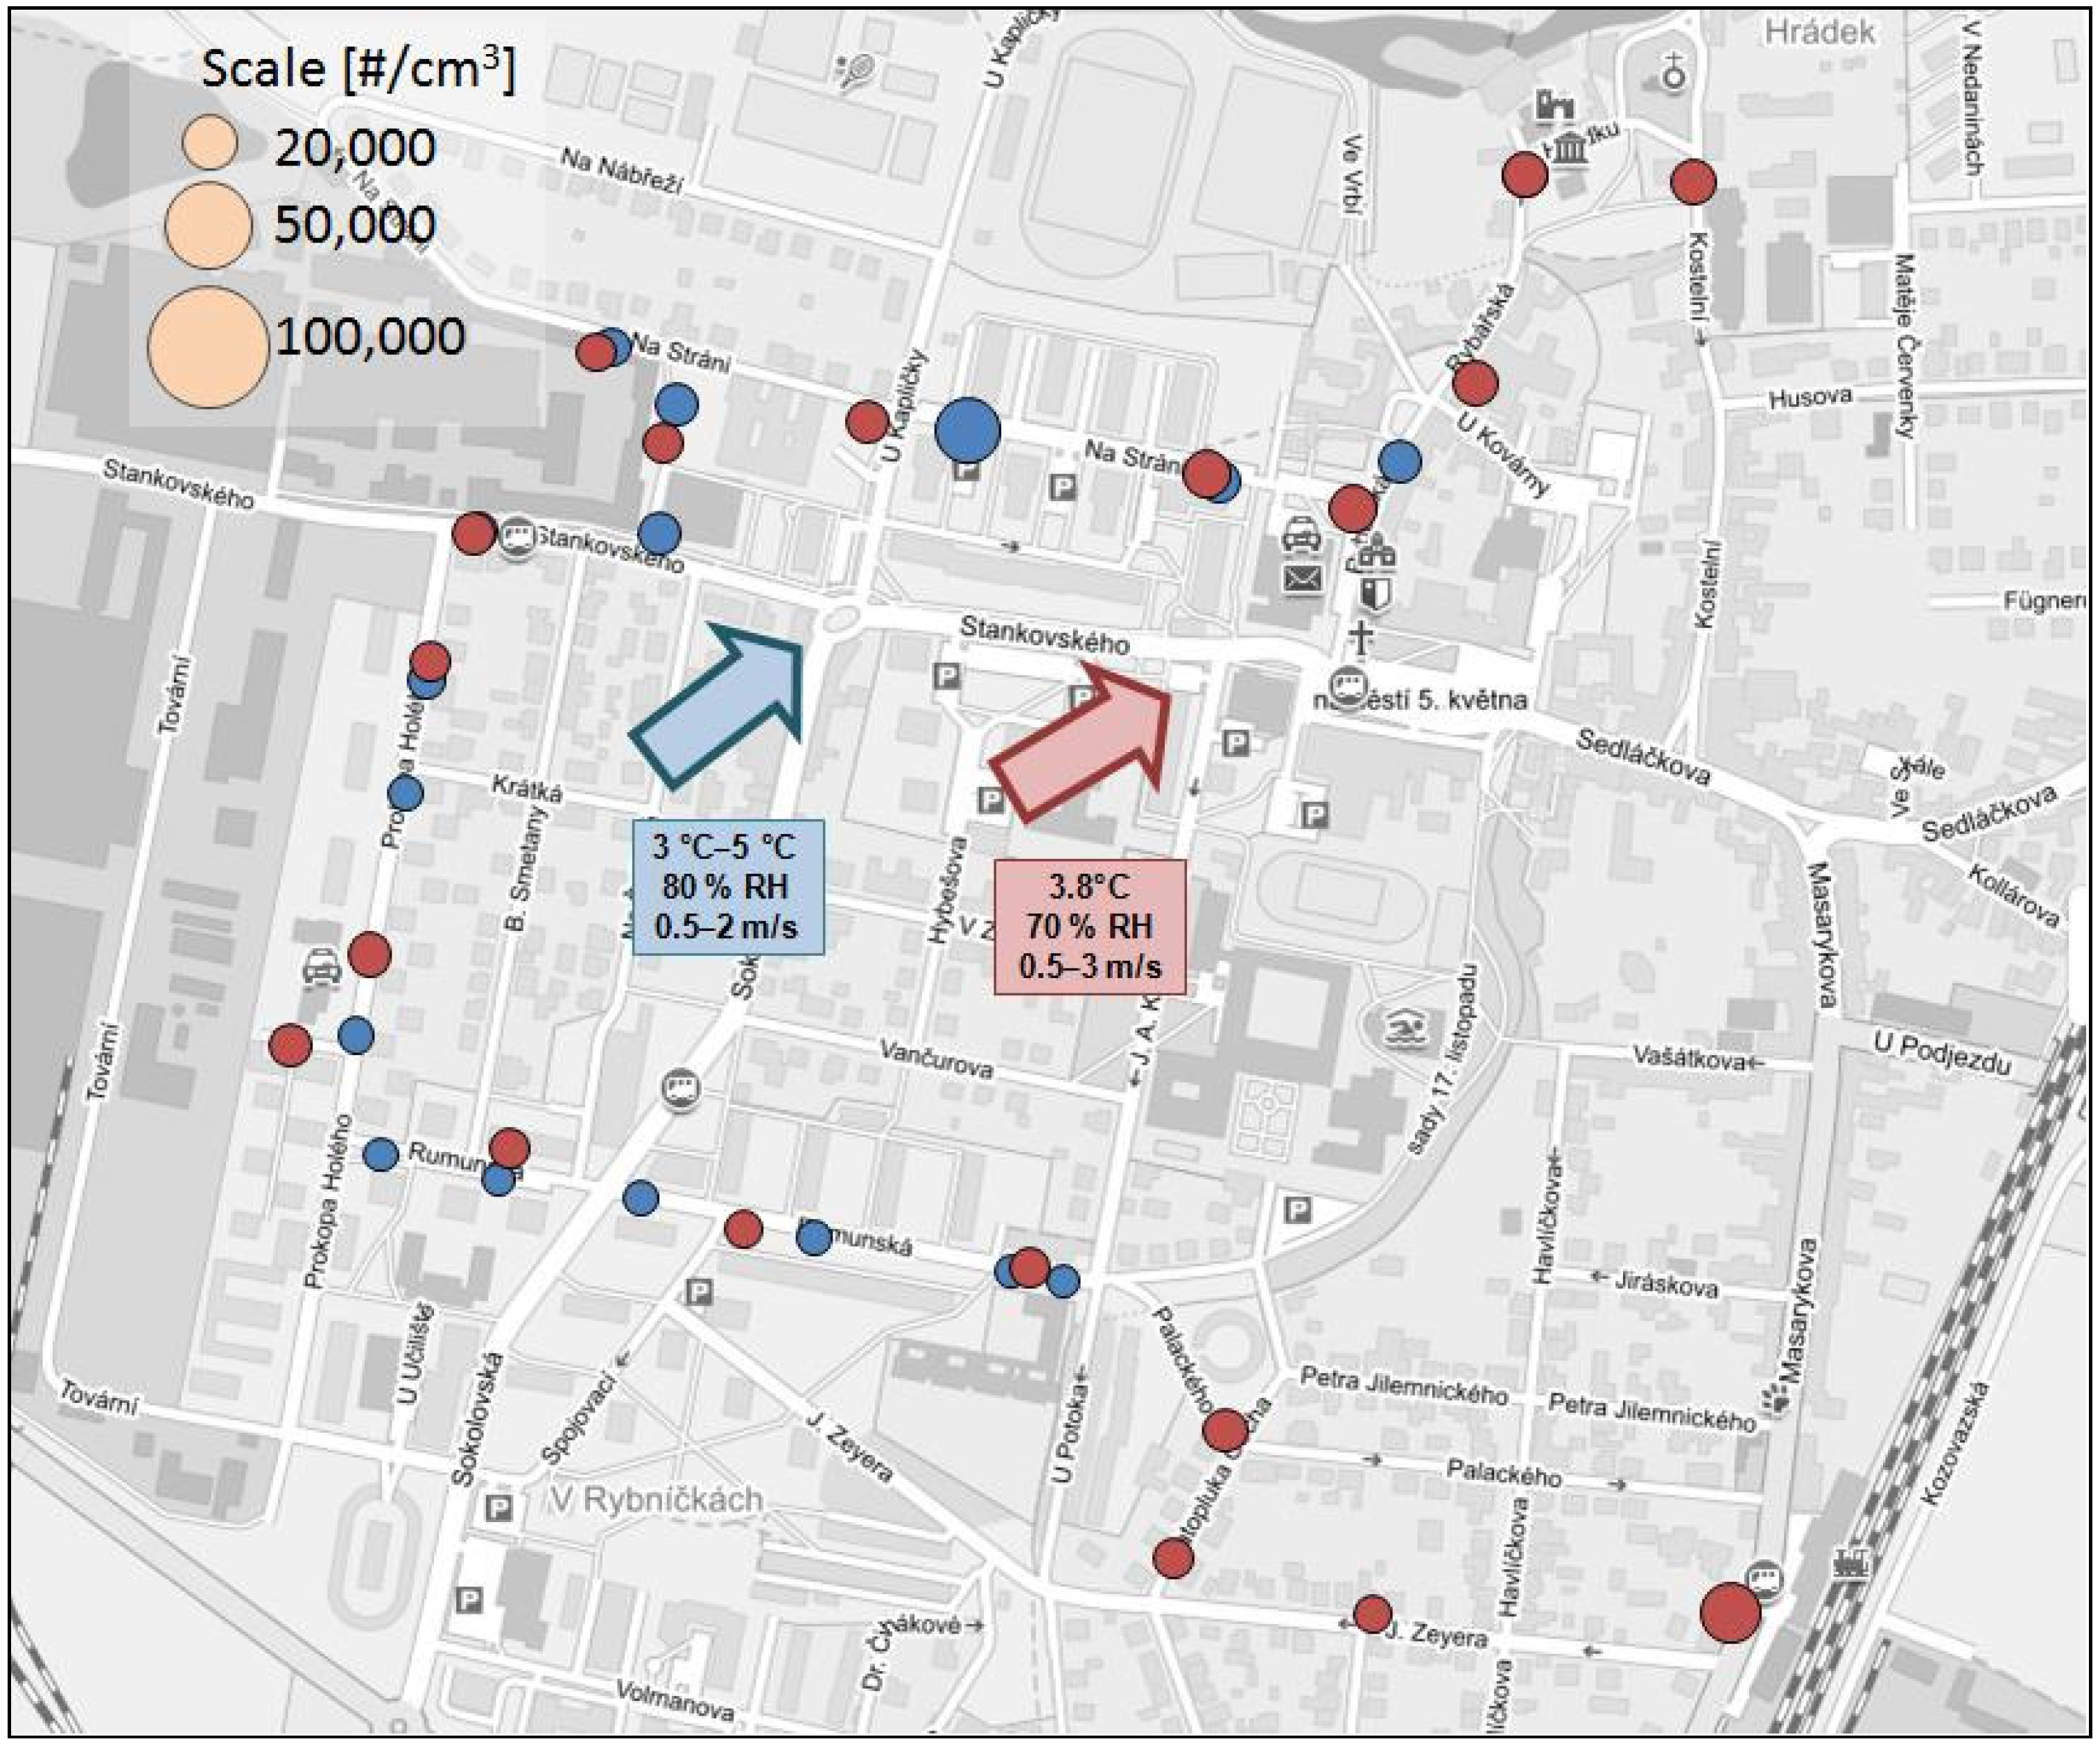
Concentrations after morning traffic peaks were stable around 1.5 × 10
4 #/cm
3 up to 10:00 a.m., then gradually decreased to concentrations 1.0 × 10
4 #/cm
3 (3 February) and 7.0 × 10
3 #/cm
3(30 January) at midday. Lower concentrations on 30 January were not likely to have been caused by better dispersion conditions because wind speed were around 0.5–2 m/s, while on 3 February the wind speed varied between 0.5–3 m/s (
Figure 16).We expected lower concentrations in comparison with other studies, so there should be other sources of ultrafine particles, but no such sources were identified during the measurements. A heavily traveled freeway to Prague is 3 km from the measurement site. UFP generated by vehicles going on the highway should have already coagulated into large particles before they reached Celakovice; however, at this time, the measurement was downwind from the freeway.
After the afternoon traffic peak, 3 February 6:00–6:30 p.m., concentrations were stabilized around 2.0 × 10⁴ #/cm3 with some exceeding values, while the source was always vehicle e.g., idling diesel vehicle in front of a house or a high emitting vehicle passage. Together, average particle number concentration was 2.2 × 10⁴ #/cm3 (median 1.8 × 10⁴ #/cm3).
Figure 16.
Particle number concentrations measured after traffic peaks on 30 January—blue, and 3 February—red; Vehicles on the main road going through the city were not proved as the main source due to very low traffic load after morning peak. Other source of UFP emissions is a motorway, about 3 km and upwind from the measurement site. Map sources: Mapy.cz, Seznam.cz a.s.


