Article

The Effect of Cover Crops on Soil Water Balance in Rain-Fed Conditions

1
Faculty of Agriculture, University of Novi Sad, Novi Sad 21000, Serbia
2
Department of Agricultural, Food and Environmental Sciences, Università Politecnica delle Marche, 60131 Ancona, Italy
3
Chemical Agrosava, 11070 Novi Beograd, Serbia
*
Author to whom correspondence should be addressed.
Submission received: 7 September 2018 / Revised: 16 November 2018 / Accepted: 19 November 2018 / Published: 11 December 2018

Abstract

:
Soil and water conservation benefits of cover crops have been hypothesized as a way to mitigate and adapt to changing climatic conditions, but they can also have detrimental effects if rainfall is limited. Our objective was to quantify effects of winter cover crops on soil water storage and yield of silage maize under the agro-ecological conditions within Vojvodina Province in Serbia. The experiment was conducted under rain-fed conditions at three locations and included a control (bare fallow) plus three cover crop and two N rate treatments. The cover crop treatments were common vetch (Vicia sativa L.), triticale (x Triticosecale Wittm. ex A. Camus) and a mixture of the two species. All were managed as green manure and subsequently fertilized with either 120 or 160 kg N ha−1 before planting silage maize (Zea mays L.). Cover crop effects on soil water storage were calculated for two periods, March–May and May–September/October. A Standardized Precipitation Index (SPI) used to characterize drought severity for 2011/2012 and 2012/2013, showed values of 3 and 9, respectively, for the two periods. Soil water storage was reduced by all cover crop treatments, with the greatest deficiency occurring during the extremely dry year of 2012. Previous studies have shown cover crop growth reduced by soil water depletion during their growing season and negative effects on early-season growth and development of subsequent cash crops such as silage maize, but if rainfall is extremely low it can also reduce cash crop yield. This detrimental effect of cover crops on soil water balance was confirmed by correlations between soil water storage and maize silage yield.

1. Introduction

The intensification of agriculture has increased food production, primarily based on the use of high-productivity crop varieties and the application of fertilisers, pesticides and irrigation [1]. However, this practice of the continuous cultivation of the same soil and the application of different inputs has serious consequences for the physical, chemical and biological properties of soil [2,3].
Intensive conventional agriculture has also been used, to a greater or lesser extent, on the fertile soil in Vojvodina Province, Serbia, and over the years has decreased organic matter content and changed soil structure [4]. The studies of Belić et al. [5] and Seremesic et al. [6] confirm a decline in the soil organic matter in this region. This decline became a serious concern considering that further agricultural demands and food production under the more obvious climate changes in the 21st century will require maintaining or improving soil fertility and productivity [7]. The projections for climate change indicate increased precipitation variability rather than increased amount of annual precipitation [8], which is more likely to be mitigated on fertile and well-structured soils. The level of soil organic matter, and therefore soil carbon content, positively influence the stability of soil aggregates and soil moisture retention under extreme precipitation or drought [9,10,11]. Several management practices can be the bond between the requirements to adapt to the weather changes and to stop the reduction or to increase soil fertility, such as by reducing or eliminating tillage, growing cover crops, and applying organic fertilisers.
Because livestock production in Serbia and, therefore, the availability of organic fertilisers are low, research focuses on cover cropping. Additionally, reduced or no tillage is uncommon because of requirements for adequate machines, which significantly limit its application on small and medium farms. Cover crops have several uses, including preventing erosion, increasing organic matter content, improving nitrogen balance and soil properties, and suppressing weeds, among others [12,13]. Cover crops in crop rotations are not a common practice primarily because growing cover crops usually includes crops that do not result in economic return and often do not allow sufficient time for soil preparation for cash crops. Additionally, cover crops may reduce soil moisture for the subsequent crop in specific growing conditions. In the most prevalent annual crop rotation system of maize (Zea mays L.) and soybean (Glycine max (L.) Merr.), growing winter cover crops should be considered, because cover crops positively affect physical and chemical soil properties and therefore improve soil productivity and soil water storage capacity [14,15]. According to Kaspar and Singer [16], cover crops increase soil organic matter from 9 to 85% depending on biomass production and soil and climate conditions of the region. In temperate regions of Europe, winter cover crops are the most common [17], which cover the land between two cash crops that otherwise would be left bare over winter and exposed to diverse weather impacts such as wind erosion and nitrogen leaching, among other effects.
All benefits that result from cover crops in a cropping system depend on the cover crop species or mixture, type of soil and climate [18]. Legume cover crops are usually included because of their short growing season, and they provide biologically fixed nitrogen (N) for the subsequent cash crop [19,20]. When legume cover crops are used as green manure and ploughed-in, the organic matter is also incorporated, significantly increasing the input of N [13,21]. The non-legume winter cover crops of winter cereals and brassicas are also used in temperate regions. Winter cereals, such as oats (Avena sativa L.), barley (Hordeum vulgare L.), triticale (x Triticosecale Wittmack) and rye (Secale cereale L.), are grown for forage or as a green manure. Moreover, the cereals prevent erosion and suppress weeds. When increasing the content of soil organic matter is a necessity, use of cereals should be a priority because of the relatively high carbon and N ratio and slow decomposition of the residues [22]. Additionally, the extensive and dense root system of cereals stabilises soil aggregates and increases aeration and efficiently scavenges nutrients and prevents their leaching into deep soil layers [23]. Qi et al. [24] concluded that a winter rye cover crop increases soil water storage in the maize-soybean rotation. For the environmental conditions of Vojvodina, Cupina et al. [25] suggested using a mixture of legumes and cereals to reduce the problems of nitrogen deficit and low soil organic matter. Such a mixture is drought resistant [26] because of the high water use efficiency [27], which also results in less eutrophication of water courses [28].
Considering that the effects of cover crops depend on the weather conditions of a region, the aim of the research was to analyse the effect of winter cover crops on the soil water balance in the agro-ecological conditions of Vojvodina Province. Additionally, the effect of cover crops on water availability for the main crop was compared with that of bare soil as a usual practice of the maize-based cropping system.

2. Experiments

2.1. Site Descriptions and Weather Characteristics

The field experiments were conducted between 2011 and 2013 at three locations in Vojvodina Province in the northern part of Serbia: Novi Sad-Rimski Šančevi (45°19′N, 19°50′E, 80 m a.s.l.), Sombor (45°44′N, 19°08′E, 84 m a.s.l.), Senta (45°54′N, 20°05′E, 77 m a.s.l.).
Most of this region is a flat area located in the southern part of the Pannonian lowland. The climate is characterised as moderate continental with extreme seasonal variation in temperature and precipitation towards a continental climate. Based on long-term data (1981–2015), the mean annual temperature is 11.3 °C, annual precipitation sum is 610.3 mm, the mean temperature for the growing period (April–September) is 18.2 °C and the precipitation sum for the growing period (April–September) is 359.6 mm.
The mean monthly temperature and monthly precipitation data for the given period at the three locations are presented in Table 1.
The data were collected from on-site weather stations. The period October-December 2011 had a significantly lower amount of precipitation than the long-term average (Figure 1). From January to May 2012, the drought period continued, and in May 2012, precipitation was approximately the same as or slightly higher than the average. During the summer months, the extreme drought occurred again at all locations. The hydrological year 2011/2012 was characterised by a mild winter and extremely warm summer, with temperatures in July that were higher than the long-term average by 2.7–3.3 °C depending on the site and in August by 2.4–3.0 °C. In 2012/2013, weather conditions were more favourable for plant production. From October to March 2012/2013, monthly precipitation was above the long-term average. During summer months, temperatures were slightly above the average, followed by an adequate precipitation amount.
Experiments at all locations were setup on a slightly carbonated chernozem. Soil characteristics are presented in Table 1.

2.2. Experimental Design

A rain-fed experiment with 25 m2 (5 m × 5 m) plots was established using a random block design with three replicates, a bare fallow control, three cover crop treatments (common vetch (Vicia sativa L.), triticale, or a mixture of the two), and two N fertilizer rates for a subsequent cash crop—silage maize. The control was plowed in autumn and remained bare until spring. The cover crops were planted during the first half of October in 2011 and 2012 at seeding rates of 120 kg ha−1, 220 kg ha−1, and 90 + 30 kg ha−1 for the common vetch, triticale, and mixture of common vetch and triticale [13]. Mineral fertilizer (N1—120 or N2—160 kg N ha−1) was applied prior to plowing the cover crops during May 2012 and 2013. Silage maize was sown in 22 cm rows at a seeding rate of 65,000 plants ha−1. All operations used during the project are presented in Table 2.

2.3. Measurements and Data Analyses

To analyse the effect of cover crops on soil water storage, soil samples were collected from all sites three times in each trial year:
I.
at the beginning of the cover crop growing season, after the winter period (March),
II.
after ploughing-in of cover crops (end of May),
III.
after harvest of silage maize (September/October).
The soil was sampled in four soil layers: 0–30, 30–60, 60–90 and 90–120 cm. The soil moisture content was determined by thermo-gravimetric technique in which soil samples were dried to a constant weight at 105 °C for 24 h [29]. This parameter was used for calculating soil water storage ( θ ) in each depth by following formula [30]:
θ i = W   ×   10   ×   d   ×   ρ
where θ i is the soil water storage for a given depth of soil (mm), W is the soil moisture content for a given soil depth (%), d is the soil depth (cm) and ρ is the dry bulk density of the soil for the calculated soil depth (g cm−3). The values of the dry bulk density of the soil for each layer and location are given in Table 3.
The water storage of the soil profile (P) was calculated by summing water storage values of each depth from 0 to 120 cm:
P = 0 120 θ i
To specify received and lost water in the periods March-May and May-September/October, the changes in soil water storage ( ) were analysed for these two periods, that is, before the main crop and during the growing season of the main crop, respectively. In each period, the changes in soil water storage were calculated using the following formula:
  = W B W E + P B + E
where W B is the soil water storage at the beginning of the examined period, W E is the soil water storage at the end of the examined period and P B + E is the sum of precipitation in the period.
The differences in the changes in soil water storage between cover crop treatments and fallow treatments were calculated. The calculation was performed by subtracting the average changes in soil water storage from all cover crop treatments (CC) and the average changes in soil water storage from all fallow (F) treatments (N1, N2, and Control). The analysis was performed for both periods, that is, March–May and May–September/October.
Considering that weather conditions in Serbia are characterised by extreme variations in temperature and precipitation, the Standardised Precipitation Index (SPI) was used for drought identification and severity. This index depends only on precipitation and permits monitoring of water sources and groundwater supplies significant in rain-fed agricultural production [31]. The SPI was calculated for 1, 3 and 9 months for each month in the hydrological years 2011/2012 and 2012/ 2013 for Vojvodina Province using a sum of monthly data for a 30-year annual sequence [32]. The drought classification was based on the SPI classification modified by the Republic Hydrometeorological Service of Serbia for the conditions of Serbia and includes ten categories of drought/humidity conditions [33]. The modified categories are presented in Table 4.
Statistical analyses were performed using the STATISTICA 13 software package (TIBCO Software Inc., Palo Alto, CA, USA) [34]. Differences among the treatments for all mean values were tested by ANOVA, and Duncan’s multiple range test was used to compare means at 0.05. In the same software, correlations and regression equations were determined between the changes in soil water storage and silage maize yield (previously published in Cupina et al. [13]).

3. Results

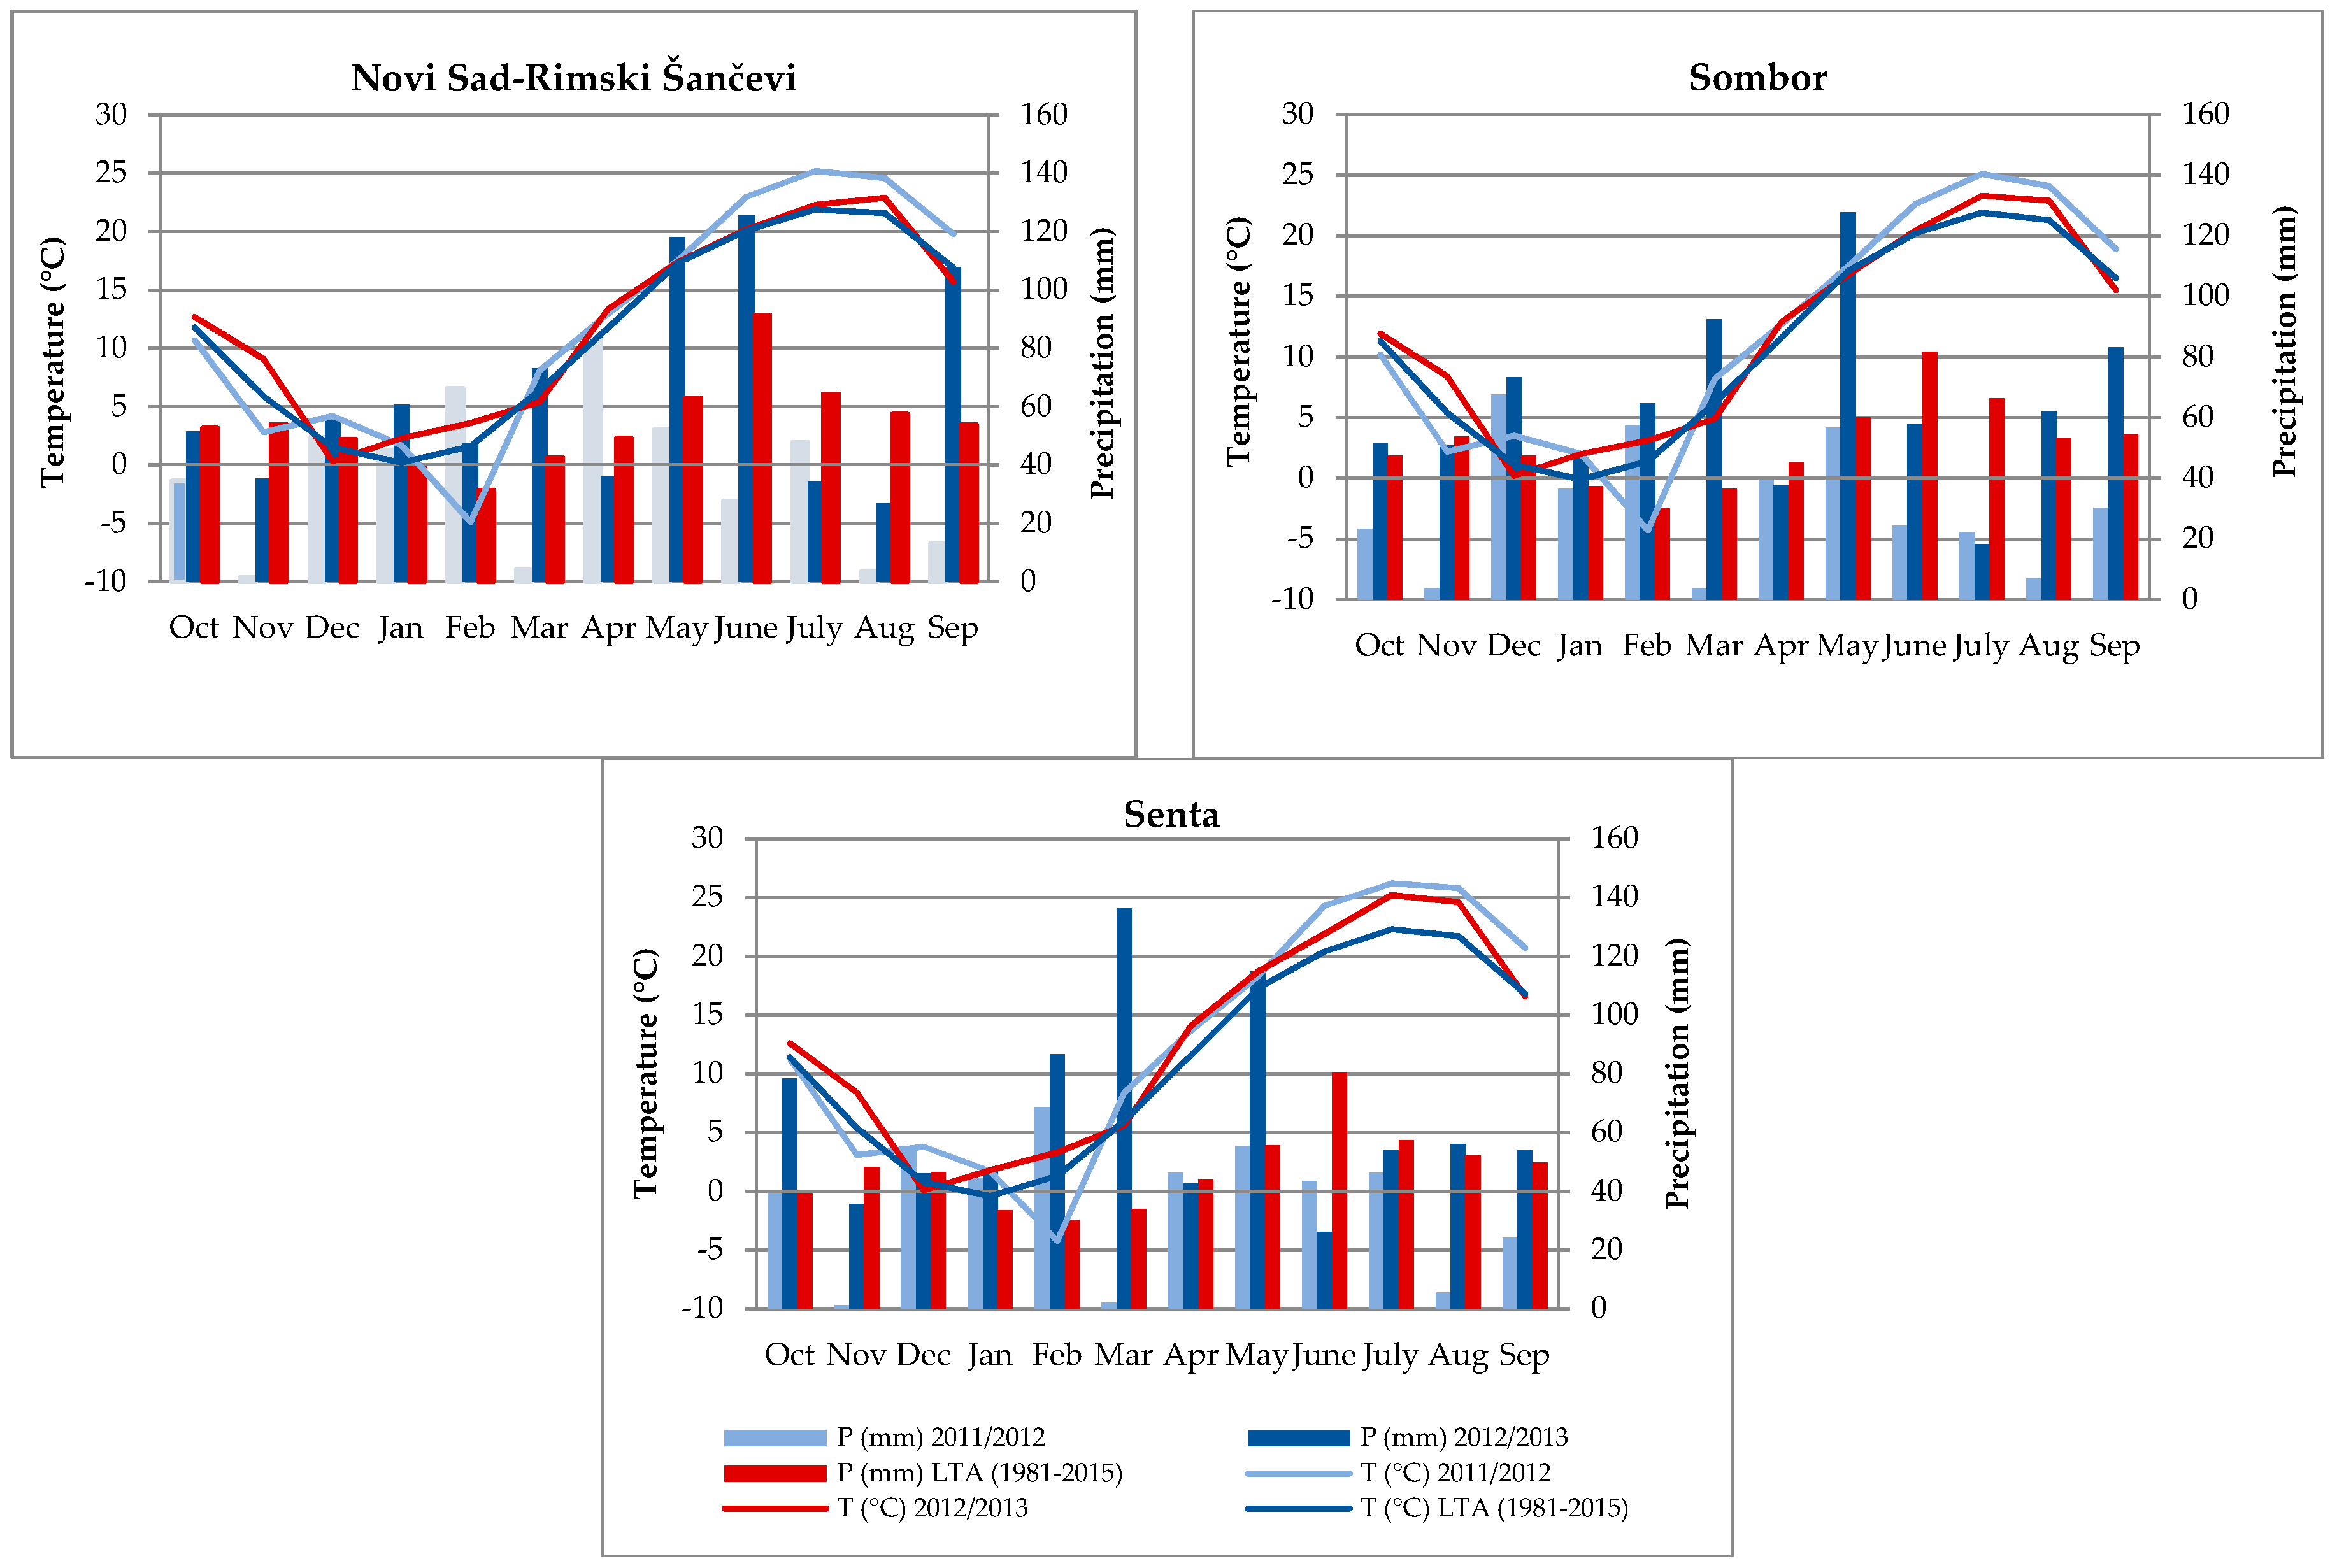
Based on SPI values, the hydrological year 2011/2012 was characterised as a year with severe drought (Table 5). In October, SPI3 was −1.67, and SPI9 was −1.92. The year 2012 was extremely dry, with positive SPI values for SPI1 and SPI3 in February (1.17 and 0.80, respectively) and in April (1.27 and 0.76, respectively). The lowest SPI1 values from January to September 2012 were recorded in March (−2.18), June (−1.95), and August (−1.92), showing extremely dry weather conditions in these months.
The SPI values characterised the hydrological year 2012/2013 with normal to moderate moisture. In October, SPI1 was 0.36 and SPI3-1.49. In the growing season, that is, from the beginning of April to the end of September, negative SPI1 values were recorded in April (−0.29), July (−0.73), and August (−0.49). In this period, the SPI3 was negative in August (−0.20) in which drought intensity was characterised as near normal.
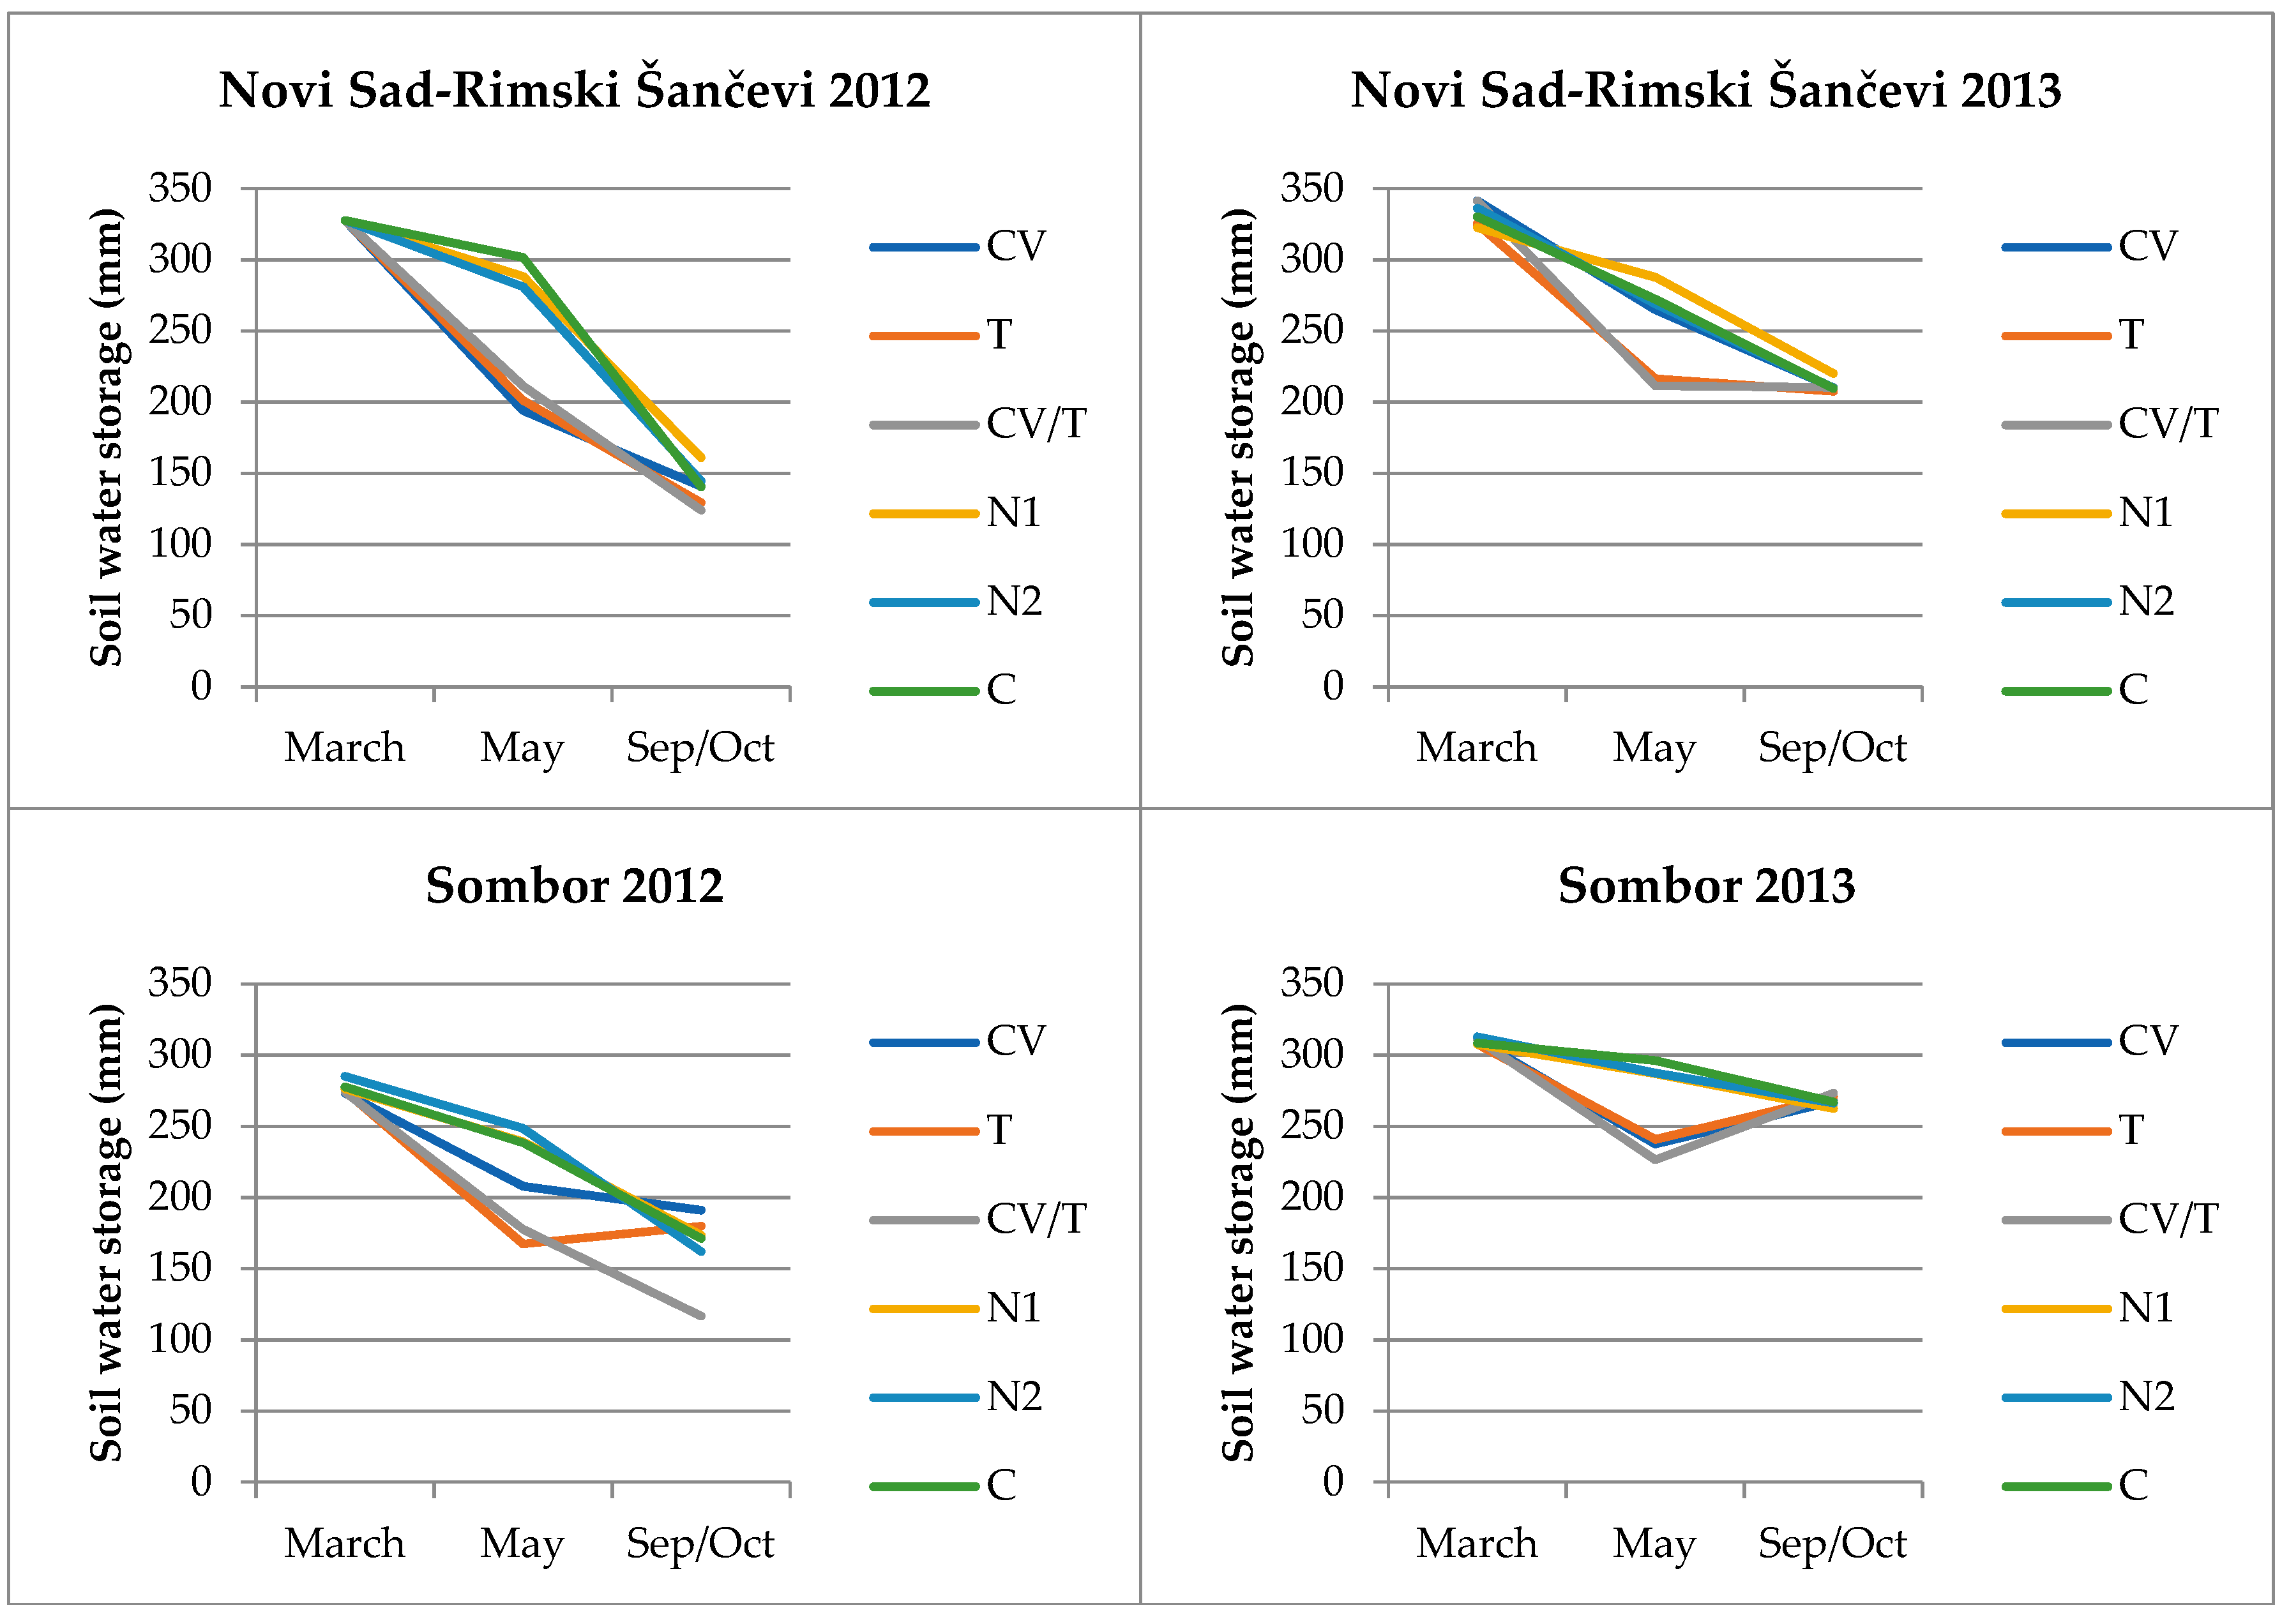
At the locality Novi Sad-Rimski Šančevi, the soil water storage was lower in 2012 than that in 2013 in all soil layers and all terms (Table 6a,b). In the first layer, the highest soil water storage was in March of both years and ranged from 79.2 mm in the treatment with common vetch in 2012 to 90.1 mm in the mixture of common vetch and triticale in 2013. In this period, in the layers 60–90 and 90–120 cm, no significant differences were detected among the treatments. In this layer in September 2012, the lowest value was recorded in the mixture of common vetch and triticale (28.5 mm), followed by the treatment with triticale (29.5 mm). In regard to fallow treatments, in May and September 2013, the highest soil water storage was registered in the first two layers in the N1 variant.
Compared with other locations, the lowest soil water storage in March was registered in Sombor in the 0–30 cm soil layer (Table 7a). In May in this layer, no significant differences were observed in soil water storage between fallow treatments in 2012 and cover crop treatments in 2013. In regard to treatments with cover crops, in both years and layers at the time of silage corn sowing (May), the highest soil water storage was in the treatment with common vetch (Table 7a,b). The lowest value of 26.8 mm was registered in September 2012 in the treatment with the mixture of common vetch and triticale.
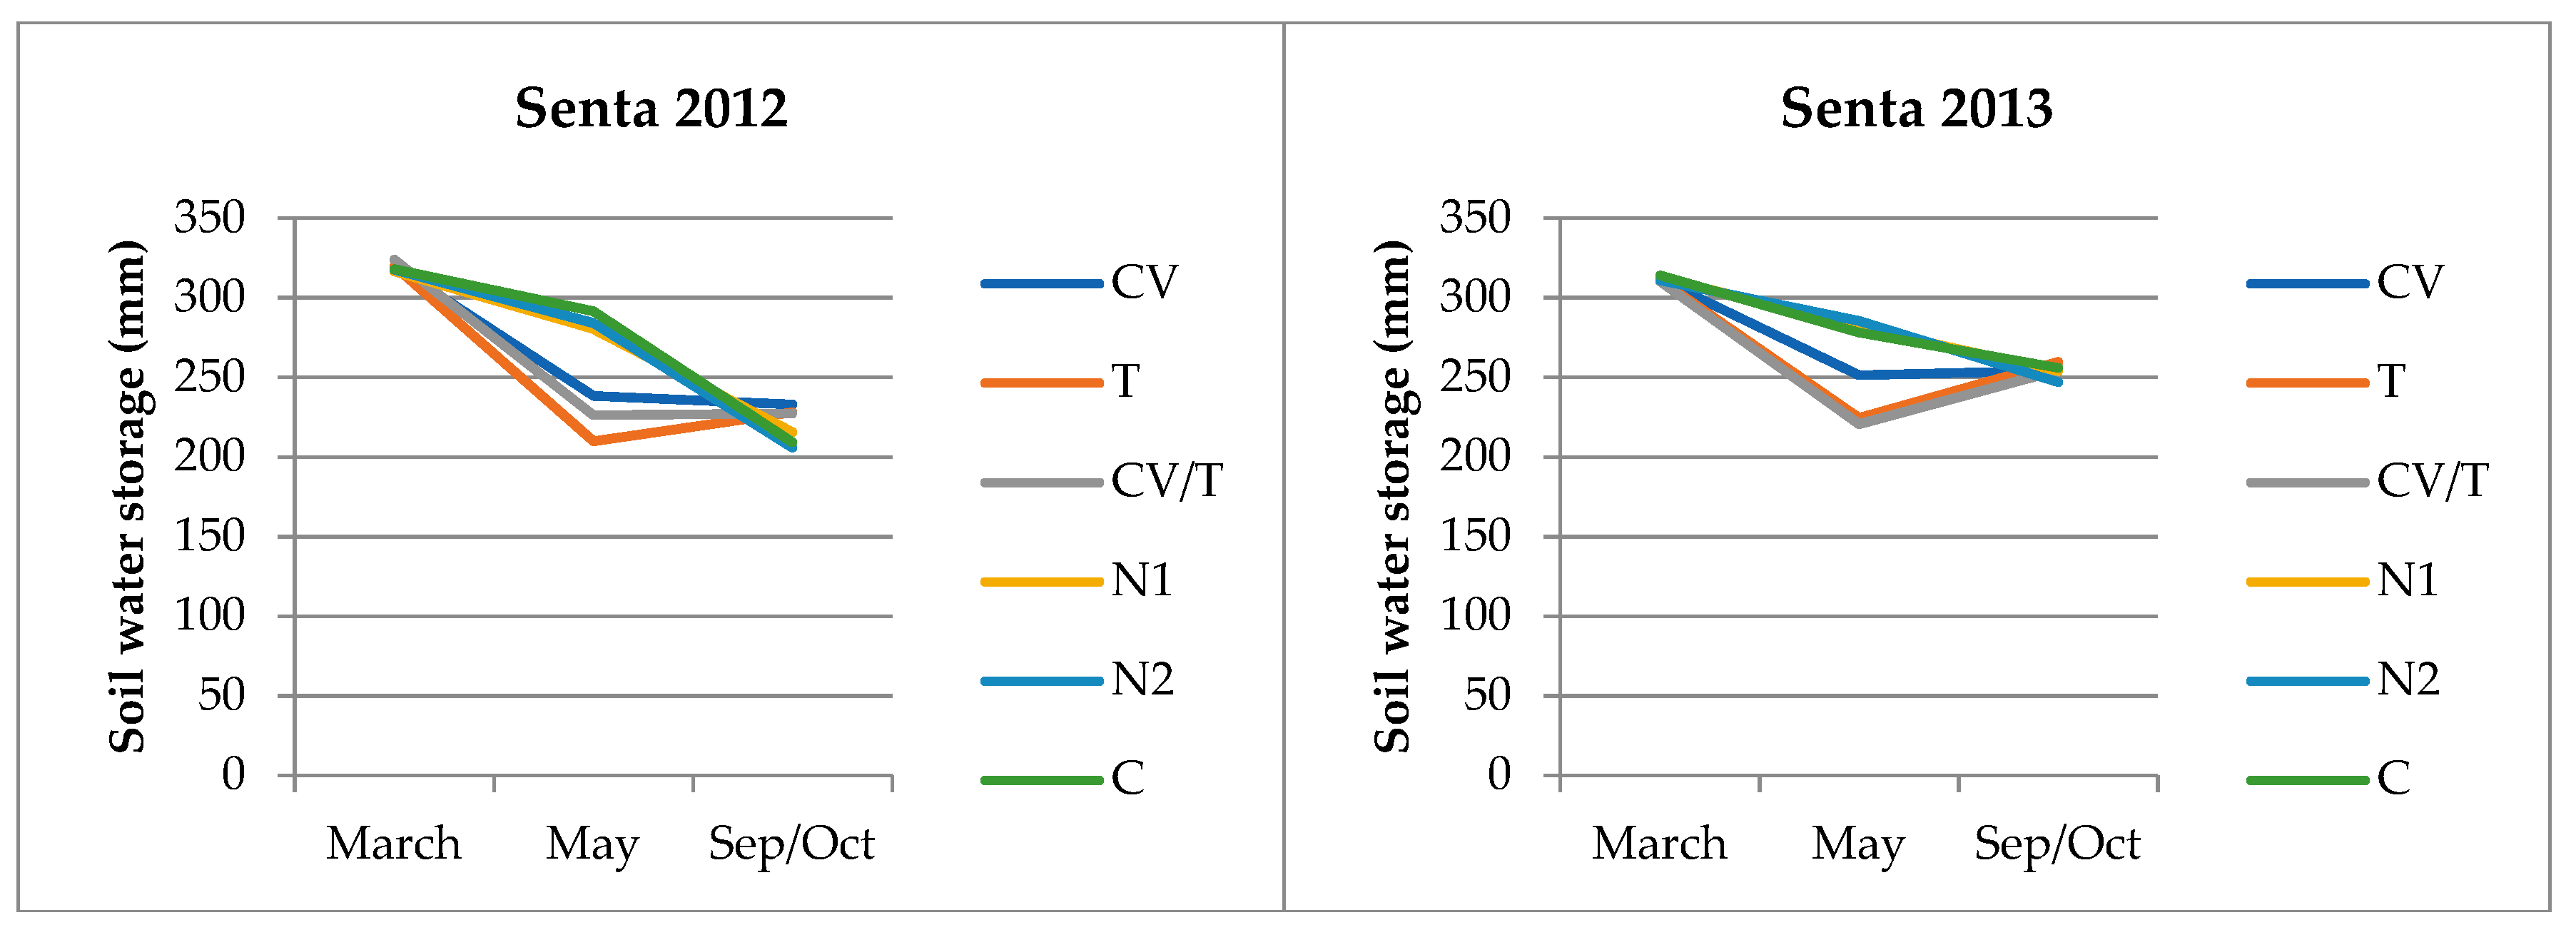
In March 2012 and 2013 at Senta in the 0–30 cm soil layer, the soil water storage did not significantly differ among treatments (Table 8a). In the second and third term in all treatments, the soil water storage was higher in 2013 than that in 2012. In May 2012 and 2013, no significant difference occurred among cover crop treatments, and they significantly differed from fallow treatments (Table 8b). Among the soil layers examined, the highest soil water storage was in the 30–60 cm layer in March 2012, and among treatments, the highest value was in the mixture of common vetch and triticale (96.4 mm).
The highest soil water storage in the profile was in the first term (Figure 2). In regard to locality, the lowest soil water storage was in Sombor in 2012 (273.2 mm in the treatment with common vetch), and the highest soil water storage was in Novi Sad in 2013 (341.5 mm in the treatment with common vetch). In May, the soil water storage decreased in the profile with the lowest values in the treatments with cover crops. In the third term in 2012, the soil water storage was higher in all treatments at Senta than that at the other two research areas. At Senta, the lowest values were observed in N2 (206.0 mm) and control (209.0 mm) treatments, whereas the highest was registered in the treatment with common vetch (233.0 mm). In September/October in 2013, at Sombor and Senta, values were the highest in the treatments with cover crops, whereas at Novi Sad, values were generally similar in all treatments.
In both periods and at all localities, the changes in soil water storage were higher in 2013 than that in 2012 (Table 9). In the first period in 2012 in Novi Sad-Rimski Šančevi and Senta, the lowest values were in the control treatment (114.5 and 145.1 mm, respectively). In 2012, the highest value of the changes in soil water storage was in Novi Sad in the treatment with common vetch (252.2 mm). At the first locality, the lowest value was in the treatment with common vetch as the cover crop (172.7 mm in 2012 and 314.4 mm in 2013), whereas the highest was in the control (280.7 mm in 2012 and 416.9 mm in 2013). In Sombor, the lowest value of the changes in the soil water storage was in the triticale variant in 2012 (110.8 mm) and in the variant with common vetch in 2013 (334.3 mm). In the period May-September/October, the changes in soil water storage were the lowest in the cover crop treatments. At this locality, the highest values were in N2 in 2012 (209.6 mm) and in the control in 2013 (499.8 mm). The changes in soil water storage in Senta in 2012 ranged from 101.2 mm in the triticale cover crop treatment to 201.6 mm in the control. In the second year, the lowest value was in the treatment with common vetch (336.2 mm), and the highest was in the N2 treatment (460.0 mm).
In the period March–May in 2012, the lowest average changes in soil water storage in treatments with cover crops were in Sombor (193.2 mm), and the highest were in Novi Sad-Rimski Šančevi (244.1 mm) (Table 10). For the average changes in soil water storage, the smallest difference between cover crops and fallow treatments was recorded in Sombor (52.0 mm) and the highest in Novi Sad-Rimski Šančevi (88.2 mm). In 2013, the average changes in soil water storage in cover crop treatments ranged from 328.7 mm in Sombor to 367.8 mm in Senta and to 432.8 mm in Novi Sad-Rimski Šančevi. The smallest difference between cover crop and fallow treatments was recorded in Senta (81.3 mm) and the highest in Novi Sad-Rimski Šančevi (99.6 mm).
In the second period in both years, the average changes in soil water storage were highest in the fallow treatments. In 2012, the lowest average changes in soil water storage were in Senta (114.8 mm in cover crop treatments, 194.4 mm in fallow treatments), whereas the highest were in Novi Sad-Rimski Šančevi (190.2 mm in cover crop treatments, 261.2 mm in fallow treatments). In 2013, the average changes in soil water storage in cover crop treatments ranged from 335.9 mm in Novi Sad-Rimski Šančevi to 387.5 mm in Senta, whereas in fallow treatments, the range was from 404.6 mm in Novi Sad-Rimski Šančevi to 482.3 mm in Sombor. In both years, the differences between cover crop and fallow treatments were negative, and the highest difference was calculated in Sombor in 2013 (−108.6 mm).
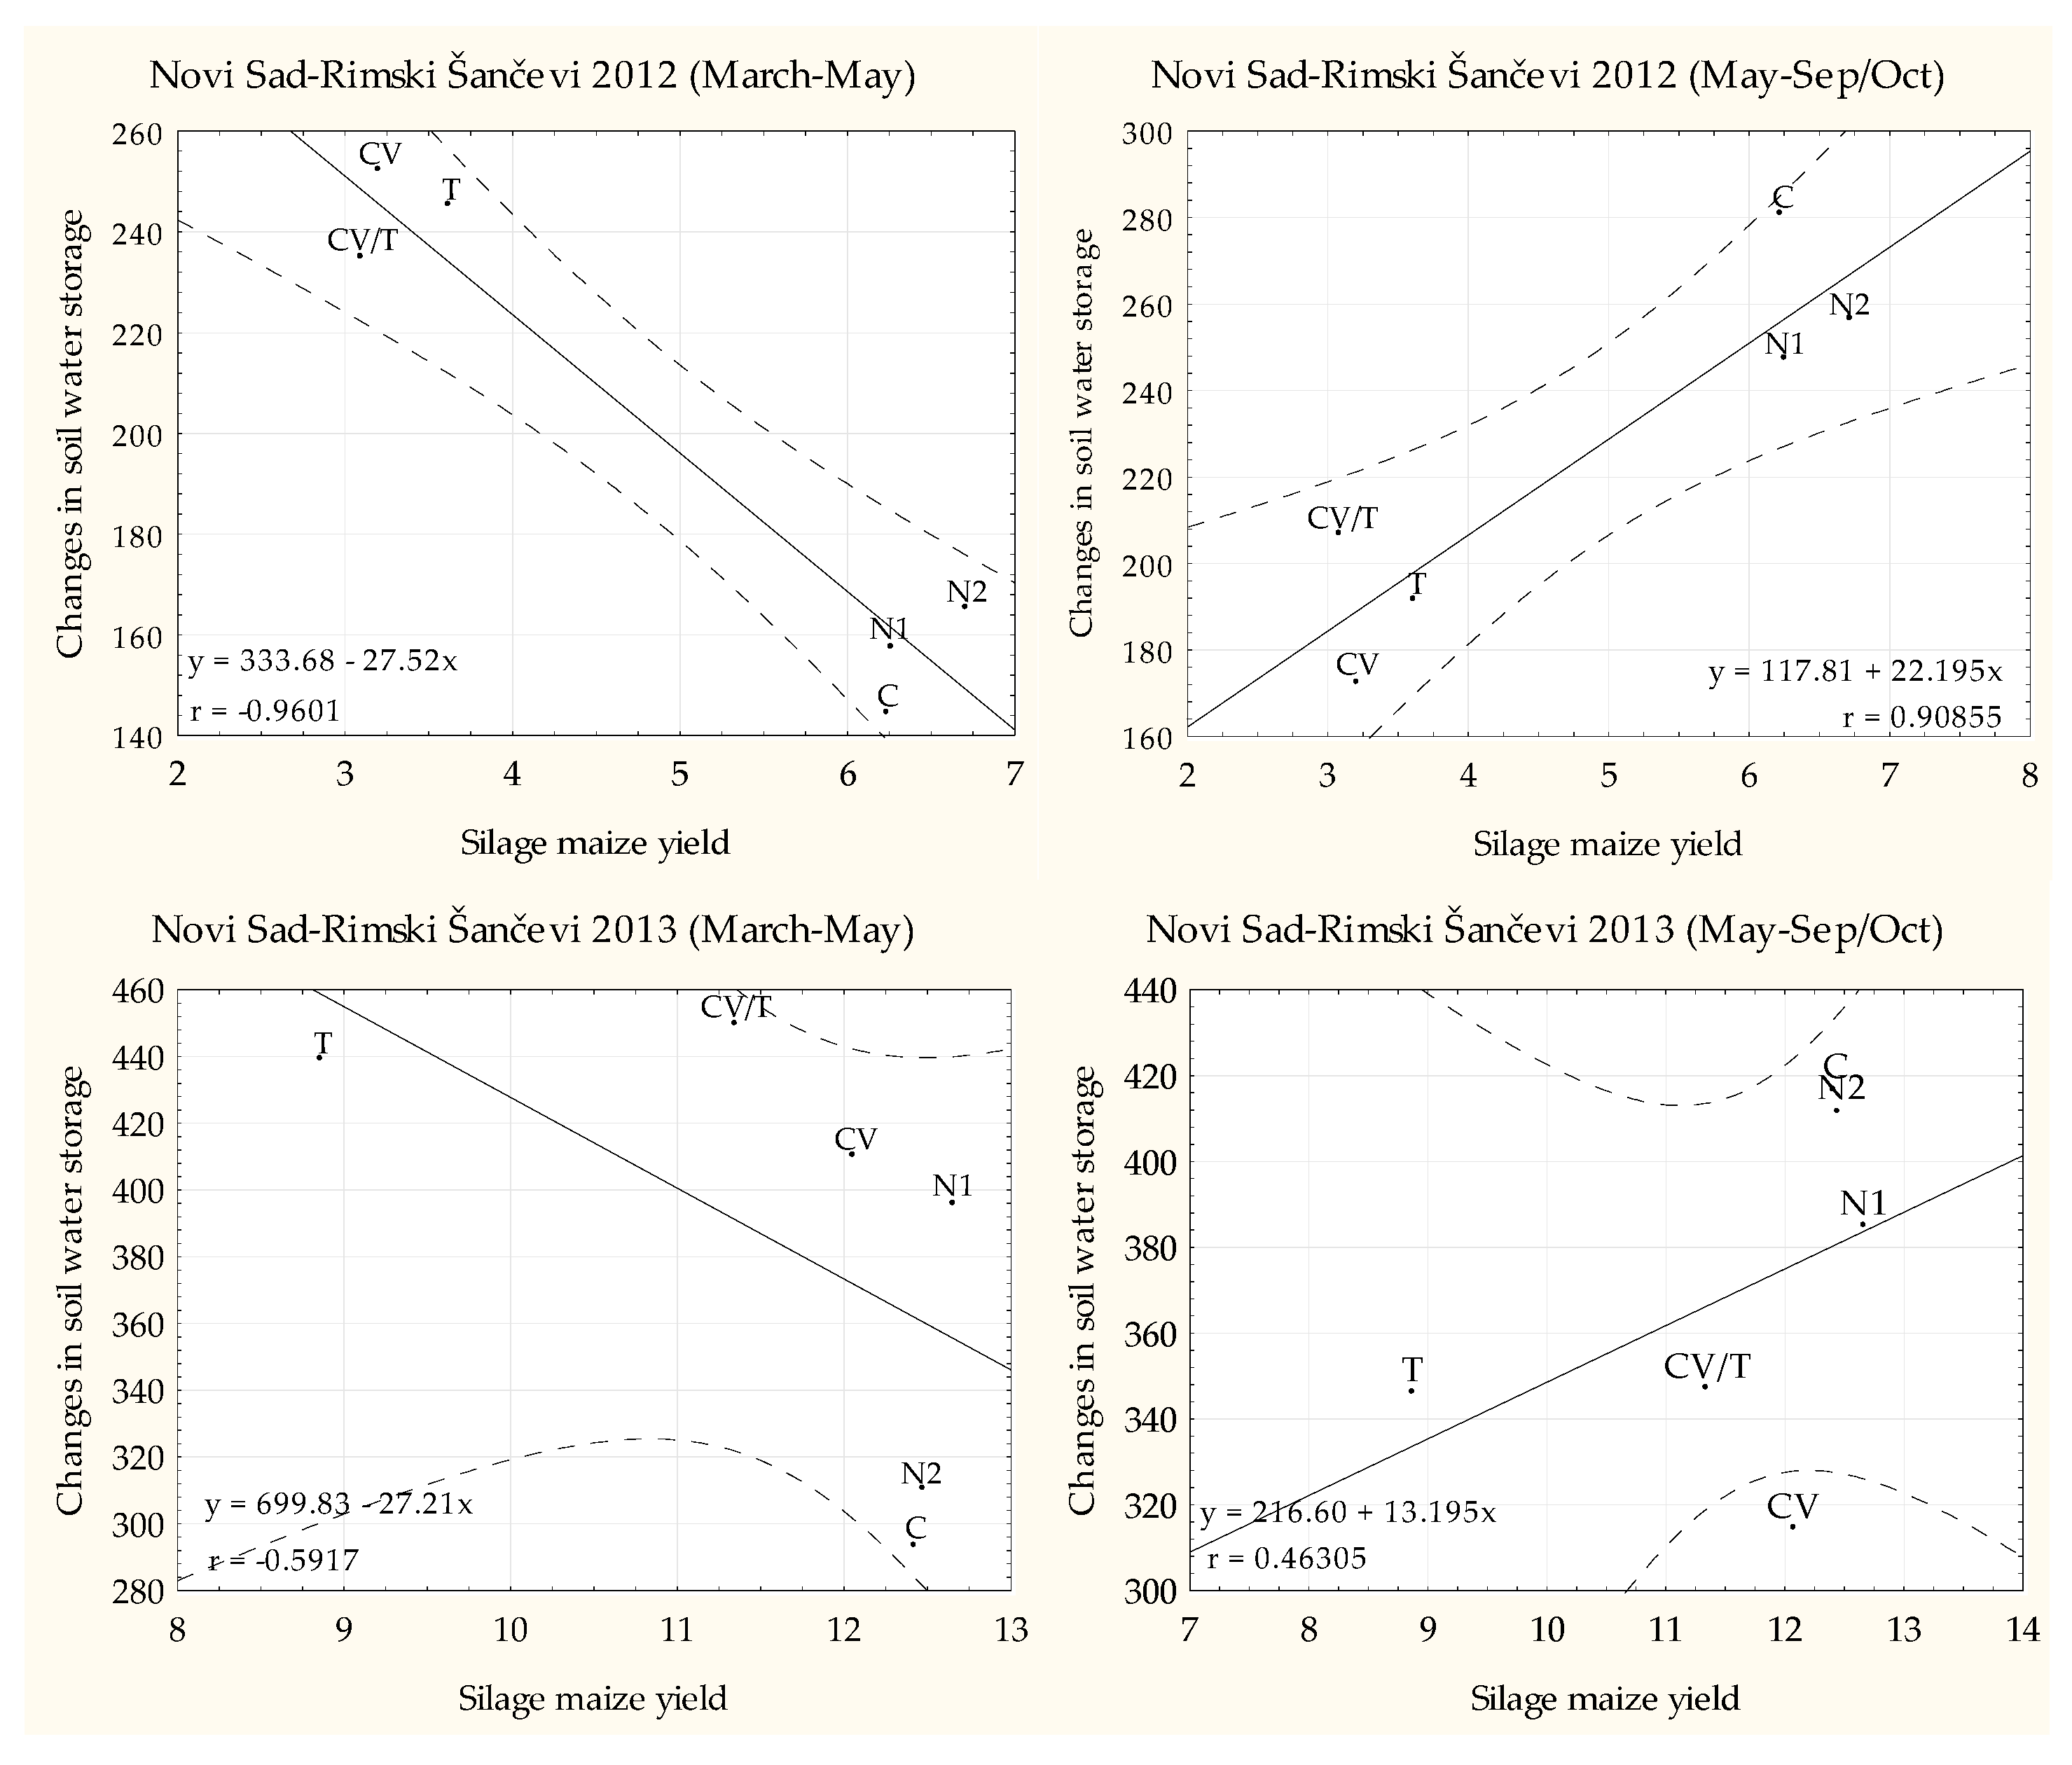
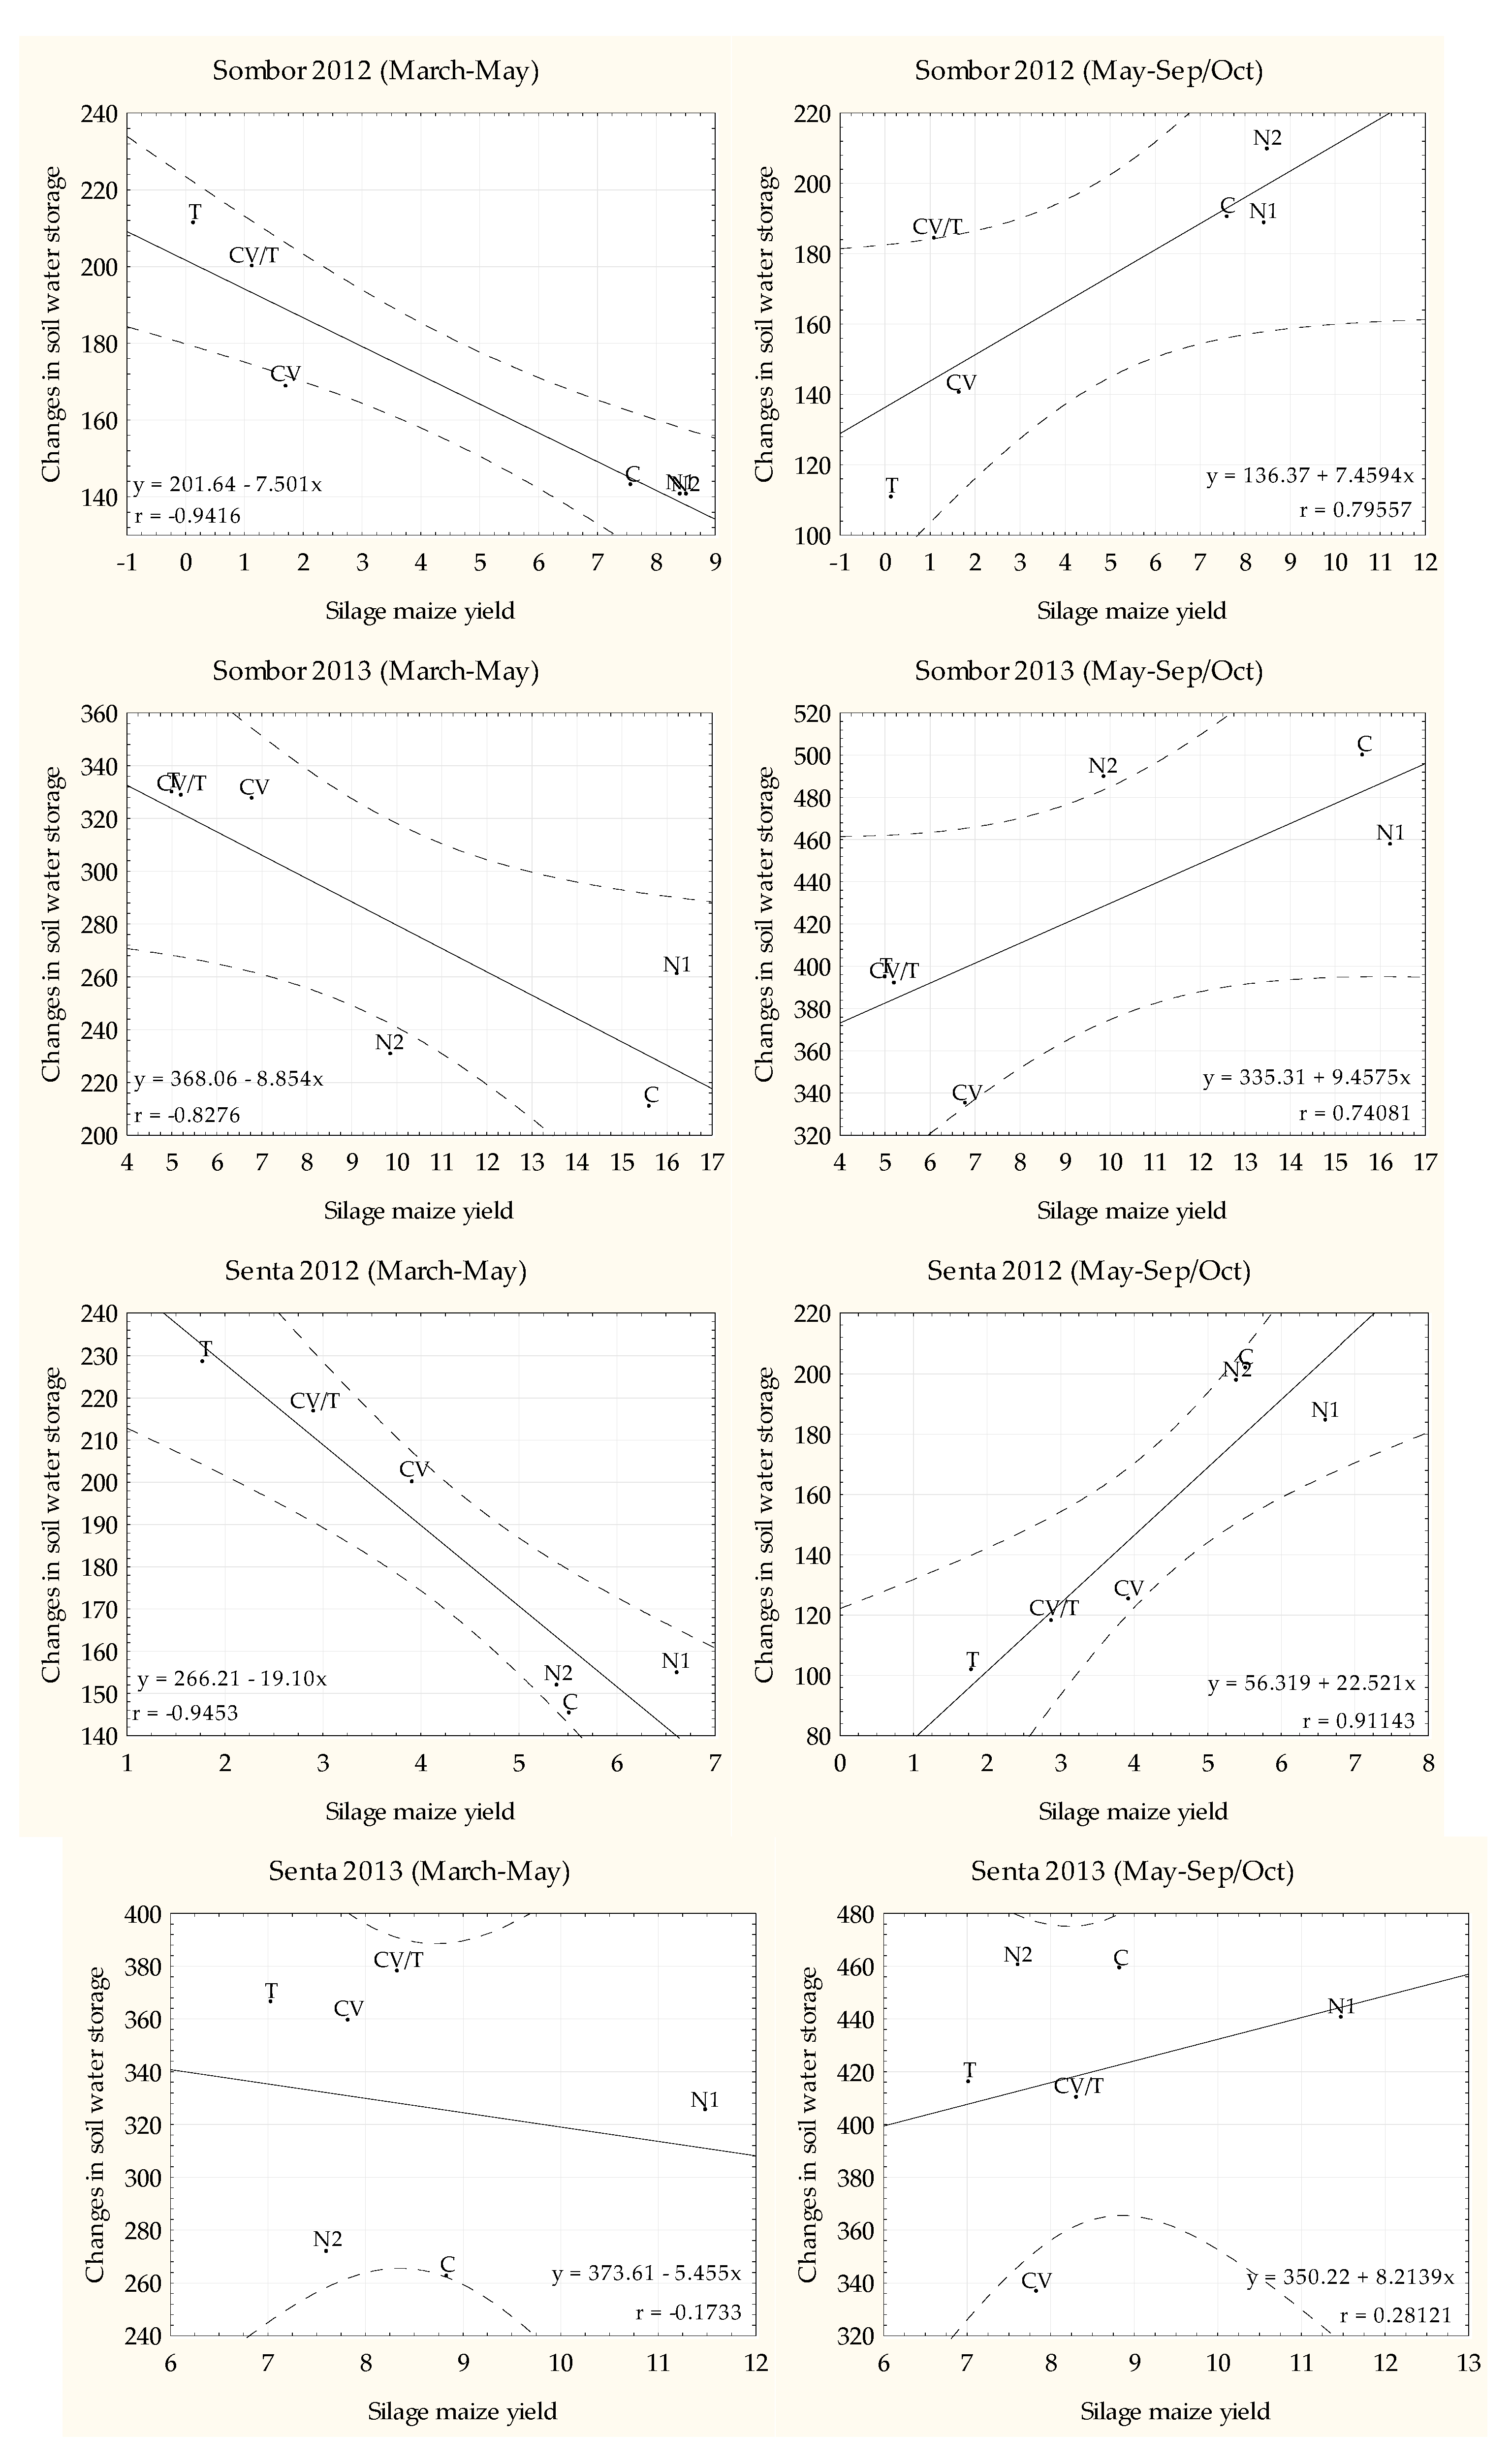
The correlation analyses for 2012 showed that the relationship between the changes in soil water storage in the first period and silage maize yield was very strong and negative (Figure 3). The opposite was observed with a very strong and positive relationship between the changes in soil water storage in the second period and silage maize yield. Similar to 2012, in 2013, the correlation between the changes in soil water storage in the first period and silage maize yield was negative but with a different strength of the correlation among the locations. The correlation was very weak (r = −0.17) in Senta, moderate in Novi Sad-Rimski Šančevi (r = −0.59), and very strong in Sombor (r = −0.83). The relationship between the changes in soil water storage in the second period and silage maize yield was positive, with the highest value obtained in Sombor (r = 0.74).

4. Discussion

In semiarid regions, the yield of cash crops such as maize or soybean is often unpredictable as a result of amount and timing of precipitation in the growing season [35]. Generally, reductions in yield of maize or any other warm-season cash crop are highly connected with the reduced precipitation and increased air temperatures during summer months [36]. According to SPI values, 2011 and 2012 were extremely dry years, and 2013 had moderately increased moisture, reaching normal values. The second warmest year in Serbia between 1951 and 2013 was 2012 [37]. This outcome confirms the statement of Stricevic et al. [38] that SPIs for Vojvodina reveal significant variations in drought intensity. Drought results from continued lack of precipitation and manifests when the amount of precipitation at a site is below usual levels during several months [39]. In the present study, the strongest drought effect was observed in November 2011 and in March and August 2012, because the amount of precipitation was less than 10 mm at all locations. These conditions significantly affected the water supply, and therefore the growth of both cover and cash crops.
As emphasised previously, cover crop contribution to the crop rotation depends on species, soil and weather conditions. All three effects can be analysed individually, but also through mutual interactions. For example, the soil water storage was lowest in all treatments with cover crops, but the deficiency was more intensive in extremely dry 2012. Similar results were obtained by Basche et al. [15] who concluded that ten days before cover crop termination and main crop sowing, soil water storage was significantly lower in the cover crop treatments than that in the treatment without cover crops. Furthermore, they concluded that in years with adequate precipitation distribution, the soil water deficit is replenished after cover crop growth. Regardless of the weather conditions, the changes in soil water storage in the two observed periods showed increased water use in the cover crop as a result of evapotranspiration, leaching, and plant water uptake, whereas the water loses in fallow treatments were only by evaporation and leaching. Thus, the use of cover crops is often confronted with the problem of soil water conservation [40]. Before sowing of silage maize, the highest water loss was registered in cover crop treatments, indicating that less water was available for maize requirements, which results in much more difficult starting conditions for the silage maize plants. Generally, more water was used by triticale because of the well-developed cereal root system. Namely, small grain cover crops are known as so-called catch crops with an increased ability for soil water uptake. Thus, these cover crops are used for water conservation and to prevent nitrogen leaching [41]. As a result of different root morphology and development, the highest water consumption was also recorded in the mixture. Additionally, in the mixture, more nitrogen was available for the cereal, which demonstrated complementarities of the cereal-legume mixture and intensive use of water and nutrients. These conditions of reduced soil water availability for a subsequent crop are aggravated further in areas with dry weather terms, irregular precipitation or on soils with a low water capacity [42]. The timely spring termination of a cover crop avoids the negative effects of opposite water conditions: excess residue holding in too much moisture for planting in wet years, or living plants drawing too much moisture from the soil in dry years [43]. In 2013, in the spring and early summer, the experimental sites received more water than average, which compensated for the moisture deficit after cover crops and mitigated their negative effect on the growth and yield of silage corn. Thus, in a region and years with no water limitation, cover crops are highly beneficial and applicable, which is in accordance with Cupina et al. [13] who stated that in the average year when the amount and timing of precipitation are consistent with the long-term average, cover crops have a positive effect on the changes in soil water storage. By contrast, in the first year of the study with water supplies used by cover crops and extremely dry and warm conditions, the silage maize yield was very low, or the crop completely failed in some localities. However, in the temperate region, such specific years with a negative effect of cover crops on the subsequent crop occur once in 5 to 10 years [44,45]. In the second year, silage maize use of water was intensive, and the yield obtained was similar between cover crop treatments and treatments with fertilisation. Among the cover crops, the lowest silage maize yield in both years was obtained in the treatment with triticale, as a result of high water consumption, whereas the highest yield in both years was after the common vetch because of less water consumption and better moisture conditions for the main crop. The correlations between the changes in soil water storage and silage maize yield confirmed that the silage maize yield is highly connected with the water storage after cover crop incorporation, considering that cover crops reduce available water for a subsequent crop. However, if the water limitation is continuous, as it was in 2012, then the negative effect is prolonged to the entire growing period.
Climate change and the extreme variation in precipitation distribution during the growing period in temperate regions have brought and will bring many challenges in crop production. One of the ways to respond to these differences is to maintain or to obtain fertile and well-structured soils, by manure application, growing cover crops or with some other measure. In the region of Vojvodina Province, livestock production is low, and therefore, the reduced availability of organic fertilisers justifies the importance of cover cropping [41]. The variations in weather conditions raise the question of whether to include cover crops in crop rotations. Moreover, the question is whether the benefits of cover crops can occur in areas with different precipitation and temperature values during a growing period, such as occur in temperate and semiarid regions, or only in a region that is generally not water limited. The use of cover crops has numerous positive effects but with short-term and long-term benefits. Soil water availability, additional nitrogen by legumes, and erosion reduction are some of the short-term effects, which vary significantly and are strongly dependent on the water supply. However, the improvement in soil properties such as infiltration, structure, and organic matter content by root residues or biomass incorporation of cover crops requires several years, which in that case, leads to better soil conditions for overcoming temperature and precipitation variations [13]. In the present research, the winter covers were ploughed-in in the late spring, which directly affected the silage maize development, because the period for water recharge was short. As a precaution, Joyce et al. [40] suggest cutting and incorporation of winter cover crops at the beginning of spring to avoid any negative effects on the following main crop by excessive evapotranspiration and other water losses. Cover cropping is an intensive system in which some operations (cutting, incorporation, soil preparation, sowing) must be performed within one or a few days [17]. Alternatively, Lyon et al. [46] propose harvesting cover crops in the fall to leave sufficient time for water accumulation. In semiarid regions such as Vojvodina Province, these approaches could be options that include cover cropped systems but reduce the possibility of cover crop disadvantages. Based on our results from Sombor and Senta, when the precipitation amount and water supply were adequate during the summer months, the soil water storage was the highest after main crop termination in the fall in the treatments with cover crops. Providing support for this outcome, the results of Basche et al. [15] indicate that because of cover crop effects on soil properties, the capacity for soil water storage increases, and therefore, the soil water content can remain high during summer months. The continuous decrease in water storage in the control variant in both years was notable. Simultaneously, in the nitrogen treatments, because of intensive water uptake by maize, soil water storage also decreased. Therefore, farmers suspicious of whether they should use cover crops should consider the importance of maintaining soil properties and investment in long-term production.

5. Conclusions

Generally, cover crops can be efficiently used for soil water conservation and yield improvement of the subsequent cash crop, with the following conclusions:
-
Cover crop benefits were more weather-specific than site-specific,
-
The soil water storage was reduced during the cover crop growing season compared to control variant and variants with nitrogen fertilisation,
-
Before the cash crop growing season, cover crops temporarily decreased the soil water storage,
-
When precipitation decreased or was not properly distributed, the water reduction after cover crops had a negative effect on the cash crop growth and yield,
-
When the precipitation amount and water supply was adequate during the cash crop growing season, the soil water storage was the highest after main crop termination in the fall in the treatments with cover crops,
-
Common vetch and the mixture of common vetch and triticale had a greater positive effect on the changes in soil water storage after ploughing-in than that of triticale as sole crop.

Author Contributions

B.C., Đ.K. and P.E. conceived and designed the experiment; Đ.K., S.V. and Z.R. performed the experiment; Đ.K., S.V. and G.J. analysed the data; Đ.K., B.C. and S.V. wrote the paper; P.D’. and G.J. reviewed the paper; and S.V. edited the paper.

Funding

This paper is supported by the H2020-TWINN-2015 ‘SERBIA FOR EXCELL’ project supported this research. This project received funding from the European Union’s Horizon 2020 research and innovation programme under grant agreement No. 691998. This research was supported by the Ministry of Education and Science, Republic of Serbia evidence, project number TR31016 and by the Provincial Secretariat for Science and Technological Development of the Vojvodina Province, project number 114-451-2180/2016-01.

Conflicts of Interest

The authors declare no conflict of interest.

References

  1. Matson, P.A.; Parton, W.J.; Power, A.G.; Swift, M.J. Agricultural intensification and ecosystem properties. Science 1997, 277, 504–509. [Google Scholar] [CrossRef]
  2. Giller, K.E.; Beare, M.H.; Lavelle, P.; Izac, A.-M.N.; Swift, M.J. Agricultural intensification, soil biodiversity and agroecosystem function. Appl. Soil Ecol. 1997, 6, 3–16. [Google Scholar] [CrossRef]
  3. Zilverberg, C.J.; Heimerl, K.; Schumacher, T.E.; Malo, D.D.; Schumacher, J.A.; Johnson, W.C. Landscape dependent changes in soil properties due to long-term cultivation and subsequent conversion to native grass agriculture. CATENA 2018, 160, 282–297. [Google Scholar] [CrossRef]
  4. Ličina, V.; Nešić, L.J.; Belić, M.; Hadžić, V.; Sekulić, P.; Vasin, J.; Ninkov, J. The soils of Serbia and their degradation. Field Veg. Crop Res. 2011, 48, 285–290. [Google Scholar]
  5. Belić, M.; Manojlović, M.; Nešić, L.; Ćirić, V.; Vasin, J.; Benka, P.; Šeremešić, S. Pedo-ecological significance of soil organic carbon stock in South-Eastern pannonian basin. Carpathian J. Earth Environ. Sci. 2013, 8, 171–178. [Google Scholar]
  6. Seremesic, S.; Ćirić, V.; Milošev, D.; Vasin, J.; Djalovic, I. Changes in soil carbon stock under the wheat-based cropping systems at Vojvodina province of Serbia. Arch. Agron. Soil Sci. 2017, 63, 388–402. [Google Scholar] [CrossRef]
  7. Amundson, R.; Berhe, A.A.; Hopmans, J.W.; Olson, C.; Sztein, A.E.; Sparks, D.L. Soil and human security in the 21st century. Science 2015, 348, 1261071. [Google Scholar] [CrossRef]
  8. Daniel, A. Changes in Extreme Precipitation Events over the Central United States in AOGCM-Driven Regional Climate Model Simulations; Agronomy, M.S., Ed.; Iowa State University: Ames, IA, USA, 2015. [Google Scholar]
  9. Six, J.; Paustian, K.; Elliott, E.T.; Combrink, C. Soil structure and organic matter I. Distribution of aggregate-size classes and aggregate-associated carbon. Soil Sci. Soc. Am. J. 2000, 64, 681–689. [Google Scholar] [CrossRef]
  10. Hubbard, R.K.; Strickland, T.C.; Phatak, S. Effects of cover crop systems on soil physical properties and carbon/nitrogen relationships in the coastal plain of southeastern USA. Soil Tillage Res. 2013, 126, 276–283. [Google Scholar] [CrossRef]
  11. Stewart, B.; Peterson, G. Managing green water in drylands agriculture. Agron. J. 2015, 107, 1544–1553. [Google Scholar] [CrossRef]
  12. Snapp, S.S.; Swinton, S.M.; Labarta, R.; Mutch, D.; Black, J.R.; Leep, R.; Nyiraneza, J.; O’Neil, K. Evaluating cover crops for benefits, costs and performance within cropping system niches. Agron. J. 2005, 97, 322–332. [Google Scholar] [CrossRef]
  13. Ćupina, B.; Vujić, S.; Krstić, D.; Radanović, Z.; Čabilovski, R.; Manojlović, M.; Latković, D. Winter cover crops as green manure in a temperate region: The effect on nitrogen budget and yield of silage maize. Crop Pasture Sci. 2017, 68, 1060–1069. [Google Scholar] [CrossRef]
  14. Kay, B. Soil structure and organic carbon: A review. In Soil Processes and the Carbon Cycle; Lal, R., Kimble, J.M., Follett, R.F., Stewart, B.A., Eds.; CRC Press: Boca Raton, FL, USA, 1998; pp. 169–197. [Google Scholar]
  15. Basche, A.D.; Kaspar, T.C.; Archontoulis, S.V.; Jaynes, D.B.; Sauer, T.J.; Parkin, T.B.; Miguez, F.E. Soil water improvements with the long-term use of a winter rye cover crop. Agric. Water Manag. 2016, 172, 40–50. [Google Scholar] [CrossRef]
  16. Kaspar, T.C.; Singer, J.W. The use of cover crops to manage soil. In Soil Management: Building a Stable Base for Agriculture; Hatfield, J.L., Sauer, T.J., Eds.; American Society of Agronomy and Soil Science Society of America: Madison, WI, USA, 2011; pp. 321–337. [Google Scholar]
  17. Ćupina, B.; Antanasović, S.; Krstić, D.J.; Mikić, A.; Manojlović, M.; Pejić, B.; Erić, P. Cover crops for enhanced sustainability of cropping system in temperate regions. Agric. For. 2013, 59, 55–72. [Google Scholar]
  18. Thorup-Kristensen, K.; Magid, J.; Jensen, L.S. Catch crops and green manures as biological tools in nitrogen management in temperate zones. Adv. Agron. 2003, 79, 227–302. [Google Scholar]
  19. Wortman, S.E.; Francis, C.A.; Bernards, M.L.; Drijber, R.A.; Lindquist, J.L. Optimizing cover crop benefits with diverse mixtures and an alternative termination method. Agron. J. 2012, 104, 1425–1435. [Google Scholar] [CrossRef]
  20. Wittwer, R.A.; Dorn, B.; Jossi, W.; Van Der Heijden, M.G. Cover crops support ecological intensification of arable cropping systems. Sci. Rep. 2017, 7, 41911. [Google Scholar] [CrossRef] [PubMed] [Green Version]
  21. Tosti, G.; Benincasa, P.; Farneselli, M.; Pace, R.; Tei, F.; Guiducci, M.; Thorup-Kristensen, K. Green manuring effect of pure and mixed barley–hairy vetch winter cover crops on maize and processing tomato N nutrition. Eur. J. Agron. 2012, 43, 136–146. [Google Scholar] [CrossRef]
  22. Ugrenović, V.; Filipović, V. Cover crops: Achievement of sustainability in the ecological systems of agriculture. In Sustainable Entrepreneurship and Investments in the Green Economy; Vasile, A.J., Nicolò, D., Eds.; IGI Global: Hershey, PA, USA, 2017; pp. 257–281. [Google Scholar]
  23. Dinnes, D.L.; Karlen, D.L.; Jaynes, D.B.; Kaspar, T.C.; Hatfield, J.L.; Colvin, T.S.; Cambardella, C.A. Nitrogen management strategies to reduce nitrate leaching in tile-drained Midwestern soils. Agron. J. 2002, 94, 153–171. [Google Scholar] [CrossRef]
  24. Qi, Z.; Helmers, M.J.; Kaleita, A.L. Soil water dynamics under various agricultural land covers on a subsurface drained field in north-central Iowa, USA. Agric. Water Manag. 2011, 98, 665–674. [Google Scholar] [CrossRef] [Green Version]
  25. Cupina, B.; Krstic, D.J.; Antanasovic, S.; Mikic, A.; Eric, P. Environmental impact of introducing legumes into cropping system in temperate regions. In Proceedings of the ILS2—Second International Legume Society Conference, Legumes for a Sustainable World, Tróia, Portugal, 11–14 October 2016; International Legume Society: Tróia, Portugal, 2016; p. 57. [Google Scholar]
  26. Lemken, D.; Spiller, A.; von Meyer-Höfer, M. The case of legume-cereal crop mixtures in modern agriculture and the transtheoretical model of gradual adoption. Ecol. Econ. 2017, 137, 20–28. [Google Scholar] [CrossRef]
  27. Wang, Z.; Zhao, X.; Wu, P.; Chen, X. Effects of water limitation on yield advantage and water use in wheat (Triticum aestivum L.)/maize (Zea mays L.) strip intercropping. Eur. J. Agron. 2015, 71, 149–159. [Google Scholar] [CrossRef]
  28. Malézieux, E.; Crozat, Y.; Dupraz, C.; Laurans, M.; Makowski, D.; Ozier-Lafontaine, H.; Rapidel, B.; de Tourdonnet, S.; Valantin-Morison, M. Mixing plant species in cropping systems: Concepts, tools and models. A review. Agron. Sustain. Dev. 2009, 29, 43–62. [Google Scholar] [CrossRef]
  29. SU, S.L.; Singh, D.N.; Baghini, M.S. A critical review of soil moisture measurement. Measurement 2014, 54, 92–105. [Google Scholar] [CrossRef]
  30. Gardner, C.M.K.; Robinson, D.; Blyth, K.; Cooper, D. Soil water content. In Soil and Environmental Analysis: Physical Methods, 2nd ed.; Smith, K.A., Mullins, C.E., Eds.; Marcel Dekker: New York, NY, USA, 2000; pp. 1–64. [Google Scholar]
  31. McKee, T.B.; Doesken, N.J.; Kleist, J. The relationship of drought frequency and duration to time scale. In Proceedings of the Eighth Conference on Applied Climatology, Anaheim, CA, USA, 17–22 January 1993; American Meteorological Society: Boston, MA, USA, 1993; pp. 179–184. [Google Scholar]
  32. Seiler, R.A.; Hayes, M.; Bressan, L. Using the standardized precipitation index for flood risk monitoring. Int. J. Climatol. 2002, 22, 1365–1376. [Google Scholar] [CrossRef] [Green Version]
  33. Implementation of Standardized Precipitation Index-SPI. Available online: http://www.hidmet.gov.rs/podaci/agro/ciril/REPORT_SPI_in_Serbia.pdf (accessed on 24 August 2018).
  34. StatSoft Inc. Statistica, Data Analysis Software System, Version 13; TIBCO Software Inc.: Palo Alto, CA, USA, 2017. [Google Scholar]
  35. Gimenez, C.; Orgaz, F.; Fereres, E. Productivity in water-limited environments: Dryland agriculture systems. In Ecology in Agriculture; Jackson, L.E., Ed.; Academic Press: San Diego, CA, USA, 1997; p. 117. ISBN 978-0-12-378260-1. [Google Scholar]
  36. Kovačević, D.; Oljača, S.; Dolijanović, Z.; Milić, V. Climate changes: Ecological and agronomic options for mitigating the consequences of drought in Serbia. In Proceedings of the Third International Scientific Symposium “Agrosym 2012”, Jahorina, Bosnia and Herzegovina, 15–17 November 2012; Faculty of Agriculture, University of East Sarajevo: East Sarajevo, Bosnia and Herzegovina, 2012; pp. 17–36. [Google Scholar]
  37. КЛИМАТОЛОШКА АНАЛИЗА 2012. ГОДИНЕ НА ТЕРИТОРИЈИ РЕПУБЛИКЕ СРБИЈЕ. Available online: http://www.hidmet.gov.rs/podaci/meteorologija/latin/2012.pdf (accessed on 5 June 2018).
  38. Stricevic, R.; Djurovic, N.; Djurovic, Z. Drought classification in Northern Serbia based on SPI and statistical pattern recognition. Meteorol. Appl. 2010, 18, 60–69. [Google Scholar] [CrossRef]
  39. Gocic, M.; Trajkovic, S. Spatiotemporal characteristics of drought in Serbia. J. Hydrol. 2014, 510, 110–123. [Google Scholar] [CrossRef]
  40. Joyce, B.A.; Wallender, W.W.; Mitchell, J.P.; Huyck, L.M.; Temple, S.R.; Brostrom, P.N.; Hsiao, T.C. Infiltration and soil water storage under winter cover cropping in California’s Sacramento Valley. Trans. ASAE 2002, 45, 315–326. [Google Scholar] [CrossRef]
  41. Ćupina, B.; Manojlović, M.; Krstić, D.J.; Čabilovski, R.; Mikić, A.; Ignjatović-Ćupina, A.; Erić, P. Effect of winter cover crops on the dynamics of soil mineral nitrogen and yield and quality of sudan grass [‘Sorghum bicolor’(L.) Moench]. Aust. J. Crop Sci. 2011, 5, 839–845. [Google Scholar]
  42. De Azevedo, D.M.P.; Landivar, J.; Vieira, R.M.; Moseley, D. The effect of cover crop and crop rotation on soil water storage and on sorghum yield. Pesqui. Agropecu. Brasil. 1999, 34, 391–398. [Google Scholar] [CrossRef] [Green Version]
  43. Clark, A. Managing Cover Crops Profitably, 3rd ed.; Diane Publishing: Darby, PA, USA, 2008; p. 248. ISBN 9781437903799. [Google Scholar]
  44. Lalic, B.; Eitzeinger, J.; Mihailovic, D.; Thaler, S.; Jancic, M. Climate change impacts on winter wheat yield change–which climatic parameters are crucial in Pannonian lowland? J. Agric. Sci. 2013, 151, 757–774. [Google Scholar] [CrossRef]
  45. Ruml, M.; Gregorić, E.; Vujadinović, M.; Radovanović, S.; Matović, G.; Vuković, A.; Počuča, V.; Stojičić, D. Observed changes of temperature extremes in Serbia over the period 1961−2010. Atmos. Res. 2017, 183, 26–41. [Google Scholar] [CrossRef]
  46. Lyon, D.J.; Nielsen, D.C.; Felter, D.G.; Burgener, P.A. Choice of summer fallow replacement crops impacts subsequent winter wheat. Agron. J. 2007, 99, 578–584. [Google Scholar] [CrossRef]
Figure 1. Long-term average (LTA), mean monthly temperature (T) and monthly precipitation (P) for hydrological years 2011/2012 and 2012/2013.
Atmosphere 09 00492 g001
Figure 2. The effect of cover crops and nitrogen rate on soil water storage in the soil profile from 0 to 120 cm at the localities of Novi Sad-Rimski Šančevi, Sombor, and Senta in 2012 and 2013. CV: common vetch; T: triticale;CV/T: the mixture of common vetch and triticale; N1: 120 kg ha−1 mineral fertilizer; N2: 160 kg ha−1 mineral fertilizer; C: control.
Atmosphere 09 00492 g002aAtmosphere 09 00492 g002b
Figure 3. Correlations between the changes in soil water storage in the growing periods of cover crops (March–May) and silage maize (May–September/October) and silage maize yield in 2012 and 2013 (silage maize yield previously published by Cupina et al. [13]).
Atmosphere 09 00492 g003aAtmosphere 09 00492 g003b
Table 1. The chemical characteristics of the soil for Rimski Šančevi, Sombor, and Senta in 2011 and 2012.
LocationYearpH in H2OCaCO3 %Organic Matter %P2O5K2O
mg 100 g−1 Soil
Rimski Šančevi20117.778.012.0734.7426.96
20127.605.482.4946.0424.13
Sombor20117.606.803.0822.5022.05
20127.507.403.1221.8021.10
Senta20117.2913.813.9518.3126.20
20127.3112.413.4819.5724.32
Average20117.559.543.0325.1825.07
20127.508.433.0329.1423.18
Table 2. Field operations at Novi Sad-Rimski Šančevi, Sombor and Senta for each year of the study during the seasons 2011/2012 and 2012/2013.
Field Operations2011/20122012/2013
Novi Sad-Rimski ŠančeviSomborSentaNovi Sad-Rimski ŠančeviSomborSenta
Cover crop sowing26/10/201127/10/2011 24/10/2011 22/10/201224/10/2012 14/10/2012
Cover crops ploughing-in and application of N mineral fertilisers29/05/2012 23/05/2012 26/05/2012 16/05/2013 30/05/2013 25/05/2013
Silage maize sowing30/05/2012 26/05/201228/05/201220/05/201302/05/201330/05/2013
Silage maize harvest11/09/201213/09/201212/09/201202/09/201305/10/201316/09/2013
Soil sampling
I term05/03/201208/03/201207/03/201213/03/201310/03/201317/03/2013
II term30/05/201227/05/201227/05/201217/05/201330/05/201330/05/2013
III term12/09/201215/09/201214/09/201208/09/201306/10/201318/09/2013
Table 3. Soil bulk density (g cm−3) for the 0–30, 30–60, 60–90 and 90–120 cm soil depth for Novi Sad-Rimski Šančevi, Sombor and Senta.
Depth (cm)Novi Sad-Rimski ŠančeviSomborSenta
0–301.391.451.45
30–601.491.391.60
60–901.241.281.29
90–1201.551.491.38
Table 4. Modified drought classification of the Standardized Precipitation Index (SPI).
Abbr.Drought/Moisture ConditionsValueRange
EcDExceptional droughtSPI ≤ −2.326
EtDExtreme drought−2.326 < SPI ≤ −1.645
SDSevere drought−1.645 < SPI ≤ −1.282
MoDModerate drought−1.282 < SPI ≤ −0.935
MiDMinor drought−0.935 < SPI ≤ −0.524Usual moisture conditions
NNear normal−0.524 < SPI < +0.524
SMSlightly increased moisture+0.524 ≤ SPI < +0.935
MMModerately increased moisture+0.935 ≤ SPI < +1.282
CMConsiderably increased moisture+1.282 ≤ SPI < +1.645
EtWExtremely wet+1.645 ≤ SPI < +2.326
EcWExceptionally wetSPI ≥ +2.326
Different colors represent different moisture conditions.
Table 5. The SPI 1, 3 and 9 for each month in hydrological years 2011/2012 and 2012/2013 for Vojvodina Province.
YearMonthValueAbbreviation
SPI1SPI3SPI9SPI1SPI3SPI9
2011/201210−0.07−1.67−1.51NEtDSD
11−3.31−1.61−1.92EtDSDEtD
120.30−1.07−1.75NMDEtD
10.44−0.85−1.53NMiDSD
21.170.80−1.29MMMMSD
3−2.180.20−1.38EtDNSD
41.270.76−1.17MMMMMD
5−0.14−0.02−0.55NNMiD
6−1.95−0.42−0.87EtDNMiD
7−0.28−1.33−0.82NSDMiD
8−1.92−1.98−0.75EtDEtDMiD
9−1.30−1.71−1.02SDEtDMD
2012/2013100.36−1.49−1.11NSDMD
11−0.30−0.68−1.47NMiDSD
120.490.09−1.05NNMD
10.980.42−1.24MMNMD
20.670.85−1.09MMMMMD
31.261.34−0.32MMCMN
4−0.290.81−0.33NMMN
51.571.330.90CMCMMM
60.921.141.33MMMMCM
7−0.730.860.94MiDMMMM
8−0.49−0.200.74NNMM
91.600.111.05CMNMM
Different colors represent different moisture conditions.
Table 6. The effect of cover crop and nitrogen rate on soil water storage (mm) from (a) 0 to 60 cm, (b) 60 to 120 cm at Novi Sad-Rimski Šančevi in 2012 and 2013.
(a)
Soil Depth (cm)SamplingYearTreatments
Common VetchTriticaleCommon Vetch/TriticaleN1N2ControlAverage
0–30March201279.2e80.2de80.5cde80.3cde80.0de79.7e80.0B
201385.7ab84.3bcd90.1a79.0e84.8bc80.6cde84.1A
Average82.4AB82.3AB85.3A79.6B82.4A80.2B82.0
May201248.2de42.2e42.1e71.2a68.1ab70.1a57.0B
201366.2abc57.5cd58.7bc67.0abc62.0abc64.9abc62.7A
Average57.2B49.9C50.4BC69.1A65.1A67.5A59.9
September201233.6bc31.4c31.4c41.8b33.6bc33.9c34.3B
201367.8a63.1a65.8a70.4a67.4a65.4a66.7A
Average47.3B48.6B49.6AB50.5AB50.7AB56.1A50.5
30–60March201289.8b91.2ab90.3b92.7ab90.4b90.9ab90.9A
201396.8a87.0b93.1ab89.9b92.7ab91.3ab91.8A
Average93.3A89.1A91.7A91.3A91.6A91.1A91.3
May201250.9c51.0c50.8c72.9ab76.7ab79.9a63.7B
201371.7b56.7c55.1c78.7ab73.8ab73.9ab68.3A
Average61.3B53.8C53.0C75.8A75.3A76.9A66.0
September201240.9def36.4ef34.6f49.9bc44.9cd43.1cde41.6B
201354.7ab53.ab59.0a57.3ab53.3ab57.2ab55.8A
Average47.8B44.8B46.8B53.6A49.1AB50.2AB48.7
(b)
Soil Depth (cm)SamplingYearTreatments
Common VetchTriticaleCommon Vetch/TriticaleN1N2ControlAverage
60–90March201280.5a79.2a79.0a78.2a78.7a79.2a79.2A
201380.6a77.3a78.4a76.3a80.0a81.3a79.0A
Average80.5A78.3A78.7A77.3A79.4A80.2A79.1
May201246.9e52.8de58.0cd70.8ab66.5abc75.0a61.7A
201362.5bc49.6de48.1e68.8ab64.5bc64.6bc59.7A
Average54.7B51.2B53.0B69.8A65.5A69.8A60.7
September201233.6bc31.9bc29.5c34.7b34.3bc32.5bc32.7B
201344.6a46.7a43.9a47.6a45.7a44.7a45.5A
Average39.1AB39.3AB36.7B41.1A40.0AB38.6AB39.1
90–120March201275.4a77.3a78.0a76.6a76.3a76.9a76.7A
201378.4a76.7a79.7a77.5a78.7a77.2a78.0A
Average76.9A77.0A78.9A77.0A77.5A77.0A77.4
May201248.0f55.1def60.3cde73.5ab69.6abc76.7a63.9A
201364.4bcd52.6ef49.6f73.2ab68.4abc68.7abc62.8A
Average56.2B53.9B55.0B73.4A69.0A72.7A63.3
September201232.6bc29.5c28.5c34.6b31.6bc31.0bc31.3A
201342.9a44.5a41.7a44.8a43.5a42.2a43.3B
Average37.8AB37.0AB35.1B39.7A37.6AB36.6B37.3
Small letters represent the differences between the treatments within one sampling; capital letters represent the differences between the average values of the treatments within one sampling and among the average values of the years within one sampling. Values followed by the same letter are not significantly different (p ≤ 0.05).
Table 7. The effect of cover crop and nitrogen rate on soil water storage (mm) from (a) 0 to 60 cm, (b) 60 to 120 cm at Sombor in 2012 and 2013.
(a)
Soil Depth (cm)SamplingYearTreatments
Common VetchTriticaleCommon Vetch/Triticale N1N2ControlAverage
0–30March201265.0b66.3b66.7b64.6b70.0b65.5b66.4B
201377.2a78.2a80.3a78.3a78.6a77.8a78.4A
Average71.1A72.2A73.5A71.4A74.3A71.7A72.4
May201247.7c45.5c46.8c63.8b65.3b61.6b55.1B
201365.0b63.7b61.1b74.5a76.3a78.2a69.8A
Average53.9B54.6B56.4B69.1A69.9A70.8A62.5
September201251.8b46.9b29.5c47.6b47.4b46.8b45.0B
201369.2a68.7a69.2a67.1a67.3a68.5a68.4A
Average60.5A57.8A49.4B57.4A57.4A57.6A56.7
30–60March201273.0d78.4cd75.3d78.6bcd78.3cd76.7d76.7B
201385.9a84.4ab86.6a82.9abc86.0a83.5abc84.9A
Average79.4A81.4A81.0A80.8A82.1A80.1A80.8
May201255.7f47.4g48.8g69.4cd73.8bc68.7cd60.6B
201364.0de64.0de60.6ef80.9a78.8ab82.0a71.7A
Average59.9B55.7C54.7C75.1A76.3A75.4A66.2
September201248.7b47.0b32.5c46.8b41.6b46.8b43.9B
201374.9a76.9a77.5a72.3a79.0a79.0a76.6A
Average61.8A61.9A55.0B59.5AB60.3AB62.9A60.2
(b)
Soil Depth (cm)SamplingYearTreatments
Common VetchTriticaleCommon Vetch/TriticaleN1N2ControlAverage
60–90March201270.1cd67.4d68.4d68.9d70.9bcd70.1cd69.3B
201374.4ab73.8abc75.6a75.1a76.6a74.6ab75.0A
Average72.2AB70.6B72.0AB72.0AB73.7A72.4AB72.2
May201251.0c35.6e42.0d56.5b56.4b56.3b49.6B
201354.8bc55.2bc51.4c69.4a67.6a70.1a61.4A
Average52.9B45.4C46.7C62.9A62.0A63.2A55.5
September201244.0c43.9c27.8e38.1d36.9d37.9d38.1B
201364.2ab64.2ab65.2a62.1ab62.7ab61.3b63.3A
Average54.1A54.1A46.5C50.1B49.8B49.6B50.7
90–120March201265.2cd62.7d63.6d64.1d65.9cd65.2cd64.5B
201373.1a71.2ab68.7bc71.1ab71.7ab72.5a71.4A
Average69.1A67.0AB66.1B67.6AB68.8A68.9A67.9
May201253.2de38.8f40.1f49.2e52.8de51.7de47.6B
201353.6cd57.8bc53.3de62.1ab64.8a65.8a59.6A
Average53.4C48.3D46.7D55.7BC58.8A58.7AB53.6
September201246.4c42.0d26.8f40.8d36.0e39.8de38.6B
201359.3ab61.1ab61.3a60.9ab57.2b58.3ab59.7A
Average52.9A51.5AB44.0E50.9AB46.6DE49.0CD49.2
Small letters represent the differences between the treatments within one sampling; capital letters represent the differences between the average values of the treatments within one sampling and among the average values of the years within one sampling. Values followed by the same letter are not significantly different (p ≤ 0.05).
Table 8. The effect of cover crop and nitrogen rate on soil water storage (mm) from (a) 0 to 60 cm, (b) 60 to 120 cm at Senta in 2012 and 2013.
(a)
Soil Depth (cm)SamplingYearTreatments
Common VetchTriticaleCommon Vetch/Triticale N1N2ControlAverage
0–30March201278.0a77.3a78.6a77.3a77.4a77.6a77.7A
201377.7a77.1a75.8a77.2a77.0a77.1a77.0A
Average77.9A77.2A77.2A77.2A77.2A77.3A77.3
May201253.0e53.9e52.9e64.8bc63.7cd68.4abc59.5B
201362.6cd62.4cd58.1de71.1a70.7ab70.4ab65.9A
Average57.8B58.2B55.5B67.9A67.2A69.4A62.7
September201262.9bc60.1cd58.9cd58.7cd59.7cd56.7d59.5B
201366.8ab67.6ab67.7a67.9a69.1a70.0a68.2A
Average64.8A63.9A63.3A63.3A64.4A63.4A63.8
30–60March201294.6ab93.4ab96.4a91.4ab92.0ab92.1ab93.3A
201389.1c89.8bc91.3ab88.8c88.9c90.3bc89.7B
Average91.8AB91.6AB93.8A90.1B90.4AB91.2AB91.5
May201261.5cde48.0h55.7egf70.0ab70.7a71.8a71.5A
201359.5def51.7gh52.5fgh67.7abc67.7abc63.1bcd70.0A
Average60.5B49.9C54.1C68.9A69.2A67.4A70.8
September201260.8b60.5bc60.8b59.6bc54.3c58.5bc59.1B
201377.0a78.5a74.4a74.2a76.9a80.0a76.8A
Average68.9A69.5A67.6A66.9A65.6A69.2A67.9
(b)
Soil Depth (cm)SamplingYearTreatments
Common VetchTriticaleCommon Vetch/TriticaleN1N2ControlAverage
60–90March201276.2abc77.5a76.8ab75.7abc76.0abc76.1abc76.4A
201374.0bc73.2c73.0c74.6abc73.6bc74.3abc73.8B
Average75.1A75.3A74.9A75.2A74.8A75.2A75.1
May201261.5cde48.0h55.7egf70.0ab70.7a71.8a62.9A
201359.5def51.7gh52.5fgh67.7abc67.7abc63.1bcd60.4A
Average60.5B49.9C54.1C68.9A69.2A67.4A61.7
September201253.3ab55.1ab55.0ab47.0c46.5c45.9c50.4B
201355.8ab57.2a58.2a57.4a50.3bc54.0ab55.5A
Average54.5AB56.1AB56.6A52.2BC48.4C49.9C53.0
90–120March201276.2abc77.5a76.8ab75.7abc76.0abc76.1abc76.4A
201374.0bc73.2c73.0c74.6abc73.6bc74.3abc73.8B
Average75.1A75.3A74.9A75.2A74.8A75.2A75.1
May201261.5cde48.0h55.7egf70.0ab70.7a71.8a62.9A
201359.5def51.7gh52.5fgh67.7abc67.7abc63.1bcd60.4A
Average60.5B49.9C54.1C68.9A69.2A67.4A61.7
September201253.3ab55.1ab55.0ab47.0c46.5c45.9c50.4B
201355.8ab57.2a58.2a57.4a50.3bc54.0ab55.5A
Average54.5AB56.1AB56.6A52.2BC48.4C49.9C53.0
Small letters represent the differences between the treatments within one sampling; capital letters represent the differences between the average values of the treatments within one sampling and among the average values of the years within one sampling. Values followed by the same letter are not significantly different (p ≤ 0.05).
Table 9. The effect of cover crops and nitrogen rate on the changes in soil water storage (mm) for the periods March–May and May–September/October at the localities Novi Sad-Rimski Šančevi, Sombor, and Senta in 2012 and 2013.
PeriodLocalityYearTreatments
Common VetchTriticaleCommon Vetch/TriticaleN1N2Control
March–MayNovi Sad-Rimski Šančevi2012252.2245.1235.0157.9165.2144.5
2013410.0438.8449.7396.1309.9293.7
Sombor2012168.9211.0199.8140.7140.2142.7
2013327.3329.9328.9260.2230.7210.7
Senta2012200.2228.6216.4154.9152.1145.1
2013359.4366.0377.9324.8272.1262.4
May–September/OctoberNovi Sad-Rimski Šančevi2012172.7191.2206.6246.8256.0280.7
2013314.4346.2347.0385.0411.9416.9
Sombor2012140.0110.8184.2188.8209.6190.3
2013334.3394.6392.2457.7489.4499.8
Senta2012124.8101.2118.3184.1197.5201.6
2013336.2416.1410.1440.4460.0458.6
Table 10. The difference in changes in soil water storage (mm) between treatments with and without cover crops at the localities Novi Sad-Rimski Šančevi, Sombor, and Senta in 2012 and 2013.
PeriodLocation20122013
Cover CropsFallowCC-FCover CropsFallowCC-F
March–MayNovi Sad-Rimski Šančevi244.1155.988.2432.8333.299.6
Sombor193.2141.252.0328.7233.994.8
Senta215.1150.764.4367.8286.481.3
Average217.5149.368.2376.4284.591.9
May–September/OctoberNovi Sad-Rimski Šančevi190.2261.2−71.0335.9404.6−68.7
Sombor145.0196.2−51.2373.7482.3−108.6
Senta114.8194.4−79.6387.5453.0−65.5
Average150.0217.3−67.3365.7446.6−80.9
CC-cover crops, F-fallow plots (with N fertilisation and the control).

