A Novel Bandpass Filter for the Analysis of Carbon Monoxide Using a Non-Dispersive Infrared Technique


1
Department of Civil and Environmental Engineering, Konkuk University, 120 Neungdong-ro, Gwangjin-Gu, Seoul 05029, Korea
2
International Climate and Environmental Research Center, Konkuk University, 120 Neungdong-ro, Gwangjin-Gu, Seoul 05029, Korea
*
Author to whom correspondence should be addressed.
Atmosphere 2018, 9(12), 495; https://0-doi-org.brum.beds.ac.uk/10.3390/atmos9120495
Submission received: 22 October 2018
/
Revised: 30 November 2018
/
Accepted: 12 December 2018
/
Published: 14 December 2018
(This article belongs to the Section Air Quality)
Abstract
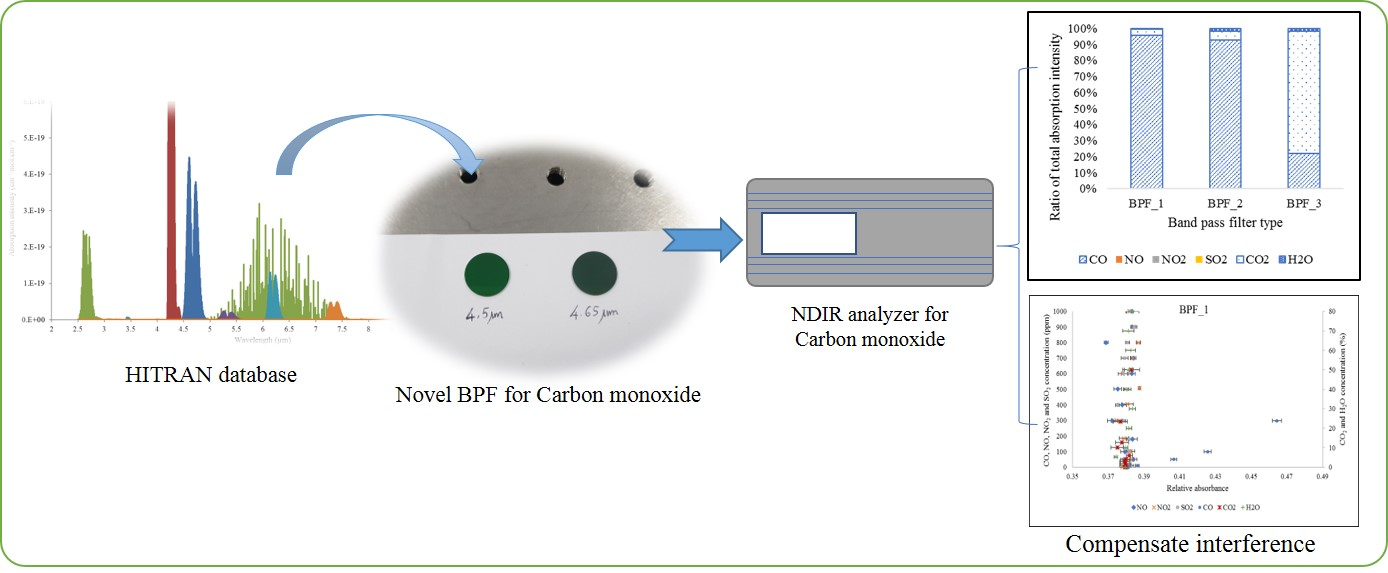
:In this study, two novel narrow bandpass filters (BPF) obtained from the high-resolution transmission molecular absorption (HITRAN) data for a carbon monoxide (CO) non-dispersive infrared (NDIR) analyzer were investigated and compared with a commercial BPF (4.64 µm). The new BPF was made using a two-cavity filter method with different center wavelengths and bandwidths from the commercial BPF. The wavelengths of the two BPFs were 4.5 µm and 4.65 µm. The gas emission pattern of a coal-fired power plant was used as a case study. Various concentrations of target gases were used to theoretically estimate the interference, and to practically determine it. It was found that although the transmittances of the two new BPFs were lower than that of the commercial BPF, the signal-to-noise ratio caused by two novel BPFs was approximately 20. In terms of interference effect, carbon dioxide (CO2) was found as a strong interfering gas on the commercial BPF at 4.64 µm and the new BPF at 4.65 µm. In contrast, the new BPF at 4.5 µm cut off the interference effect of all target gases. The measurement error of the NDIR analyzer applying the BPF at 4.5 µm was similar to that of gas filter correlation (GFC) NDIR and was less than 1%. This indicates that the novel BPF at 4.5 µm can be used instead of a GFC for a CO NDIR analyzer, thus overcoming the limitations of using a GFC.

1. Introduction
Carbon monoxide (CO), which is produced mainly from the combustion process, is a toxic gas when its concentration is >35 ppm [1]. Besides being a greenhouse gas, CO has an important role in atmospheric chemistry [2,3,4]. CO has also been widely considered as a signature means of detecting fires [5,6]. Therefore, monitoring CO is an important issue. In the monitoring of CO, two main methods have been used: gas chromatographic technologies (e.g., gas chromatography-flame ionization detectors, gas chromatography-electron capture detectors, gas chromatography-mercuric oxide detectors and gas chromatography-mass spectrometry) and spectroscopic technologies (e.g., gas filter correlation (GFC)-NDIR, Fourier-transform infrared spectroscopy, tunable diode laser spectroscopy, and resonance fluorescence) [2]. Among these instruments, NDIR has been widely used for field monitoring of CO because its optics and detecting system are less complicated than that of other instruments [7]. Furthermore, NDIR technique is also suitable for in situ application because it is often less bulky than gas chromatographic technologies. In addition, the GFC-NDIR method is well-known as a standard method for monitoring CO [8].
The principle of the NDIR technique is based on the Beer–Lambert law [9],
where I is the intensity of light after penetrating the target gas, I0 is the initial intensity from the infrared (IR) source, k is the absorption coefficient for a specific gas and filter combination, C is the concentration of the target gas, L is the path length between the IR source and detector, and kL is defined as the sensitivity of the sensor [10].
I = I0 × exp(−kCL)
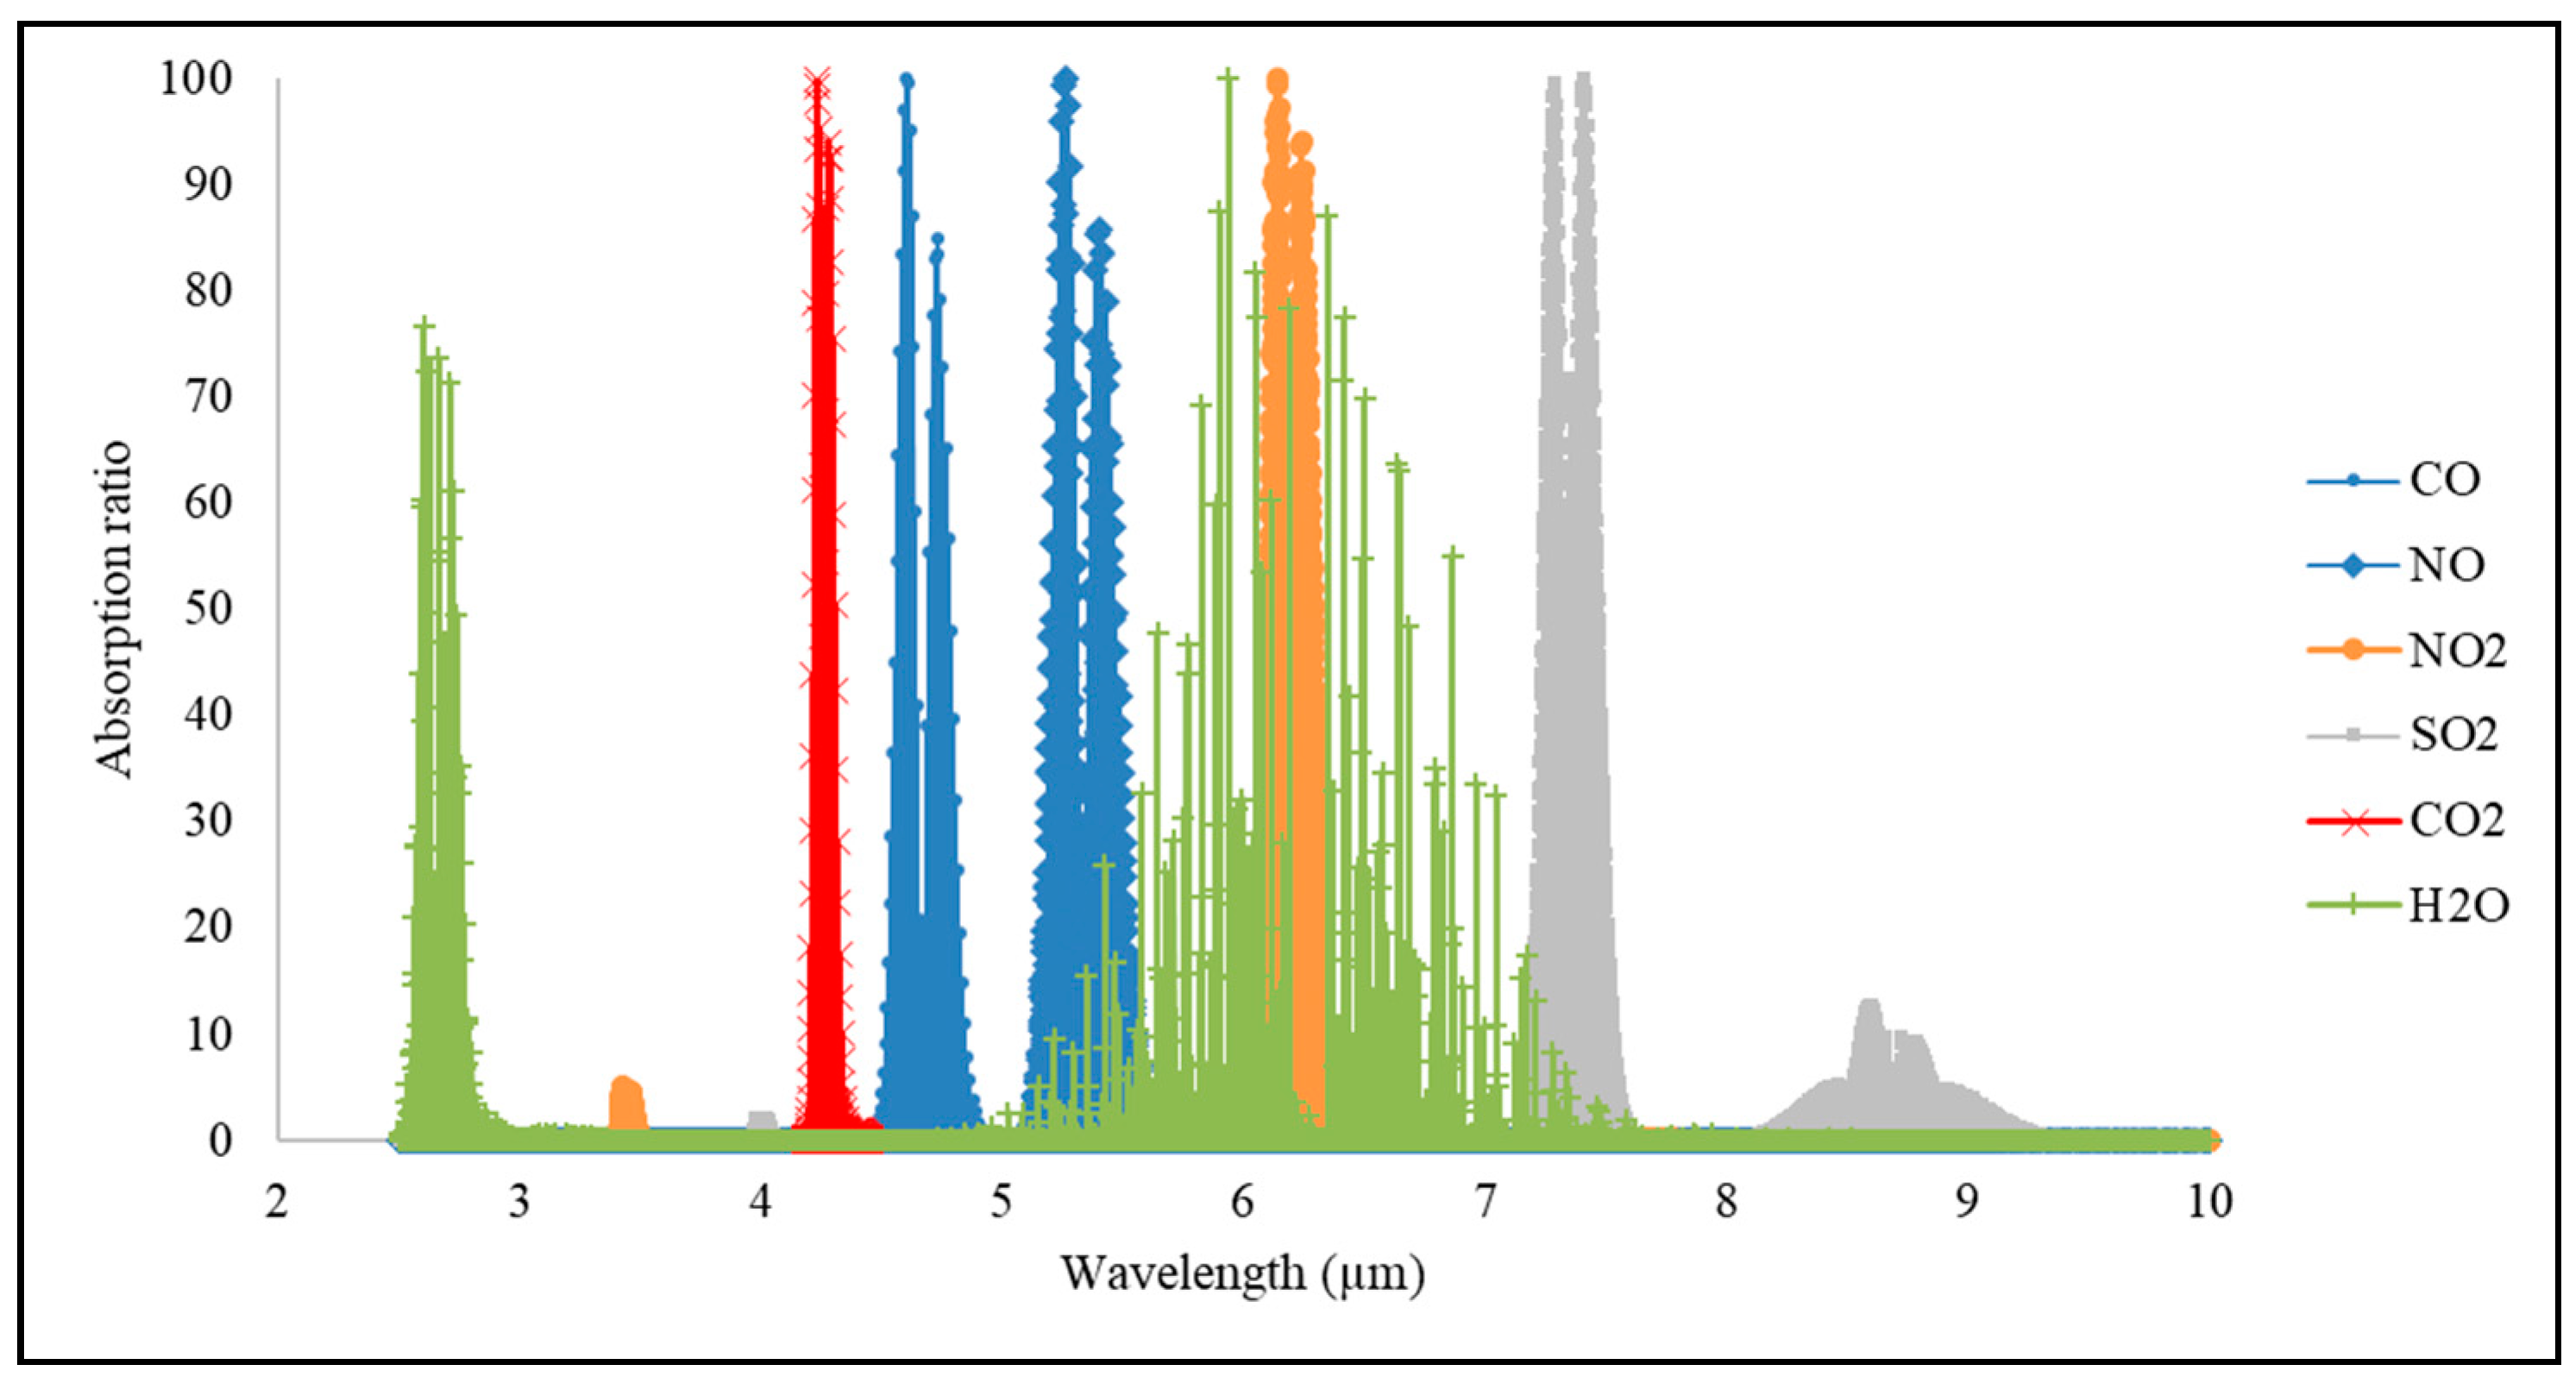
Interference is one of the main issues with the NDIR technique. Figure 1 shows the absorption ratios of several compounds emitted from a coal-fired power plant.
As shown in Figure 1, the spectra of NO, NO2, and SO2 overlapped with H2O. Hence, the analysis of these gases using NDIR would result in bias. Likewise, CO2 caused an interference error for CO. To overcome this interference issue, new developments within the NDIR technique have evolved. A review on the development of the NDIR technology can be found elsewhere [12]. The general improvement of the CO NDIR analyzer is shown in Table 1.
Although the interference effect is a pivotal issue for the NDIR analyzer, development of the CO NDIR analyzer has not advanced as much as the development of the sensor. The reason is that the GFC is the best available method to compensate for the interference in a CO NDIR analyzer, especially for an unknown emission source. However, the GFC method has limitations, such as gas leaks and a limited correction range [18]. Using a multi-bandpass filter is a good method, but leads to a cost increase, which is another issue. Therefore, this study was carried out to develop a non-interference bandpass filter (BPF) based on the high-resolution transmission molecular absorption (HITRAN) database for a CO NDIR analyzer of a continuous monitoring system. The scope of this study was the gas emission patterns of a coal-fired power plant.
2. Material and Methods
2.1. Apparatus
A GFC-NDIR analyzer (NMA-N500, Nara Controls Inc., Seoul, Korea) was used and modified for this study. Information about the analyzer is shown in Table 2.
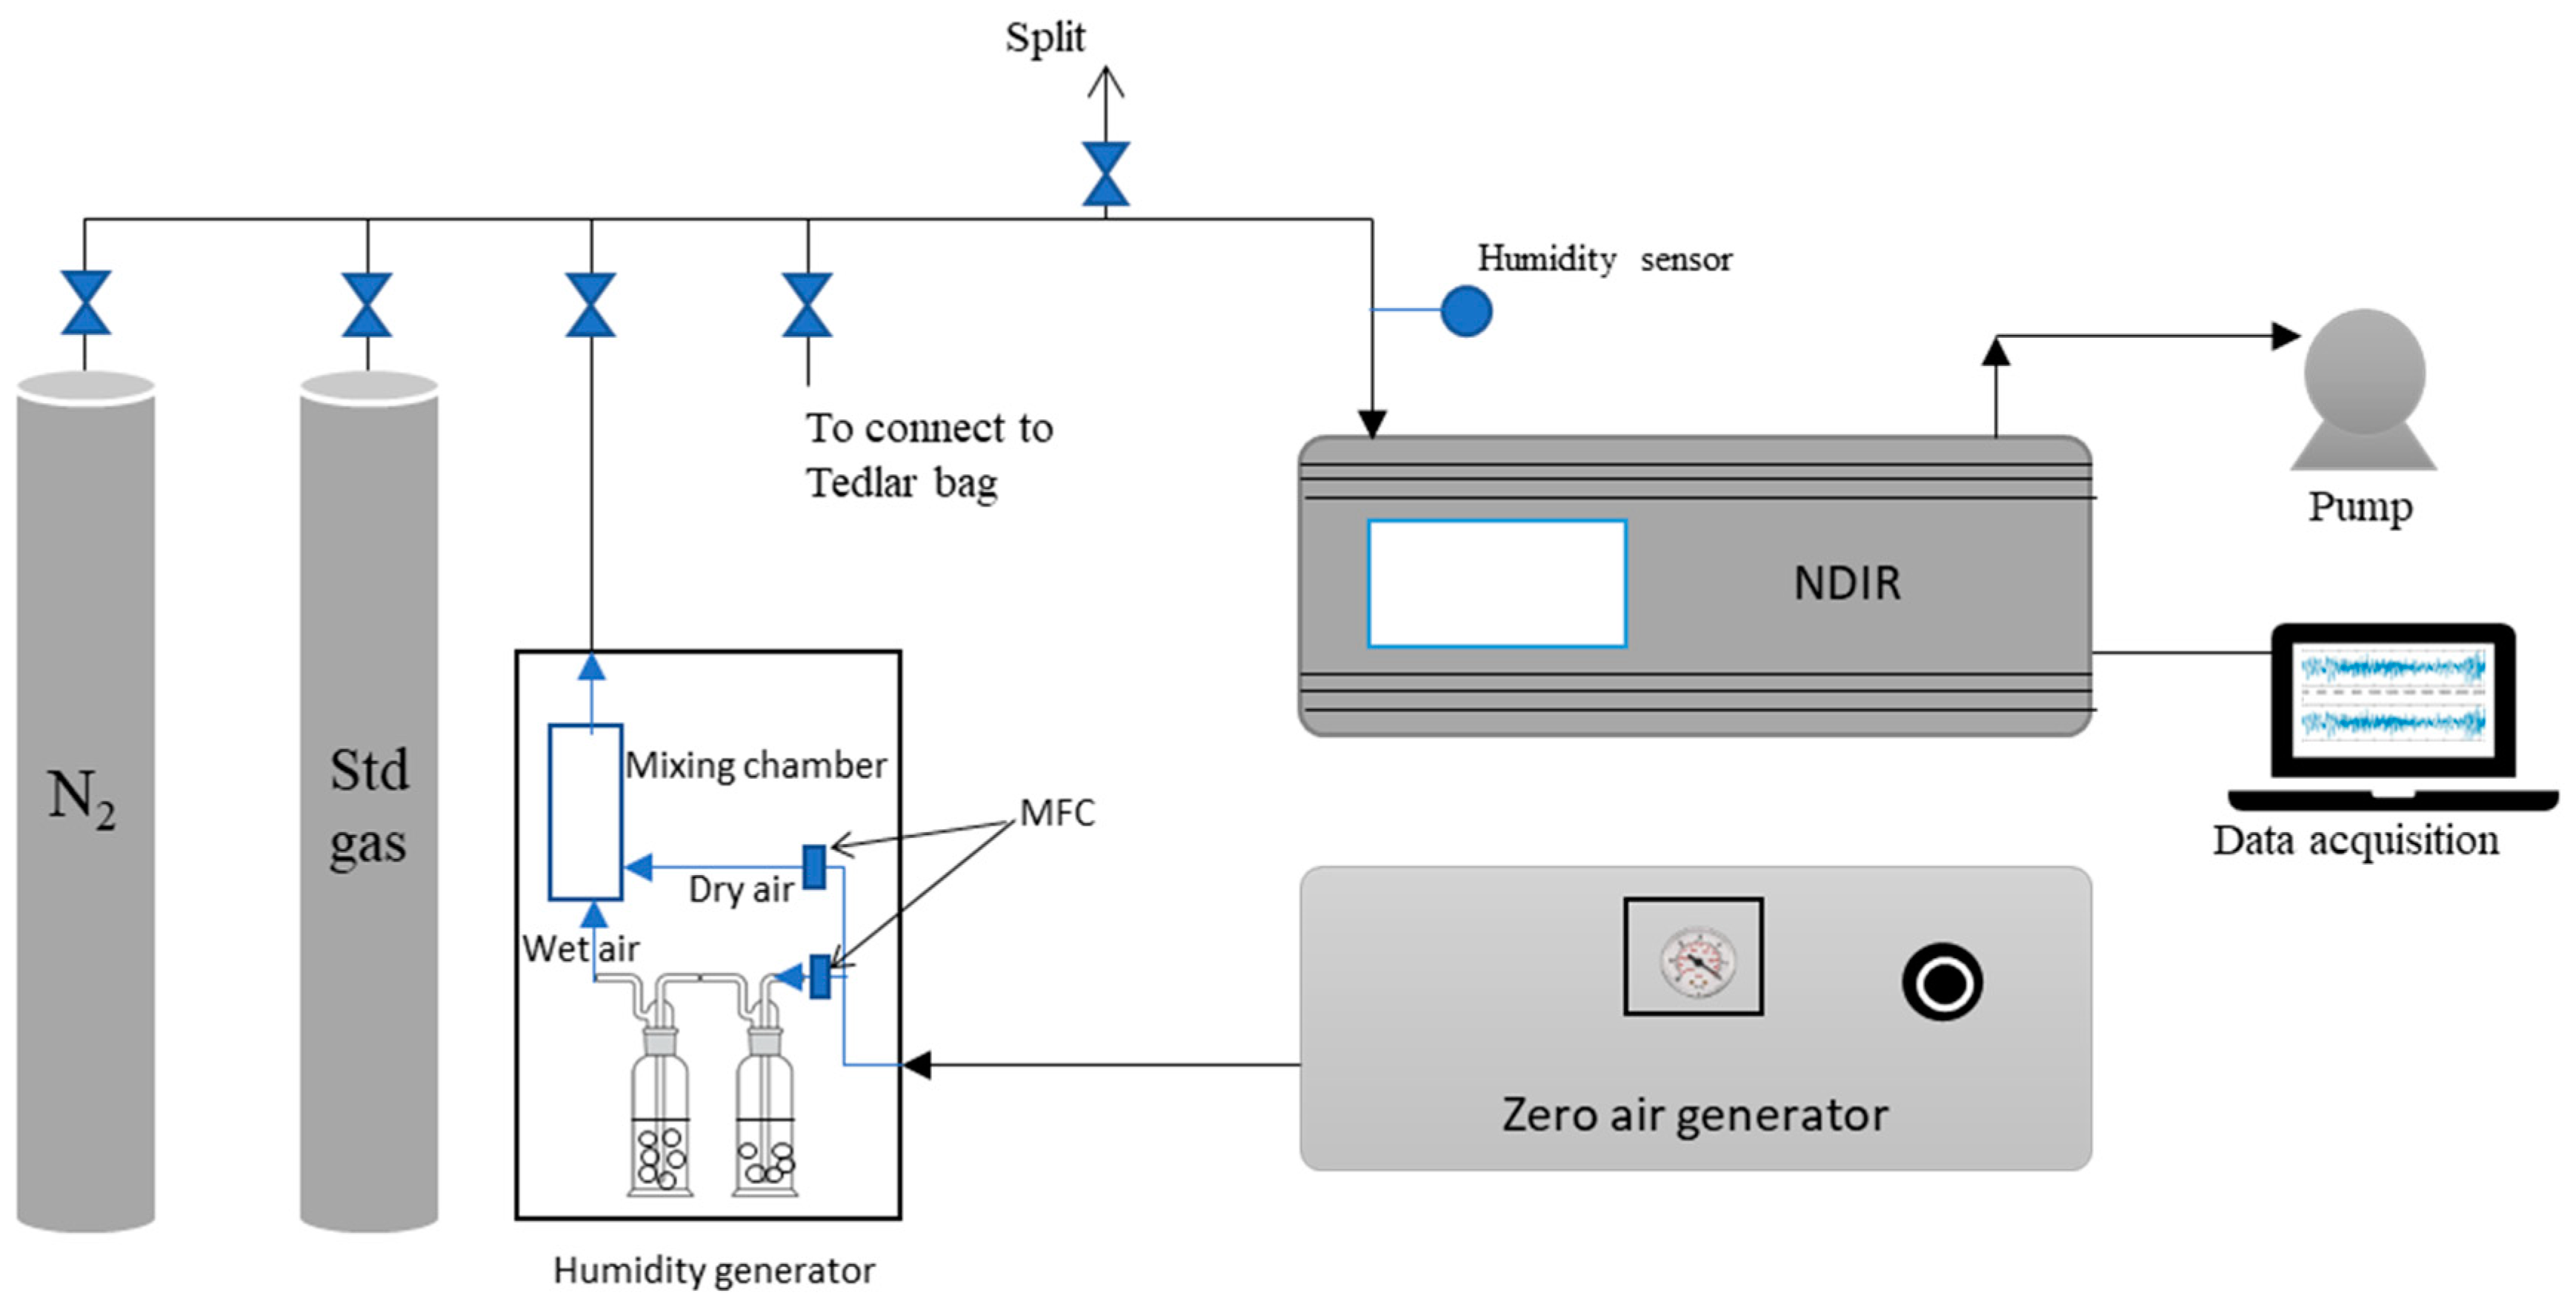
Figure 2 depicts the experimental set-up. Standard gases were purchased from Rigas Co., Ltd., Daejeon, Korea, which were produced based on the gravimetric method [19] (ISO 6142-1:2015). Humidity was produced using the bubble method at 25 °C (see Figure 2). The humidity was measured by a humidity sensor (645, Testo SE & Co. KGaA, Lenzkirch, Germany). Several gas mixtures were also used to investigate the response of the analyzer. A 25-L Tedlar bag (SKC Inc., Pittsburgh, PA, USA) was used to store the mixtures. They were re-checked by a multi-gas analyzer (60i, Thermo Fisher Scientific, Waltham, MA, USA). The experiment was repeated 3 times. The relative standard deviation of the repeated experiments was less than 1%. The transmittances of BPFs were measured using Fourier-transform infrared spectroscopy (FTIR) (MB3000, ABB Group, Mannheim, Germany).
2.2. Investigation of the Non-Interfering Wavelength for CO Gas Emitted from a Coal-Fired Power Plant
A case study on the gases emitted from a coal-fired power plant was conducted. Untreated gases emitted from a coal-fired power plant consist typically of 3 to 4% oxygen, 0–20 ppm of CO, 15 to 16% CO2, 5–7% H2O (vapor), approximately 73% N2, 0–1000 ppm of SO2, and 0–500 ppm of NOx [20,21]. Therefore, CO, CO2, NOx (NO + NO2), SO2, and H2O (vapor) were used as the target gases in this study. N2O is an interference gas for CO [13,15]. However, the emission of N2O from the combustion process was not a significant amount [15]. Therefore, the effect of N2O on CO measurement in this case was neglected.
The line-by-line absorption intensity from the HITRAN database [11] (hitran.org; Atomic and Molecular Physics Division, Harvard-Smithsonian Center for Astrophysics, Cambridge, MA, USA) was used as a reference. Since the main infrared (IR) absorption of CO is approximately 4.5 to 5.0 μm (see Figure 1), the wavelengths of 2.5 to 10 μm from the HITRAN database were considered. From the line-by-line absorption intensity, the maximum value of each gas was determined. Since different gases demonstrated different absorption levels, the absorption ratio was estimated for easy comparison. For a certain gas, the absorption ratio at a spectral line was the fraction of that line’s absorption intensity and the maximum adsorption intensity of that gas. All absorption ratios which were >0.1% (i.e., 99.9% of absorbance) of all target compounds were scanned and matched to find the non-interfering range. Then, novel BPFs based on this range were made by the Seoul Precision Optics Co., Ltd., Shiheung, Korea.
Generally, the absorbance (A) of a gas can be obtained from the transmittance (T) through the following relationship.
T = I/I0 = 10−A
From Equations (1) (see Section 1) and (2), the relationship between gas absorbance and its concentration can be derived as
where ε = log(e) × k = 0.43 k.
A = log (I0/I) = εCL
Since k is the absorption coefficient for a specific gas and filter combination [9], the transmittance and bandwidth of the BPF should be considered. Within the spectral range of a certain BPF, there are many line-by-line spectra with different absorption intensities. Therefore, a total absorption intensity was calculated. The total absorption intensity of a gas with respect to a certain BPF was calculated to compare the effects of interferences [22]. The total absorption intensity was calculated based on Equation (4). The average transmittance was used because the transmittance displayed in the line-by-line spectra varied within the BPF spectral range. Therefore, using the average transmittance was better than using the maximum transmittance.
where is the integration of all line-by-line absorption intensities from HITRAN database of each gas from line 1 to line n within each BPF spectral range (cm−1/molecule.cm−2), Ngas is the number of molecules of that gas (i.e., the number of molecules was converted from the concentration because the absorption intensity from HITRAN was calculated based on molecule) (molecule), T’ is the average transmittance of the BPF (unitless) and L is the optical pathlength of the gas chamber (cm).
On the other hand, the signal-to-noise ratio (S/N), which is a more useful variable than only noise, is also an important factor in determining the quality of an instrument [23,24]. S/N should be higher than 3 in order to detect a signal [24]. The S/N depends on many factors. In terms of the BPF, the S/N caused by the BPF is proportional to the detectivity of the detector, which is presented through the following equation [23,25]
where S/N is the signal-to-noise ratio, D* is the detectivity of the detector, Ad is the active area of the detector, Pin is the IR intensity reaching the detector, and ∆f is the bandwidth.
Since the same detector and IR source were always used for all experiments, the S/N fraction of the 2 BPFs could be derived as follows:
where ΔfBPF1 and ΔfBPF2 are the bandwidths of bandpass filter 1 (BPF1) and bandpass filter 2 (BPF2), respectively and T1 and T2 are the average transmittances of BPF1 and BPF2, respectively. The average transmittance was employed instead of the radiant input because an identical IR source was used to supply the same IR radiant. In this equation, the bandwidth is the most important factor because the bandwidths of new BPFs were much lower than that of the commercial one while their transmittances were not much different.
For a direct current (DC) signal, S/N can be practically observed from a variety of signals as follows [24].
where is the mean of signal and σS is the signal standard deviation.
Accordingly, the sensitivity, theoretical and experimental interference, and theoretical and experimental S/N of the 2 new BPFs and a commercial BPF were evaluated and compared.
2.3. Production of Novel BPFs
The new BPFs were made based on the results from Section 2.2. The novelty of these BPFs was their center wavelength and bandwidth. In general, BPFs at 4.64 μm or 4.75 μm have been widely used for CO analysis using the NDIR techniques, whereas the new BPFs had wavelengths of 4.5 and 4.65 μm. In addition, the bandwidths of new BPFs were narrower than those of the commercial BPFs. The optical properties of the new BPFs will be introduced in more detail in Section 3.1. Two-cavity filter method was used to make the new BPFs with Germanium substrate and SiO coating material.
2.4. Investigation of the Effect of Interfering Gas on the Novel BPFs
A commercial BPF at 4.64 μm (180 nm) (NBPF 4.64; Seoul Precision Optics Co., Ltd., Shiheung, Korea) was selected to compare with the new BPFs. The description of the novel BPF will be introduced in more details in Section 3.1. Each BPF was applied to the NDIR analyzer to investigate its performance. Various concentrations of target gases were introduced into the analyzer to investigate the interference. The N2 gas (99.999%, Dong A Co., Ltd., Gyeonggi, Korea) and CO standard gases at 10, 50, 100, and 298 ppm (Rigas Co., Ltd., Daejeon, Korea) were used to calibrate the analyzer. Based on the literature [20,21], the NO, NO2, and SO2 levels were varied from 1 to 1000 ppm (Rigas Co., Ltd., Daejeon, Korea), and CO2 levels were varied from 1 to 50% (Rigas Co., Ltd., Daejeon, Korea) to investigate the interference effect. In general, a cooler or a membrane is usually used to remove the H2O vapor before introducing the gas stream into the analyzer. Hence, it was presumed that the inlet air of the analyzer would be dry. However, these instruments could not completely remove all H2O vapor. Accordingly, we assumed that the inlet H2O vapor concentration of the analyzer was less than 25,800 ppm at 25 ± 2 °C. The H2O vapor levels, which were directly introduced into the analyzer, were varied from 1400 to 23,000 at 25 °C in this study.
Several gas mixtures were also used to investigate the performance of the analyzer with the original structure (i.e., GFC-NDIR), the novel BPF, and the BPF at 4.64 μm. Based on the Korean emission regulations for a new coal-fired power plant, the SO2 and NOx concentrations should be ≤50 ppm [26]. Moreover, CO and CO2 concentrations were selected based on the literature [20,21] because there were no emission regulations for these gases. Consequently, gas mixtures consisting of CO (10, 100, and 200 ppm), NO (50 ppm), CO2 (15%), NO2 (50 ppm), SO2 (50 ppm), and H2O (~14,360 ppm) were generated and introduced into the analyzer to determine the measurement errors. The measurement errors were obtained from the relative percent difference between the standard gas and the analytical results. NO, CO, NO2, and SO2 were diluted from 2000 ppm of the standard gases (Rigas Co., Ltd., Daejeon, Korea). CO2 was diluted from 50% of the standard gas (Rigas Co., Ltd., Daejeon, Korea). H2O was diluted from 80% of relative humidity. N2 was used as the balancing gas. A 25-L Tedlar bag was used to prepare gas mixtures. N2 was introduced into the Tedlar bag with the flow rate controlled by a mass flow controller (M3030VA, Line Tech Ltd., Co., Daejeon, Korea). Standard gas samples were introduced into the Teblar bag with a 500 mL glass syringe (500MAR-LL-GT, SGE Analytical Science Pty. Ltd., Ringwood, Australia). Each gas was introduced into the NDIR analyzer for 15 min. Results from the first 5 min were ignored due to equilibrium concentration in the analyzer. The values from the last 10 min were collected. Each experiment was repeated 3 times. The signal was recorded every second. The relative absorbance of each gas was practically calculated based on the log of the detector signal from the reference channel to the detector signal from the CO channel.
3. Results and Discussion
3.1. Non-Interfering Wavelengths for CO Gas Emitted From a Coal-Fired Power Plant
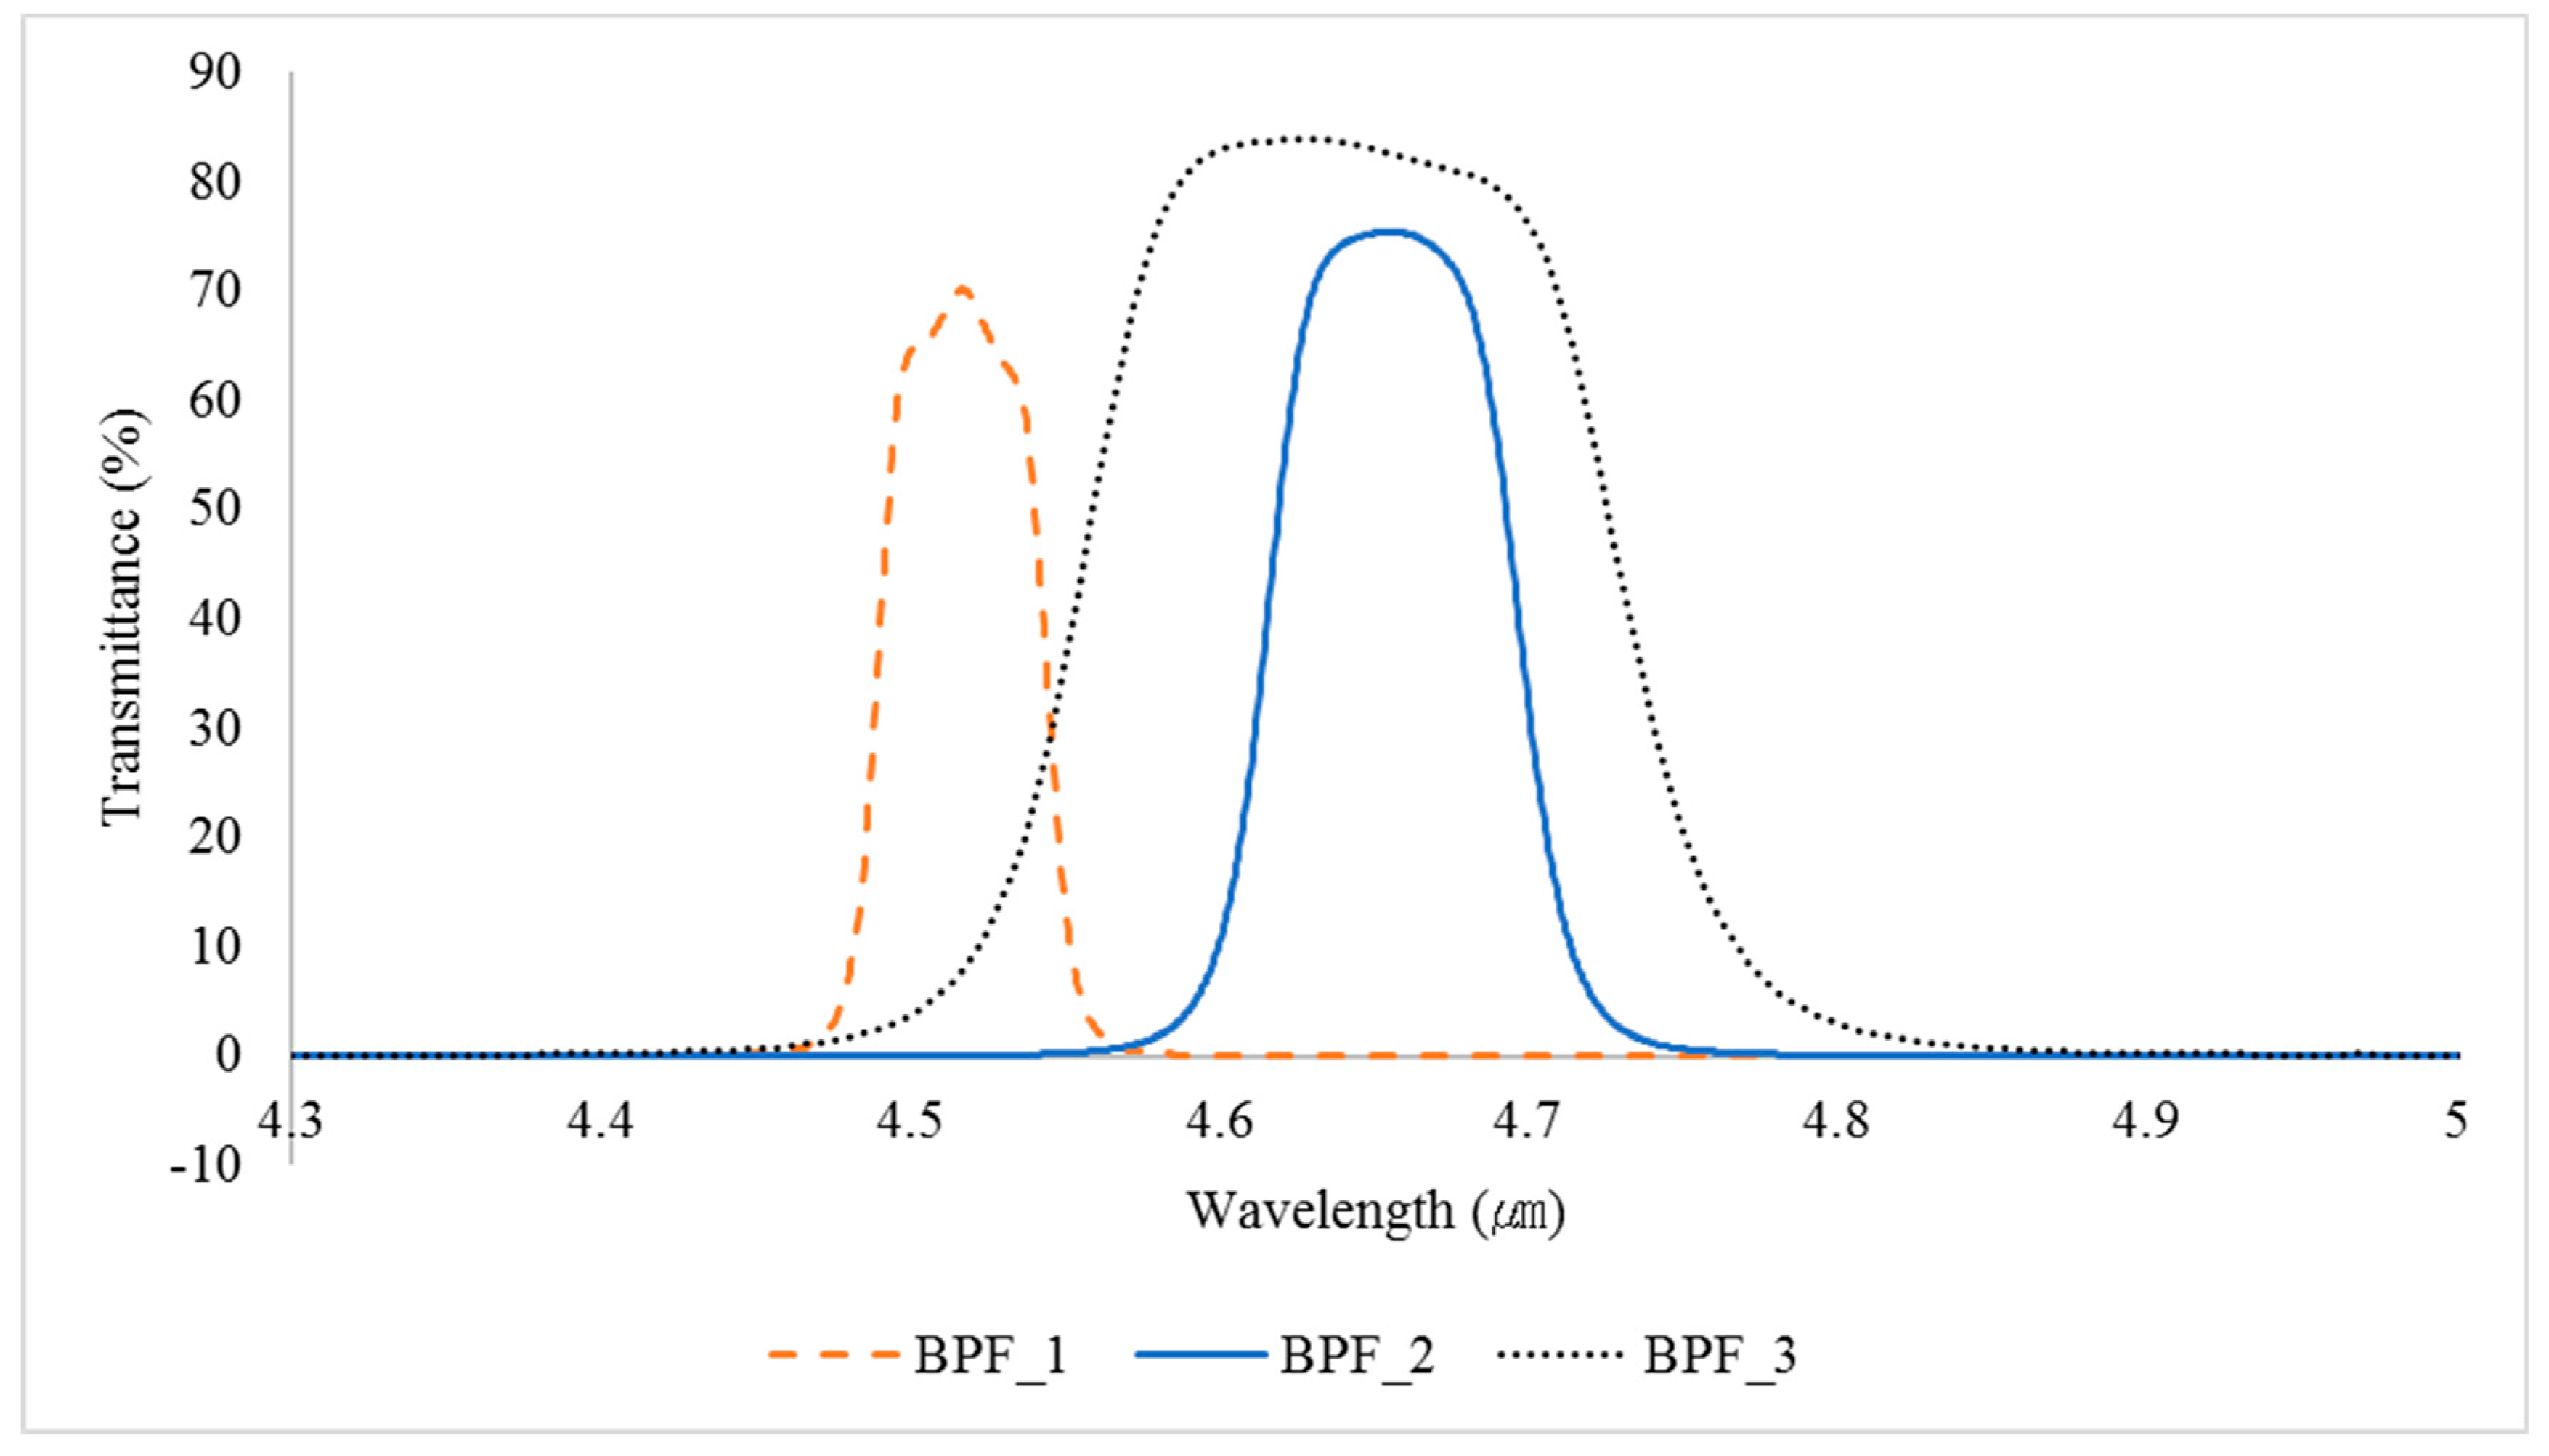
From the HITRAN, the non-interfering wavelengths for CO in the presence of CO2, NOx, SO2, and H2O were found to be in the range of 4.76–4.78 (bandwidth = 20 nm), 4.55–4.75 (bandwidth = 200 nm), and 4.46–4.54 μm (bandwidth = 80 nm). Due to technical limitations, a new BPF at 4.5 μm (i.e., BPF_1) with a half bandwidth of 50 nm and a new BPF at 4.65 μm (i.e., BPF_2) with a half bandwidth of 60 nm were manufactured. In general, a BPF filter consists a sort of thin-film layers. The bandwidth of the BPF depends on the number of layers. The more thin-film layers there are, the narrower the bandwidth of the BPF is. However, the transmittance of the BPF is also influenced by the BPF thickness and the tolerance of the coating process [27]. Therefore, it is a challenge to reduce the bandwidth as much as the values above while maintaining a high transmittance. The transmittance should be high enough to retain a good S/N ratio for the analyzer. The commercial BPF at 4.64 μm with a half bandwidth of 180 nm was labelled as BPF_3. The transmittances of three BPFs are presented in Figure 3.
As shown in Figure 3, the full bandwidth at transmittance ≥0.1% of the two new BPFs was much narrower than that of BPF_3. The full bandwidths of the BPF_1, BPF_2, and BPF_3 were 141, 262, and 567 nm, respectively. Table 3 shows a summary of the specifications for each BPF. The maximum transmittances of the BPF_1 and BPF_2 did not differ greatly from that of BPF_3. The average transmittances of BPF_1, BPF_2, and BPF_3 were 26.8%, 24.6%, and 27%, respectively. With the optical path length of 8 m, the values for sensitivity kL of BPF_1, BPF_2, and BPF_3 were 5.45 × 10⁻¹⁶, 1.82 × 10⁻¹⁵, and 2.19 × 10⁻¹⁵ (1/molecule·cm−2) respectively. This indicates that the sensitivity of BPF_3 was four times higher than that of BPF_1 and 1.2 times higher than that of BPF_2. However, the theoretical fraction of S/NBPF_3 to S/NBPF_1 was only 0.50, and that of S/NBPF_3 to S/NBPF_2 was only 0.74. The theoretical S/NBPF_3 was not much different from the new BPFs because its average transmittances were similar to that of others. From Equation (7), the practical S/N of BPF_1, BPF_2, and BPF_3 were calculated as 20.0, 19.6, and 49.7, respectively. In the experimental results, the S/N caused by BPF_3 was approximately 2.5 times higher than that caused by BPF_1 and BPF_2 due to their relatively lower values for maximum transmittance. However, these S/N values were much higher than 3. Therefore, these new BPFs can be applicable [24].
Although BPF_1 and BPF_2 were made with very narrow half bandwidths, their real full bandwidth was still over the range estimated from HITRAN. Hence, the theoretical and practical interference should be investigated. The theoretical interference is discussed in this section. The practical interference will be discussed in Section 3.2. Based on the absorption intensity from HITRAN, the optical path length of the analyzer, the average transmittance of BPFs, and the various concentrations of target gases, the total absorption intensity of each gas was evaluated. These values are depicted in Figure 4.
As shown in Figure 4, NO, NO2, and SO2 did not reveal significant effects on any BPFs. H2O had a slight effect on BPF_2 at low concentrations of CO. CO2 showed a strong effect on CO measurement. This cross-interference between CO and CO2 is well-known [13,14,15]. The CO2 gas demonstrated a strong effect on BPF_3 because the linear regression of CO2 was the closest to that of CO (i.e., the slope between two curves was 2.3 × 10⁻⁴). In contrast, CO2 showed less effect on BPF_1 and BPF_2. At 50% CO2, the slope between two curves at BPF_1 was about 0.074 and that at BPF_2 was approximately 0.017. This indicates that BPF_1 reduced more interference effect than the other two BPFs.
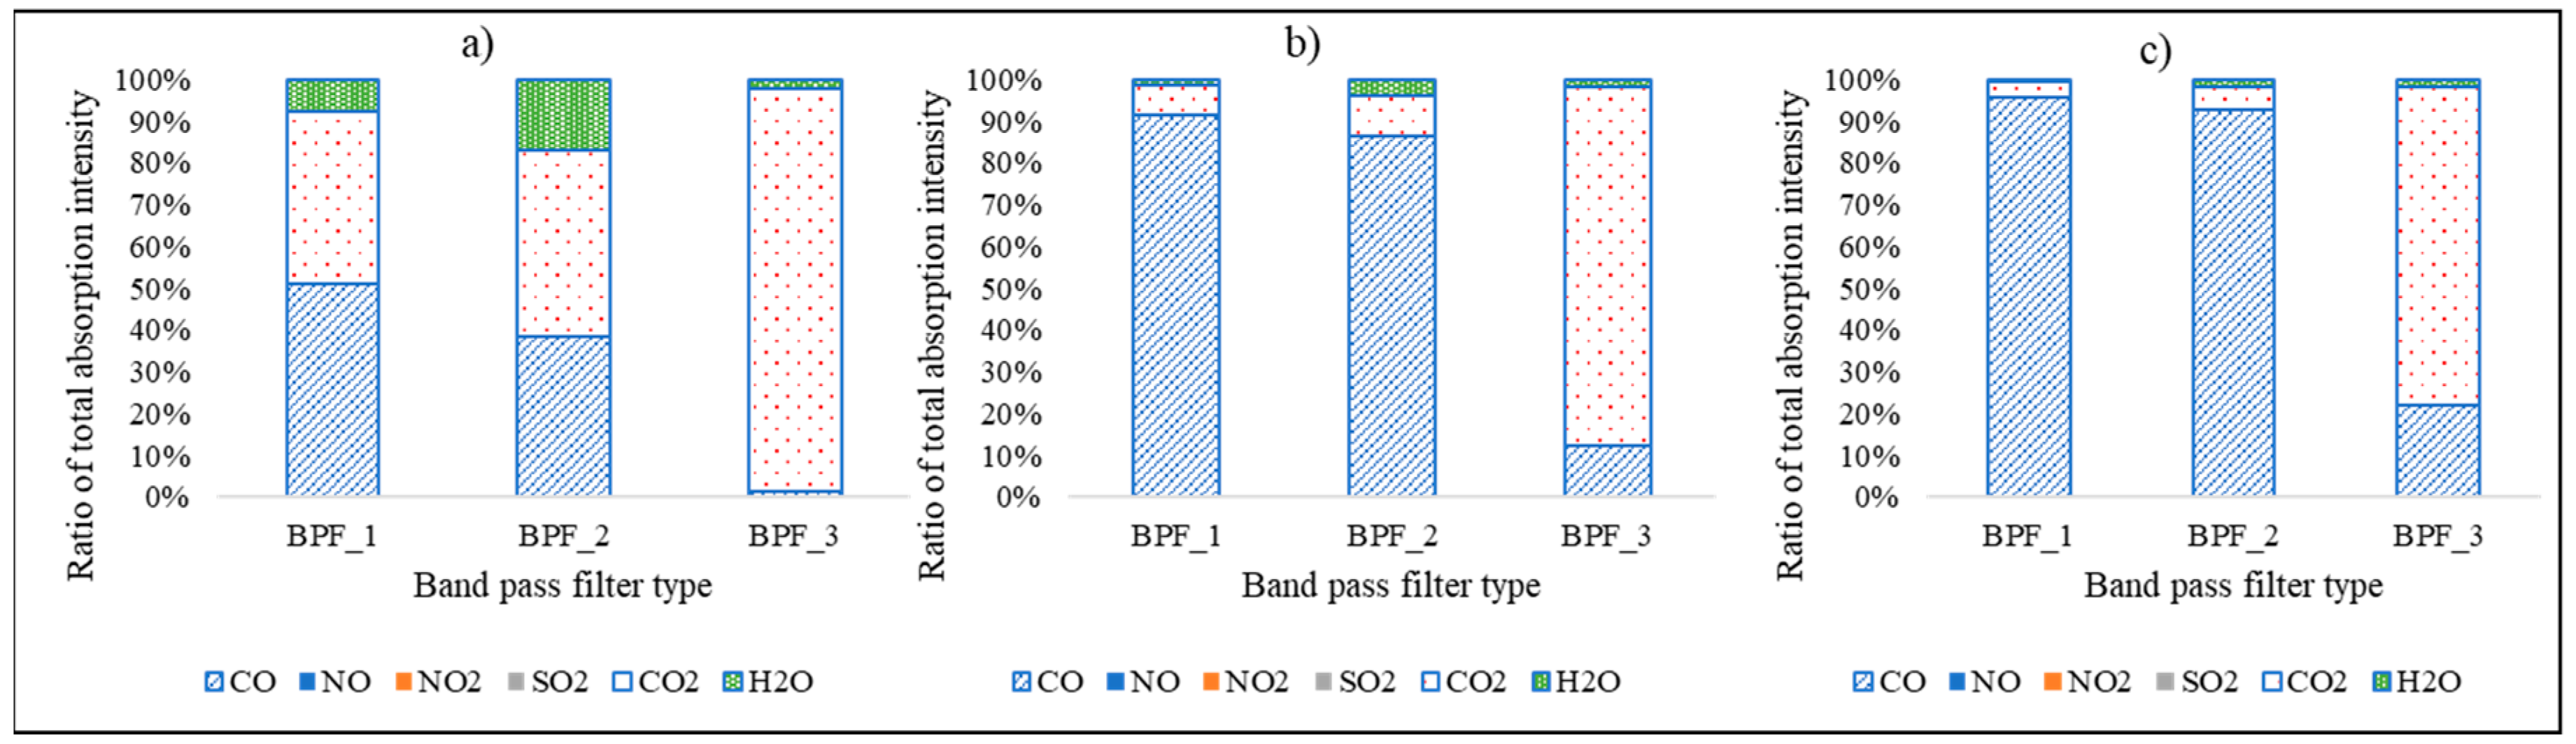
The interference ratios caused by mixing gases were also estimated. The concentration of target gases in the mixture was described in Section 2.3. The interference ratios are depicted in Figure 5.
As shown in Figure 5, at 10 ppm of CO, CO2 revealed significant interference on all BPFs. However, the lowest effect appeared on BPF_1. On the other hand, H2O showed significant effects on BPF_2. The higher the CO concentration, the lower the effect of CO2. At 100 ppm of CO, CO2 denoted the lowest effect on BPF_1, followed by BPF_2 and BPF_3. At 200 ppm of CO, CO2 showed less effect on both of BPF_1 and BPF_2. In all cases, CO2 demonstrated significant effects on BPF_3. In terms of H2O, significant effects on all BPFs could not be found at high CO concentrations. Although the full bandwidth was large, BPF_1 compensated more for the interference effect of CO2 and H2O than the other two BPFs.
3.2. Effect of Target Gases on the Novel BPFs
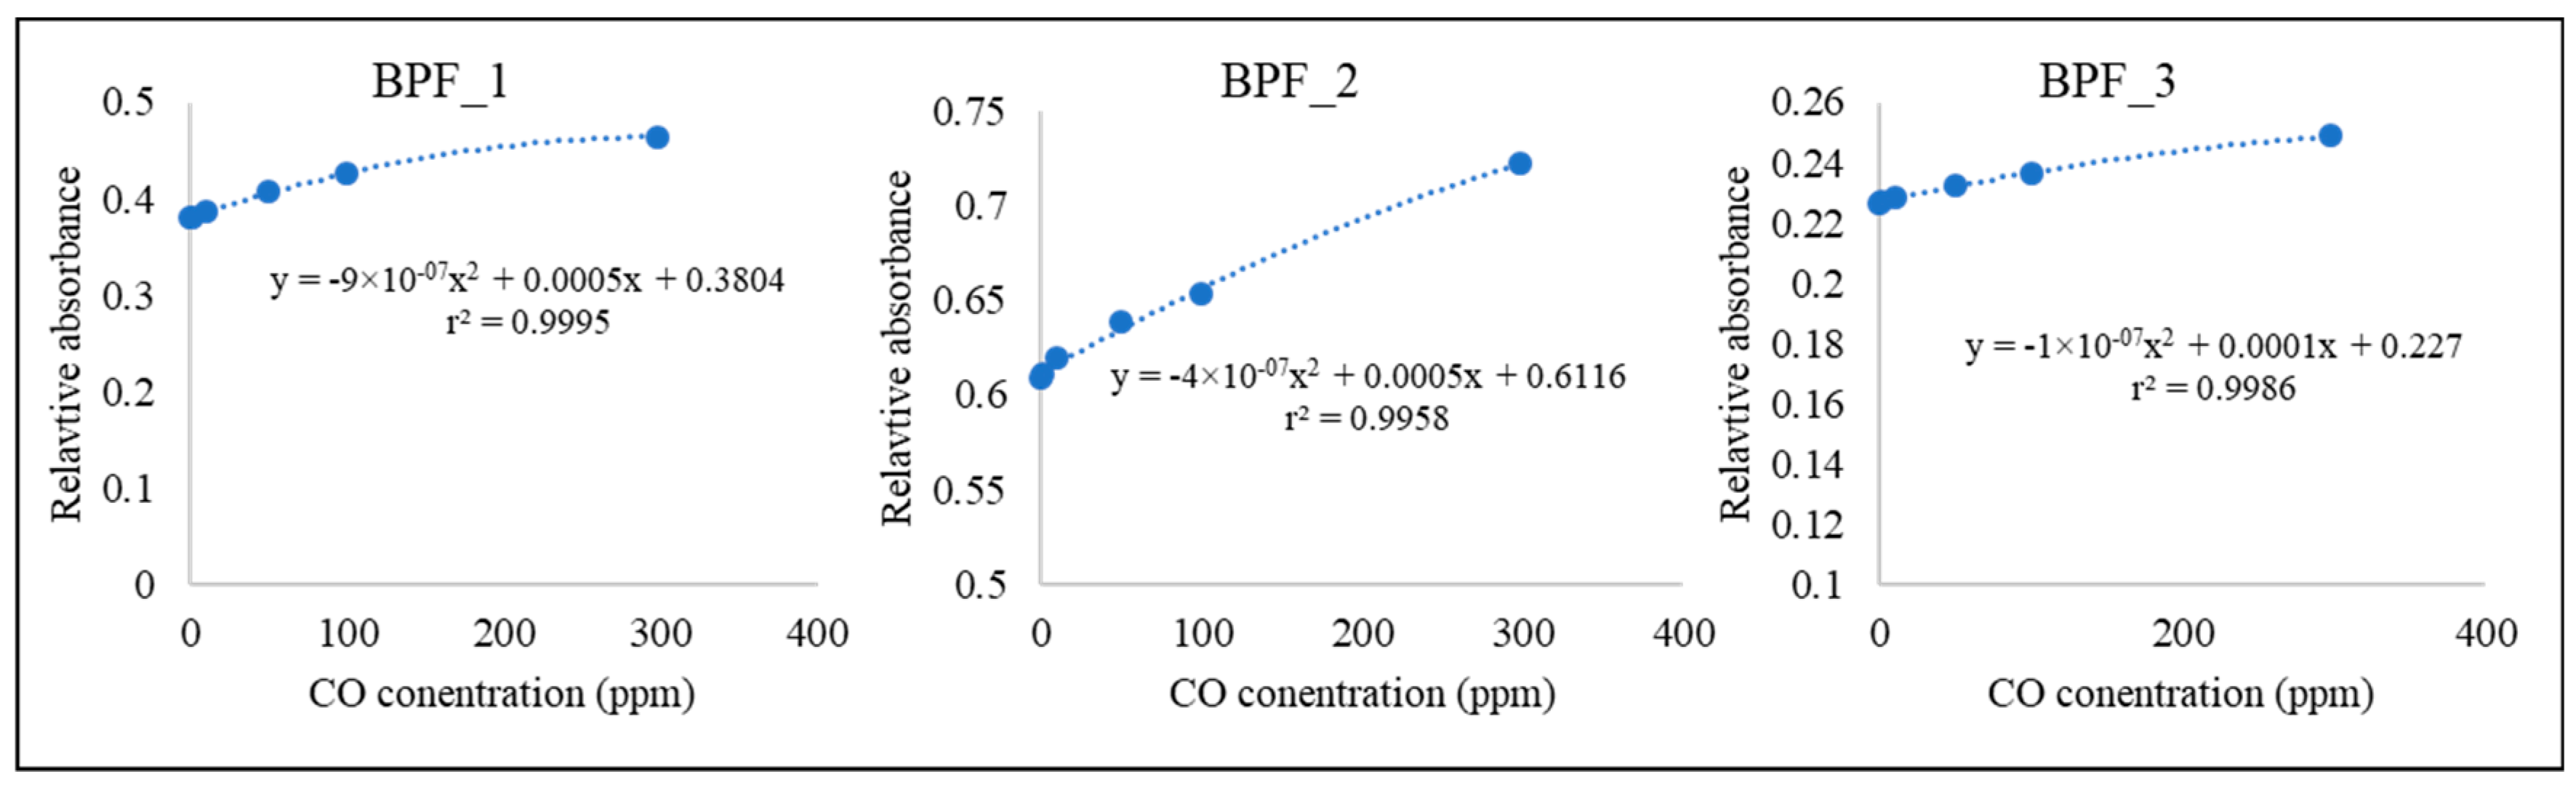
Various concentrations of a single target gas were used to determine the real interference effect on new BPFs, as well as the commercial BPF. The CO calibration curves are presented in Figure 6. Relative absorbances were calculated from the log of ratio values between detector signals from the reference channel (i.e., reference BPF at 3.95 µm) and detector signals of the CO measurement channel (i.e., BPF of CO gas). It was found that all BPFs showed good performance in terms of calibration (r2 > 0.99).
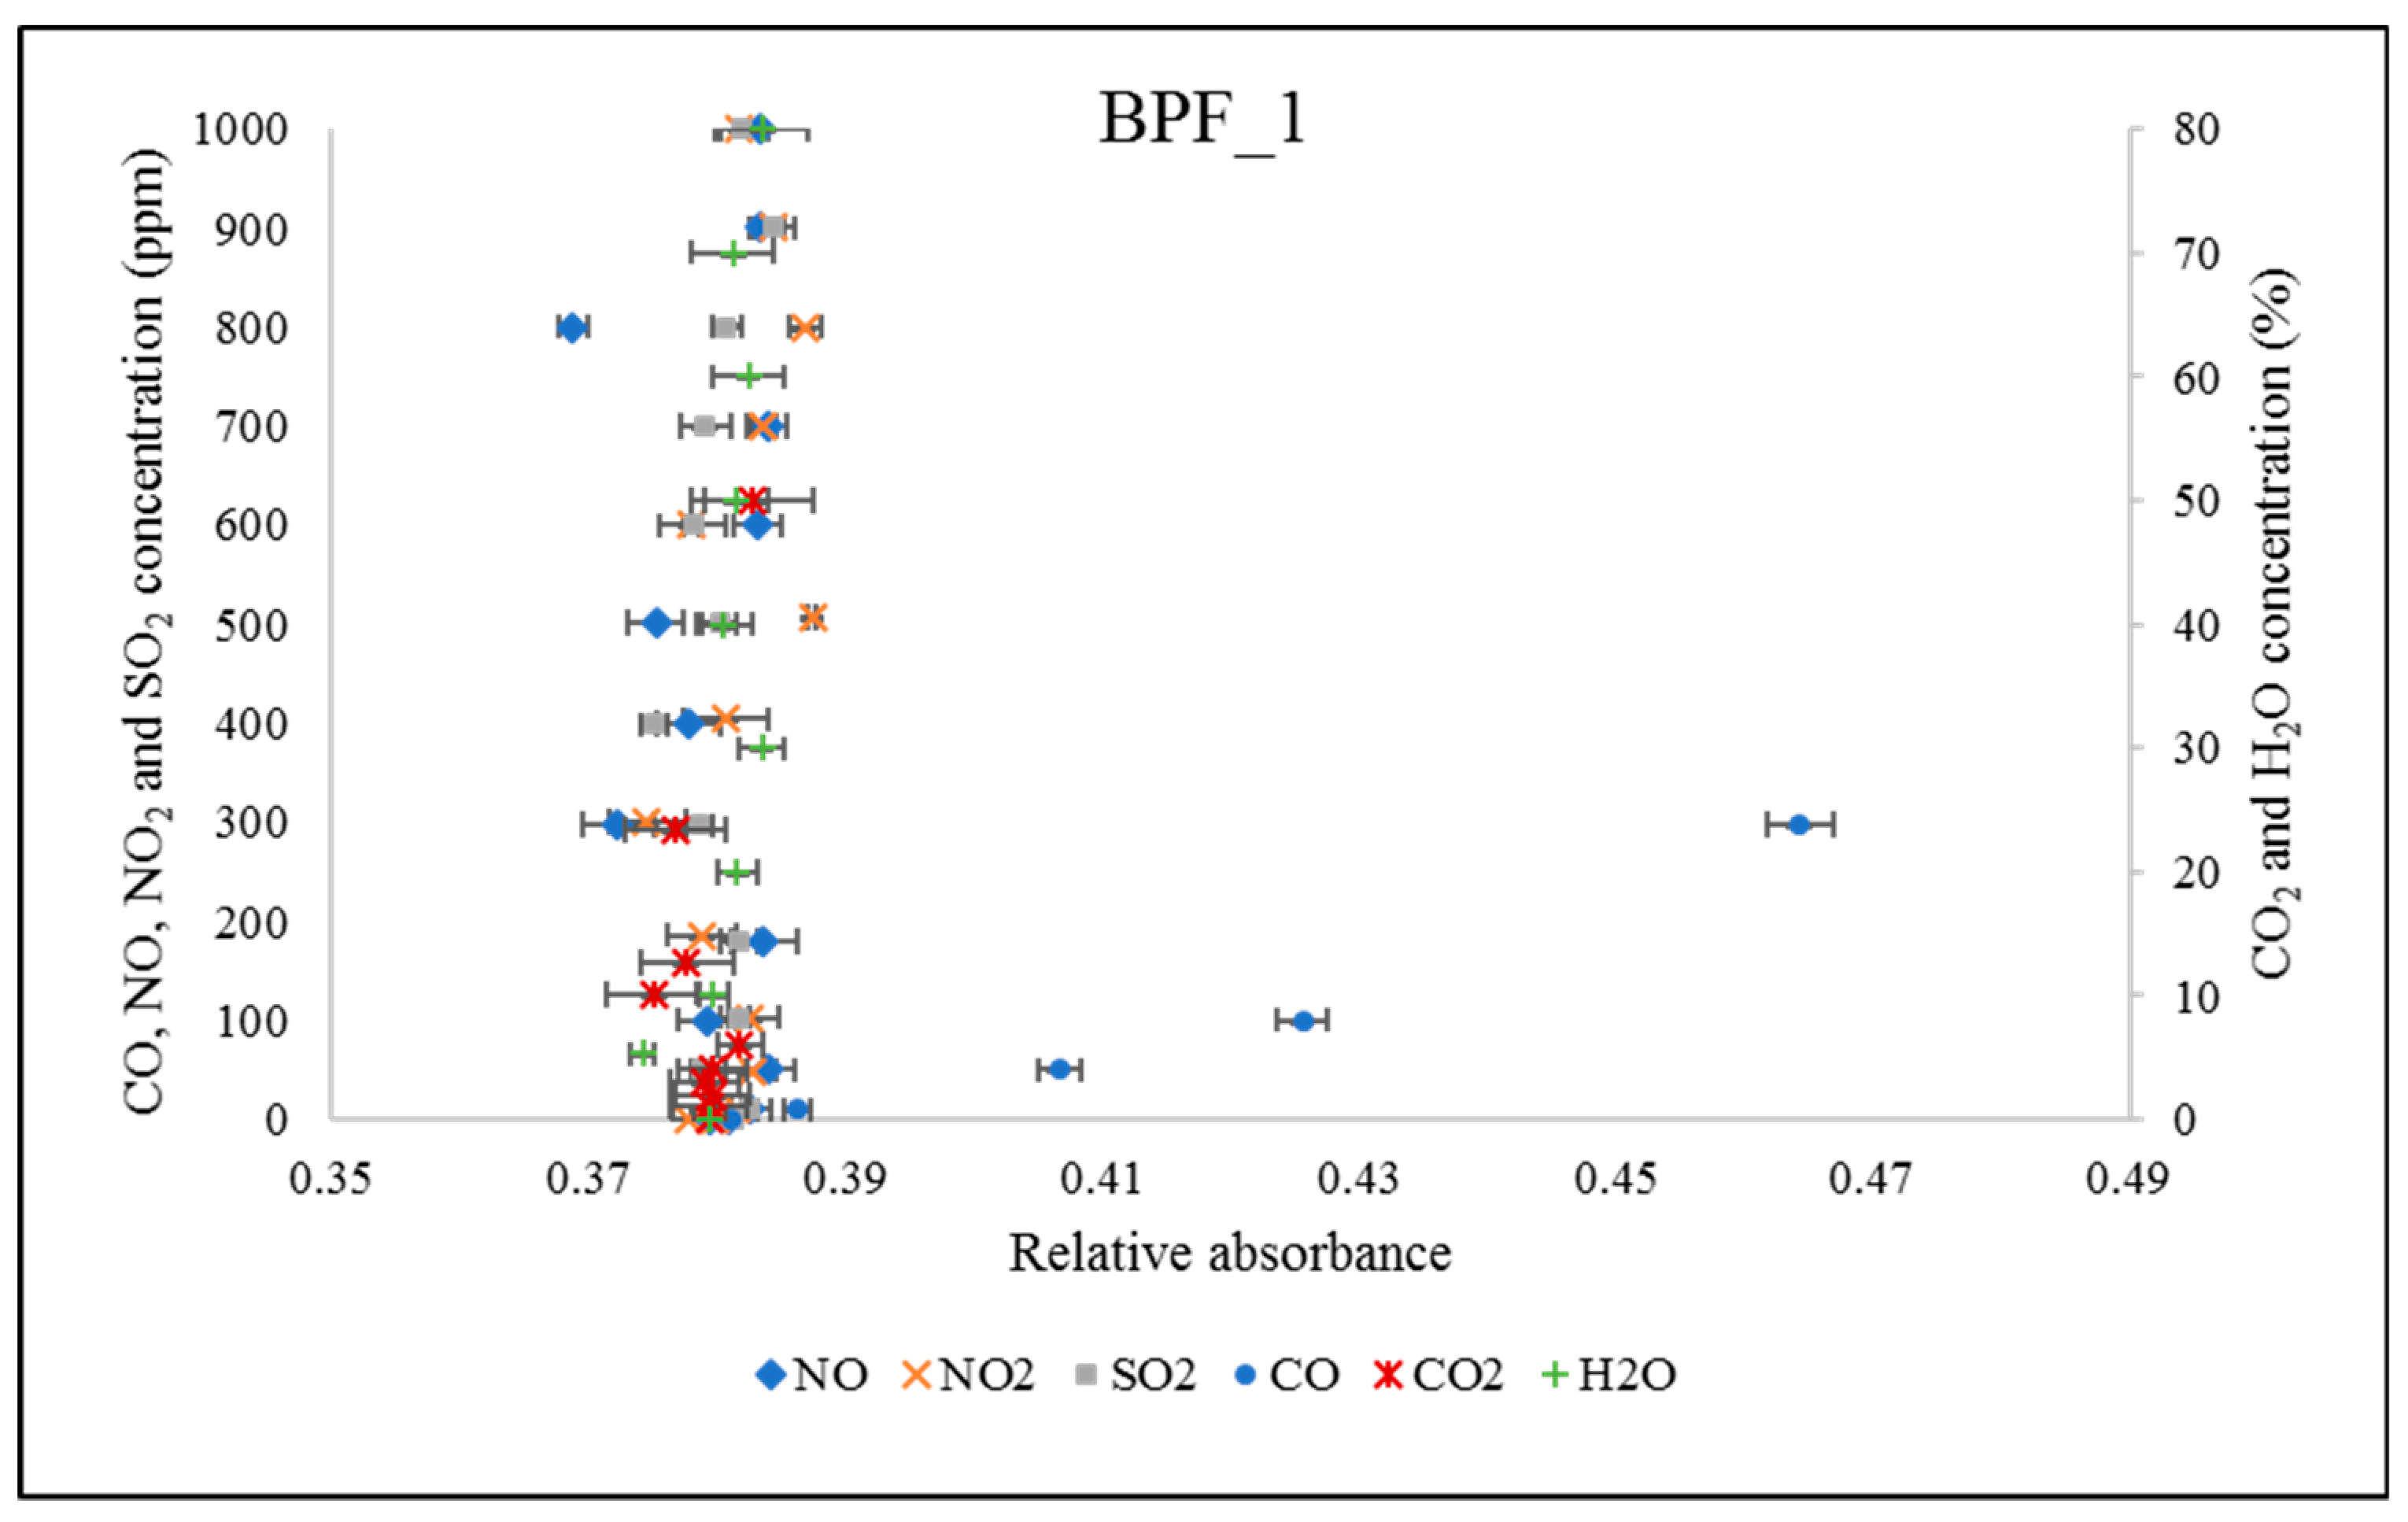
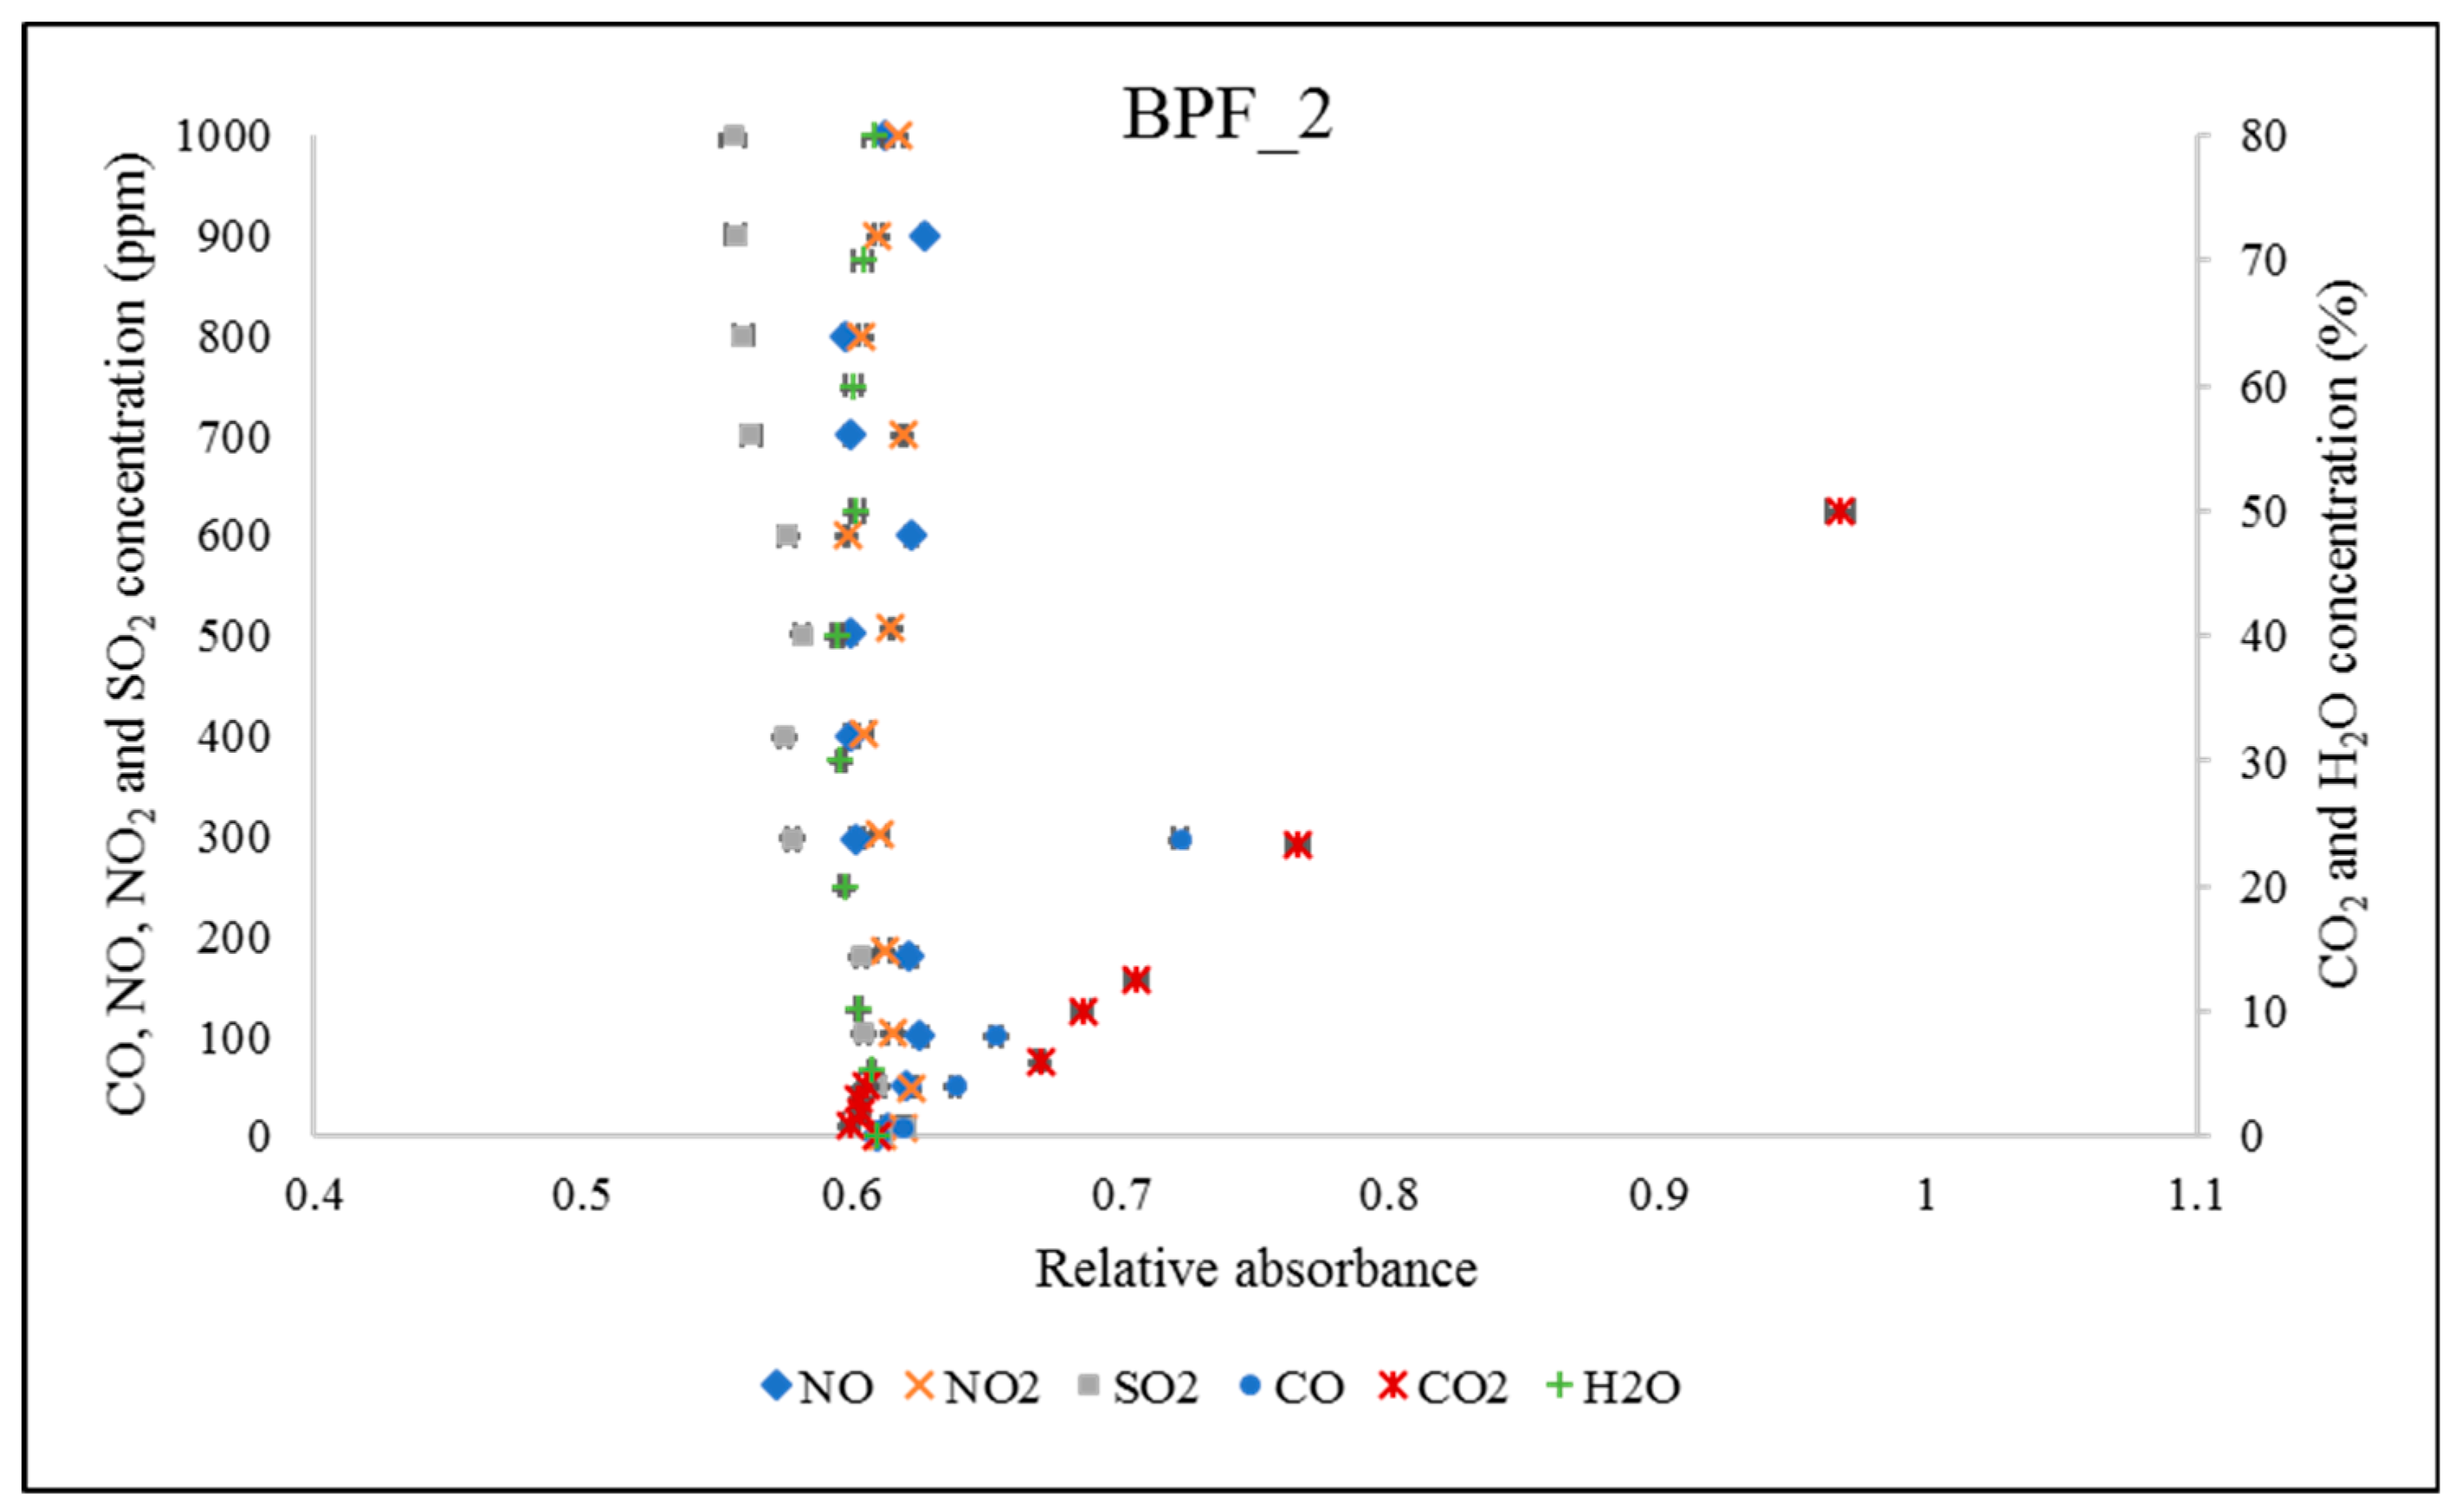
The SO2, NO2, and NO gas concentrations were varied at the following values: 1, 10, 50, 100, 200, 300, 400, 500, 600, 700, 800, 900 and 1000 ppm. The CO2 concentrations were varied as 1%, 2%, 3%, 4%, 6%, 10%, 12%, 23% and 50%. The H2O (vapor) was varied as 5%, 10%, 20%, 30%, 40%, 50%, 60%, 70% and 80% of relative humidity at 25 °C (i.e., from 1400 to 23,000 ppm). The interference of target gases on each BPF is depicted in Figure 7, Figure 8 and Figure 9.
As shown in Figure 7, BPF_1 was not significantly affected by NO, NO2, or SO2. This pattern was similar to that of the theoretical estimation. On the other hand, H2O and CO2 revealed effects at low ppm concentrations (i.e., 10 ppm) of CO in the theoretical estimation, but the experimental results did not show these effects of these gases.
As shown in Figure 8, NO, NO2, and H2O did not demonstrate interference effects on BPF_2. In contrast, a slightly negative effect caused by SO2 was found. Particularly, CO2 revealed strong effects on BPF_2. The effect of CO2 was stronger on BPF_2 than on BPF_1 because BPF_2 had a larger bandwidth than BPF_1, and the total CO absorption intensity in this band was higher than that of BPF_1. BPF_3 was also strongly affected by CO2 (Figure 9). At 50% of CO2, the error concentration of CO was about 50 ppm. The large bandwidth of BPF_3 brought about the high absorption of CO2. However, the effect of CO2 on BPF_3 was weaker than that on BPF_2 because the CO absorption intensity of BPF_3 was the highest (i.e., largest full bandwidth) based on HITRAN data. This pattern was a little different from the theoretical evaluation, which showed a stronger effect of CO2 on BPF_3 than BPF_2. This difference might be a result of their different transmittance values. The maximum and average transmittance of BPF_3 were higher than those of BPF_2. Moreover, due to the multi-pathway gas chamber of the analyzer, this gap increased many times after the IR beam had reached to the detector. When the same IR source and detector were used, IR intensity which reached to the detector with BPF_3 would be higher than that with BPF_2. Based on Beer–Lambert law, the detector with BPF_2 would be more sensitive to CO and CO2 gases than that with BPF_3. This resulted in the increase of the effect of the CO2. In addition, the errors in the HITRAN data and the observed bandwidth of BPF by the Fourier-transform infrared spectroscopy (FITR) might also cause this bias.
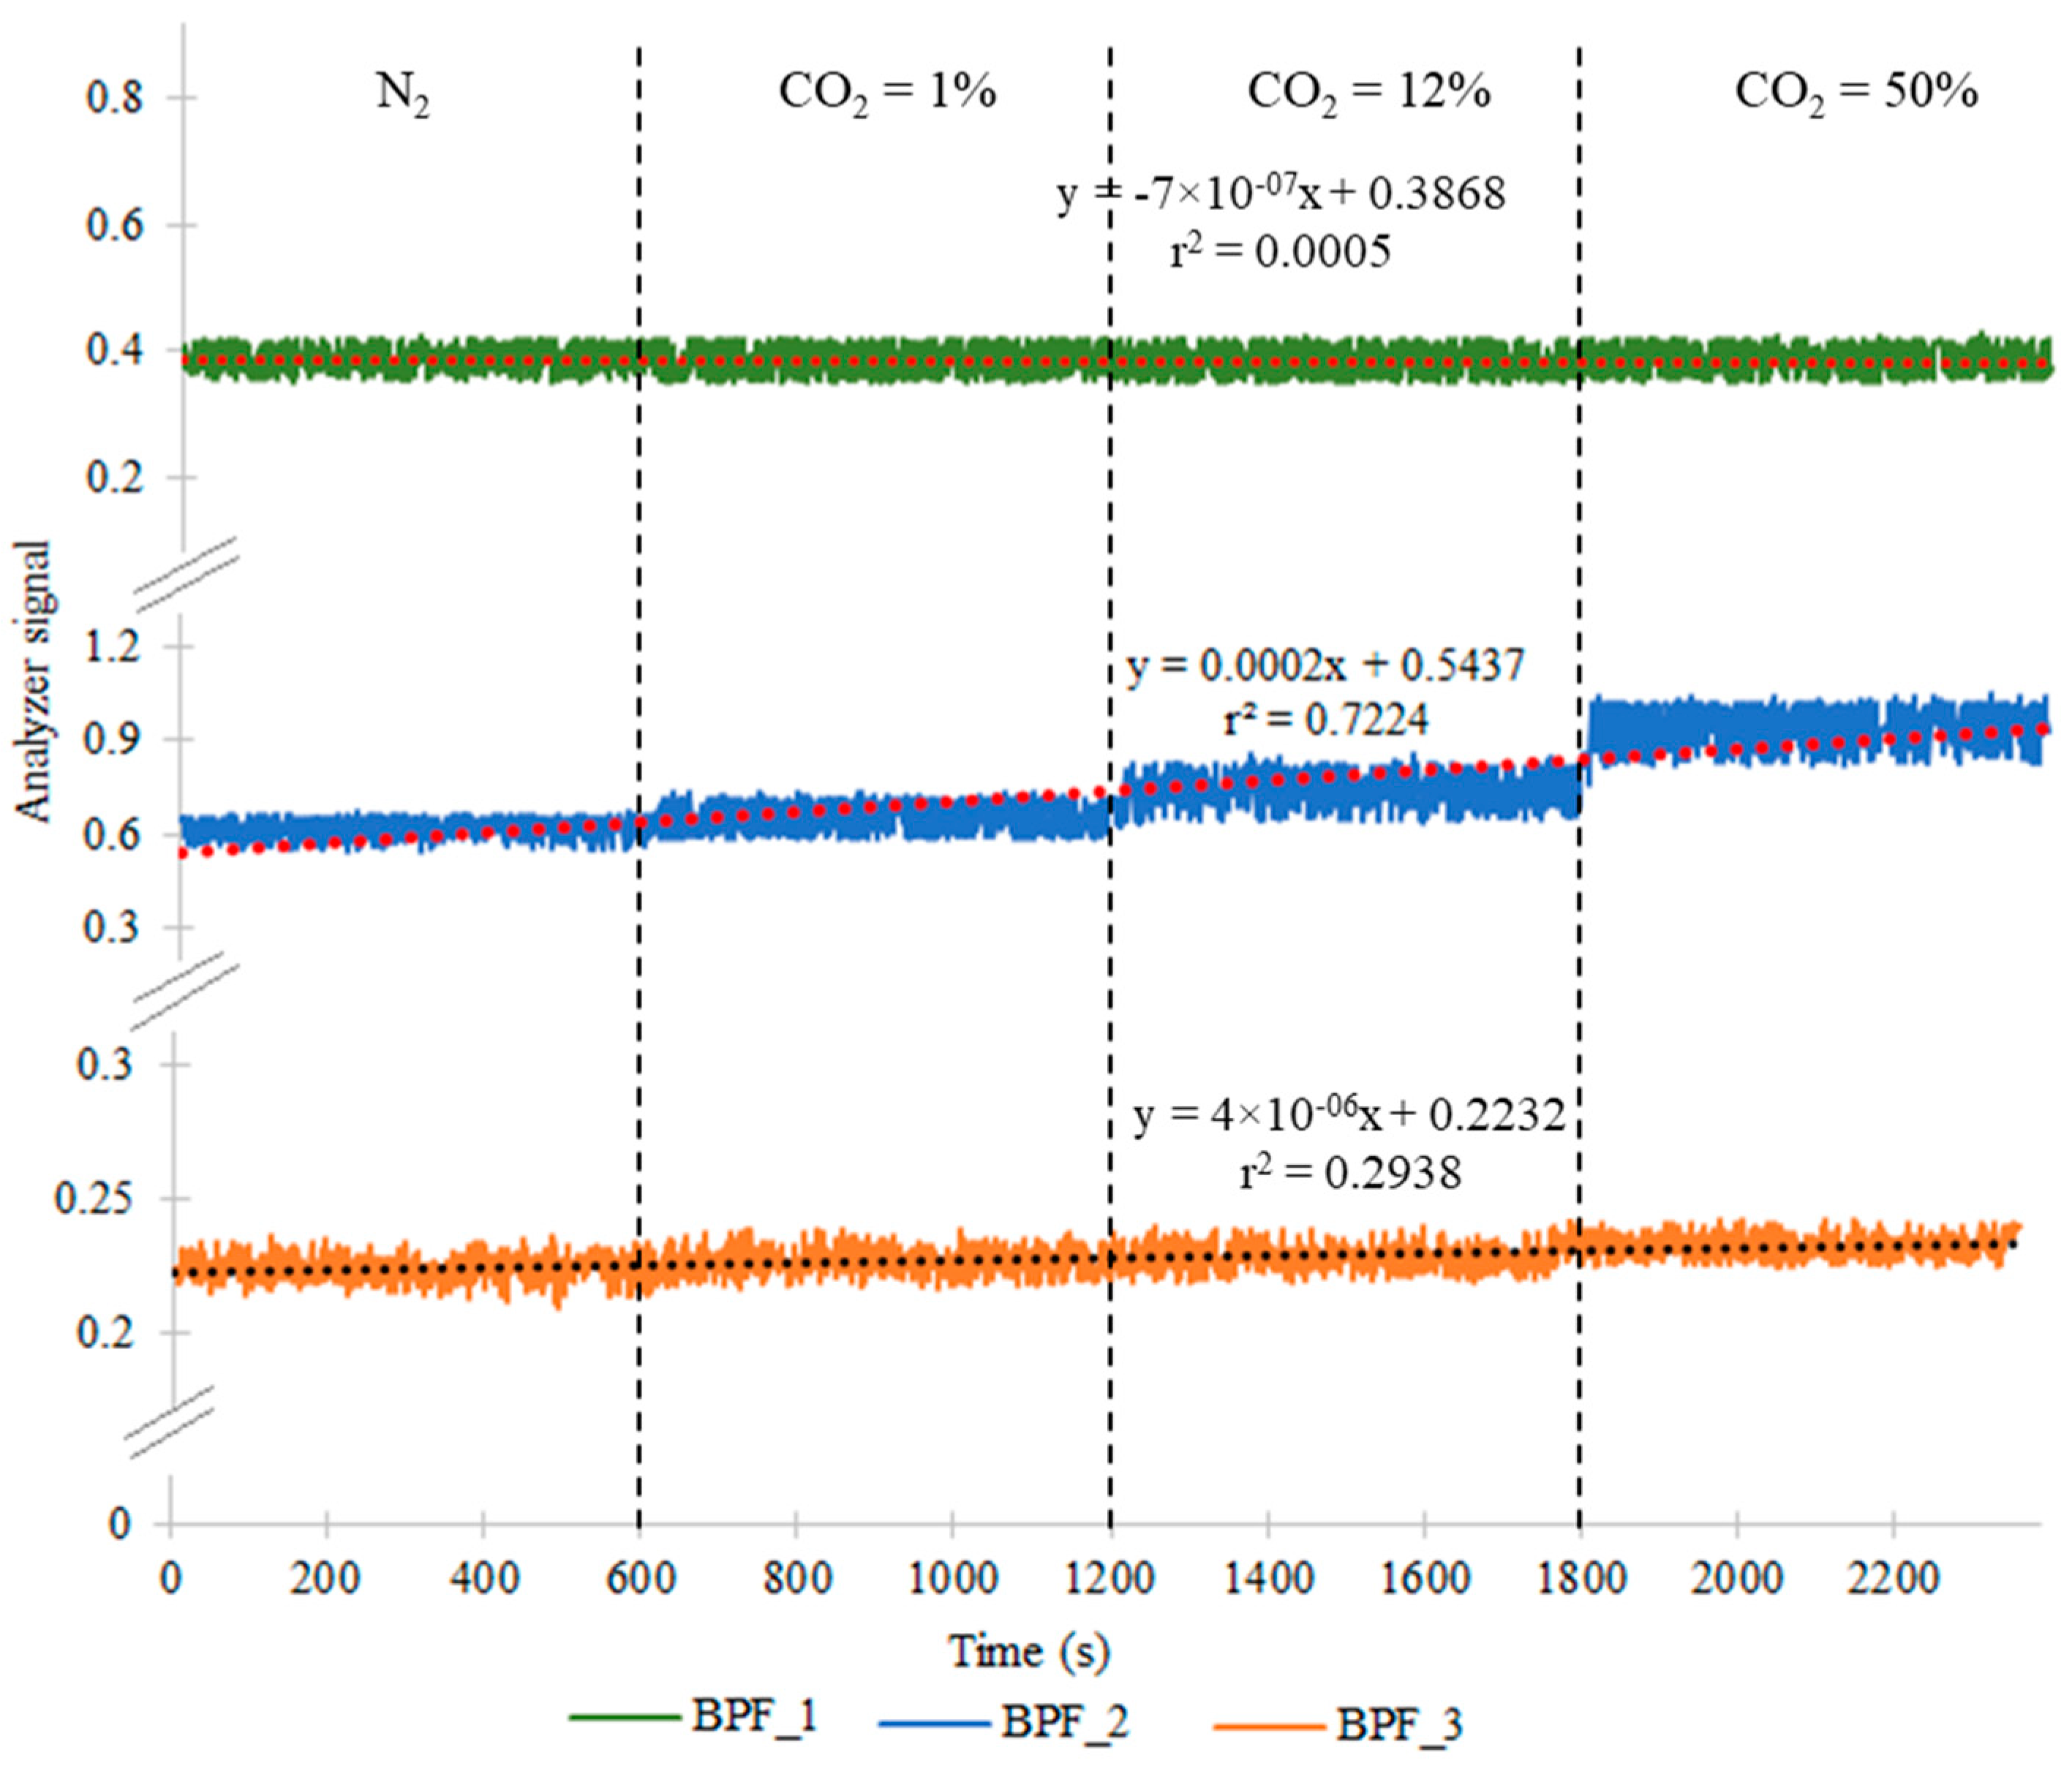
An example of the analyzer signal with respect to the interference of CO2 is presented in Figure 10. Linear regression of these analyzer signals was also estimated to compare their patterns. As shown in the figure, the analyzer signals with respect to BPF_2 and BPF_3 denoted an increase pattern (i.e., positive slope, r2 = 0.7224 and 0.2938 respectively). In addition, the response of the analyzer with respect to BPF_2 for CO2 was very clear compared to that of BPF_3 (i.e., slope = 2 × 10⁻⁴ > 4 × 10⁻⁶). In terms of using BPF_1, the signal was not influenced by CO2 (i.e., the slope was almost zero and r2 << 1).
To investigate the performance of the analyzer employing these BPFs, different gas mixtures based on the emission patterns of a coal-fired power plant were introduced into the NDIR analyzer. Table 4 shows the measurement errors with respect to the mixing gases.
As shown in Table 4, the measurement errors associated with BPF_2 were very high due to the strong effect of CO2. In the case of the BPF_3, the error was very high (88.7%) at 10 ppm of CO, but it was lower at 100 and 200 ppm of CO. However, the error was still higher than 2%. Therefore, BPF_3 could not be employed itself for the NDIR analyzer. The commercial BPF_3 coupled with GFC helped to remove the interference of CO2. The measurement errors of the GFC-NDIR were all less than 1%. This pattern was similar to that of BPF_1. Although there was an error at 10 ppm of CO when BPF_1 was applied for the NDIR analyzer, the measurement error was still less than 1%. This result was comparable to the results of other studies. Sun et al. (2013) developed a multi-NDIR analyzer using multiple BPFs coupled with a cross-interference algorithm to compensate for the interference. It was reported that the measurement error of CO was less than 1% with an analytical range of 0–850 ppm [14]. In another research, a combination of array filters and detectors was applied to the multi-gas NDIR sensor, in which the measurement error of CO was less than 1.5% with an analytical range of 0–1000 ppm [6].
These results indicate that the new BPF_1 can be applied to the CO NDIR analyzer instead of a GFC to compensate for the interference effect, especially for CO2. BPF_1 has the added advantage of having no leak problems. In addition, our test results showed that BPF_1 had a good performance with up to 50% CO2 and up to 1000 ppm NOx and SO2. Therefore, it can be applied to monitor CO emission from a power plant as well as the combustion process. Although the new BPF could overcome some disadvantage of the GFC, the center wavelength of the new BPF was different to that of the reference BPF (i.e., 3.95 µm). Consequently, drift due to aging of IR source or detector and various of temperature would still occur [28]. Based on Planck’s law, spectral intensity at a certain wavelength depends on temperature. When temperature varied, the IR intensity penetrated the reference BPF and target gas BPF would change, which resulted in changing the ratio between reference channel and measurement channel at the same target gas concentration and pressure. Hence, the base line of the analyzer would shift, which leads to increase the analyzer bias [26]. Accordingly, the effect of temperature as well as a new reference method on the analyzer should be investigated in the future.
4. Conclusions
A HITRAN database was used to investigate the non-interference wavelength for CO analysis using NDIR technology. The non-interference wavelength was determined with respect to the gas emission patterns of a coal-fired power plant. As a result, two new BPFs at 4.5 µm (with a half bandwidth of 50 nm) and 4.65 µm (with half bandwidth of 60 nm) were developed. The S/N ratios of the NDIR analyzer when the new BPFs were applied were approximately 20. In terms of interference compensation, the BPF at 4.5 µm was found to remove the effect of CO2 up to 50% and that of NOx and SO2 up to 1000 ppm. The measurement errors of the NDIR coupled with BPF_1 were similar to those of a GFC-NDIR analyzer, showing less than 1%. Therefore, BPF_1 can be used instead of the GFC for a NDIR analyzer to monitor gas emission from any combustion process for which the main components include NOx, CO2, CO, SO2, O2 and H2O. In terms of BPF_2, since its full bandwidth was still large, a narrower bandwidth of BPF_2 should be produced, and its performance should be investigated with interference gases in the further work. Although the price of the filter was high, its price will decrease in the end due to the increase of demand and the improvement of technology. The effect of temperature and new reference method should be investigated in future work. The investigation of BPFs for other compounds which typically require the use of a GFC for the NDIR analyzer would be a new direction in this NDIR field.
5. Patents
Korean patents 10-0897279 and 10-2018-0126957 resulted from the work reported in this manuscript.
Author Contributions
J.-C.K. and T.-V.D. conceptualized the work. Data curation was performed by J.-W.A. and I.-Y.C., The methodology was created by T.-V.D., T.-V.D. wrote the original draft, and review and editing was done by J.-C.K.
Funding
This research was supported by the R&D Center for Green Patrol Technologies through the R&D for Global Top Environmental Technologies funded by the Ministry of Environment (MOE), Republic of Korea. This work is supported in part by the MOE under the Graduate School Specialized in Climate Change program and the Pride Leading Group 2015 of Konkuk University.
Conflicts of Interest
The authors declare no conflict of interest.
References
- Pohanish, R.P. Sittig’s Hanbook of Toxic and Hazardous Chemicals and Carcinogens, 6th ed.; Elsevier Inc.: Oxford, UK, 2012; ISBN 978-1-4377-7869-4. [Google Scholar]
- Novelli, P.C. CO in the atmosphere: Measurement techniques and related issues. Chemosphere 1999, 1, 115–126. [Google Scholar] [CrossRef]
- Tanimoto, H.; Sawa, Y.; Matsueda, H.; Yonemura, S.; Wada, A.; Mukai, H.; Wang, T.; Poon, S.; Wong, A.; Lee, G.; et al. Evaluation of standards and methods for continuous measurements of carbon monoxide at ground-based sites in Asia. Pap. Meteorol. Geophys. 2007, 58, 85–93. [Google Scholar] [CrossRef] [Green Version]
- Yang, J.; Zhou, J.; Lv, Z.; Wei, W.; Song, H. A Real-Time Monitoring System of Industry Carbon Monoxide Based on Wireless Sensor Networks. Sensors 2015, 15, 29535–29546. [Google Scholar] [CrossRef] [Green Version]
- Chen, T.; Su, G.; Yuan, H. In situ gas filter correlation: Photoacoustic CO detection method for fire warning. Sens. Actuators B Chem. 2005. [Google Scholar] [CrossRef]
- Fonollosa, J.; Solórzano, A.; Jiménez-Soto, J.M.; Oller-Moreno, S.; Marco, S. Gas Sensor Array for Reliable Fire Detection. Procedia Eng. 2016, 168, 444–447. [Google Scholar] [CrossRef]
- Worthington, B. 60 years of continuous improvement in NDIR gas analyzers. In Proceedings of the 50th Annual ISA Analysis Division Symposium—50 Years of Analytical Solutions, Houston, TX, USA, 10–14 April 2005; pp. 95–107. [Google Scholar]
- ISO 12039:2001. Stationary Source Emissions—Determination of Carbon Monoxide, Carbon Dioxide and Oxygen—Performance Characteristics and Calibration of Automated Measuring Systems; ISO: Geneva, Switzerland, 2001. [Google Scholar]
- Lee, R.; Kester, W. Complete Gas Sensor Circuit Using Nondispersive Infrared (NDIR). Analog Dialogue 2016, 50, 1–9. [Google Scholar]
- Snakenborg, D.; Mogensen, K.B. Optimization of signal-to-noise ration in absorbance detection by integration of microoptical components. In Proceedings of the Seventh International Conference on Miniaturized Chemical and Biochemical Analysis Systems, Squaw Valley, CA, USA, 5–9 October 2003. [Google Scholar]
- Harvard-Smithsonian Center for Astrophysics. High-Resolution Transmission Molecular Absorption Database; Harvard-Smithsonian Center for Astrophysics: Cambridge, MA, USA, 2018. [Google Scholar]
- Dinh, T.-V.; Choi, I.-Y.; Son, Y.-S.; Kim, J.-C. A review on non-dispersive infrared gas sensors: Improvement of sensor detection limit and interference correction. Sens. Actuators B Chem. 2016, 231, 529–538. [Google Scholar] [CrossRef]
- Arévalo-Martínez, D.L.; Beyer, M.; Krumbholz, M.; Piller, I.; Kock, A.; Steinhoff, T.; Körtzinger, A.; Bange, H.W. A new method for continuous measurements of oceanic and atmospheric N2O, CO and CO2: Performance of off-axis integrated cavity output spectroscopy (OA-ICOS) coupled to non-dispersive infrared detection (NDIR). Ocean Sci. 2013, 9, 1071–1087. [Google Scholar] [CrossRef]
- Sun, Y.W.; Liu, C.; Chan, K.L.; Xie, P.H.; Liu, W.Q.; Zeng, Y.; Wang, S.M.; Huang, S.H.; Chen, J.; Wang, Y.P.; et al. Stack emission monitoring using non-dispersive infrared spectroscopy with an optimized nonlinear absorption cross interference correction algorithm. Atmos. Meas. Tech. 2013, 6, 1993–2005. [Google Scholar] [CrossRef] [Green Version]
- Thurmond, K.; Loparo, Z.; Partridge, W.; Vasu, S.S. A Light-Emitting Diode-(LED-) Based Absorption Sensor for Simultaneous Detection of Carbon Monoxide and Carbon Dioxide. Appl. Spectrosc. 2016, 70, 962–971. [Google Scholar] [CrossRef] [PubMed]
- Camargo, E.G.; Tokuo, S.; Goto, H.; Kuze, N. Nondispersive Infrared Gas Sensor Using InSb-Based Photovoltaic-Type Infrared Sensor. Sens. Mater. 2014, 26, 253–262. [Google Scholar]
- Tan, Q.; Tang, L.; Yang, M.; Xue, C.; Zhang, W.; Liu, J.; Xiong, J. Three-gas detection system with IR optical sensor based on NDIR technology. Opt. Lasers Eng. 2015, 74, 103–108. [Google Scholar] [CrossRef]
- Dinh, T.-V.; Ahn, J.-W.; Choi, I.-Y.; Song, K.-Y.; Chung, C.-H.; Kim, J.-C. Limitations of gas filter correlation: A case study on carbon monoxide non-dispersive infrared analyzer. Sens. Actuators B Chem. 2017, 243, 684–689. [Google Scholar] [CrossRef]
- ISO 6142-1:2015. Gas Analysis—Preparation of Calibration Gas Mixtures—Part 1: Gravimetric Method for Class I Mixtures; ISO: Geneva, Switzerland, 2015. [Google Scholar]
- McLarnon, C.R.; Steen, D. Combined SO2, NOx, PM, and Hg removal from coal fired boilers. In Proceedings of the Joint EPRI-DOE-EPA Combined Utility Air Pollutant Control Symposium, The MEGA Symposium, EPRI-DOE-EPA, Washington, DC, USA, 19–22 May 2003. [Google Scholar]
- Granite, E.J.; King, W.P.; Stanko, D.C.; Pennline, H.W. Implications of mercury interactions with band-gap semiconductor oxides. Main Group Chem. 2008, 7, 227–237. [Google Scholar] [CrossRef]
- Zhao, Y.; Pan, Y.; Rutherford, J.; Mitloehner, F.M. Estimation of the interference in Multi-Gas measurements using infrared photoacoustic analyzers. Atmosphere 2012, 3, 246–265. [Google Scholar] [CrossRef]
- Jones, R.C. Performance of Detectors for Visible and Infrared Radiation. In Advances in Electronics and Electron Physics; Marton, L., Ed.; Academic Press: Cambridge, MA, USA, 1953; Volume 5, pp. 1–96. ISBN 0065-2539. [Google Scholar]
- Douglas, A.; Skoog, F.; James Holler, S.R.C. Principle of Instrumental Analysis; Cengage: Boston, MA, USA, 2007; ISBN 978-8-57-811079-6. [Google Scholar]
- Gonz´alez, F.J. Noise measurements on optical detectors. Rev. Mex. Fis. 2006, 52, 550–554. [Google Scholar]
- Korea MOE. National Emission Standard for Coal-Fired Power Plant; Korea MOE: Sejong, Korea, 2017. [Google Scholar]
- MacLeod, H.A. Thin-Film Optical Filter, 4th ed.; CRC Press Taylor & Francis Group: Boca Raton, FL, USA, 2010; ISBN 978-1-42-007302-7. [Google Scholar]
- Wong, J.Y.; Schell, M. Zero drift NDIR gas sensors. Sens. Rev. 2011, 31, 70–77. [Google Scholar] [CrossRef]
Figure 1.
Absorption ratios of several gases emitted from a coal-fired power plant observed from the high-resolution transmission molecular absorption (HITRAN) database [11]. (The absorption ratio at a spectral line was the fraction of that line’s absorption intensity and the maximum adsorption intensity of that gas).

Figure 2.
Schematic diagram of experimental set-up. NDIR: non-dispersive infrared; MFC: mass flow controller.
Figure 2.
Schematic diagram of experimental set-up. NDIR: non-dispersive infrared; MFC: mass flow controller.

Figure 3.
Spectra of target band pass filters (BPF_1, BPF_2, and BPF_3) observed from the Fourier-transform infrared spectroscopy.
Figure 3.
Spectra of target band pass filters (BPF_1, BPF_2, and BPF_3) observed from the Fourier-transform infrared spectroscopy.

Figure 4.
Total absorption intensity of CO, NO, NO2, SO2, CO2, and H2O. The concentration of CO was from 1 to 298 ppm; that of NO, NO2, and SO2 was from 1 to 1000 ppm; that of CO2 was from 10,000 to 500,000 ppm; and that of H2O was from 1431 ppm to 22,972 ppm at 25 °C, 1 atm.
Figure 4.
Total absorption intensity of CO, NO, NO2, SO2, CO2, and H2O. The concentration of CO was from 1 to 298 ppm; that of NO, NO2, and SO2 was from 1 to 1000 ppm; that of CO2 was from 10,000 to 500,000 ppm; and that of H2O was from 1431 ppm to 22,972 ppm at 25 °C, 1 atm.

Figure 5.
Interference ratios of target gases with respect to different mixtures. (a) 10 ppm of CO; 50 ppm of NO, NO2, and SO2; 15% of CO2; and 14,360 ppm of H2O. (b) 100 ppm of CO; 50 ppm of NO, NO2, and SO2; 15% of CO2; and 14,360 ppm of H2O. (c) 200 ppm of CO; 50 ppm of NO, NO2, and SO2; 15% of CO2; and 14,360 ppm of H2O.

Figure 6.
CO calibration curves associated with BPF_1, BPF_2, and BPF_3.

Figure 7.
Interference effect of NO, NO2, SO2, CO2, and H2O on CO with respect to BPF_1. The error bar in the figure is the standard deviation of the repeated experiment.
Figure 7.
Interference effect of NO, NO2, SO2, CO2, and H2O on CO with respect to BPF_1. The error bar in the figure is the standard deviation of the repeated experiment.

Figure 8.
Interference effect of NO, NO2, SO2, CO2, and H2O on CO with respect to BPF_2. The error bar in the figure is the standard deviation of the repeated experiment.
Figure 8.
Interference effect of NO, NO2, SO2, CO2, and H2O on CO with respect to BPF_2. The error bar in the figure is the standard deviation of the repeated experiment.

Figure 9.
Interference effect of NO, NO2, SO2, CO2, and H2O on CO with respect to BPF_3. The error bar in the figure is the standard deviation of the repeated experiment.
Figure 9.
Interference effect of NO, NO2, SO2, CO2, and H2O on CO with respect to BPF_3. The error bar in the figure is the standard deviation of the repeated experiment.

Figure 10.
Non-dispersive infrared (NDIR) analyzer signal associated with different BPFs and CO2 concentrations.
Figure 10.
Non-dispersive infrared (NDIR) analyzer signal associated with different BPFs and CO2 concentrations.


Table 1.
Recent studies on CO non-dispersive infrared analysis.
| Type of Non-Dispersive Infrared (NDIR) | Application Field | Improvement Part | Advantages |
|---|---|---|---|
| Analyzer [13] | Greenhouse gases from ocean | Coupled with off-axis integrated cavity output spectroscopy to a Weiss-type equilibrator | Fast response due to faster gas equilibration process. Detection limit <40 ppt, high precision, stable |
| Analyzer [14] | Gas emission from a stack | Cross-interference correction with multi-bandpass filter. Using fitted interference functions for nonlinear absorption compounds | High accuracy due to apply fitted interference functions |
| Sensor [15] | Gas emission from combustion engine | Applied broad-spectral light-emitting diodes (LED) in the 3–5 µm wavelength as an infrared (IR) source instead of a laser source | LED is lower cost and smaller size than a laser system. Fast response due to high frequency of LED (250 Hz) |
| Sensor [4] | Construction industry | Digital filter to remove noise. Applied sensor networks with Wi-Fi | Noise was removed by digital filter leaded to high accuracy. Stability in long-term operation due to integrated data from sensor networks |
| Sensor [16] | Air monitoring in vehicles, building air conditioning systems | Uncooled small InSb-based detector with AlInSb barrier. Several single photodiodes with i-layer thickness connected in series | The barrier helped to remove thermal insulation. Hence, the size of the sensor was reduced. The i-layer helped to improve signal-to-noise S/N ratio, which leads to increase sensitivity. The detector could detect a wide band for multi-gas detection |
| Sensor [17] | Environment monitoring | One IR source coupled with 4 pyroelectric detectors. Compensation parameter for temperature, humidity, and pressure | Multi-detectors for multi-gas detection. Effect factors were compensated resulted in high accuracy |
| Sensor [12] | Fire warning | Applied photoacoustic detector | Help to improve selectivity and precision |
Table 2.
Characteristic of the NDIR analyzer.
| Parameter | Value | Unit |
|---|---|---|
| Measurement range | 0–200 | ppm |
| Optical path length | 8 | m |
| Air flow rate | 1 | L/min |
| Gas chamber temperature | 45 | °C |
| Bandpass filter (BPF) for CO wavelength (half bandwidth) | 4.64 (180) | μm (nm) |
| Reference BPF (half bandwidth) | 3.95 (90) | μm (nm) |
Table 3.
Specification of BPFs using in this research.
| BPF | Center Wavelength (µm) | Half Band Width (nm) | Full Bandwidth * (nm) | Maximum Transmittance (%) | Average Transmittance (%) |
|---|---|---|---|---|---|
| BPF_1 | 4.5 | 50 | 141 | 70.1 | 26.8 |
| BPF_2 | 4.65 | 60 | 262 | 75.4 | 24.6 |
| BPF_3 | 4.64 | 180 | 567 | 83.8 | 27 |
Note: * Full bandwidth from 0.1% of transmittance.
Table 4.
Comparison between standard gas concentrations and analytical results for CO gas associated with different BPFs.
Table 4.
Comparison between standard gas concentrations and analytical results for CO gas associated with different BPFs.
| CO Std. (ppm) | GFC-NDIR | BPF_1 | BPF_2 | BPF_3 | ||||
|---|---|---|---|---|---|---|---|---|
| Mean of Analytical Values (ppm) | Mea. Error (%) | Mean of Analytical Values (ppm) | Mea. Error (%) | Mean of Analytical Values (ppm) | Mea. Error (%) | Mean of Analytical Values (ppm) | Mea. Error (%) | |
| 10 | 10.04 | 0.40 | 10.08 | 0.83 | 283.74 | 2737 | 18.87 | 88.7 |
| 100 | 100.22 | 0.22 | 100.22 | 0.22 | 362.93 | 263 | 105.94 | 5.94 |
| 200 | 200.17 | 0.08 | 199.84 | 0.08 | 505.79 | 153 | 205.08 | 2.54 |
Note: Measurement error (Mea. error) is obtained from the relative percent difference between the CO concentration of standard and analytical results. CO std. is concentration of CO standard gas.
© 2018 by the authors. Licensee MDPI, Basel, Switzerland. This article is an open access article distributed under the terms and conditions of the Creative Commons Attribution (CC BY) license (http://creativecommons.org/licenses/by/4.0/).
Share and Cite
MDPI and ACS Style
Dinh, T.-V.; Ahn, J.-W.; Choi, I.-Y.; Kim, J.-C. A Novel Bandpass Filter for the Analysis of Carbon Monoxide Using a Non-Dispersive Infrared Technique. Atmosphere 2018, 9, 495. https://0-doi-org.brum.beds.ac.uk/10.3390/atmos9120495
AMA Style
Dinh T-V, Ahn J-W, Choi I-Y, Kim J-C. A Novel Bandpass Filter for the Analysis of Carbon Monoxide Using a Non-Dispersive Infrared Technique. Atmosphere. 2018; 9(12):495. https://0-doi-org.brum.beds.ac.uk/10.3390/atmos9120495
Chicago/Turabian StyleDinh, Trieu-Vuong, Ji-Won Ahn, In-Young Choi, and Jo-Chun Kim. 2018. "A Novel Bandpass Filter for the Analysis of Carbon Monoxide Using a Non-Dispersive Infrared Technique" Atmosphere 9, no. 12: 495. https://0-doi-org.brum.beds.ac.uk/10.3390/atmos9120495
Note that from the first issue of 2016, this journal uses article numbers instead of page numbers. See further details here.