Methodological Framework for Analysing Cascading Effects from Flood Events: The Case of Sukhumvit Area, Bangkok, Thailand

 ,
,
Abstract
:1. Introduction
2. Framing the Methodology
2.1. Concepts, Terminology and Literature
2.2. Defining Cascading Effects from Floods
2.3. Methodological Framework
3. Application of the Framework
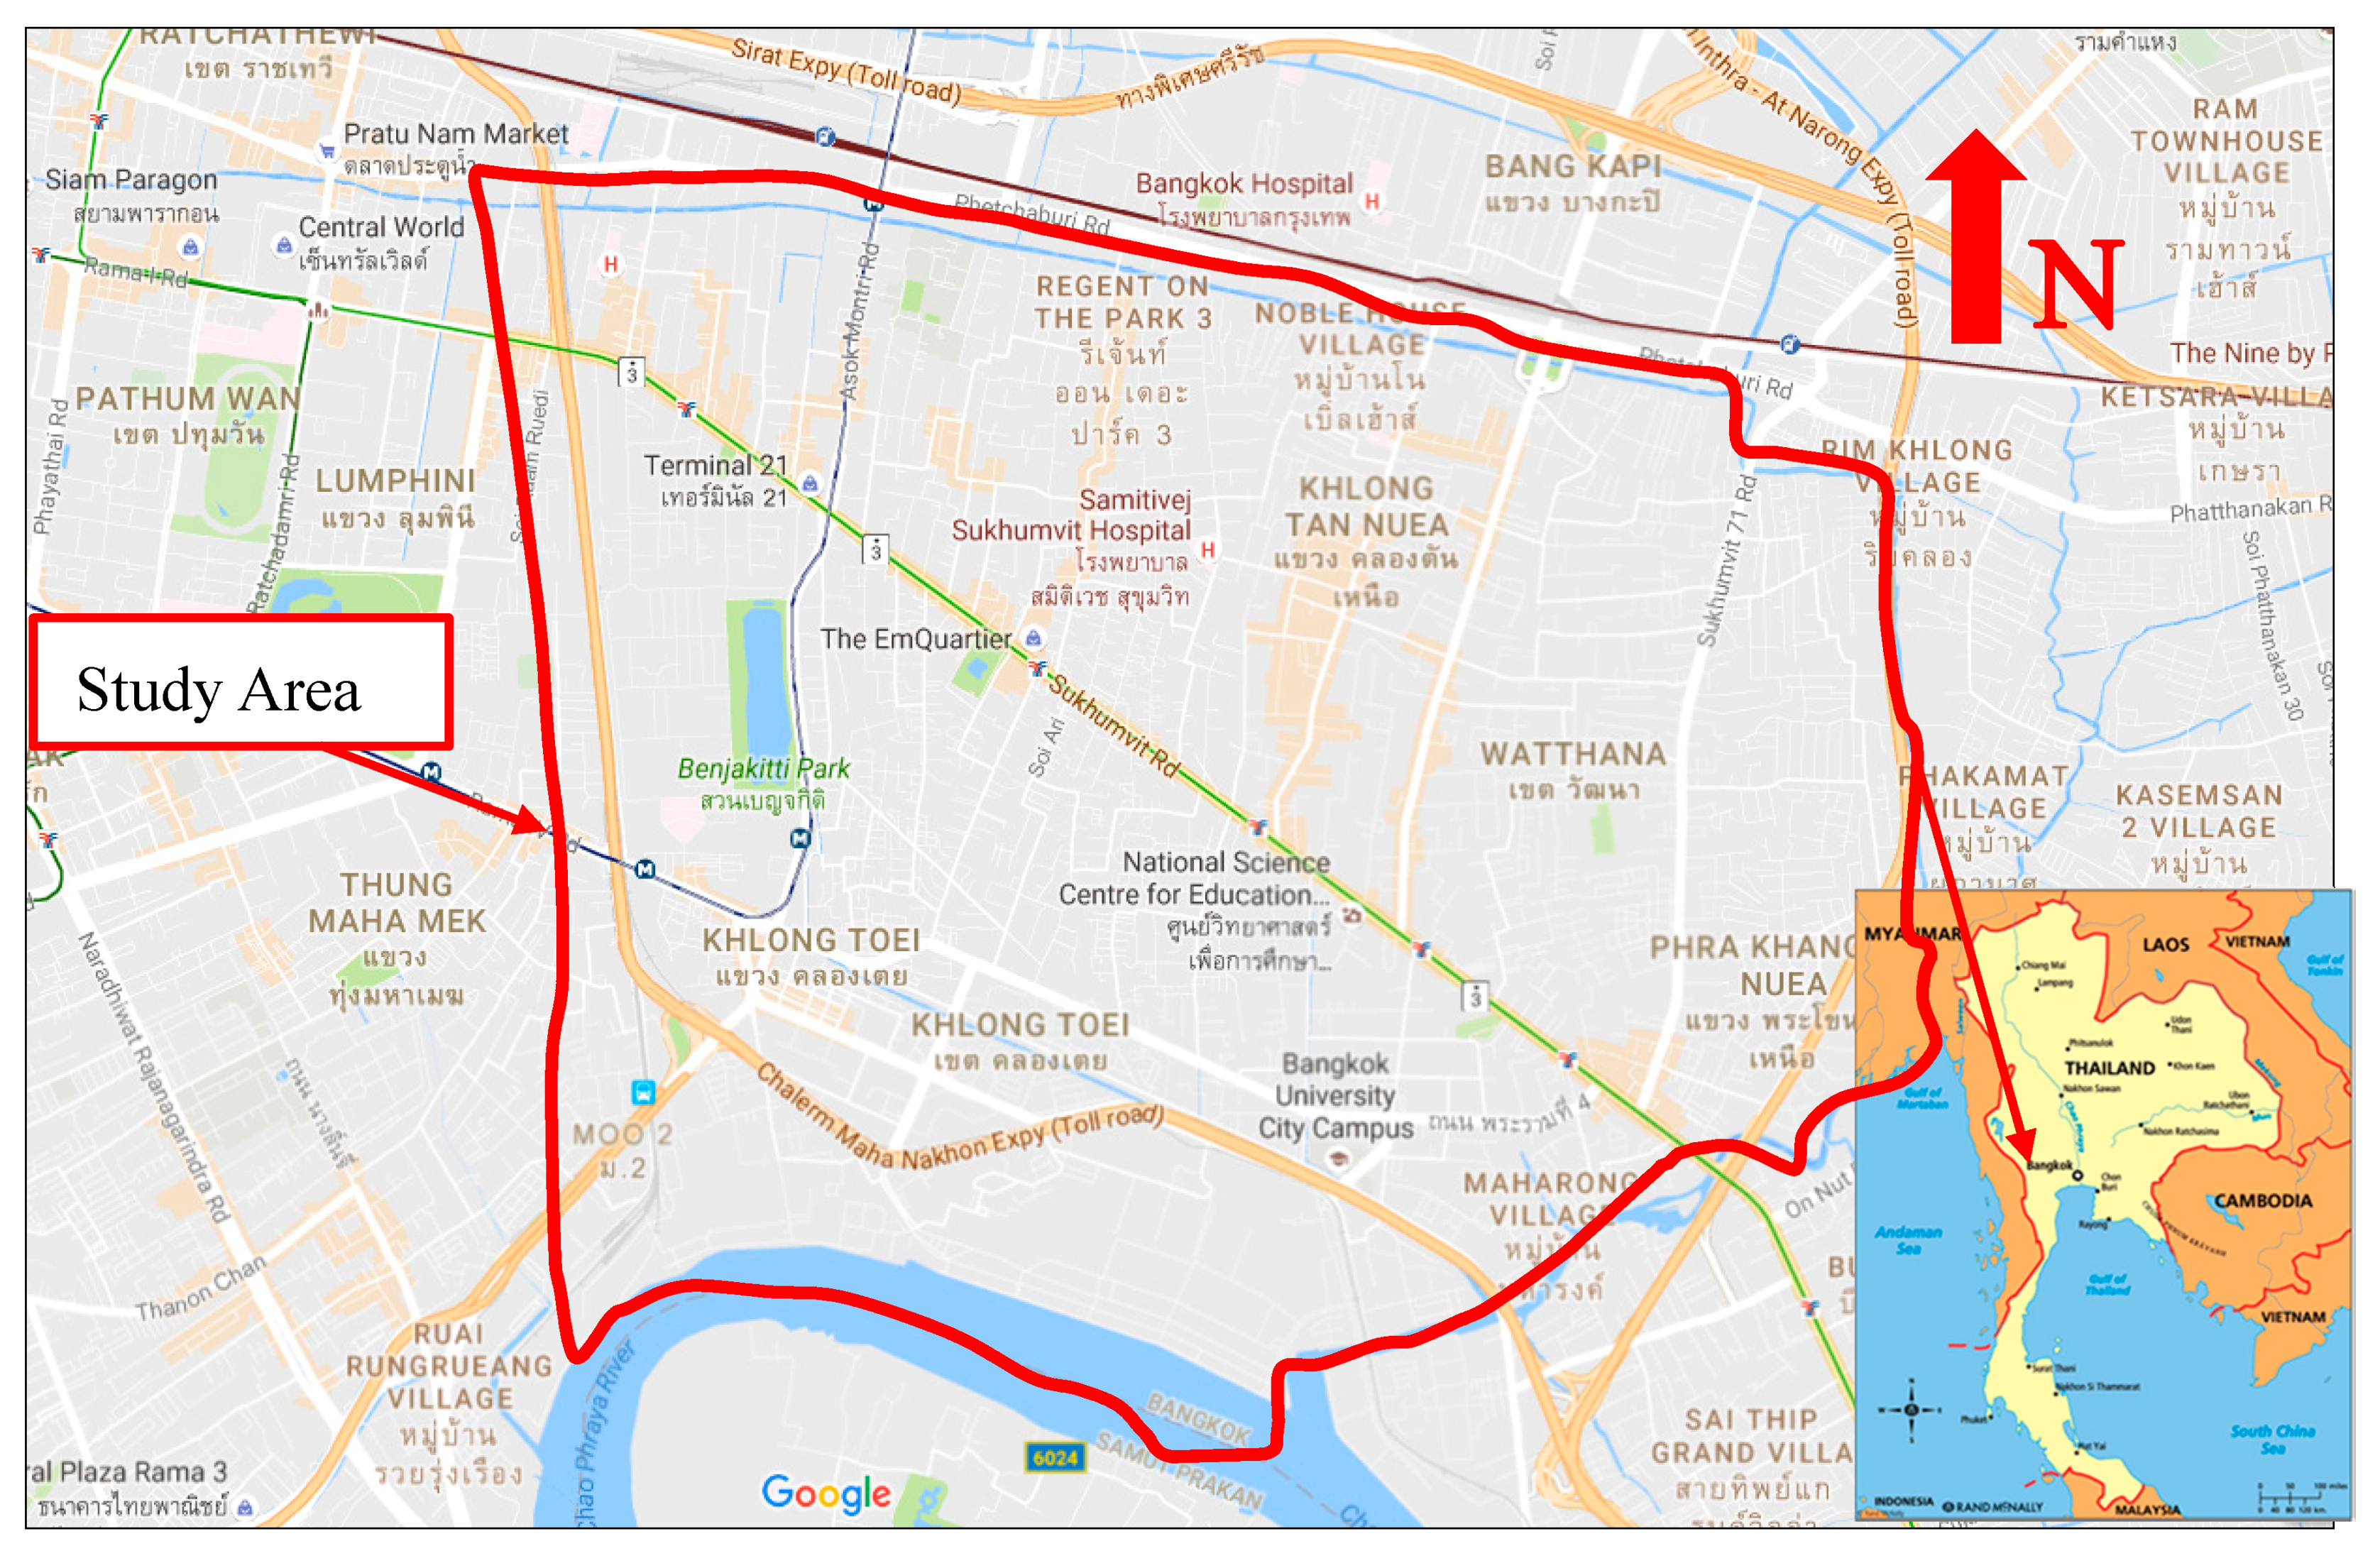
3.1. Description of the Case Study Area
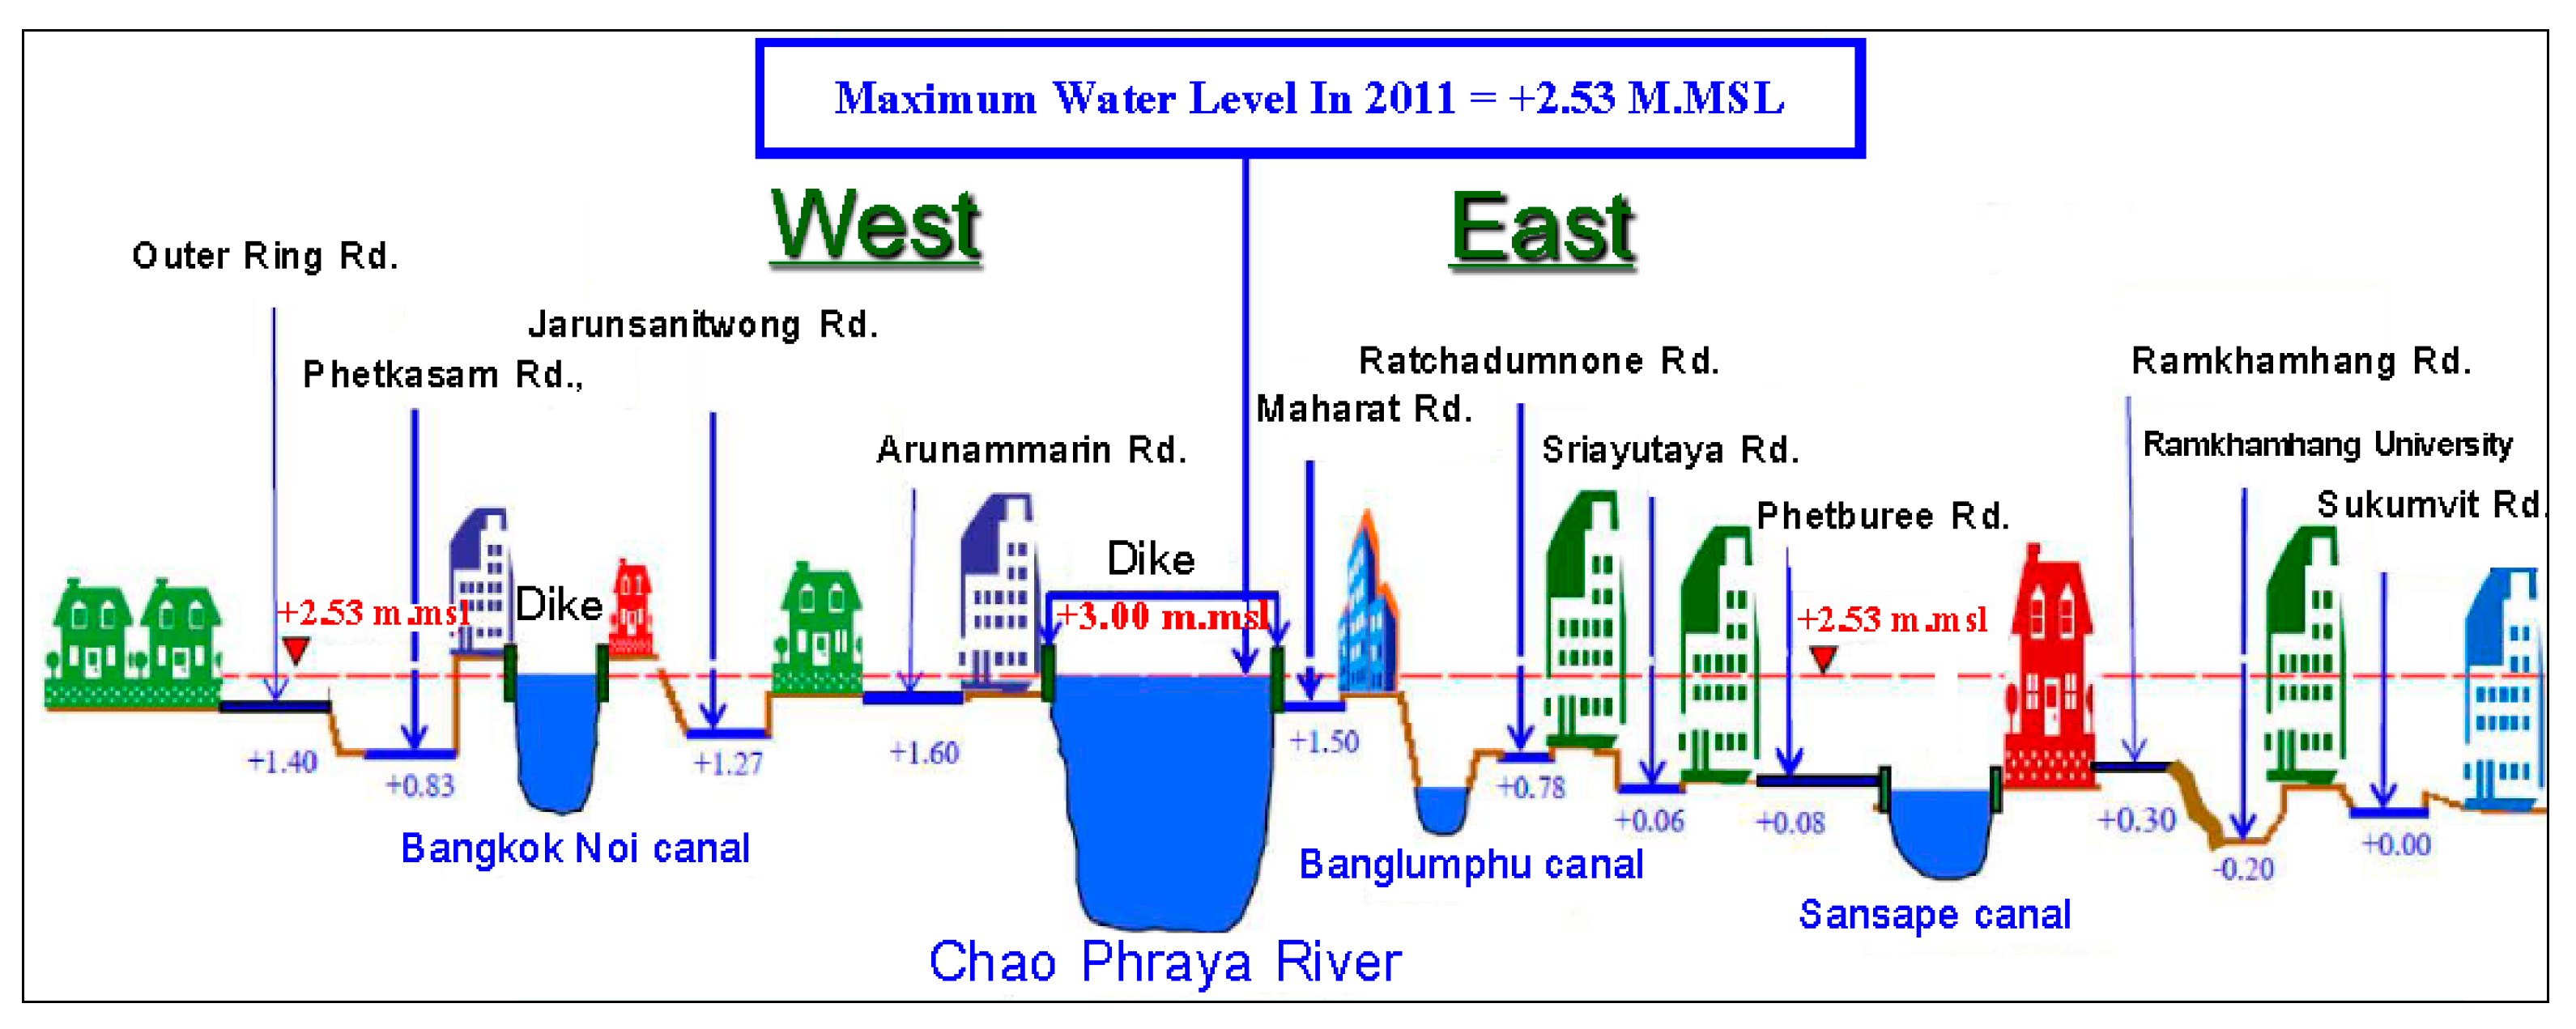
3.2. Identifying Flood-Prone Areas
3.3. Analysing Cascading Effects
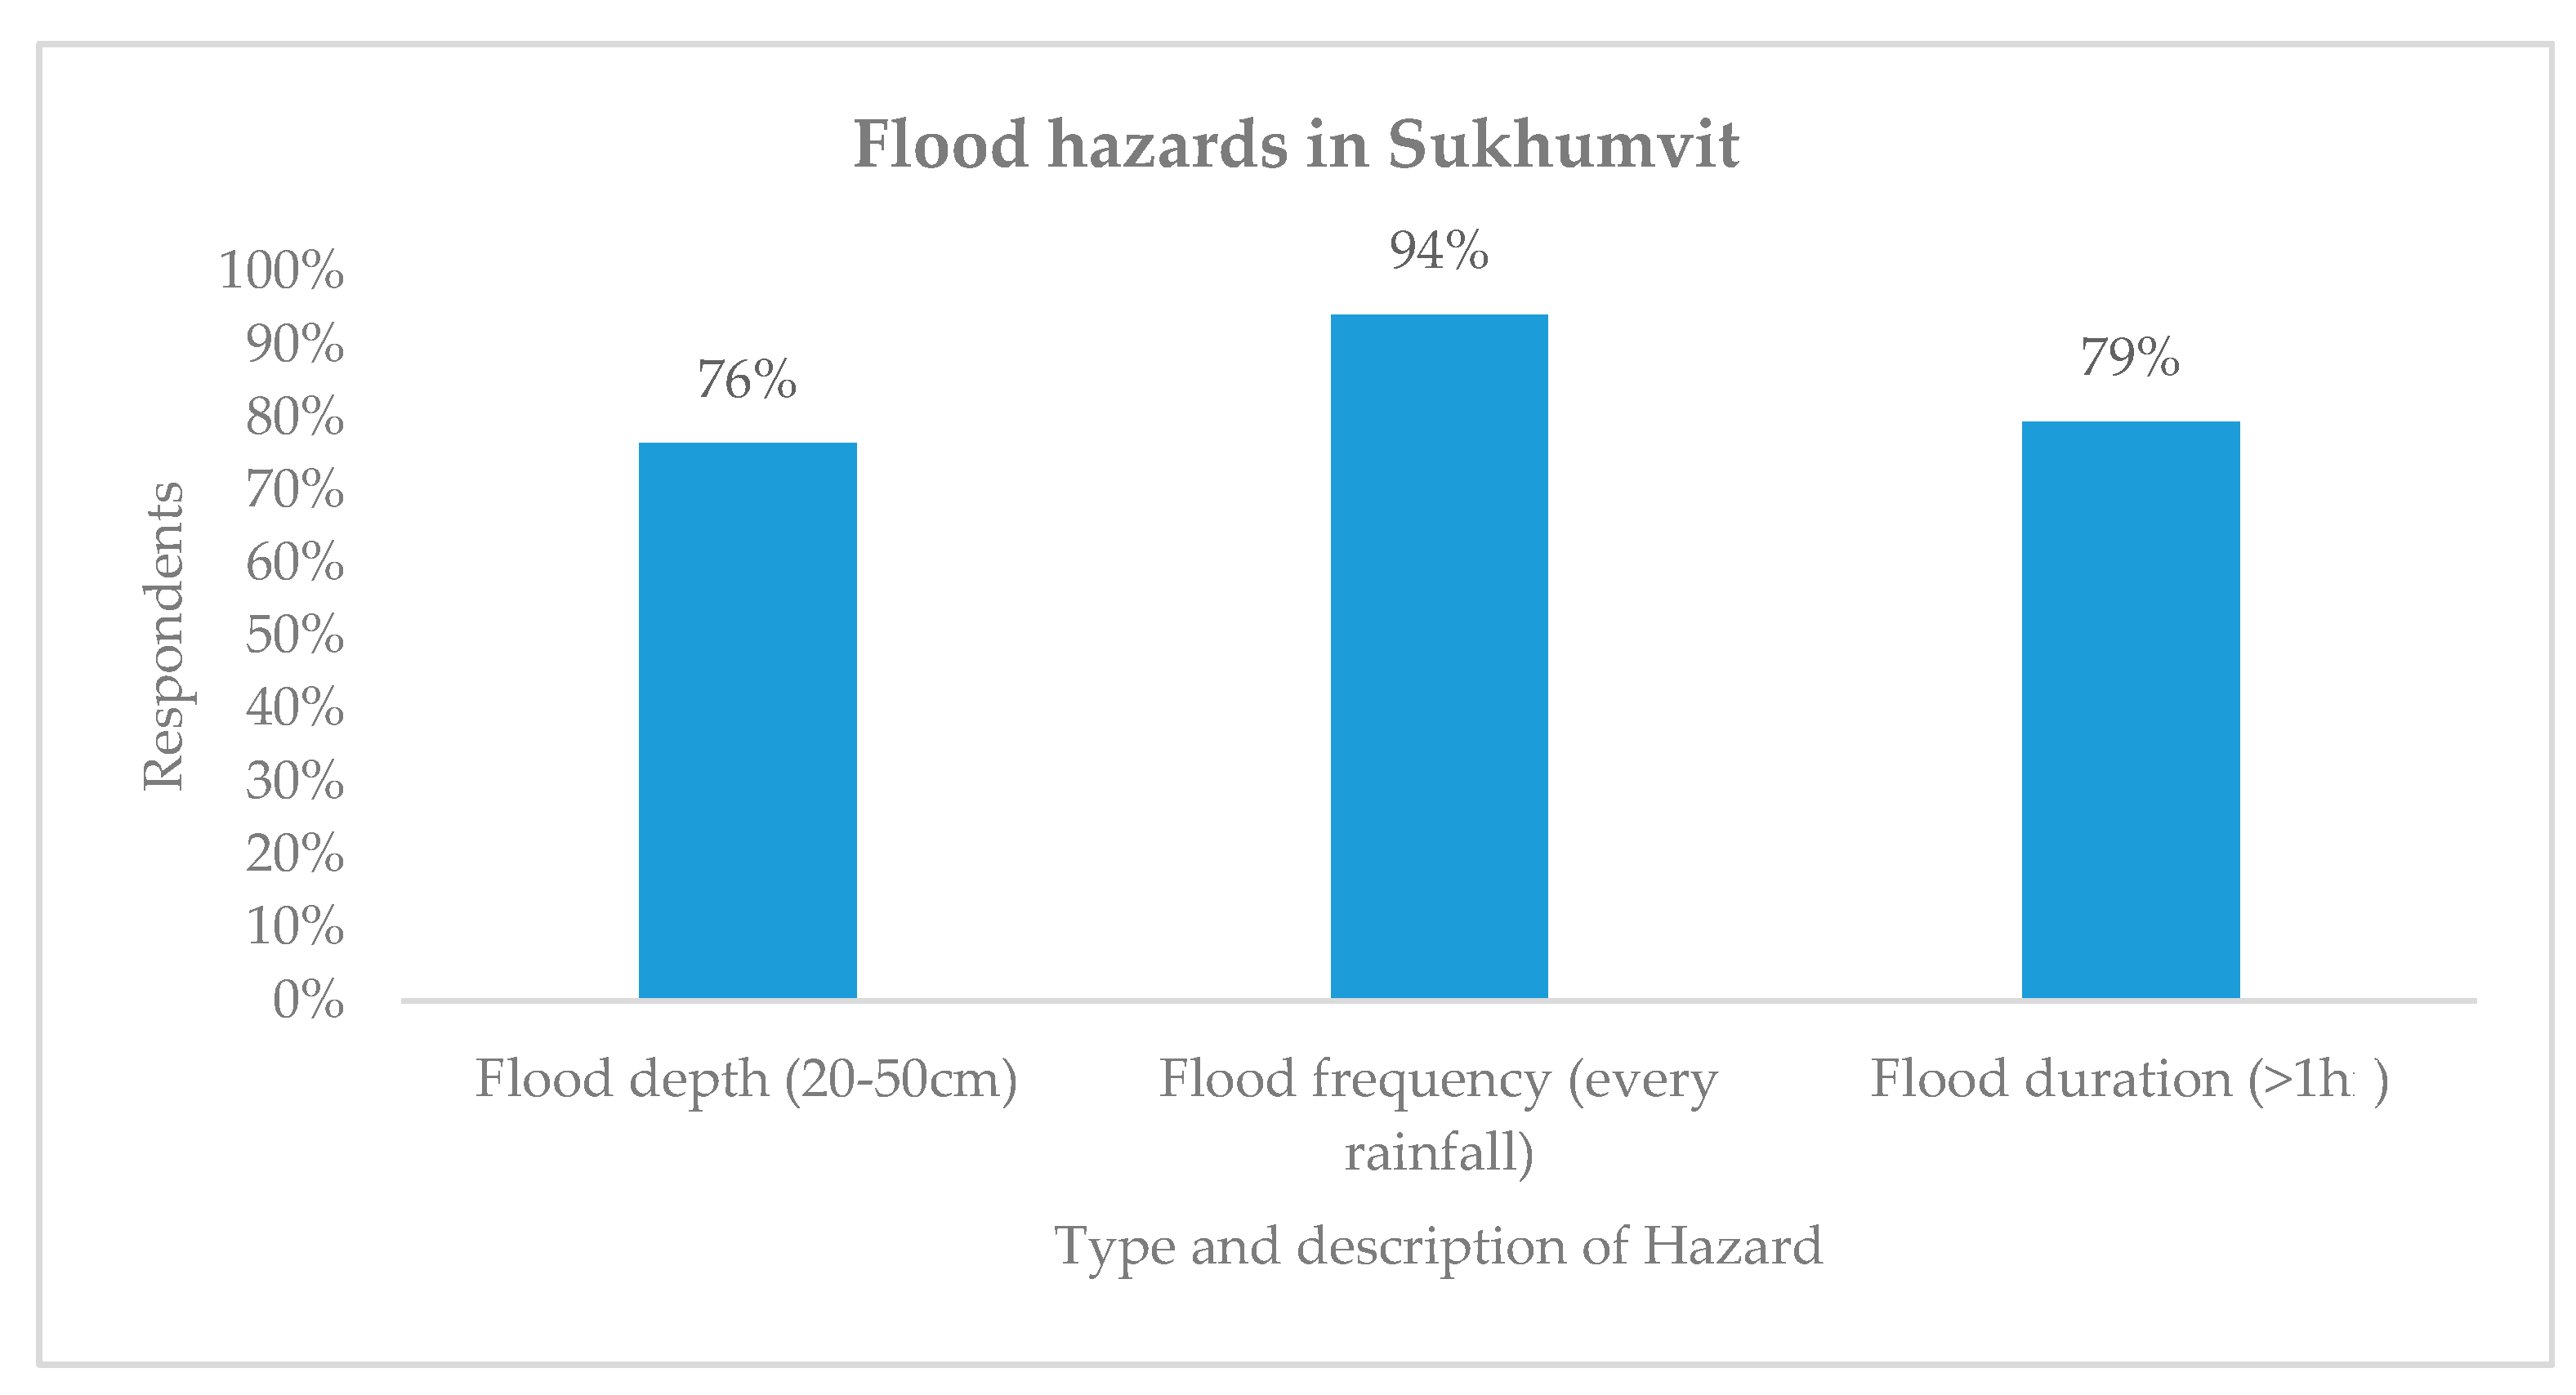
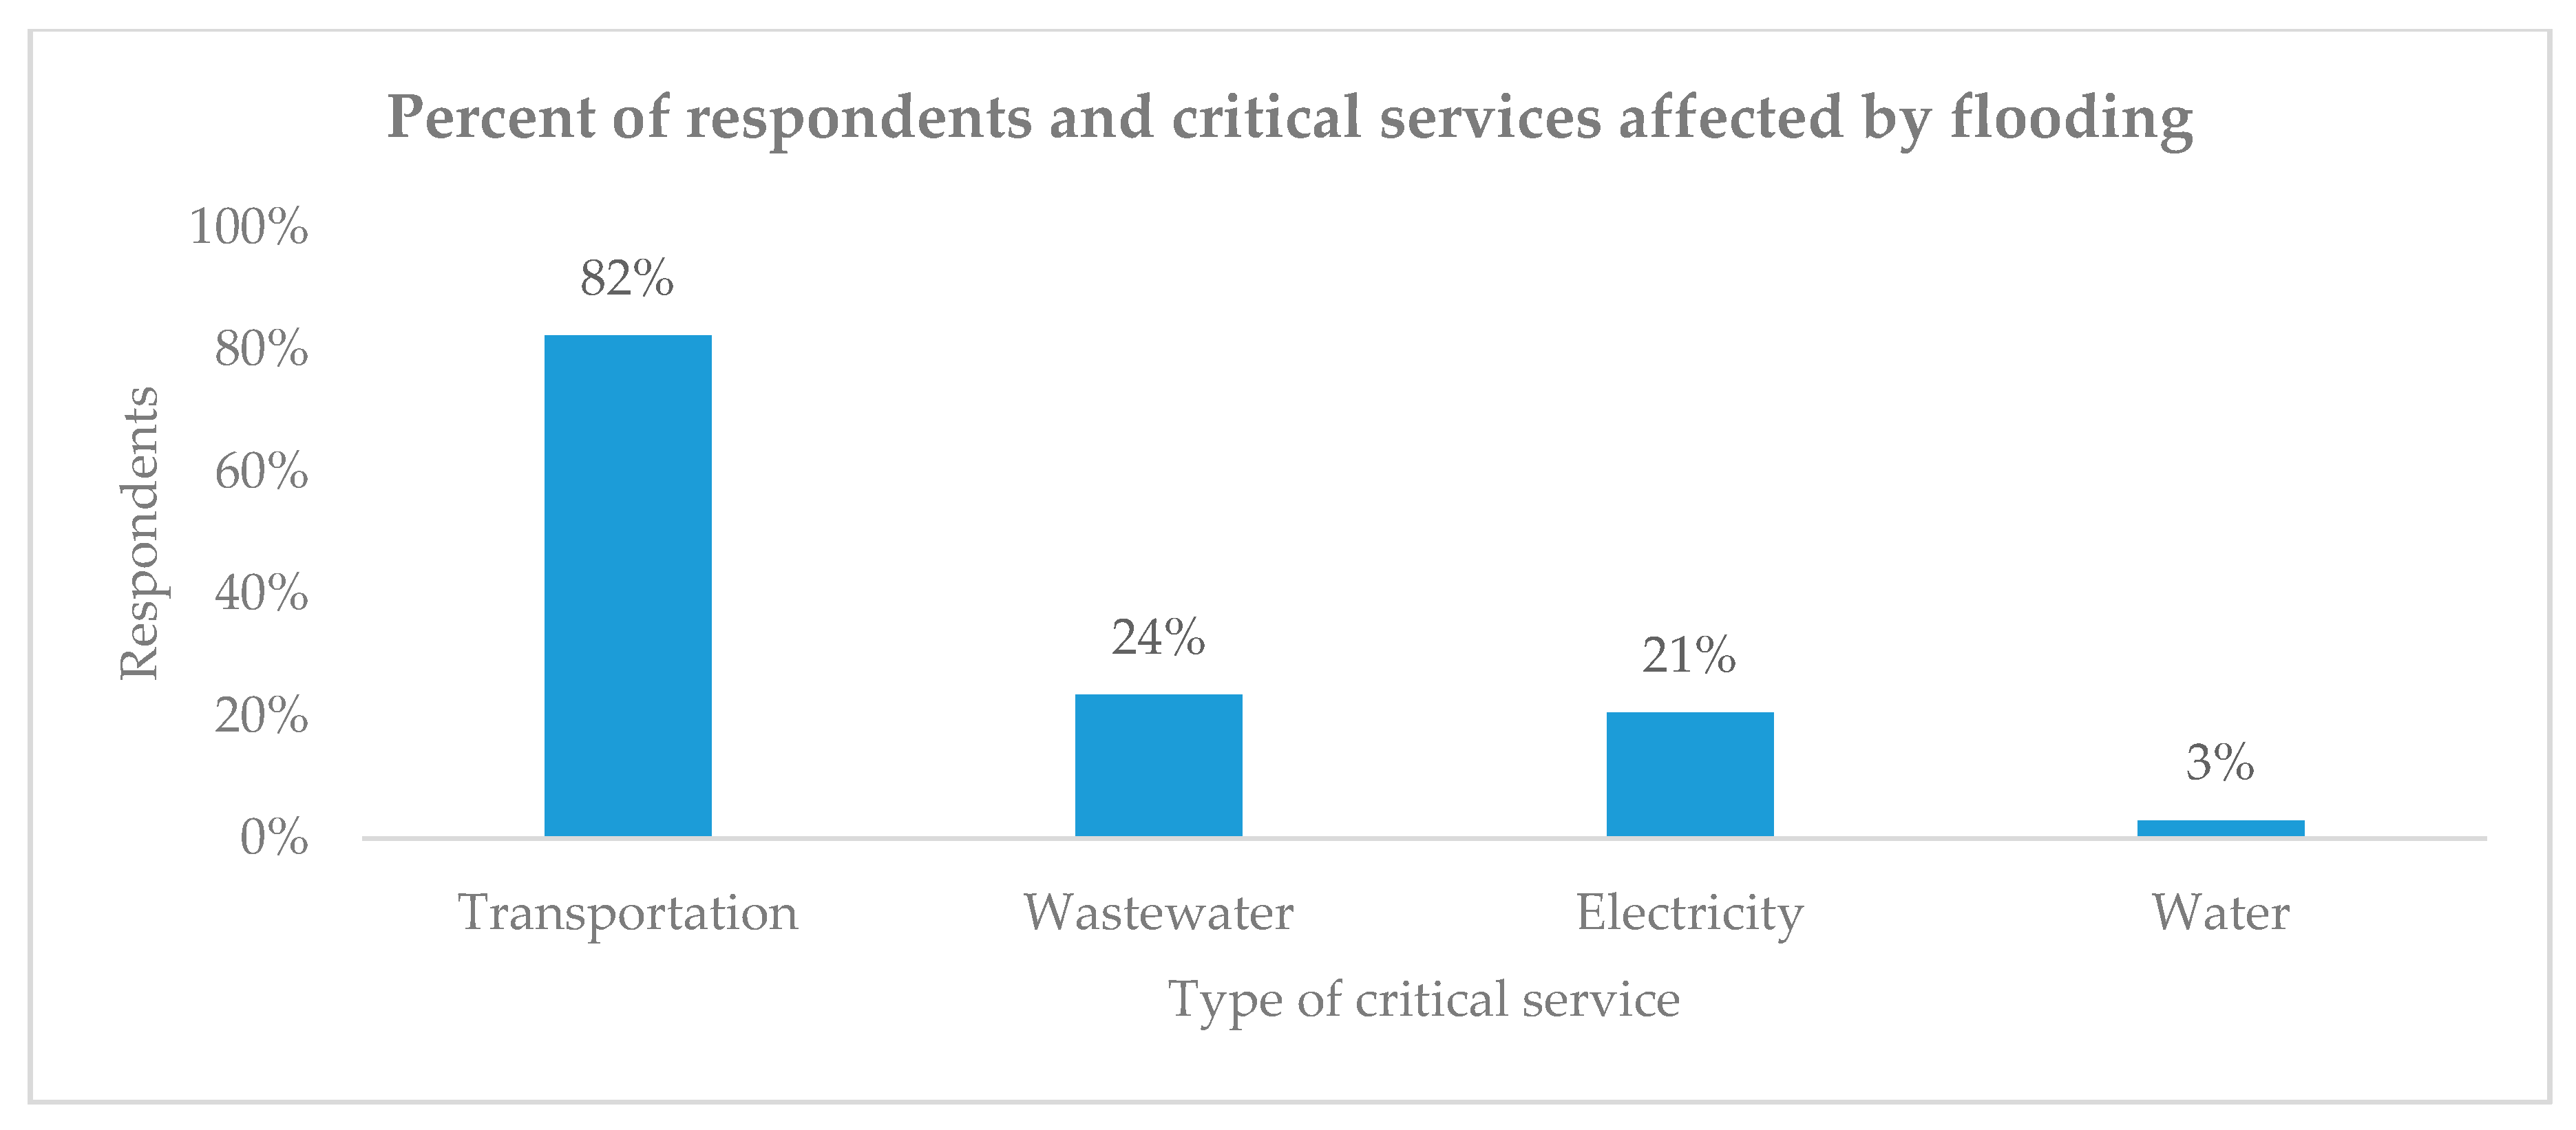
3.3.1. Interviews with Residents and Business Owners
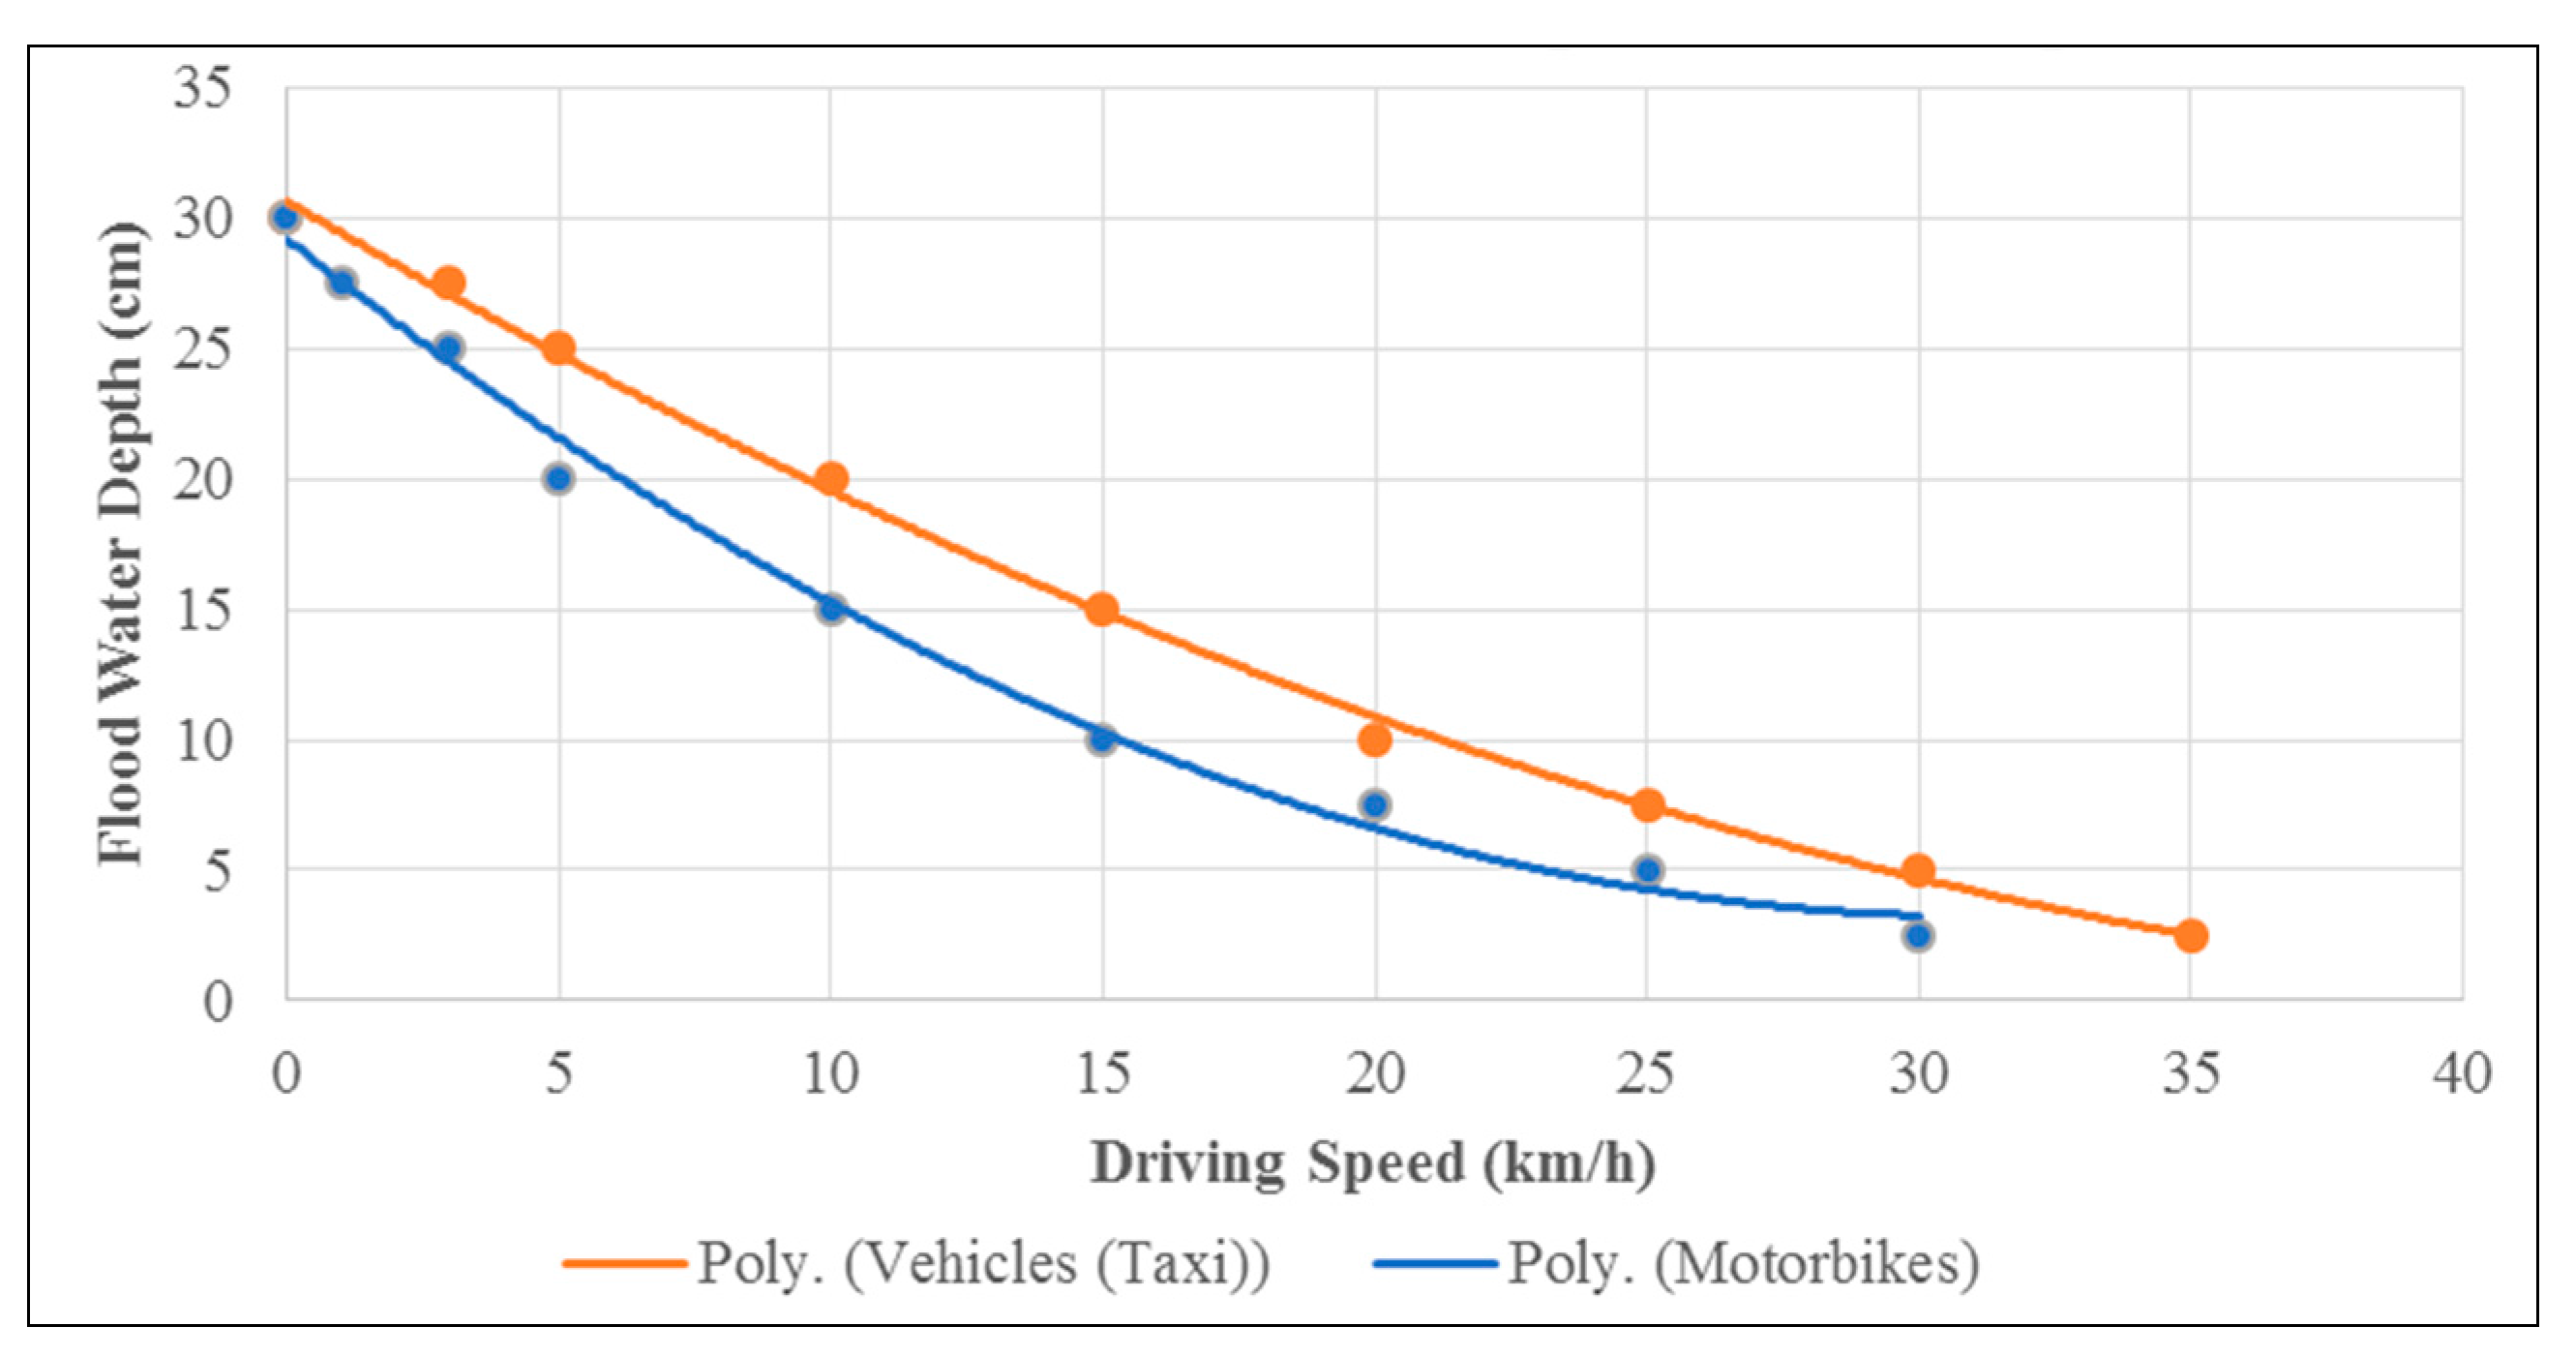
3.3.2. Interviews with Drivers of Vehicles and Motorbikes
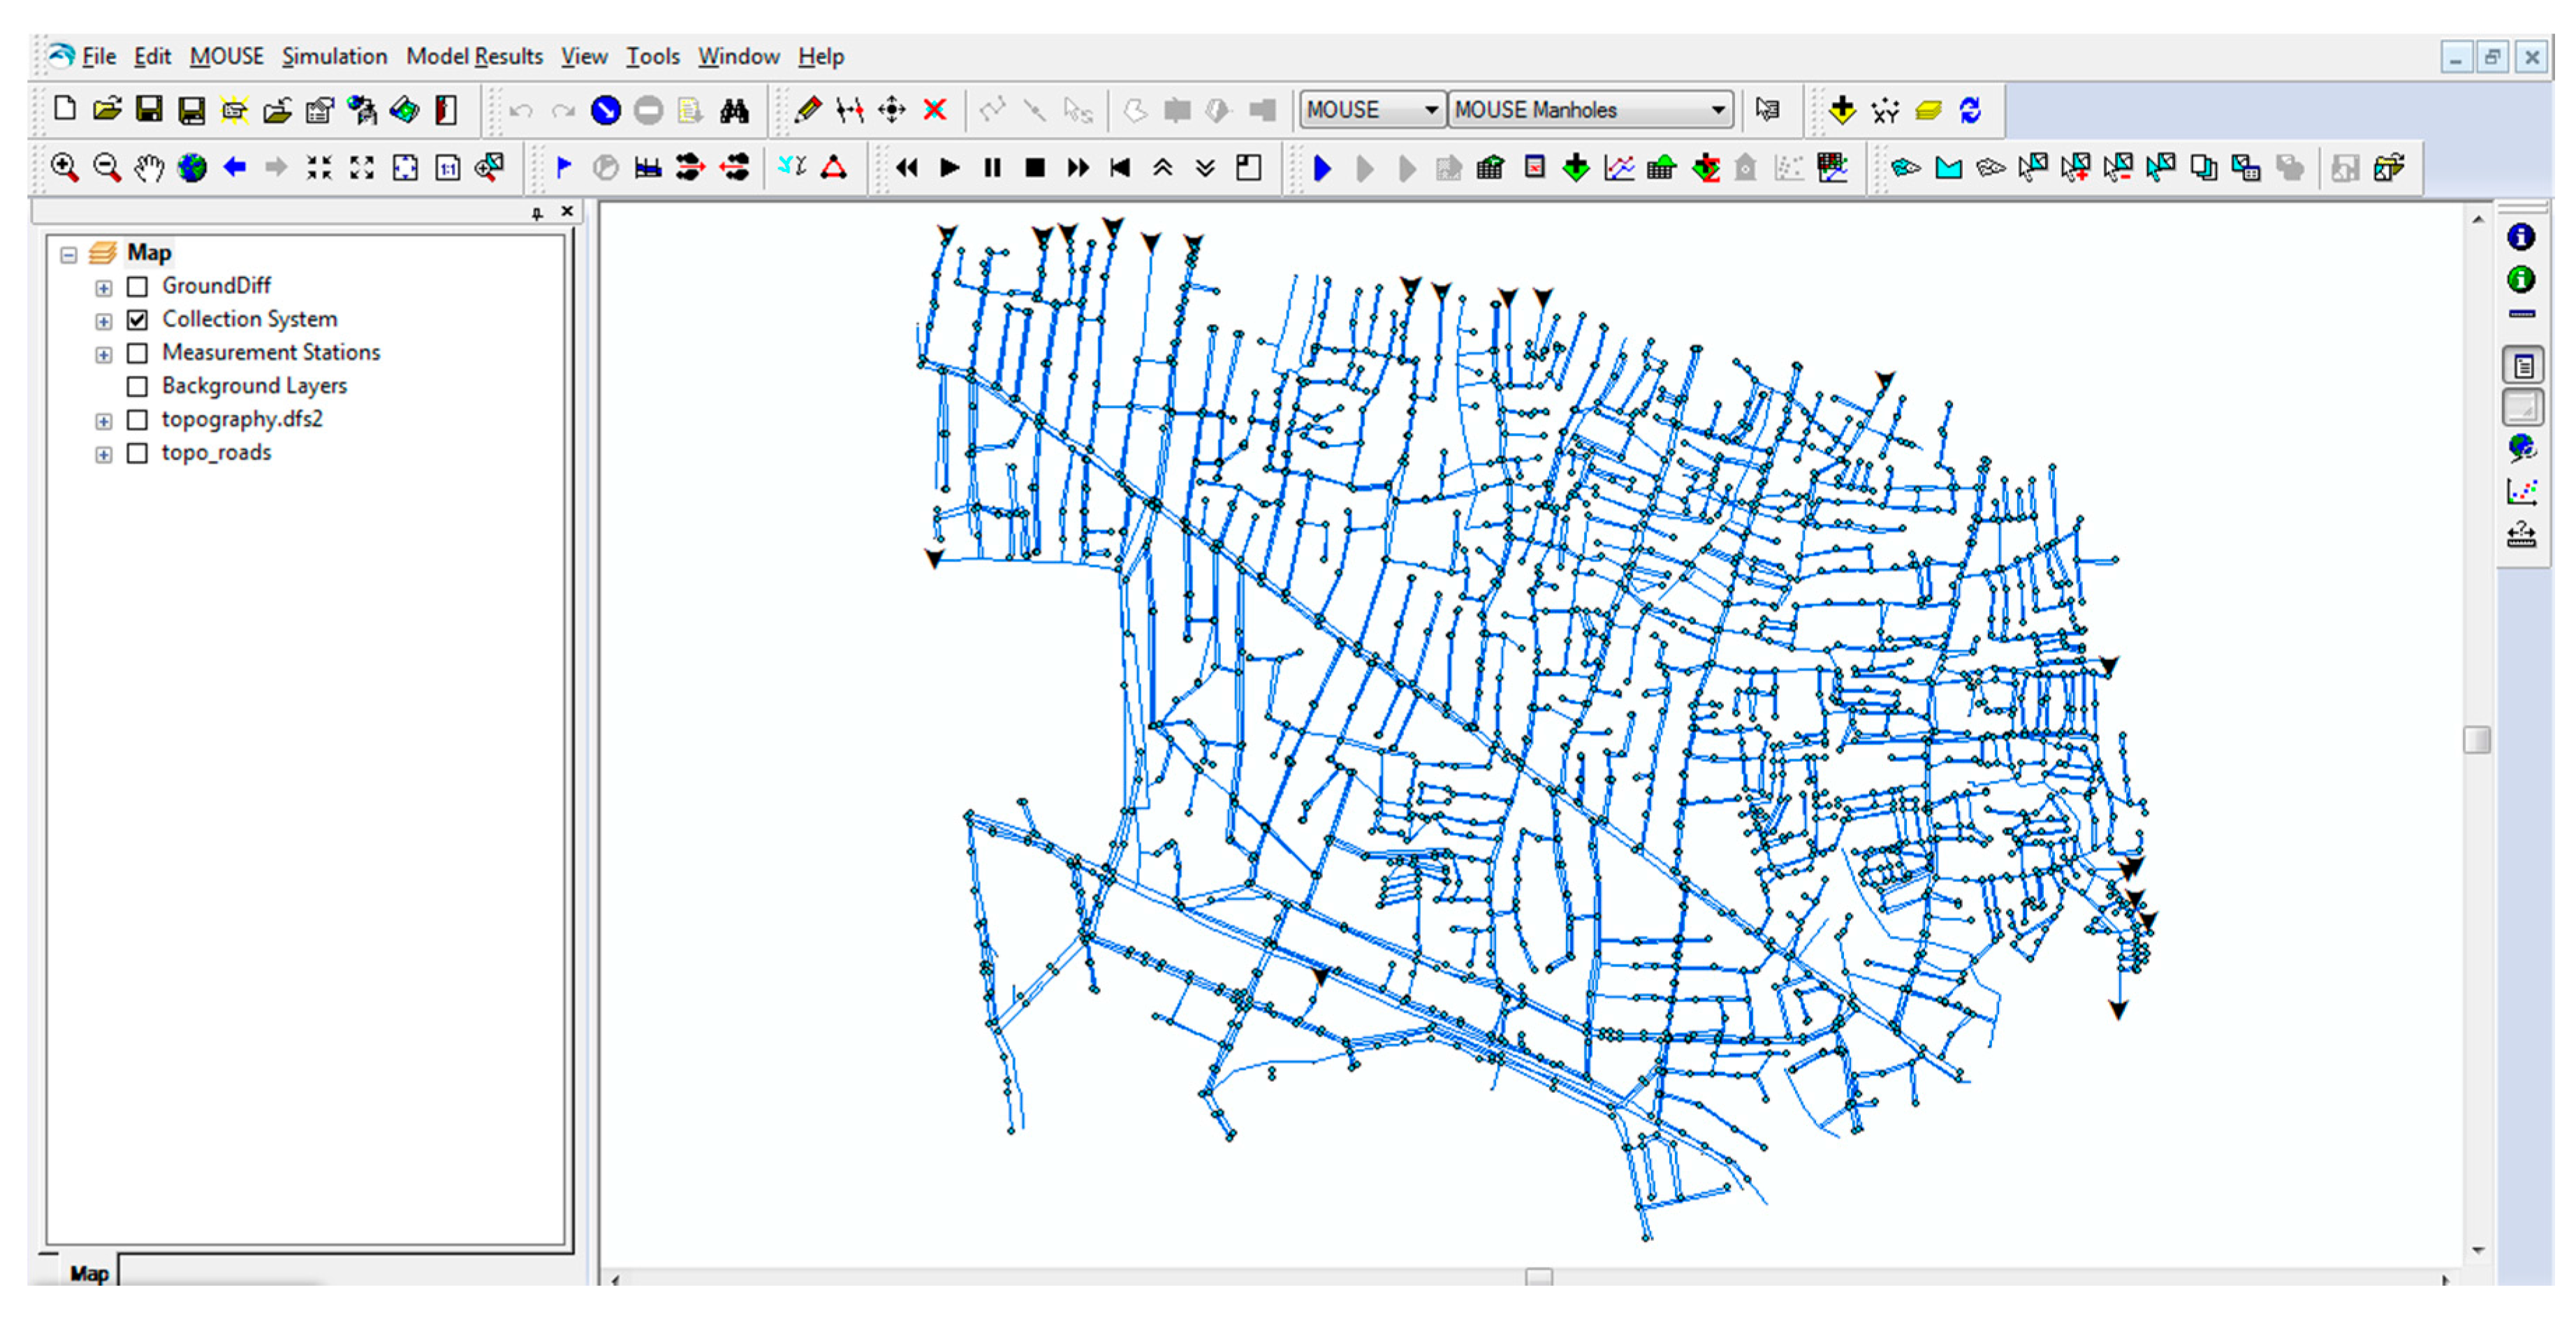
3.3.3. Analysing Data from Critical Infrastructure Operators
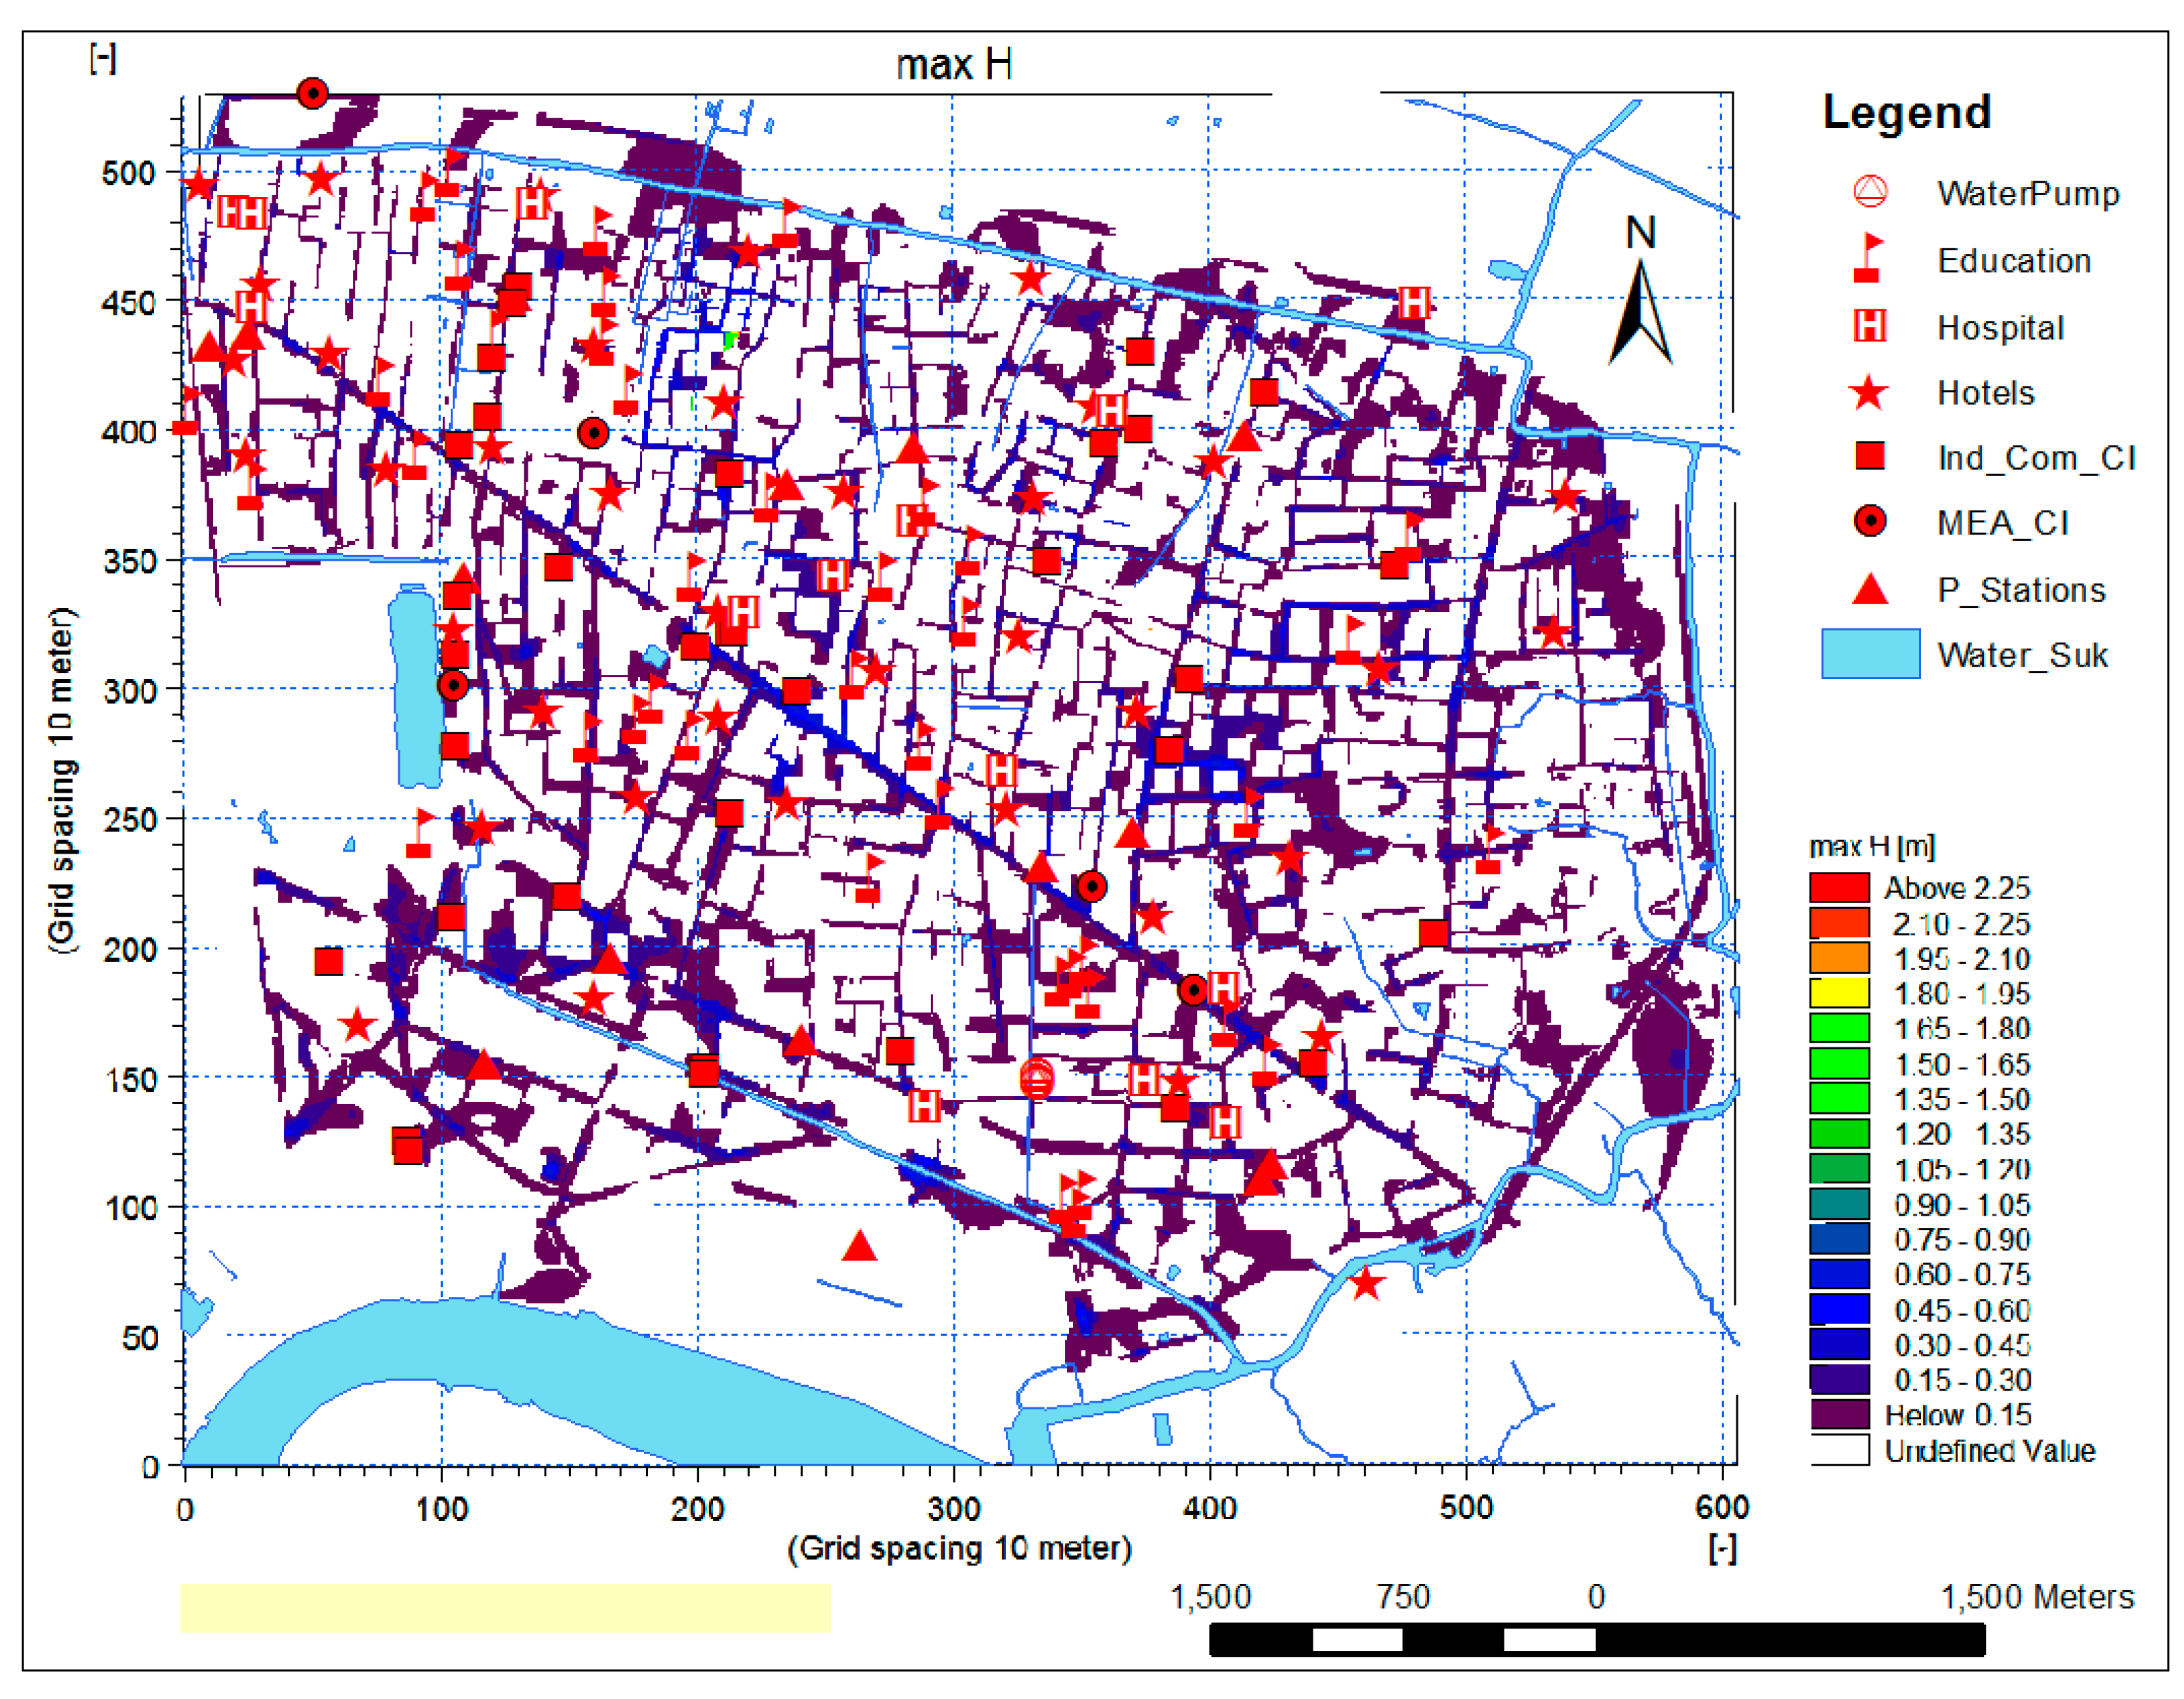
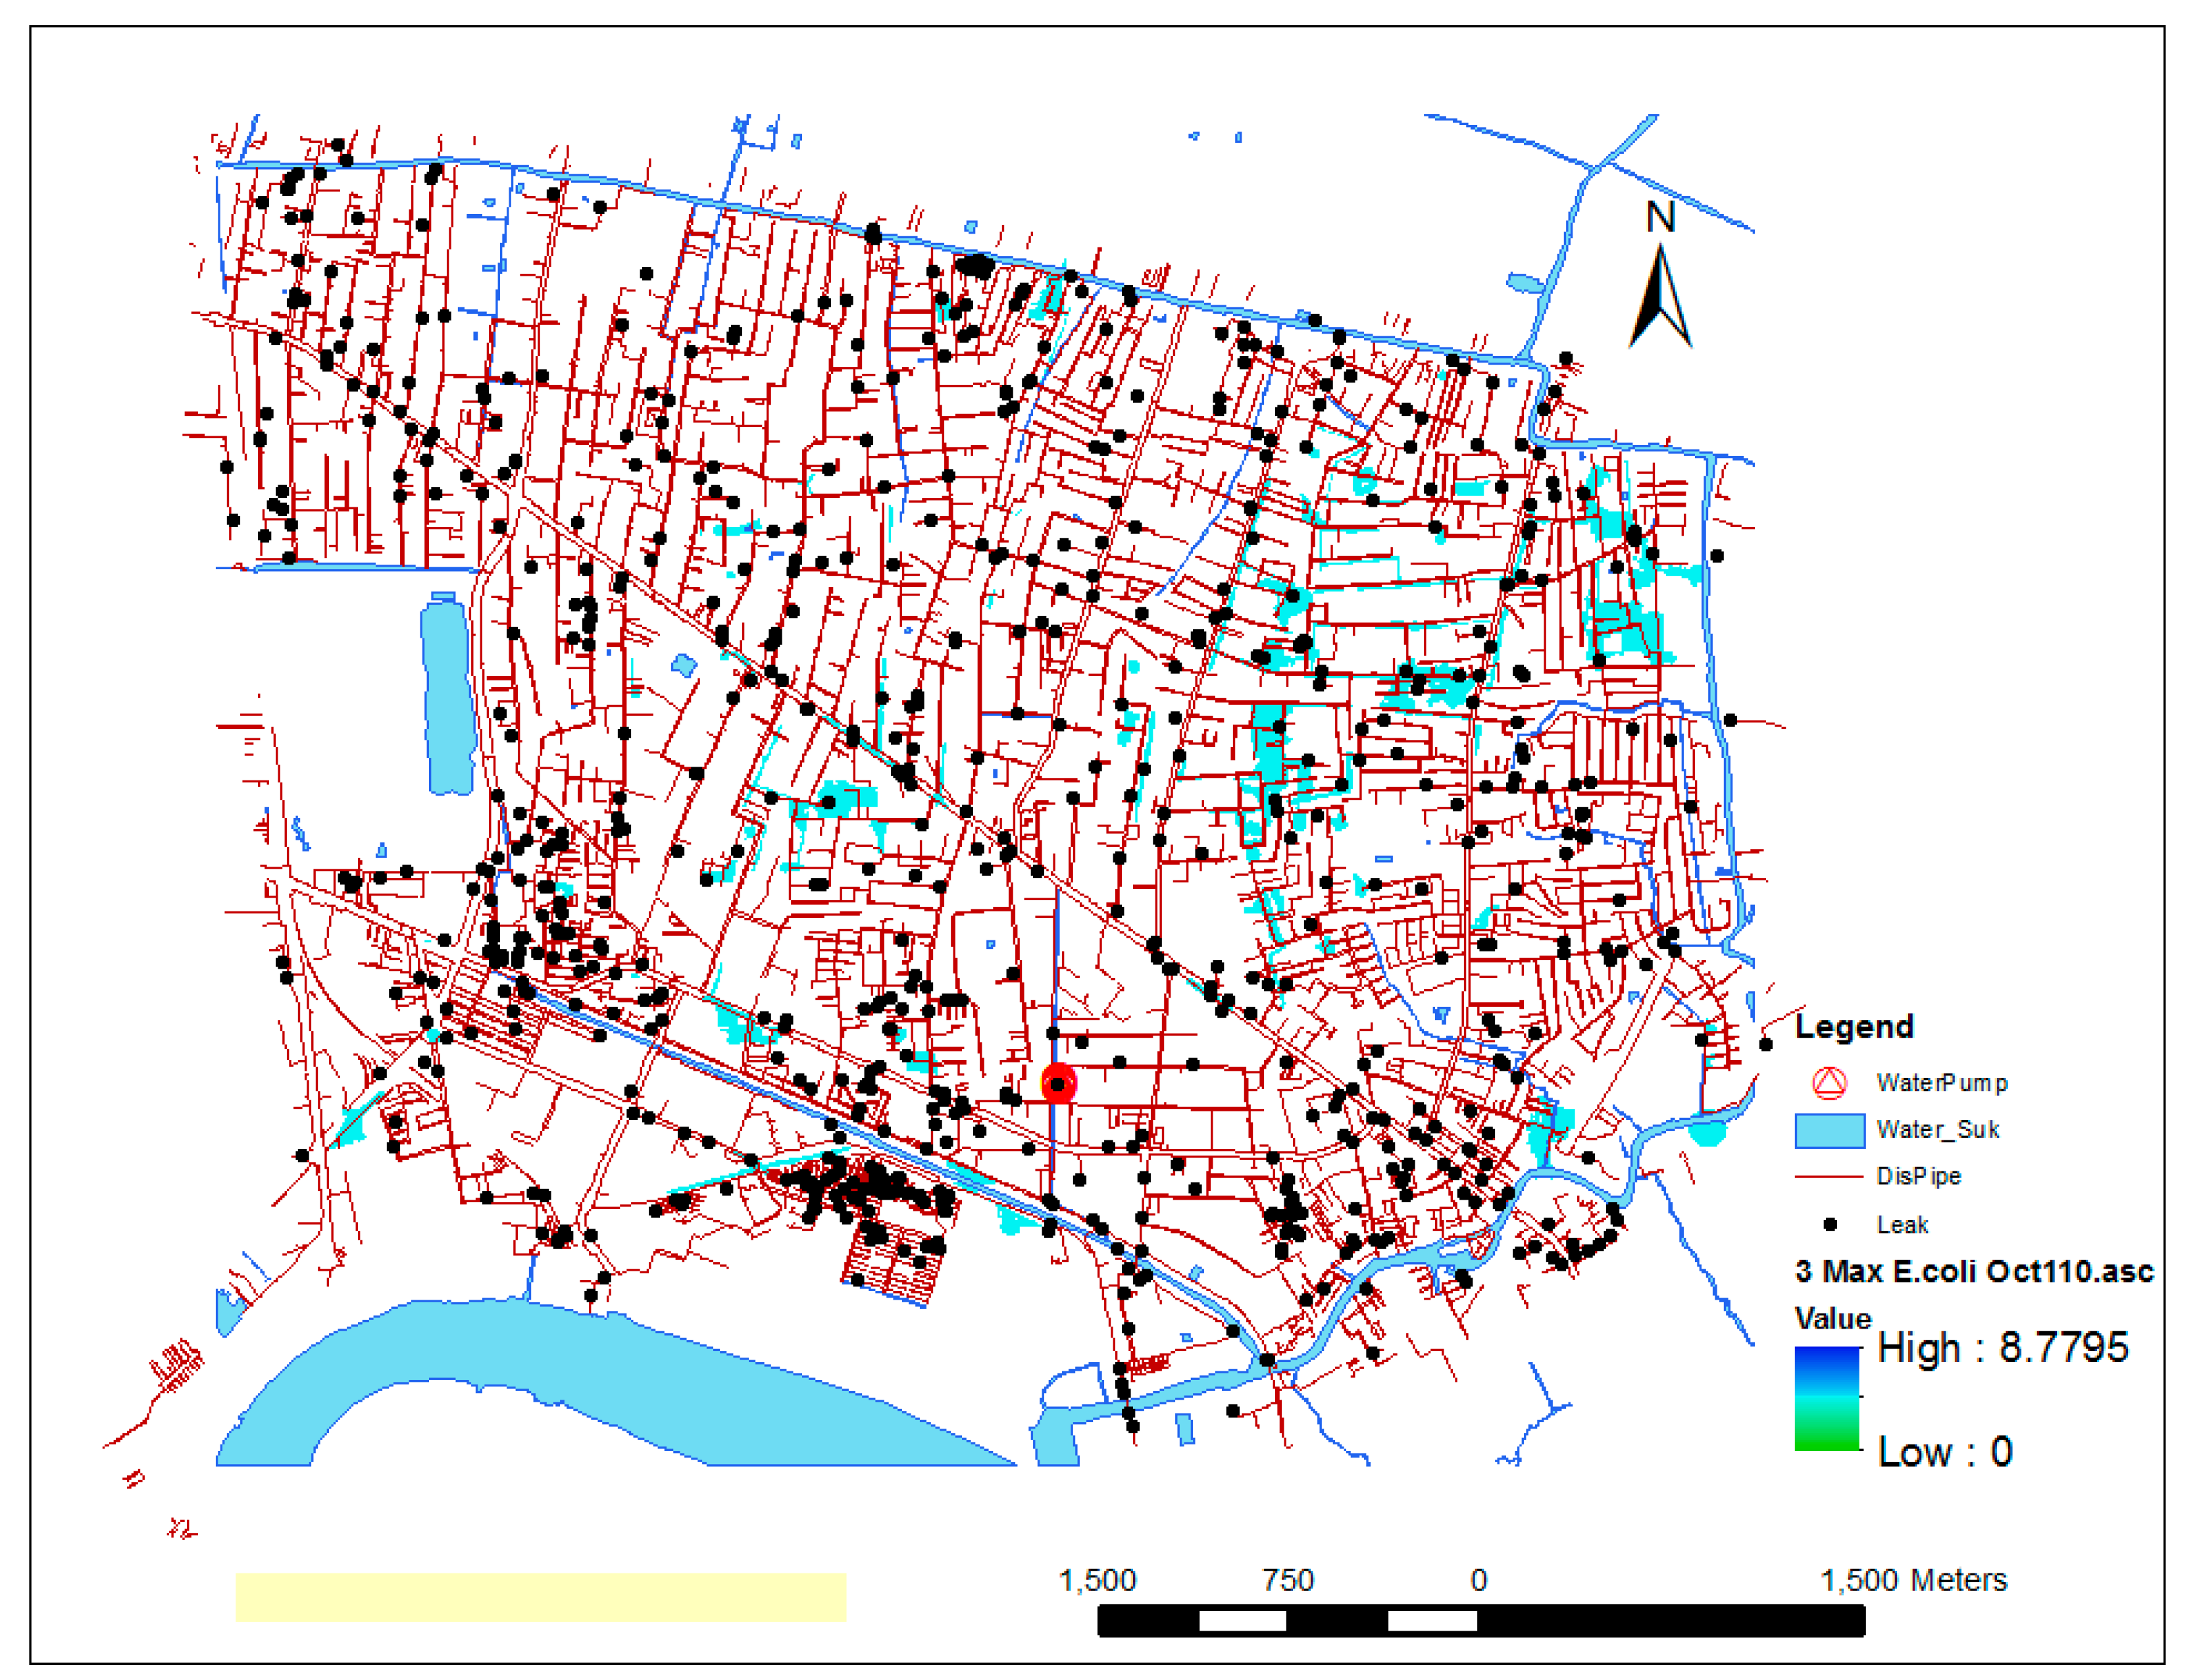
3.3.4. Overlaying Flood Hazard Data with Critical Infrastructure Data
3.4. Impact Assessment
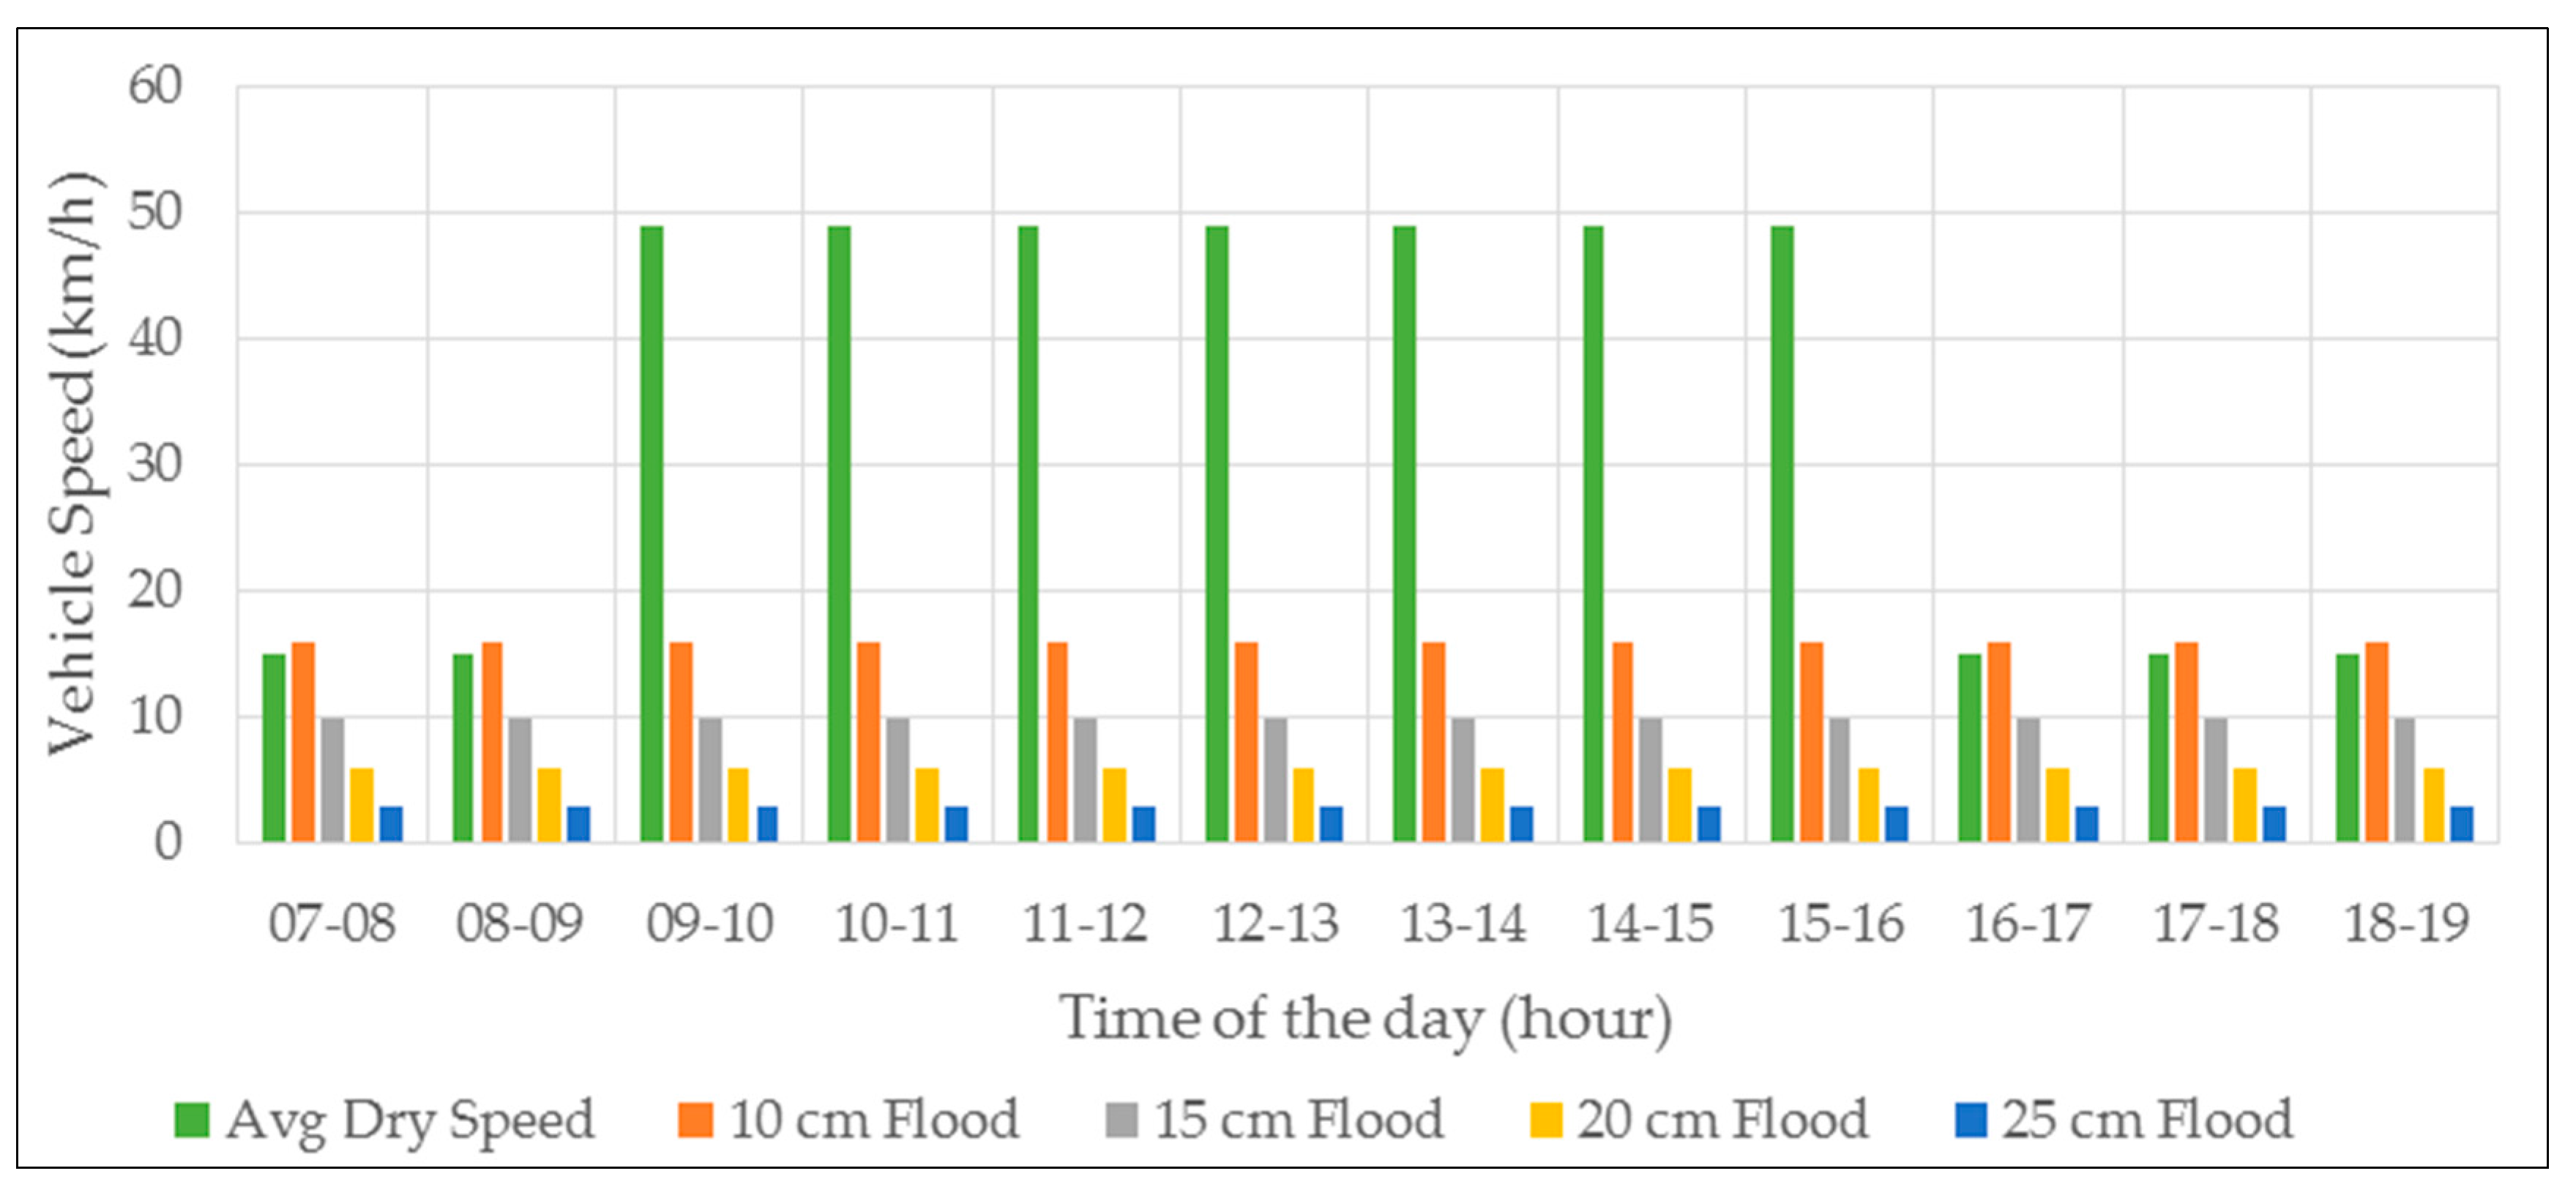
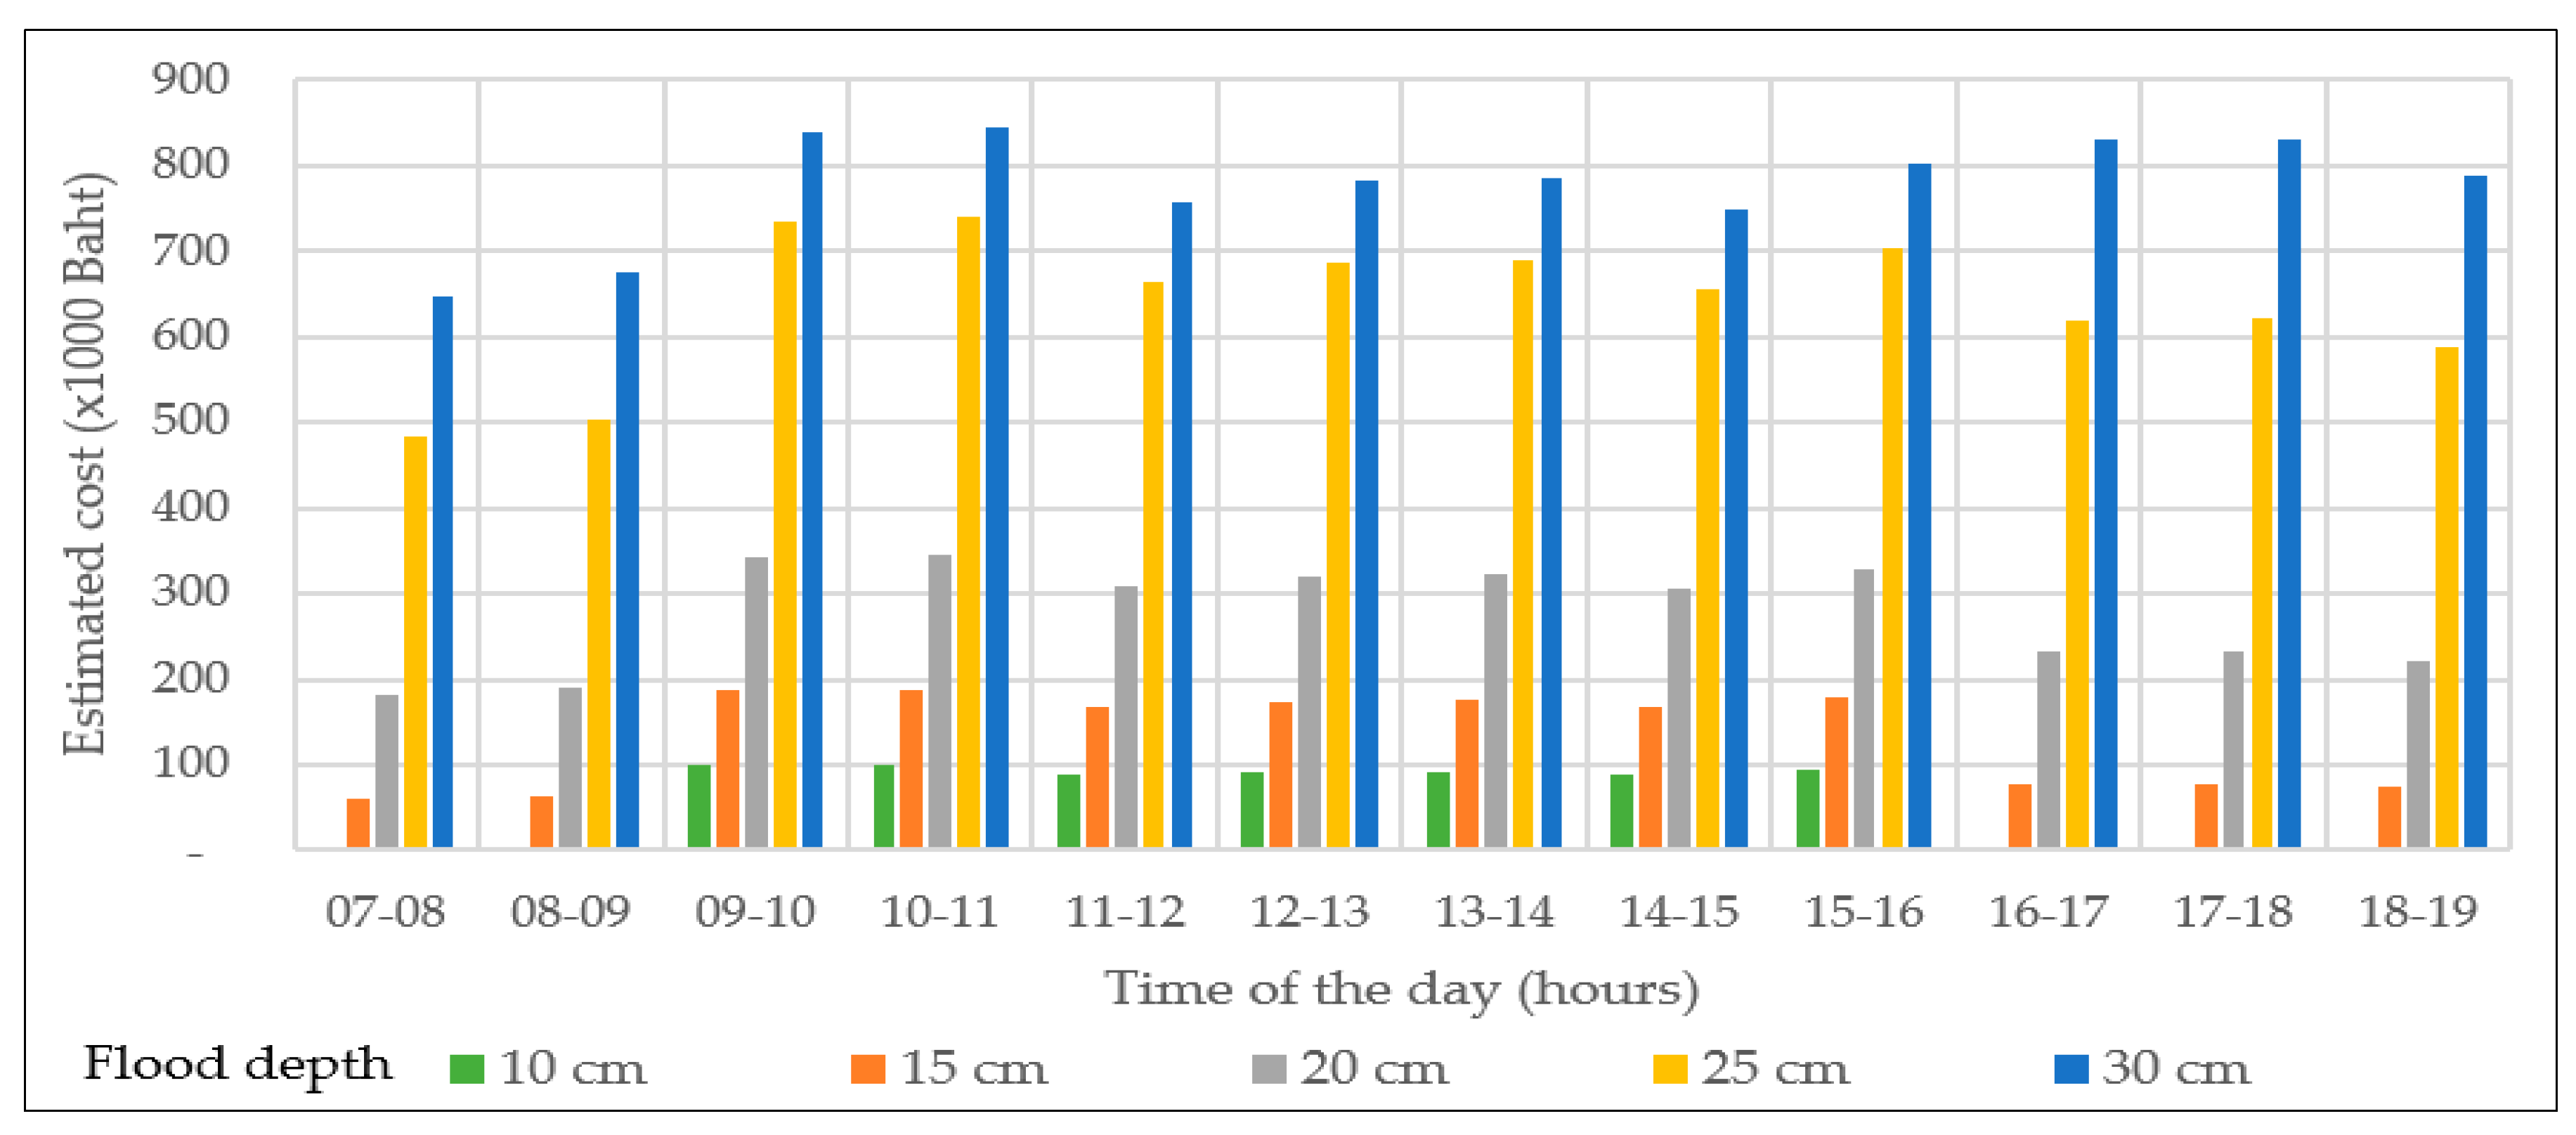
3.4.1. Assessment of Impacts on Transportation Services
- In case of no flood, the vehicles will drive at the average speed for that particular hour.
- The vehicles using alternative routes during flood events will also experience the same delay effects. Therefore, all vehicles in the area will be considered affected.
- The average number of vehicles passing through the road affected by the floodwater is given hourly in Figure 10.
- Larger vehicles will adjust to the speed of small vehicles despite their ability to drive faster through affected roads.
- delay time in hours ,
Vf = speed of vehicle on flooded road (km/h)
Vd = speed of vehicle on dry road (km/h)
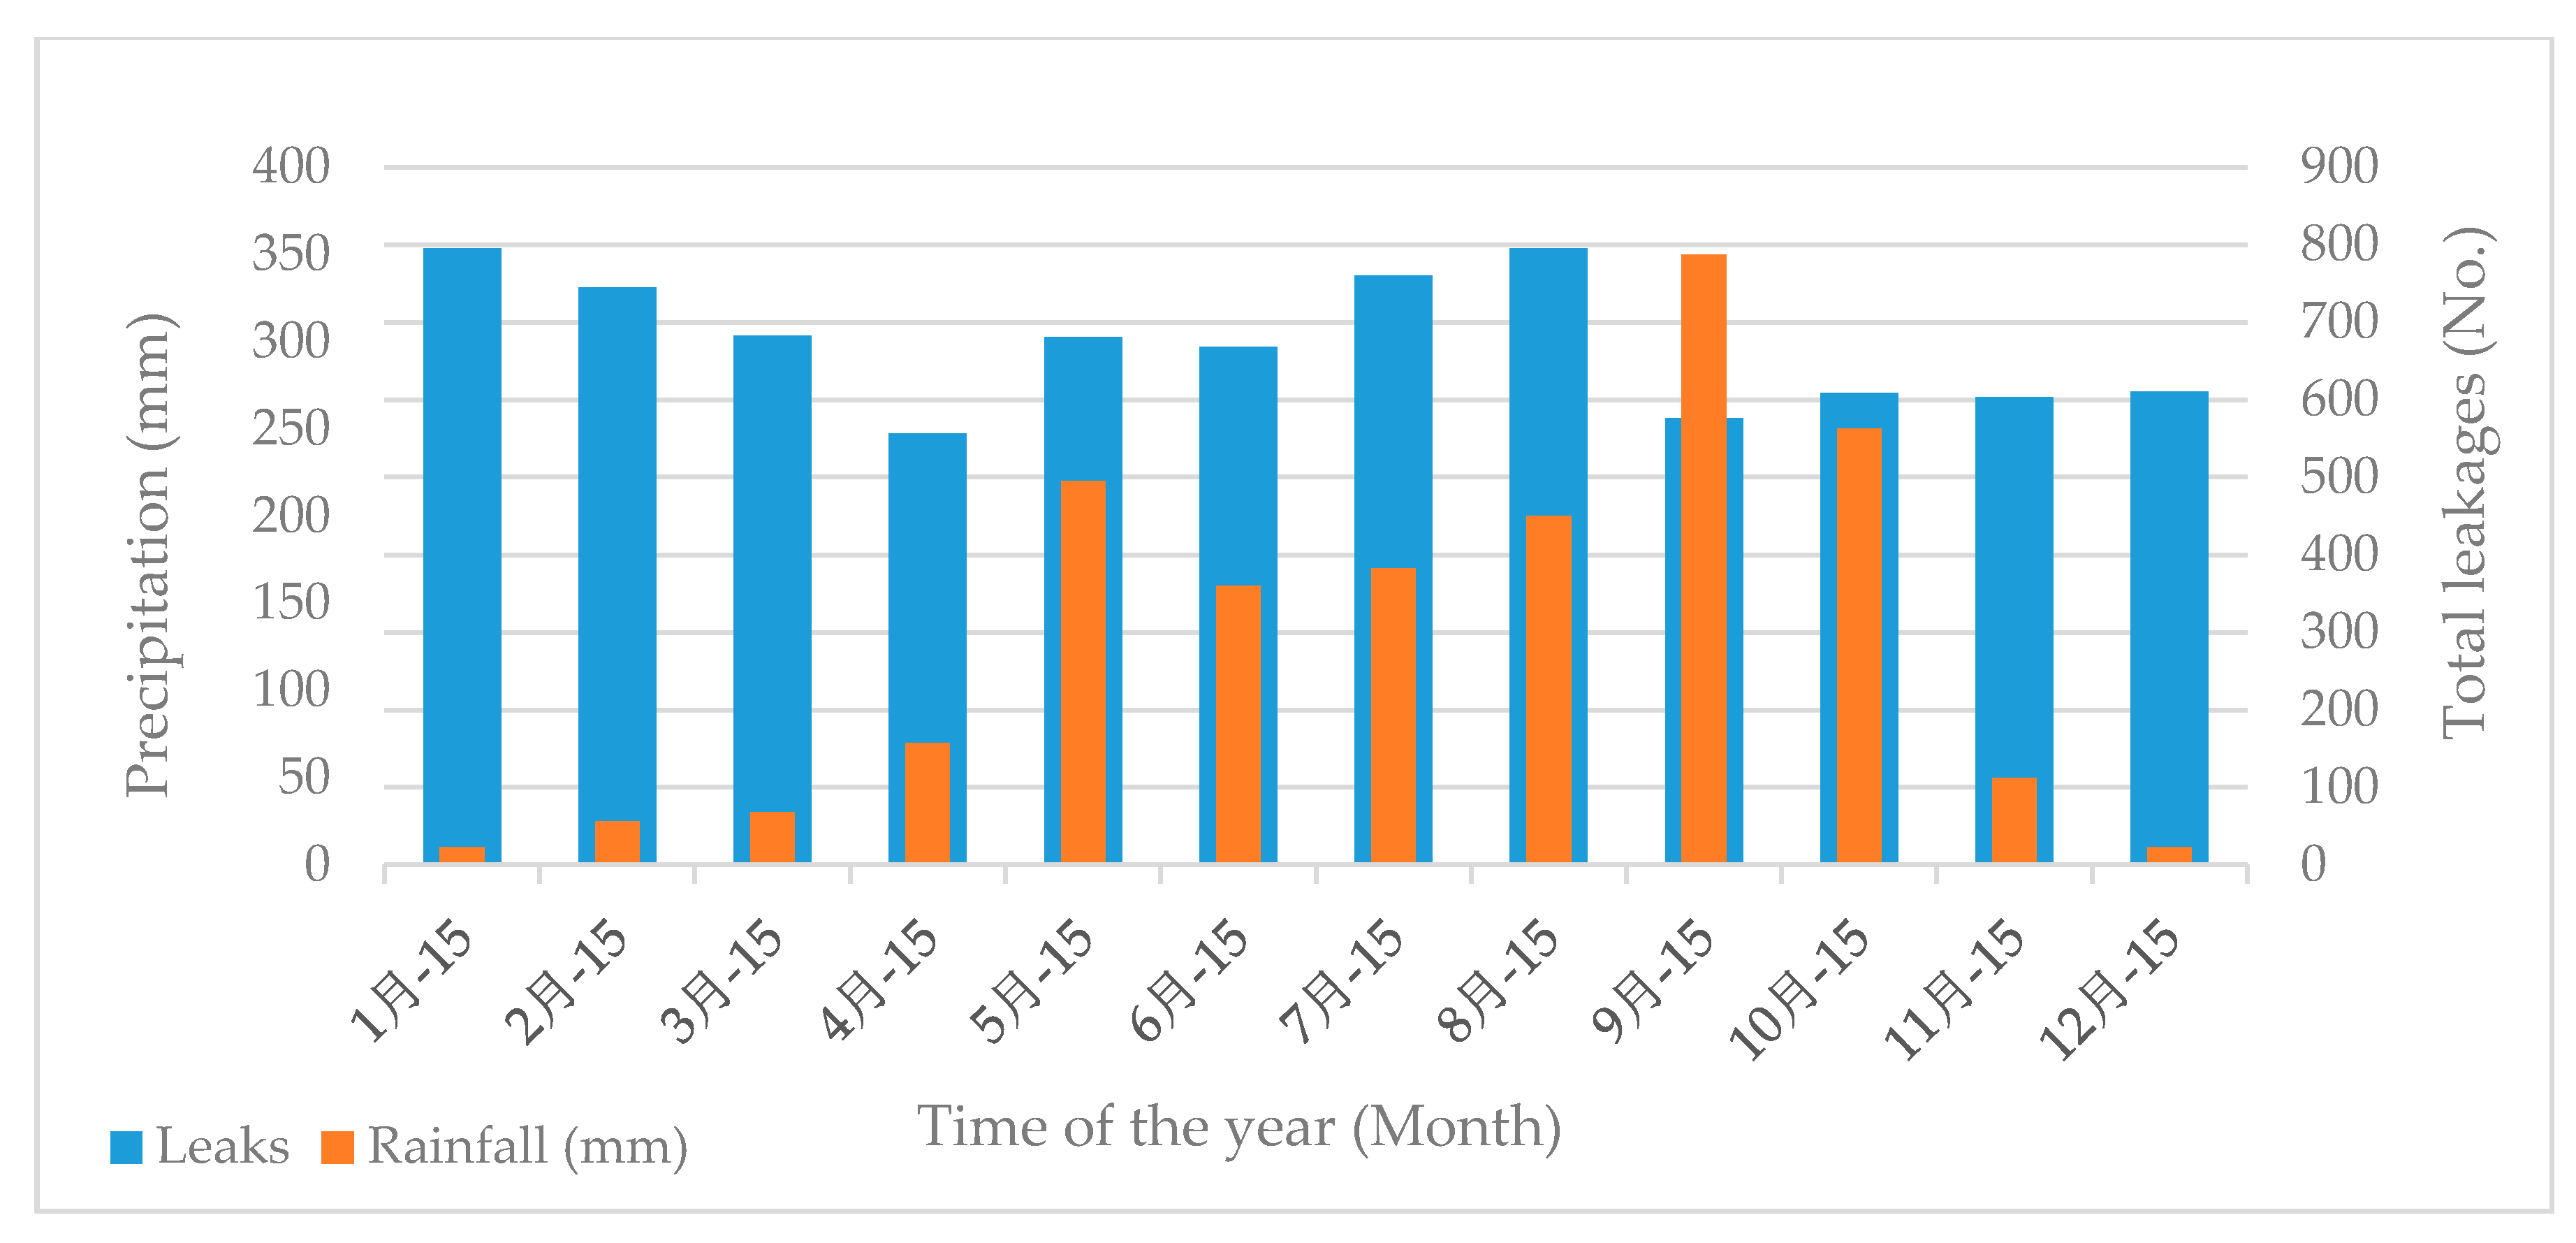
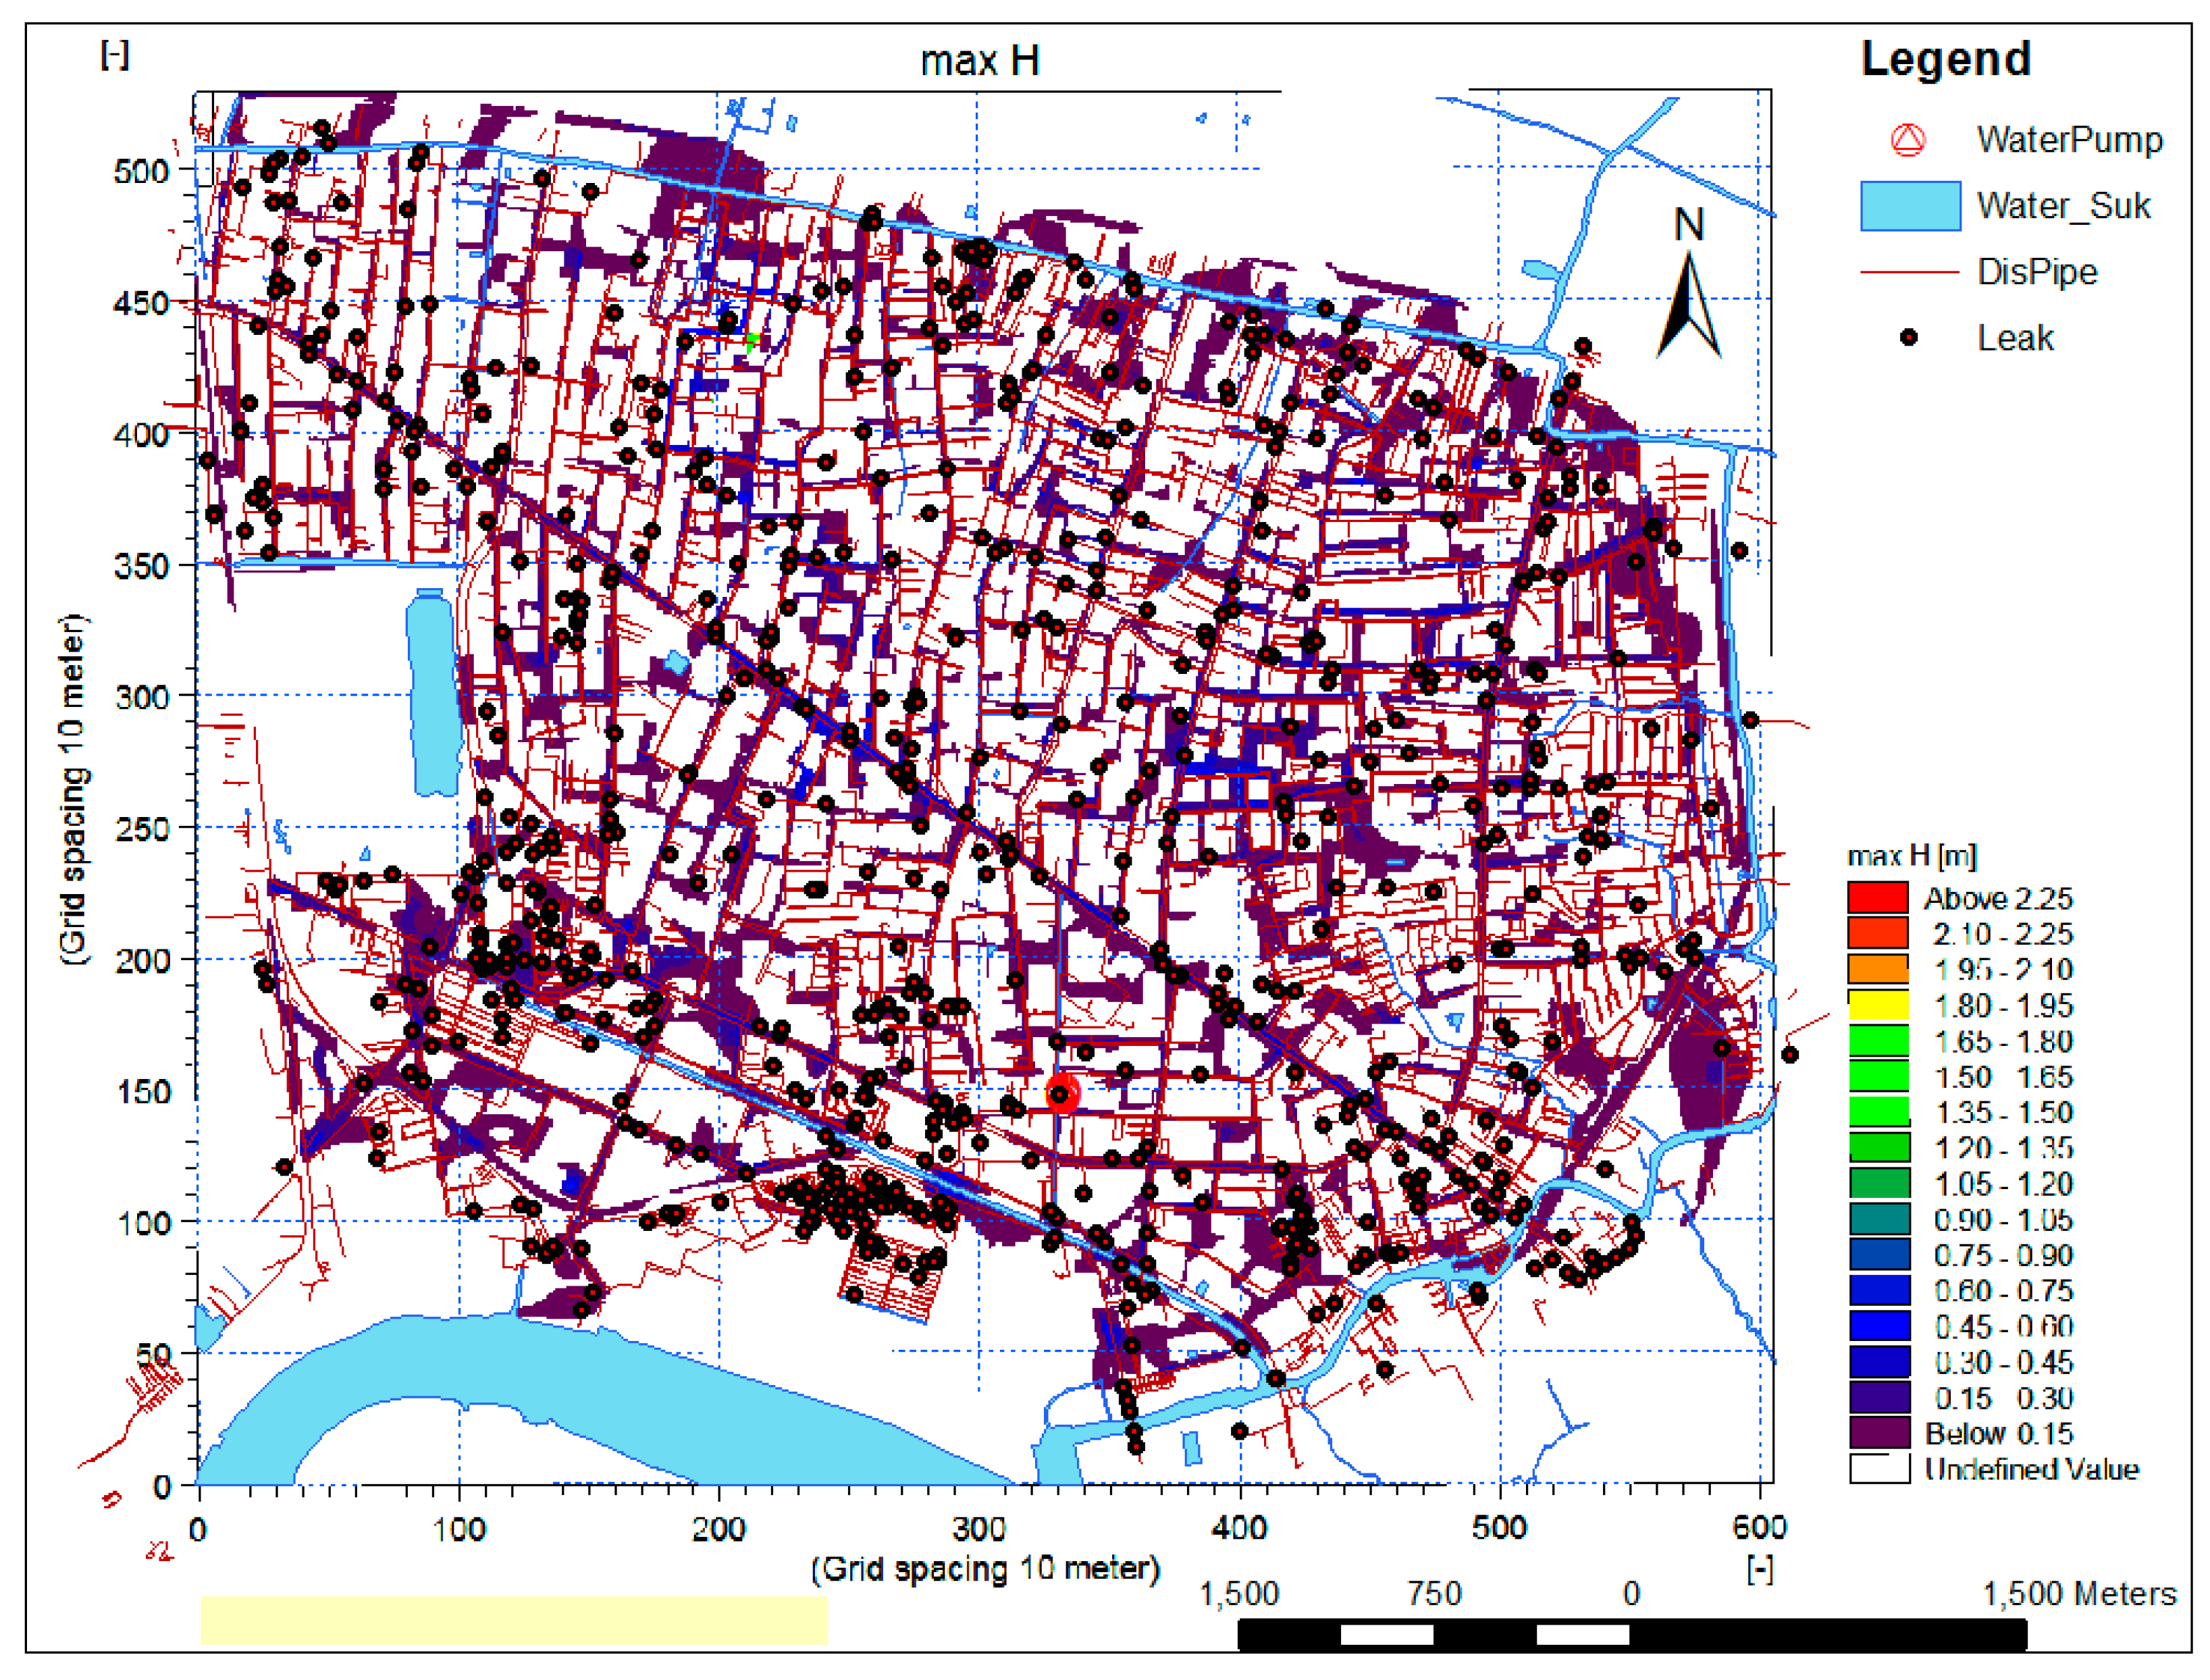
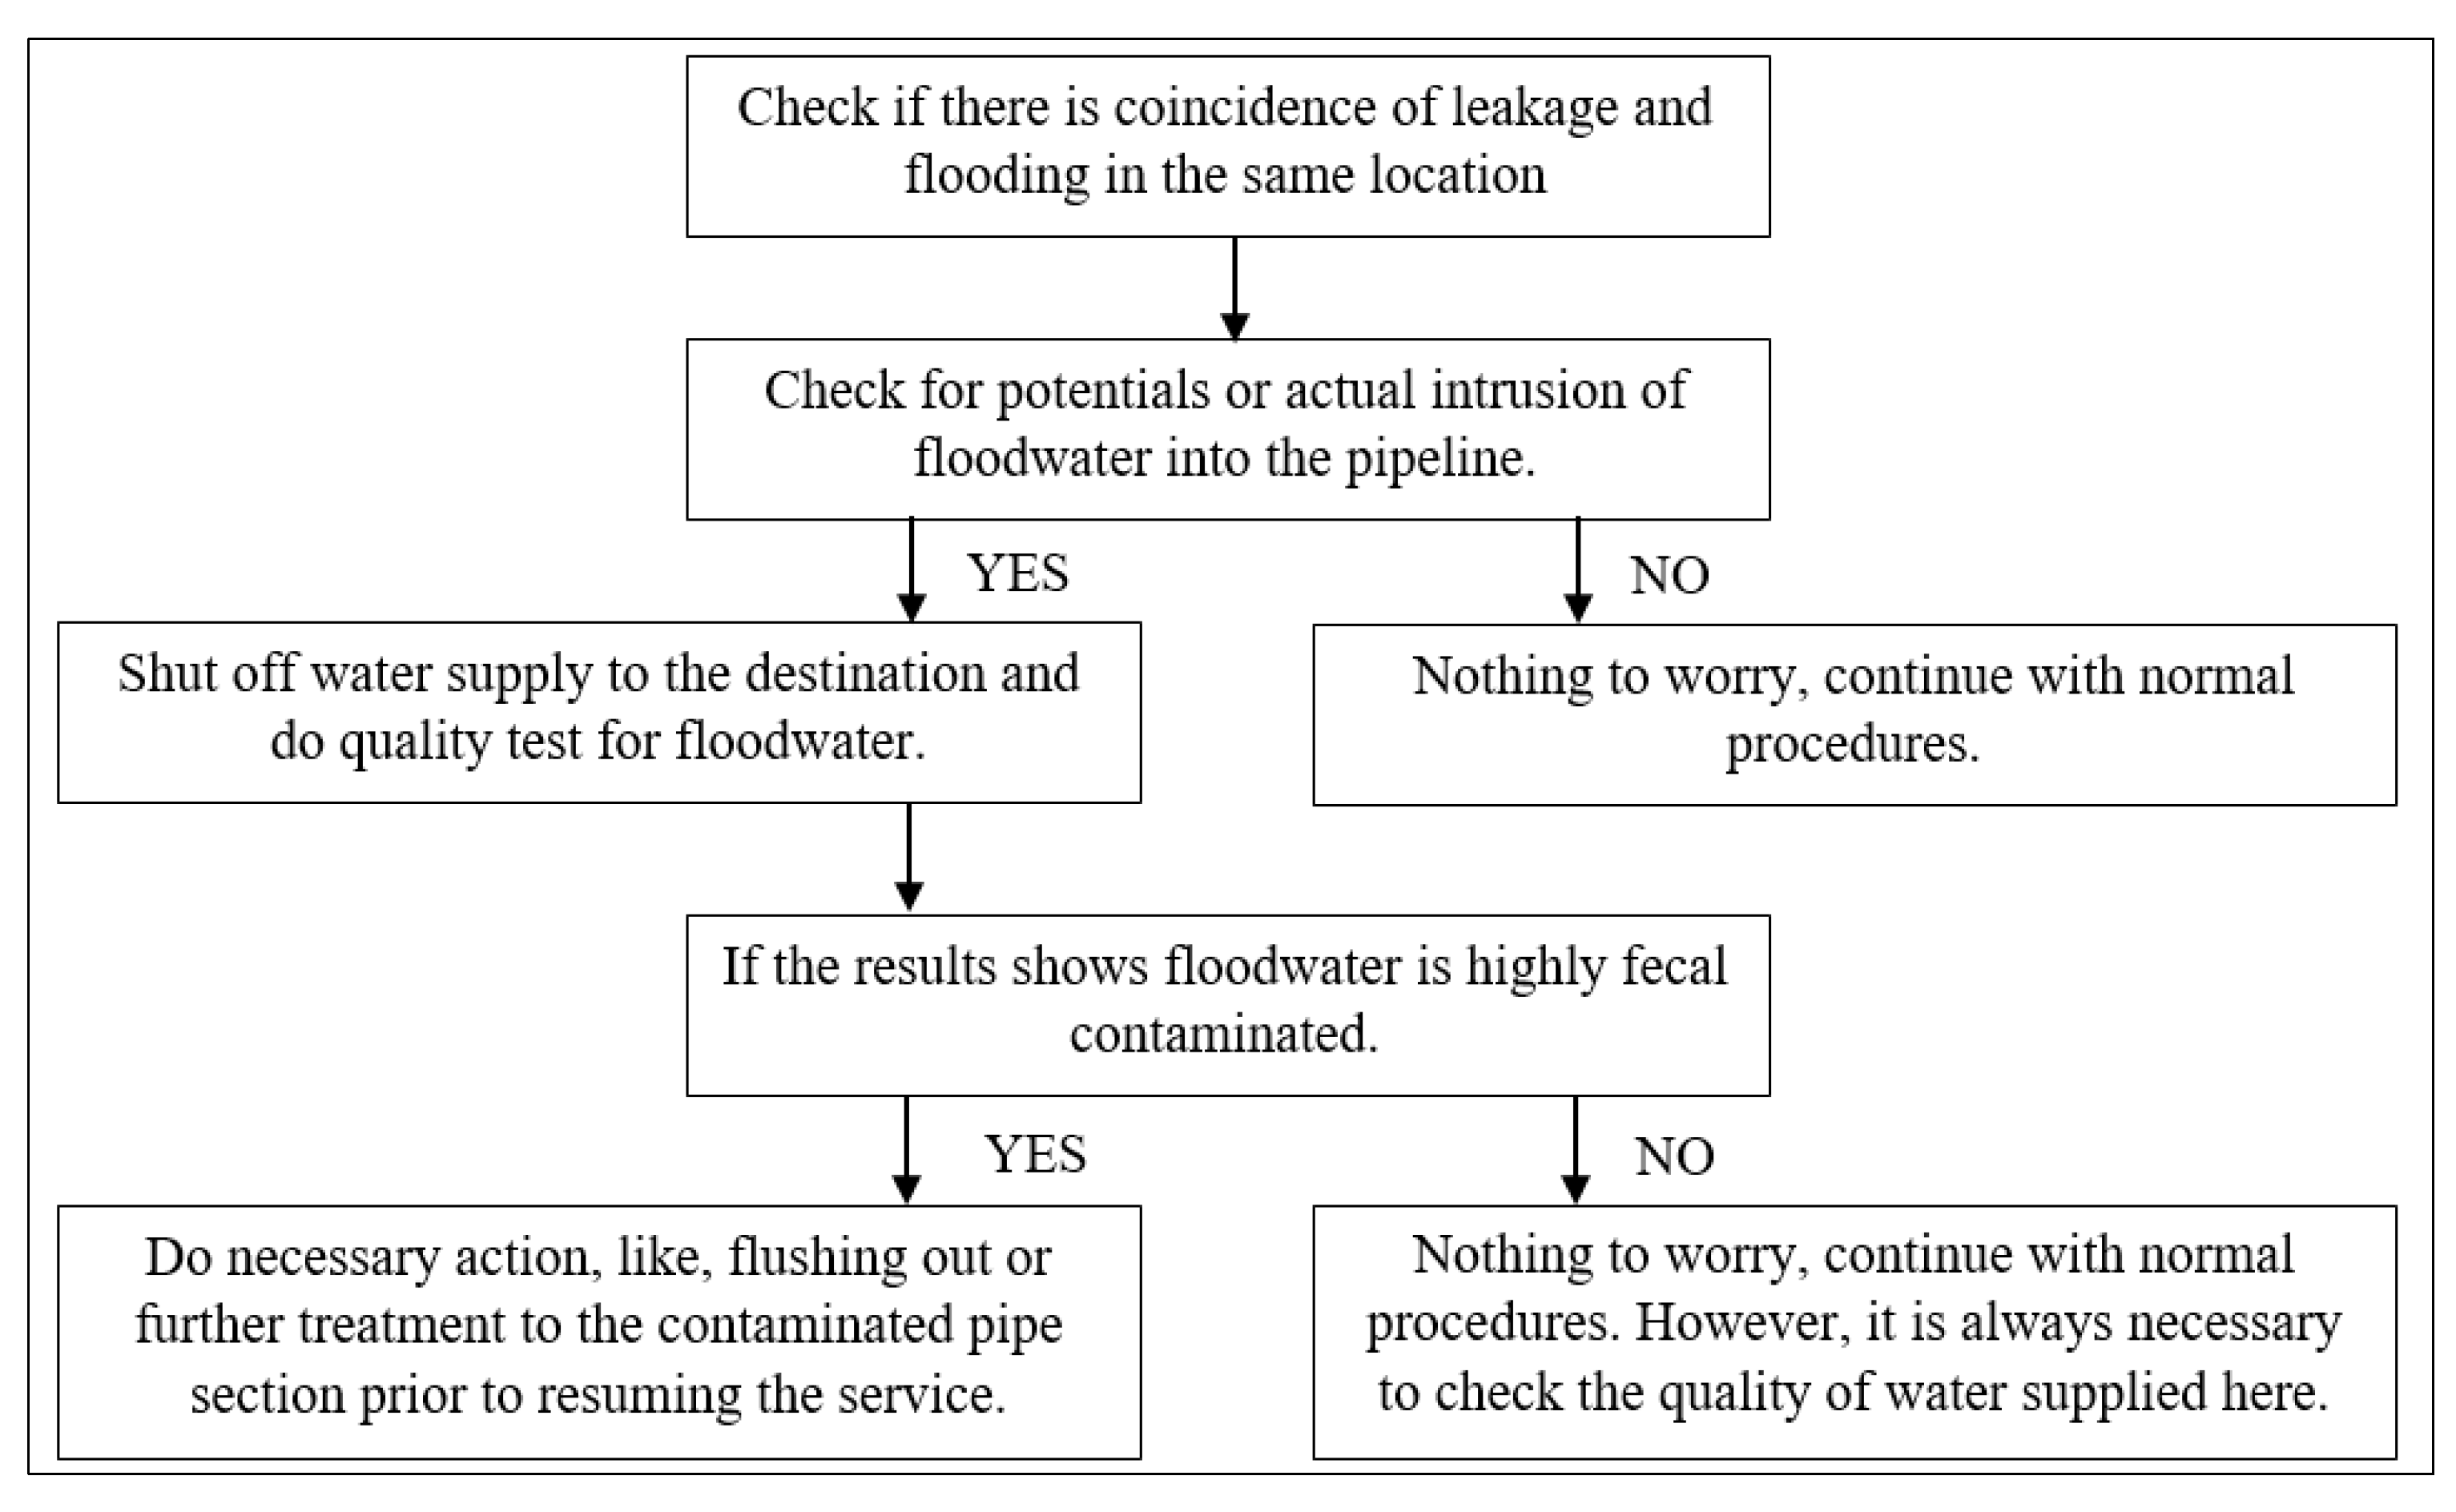
3.4.2. Assessment of Impacts on Water Supply Services
3.4.3. Assessment of Impacts on Power Supply Services
- interruptions in parts of communications services;
- inconveniences due to high temperatures and cooling (i.e., the use of air-conditioning);
- impacts on perishable foods, unless there are backup generators;
- traffic jams due to power failure or outage at traffic lights;
- water supply and sewerage services’ disruption (due to power supply failure at pumping stations).
4. Presentation and Visualization of Results
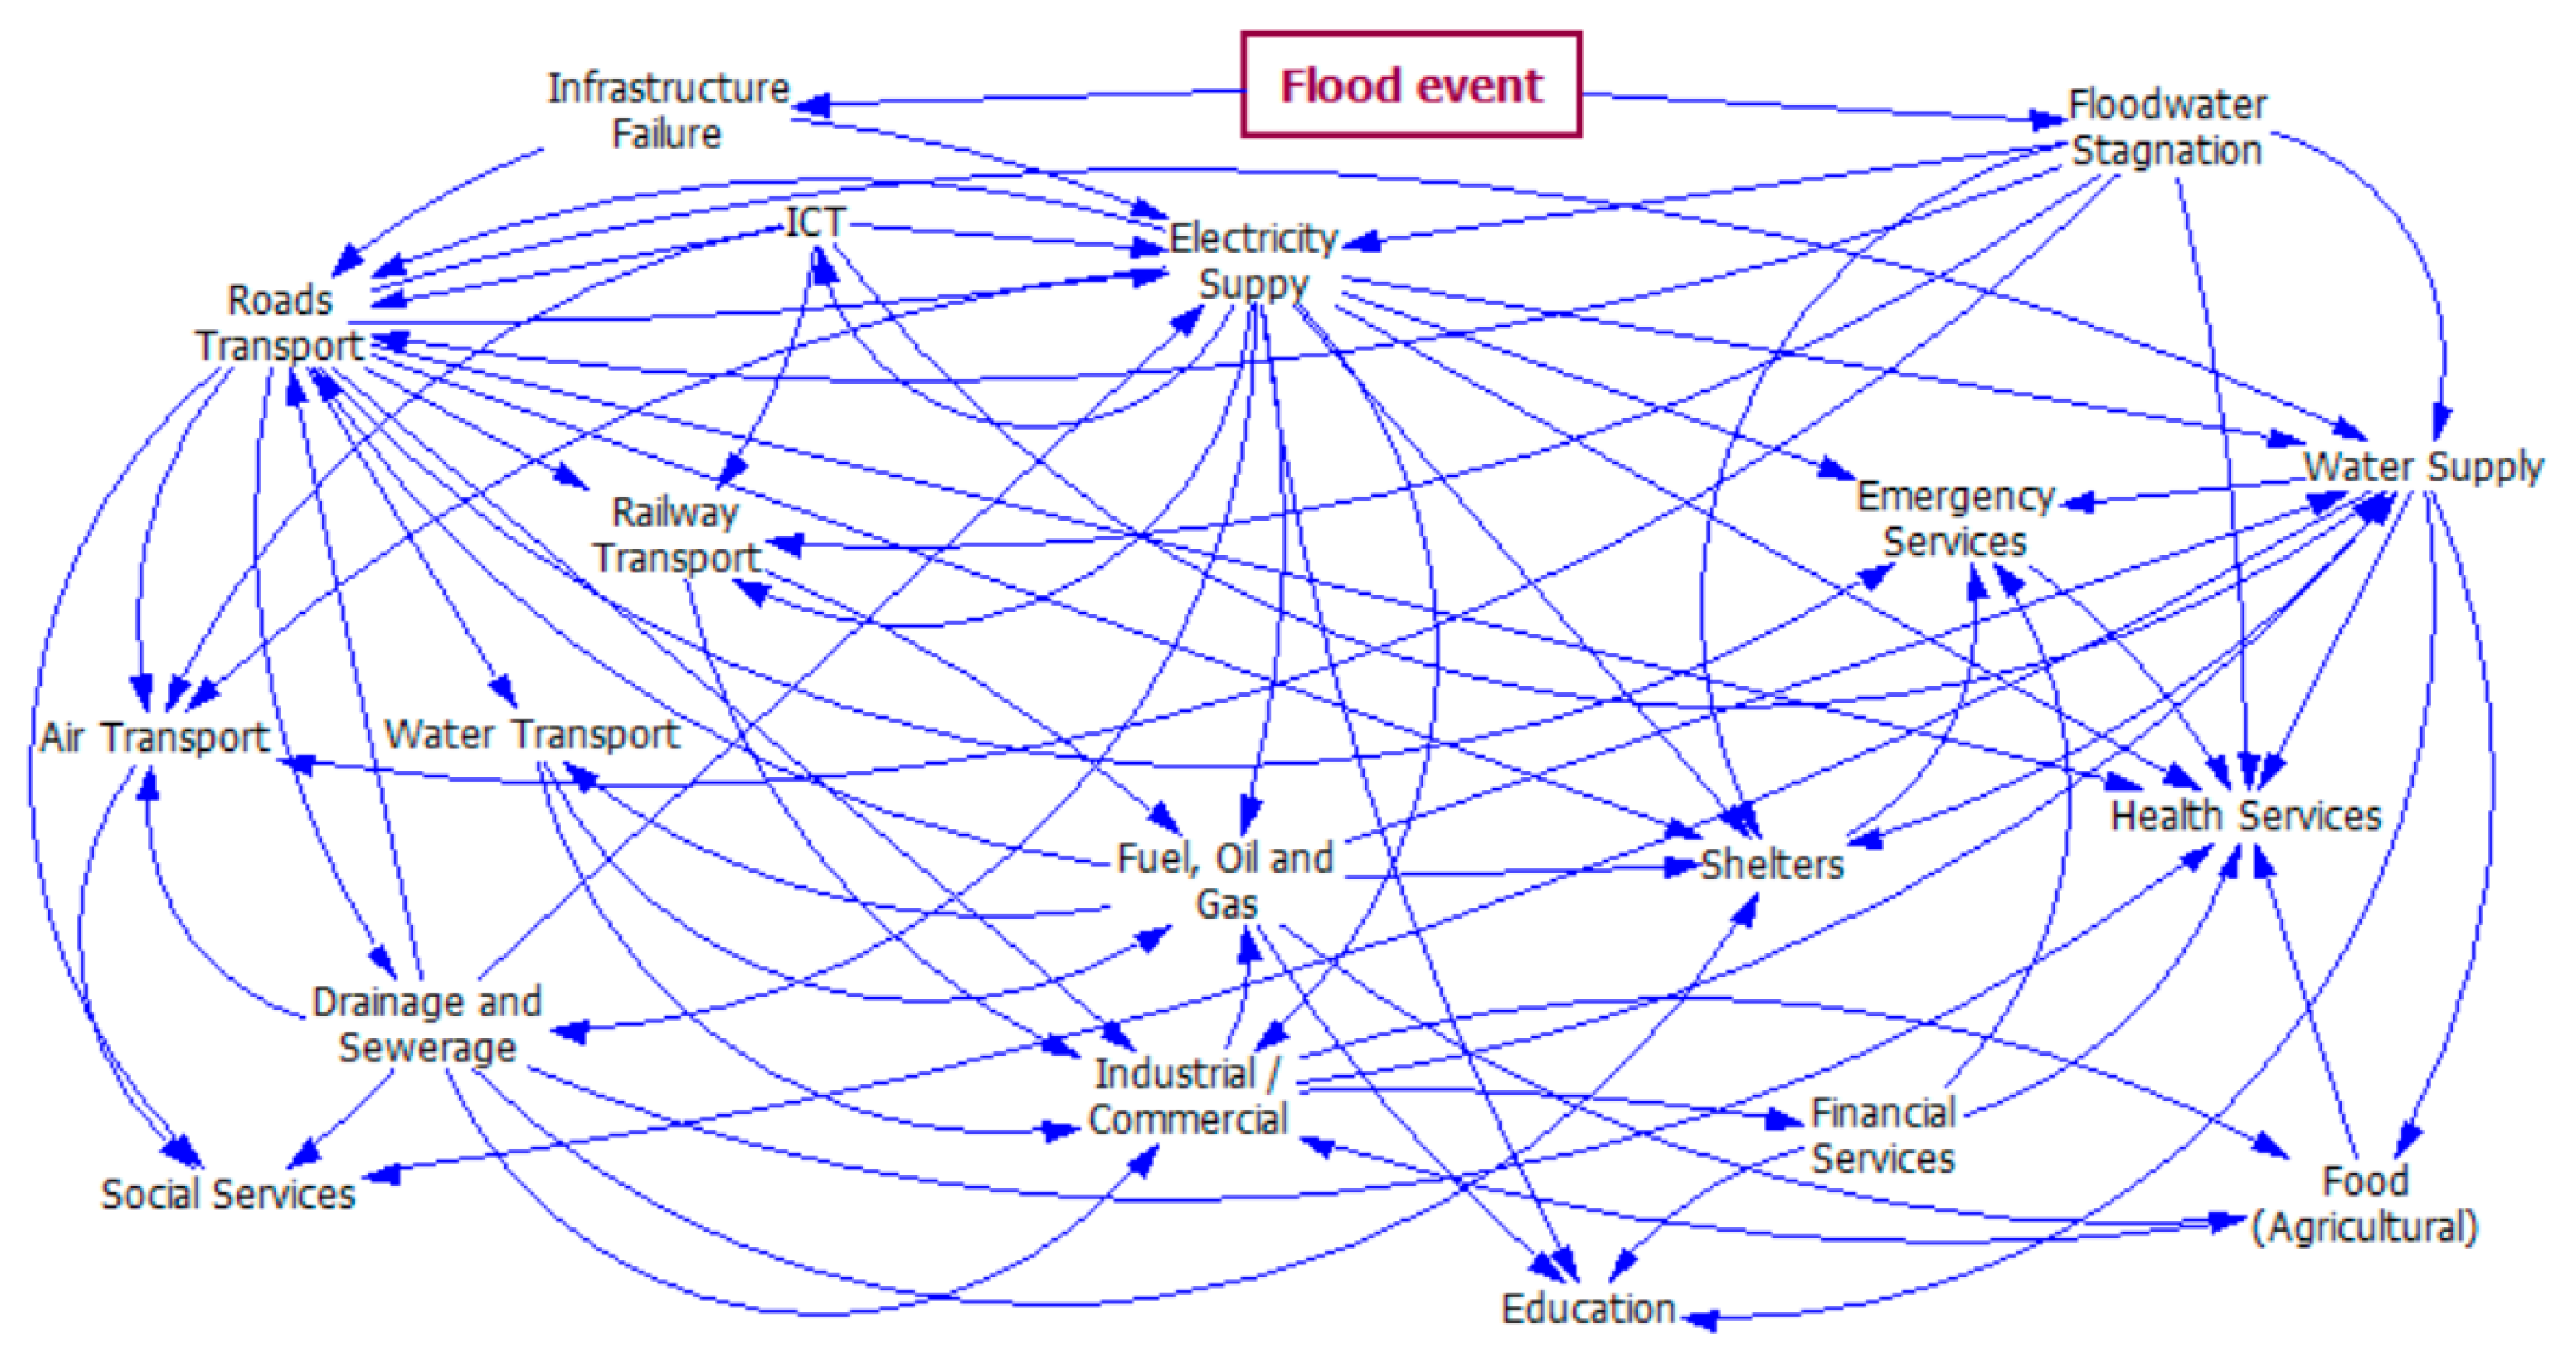
4.1. Causal Loop Diagram
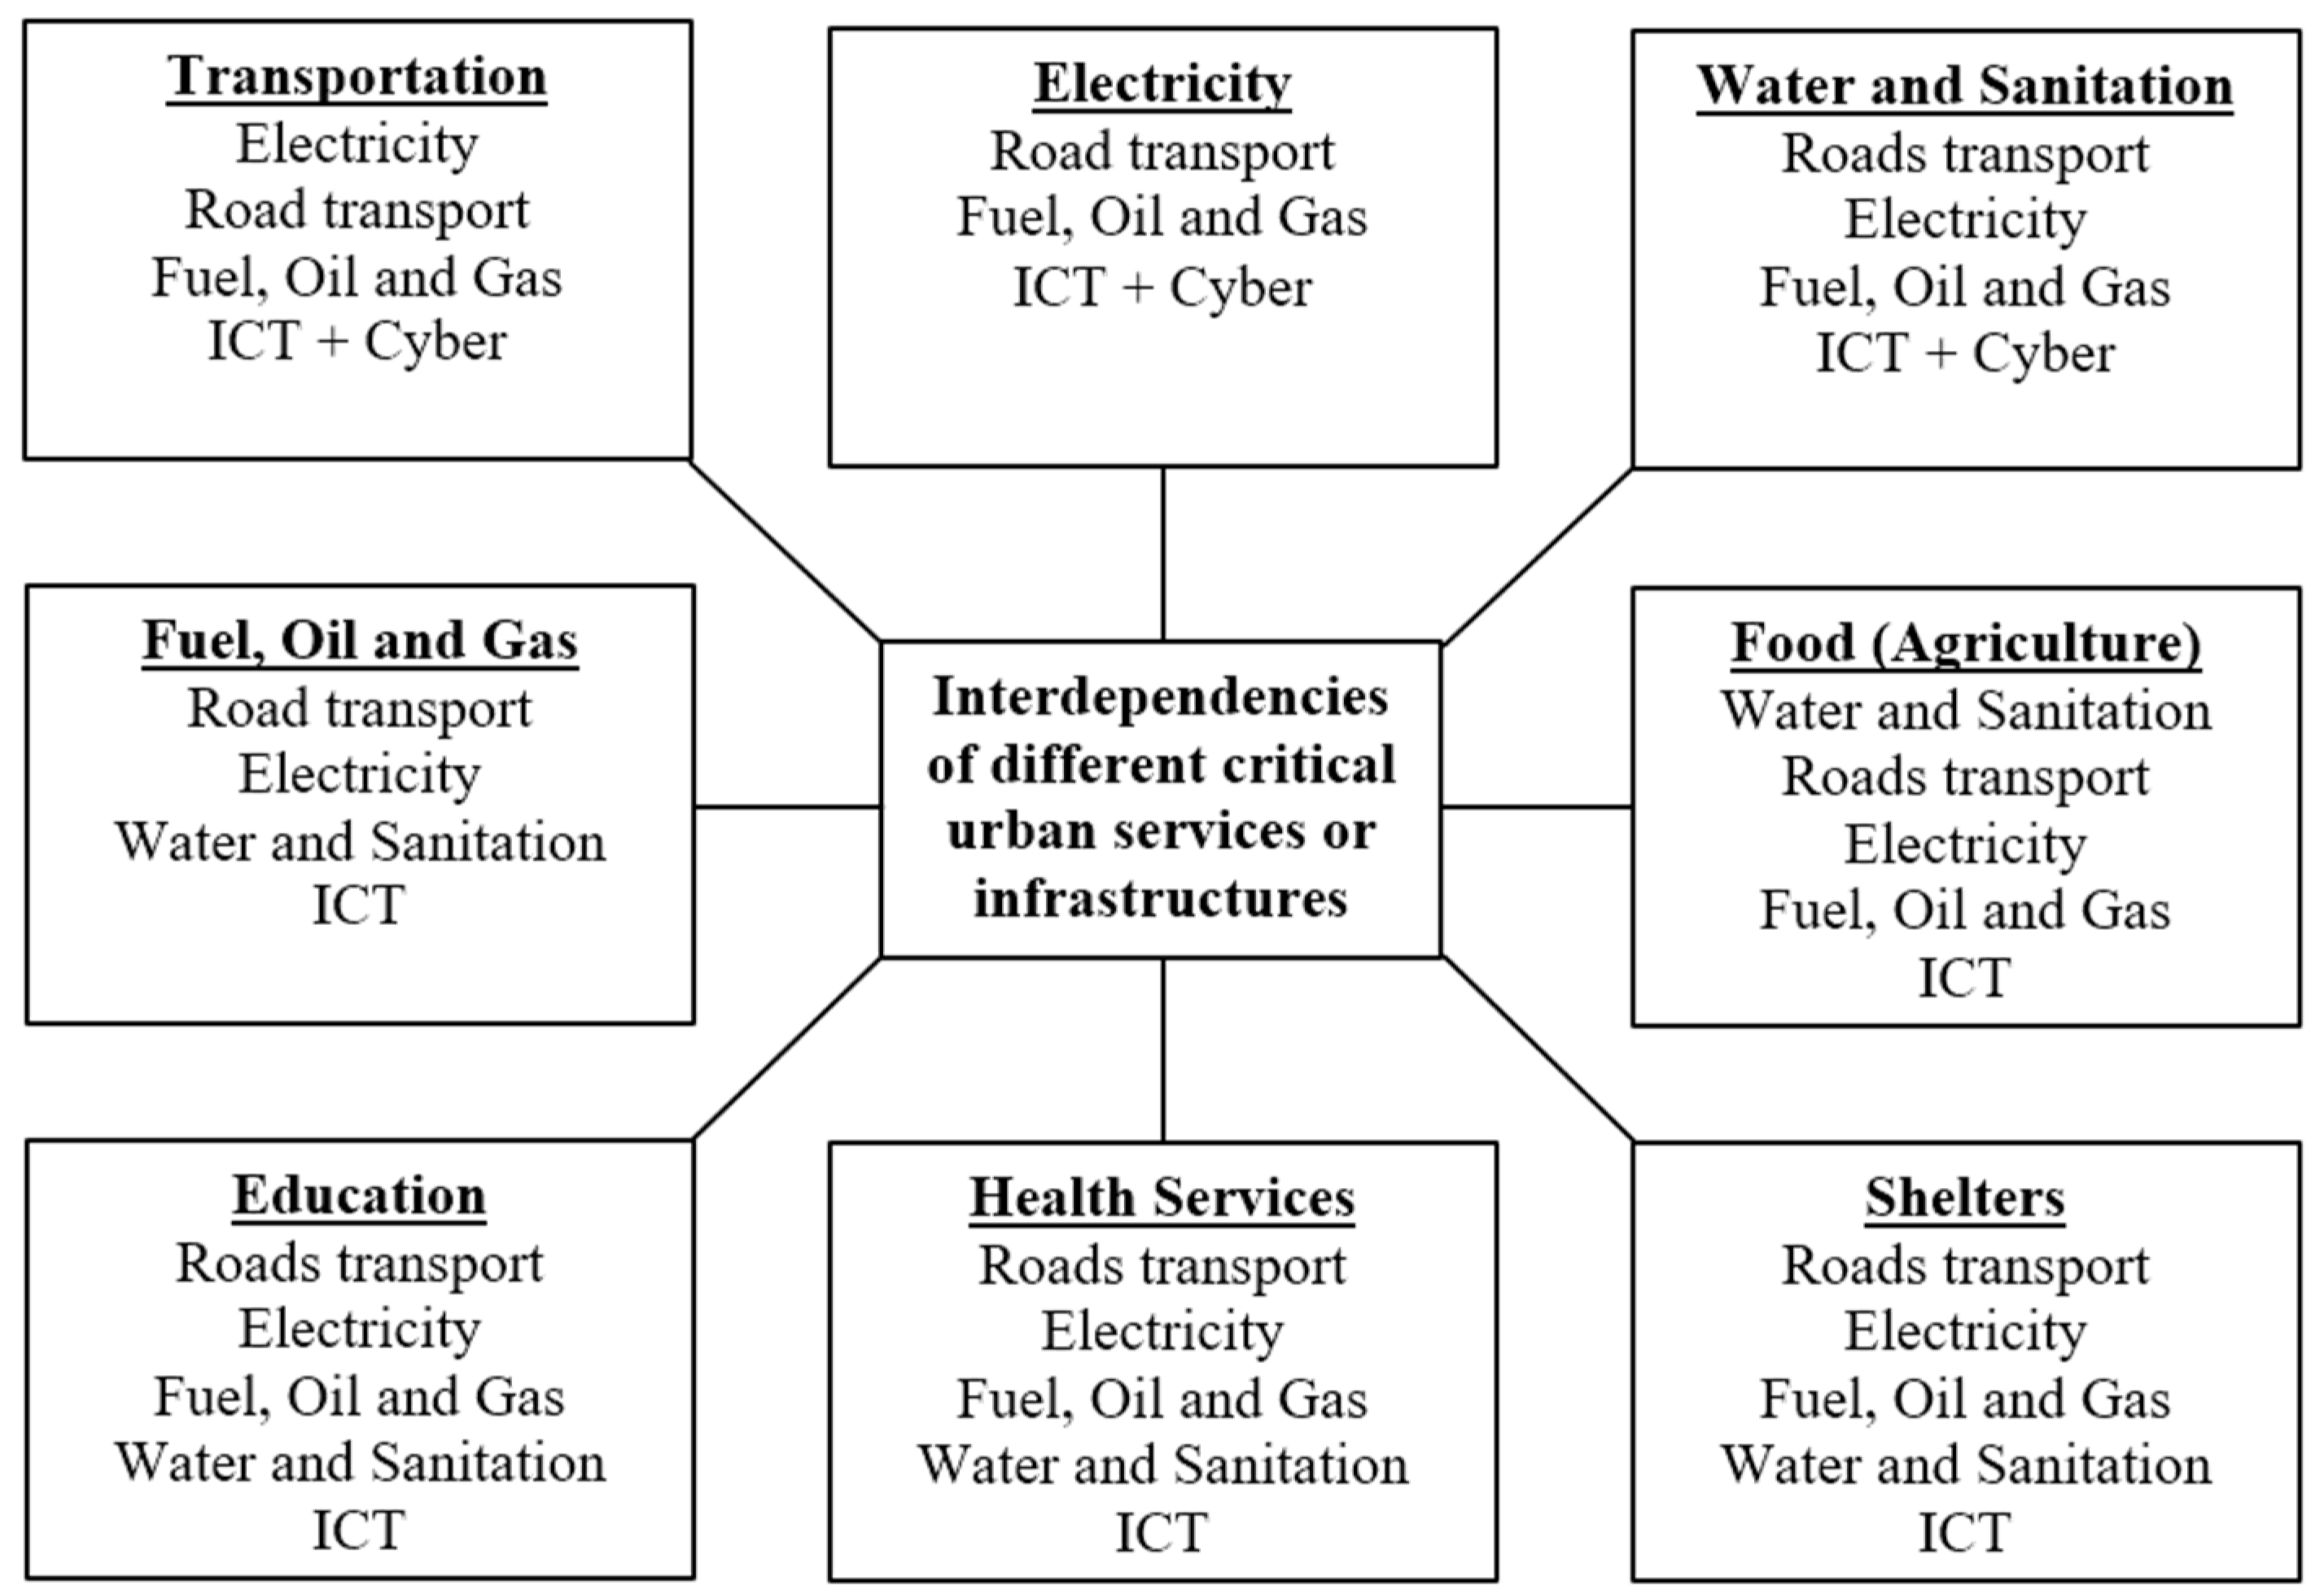
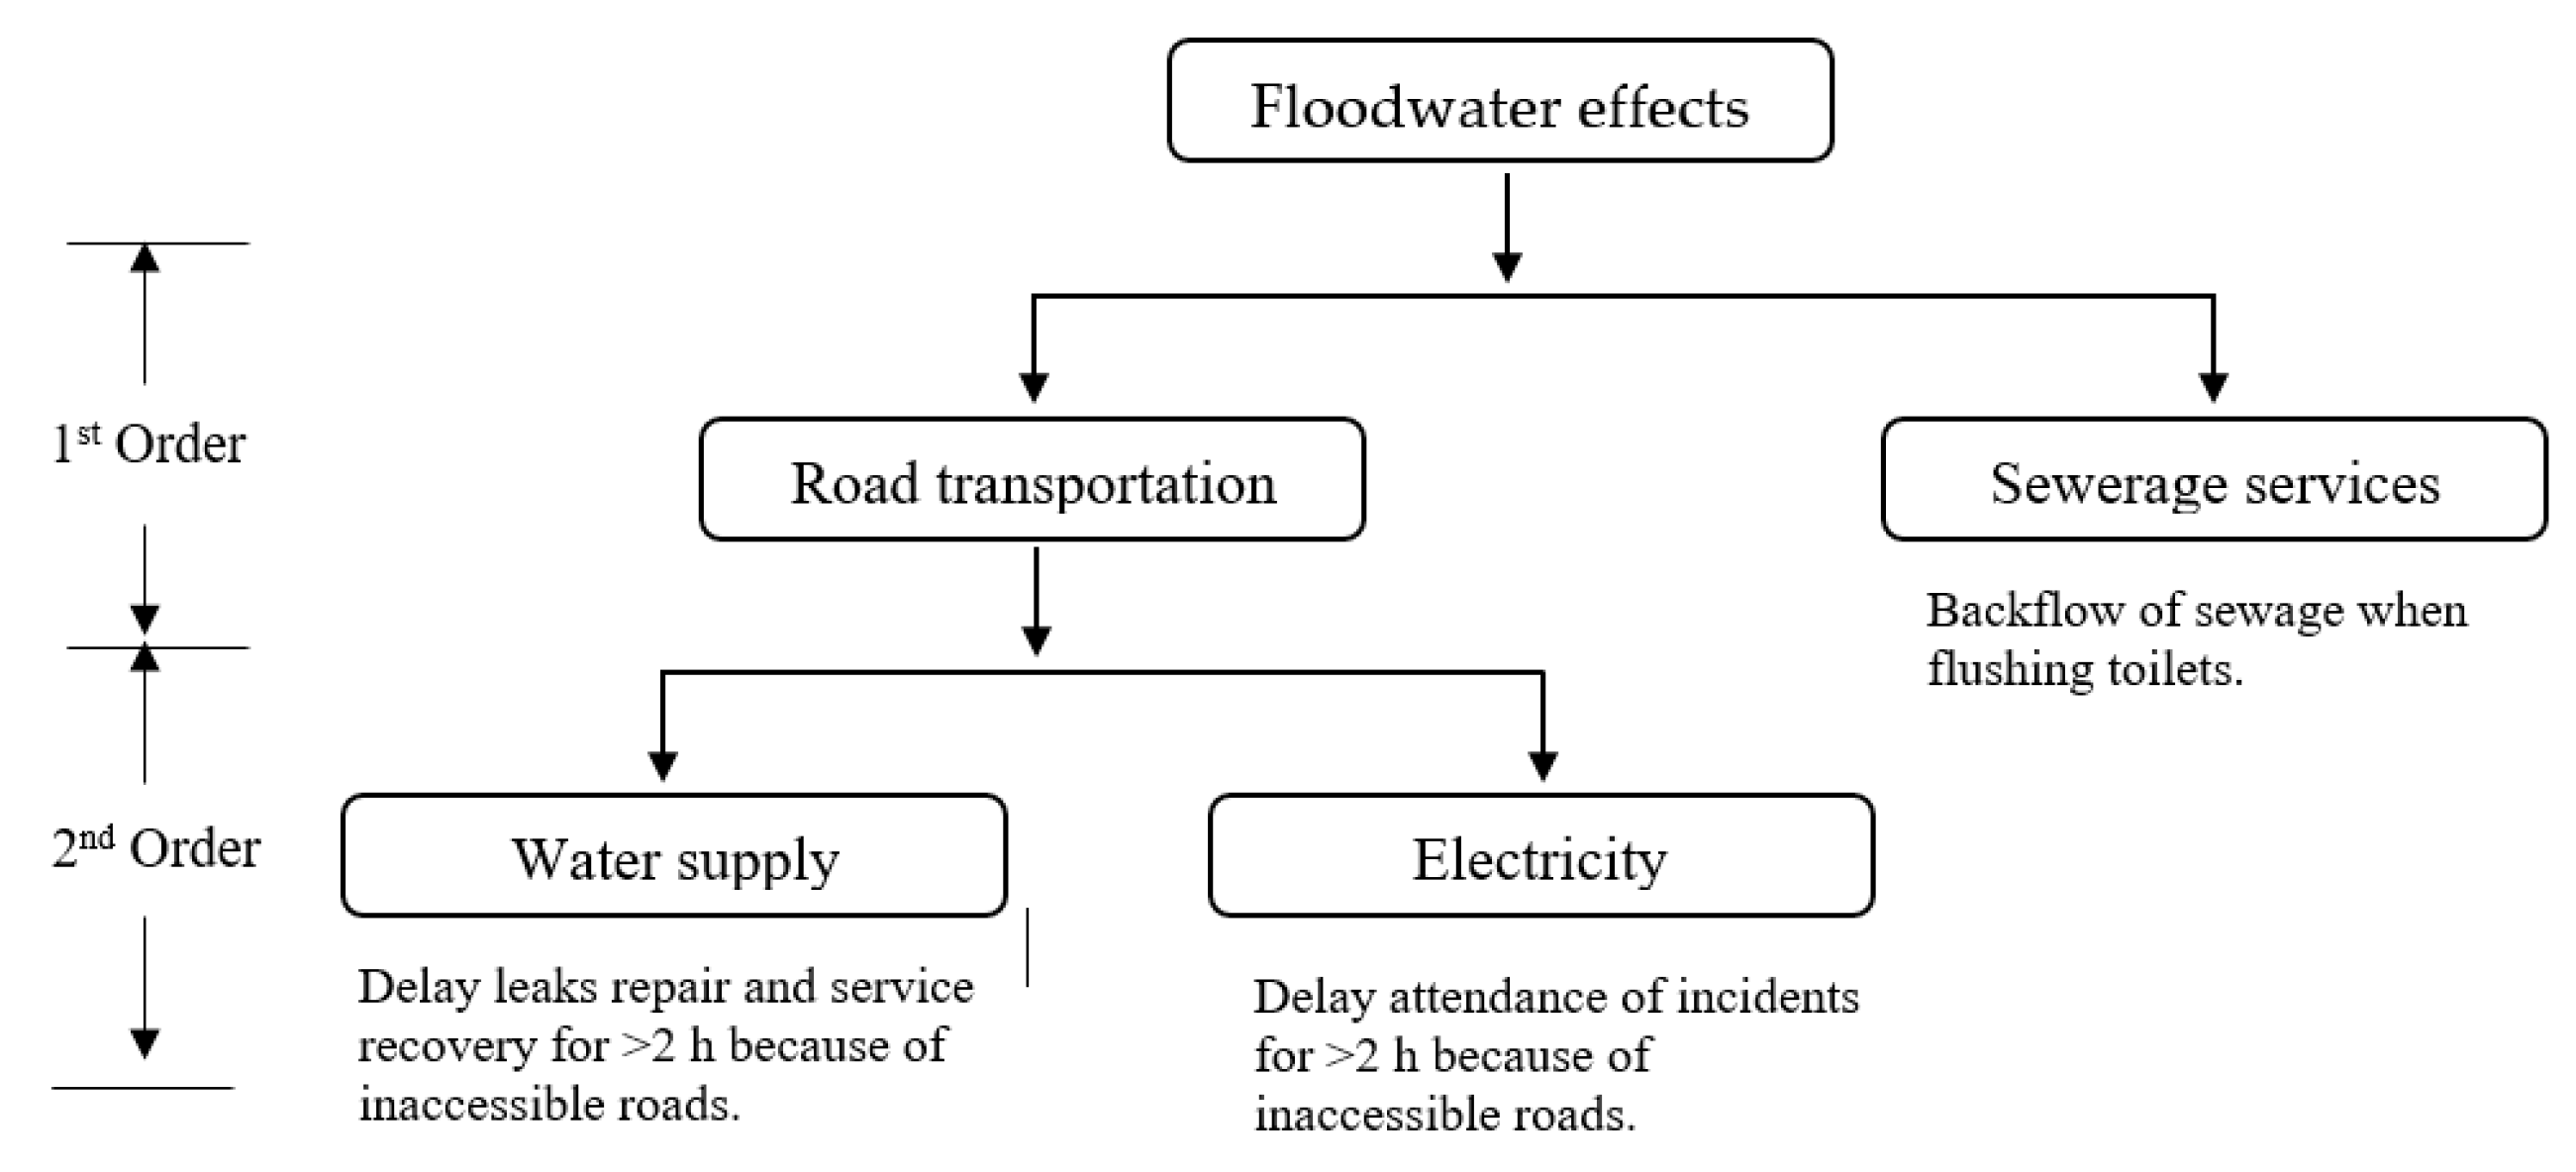
4.2. Tree Diagram
4.3. GIS Maps
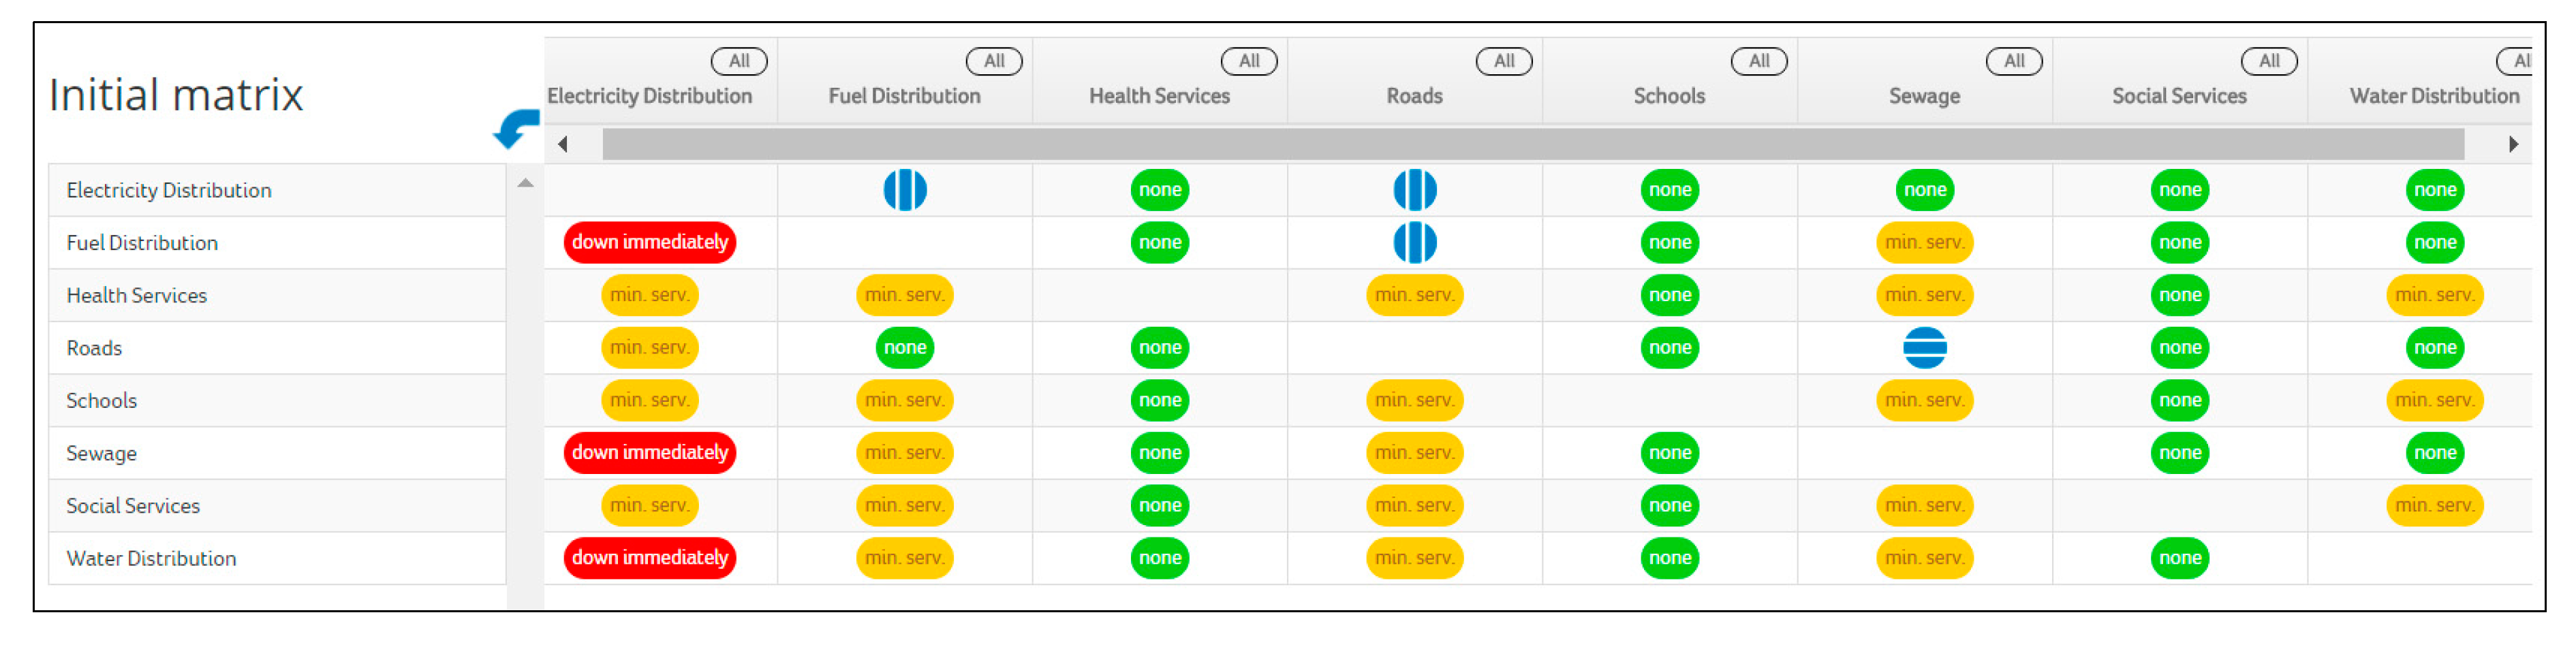
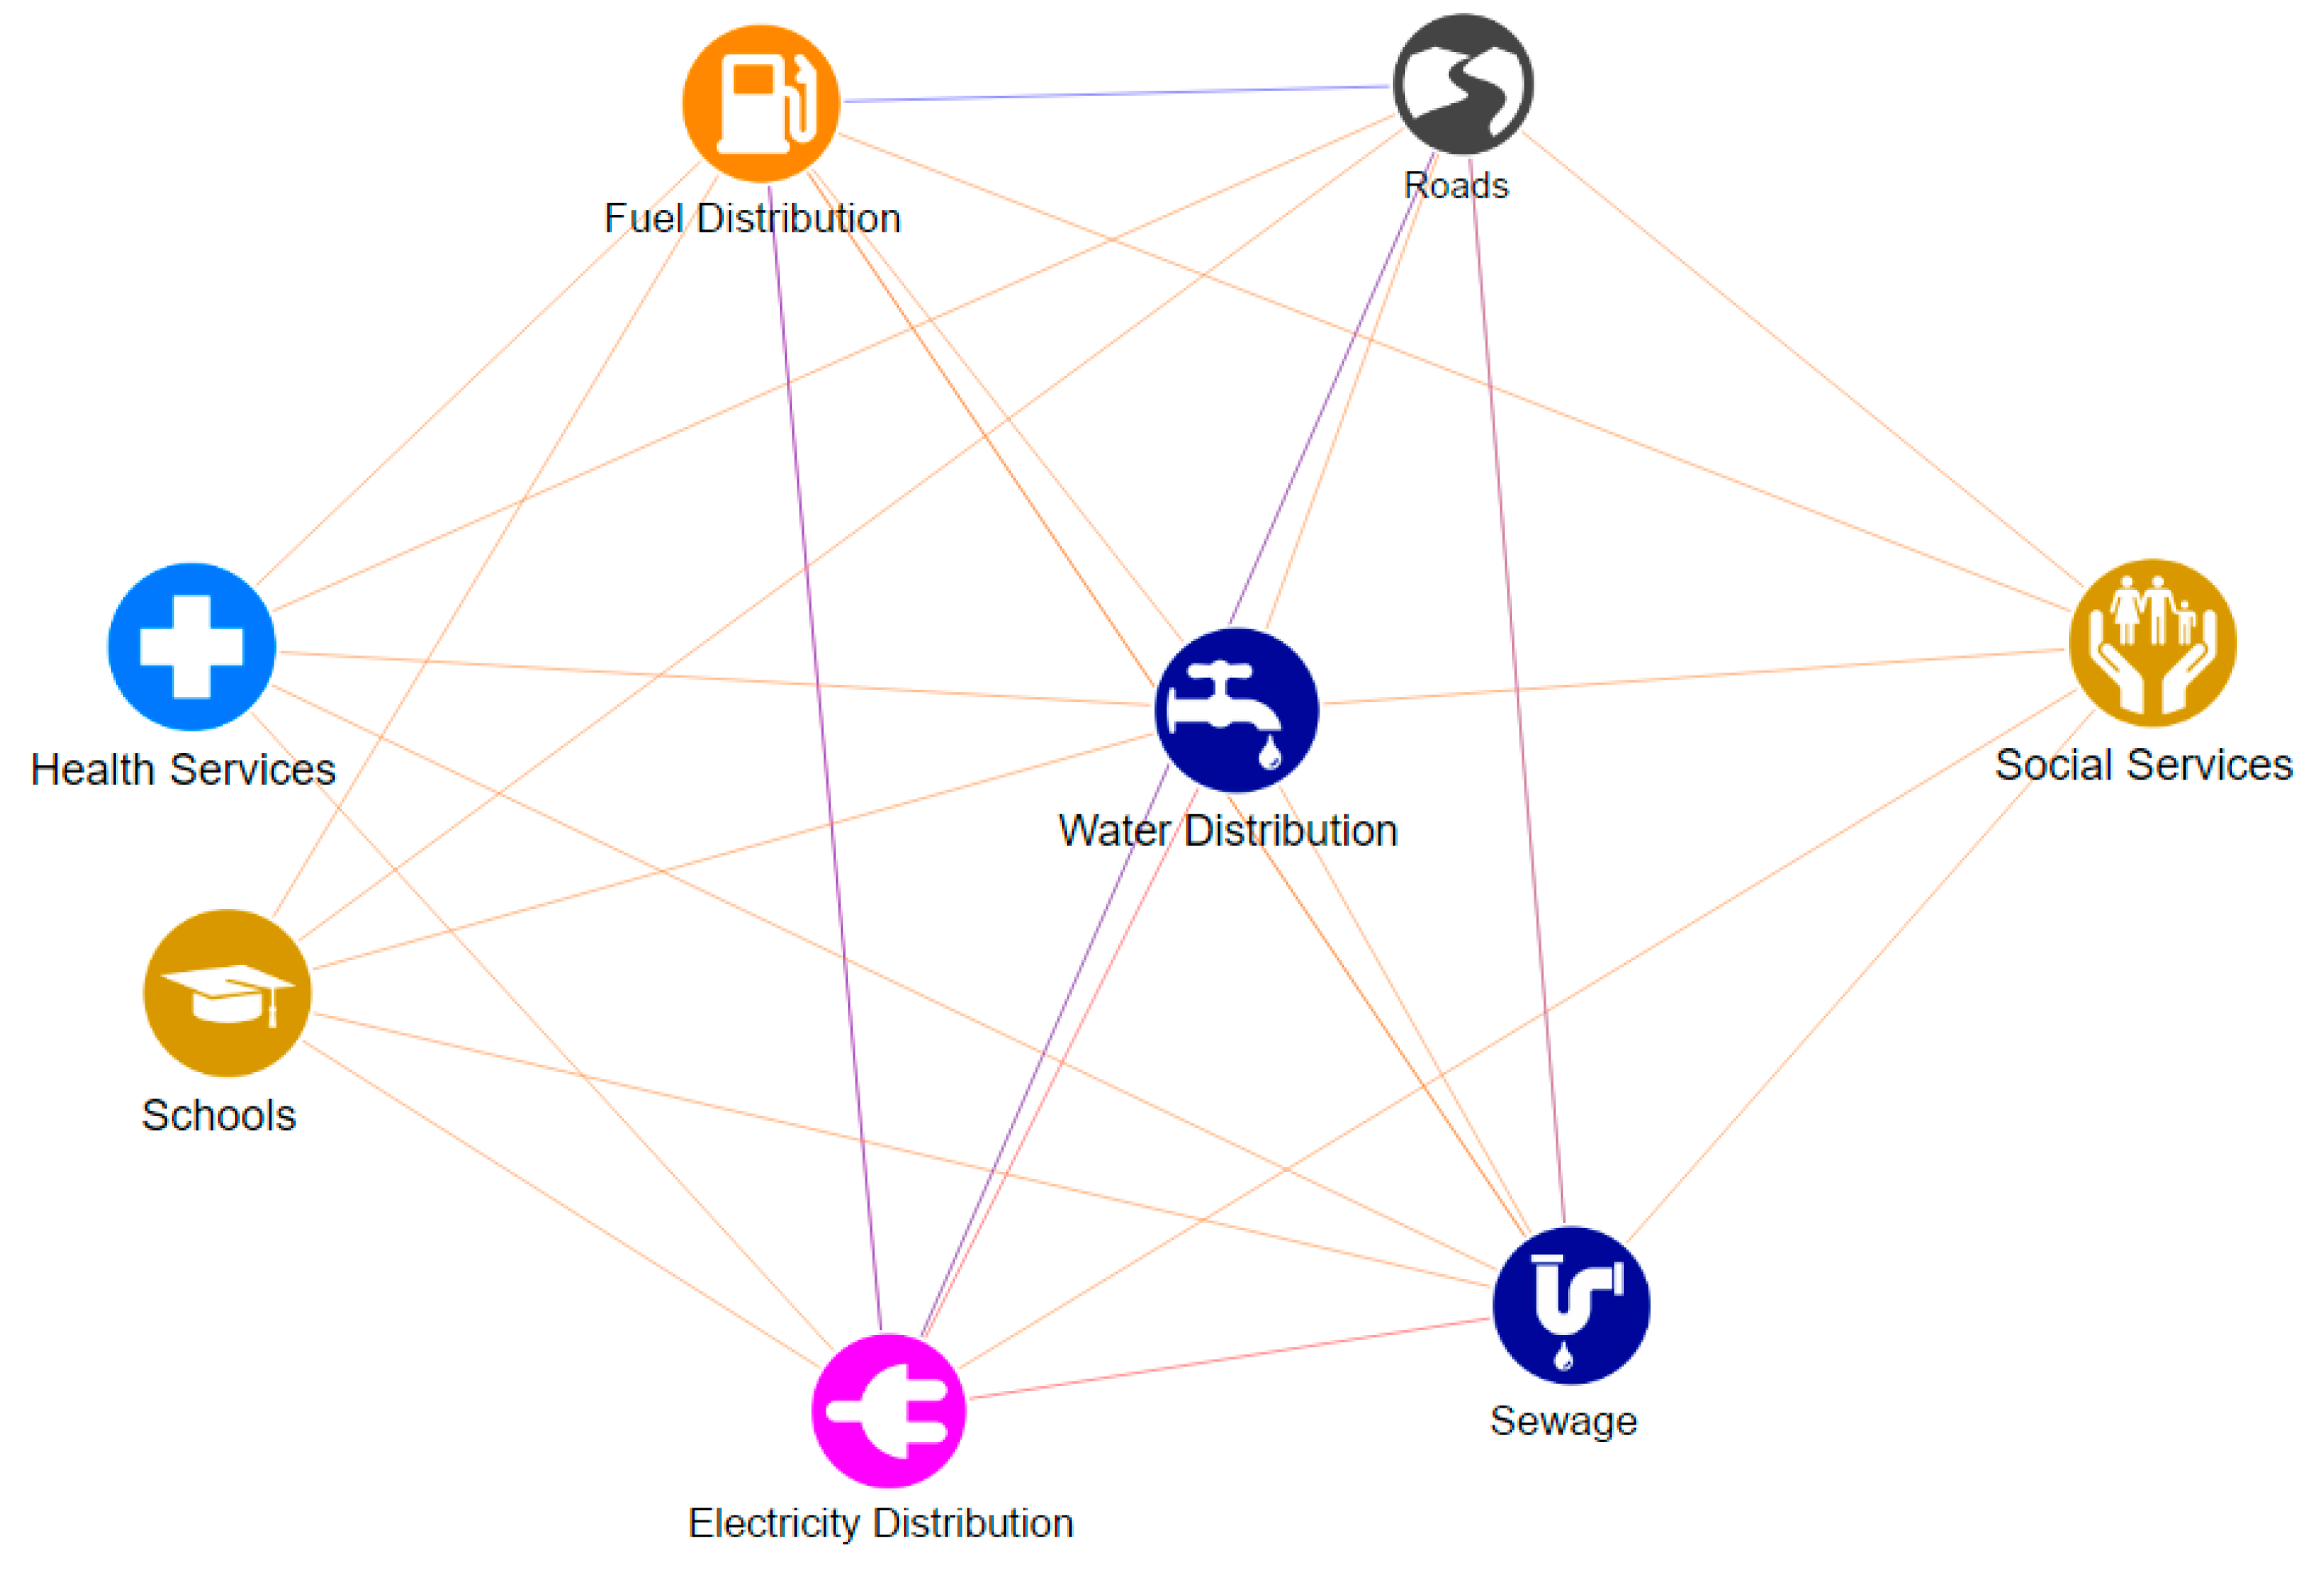
4.4. HAZUR
5. Conclusions
Acknowledgments
Author Contributions
Conflicts of Interest
Appendix A


Appendix B

Appendix C

References
- Vojinovic, Z.; Abbott, M.B. Flood Risk and Social Justice: From Quantitative to Qualitative Flood Risk Assessment and Mitigation; IWA Publishing: London, UK, 2012. [Google Scholar]
- Pelling, M. Adaptation to Climate Change: From Resilience to Transformation; Routledge: London, UK, 2011. [Google Scholar]
- Vojinovic, Z. Flood Risk: The Holistic Perspective, from Integrated to Interactive Planning for Flood Resilience; IWA Publishing: London, UK, 2015. [Google Scholar]
- Mynett, A.E.; Vojinovic, Z. Hydroinformatics in multi-colours—Part red: Urban flood and disaster management. J. Hydroinform. 2009, 11, 166–180. [Google Scholar] [CrossRef]
- Sanchez, A.; Medina, N.; Vojinovic, Z.; Price, R. An integrated cellular automata evolutionary-based approach for evaluating future scenarios and the expansion of urban drainage networks. J. Hydroinform. 2013, 16, 319–340. [Google Scholar] [CrossRef]
- Vojinovic, Z.; Van Teeffelen, J. An Integrated Stormwater Management Approach for Small Islands in Tropical Climates. Urban Water J. 2007, 4, 211–231. [Google Scholar] [CrossRef]
- Abbott, M.; Vojinovic, Z. Realising social justice in the water sector: Part 1. J. Hydroinform. 2010, 12, 110–130. [Google Scholar]
- Abbott, M.; Vojinovic, Z. Realising social justice in the water sector: Part 2. J. Hydroinform. 2010, 12, 225–239. [Google Scholar] [CrossRef]
- Abbott, M.; Vojinovic, Z. Towards a hydroinformatics for China. J. Hydroinform. 2012, 15, 1189–1202. [Google Scholar] [CrossRef]
- Abbott, M.; Vojinovic, Z. Towards a hydroinformatics praxis in the service of social justice. J. Hydroinform. 2013, 16, 516–530. [Google Scholar] [CrossRef]
- Vojinovic, Z.; Hammond, M.; Golub, D.; Hirunsalee, S.; Weesakul, S.; Meesuk, V.; Medina, N.; Sanchez, A.; Kumara, S.; Abbott, M. Holistic approach to flood risk assessment in areas with cultural heritage: A practical application in Ayutthaya, Thailand. Nat. Hazards 2015, 81, 589–616. [Google Scholar] [CrossRef]
- Vojinovic, Z.; Solomatine, D.; Price, R. Dynamic least-cost optimisation of wastewater system remedial works requirements. Water Sci. Technol. 2006, 54, 467–475. [Google Scholar] [CrossRef] [PubMed]
- Vojinovic, Z.; Sanchez, A.; Barreto, W. Optimising sewer system rehabilitation strategies between flooding, overflow emissions and investment costs. In Proceedings of the 11th International Conference on Urban Drainage, Edinburgh, UK, 31 August–5 September 2008. [Google Scholar]
- Barreto, W.; Vojinovic, Z.; Price, R.K.; Solomatine, D.P. Approaches to multi-objective multi-tier optimization in urban drainage planning. In Proceedings of the 7th International Conference on Hydroinformatics, Nice, France, 4–8 September 2006. [Google Scholar]
- Barreto, W.; Vojinovic, Z.; Price, R.; Solomatine, D. Multi-objective Evolutionary Approach for Rehabilitation of Urban Drainage Systems. J. Water Resour. Plan. Manag. 2010, 136, 547–554. [Google Scholar] [CrossRef]
- Alves, A.; Sanchez, A.; Vojinovic, Z.; Seyoum, S.; Babel, M.; Brdjanovic, D. Evolutionary and Holistic Assessment of Green-Grey Infrastructure for CSO Reduction. Water 2016, 8, 402. [Google Scholar] [CrossRef]
- Vojinovic, Z.; Sahlu, S.; Torres, A.S.; Seyoum, S.D.; Anvarifar, F.; Matungulu, H.; Barreto, W.; Savic, D.; Kapelan, Z. Multi-objective rehabilitation of urban drainage systems under uncertainties. J. Hydroinform. 2014, 16, 1044–1061. [Google Scholar] [CrossRef]
- Pescaroli, G.; Alexander, D. Critical infrastructure, panarchies and the vulnerability paths of cascading disasters. Nat. Hazards 2016, 82, 175–192. [Google Scholar] [CrossRef]
- Veldhuis, J. How the choice of flood damage metrics influences urban flood risk assessment. J. Flood Risk Manag. 2011, 4, 281–287. [Google Scholar] [CrossRef]
- Fewtrell, L.; Kay, D. An attempt to quantify the health impacts of flooding in the UK using an urban case study. Public Health 2008, 122, 446–451. [Google Scholar] [CrossRef] [PubMed]
- Hounjet, M.; Kieftenburg, A.; Altamirano, M. Learning from flood events on Critical Infrastructure: Relations and Consequences for Life and Environment (CIrcle). Coast. Manag. 2016. [Google Scholar] [CrossRef]
- Carrera, L.; Standardi, G.; Bosello, F.; Mysiak, J. Assessing direct and indirect economic impacts of a flood event through the integration of spatial and computable general equilibrium modelling. Environ. Model. Softw. 2015, 63, 109–122. [Google Scholar] [CrossRef]
- Hallegatte, S. An adaptive regional input-output model and its application to the assessment of the economic cost of Katrina. Risk Anal. 2008, 28, 779–799. [Google Scholar] [CrossRef] [PubMed]
- Penning-Rowsell, E.C.; Parker, D.J. The indirect effects of floods and benefits of flood alleviation: Evaluating the Chesil Sea Defence Scheme. Appl. Geogr. 1987, 7, 263–288. [Google Scholar] [CrossRef]
- National Statistical Office. The 2013 Household Socio-Economic Survey Bangkok Metropolis, Nonthaburi, Pathum Than and Samut Prakan; Ministry of Information and Communication Techology: Bangkok, Thailand, 2014.
- Oxford. Oxford Dictionaries: Definition of Infrastructure in English. 2017. [cited 2017 Oxford University Press]. Available online: https://en.oxforddictionaries.com/definition/infrastructure (accessed on 10 October 2016).
- University of Exeter. RESilience to Cope with Climate Change in Urban arEas (RESCCUE)—Resilience with HAZUR; University of Exeter: Exeter, UK, 2015. [Google Scholar]
- Pinnaka, S.; Yarlagadda, R.; Çetinkaya, E.K. Modelling robustness of critical infrastructure networks. In Proceedings of the 2015 11th International Conference on the Design of Reliable Communication Networks (DRCN), Kansas City, MO, USA, 24–27 March 2015; IEEE: Piscataway, NJ, USA, 2015. [Google Scholar]
- Ouyang, M. Review on modeling and simulation of interdependent critical infrastructure systems. Reliab. Eng. Syst. Saf. 2014, 121, 43–60. [Google Scholar] [CrossRef]
- Franchina, L.; Carbonelli, M.; Gratta, L.; Crisci, M.; Perucchini, D. An impact-based approach for the analysis of cascading effects in critical infrastructures. Int. J. Crit. Infrastruct. 2011. [Google Scholar] [CrossRef]
- The Department of Homeland Security Critical Infrastructure Sectors. Available online: https://www.dhs.gov/critical-infrastructure-sectors (accessed on 27 October 2015).
- Murray, A.T.; Grubesic, T.H. Overview of Reliability and Vulnerability in Critical Infrastructure. Crit. Infrastruct. 2007, 1–8. [Google Scholar] [CrossRef]
- Rinaldi, S.M.; Peerenboom, J.P.; Kelly, T.K. Identifying, understanding, and analyzing critical infrastructure interdependencies. IEEE Control Syst. 2001, 21, 11–25. [Google Scholar] [CrossRef]
- Pederson, P.; Dudenhoeffer, D.; Hartley, S.; Permann, M. Critical Infrastructure Interdependency Modeling: A Survey of US and International Research; Idaho National Laboratory: Idaho Falls, ID, USA, 2006.
- Wilson, G.; Wilson, T.M.; Deligne, N.I.; Cole, J.W. Volcanic hazard impacts to critical infrastructure: A review. J. Volcanol. Geotherm. Res. 2014, 286, 148–182. [Google Scholar] [CrossRef]
- Pregnolato, M.; Ford, A.; Robson, C.; Glenis, V.; Barr, S.; Dawson, R. Assessing urban strategies for reducing the impacts of extreme weather on infrastructure networks. R. Soc. Open Sci. 2016, 3, 160023. [Google Scholar] [CrossRef] [PubMed]
- Merz, B.; Kreibich, H.; Schwarze, R.; Thieken, A. Review article “Assessment of economic flood damage”. Nat. Hazards Earth Syst. Sci. 2010, 10, 1697–1724. [Google Scholar] [CrossRef]
- Williams, P.; Nolan, M.; Panda, A. Disaster Resilience Scorecard for Cities in United Nations International Strategy for Disaster Risk Reduction (UNISDR). Int. J. Disaster Resil. Built Environ. 2014, 5. [Google Scholar] [CrossRef]
- Messner, F. Evaluating Flood Damages: Guidance and Recommendations on Principles and Methods; The Helmholtz Center for Environmental Research (UFZ): Leipzig, Germany, 2007. [Google Scholar]
- Jonkeren, O.; Azzini, I.; Galbusera, L.; Ntalampiras, S.; Giannopoulos, G. Analysis of Critical Infrastructure Network Failure in the European Union: A Combined Systems Engineering and Economic Model. Netw. Spat. Econ. 2015, 15, 253–270. [Google Scholar] [CrossRef]
- Jonkman, S.N.; Bočkarjova, M.; Kok, M.; Bernardini, P. Integrated hydrodynamic and economic modelling of flood damage in The Netherlands. ECOLEC Ecol. Econ. 2008, 66, 77–90. [Google Scholar] [CrossRef]
- Polania Siculaba, J.C. Amethodology for Health Impact Assessment during Pluvial Flooding a Case Study of the Sukhumvit Area in Bangkok, Thailand; UNESCO-IHE: Delft, The Netherlands, 2015. [Google Scholar]
- Abbott, M.B.; Tumwesigye, B.; Vojinovic, Z. The fifth generation of modelling in hydroinformatics. In Proceedings of the 7th International Conference on Hydroinformatics, Nice, France, 4–8 September 2006. [Google Scholar]
- Abbott, M.; Vojinovic, Z. Applications of Numerical Modelling in Hydroinformatics. J. Hydroinform. 2009, 11, 308–319. [Google Scholar] [CrossRef]
- Abebe, Y.A.; Seyoum, S.D.; Vojinovic, Z.; Price, R.K. Effects of reducing convective acceleration terms in modelling supercritical and transcritical flow conditions. Water 2016, 8, 562. [Google Scholar] [CrossRef]
- Vojinovic, Z.; Bonillo, J.; Kaushik, C.; Price, R. Modelling flow transitions at street junctions with 1D and 2D models. In Proceedings of the 7th International Conference on Hydroinformatics, Nice, France, 4–8 September 2006. [Google Scholar]
- Vojinovic, Z.; Tutulic, D. On the use of 1D and coupled 1D–2D modelling approaches for assessment of flood damage in urban areas. Urban Water J. 2009, 6, 183–199. [Google Scholar] [CrossRef]
- Vojinovic, Z.; Seyoum, S.D.; Mwalwaka, J.M.; Price, R.K. Effects of Model Schematization, Geometry and Parameter Values on Urban Flood Modelling. Water Sci. Technol. 2011, 63, 462–467. [Google Scholar] [CrossRef] [PubMed]
- Seyoum, S.D.; Vojinovic, Z.; Price, R.K.; Weesakul, S. Coupled 1D and noninertia 2D flood inundation model for simulation of urban flooding. J. Hydraul. Eng. 2012, 138, 23–34. [Google Scholar] [CrossRef]
- Vojinovic, Z.; Seyoum, S.; Salum, M.H.; Price, R.K.; Fikri, A.K.; Abebe, Y. Modelling floods in urban areas and representation of buildings with a method based on adjusted conveyance and storage characteristics. J. Hydroinform. 2012, 15, 1150–1168. [Google Scholar] [CrossRef]
- Abdullah, A.; Rahman, A.; Vojinovic, Z. LiDAR filtering algorithms for urban flood application: Review on current algorithms and filters test. Laser Scanning 2009, 38, 30–36. [Google Scholar]
- Abdullah, A.; Vojinovic, Z.; Price, R. A Methodology for Processing Raw LIDAR Data to Support 1D/2D Urban Flood Modelling Framework. J. Hydroinform. 2011, 14, 75–92. [Google Scholar] [CrossRef]
- Abdullah, A.; Vojinovic, Z.; Price, R. Improved Methodology for Processing Raw LIDAR Data to Support Urban Flood Modelling—Accounting for Elevated Roads and Bridges. J. Hydroinform. 2011, 14, 253–269. [Google Scholar] [CrossRef]
- Meesuk, V.; Vojinovic, Z.; Mynett, A.E.; Abdullah, A.F. Urban flood modelling combining top-view LiDAR data with ground-view SfM observations. Adv. Water Resour. 2015, 75, 105–117. [Google Scholar] [CrossRef]
- Doong, D.-J.; Lo, W.; Vojinovic, Z.; Lee, W.L.; Lee, S.P. Development of a New Generation of Flood Inundation Maps—A Case Study of the Coastal City of Tainan, Taiwan. Water 2016, 8, 521. [Google Scholar] [CrossRef]
- Shrestha, A.; Babel, M.S.; Weesakul, S.; Vojinovic, Z. Developing Intensity–Duration–Frequency (IDF) Curves under Climate Change Uncertainty: The Case of Bangkok, Thailand. Water 2017, 9, 145. [Google Scholar] [CrossRef]
- Shrestha, A. Impact of Climate Change on Urban Flooding in Sukhumvit Area of Bangkok. Master’s Thesis, Kathmandu University, Dhulikhel, Nepal, May 2013. [Google Scholar]
- Taylor, M.A.P.; Deste, G.M. Transport Network Vulnerability: A Method for Diagnosis of Critical Locations in Transport Infrastructure Systems. Crit. Infrastruct. 2007, 9–30. [Google Scholar] [CrossRef]
- Pyatkova, K.; Chen, A.S.; Djordjevic, S.; Butler, D.; Vojinović, Z.; Abebe, Y.A.; Hammond, M.J. Flood Impacts on Road Transportation Using Microscopic Traffic Modelling Technique; University of Exeter: Exeter, UK, 2015. [Google Scholar]
- Weisbrod, G.E.; Vary, D.; Treyz, G. Economic Implications of Congestion; National Academy Press: Washington, DC, USA, 2001. [Google Scholar]


| No. | Types of Urban Service | Categories or Means of Service | Infrastructure | Exposure to Floods |
|---|---|---|---|---|
| 1 | Transportation | Roads transport | Roads network | HL |
| Bridges (culverts, drifts) | HL | |||
| Railway transport | Railway network | HL | ||
| Bridges and culverts | HL | |||
| Air transport | Airports, airstrips | ML | ||
| Water transport | Ports, harbours and marine terminals (docks and bridges) | HL | ||
| 2 | Energy | Electricity | Power generation plants | ML |
| Electricity network | ML | |||
| Substations | HL | |||
| Fuel, oil and gas | Refinery plants | HL | ||
| Petrol stations | HL | |||
| Gas and fuel pipe networks | LL | |||
| 3 | Water and Sanitation | Water supply | Water sources and intakes | HL |
| Water treatment plants | HL | |||
| Piped networks system | ML | |||
| Pumping stations | HL | |||
| Storage or balancing tanks | ML | |||
| Drainage and sewerage | Wastewater treatment plants | HL | ||
| Pumping stations | HL | |||
| Piped networks | ML | |||
| Open channels or canals | HL | |||
| CSO storage facility | HL | |||
| 4 | Health Services | Health services | Pharmaceutical industries | HL |
| Medical stores | HL | |||
| Hospitals healthcare centres | HL | |||
| 5 | Financial Services | Financial | Banks’ and funds’ buildings and their installations | HL |
| 6 | Food | Agricultural | Farming lands | ML |
| Irrigation schemes | ML | |||
| Fertilizer and pesticide industries | HL | |||
| Food processing industries | HL | |||
| Warehouses or storage | HL | |||
| Ginneries and clothing industries | HL | |||
| Wholesale and retail shops | HL | |||
| 7 | Shelters | Residential, offices, commercial, social, etc. | Residential buildings | HL |
| Office use buildings | HL | |||
| Markets and shopping buildings | HL | |||
| Recreational and cultural buildings and places | HL | |||
| Hotels and conference buildings | ML | |||
| 8 | Information and Communications Technology (ICT) | Information and communications technology (ICT) | Telephone lines and wireless signals | ML |
| Computers and their installations | LL | |||
| Radio, TV and Internet stations | HL | |||
| ICT structures and devices | ML | |||
| 9 | Emergency Services | Fire brigade | N/A | N/A |
| Emergency medical | N/A | N/A | ||
| Security | N/A | N/A | ||
| General rescue | N/A | N/A | ||
| 10 | Education | Schools, institutes, colleges, universities | School buildings | HL |
| Educational facilities | HL |
| Infrastructure | Categories or Types of Service | Safe Limit of Flood Depth (cm) |
|---|---|---|
| Roads transport | Traffic (motorbikes and vehicles) | 30 * |
| Pedestrians (footpath level) | 20 | |
| Electricity | Customer electric meters | 200 ** |
| Ground Electric cables | 80 | |
| Distribution Transformers | 250 ** | |
| Substations | 350 ** | |
| Water Supply | Valve chambers | 20 |
| Piped networks system | 20 | |
| Pumping stations | 50 | |
| Drainage and Sewerage | Pumping stations | 50 |
| No. | Infrastructure | Investigated | In Flood Depth | |
|---|---|---|---|---|
| <50 cm * | >50 cm | |||
| 1 | Hospitals | 14 | 8 | 4 |
| 2 | Schools and university | 41 | 32 | 7 |
| 3 | Hotels (39 locations) | 282 | 216 | 36 |
| 4 | Petrol stations | 15 | 10 | 3 |
| 5 | Industries and malls | 34 | 23 | 9 |
| 6 | Electricity substations | 4 | 2 | 1 |
| 7 | Water pump stations | 1 | 1 | 0 |
| 8 | Roads | All | All | 0 |
| 9 | Bus station | 1 | 1 | 0 |
| S/N | Street | Pipe Size (mm) | Leakage Locations |
|---|---|---|---|
| 1 | Main Road | 300–1000 | 38 |
| 2 | Ekkamai | 300–1000 | 12 |
| 3 | Sukhumvit 39 | 300–600 | 11 |
| 4 | Sukhumvit 22 | 300–700 | 9 |
| 5 | Asok | 300–800 | 4 |
| 6 | Sukhumvit 24 | 300 | 3 |
| 7 | Sukhumvit 26 | 150–300 | 1 |
| 8 | Other streets | 150–1000 | >100 |
© 2018 by the authors. Licensee MDPI, Basel, Switzerland. This article is an open access article distributed under the terms and conditions of the Creative Commons Attribution (CC BY) license (http://creativecommons.org/licenses/by/4.0/).
Share and Cite
Hilly, G.; Vojinovic, Z.; Weesakul, S.; Sanchez, A.; Hoang, D.N.; Djordjevic, S.; Chen, A.S.; Evans, B. Methodological Framework for Analysing Cascading Effects from Flood Events: The Case of Sukhumvit Area, Bangkok, Thailand. Water 2018, 10, 81. https://0-doi-org.brum.beds.ac.uk/10.3390/w10010081
Hilly G, Vojinovic Z, Weesakul S, Sanchez A, Hoang DN, Djordjevic S, Chen AS, Evans B. Methodological Framework for Analysing Cascading Effects from Flood Events: The Case of Sukhumvit Area, Bangkok, Thailand. Water. 2018; 10(1):81. https://0-doi-org.brum.beds.ac.uk/10.3390/w10010081
Chicago/Turabian StyleHilly, Geofrey, Zoran Vojinovic, Sutat Weesakul, Arlex Sanchez, Duc Nguyen Hoang, Slobodan Djordjevic, Albert S. Chen, and Barry Evans. 2018. "Methodological Framework for Analysing Cascading Effects from Flood Events: The Case of Sukhumvit Area, Bangkok, Thailand" Water 10, no. 1: 81. https://0-doi-org.brum.beds.ac.uk/10.3390/w10010081