Article

Analysis of Soil Erosion Induced by Heavy Rainfall: A Case Study from the NE Abruzzo Hills Area in Central Italy

1
Department of Engineering and Geology, Università degli Studi “G. d’Annunzio” Chieti-Pescara, Laboratory of Tectonic Geomorphology and GIS, Via dei Vestini 31-66100 Chieti Scalo (CH), Italy
2
Istituto Nazionale di Geofisica e Vulcanologia, Sezione Roma 1, Via di Vigna Murata 605, 00143 Rome, Italy
3
SGI Studio Galli Ingeneria S.r.l., Via della Provvidenza, 15, 35030 Sarmeola di Rubano (PD), Italy
*
Author to whom correspondence should be addressed.
Submission received: 21 July 2018 / Revised: 8 September 2018 / Accepted: 11 September 2018 / Published: 22 September 2018
(This article belongs to the Special Issue Soil Erosion by Water)

Abstract

:
Soil erosion induced by heavy rainfall deeply affects landscape changes and human activities. It depends on rainfall distribution (e.g., intensity, duration, cumulative per event) and is controlled by the interactions between lithology, orography, hydrography, land use, and vegetation. The Abruzzo piedmont coastal hilly area has been affected by several heavy rainfall events in the last decades. In this work, we investigated three ~1-day heavy rainfall (>35 mm/h and 100–220 mm/day) events in 2007, 2011, and 2012 that occurred in the clayey hilly coastal NE Abruzzo area, analyzing cumulative rainfall, intensity, and duration while mapping triggered geomorphological effects (soil erosion and accumulation) and evaluating average erosion. The analysis provides contributions to a soil erosion assessment of clayey landscapes that characterizes the Adriatic hilly area, with an estimation of rainfall-triggering thresholds for heavy soil erosion and a comparison of erosion in single events with rates known in the Mediterranean area. The triggering threshold for heavy soil erosion shows an expected value of ~100–110 mm. The estimated average soil erosion is from moderate to high (0.08–3.08 cm in ~1-day heavy rainfall events) and shows a good correlation with cumulative rainfall and a poor correlation with peak rainfall intensity. This work outlines the strong impact of soil erosion on the landscape changes in the Abruzzo and Adriatic hilly areas.

1. Introduction

Rainfall and heavy rainfall events are among the most important factors inducing soil erosion and landslides, particularly in Mediterranean countries [1,2,3,4]. Their impact on slope instabilities is mainly related to the interaction between lithology, orography, hydrography, land use, and vegetation [5,6,7,8,9,10]. The relationship between rainfall intensity/duration and the geomorphological effects on the landscape, especially in terms of heavy soil erosion, is an open issue [1,2,3,5]. This is particularly true in the framework of changing climate/land use and increasing flash flooding induced by extremely heavy rainfall events [8,11,12,13]. These events have a strong impact on landscape changes and deeply affect human activities, inducing large losses and even casualties [14,15,16,17]. For these reasons, they are studied with different approaches and data in Mediterranean and arid environments (e.g., rain gauge data, satellite rainfall data, time series statistical analysis, remote sensing, climate modeling, empirical connections between rainfall and geomorphological effects, morphometry, automated reconstructions, etc.) [18,19,20].
The Mediterranean areas, and particularly the hilly areas all around the Mediterranean coasts (e.g., Apennines hills, Sicily, Liguria, Greece, and also islands, Southern Spain, occasionally the Maghreb areas), are characterized by moderate to low annual precipitation, but occasionally are affected by heavy rainfall events (up to 400–500 mm/day) [21,22,23,24,25,26,27]. Due to these events, the landscape might suffer severe changes in terms of landslides, river modifications, coastal variations, and soil erosion, etc. Clayey hills, such as those characterizing the eastern piedmont of the Apennines and the Adriatic coastal hills of southern, central, and northern Italy [28] are largely used for high-quality plantations (e.g., olive groves, vineyards). This landscape suffers severe soil erosion from sheet-rill erosion, gullies, channel incisions, mud flows, and flooding (among many other issues [14,29,30,31]). Moreover, the coastal areas are devoted to touristic villages and facilities and have suffered strong land-use change and urbanization in recent years, inducing heavy soil consumption [32]. Over the last decades, the Abruzzo region has been affected by several heavy rainfall events (e.g., January 2003, October 2007, March 2011, September 2012, December 2013, February–March 2015, January 2017 [7,25,33,34]). These events have triggered different types of geomorphological instability (i.e., landslides, soil erosion, and flooding), with distribution and types varying from event to event, and in many cases led to an official natural disaster declaration at the regional government level [35].
Rainfall-induced soil erosion is investigated either by means of indirect estimations (e.g. Tu, RUSLE, USPED [36,37]), or with direct measurements (e.g., field plots [38], pins [39], detailed digital elevation models, DEM, morphometry and photogrammetry [40], field survey [39], reservoir sedimentation [36,37], and morphotectonic analysis [41]). The former are more suitable at large basin scales and for average soil erosion assessment [37,42], while the latter are more suitable at the local scale and in small catchment investigations as well as for single event investigations [42] (except for reservoir sedimentation analysis). In this study, we had the opportunity to perform a direct survey with a geomorphological approach (field mapping combined with detailed aerial photos analysis) of the effects of heavy rainfall events on the clayey and sandy hilly landscape of northern Abruzzo (Figure 1). This area is largely dedicated to agricultural activities and high-quality cultivation (e.g., olive groves, vineyards), but is also affected by urbanization-related soil consumption [32]. We investigated three heavy rainfall events that occurred from 2007 to 2012 in terms of rainfall intensity-duration, surface geomorphological effects, and soil erosion, and we compared the very short-term soil erosion effects revealed by this work with wider and more long-term soil erosion in Mediterranean clayey landscapes [39,40,41,42]. The investigated events had rainfall from 100 mm to >200 mm over ~1 day and affected, to different extents, northern Abruzzo (Figure 2) on several dates: 6–7 October 2007 (in a small part of the hilly-coastal Teramo area); 1–2 March 2011 (in the hilly-coastal Teramo and Pescara area); and 5–6 and 13–14 September 2012 (in the hilly coastal Teramo area). For each of them, the rainfall amount, intensity, and duration were investigated by means of rain gauge data (18 pluviometric stations; Figure 2). The survey of geomorphological effects induced by the events was focused on some small coastal catchment with investigation in the field and by means of aerial photos and technical reports and geographic information system (GIS) mapping. The data processing enabled the analysis and comparison of geomorphological effect and soil erosion estimations with hourly rainfall intensity, event cumulative rainfall, daily rainfall, and rainfall before the event.
The aims of the work are as follows: (1) to outline the correlation between rainfall parameters and geomorphological effects in terms of soil erosion in NE Abruzzo; (2) to assess the impact of soil erosion on the clayey landscape (which is largely characterized by high-quality plantations); and (3) to contribute to the empirical definition of rainfall threshold for the triggering of heavy soil erosion through local inventories (for the debate on this issue see also Segoni et al. [43] and references therein). These types of investigations may contribute to applied studies for the stabilization and management of slopes and minor or major drainage basins, and for general land management. Finally, this work is expected to contribute to quantitatively investigate and mapping land sensitivity to soil erosion, and for defining future scenarios of the impact of soil erosion on areas increasingly devoted to high-quality agricultural deployment (e.g., vineyards, olive groves), which sustainable land planning and management should be based on [14,29,31].

2. Study Area and Rainfall Events

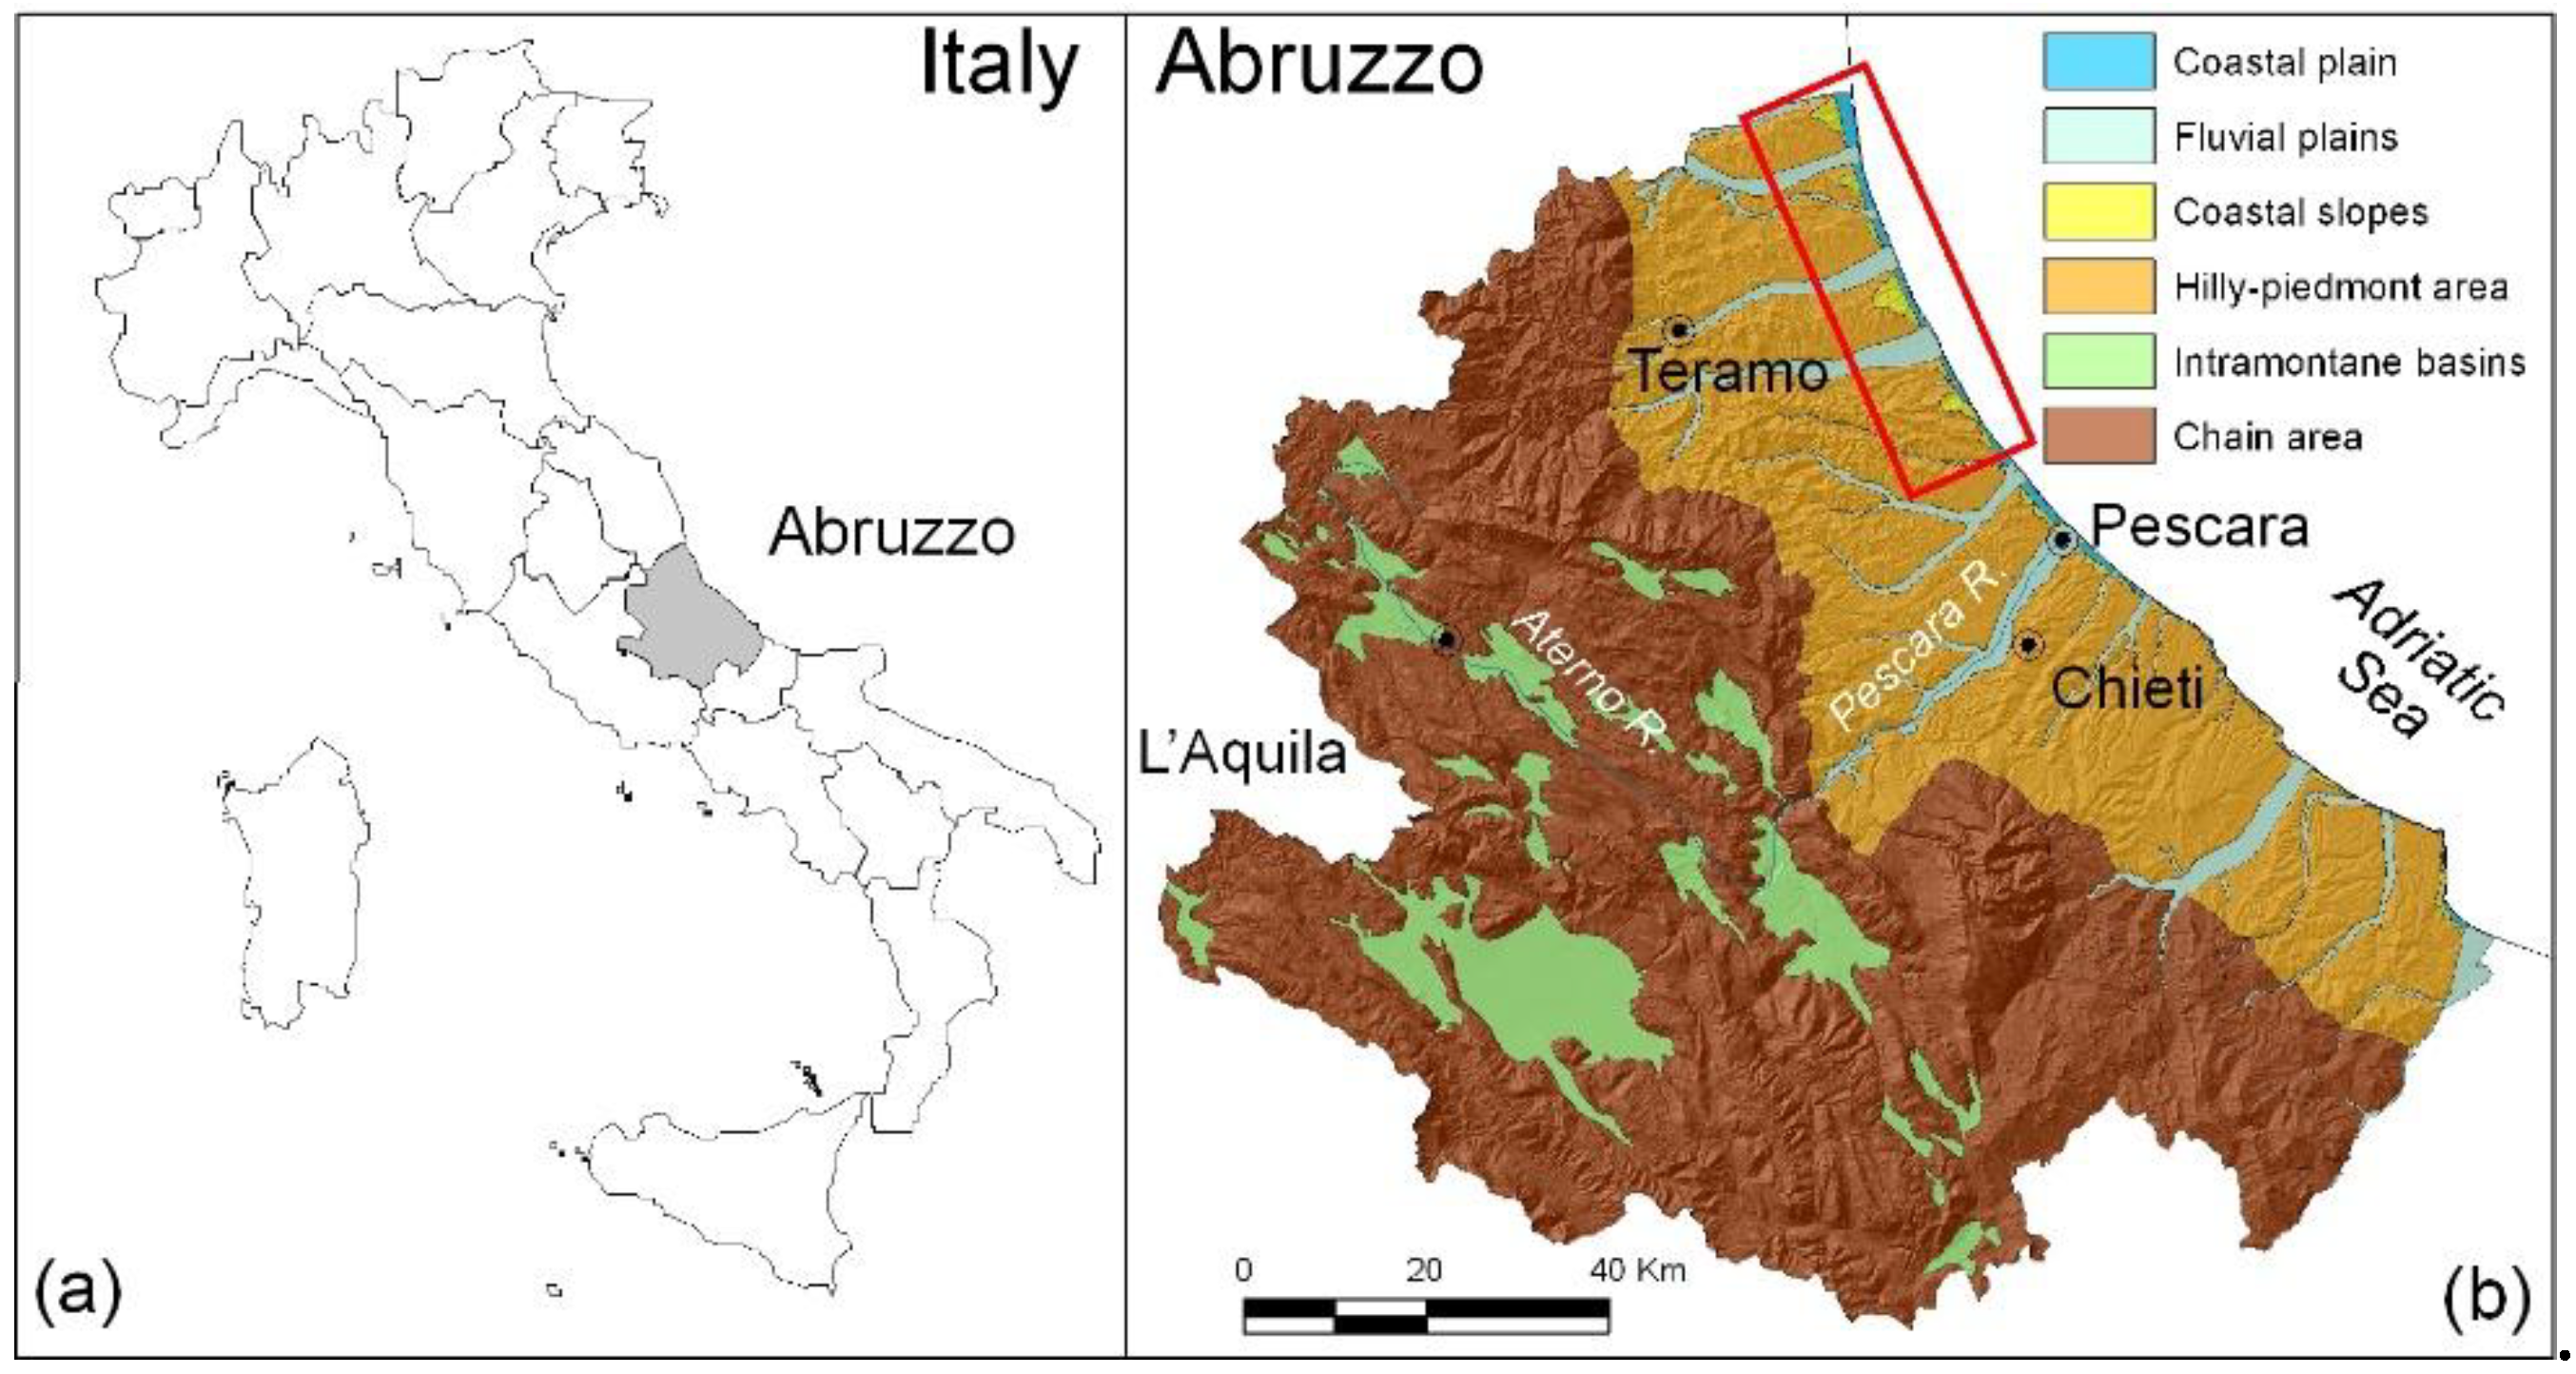
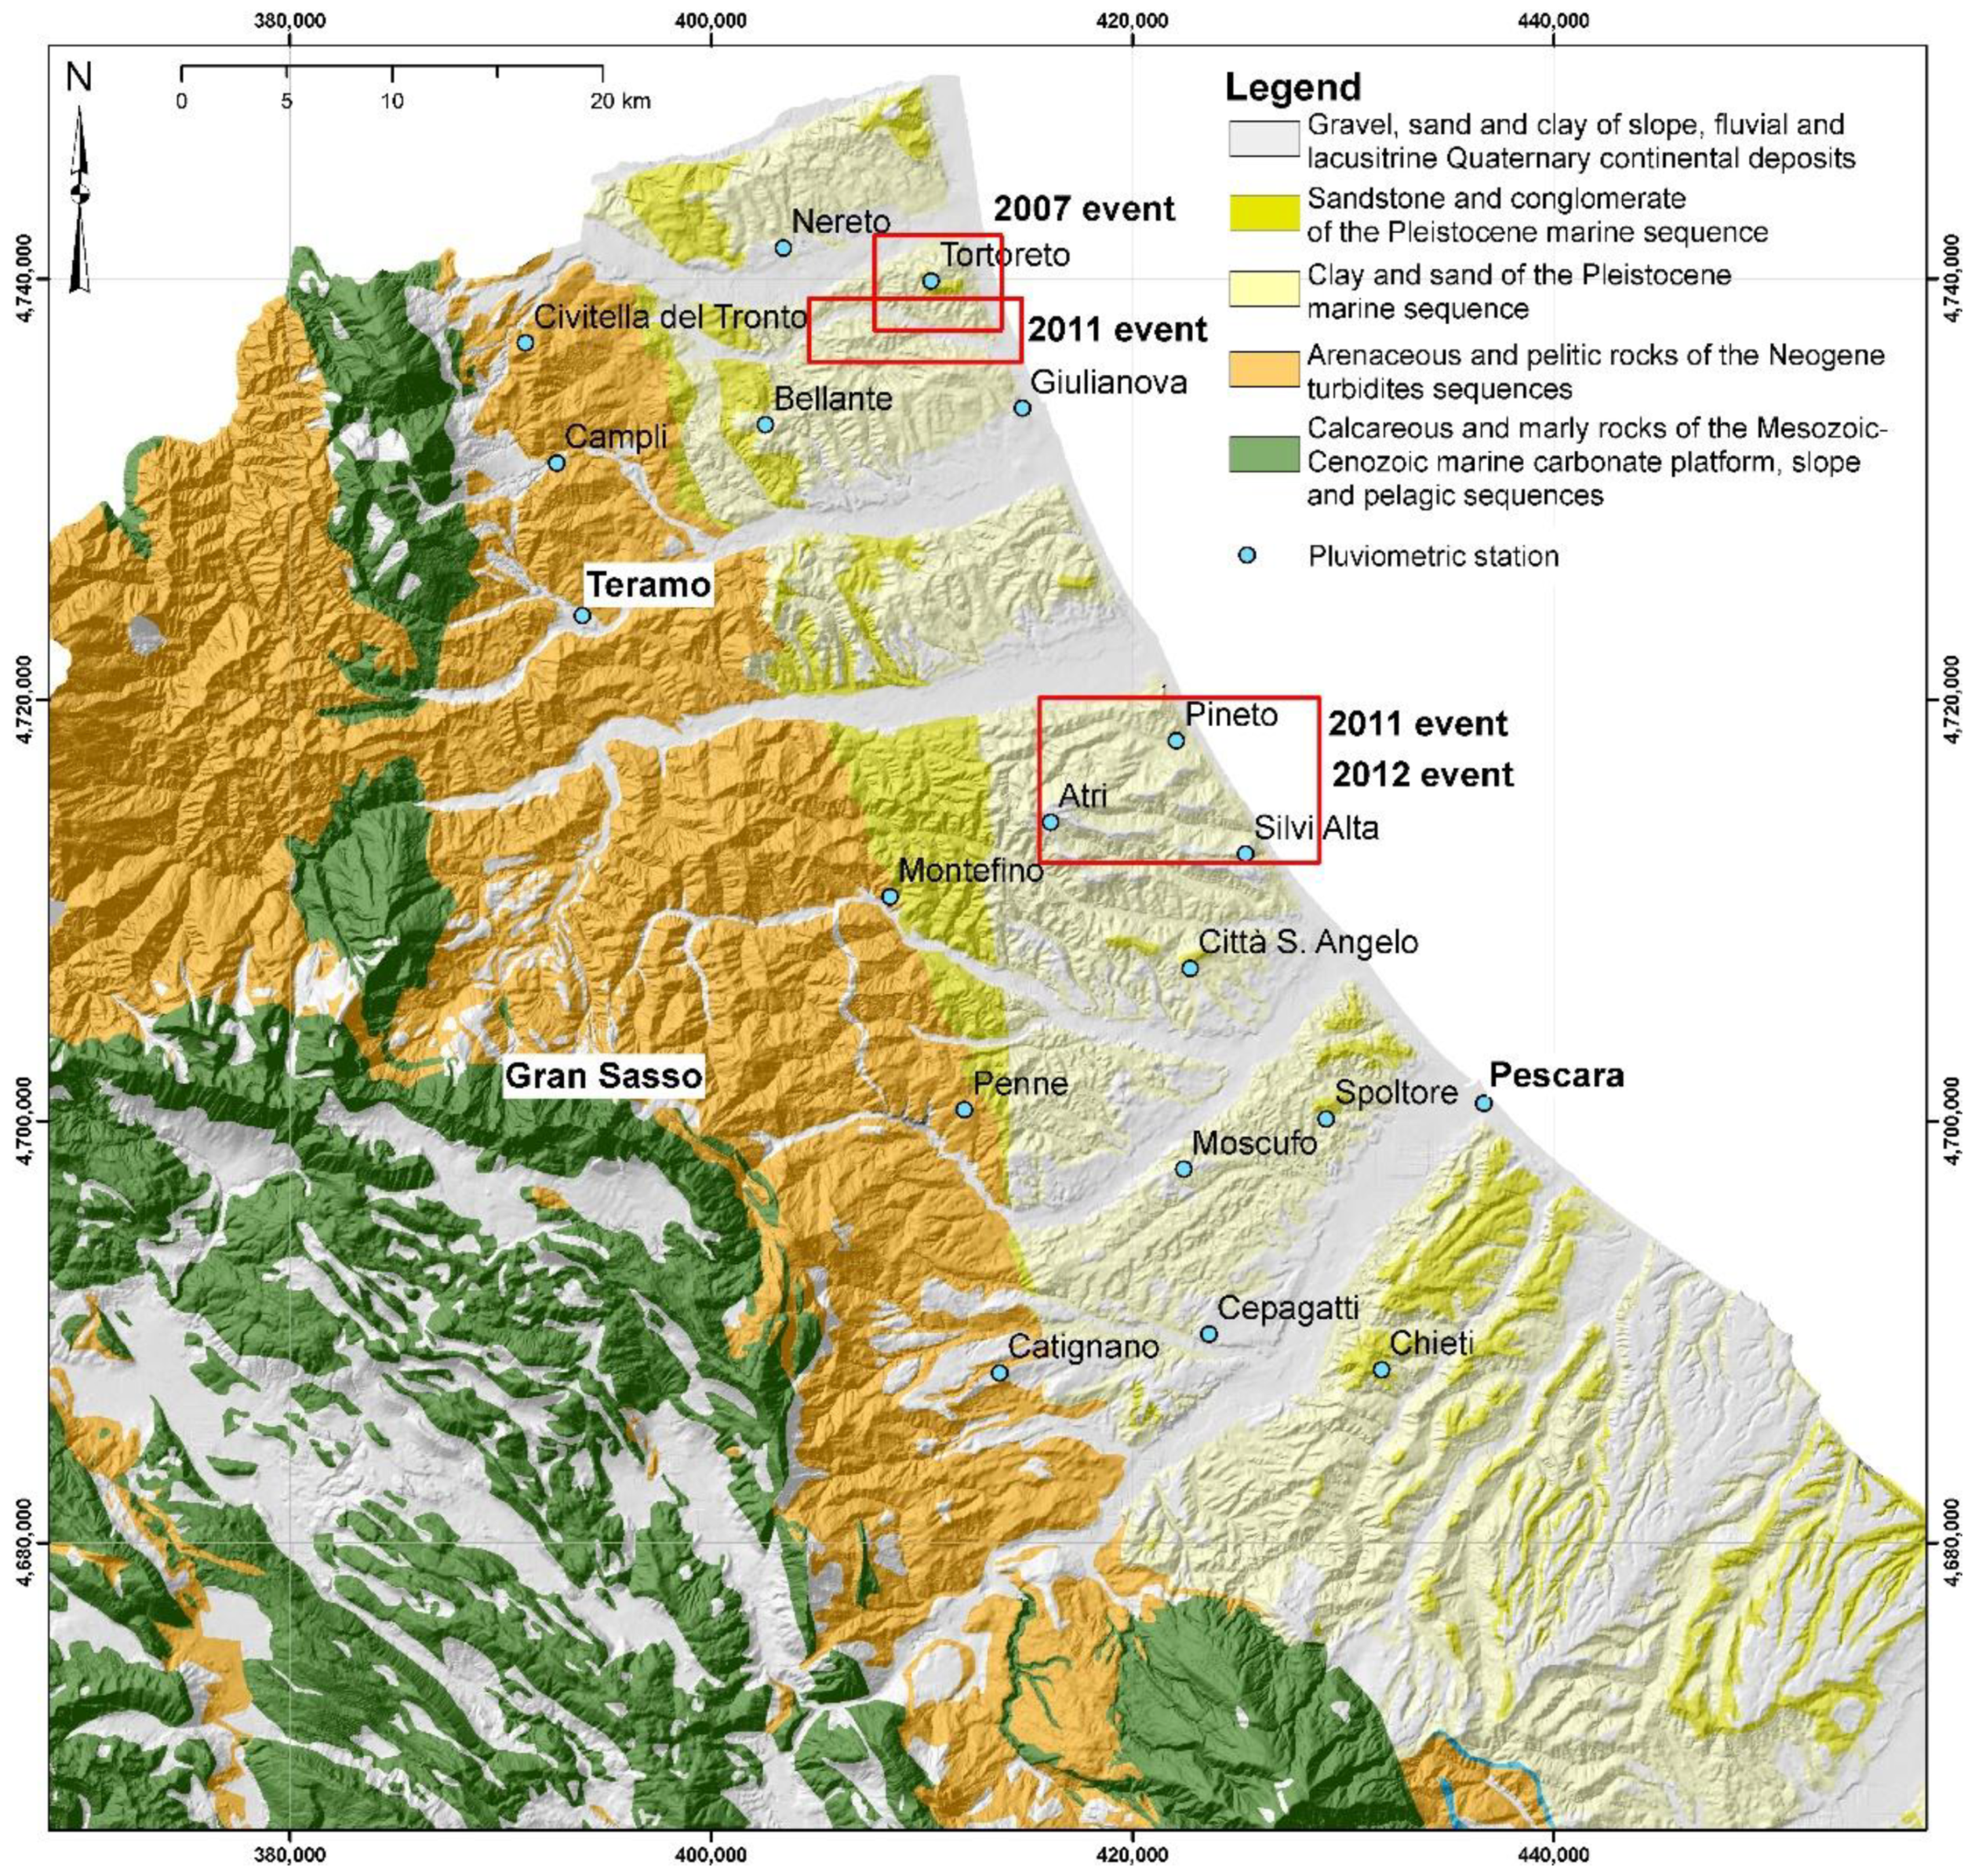
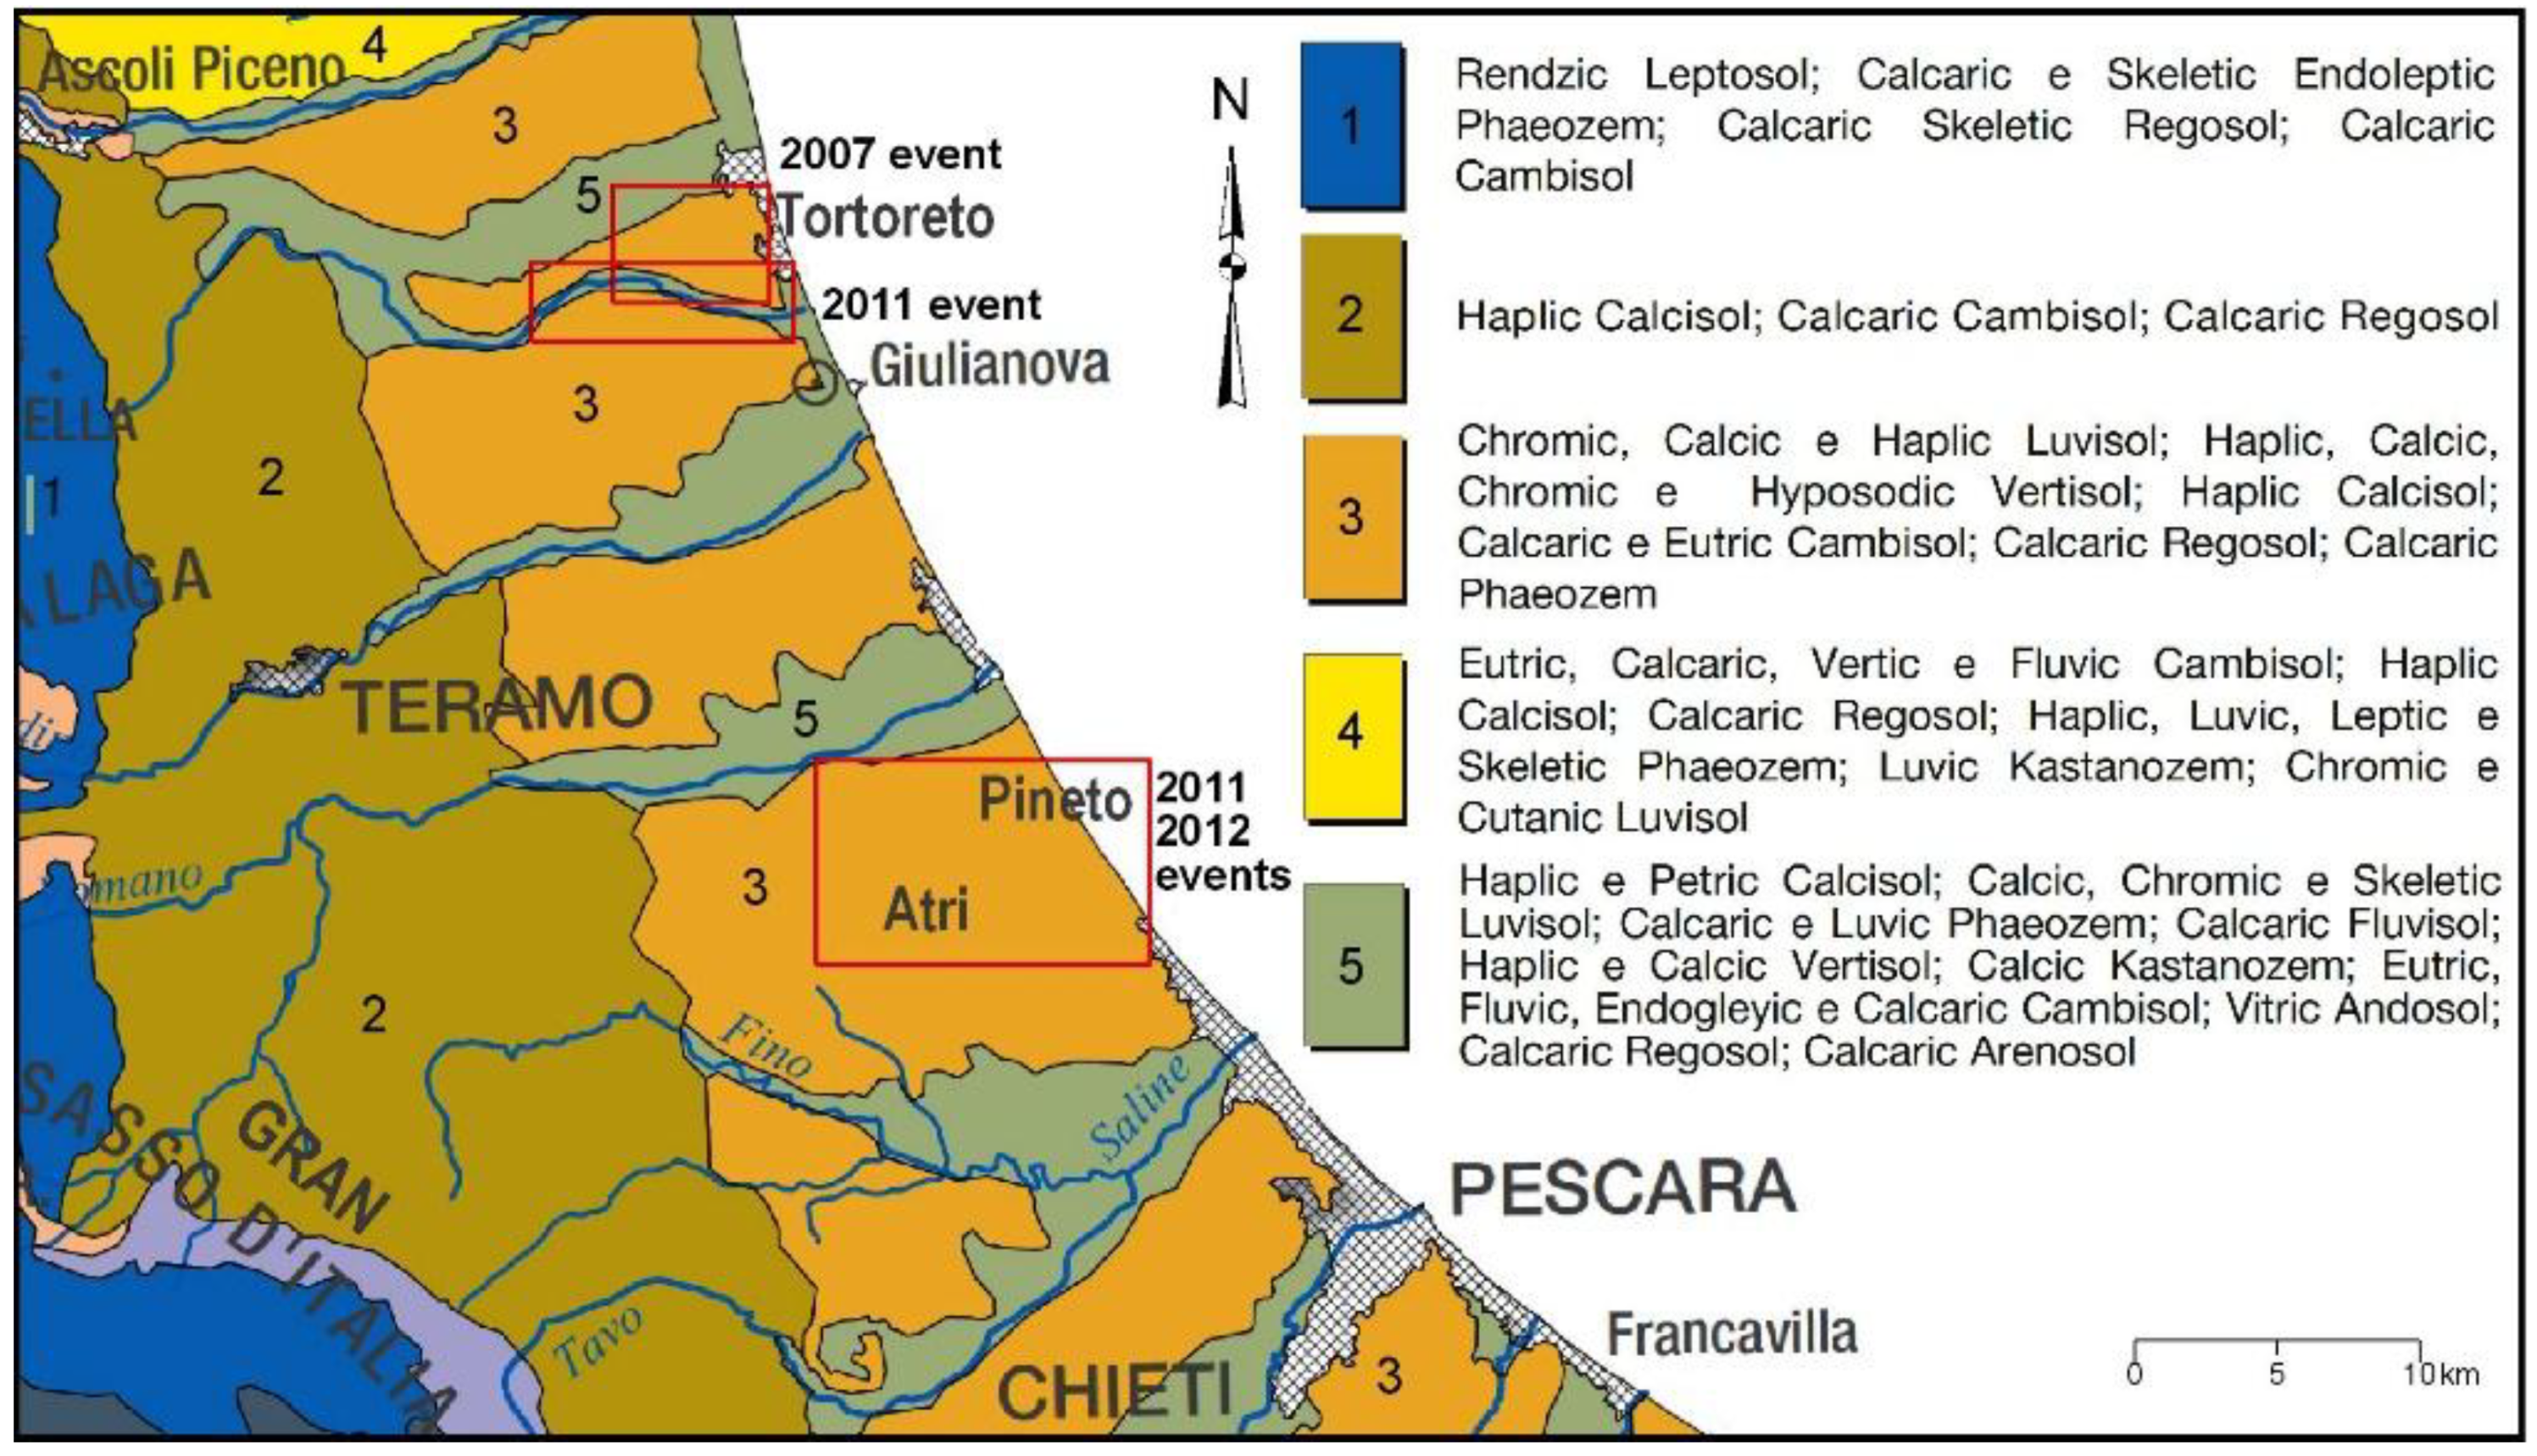
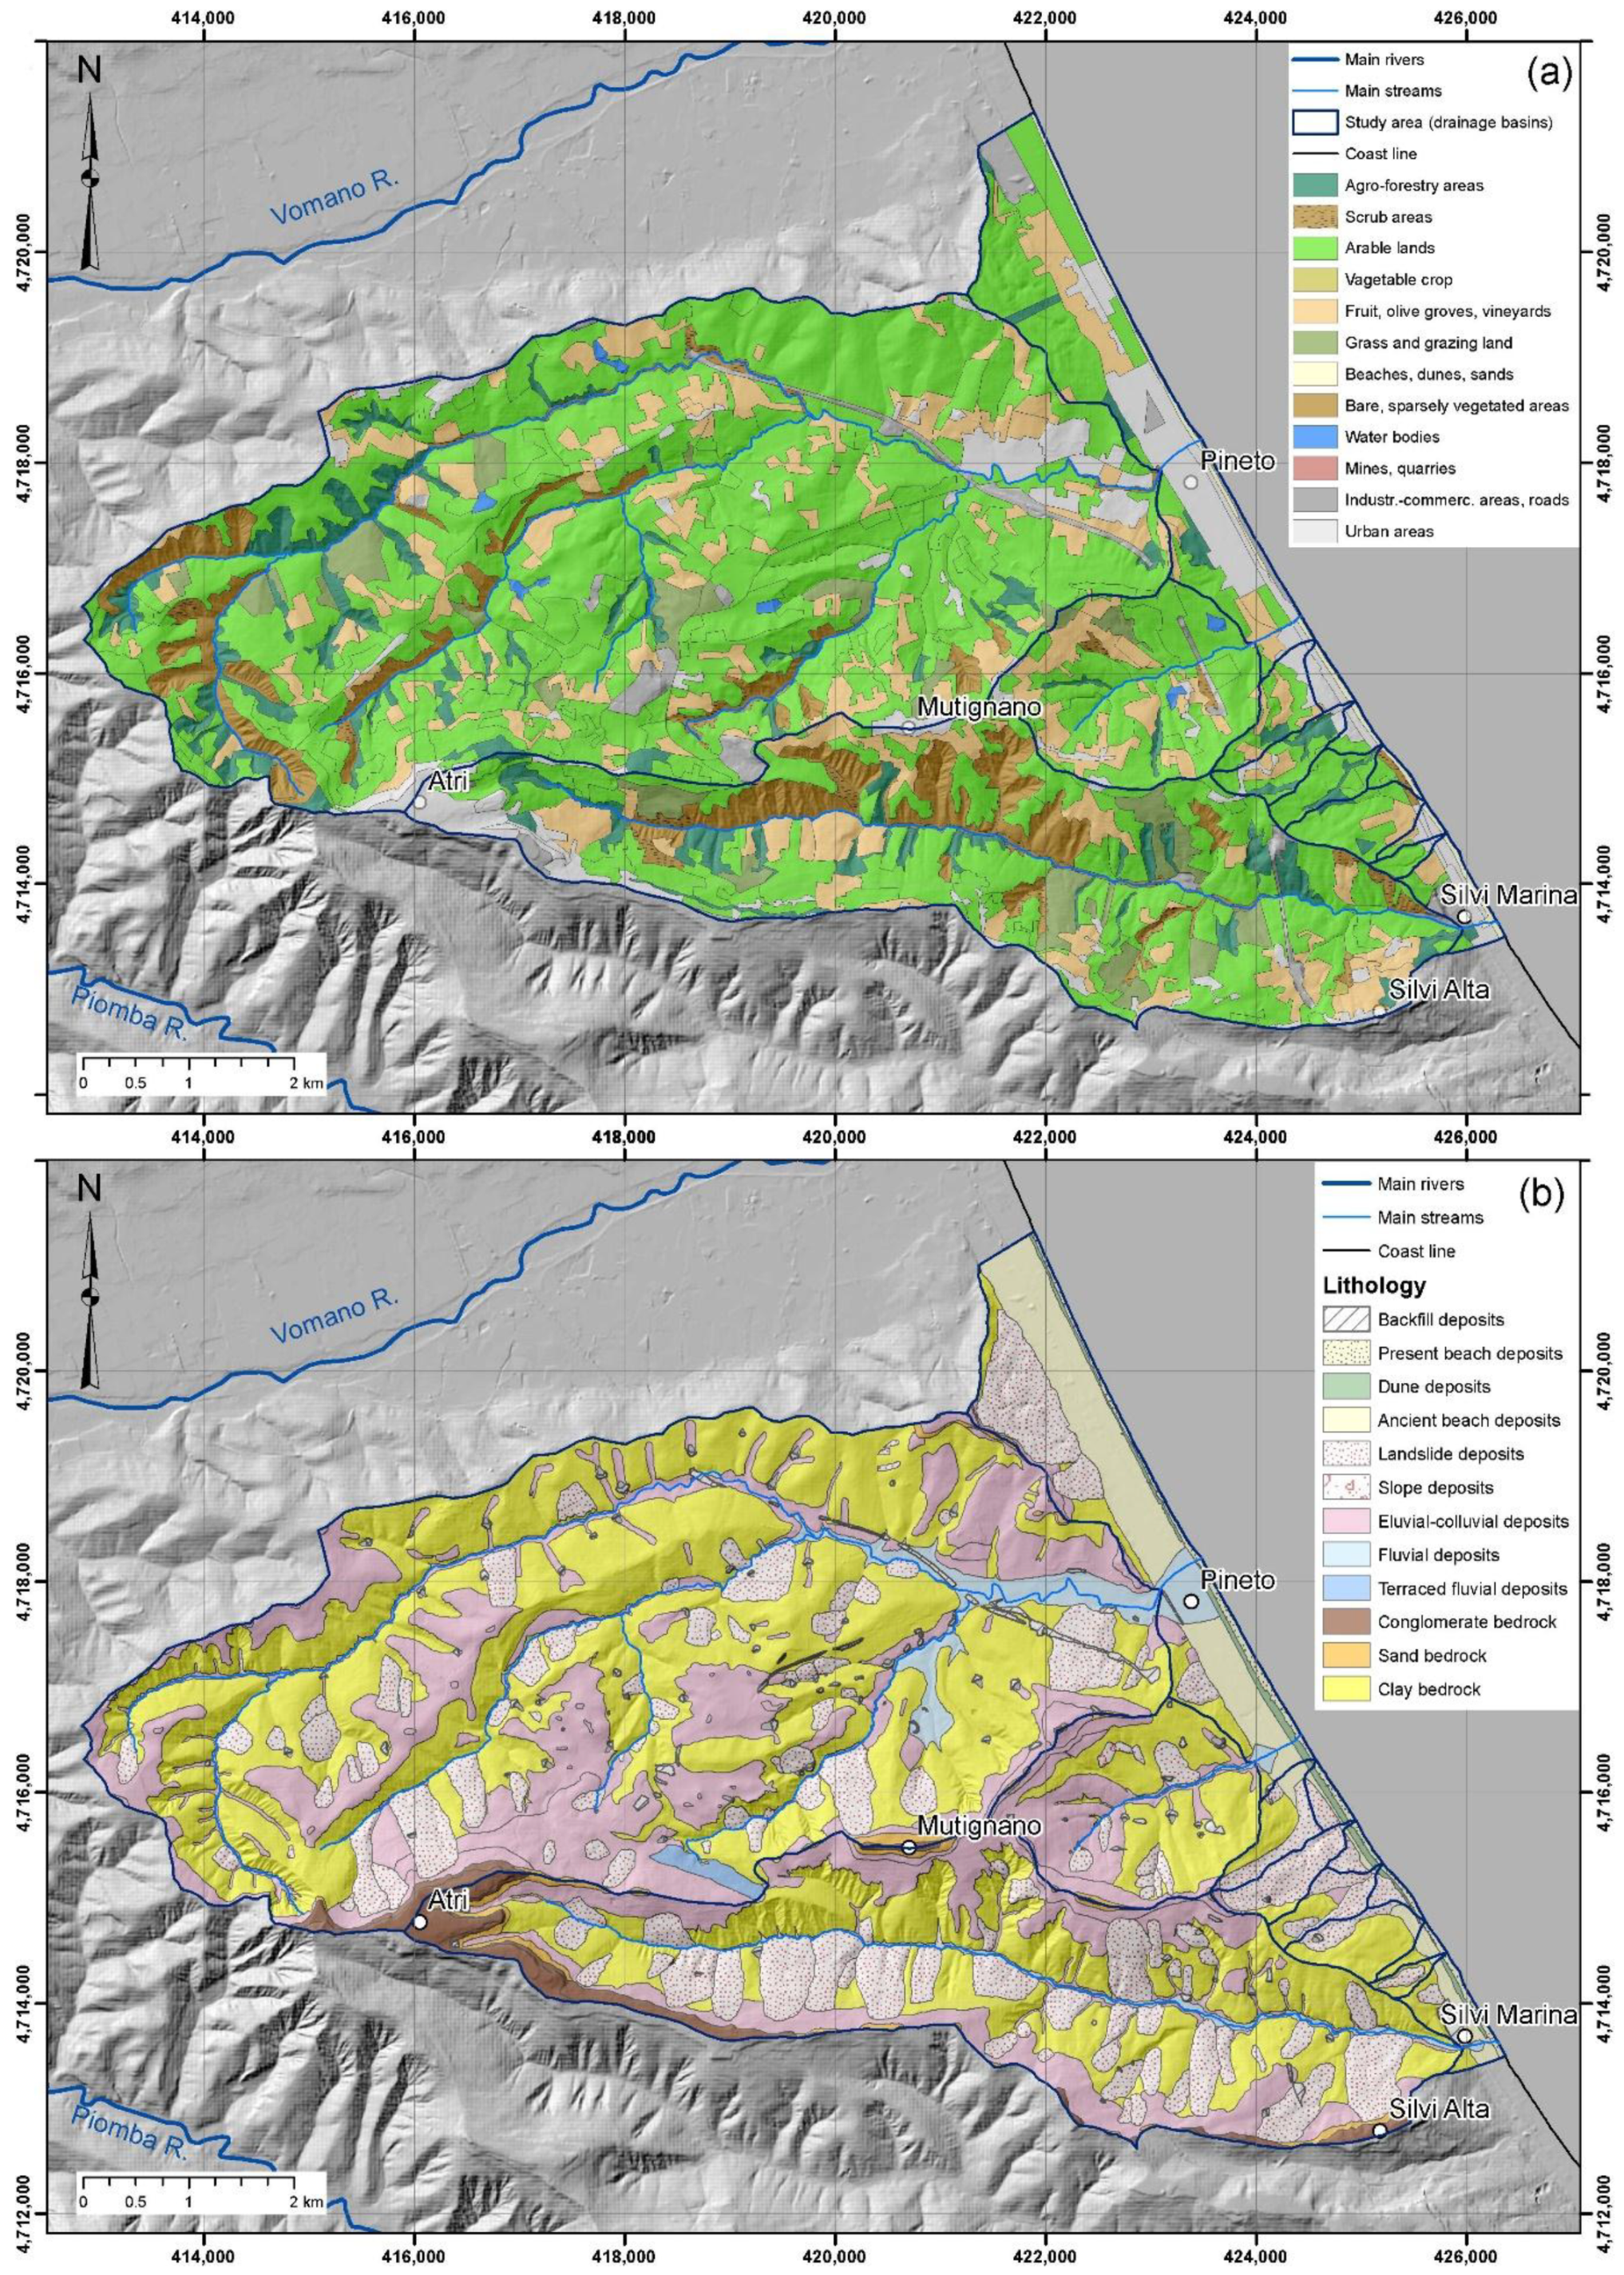
2.1. Regional Setting

The NE Abruzzo region is located in the central eastern part of the Italian peninsula along the piedmont area of the Central Apennines and the hilly coastal area (Figure 1). It includes the lower part of the main SW–NE to W–E fluvial valleys (the Tronto, Vibrata, Salinello, Vomano, and Saline rivers), and the small tributary catchment of the main rivers and those incising the coastal slopes.
The elevation ranges from 0 to ~600 m along the main drainage divides between the main rivers, and the terrain gradient (derived from a 10-m-cell digital elevation model, DEM) ranges from 0° along the river and coastal plains to >40°, with local vertical scarps along the slopes.
There are four lithologic bedrock complex, or groups of rock units, in the area, each comprising different marine sedimentary rock types varying in strength from hard to weak and soft rocks: (1) sandstone and claystone (in the inner hilly areas); (2) clay (in the lower slopes of the coastal hilly areas); (3) sand and weak sandstone (in the upper slopes of the hilly coastal areas); and (4) conglomerate and consistent gravel (at the top of the main coastal hills). In the recent official geological map of Italy [44,45], these complexes are pertaining to Neogene turbiditic arenaceous and pelitic rocks, and to Plio-Pleistocene marine clay–sand–sandstone–conglomerate rocks. The bedrock units are covered with Middle Pleistocene–Holocene clastic continental deposits (slope, landslides, fluvial deposits) at the bases of the slopes and in the main valleys (Figure 2). The hillslopes and coastal slopes are mantled by clay- and sand-rich eluvial and colluvial cover, for which thickness ranges from < 1 m to >10 m depending on morphology and lithology (thicker in clay bedrock and within minor valleys). Finally, the superficial soil cover reflects the lithological types, with thickness ranging from a few centimeters to >1 m. The piedmont and coastal hilly areas, as well as the river and coastal plains, are mostly characterized by luvisoils, vertisoils, and cambisoils (Figure 3 [46]) developed on clayey and sandy parent materials [47], which are typical of terrains affected by high erosion rates [48]. The structural setting is defined in the inner part by thrust reliefs, which are affected by regional NNW–SSE Pliocene thrusts and minor high-angle normal faults and, in the outer part, by a large slightly NE-dipping homocline [44,45,49,50,51,52,53].
The piedmont coastal area features a hilly landscape carved by cataclinal valleys (SW–NE) on arenaceous–pelitic thrusted and faulted successions and on a gently NE-dipping homocline on clay, sand, and conglomerate deposits. This landscape is incised by the main river valleys (featuring up to 4-km-wide fluvial plains) and by minor catchments flowing toward the main valleys and the coastal plain (featuring radial, trellis, and angular drainage patterns [49]). The coastal area is characterized by wide coastal slopes and a coastal plain up to >1 km wide [49,54]. The geomorphological processes are mainly fluvial, gravity-induced, and mass-wasting. These processes are frequently activated by the heavy rainfall events that affect the region. Fluvial processes affect the main rivers, alternating between channel incisions and flooding. The slope processes due to running water mostly affect the clayey and arenaceous–pelitic hills of piedmont and the coastal areas, generating badlands and minor landforms such as rills, gullies, and mudflows [41]. Mass-wasting processes have induced the formation of a huge number of landslides and mass movements, mostly affecting the hilly piedmont area and the chain area and, locally, the coastal area [54,55,56,57]. Moreover, the clayey hill areas are largely affected by both short-term and long-term heavy soil erosion processes [58]. The long-term average erosion rate is documented to be ~0.1–14 mm/year, and the short-term erosion rate is 1–90 mm/year in this area and in the central Italy clayey hills [29,39,40,41,42].
The hilly piedmont coastal area is characterized by a maritime Mediterranean climate [59]. The average annual precipitation is 600–800 mm/y, with occasional heavy rainfall (>100 mm/day and 30–40 mm/h) [33,34,60,61,62]. In the last decades, this area was affected by flash flood events induced by heavy rainfall ranging from 60 to 80 mm in a few hours to >200 mm in one day (e.g., January 2003, October 2007, March 2011, September 2012, December 2013, February–March 2015, January 2017).
In terms of land use, the hilly coastal area of NE Abruzzo is characterized by arable lands, and the number of high-quality plantations (mainly olive groves and vineyards) has increased in the last decades; minor urban areas and sparsely urbanized rural areas are also present. The fluvial plains show alternating cropland and industrial commercial areas. Finally, the coastal plain is mostly seamlessly urbanized with villages, tourist facilities, roads, railroad, ports, etc.

2.2. Rainfall Events and Affected Areas

The investigated heavy rainfall events occurred on 6–7 October 2007, 1–2 March 2011, and 5–6/13–14 September 2012, and affected the Tortoreto area, the Pineto and Salinello River area, and the Pineto area, respectively (Figure 2).

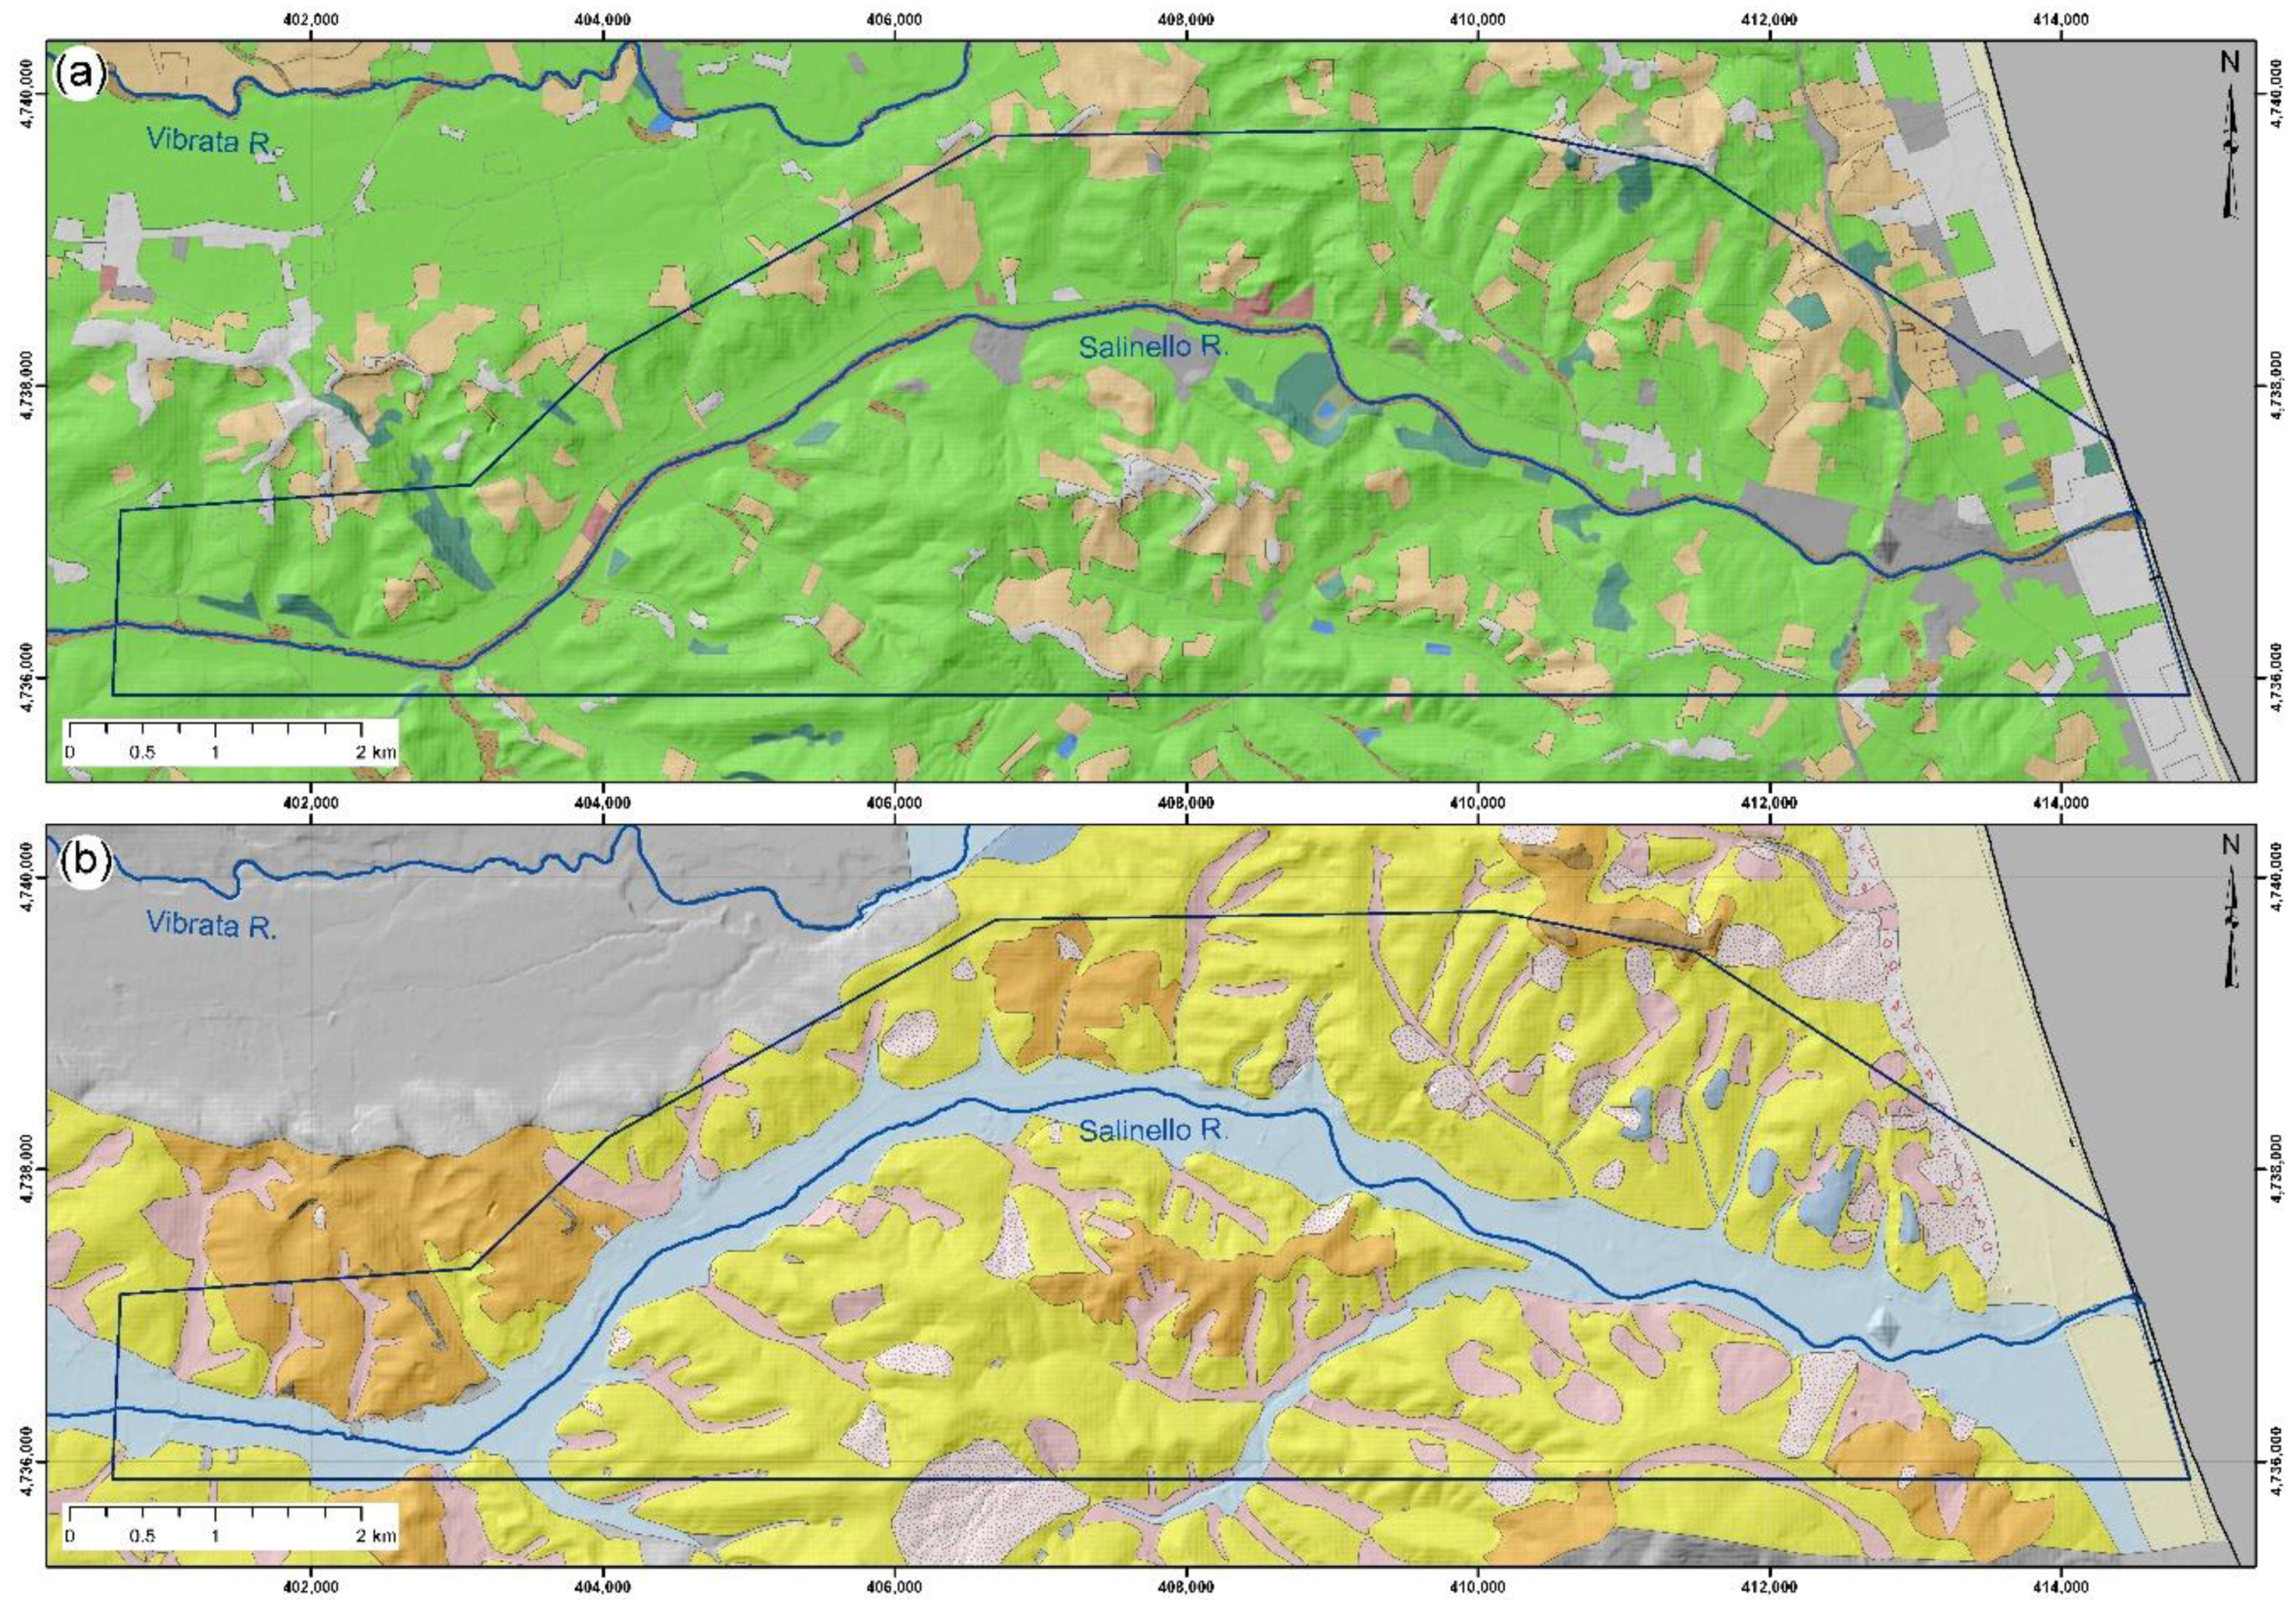
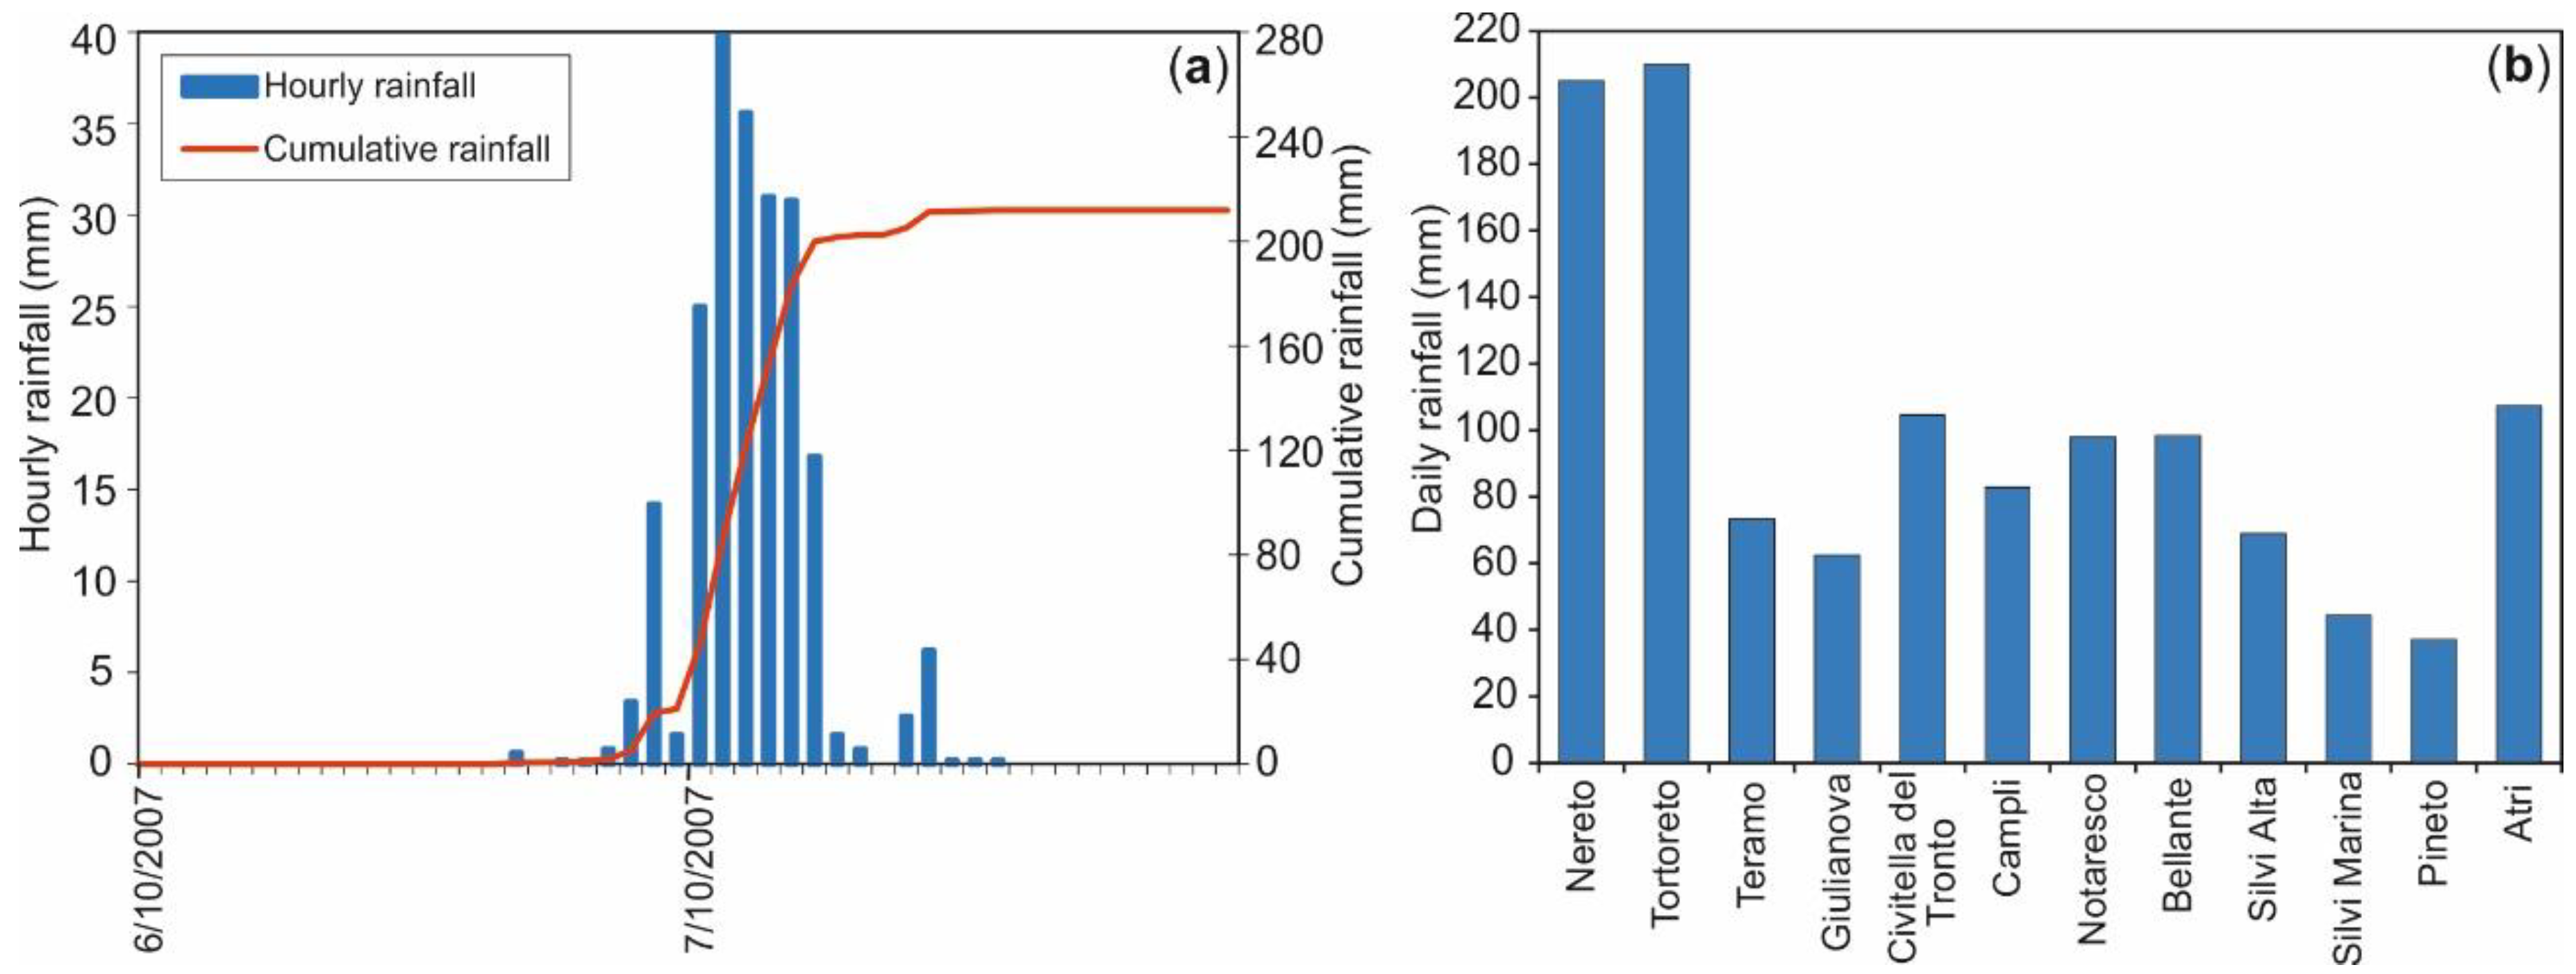
2.2.1. Rainfall Event of 6–7 October 2007

The 2007 heavy rainfall event affected, for a short time (14–16 h), a local area in the northern Abruzzo (hilly and coastal Tortoreto area; Figure 2), including tributary catchments between the Salinello and Vibrata rivers and coastal catchment (total area of 43.7 km2). River and coastal plains (slope gradient > 5°) cover 35% of the area, while 65% is hills (slope gradient 5–30°, with local scarps). The event occurred after two dry months and affected a very poorly vegetated landscape. The agricultural areas (arable land, vineyards, and olive groves; Figure 4a) were largely plowed on erodible clay bedrock with sands and conglomerates on the top of the hill, both largely covered with clayey eluvial and colluvial cover and landslides (Figure 4b).

2.2.2. Rainfall Event of 1–2 March 2011

The 2011 heavy rainfall event affected the entire northeastern Abruzzo piedmont hilly area (hilly and coastal Teramo area between the Vomano, Tordino, Salinello, and Vibrata rivers; Figure 2) for a moderately short time (22–26 h), after ~10 days of moderate rainfall (total 50 mm). After this event, two areas were investigated in detail because they suffered the heaviest rainfall and induced effects: the Salinello River valley and the Pineto-Atri hilly area (Figure 2). The Salinello area includes the lower part of the Salinello River valley and the surrounding hillslopes (including part of the Tortoreto hilly area affected by the 2007 event). Over 50% of the area pertains to the river and the coastal plains; the remaining area incorporates the hilly relief up to ~300 m a.s.l. with a slope gradient of 5–30° (total area 39.7 km2; Figure 5). With respect to the 2007 event, which partially affected the same area (lower Salinello hillslopes), the 2011 event occurred on a moderately vegetated landscape with agricultural areas (arable land, vineyards, and olive groves; Figure 5a) at an initial crop growth stage and during grass development. This event occurred again on clay–sand–conglomerate bedrock blanketed by a clayey eluvial and colluvial cover and landslides (Figure 5b).
The Pineto-Atri area consists of three coastal catchments, the intervening coastal slopes, and an up to <1 km wide coastal plain (total area 60.6 km2; Figure 6). The elevation ranges from sea level to ~450 m a.s.l. The coastal and river plain areas make up ~15% of the area, while the hilly area (slope gradient 5–35° with local scarps) makes up the remaining 85%. Similar to the others, the Pineto area is characterized by arable land and high-quality plantations in the hilly areas, but also large bare clay areas within widespread badlands affecting the south-facing clay slopes.
The coastal area is, again, seamlessly urbanized (Figure 6a). The hillslopes are on clay bedrock; in the hilltops, sand, sandstone and conglomerate are present. As for the other areas, the slopes are covered with eluvial–colluvial covers and landslides (Figure 6b).

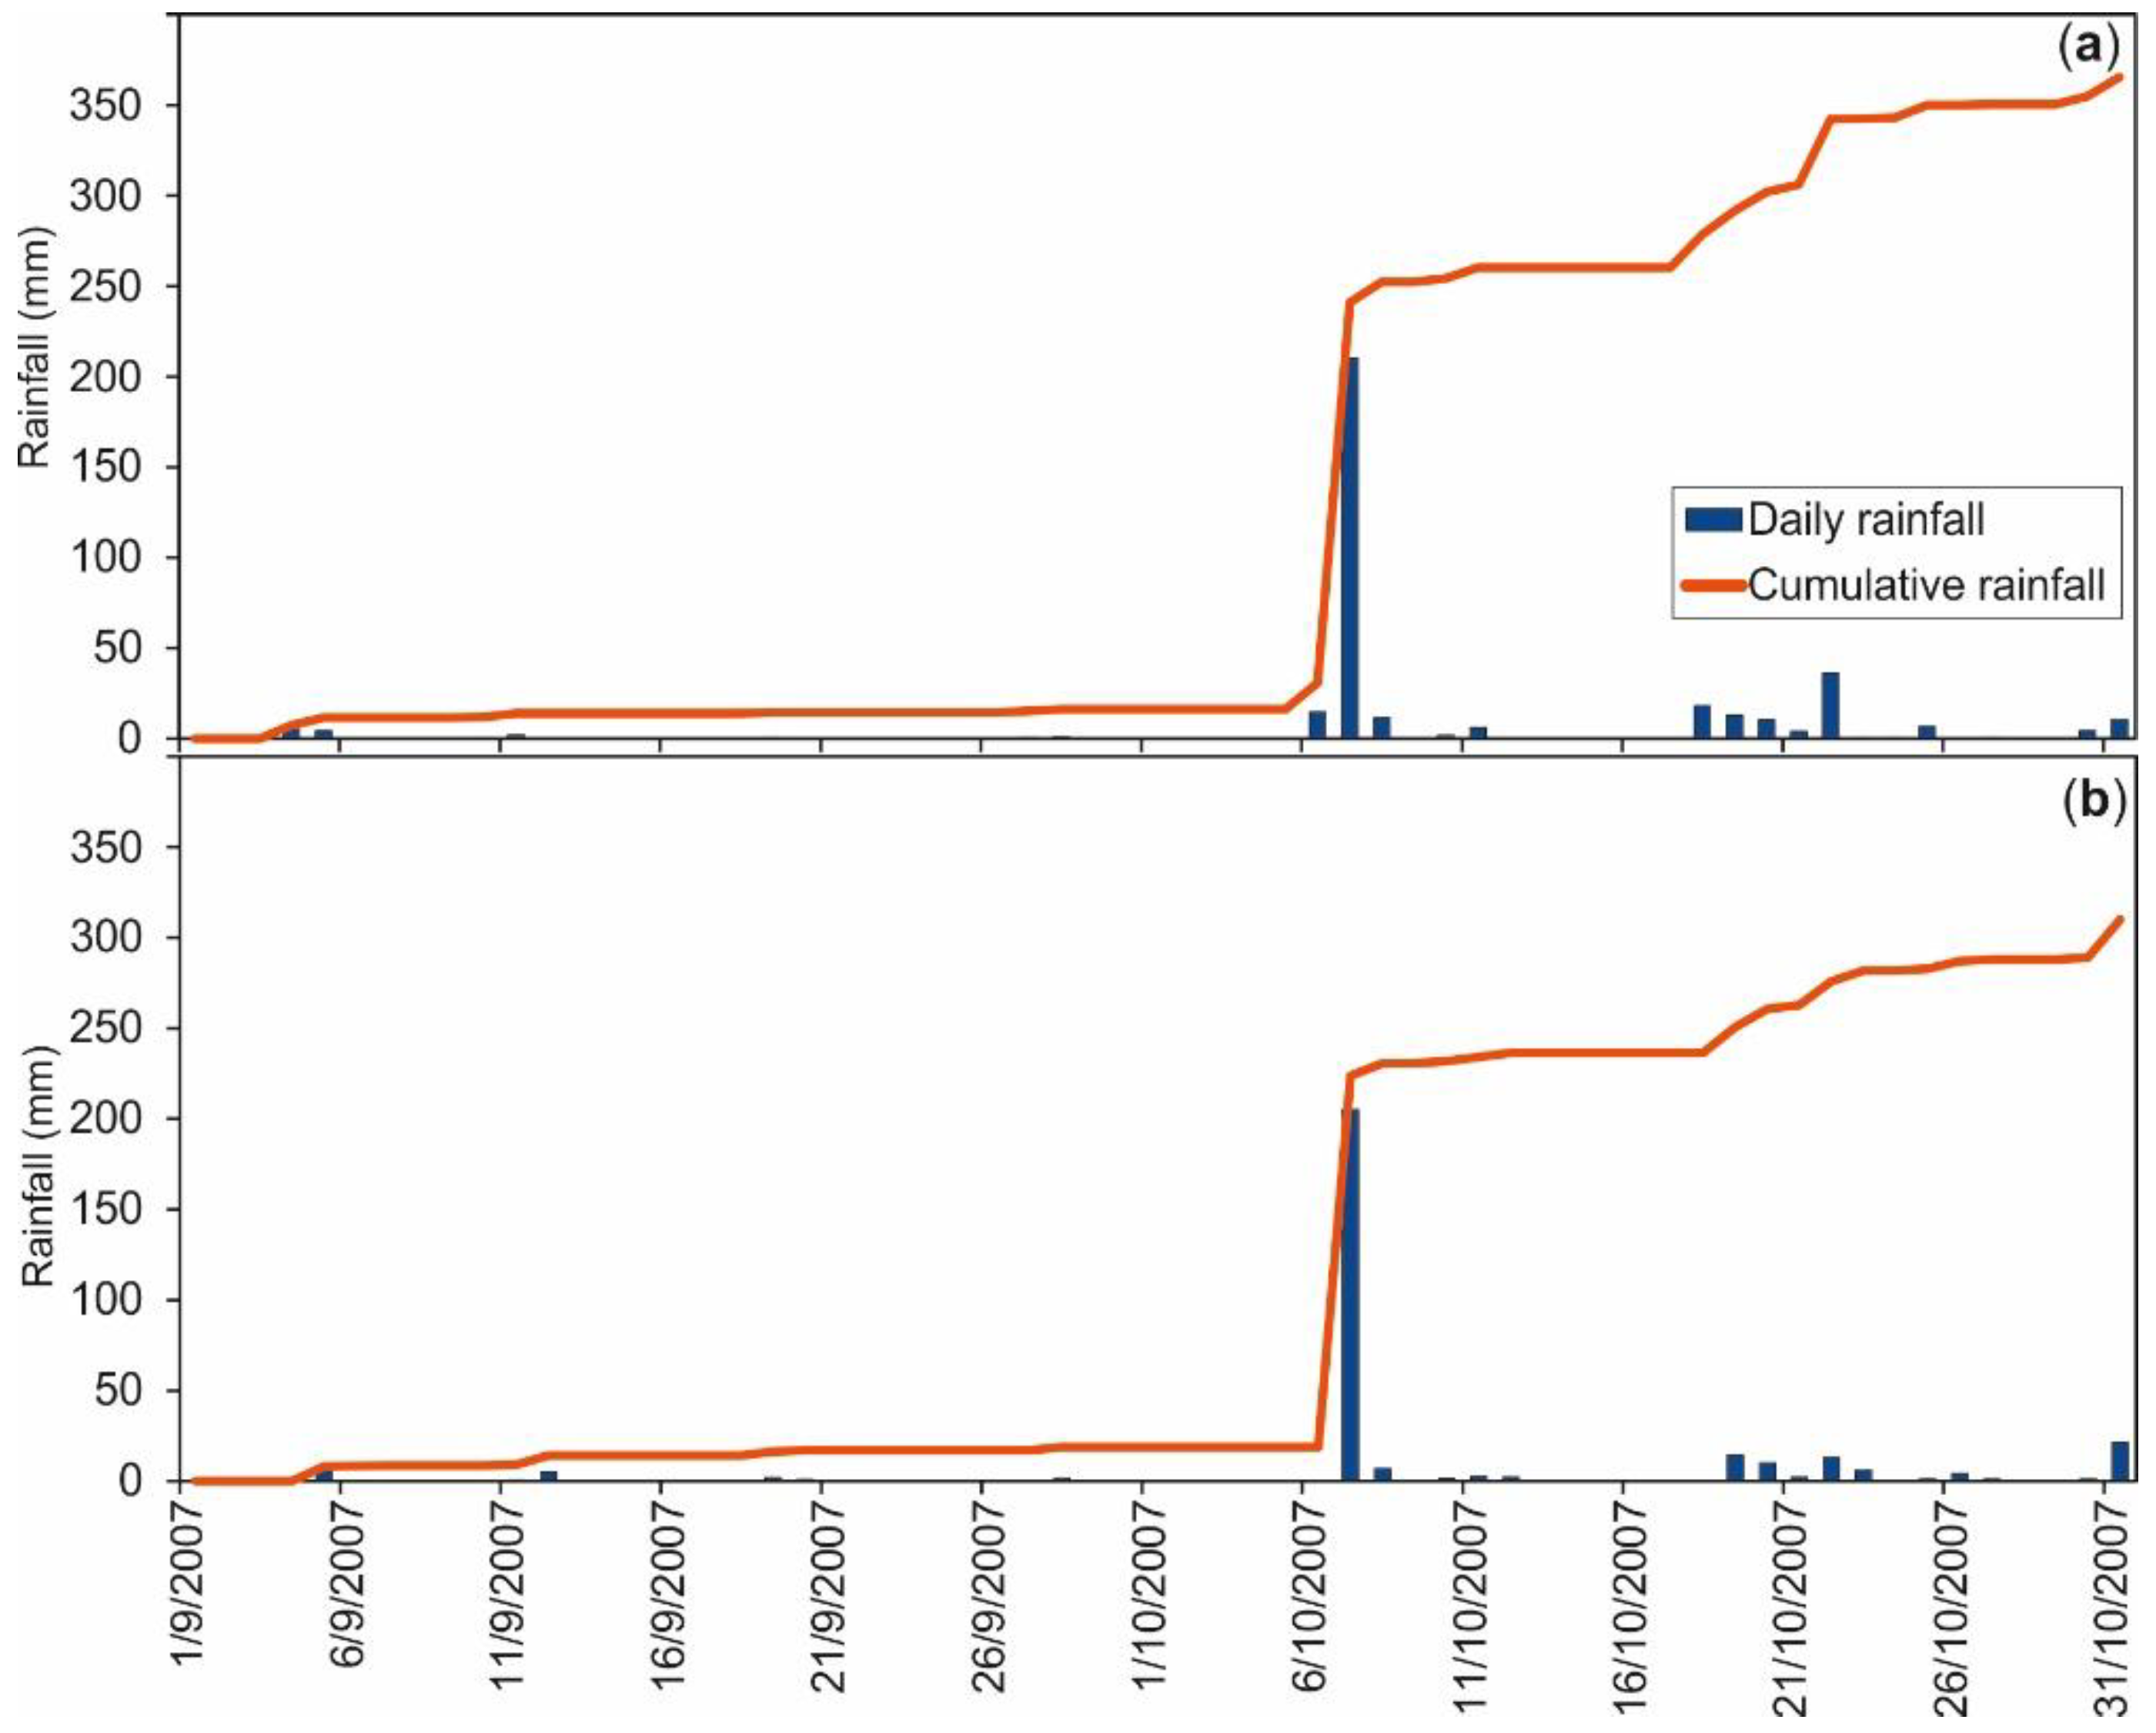
2.2.3. Rainfall Event of 5–6 and 13–14 September 2012

During September 2012, after a >1-month dry time, the hilly coastal area of the northeastern Apennines (between the Pescara and Vibrata rivers; Figure 2), was affected by two rainfall events a short time from one another: a moderate one on 5–6 September and a heavy one on 13–14 September. After both of these events, the Pineto-Atri area was investigated in detail (the same three minor coastal catchments analyzed in 2011; Figure 6). The 2012 event occurred on poorly vegetated landscape with agricultural areas (arable land, vineyards, and olive groves) that were mainly plowed.

3. Methods

This work deals with the rainfall-induced soil erosion issue with a geomorphological approach based on direct field observation and remote air-photo analysis. It is based on the comparison of rain gauge data and geomorphological effects on the piedmont and coastal area of the NE Abruzzo region during three heavy rainfall events. We used a rainfall dataset from a network of 18 meteorological pluviometric stations (blue dot in Figure 2) provided by the Functional Center and Hydrographic Office of the Abruzzo Region. In the study area, 5–15 min sampled rain gauges (for at least 6 days around the main events, accuracy 0.2–1 mm) were analyzed, as well as daily data (1–2 months before the event). For each event, the data (from single rain gauges or from networks of rain gauges) enabled the analysis and comparison of: (1) hourly rainfall intensity; (2) event cumulative rainfall; (3) event duration; (4) daily rainfall; and (5) pre-event rainfall [2,43,65]. In this work, we do not consider the uncertainty in the rainfall duration triggering the geomorphological instabilities [65] because all the events are well defined in terms of time, and, focusing on the overall soil erosion, we consider all the effects induced by the entire events as an assumption.
The geomorphological effects of the heavy rainfall events were investigated through different types of available data: (1) 1–2-day post-event field surveys (1:5000; 2011 and 2012 events); (2) analysis of 2-day post-event aerial photos (2007 event; aerial photo scale 1:5000 taken on 9 October 2007 provided by Abruzzo Region Cartographic office) combined with ground truthing through direct landform measurements; and (3) effects inventories and technical reports (all events). This allowed us to be confident that the mapped effects were triggered by the events [66]. The field survey investigated the lithological features of bedrock and superficial deposits cover and the field data were compared to the results of borehole investigations and technical reports. The field geomorphological investigations focused on the type and distribution of the geomorphological effects (i.e., sheet-rill areas, gully areas, major gullies, channel incision, mud flows, flooding areas, crevasse splays, bank failures). For all of the landforms, the length, width, and surface area were mapped in the field (~5 m plan resolution by means of GPS measurements and mapping on 1:5000 topographic maps) and digitized in GIS software (ArcMap® 10.1, ESRI, Redlands, CA, USA). The incision of the erosional landform and the thickness of the depositional landforms were directly measured in the field (~1–5 cm precision) on~55% of the landforms and inferred from remote observation on the remaining ~45%. For the 2007 event, the remote observation from aerial photos (0.5-m resolution) allowed us to map, with GIS software, the surface distribution of the landforms and partly interpret their incision and thickness. Some landforms (from four to ten) for each type were observed and measured in the field for ground-truthing. Through these combined field and remote investigations, a dataset including (1) 1192 features for 2007 (~40 points of direct measurements), (2) 299 features for 2011 (~180 points of direct measurements), and (3) 614 features for 2012 (~330 points of direct measurements), was defined including soil erosion and flooding features induced by the three events. This allowed us to define or estimate the average erosion depth or accumulation thickness for all the landforms. Considering the surface area (for areal landforms), length and width (for linear features), and the average erosion depth or accumulation thickness of the landforms, the eroded volume, as well as the sedimented volume, were estimated for each landform for the overall investigated areas and for each event as follows:
(1)
areal landform erosion = i = 1 n a v g . e r o s i o n   d e p t h i × l a n d f o r m   a r e a i
(2)
linear landform erosion = i = 1 n a v g . e r o s i o n   d e p t h i × l a n d f o r m   l e n g t h i × l a n d f o r m   w i d t h i
(3)
areal landform accumulation = i = 1 n a v g . a c c u m u l a t i o n i × l a n d f o r m   a r e a i
The total eroded volume was calculated from (1) and (2), and the total accumulated sediment from (3).
The percentage and areal distribution of these effects were also analyzed for the different events and compared to the land use and crop conditions in the agricultural areas [42]. Averaging the eroded volumes in the investigated areas (average erosion = total eroded volume/hilly surface area) provided the average erosion depth for each event. In the calculation, only the hilly areas (with slope > 5°) were considered, excluding valley floors and fluvial and coastal plains.
We exploited soil erosion values and rainfall data in each event (heuristic expert method according to Brunetti et al. [66]) in order to outline a correlation and the expected threshold for the trigger of heavy soil erosion features in the investigated area. Finally, the erosion rates/rainfall ratio were compared to short-term and long-term erosion rates known for the Mediterranean area in order to outline the impact of heavy soil erosion on the clayey and sandy Apennine piedmont and coastal hilly landscape.

4. Results

The results of the rainfall distribution analysis and post-event investigations are presented for the 2007, 2011, and 2012 events. For each event, only the most significant rainfall graphs are presented as well as the mapping, features, and distribution of the geomorphological effects.

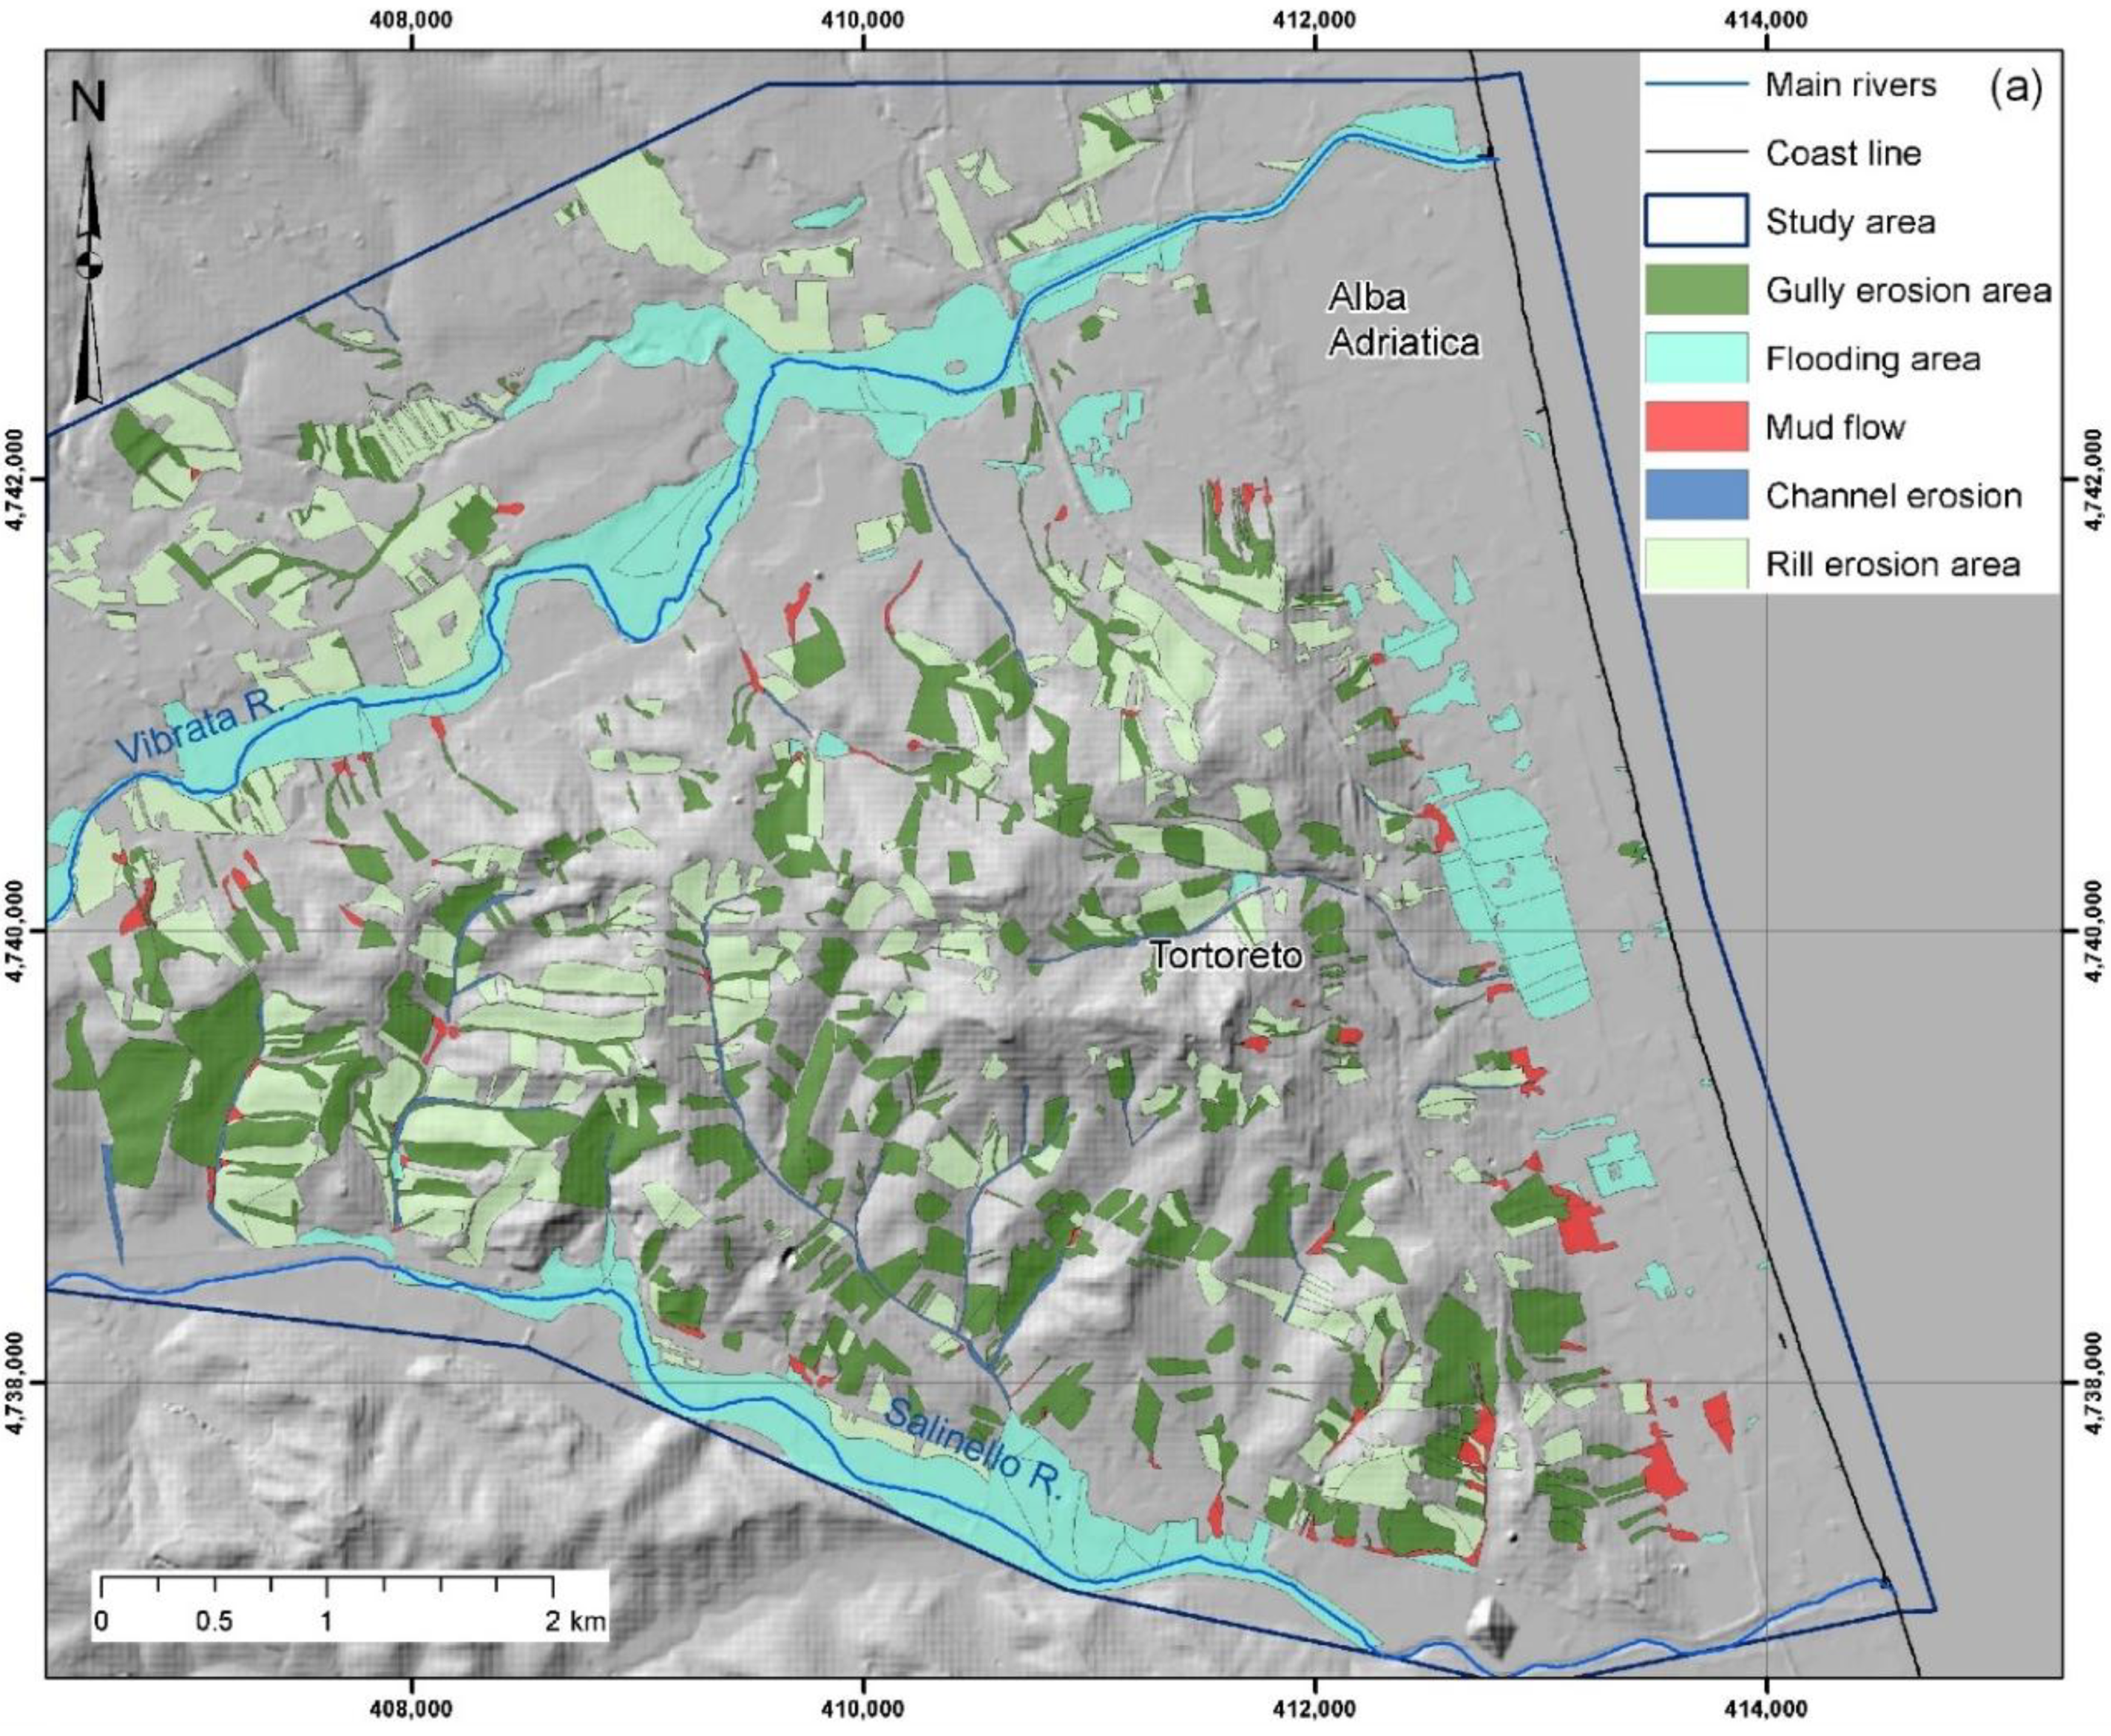
4.1. Rainfall Event of 6–7 October 2007

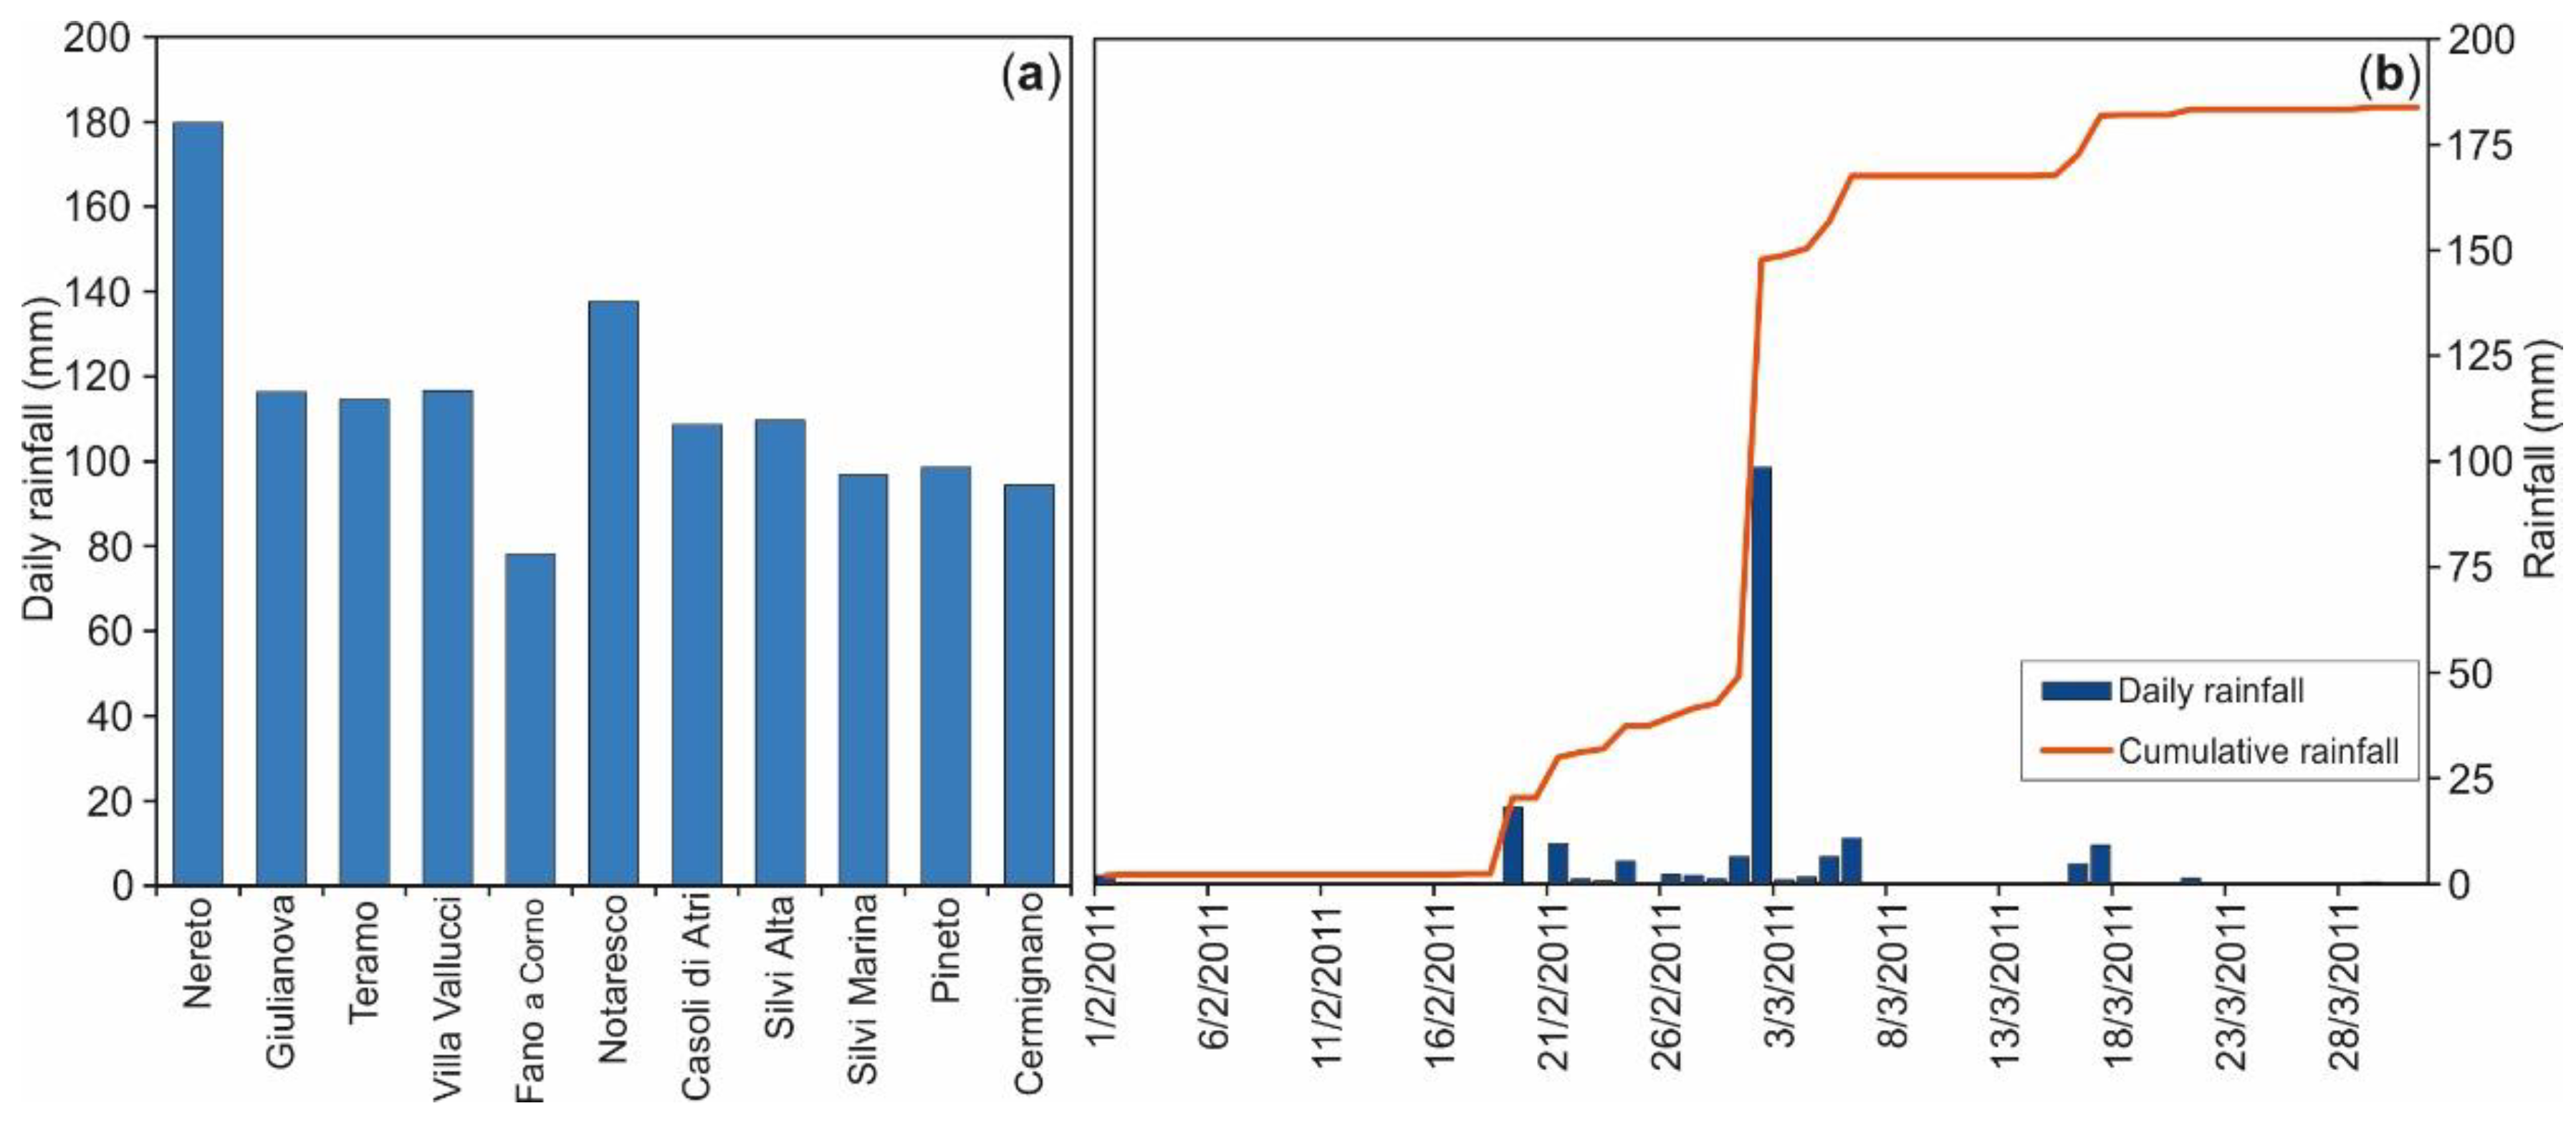
4.1.1. Rainfall Amount and Duration

The rainfall event occurred from about 20:00 to 21:00 on October 6 to about 11:00 to 12:00 on 7 October 2007, for a total duration of some 14–16 h. The cumulative rainfall was from 60–80 mm in the coastal area to >200 mm in the hilly area (205 mm, Nereto station; Figure 7a). The intensity was from moderate to high, with values ranging from 10 mm/h in the coastal area to 40 mm/h in the hilly area (Nereto station; Figure 7a). The daily rainfall was comparable to the cumulative for the event (~100 mm up to a maximum of 210 mm, Tortoreto and Nereto stations, Figure 7b and Figure 8). Along the coast, the recorded daily precipitation was around 60–80 mm (Figure 7b). Moreover, this event occurred after a fairly dry period, with very low September rainfall (<20 mm; Figure 8).
In summary, the Tortoreto 2007 event had high intensity (10–40 mm/h, up to >200 mm/day) and high cumulative rainfall (up to 210 mm) and occurring after >1 month of very low rainfall.

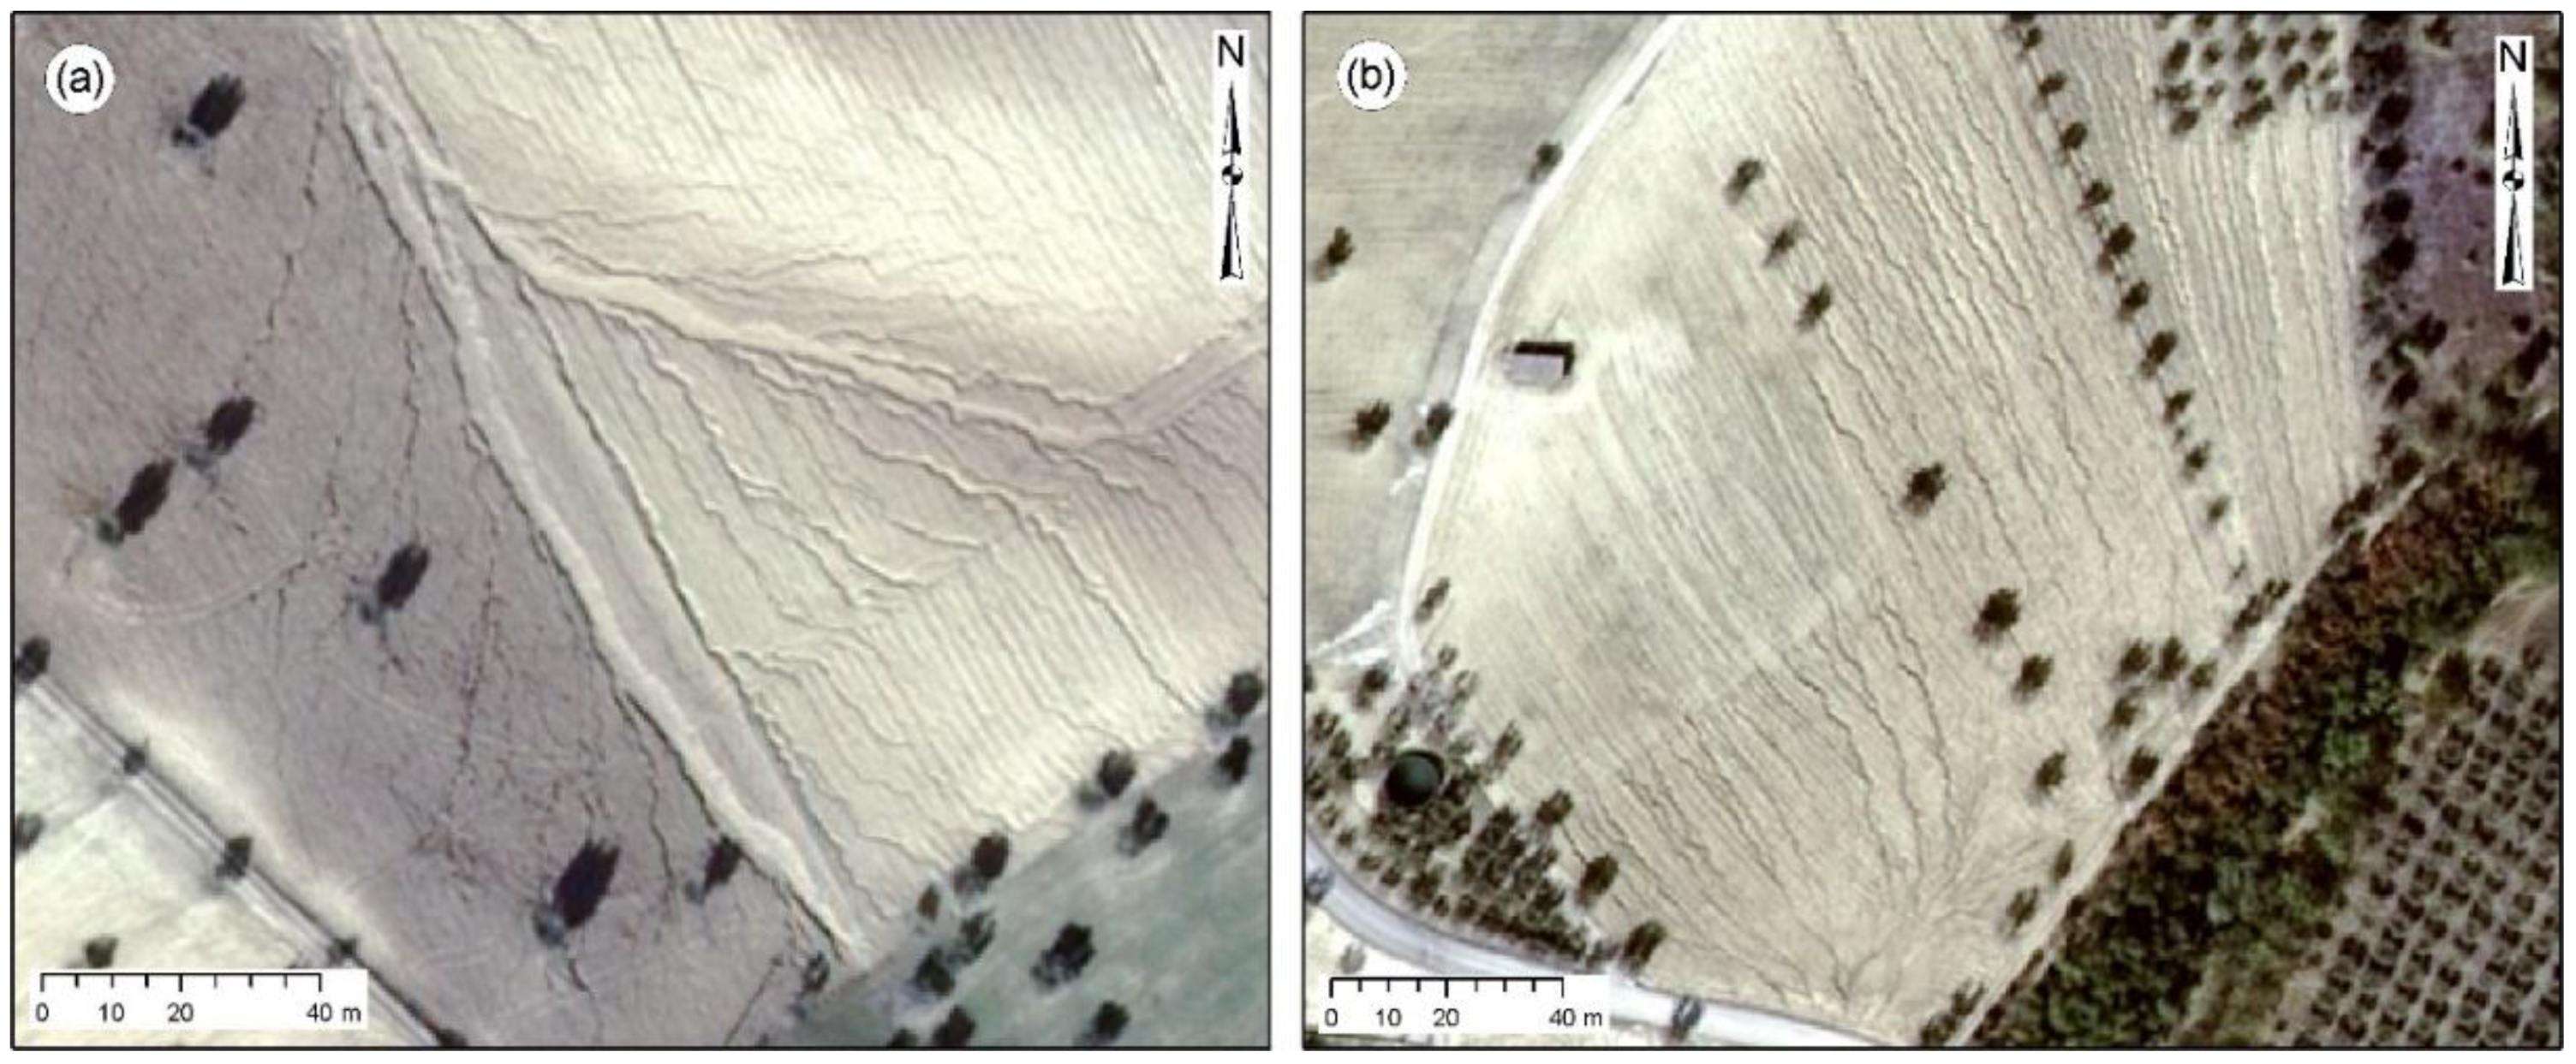
4.1.2. Geomorphological Effects

This event induced heavy soil erosion processes on the slopes (sheet, rill, and gully erosion), rapid mud flows at the bases of slopes and minor drainage basins, and flooding within the main river and coastal plains, mostly at the outlets of minor tributary catchments (Figure 9 and Figure 10). On the downstream side, along the urbanized area and the coastal plain, large volumes of sediment were deposited on roads, at the stream outlet, and along paleovalleys (covered with urban areas). This induced serious problems at the circulation and also affected the safety of the population.
Hilly catchments and slopes were affected by gully erosion (4.36 km2, 10.0% of the investigated area; Figure 9 and Figure 10) and sheet-rill erosion (4.84 km2, 11.1% of the investigated area; Figure 9 and Figure 10). The low gradient slopes and ridges with vineyards and olive groves, or, in general, those not plowed, were mostly affected by moderate sheet-rill erosion. Rill features were observed as 1–5 cm deep and with 1–10 m spacing in these areas. The average erosion in the sheet-rill erosion areas was calculated to be as much as ~1 cm. The total calculated eroded volume was ~48,400 m3. The high gradient slopes, particularly where plowed in a downslope direction, were incised by gullies (Figure 9). Gullies were measured mostly from 20 cm up to ~100 cm deep and 40–200 cm wide, usually spaced 4–8 m apart. The average erosion in the gully erosion area was calculated to reach ~14 cm. The total eroded volume was calculated as ~610,900 m2. Along the main channels of the tributary catchments, channel incision occurred (channels up to 2 m deep and 3–4 m wide). The area affected was 0.23 km2 and the average depth was ~100 cm. The total eroded volume was calculated as ~228,400 m3.
Mud flows were the result of heavy soil erosion on the slopes, inducing the mobilization of huge sediment volumes of clay-silt and minor volumes of sand from the eluvial and colluvial cover. Extensive mud and water flooding affected both coastal plains, coming more from the small catchments than from the main rivers (Figure 10). In the lower part of the slopes and at the outlets of the catchments, mud flows were very common (total area of ~0.37 km2, ~0.9% of the investigated area), showing mud accumulated thickness ranging from 50 to 200 cm. The total estimated sediment volume was 250,900 m3. Mud-rich flooding areas occurred at the bases of the slopes, along the channels of tributary catchments, and at the outlets of catchments to the fluvial or coastal plains (~3.97 km2, ~9.1% of the investigated area); accumulated mud was 0–10 cm thick, for a total estimated volume of 153,000 m3.

4.2. Rainfall Event of 1–2 March 2011

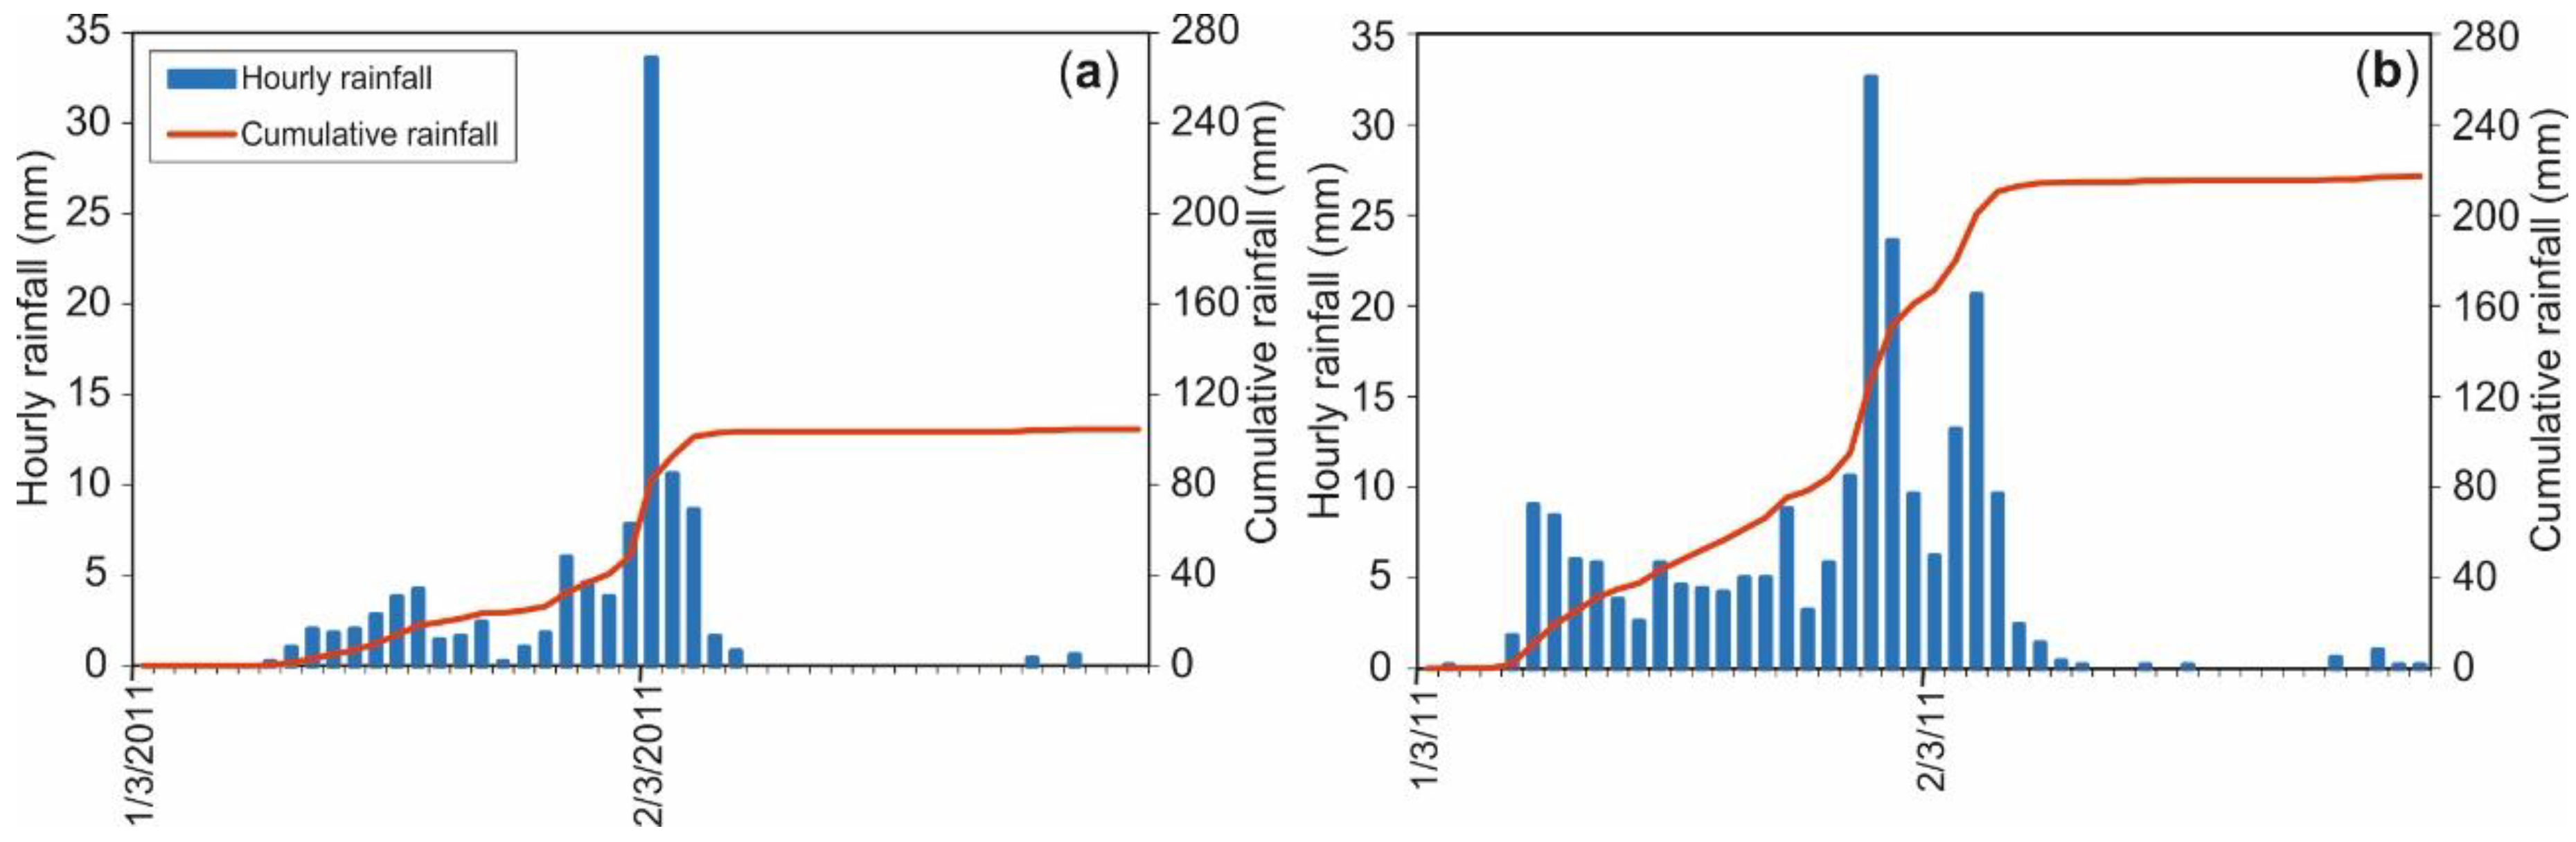
4.2.1. Rainfall Amount and Duration

The rainfall event occurred from about 02:00 on 1 March to 02:00 on 2 March 2011, for a total duration of some 22–26 h. The cumulative rainfall was 100–130 mm at most of the stations (e.g., Pineto station; Figure 11a), up to a maximum of 211 mm in the hilly area (Nereto station; Figure 11b). The rainfall intensity was around 15–20 mm/h and up to 35 mm/h (e.g., Pineto and Nereto stations; Figure 11). The daily rainfall was ~80–120 mm/day in the entire hilly area, up to a maximum of 180 mm (Nereto station; Figure 12a). Moreover, this event occurred after a moderately humid winter period (~50 mm in a 10-day time span before the event, Figure 12b).
In summary, the 2011 event affected a regional area (Pineto 2011 and Salinello 2011) for a moderately short duration (22–26 h) with high intensity (15–35 mm/h, up to >180 mm/day) and high cumulative rainfall (up to 211 mm) and after ~10 days of moderate antecedent rainfall.

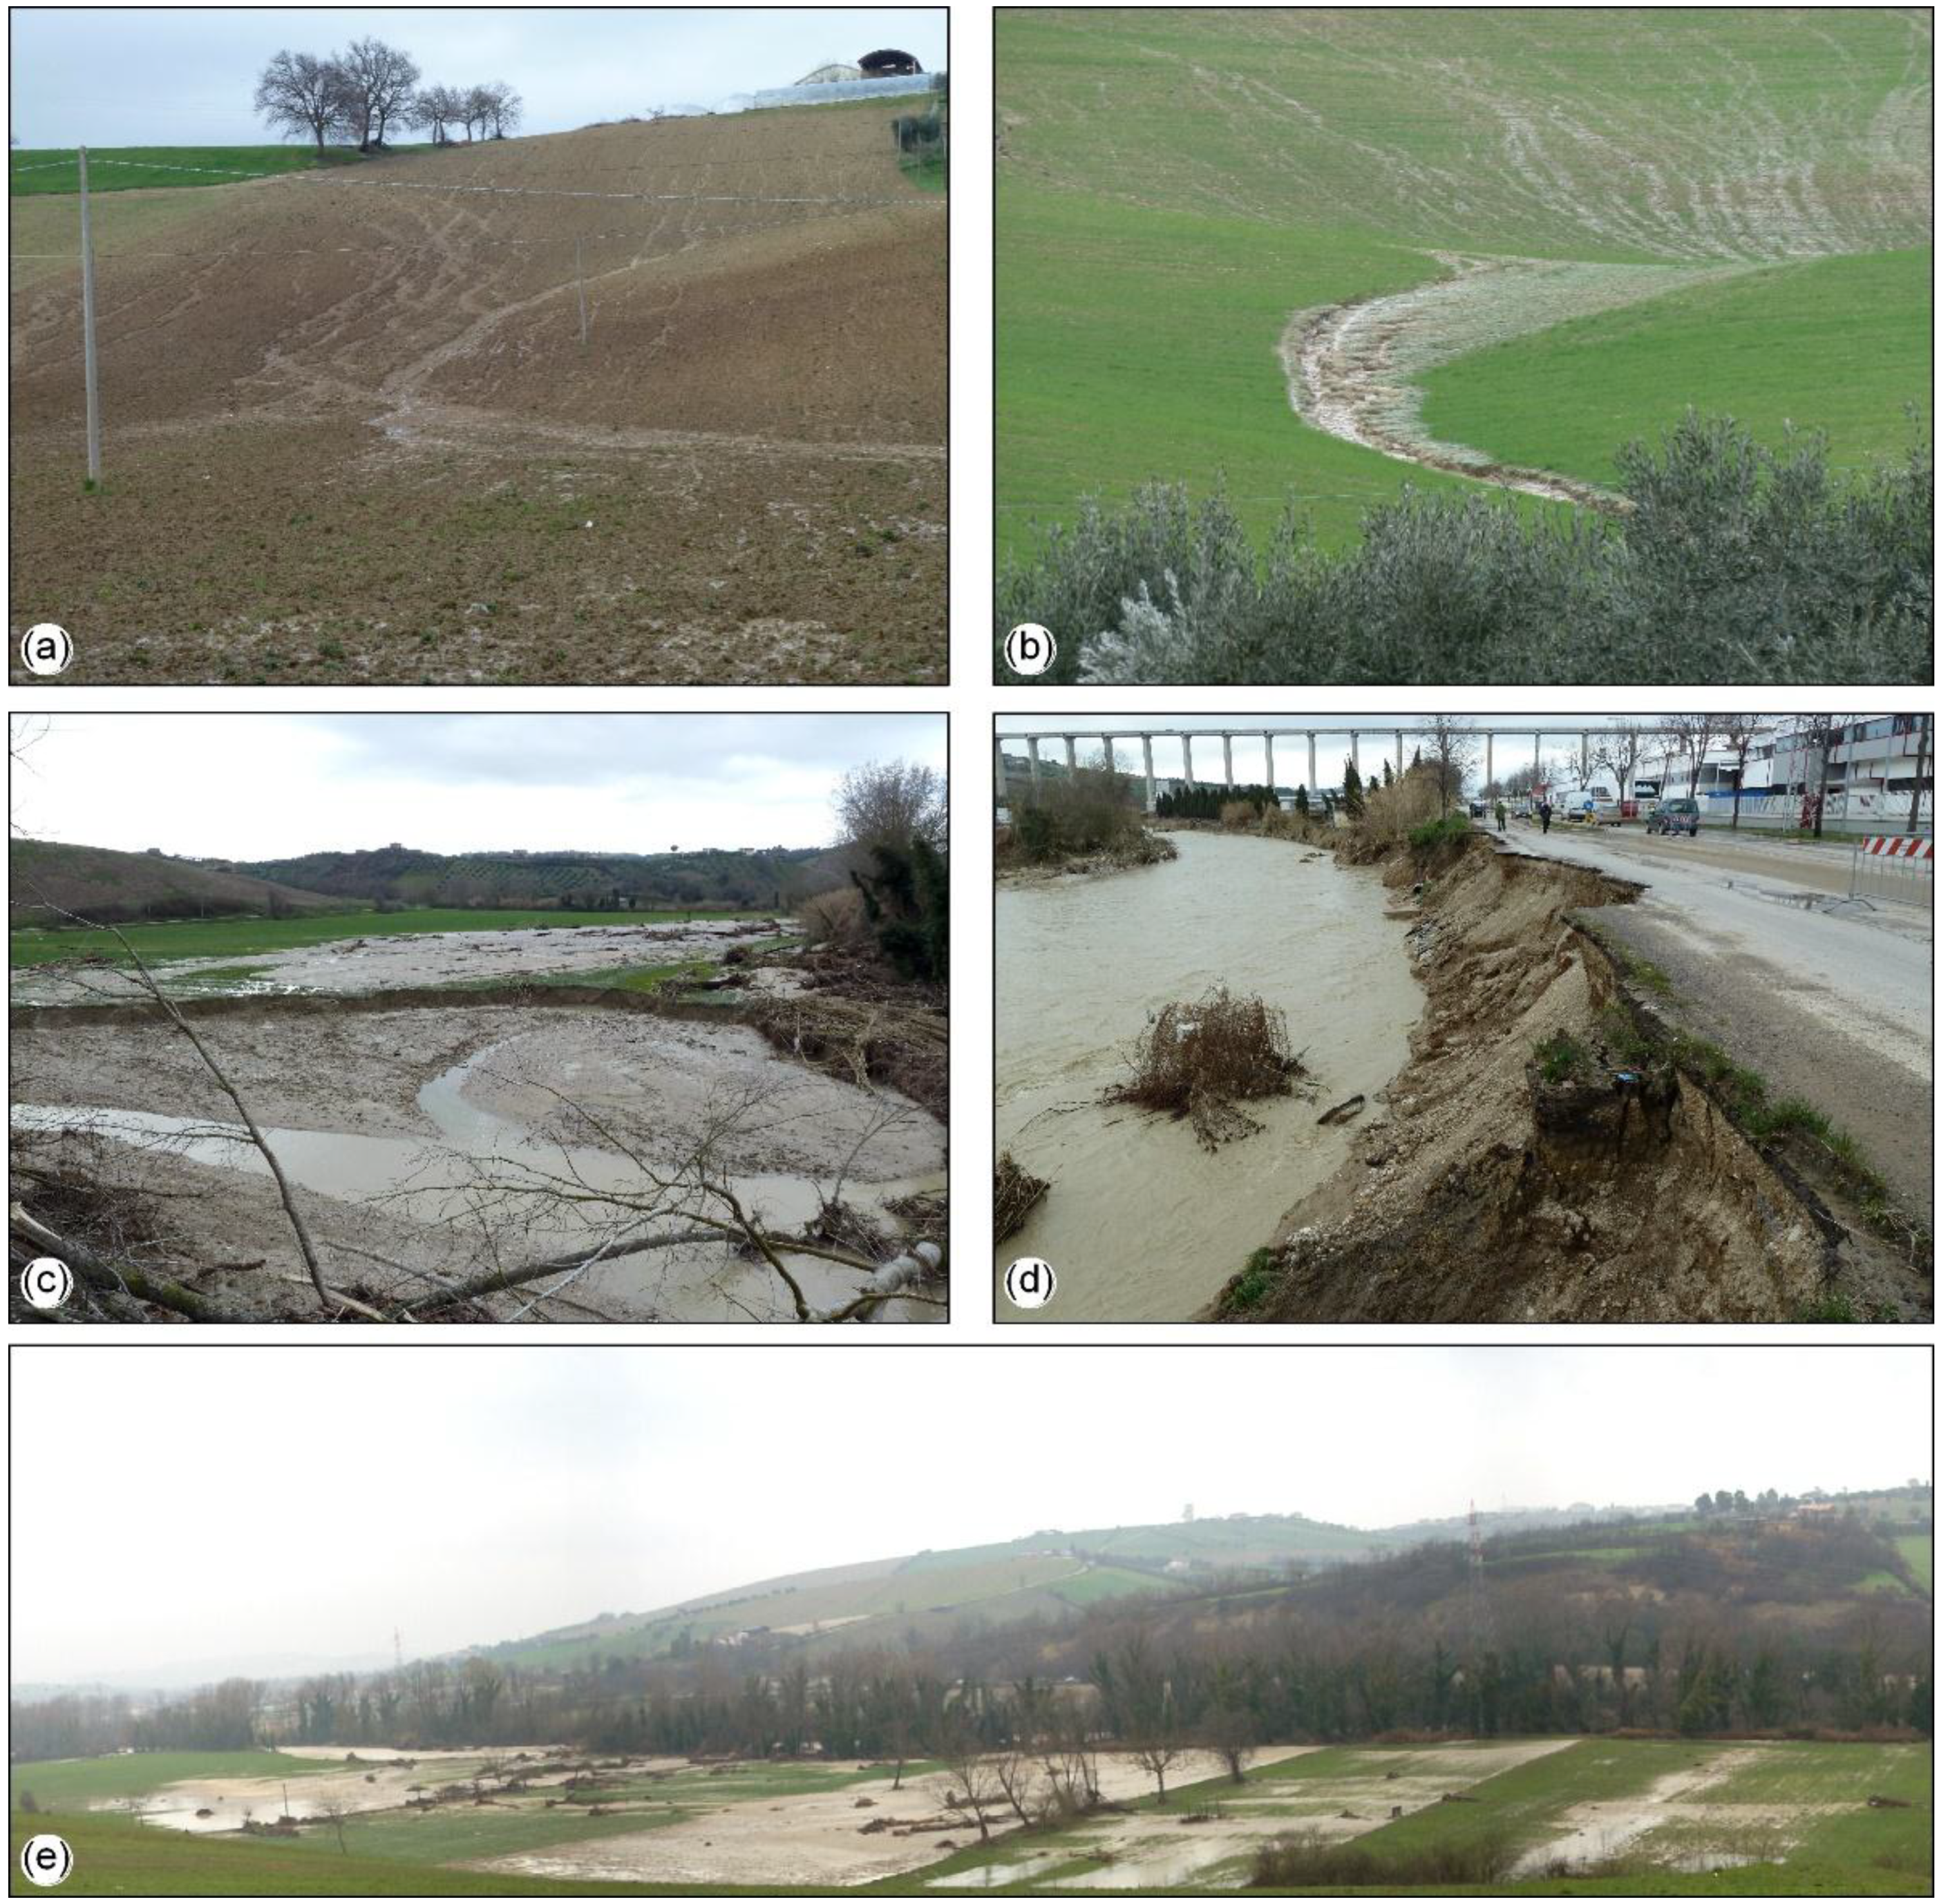
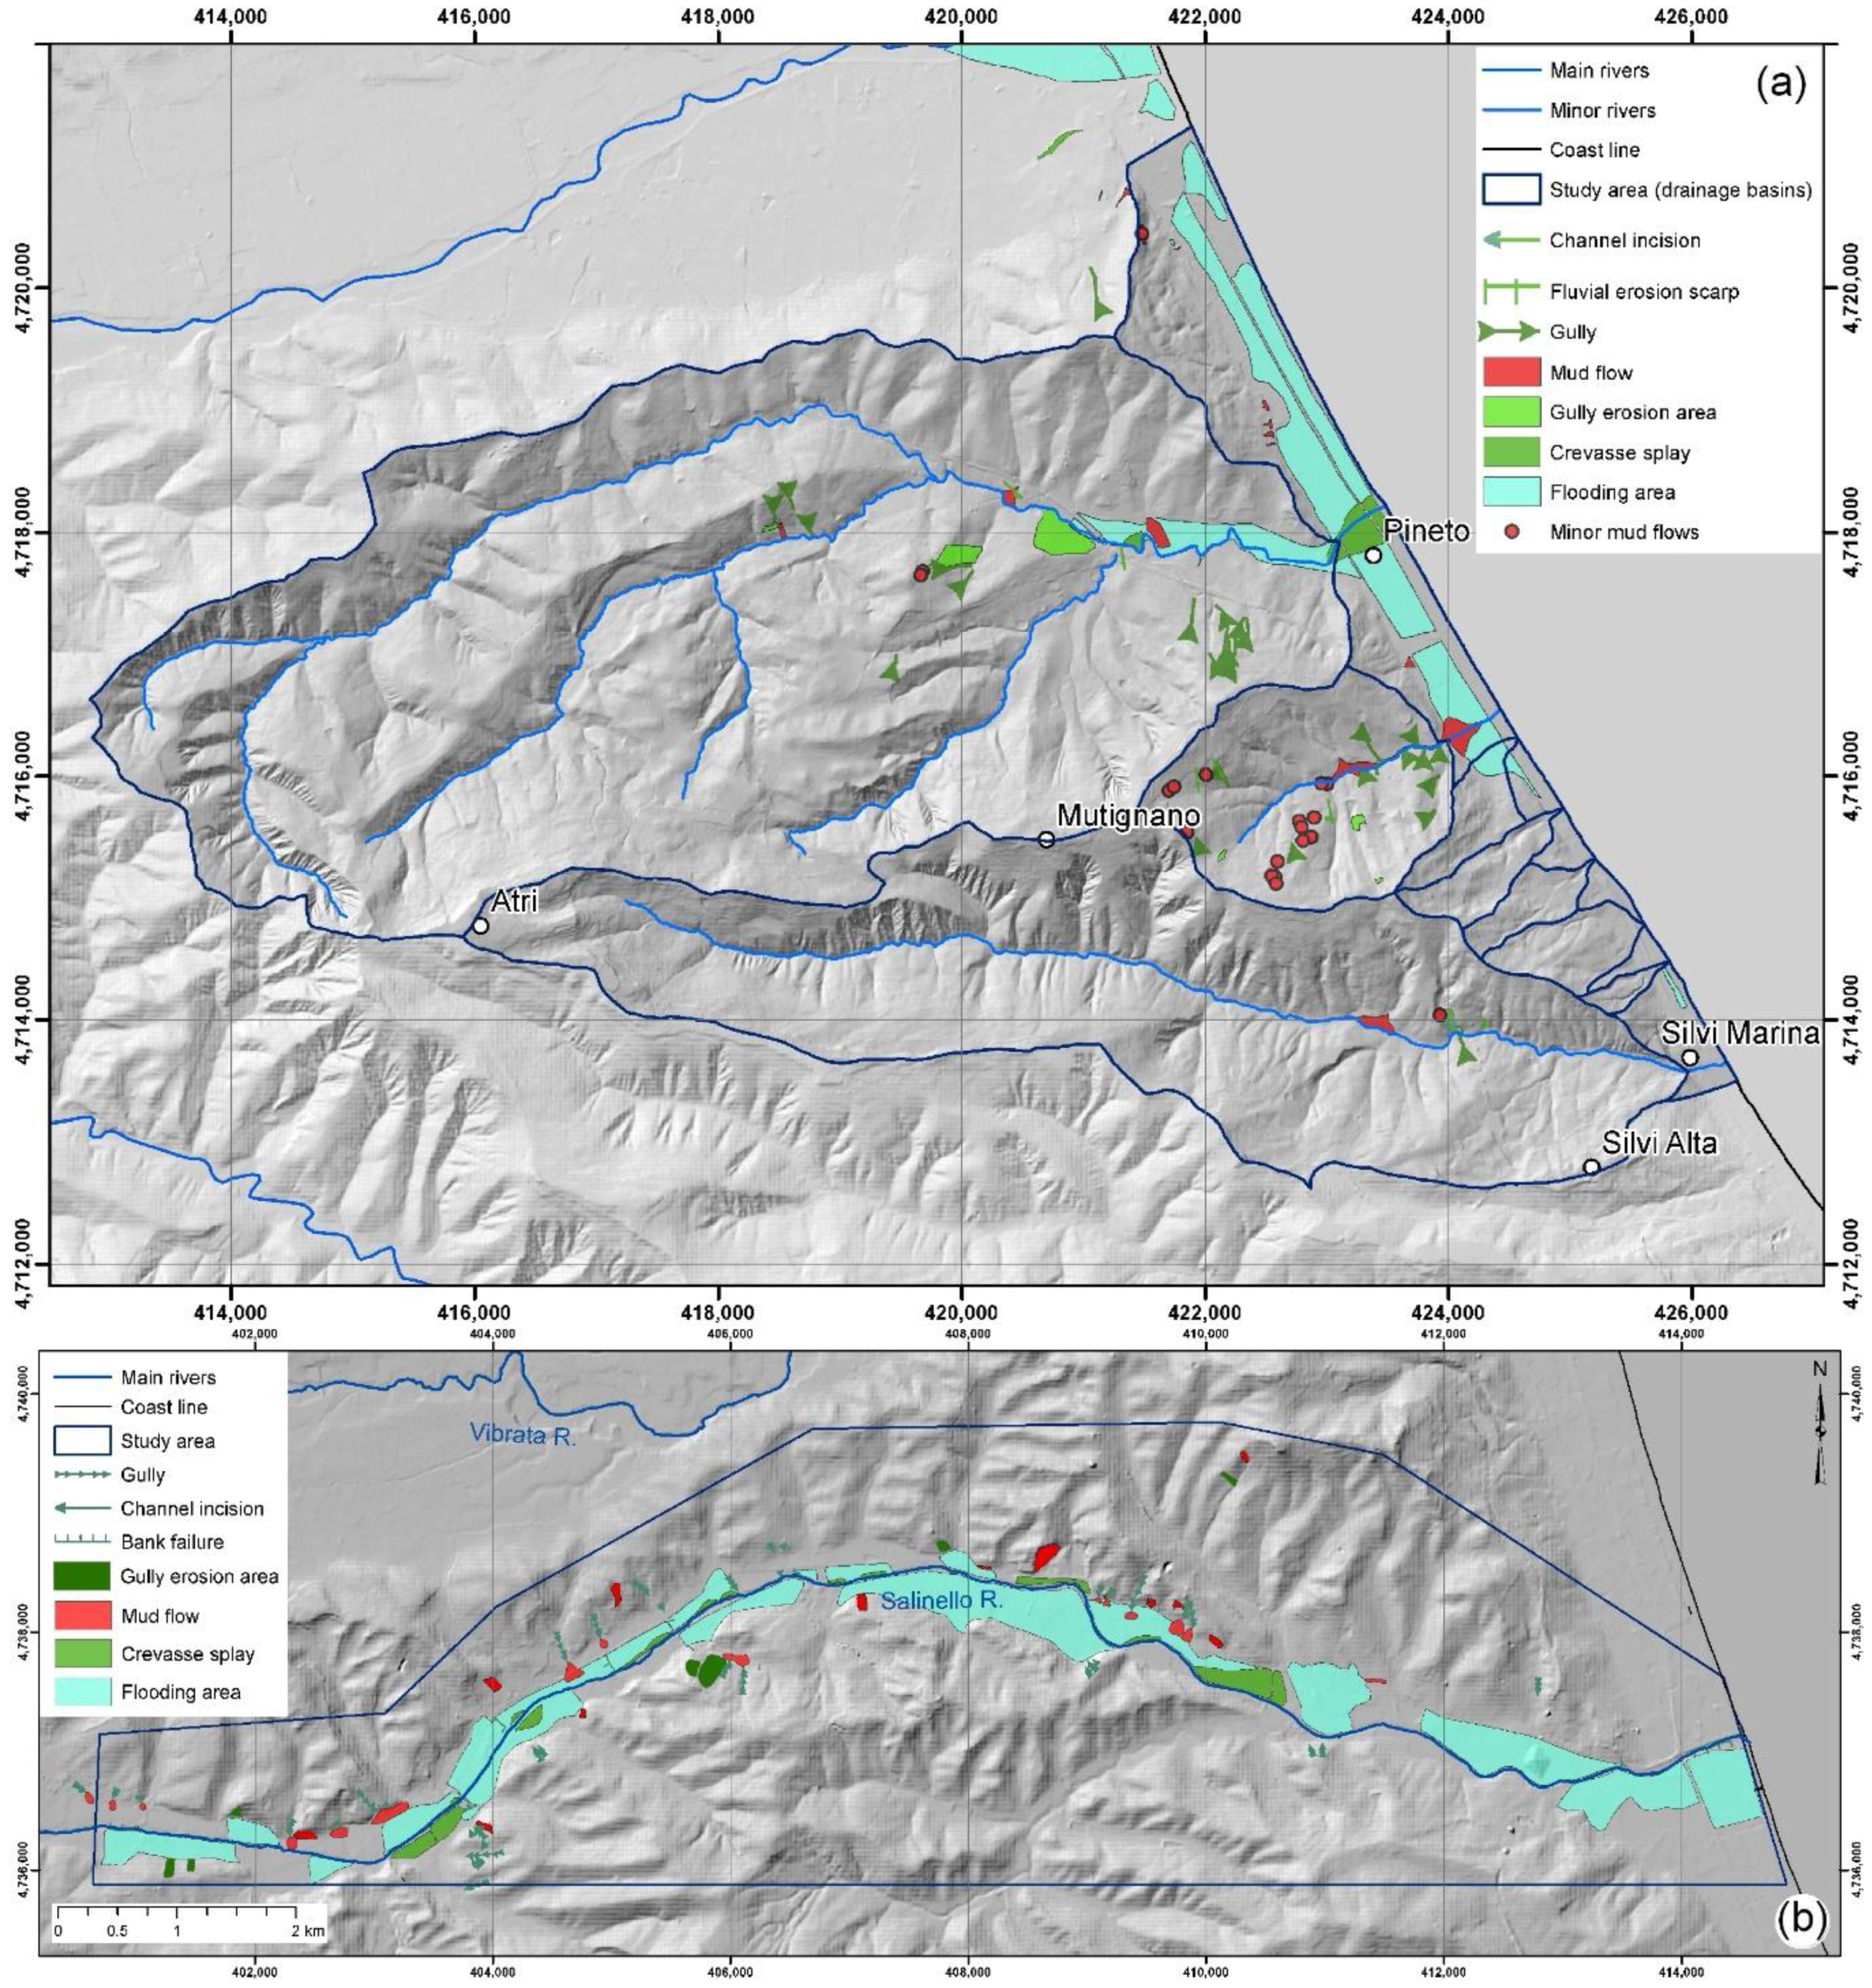
4.2.3. Geomorphological Effects

The geomorphological analysis performed after the event outlined soil erosion due to sheet and rill erosion, gully erosion, and sedimentation as mud flows and flooding (Figure 13), similar to the 2007 event but with a different distribution and minor total extent. In the hilly catchments and slopes of the Pineto-Atri area (Figure 13a,b and Figure 14a), soil erosion occurred as gully areas, with gullies 20–50 cm deep and spaced 3–20 m (over an area of 1.13 km2, 1.9% of the investigated area, Figure 14); the total eroded volume was 133,000 m3. Major gullies up to 1 m deep and 2 m wide (total gully length 10.2 km; Table 1a, Figure 14a) occurred along the channels of tributary catchments and slope undulations, in some cases enlarging natural or manmade notches or plowing incisions (Figure 13b); the total estimated volume was 8900 m3. At the bases of the slopes within the main valleys and along the coastal slope rapid mud flows occurred from 20 cm to 150 cm thick (total area of 0.26 km2, 0.4% of the investigated area; Table 1a, Figure 14a); the estimated accumulated volume was 60,400 m3. Along the main rivers and at the outlet to the coastal plain, crevasse splays occurred, with a sediment thickness of 10–50 cm (total area 0.16 km2, 0.3% of the area; estimated volume 20,000 m3), as well as flooding areas, with mud 0–5 cm thick (total area 2.01 km2, 3.3% of the area; estimated volume 26,100 m3).
In the Salinello River valley (Figure 13c,d,e and Figure 14b), limited soil erosion occurred on the moderately vegetated slopes, while most of the effects were related to flooding along the main river. Heavy mud and water flooding were the prevailing effects of this event, affecting the coastal plains as well as the river plain almost seamlessly. Extensive overbank flooding along the rivers induced the formation of wide and long crevasse splays on the floodplain (Figure 13c–e). Soil erosion occurred in terms of areas affected by sheet-rill erosion areas (Table 1b, Figure 14b), with an average erosion of 5–10 cm (0.10 km2, 0.2% of the area; estimated volume 5700 m3), with gullies 20–100 cm deep and 0.5–2.0 m wide (for a total length of ~4.5 km; estimated eroded volume 4400 m3). Along the main channel of the Salinello River bank, failure occurred (for a total length of ~2.0 km; Figure 13c,d), inducing severe damage to valley roads. At the bases of the slopes, mud flows were formed (Table 1b, Figure 14b) over a 0.15 km2 area, as thick as 50–150 cm (total estimated volume 65,500 m3). Flooding areas occurred (Table 1b, Figure 14b) over 3.62 km2 (8.3% of the investigated area), accumulating 0–5 cm of mud (estimated volume 46,700 m3). All along the flooding areas, crevasse splays formed (Figure 13e) over 0.32 km2 (0.7% of the area), from 20 cm to 40 cm thick (estimated volume 83,700 m3).

4.3. Rainfall Event of 5–6 and 13–14 September 2012

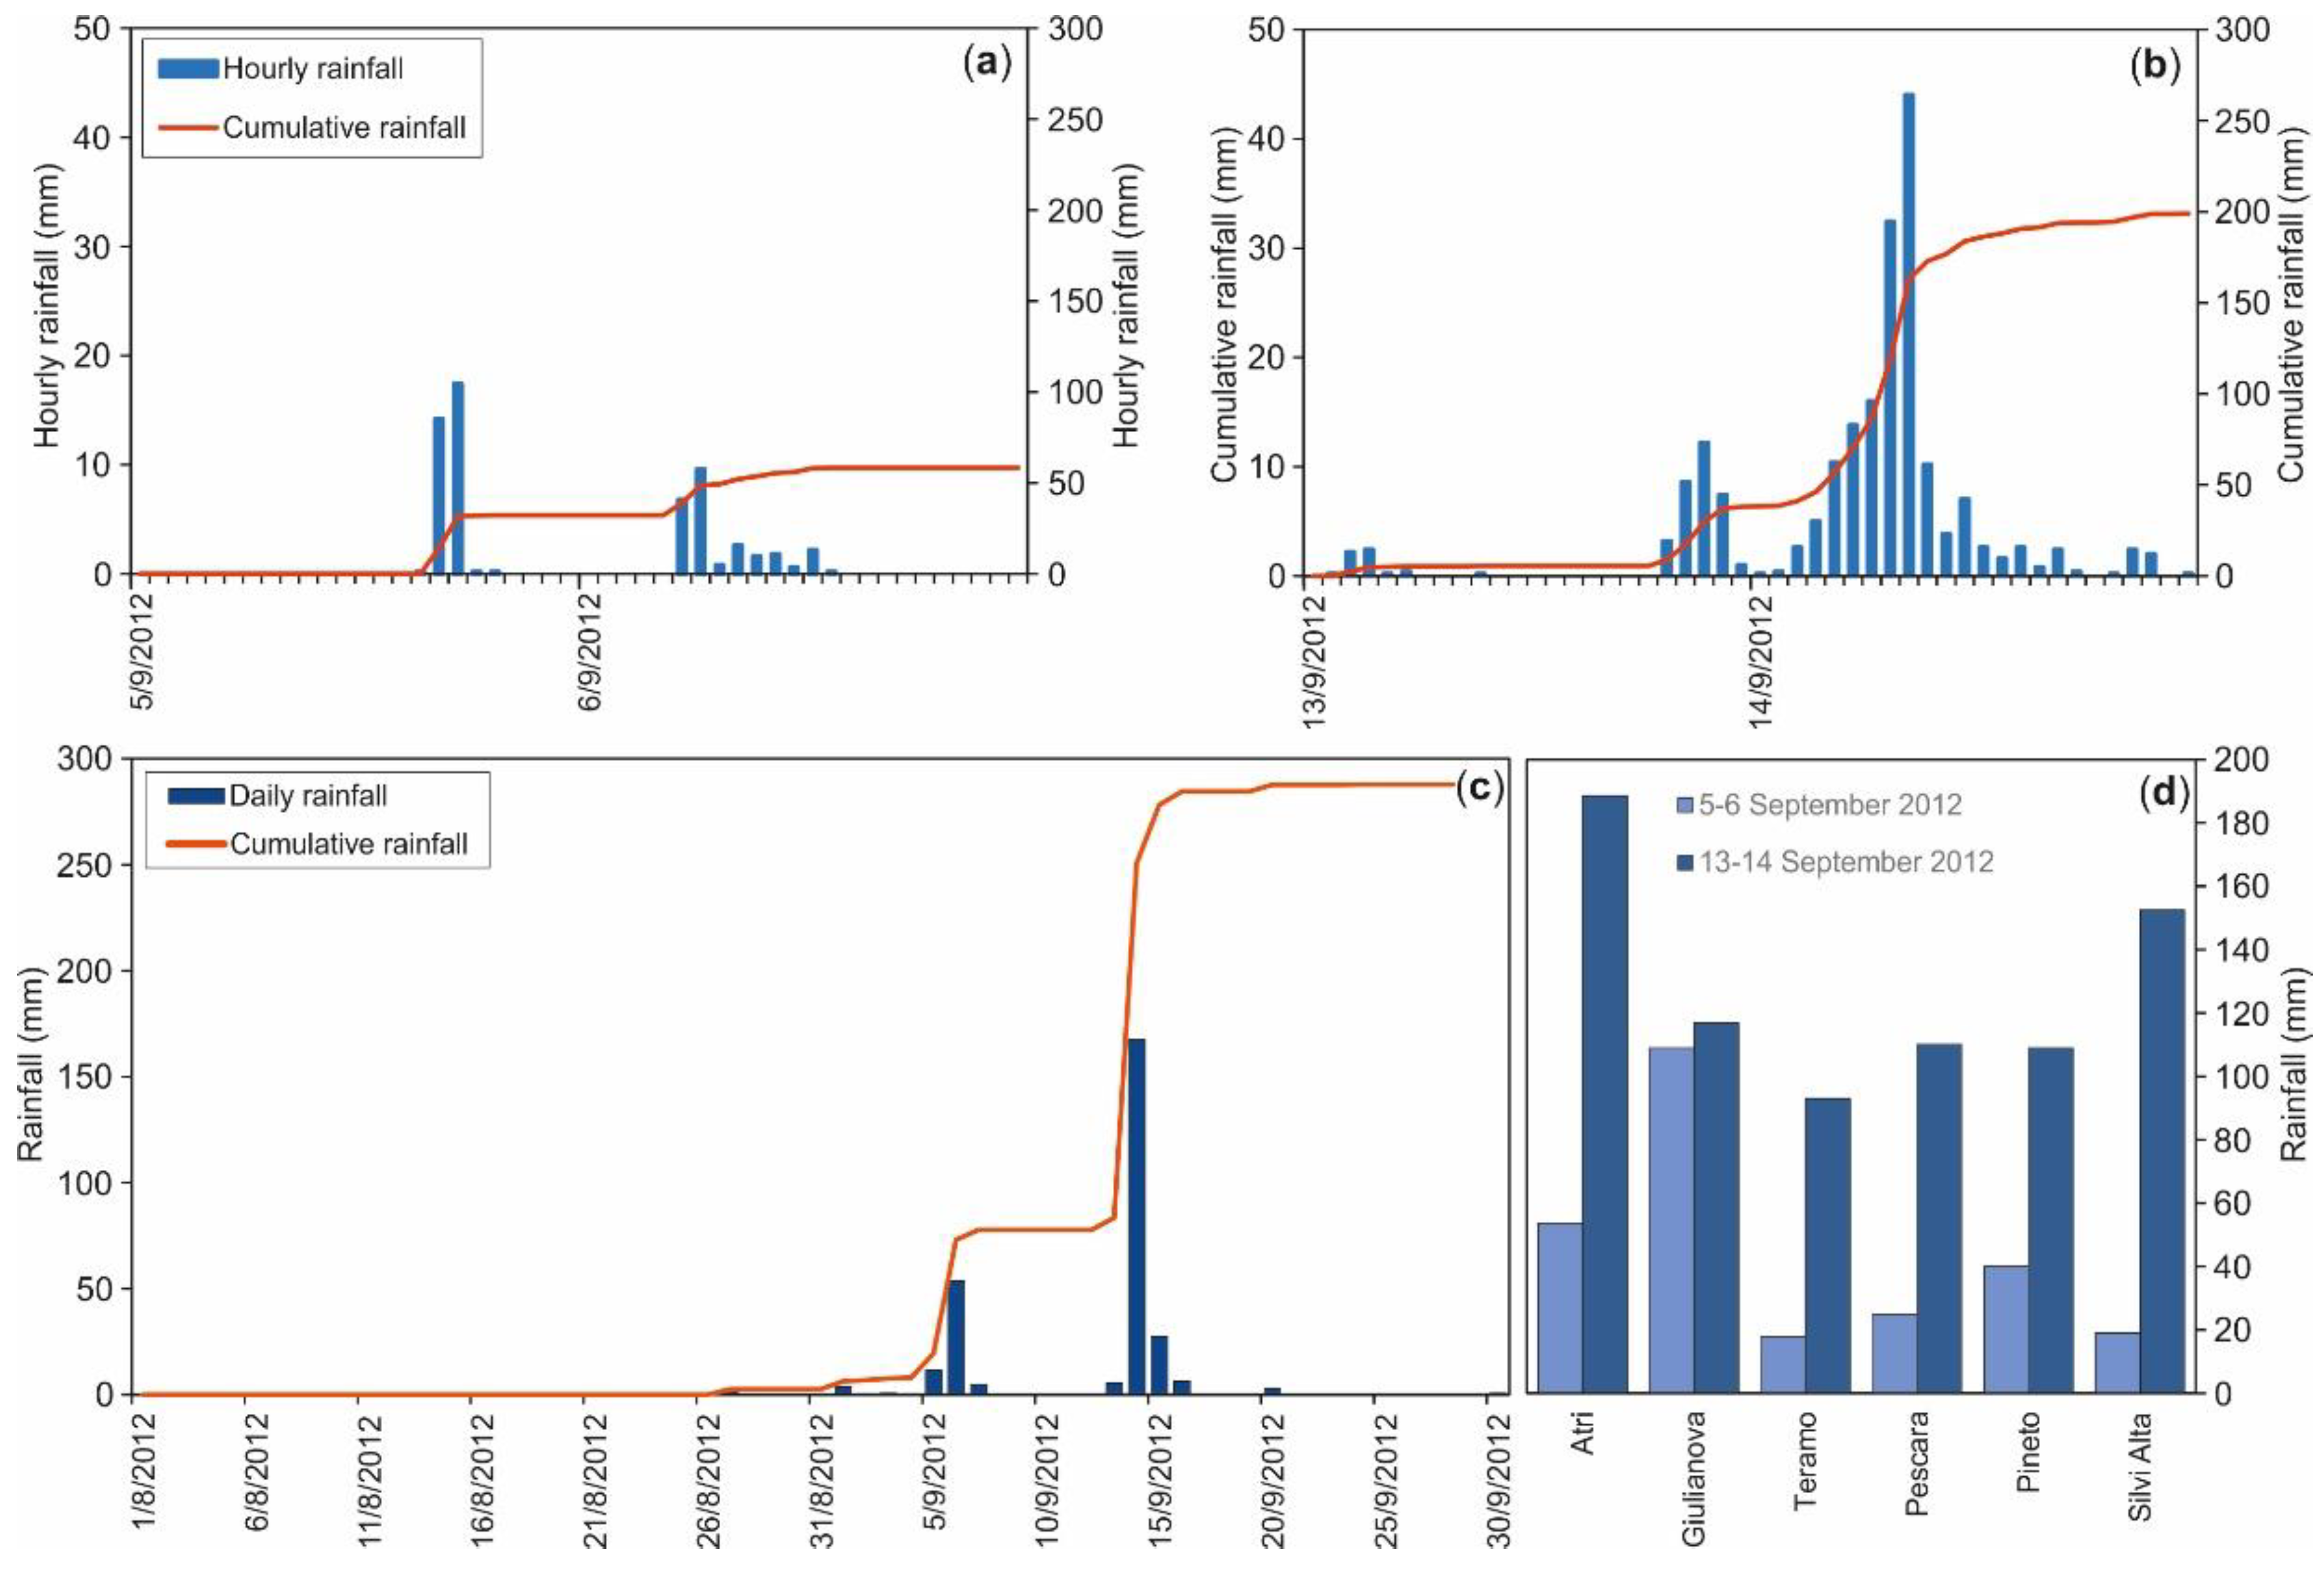
4.3.1. Rainfall Amount and Duration

This event is the result of two rainfall periods separated by a 7-day dry period and has to be considered as two separated events (according to Peruccacci et al. and Brunetti et al. [7,66]). The first rainfall event occurred from about 17:00 on 5 September to 11:00 on 6 September 2012, for a total duration of some ~18 h, with peaks in the evening and the morning; the second event occurred from about 18:00 on 13 September to 18:00 on 14 September 2012, for a total duration of ~24 h. The cumulative rainfall was ~30–110 mm for the first event and ~80–190 mm for the second event (Figure 15a,b). The recorded rainfall intensity was 10 to >60 mm/h for the first event and ~15–45 mm/h for the second event (Figure 15a,b). The daily rainfall was ~60–110 mm/day for the first event and up to a maximum of 190 mm for the second event (Figure 15c,d). Moreover, these events occurred after more than a month of completely dry conditions (Figure 15c).
In summary, the Pineto 2012 event was a double event, 18 and 24 h long, and affected and coastal hilly area within a 1-week interval, with high intensity (15–65 mm/h, up to >190 mm/day) and combined cumulative rainfall up to 280 mm, after a >1-month completely dry period.

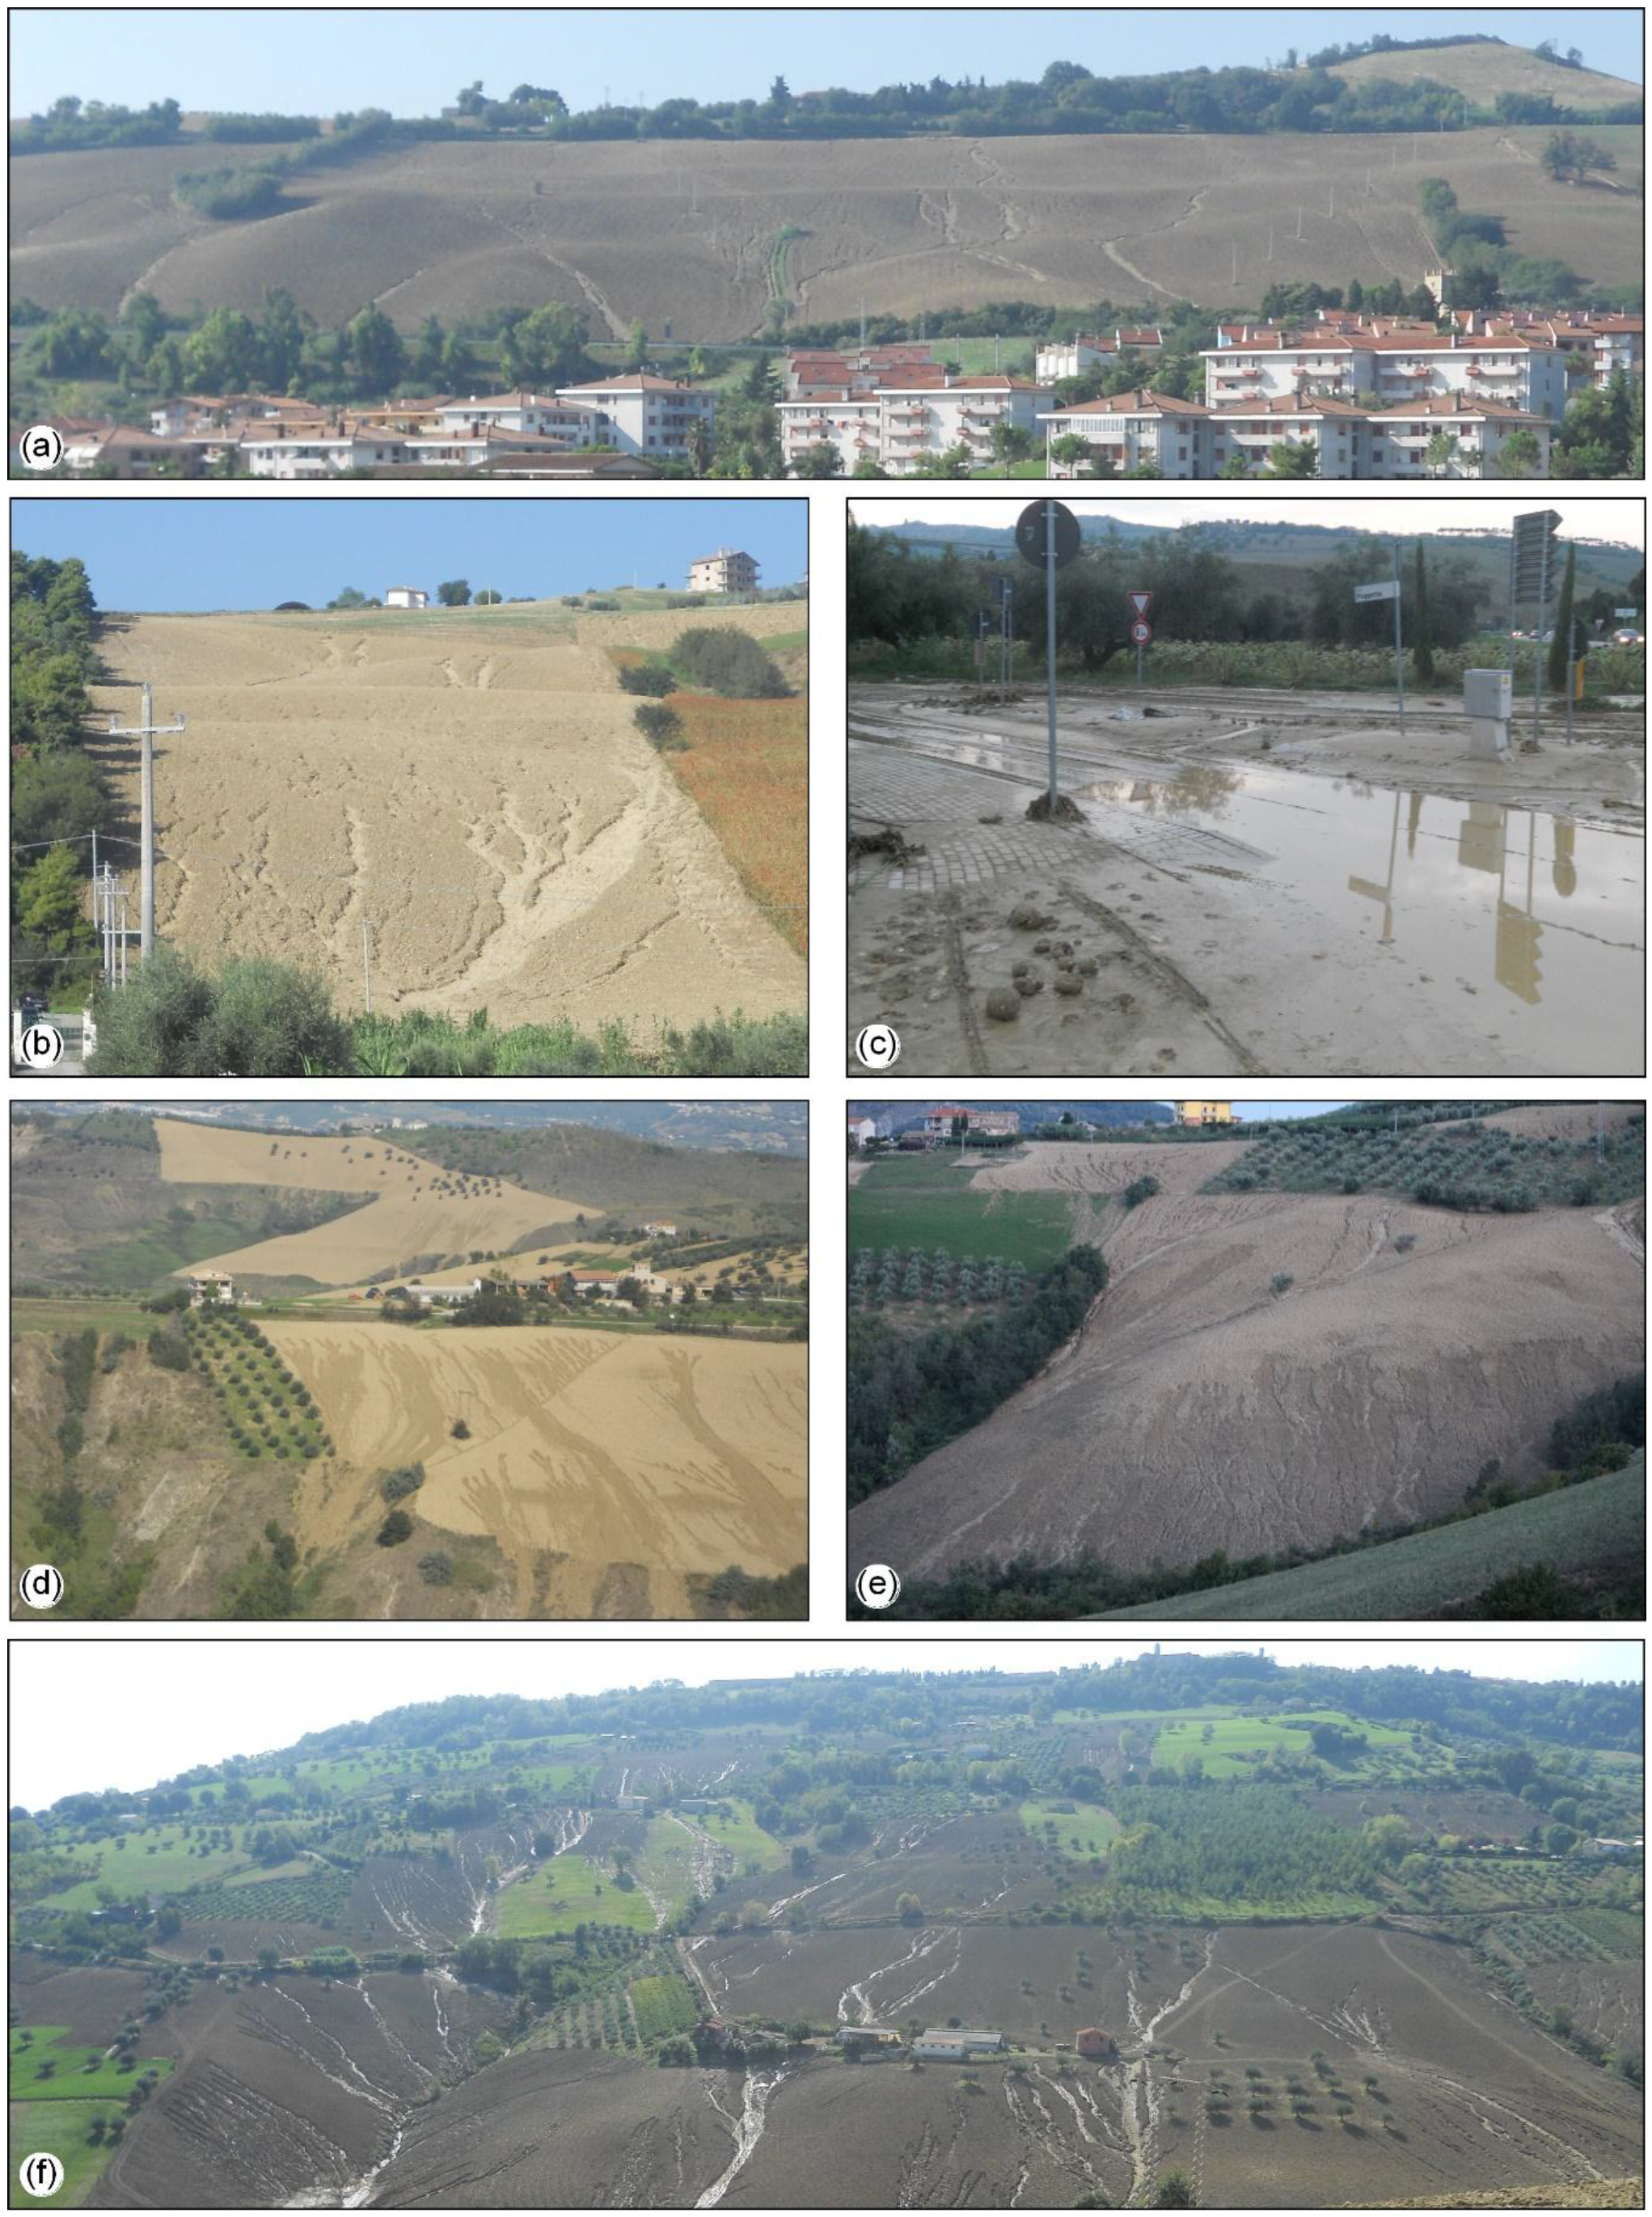
4.3.2. Geomorphological Effects

The geomorphological analysis performed after both the first and second event outlined a large distribution of soil erosion features combined with mud flows, flooding areas, and minor crevasse splays (Figure 16).
On 5–6 September (Figure 17a, Table 2a), minor effects occurred in terms of soil erosion features, such as gully areas with 10–30 cm average incision (0.23 km2, 0.4% of the area; estimated volume 33,900 m3) and gullies 20–40 cm deep and 50–150 cm wide (total length 8.3 km; estimated volume 2700 m3; Figure 16a,b); sedimentation features included mud flows 25–50 cm thick (over 0.1 km2, 0.2% of the area; estimated volume 30,900 m3), flooding areas (Figure 16c) with 0–3 cm thick mud (over 0.30 km2, 0.5% of the area; estimated volume 6300 m3), and minor crevasse splays.
On 13–14 September (Figure 17b, Table 2b), further heavy soil erosion occurred, mostly due to gully areas with an average 20–40 cm incision (over 1.18 km2, 2.0% of the area; estimated volume 236,500 m3) and major gullies 20–70 cm deep and 1–2 m wide (total length 48.8 km; estimated volume 23,300 m3; Figure 16 d–f). Sheet-rill erosion areas were observed with a 2–5 cm incision (over 0.92 km2, 1.5% of the area; estimated volume 27,600 m3). In the lower part of the slopes and at the junctions of minor tributaries to main streams, mud flows occurred up to 150 cm thick (over 0.18 km2, 0.3% of the area; estimated volume 88,000 m3). Along the main fluvial plain and the coastal plain, flooding areas occurred with 0–3 cm of accumulated mud (over 0.36 km2, 0.59% of the area; estimated volume ~5000 m3), as well as some local crevasse splay 10–30 cm thick (over 0.03 km2, 0.1% of the area; estimated volume 5900 m3).

5. Discussion

A direct investigation (field mapping and air-photo) analysis of the geomorphological effects induced by three heavy rainfall events in the NE Abruzzo hilly coastal area provided the mapping of >2000 soil erosion and accumulation features. The amount of soil erosion was estimated along the slopes and in the hilly areas for the different types of landforms in all of the investigated events (Table 3). The distribution of mud flows, flooding areas, and crevasse splay outlined the estimated volume of sediment accumulated at the bases of slopes, at the outlets of minor catchments, and on the river and coastal plains (Table 4).
For the 2007 event, the estimated soil erosion volume on the hillslopes and catchments was about 887,700 m3 (mostly due to gully erosion; Table 3). The average overall erosion calculated in the hilly area (65% of the investigated area) was ~3.08 cm in this single event. At the base of the slopes, in the valley floors, and in the coastal and river plains, mud flows and floods accumulated an estimated 403,800 m3 volume of sediment. This means that more than half of the eroded soil (55%) was removed from the hilly system to the sea. For the 2011 event in the Pineto-Atri area, the estimated amount of soil erosion was about 141,900 m3 (mostly due to gully erosion; Table 3). The average overall erosion calculated in the slopes of the hilly area (~85% of the investigated area) was ~0.29 cm. At the bases of slopes, in the valley floors, and in the coastal and river plains, mud flows and floods accumulated an estimated 106,500 m3 volume of sediment. Again, 25% of the eroded soil was removed from the hilly system to the sea. In the Salinello River area, the estimated eroded volume was very low at 12,100 m3 (overall erosion estimated in the hilly area <0.01 cm), while the sedimented volume was as great as 196,000 m3 (mostly due to mud flows and crevasse splay; Table 3). This confirms that this case is in a different geomorphological framework (main river valley instead of coastal hilly area) and the main geomorphological effects were related to flooding in the main river (mostly coming from upstream and the main valley) and not to soil erosion in the hilly slopes. For the 2012 double event, the estimated amount of soil erosion (Table 3) was about 36,500 m3 on 5–6 September (Pineto 2012-1) and 289,900 m3 on 13–14 September (Pineto 2012-2). The average overall erosion in the slopes of the hilly Pineto-Atri area (~85% of the investigated area) was ~0.08 (5–6 September) and ~0.60 cm (13–14 September). At the bases of slopes, in the valley floors, and in the coastal and river plains, mud flows and floods accumulated an estimated amount of about 37,500 m3 of sediment (5–6 September, roughly corresponding to the eroded volume) and 98,900 m3 of sediment (13–14 September, about one-third of the eroded volume). Again, this means that 66% of the eroded soil was removed from the hilly system to the sea. Moreover, for all the events, considering that large part of the sediment was accumulated in urban/industrial areas and removed after the events, the actual soil loss was even higher.
The events were characterized by variable heaviness (i.e., cumulate rain and intensity) and different areas, but in comparable lithological-geomorphological settings (coastal clay–sand–conglomerate hills covered with eluvial–colluvial and landslide deposits), except for the Salinello River valley (major river valley and hillslopes). The main rainfall parameters of the events in the different areas (i.e., cumulative rainfall, which in this case roughly corresponds to daily rainfall, rainfall peak intensity, and rainfall duration) were compared to the soil erosion estimations (eroded volume, erosion averaged over the affected hilly slope areas, sediment volume, sediment loss) (Table 4). Despite encompassing a limited number of investigated events, rainfall data and soil erosion estimations were analyzed (Figure 18) in order to outline the controlling factors and possibly a triggering threshold for the heavy soil erosion features in this area. Considering the distribution of rainfall values, the strong influence on soil erosion of cumulative rainfall and the poor influence of maximum rainfall intensity are outlined in this case. More specifically, eroded volume vs., cumulative rainfall (Figure 18a), which roughly corresponds to daily rainfall for these events as well as average erosion vs. cumulative rainfall (Figure 18b), shows good correlation (the latter not depending on the size of the areas). Otherwise, average erosion vs. rainfall intensity (Figure 18c) shows a scattered distribution and poor control of the peak intensity in soil erosion for these events. Only the 2011 Salinello event is completely incomparable (2a in Figure 18), as expected, being in a different geomorphological framework (main river valley vs., coastal hilly area) and possibly due to the condition of slopes in terms of vegetation cover. The event occurred at the beginning of March, with the cultivated areas already covered by incipient vegetation, which prevented the slopes from undergoing heavy soil erosion. This is partially true also for the Pineto 2011 area (in terms of landform distribution), in which sheet-rill features did not form due to the vegetation cover of the slope, and only gully areas and major gullies incised the slopes.
Several studies outlined that the main parameters controlling the soil erosion are related to the interaction among rainfall parameters and lithology, orography, hydrography, land-use and vegetation [5,6,7,8,9,10]. In this case, considering the relatively homogeneous lithologic–geomorphological settings, we mainly outlined the role of land-use and vegetation cover (as mentioned above) and the control of rainfall parameters (i.e., cumulative rainfall) on the soil erosion.
We compared the average single-event erosion estimated in the investigated events (0.8–30.8 mm) with the short- and long-term erosion rates known in the literature (0.05–90 mm/year [67,68,69,70,71,72,73,74,75]; Table 5). The values resulting from this work are comparable to the highest short-term values known for badlands (10–30 mm/year) and landslides (30–90 mm/year) from direct measurements at local scale and in small catchments [29,39,41] and about one order of magnitude higher than the values known at basin scale (0.05–8 mm/year) obtained from indirect estimations [37,69,75] and the long-term erosion rates (0.06–15 mm/year) derived from trapped sediment calculations and morphotectonic reconstructions [41,67,68,69,70] (Table 5). Even if these values are related to different types of processes (episodic vs., continue processes), taking into account that they affect comparable lithologic, geomorphological, and climatic environments (or in some cases, the same area, 10 in Table 5), this comparison highlights that the impact of soil erosion on the landscape is largely underestimated, particularly in the long-term analysis, in respect to what is outlined by the recent heavy rainfall events.
Concerning the issue of the rainfall threshold for geomorphological effects of heavy rainfall events, which is widely debated in the literature ([43,70,71] and references therein), this work provides a local contribution that could be representative of a larger area. The rainfall thresholds for soil erosion are usually defined for short-term intensities (e.g., from 5.6 to 20 mm/h [70,71]). In this work, even after a few investigated cases, the average erosion vs. cumulative rainfall graph (Figure 18b) suggests a threshold for the triggering of heavy soil erosion features around 100–110 mm of cumulative rainfall in ~1-day events, according to the intersection of the correlation line with the x-axis (excluding the 2011 Salinello event, 2a; Figure 18). The hourly intensity threshold is less defined in this case (scattered distribution in Figure 18b) at roughly ~30–40 mm/h. These values are more meaningful for agricultural areas (e.g., arable lands, vineyards, olive groves) during the plowed stage (in autumn and winter) than during the unplowed vegetative stage (spring and summer), when soil erosion distribution is less intense. These results can also be representative of larger areas, considering that the geologic and geomorphological features of the investigated areas are typical of large parts of the Adriatic clay hills.
When compared with other direct and indirect methods applied to soil erosion [36,37,38,39,40,41,42], the direct field survey approach appears to be suitable for intermediate-scale (several km2) investigations and is useful for assessing the impact of soil erosion to hilly and agricultural landscapes. Other direct observations provide greater advantages at the local scale (~1 km2 and less) and in small basin investigations, while indirect estimations are more suitable for large-scale (hundreds of km2) soil erosion assessment of large drainage basins and entire physiographic domains. Moreover, the used approach is more suitable for single or multiple event investigations as in this work, and for applied issues, while other direct and indirect methods provide average long-term and short-term assessments that, however, might underestimate the assessment of soil erosion and its impact on the landscape.

6. Conclusions

In this work, we investigated three ~1-day heavy rainfall events (combined or not with antecedent rainfall) in 2007, 2011, and 2012 in different areas along the clayey hilly-coastal NE Abruzzo area, largely characterized by agricultural areas and urban tourist areas (affected by strong urbanization along coast and hilly area). The events were investigated in terms of cumulative rainfall, intensity and duration, triggered geomorphological effects (soil erosion and accumulation), and average erosion. The investigation offers several contributions to widely debated issues: (1) soil erosion assessment and impact on clayey landscapes typical of the entire Adriatic coastal hilly area; (2) comparison of estimated erosion with short- and long-term erosion rates in the Mediterranean area; and (3) rainfall triggering threshold for heavy soil erosion.
The soil erosion assessment shows average erosion from 0.08 cm to 3.08 cm in a single ~1-day heavy rainfall event (Figure 18). The erosion values show a good comparison (even if over a few events) with cumulative rainfall and not with peak rainfall intensity. The correlation is significant for the hilly coastal areas (Tortoreto, Pineto) but not for the Salinello area, incorporating the lower part of a main river valley and processes that are more connected to the main river than to the hillslopes. More specifically, the geomorphological features of the 2011 event, which occurred in March with partly vegetated cropland, outline the positive contribution (reduced erosion values) of vegetated landscape for preventing slopes from heavy soil erosion with respect to other events occurring in a heavily plowed landscape.
The average erosion values obtained for single events are comparable to the annual erosion rates obtained from previous studies for badlands (10–30 mm/y) and up to about one order of magnitude greater than the basin scale values (0.05–8 mm/y) and the long-term erosion rates (0.06–15 mm/y). Since these events occurred several times in the last decades and heavy rainfall is one of the main issues in future scenarios in terms of climate change, it is possible to outline the underestimation of the impact of soil erosion on the Adriatic hilly landscapes. This is fundamental in areas largely dedicated to agriculture, including high-quality plantations (e.g., olive groves, vineyards), and urban tourist areas, which are also suffering a strong loss of free soil due to land-use change and urbanization in recent years.
In terms of a heavy soil erosion triggering thresholds for clayey hilly landscapes, the correlation of cumulative rainfall and average erosion shows an expected threshold value as high as ~100–110 mm/day (Figure 18). This value, even if it results from a few local cases, could be representative of larger areas of the Adriatic clay hills with a similar morphoclimatic setting and it is comparable with the results of previous works, although mostly defining hourly rainfall intensity thresholds.
Finally, comparing the field mapping approach used in this work with other direct and indirect approaches for soil erosion assessment, it appears to be suitable mostly for intermediate-scale investigations and for single-multiple events analysis and can be used to verify and calibrate the evaluation of erosion rates with other methods.
In further development of this research, we expect to analyze new events, which occasionally affect the Adriatic clayey and sandy hills in order to verify the results. Moreover, we expect to compare the direct investigations with erosion modeling, and to use this approach to outline future scenarios of soil erosion impact in the framework of climate changes in terms of the debated issue of increasing heavy rainfall events.

Author Contributions

Conceptualization and supervision, E.M. and V.M.; rainfall and geomorphological analysis, GIS mapping, T.P.; rainfall analysis, A.G. and V.M.; discussion and conclusion, T.P., E.M., A.G., and V.M.; writing—original draft preparation, review and editing, T.P.

Funding

This research and the APC were funded by Università degli Studi “G. d’Annunzio” Chieti-Pescara, grant Miccadei and grant Piacentini.

Acknowledgments

The authors wish to thank F. Fonzi, O. Ranalli, and V. Mancinelli, who contributed the geomorphological survey and rainfall analysis. They are also very grateful to the three anonymous reviewers, whose precious comments greatly improved this paper. The rainfall data were provided by the Functional Center and Hydrographic Office of the Abruzzo Region (Centro Funzionale e Ufficio Idrografico Regione Abruzzo). The topographic data and aerial photos were provided by the Cartographic Office of the Abruzzo Region by means of the OpenGeoData Portal (http://opendata.regione.abruzzo.it/).

Conflicts of Interest

The authors declare no conflict of interest.

References

  1. Panagos, P.; Ballabio, C.; Borrelli, P.; Meusburger, K.; Klik, A.; Rousseva, S.; Tadić, M.P.; Michaelides, S.; Hrabalíková, M.; Olsen, P.; et al. Rainfall erosivity in Europe. Sci. Total Environ. 2015, 511, 801–814. [Google Scholar] [CrossRef] [PubMed]
  2. Guzzetti, F.; Peruccacci, S.; Rossi, M.; Stark, C.P. The rainfall intensity-duration control of shallow land-slides and debris flows: An update. Landslides 2008, 5, 3–17. [Google Scholar] [CrossRef]
  3. De Vita, P.; Reichenbach, P. Rainfall-triggered landslides: A reference list. Environ. Geol. 1998, 35, 219–233. [Google Scholar] [CrossRef]
  4. Grimm, M.; Jones, R.J.A.; Rusco, E.; Montanarella, L. Soil Erosion Risk in Italy: A Revised USLE Approach. EUR 20677 EN, European Soil Boreau Research Report; Office for Official Publications of the Europe-an Communities Luxembourg: Luxemburg, 2003; p. 28. [Google Scholar]
  5. Panagos, P.; Borrelli, P.; Poesen, J.; Ballabio, C.; Lugato, E.; Meusburger, K.; Montanarella, L.; Alewell, C. The new assessment of soil loss by water erosion in Europe. Environ. Sci. Policy 2015, 54, 438–447. [Google Scholar] [CrossRef] [Green Version]
  6. Guzzetti, F. Hydrological triggers of diffused landsliding. Environ. Geol. 1998, 35, 79–80. [Google Scholar] [CrossRef]
  7. Peruccacci, S.; Brunetti, M.T.; Luciani, S.; Vennari, C.; Guzzetti, F. Lithological and seasonal control on rainfall thresholds for the possible initiation of landslides in central Italy. Geomorphology 2012, 139–140, 79–90. [Google Scholar] [CrossRef]
  8. Capolongo, D.; Pennetta, L.; Piccarreta, M.; Fallacara, G.; Boenzi, F. Spatial and temporal variations in soil erosion and deposition due to land-levelling in a semiarid area of Basilicata (Southern Italy). Earth Surf. Process. Landf. 2008, 33, 364–379. [Google Scholar] [CrossRef]
  9. Borrelli, P.; Robinson, D.A.; Fleischer, L.R.; Lugato, E.; Ballabio, C.; Alewell, C.; Meusburger, K.; Modugno, S.; Schütt, B.; Ferro, V.; et al. An assessment of the global impact of 21st century land use change on soil erosion. Nat. Commun. 2017, 8. [Google Scholar] [CrossRef] [PubMed]
  10. Gariano, S.L.; Petrucci, O.; Rianna, G.; Santini, M.; Guzzetti, F. Impacts of past and future land changes on landslides in southern Italy. Reg. Environ. Chang. 2018, 18, 437–449. [Google Scholar] [CrossRef]
  11. Gariano, S.L.; Guzzetti, F. Landslides in a changing climate. Earth Sci. Rev. 2016, 162, 227–252. [Google Scholar] [CrossRef]
  12. Alvioli, M.; Melillo, M.; Guzzetti, F.; Rossi, M.; Palazzi, E.; von Hardenberg, J.; Brunetti, M.T.; Peruccacci, S. Implications of climate change on landslide hazard in Central Italy. Sci. Total Environ. 2018, 630, 1528–1543. [Google Scholar] [CrossRef] [PubMed]
  13. Brunetti, M.; Maugeri, M.; Monti, F.; Nanni, T. Temperature and precipitation variability in Italy in the last two centuries from homogenized instrumental time series. Int. J. Clim. 2006, 26, 345–381. [Google Scholar] [CrossRef]
  14. Panagos, P.; Standardi, G.; Borrelli, P.; Lugato, E.; Montanarella, L.; Bosello, F. Cost of agricultural productivity loss due to soil erosion in the European Union: From direct cost evaluation approaches to the use of macroeconomic models. Land Degrad. Dev. 2018, 29, 471–484. [Google Scholar] [CrossRef] [Green Version]
  15. Haque, U.; Blum, P.; da Silva, P.F.; Andersen, P.; Pilz, J.; Chalov, S.R.; Malet, J.P.; Auflič, M.J.; Andres, N.; Poyiadji, E.; et al. Fatal landslides in Europe. Landslides 2016, 13, 1545–1554. [Google Scholar] [CrossRef]
  16. Salvati, P.; Bianchi, C.; Rossi, M.; Guzzetti, F. Societal landslide and flood risk in Italy. NHESS 2010, 10, 465–483. [Google Scholar] [CrossRef] [Green Version]
  17. Salvati, P.; Petrucci, O.; Rossi, M.; Bianchi, C.; Pasqua, A.A.; Guzzetti, F. Gender, age and circumstances analysis of flood and landslide fatalities in Italy. Sci. Total Environ. 2018, 610–611, 867–879. [Google Scholar] [CrossRef] [PubMed]
  18. Ciccacci, S.; Del Monte, M.; Fredi, P.; Lupia Palmieri, E. Sviluppo di Metodi per la Valutazione Quantitativa dell’intensità della Denudazione e della Relativa Pericolosità in Bacini Idrografici Italiani. In Erosione Idrica in Ambiente Mediterraneo: Valutazione Diretta e Indiretta in Aree Sperimentali e Bacini Idrografici, Atti Convegno conclusivo PRIN; Rodolfi, G., Ed.; Brigati: Genova, Italy, 2006; pp. 125–144. [Google Scholar]
  19. Märker, M.; Pelacani, S.; Schröder, B. A functional entity approach to predict soil erosion processes in a small Plio-Pleistocene Mediterranean catchment in Northern Chianti, Italy. Geomorphology 2011, 125, 530–540. [Google Scholar] [CrossRef]
  20. Conoscenti, C.; Agnesi, V.; Cama, M.; Caraballo-Arias, N.A.; Rotigliano, E. Assessment of Gully Erosion Susceptibility Using Multivariate Adaptive Regression Splines and Accounting for Terrain Connectivity. Land Degrad. Dev. 2018, 29, 724–736. [Google Scholar] [CrossRef]
  21. Brunetti, M.T.; Peruccacci, S.; Antronico, L.; Bartolini, D.; Deganutti, A.M.; Gariano, S.L.; Iovine, G.; Luciani, S.; Luino, F.; Melillo, M.; et al. Catalogue of rainfall events with shallow landslides and new rainfall thresholds in Italy. In Engineering Geology for Society and Territory Landslide Processes; Lollino, G., Giordan, D., Crosta, G.B., Corominas, J., Azzam, R., Wasowski, J., Sciarra, N., Eds.; Springer International Publishing: Cham, Switzerland, 2015; Volume 2, pp. 1575–1579. ISBN 978-3-319-09057-3. [Google Scholar]
  22. Vessia, G.; Parise, M.; Brunetti, M.T.; Peruccacci, S.; Rossi, M.; Vennari, C.; Guzzetti, F. Automated recon-struction of rainfall events responsible for shallow landslides. NHESS 2014, 14, 2399–2408. [Google Scholar]
  23. IPCC Intergovernmental Panel on Climate Change. Synthesis Report; Contribution of Working Groups I, II and III to the Fifth Assessment Report of the Intergovernmental Panel on Climate Change; IPCC: Geneva, Switzerland, 2008; p. 151. Available online: https://www.ipcc.ch/report/ar5/s (accessed on 1 November 2014).
  24. Piccarreta, M.; Pasini, A.; Capolongo, D.; Lazzari, M. Changes in daily precipitation extremes in the Mediterranean from 1951 to 2010: The Basilicata region, southern Italy. Int. J. Clim. 2013, 33, 3229–3248. [Google Scholar] [CrossRef]
  25. Bramati, M.C.T.; Tarragoni, C.; Davoli, L.; Raffi, R. Extreme rainfall in coastal metropolitan areas of Cen-tral Italy: Rome and Pescara case studies. Geog. Fis. Din. Quat. 2014, 37, 3–13. [Google Scholar]
  26. Mariani, L.; Parisi, S.G. Extreme rainfalls in the Mediterranean area. Adv. Nat. Technol. Hazard 2014, 39, 17–37. [Google Scholar]
  27. Forestieri, A.; Lo Conti, F.; Blenkinsop, S.; Cannarozzo, M.; Fowler, H.J.; Noto, L.V. Regional frequency analysis of extreme rainfall in Sicily (Italy). Int. J. Clim. 2018, 38, 698–716. [Google Scholar] [CrossRef]
  28. Fredi, P.; Lupia Palmieri, E. Morphological Regions of Italy. In Landscapes and Landforms of Italy. World GeOmorphological Landscapes; Soldati, M., Marchetti, M., Eds.; Springer: Cham, Switzerland, 2017; pp. 39–74. [Google Scholar]
  29. Brandolini, P.; Pepe, G.; Capolongo, D.; Cappadonia, C.; Cevasco, A.; Conoscenti, C.; Marsico, A.; Ver-gari, F.; Del Monte, M. Hillslope degradation in representative Italian areas: Just soil erosion risk or opportunity of development? Land Degrad. Dev. 2018. [Google Scholar] [CrossRef]
  30. Vergari, F.; Della Seta, M.; Del Monte, M.; Fredi, P.; Lupia Palmieri, E. Long- and short-term evolution of several Mediterranean denudation hot spots: The role of rainfall variations and human impact. Geomophology 2013, 183, 14–27. [Google Scholar] [CrossRef]
  31. Costantini, E.A.C.; Castaldini, M.; Diago, M.P.; Giffard, B.; Lagomarsino, A.; Schroers, H.J.; Priori, S.; Valboa, G.; Agnelli, A.E.; Akça, E.; et al. Effects of soil erosion on agro-ecosystem services and soil functions: A multidisciplinary study in nineteen organically farmed European and Turkish vineyards. J. Environ. Manag. 2018, 223, 614–624. [Google Scholar] [CrossRef] [PubMed]
  32. ISPRA. Consumo di Suolo, Dinamiche Territoriali e Servizi Ecosistemici Edizione; ISPRA: Rome, Italy, 2018; Rapporti 288/2018; ISBN 978-88-448-0902-7. [Google Scholar]
  33. Miccadei, E.; Piacentini, T.; Daverio, F.; Di Michele, R. Geomorphological instability triggered by heavy rainfall: Examples in the Abruzzi Region (Central Italy). In Environmental and Applied Geomorphology; Miccadei, E., Piacentini, T., Eds.; INTECH: Rijeka, Croatia, 2012; pp. 45–62. ISBN 9789535103615. [Google Scholar]
  34. Di Lena, B.; Antenucci, F.; Mariani, L. Space and time evolution of the Abruzzo precipitation. It. J. Agro-meteo. 2012, 1, 5–20. [Google Scholar]
  35. Regione Abruzzo. Calamità Naturali. Available online: https://www.regione.abruzzo.it/content/calamità-naturali (accessed on 10 August 2018).
  36. Ciccacci, S.; Fredi, F.; Lupia Palmieri, E.; Pugliese, F. Contributo dell’analisi geomorfica quantitativa alla valutazione dell’entita dell’erosione nei bacini fluviali. Boll. Soc. Geol. Ital. 1980, 99, 455–516. [Google Scholar]
  37. Lazzari, M.; Gioia, D.; Piccarreta, M.; Danese, M.; Lanorte, A. Sediment yield and erosion rate estimation in the mountain catchments of the Camastra artificial reservoir (Southern Italy): A comparison between different empirical methods. Catena 2015, 127, 323–339. [Google Scholar] [CrossRef]
  38. Boix-Fayos, C.; Martínez-Mena, M.; Calvo-Cases, A.; Arnau-Rosalén, E.; Albaladejo, J.; Castillo, V. Causes and underlying processes of measurement variability in field erosion plots in Mediterranean conditions. Earth Surf. Process. Landf. 2007, 32, 85–101. [Google Scholar] [CrossRef]
  39. Della Seta, M.; Del Monte, M.; Fredi, P.; Lupia Palmieri, E. Space-time variability of denudation rates at the catchment and hillslope scales on the Tyrrhenian side of Central Italy. Geomorphology 2009, 107, 161–177. [Google Scholar] [CrossRef]
  40. Martínez-Casasnovas, J.A.; Ramos, M.C.; Ribes-Dasi, M. Soil erosion caused by extreme rainfall events: Mapping and quantification in agricultural plots from very detailed digital elevation models. Geoderma 2002, 105, 125–140. [Google Scholar] [CrossRef]
  41. Buccolini, M.; Gentili, B.; Materazzi, M.; Piacentini, T. Late Quaternary geomorphological evolution and erosion rates in the clayey peri-Adriatic belt (central Italy). Geomorphology 2010, 116, 145–161. [Google Scholar] [CrossRef]
  42. Del Monte, M.; Vergari, F.; Brandolini, P.; Capolongo, D.; Cevasco, A.; Ciccacci, S.; Conoscenti, C.; Fredi, P.; Melelli, L.; Rotigliano, E.; et al. Multi-Method Evaluation of Denudation Rates in Small Mediterranean Catchments. In Engineering Geology for Society and Territory Climate, Change and Engineering Geology; Lollino, G., Manconi, A., Clague, J., Shan, W., Chiarle, M., Eds.; Springer International Publishing: Cham, Switzerland, 2015; Volume 1, pp. 563–567. ISBN 978-3-319-09300-0. [Google Scholar]
  43. Segoni, S.; Piciullo, L.; Gariano, S.L. A review of the recent literature on rainfall thresholds for landslide occurrence. Landslides 2018, 15, 1483–1501. [Google Scholar] [CrossRef]
  44. ISPRA. Cartografia Geologica d’Italia alla Scala 1:50.000, Foglio 339 “Teramo”; Serv. Geol. It.; ISPRA: Rome, Italy, 2012. [Google Scholar]
  45. ISPRA. Cartografia Geologica d’Italia alla Scala 1:50.000, Foglio 351 “Pescara”; Serv. Geol. It.; ISPRA: Rome, Italy, 2012. [Google Scholar]
  46. Costantini, E.A.C.; L’Abate, G.; Barbetti, R.; Fantappie, M.; Lorenzetti, R.; Magini, S. Carta dei suoli d’Italia, Scala 1:1.000.000. Available online: http://www.soilmaps.it/en/downloads.html (accessed on 18 September 2018).
  47. Chiuchiarelli, I.; Paolanti, M.; Rivieccio, R.; Santucci, S. Suoli e Paesaggi d’Abruzzo—Carta dei Suoli d’Abruzzo, in Scala 1:250.000; ARSSA Regione Abruzzo, 2006. [Google Scholar]
  48. FAO. World Reference Base for Soil Resources 2014. International Soil Classification System for Naming Soils and Creating Legends for Soil Maps; World Soil Resources Reports; Food and Agriculture Organization of the United Nations: Rome, Italy, 2015; pp. 106–203. ISSN 0532-0488. [Google Scholar]
  49. Miccadei, E.; Piacentini, T.; Buccolini, M. Long-Term Geomorphological Evolution in the Abruzzo Area (Central Apennines, Italy): Twenty Years of Research. Thematic Issue “Long-term geomorphological evolution of central-southern Italy. Geol. Carp. 2017, 68, 19–28. [Google Scholar] [CrossRef]
  50. Miccadei, E.; Piacentini, T.; Gerbasi, F.; Daverio, F. Morphotectonic map of the Osento River basin (Abruzzo, Italy), scale 1:30,000. J. Maps 2012, 8, 62–73. [Google Scholar] [CrossRef] [Green Version]
  51. Miccadei, E.; Piacentini, T.; Pozzo, A.D.; Corte, M.L.; Sciarra, M. Morphotectonic map of the Aventino-Lower Sangro valley (Abruzzo, Italy), scale 1:50,000. J. Maps 2013, 9, 390–409. [Google Scholar] [CrossRef] [Green Version]
  52. Patacca, E.; Scandone, P. Geology of the Southern Apennines. Boll. Soc. Geol. Ital. 2007, 7, 75–119. [Google Scholar]
  53. Piacentini, T.; Miccadei, E. The role of drainage systems and intermontane basins in the Quaternary landscape of the Central Apennines chain (Italy). Rend. Fis. Acc. Lincei 2014, 25, 139–150. [Google Scholar] [CrossRef]
  54. Miccadei, E.; Mascioli, F.; Ricci, F.; Piacentini, T. Geomorphology of soft clastic rock coasts in the midwestern Adriatic Sea (Abruzzo, Italy). Geomorphology 2018, accepted. [Google Scholar]
  55. Calista, M.; Miccadei, E.; Pasculli, A.; Piacentini, T.; Sciarra, M.; Sciarra, N. Geomorphological features of the Montebello sul Sangro large landslide (Abruzzo, Central Italy). J. Maps 2016, 12, 882–891. [Google Scholar] [CrossRef]
  56. D’Alessandro, L.; Del Sordo, L.; Buccolini, M.; Miccadei, E.; Piacentini, T.; Urbani, A. Regione Abruzzo (Cap.18). In Rapporto Sulle Frane in Italia. Il Progetto IFFI. Risultati, Elaborazioni, e Rapporti Regionali; Rapporti APAT 78/2007; ISPRA: Rome, Italy, 2007; pp. 464–497. [Google Scholar]
  57. Piacentini, T.; Sciarra, M.; Miccadei, E.; Urbano, T. Near-surface deposits and hillslope evolution of the Adriatic piedmont of the Central Apennines (Feltrino Stream basin and minor coastal basins, Abruzzo, Italy). J. Maps 2015, 11, 299–313. [Google Scholar] [CrossRef]
  58. Piccini, C.; Marchetti, A.; Santucci, S.; Chiuchiarelli, I.; Francaviglia, R. Stima dell’erosione dei suoli nel territorio della regione Abruzzo. Geol. Ambiente 2012, 2 (Suppl. 1), 257–261. [Google Scholar]
  59. Peel, M.C.; Finlayson, B.L.; McMahon, T.A. Updated world map of the Köppen-Geiger climate classifica-tion. Hydrol. Earth Syst. Sci. 2007, 11, 1633–1644. [Google Scholar] [CrossRef]
  60. Piacentini, T.; Marsala, V.; Miccadei, E.; Ranalli, O.; Sciarra, M. Analysis of Geomorphological Effects Induced by Heavy Rainfalls in ne Abruzzo (central italy) for Hazard Assessment and Land Management. In Proceedings of the Geomorphology of Natural Hazards: Mapping, Analysis and Prevention, 17th Joint Geomorphological Meeting, Liege, Belgium, 30 June–3 July 2014. [Google Scholar]
  61. Chiaudani, A.; Di Curzio, D.; Palmucci, W.; Pasculli, A.; Polemio, M.; Rusi, S. Statistical and fractal ap-proaches on long time-series to surface-water/groundwater relationship assessment: A central Italy al-luvial plain case study. Water 2017, 9, 850. [Google Scholar] [CrossRef]
  62. Mazzocca, M.; Flacco, I.; Di Carlo, P.; Pagliani, T. Profilo climatico Regione Abuzzo. Piano di Adattamento ai Cambiamenti Climatici, Regione Abruzzo. Available online: https://www.regione.abruzzo.it/system/files/energia/pacc/Profilo-Climatico_23giu2017_def.pdf (accessed on 18 September 2018).
  63. Vezzani, L.; Ghisetti, F. Carta Geologica della Regione Abruzzo, Scala 1:100,000; Ufficio Cartografico, Regione Abruzzo set, Urbanistica-Beni Ambientali e Cultura; 1998. [Google Scholar]
  64. Abruzzo Region. Carta dell’uso del suolo. Edizione 2000. Ufficio Cartografico Regione Abruzzo. Available online: Opendata.regione.abruzzo.it (accessed on 10 March 2018).
  65. Guzzetti, F.; Peruccacci, S.; Rossi, M.; Stark, C.P. Rainfall thresholds for the initiation of landslides in central and southern Europe. Meteorol. Atmos. Phys. 2007, 98, 239–267. [Google Scholar] [CrossRef]
  66. Brunetti, M.T.; Peruccacci, S.; Rossi, M.; Luciani, S.; Valigi, D.; Guzzetti, F. Rainfall thresholds for the possible occurrence of landslides in Italy. NHESS 2010, 10, 447–458. [Google Scholar] [CrossRef] [Green Version]
  67. Hinderer, M. Late Quaternary denudation of the Alps, valley and lake fillings and modern river loads. Geodin. Acta 2001, 14, 231–263. [Google Scholar] [CrossRef]
  68. Degens, E.T.; Paluska, A.; Eriksson, E. Rates of soil erosion. Ecol. Bull. 1976, 22, 185–191. [Google Scholar]
  69. Miccadei, E.; Carabella, C.; Paglia, G.; Piacentini, T. Paleo-drainage network, morphotectonics and fluvial terraces: Clues from the Verde Stream in the middle Sangro River (Central Italy). Geosciences 2018, 8, 337. [Google Scholar] [CrossRef]
  70. Cantón, Y.; Solé-Benet, A.; de Vente, J.; Boix-Fayos, C.; Calvo-Cases, A.; Asensio, C.; Puigdefábregas, J. A review of runoff generation and soil erosion across scales in semiarid south-eastern Spain. J. Arid Environ. 2011, 75, 1254–1261. [Google Scholar] [CrossRef] [Green Version]
  71. Mohr, C.H.; Coppus, R.; Iroumé, A.; Huber, A.; Bronstert, A. Runoff generation and soil erosion processes after clear cutting. J. Geophys. Res. Earth Surf. 2013, 118, 814–831. [Google Scholar] [CrossRef] [Green Version]
  72. Gay, I.; Macaire, J.J.; Cocirta, C. Evolution qualitative des flux particulaires depuis 12600 ans dans le bassin du lac Chambon, Massif central, France. Bull. Soc. Géol. Fr. 1998, 169, 310–314. [Google Scholar]
  73. Sirvent, J.; Desir, G.; Gutierrez, M.; Sancho, C.; Benito, G. Erosion rates in badland areas recorded by collectors, erosion pins and profilometers techniques (Ebro Basin, NE-Spain). Geomorphology 1997, 18, 61–75. [Google Scholar] [CrossRef]
  74. Della Seta, M.; Del Monte, M.; Fredi, P.; Lupia Palmieri, E. Direct and indirect evaluation of denudation rates in Central Italy. Catena 2007, 71, 21–30. [Google Scholar] [CrossRef]
  75. Verheijen, F.G.A.; Jones, R.J.A.; Rickson, R.J.; Smith, C.J. Tolerable versus actual soil erosion rates in Europe. Earth Sci. Rev. 2009, 94, 23–38. [Google Scholar] [CrossRef] [Green Version]
Figure 1. Location map of (a) the Abruzzo region and (b) of the study area in the main physiographic domains of the Abruzzo region.
Water 10 01314 g001
Figure 2. Geologic scheme of the Abruzzo region (modified from [44,45,63]). The red boxes indicate locations of the study areas (grid in UTM WGS84 coordinates).
Water 10 01314 g002
Figure 3. Soil scheme of the study area (modified from Soil Map of Italy [46]).
Water 10 01314 g003
Figure 4. Tortoreto area: (a) land use map (modified from land use map of the Abruzzo region [64]) and (b) lithologic scheme (grid in UTM WGS84 coordinates).
Water 10 01314 g004
Figure 5. Lower Salinello area: (a) land use map (modified from land use map of the Abruzzo region [64]) and (b) lithologic scheme (legend is in Figure 4, grid in UTM WGS84 coordinates).
Water 10 01314 g005
Figure 6. Pineto area: (a) land-use map (modified from land use map of the Abruzzo region [64]) and (b) lithological scheme (modified from [60], grid in UTM WGS84 coordinates).
Water 10 01314 g006
Figure 7. Heavy rainfall event of 7 October 2007: (a) hourly and cumulative rainfall at the Nereto (TE) station and (b) maximum daily rainfall at the stations surrounding the study area (location in Figure 2).
Water 10 01314 g007
Figure 8. September–October 2007 daily rainfall at the (a) Tortoreto station and (b) Nereto station.
Water 10 01314 g008
Figure 9. Geomorphological effects induced by the 2007 heavy rainfall event in the Tortoreto hilly area (ortophoto taken 2 days after the event): (a) gully erosion and (b) rill-gully erosion features.
Water 10 01314 g009
Figure 10. Geomorphological effects triggered by the 2007 heavy rainfall event in the Tortoreto hilly and coastal area (Tortoreto 2007): (a) map (grid in UTM WGS84 coordinates) and (b) table of the effects distribution.
Water 10 01314 g010

(b)Sheet-Rill
Erosion
Gully
Erosion
Channel
Incision
Mud
Flows
Flooding
Areas
TOTAL
Number of features389506451281241192
Depth/thickness (cm)1–520–100100–20050–1500–10
Spacing (m)1–104–8
Area (km2)4.364.840.230.373.9713.77
% of total area10.011.1 0.99.131.00
Eroded volume (m3)48,400610,900228,400 887,700
Sedimented volume (m3) 250,900153,000403,900
Figure 11. Hourly and cumulative rainfall during the heavy rainfall event on 1–2 March 2011, at (a) the Pineto (TE) station and (b) the Nereto (TE) station.
Water 10 01314 g011
Figure 12. Rainfall event on 2 March 2011: (a) daily rainfall at stations in the NE Abruzzo hilly area, and (b) daily and cumulative rainfall in the February–March 2011 time interval (Pineto station).
Water 10 01314 g012
Figure 13. Geomorphological instabilities triggered by the 2011 heavy rainfall event: (a) Pineto, gully erosion area on nonvegetated cropland; (b) Pineto, major gully on a vegetated cropland; (c) Salinello River, crevasse splay and fluvial erosion scarps; (d) Salinello River, fluvial erosion scarp affecting a valley road; (e) Salinello River, flooding area and crevasse splays on the main fluvial plain.
Water 10 01314 g013
Figure 14. Map of the geomorphological effects triggered by the 2011 heavy rainfall event (grid in UTM WGS84 coordinates): (a) Atri-Pineto hilly and coastal area (Pineto 2011) and (b) Salinello River valley (Salinello 2011).
Water 10 01314 g014
Figure 15. Double September 2012 event in the Atri-Pineto area: (a) hourly and cumulative rainfall (5–6 September 2012; Atri station); (a) hourly and cumulative rainfall (13–14 September 2012; Atri station); (c) daily rainfall in August and September 2012 at the Atri station; (d) daily rainfall over the periods 5–6 and 13–14 September 2012, events at significant stations in NE Abruzzo.
Water 10 01314 g015
Figure 16. Geomorphological instabilities triggered by the 2012 double heavy rainfall event: (a) Pineto valley slope, gully erosion area on a not-vegetated cropland; (b) Pineto coastal slope, major gully on plowed cropland; (c) Pineto coastal plain, flooding area with mud accumulation; (d) Atri-Pineto hilly slopes, widespread sheet-rill and gully erosion areas; (e) Atri hilly slopes, sheet-rill and gully erosion areas; (f) Atri hilly slopes, major gullies along the minor catchments.
Water 10 01314 g016
Figure 17. Map of geomorphological effects triggered by the 2012 heavy rainfall event in the Atri-Pineto hilly-coastal area (grid in UTM WGS84 coordinates): (a) 5–6 September (Pineto 2012-1) and (b) 13–14 September (Pineto 2012-2).
Water 10 01314 g017
Figure 18. Comparison of soil erosion values (eroded volume, average erosion, sediment loss) and rainfall distribution (cumulative rainfall, max and mean rainfall intensity). The event numbers refer to Table 3.
Water 10 01314 g018
Table 1. Table of the geomorphological effects distribution of the 2011 heavy rainfall event: (a) Pineto area and (b) Salinello area.
(a)Gully ErosionMajor GulliesMud FlowsFlooding AreasCrevasse SplaysTOTAL
Number of features8263813590
Depth/thickness (cm)20–5050–10020–1500–510–50
Spacing (m)3–20
Area (km2)1.1310.200.262.010.1613.76
% of total area1.9 0.43.30.35.9
Eroded volume (m3)133,0008900 141,900
Sedimented volume (m3) 60,40026,10020,00086,500
(b)Sheet-rill ErosionMajor GulliesBank FailureMud FlowsFlooding AreasCrevasse SplaysTOTAL
Number of features278415313220209
Depth/thickness (cm)5–1020–100100–20050–2000–520–40
Spacing (m)1–2
Area (km2)/Length (km)0.104.502.000.503.620.32
% of total area0.2 0.38.30.79.5
Eroded volume (m3)570044002000 12,100
Sedimented volume (m3) 65,50046,70083,700195,900
Table 2. Table of the geomorphological effects distribution of the 2012 heavy rainfall event: (a) 5–6 September and (b) 13–14 September.
(a)Gully ErosionMajor GulliesMud FlowsFlooding AreasCrevasse SplaysTOTAL
Number of features23664131106
Depth/thickness (cm)10–3020–4050–2000–330
Spacing (m)4–6
Area (km2)0.238.30.100.30> 0.0018.93
% of total area0.4 0.20.5 1.1
Eroded volume (m3)33,9002700 36,600
Sedimented volume (m3) 30,900630030037,500
(b)Sheet-rill ErosionGully ErosionMajor GulliesChannel IncisionMud FlowsFlooding AreasCrevasse SplaysTOTAL
Number of features5276321423248508
Depth/thickness (cm)2–520–4020–7030–6050–2000–310–30
Spacing (m)1–44–8
Area (km2)0.921.1848.800.900.180.360.0352.37
% of total area1.52.0 0.30.60.14.5
Eroded volume (m3)27,600236,50023,3002500 289,900
Sedimented volume (m3) 88,0005000590098,900
Table 3. Geomorphological effects and landform distributions for the investigated events, soil erosion-sedimentation, and soil loss estimation.
Tortoreto 2007Salinello 2011Pineto 2011Pineto 2012-1Pineto 2012-2
Erosionm3%m3%m3%m3%m3%
Sheet-rill erosion48,40055700560 0027,60010
Gully erosion610,900690 133,0009433,90093236,50082
Major gullies00440044890062700723,3008
Bank failure0020002000001000
Channel incision228,400260 0 0025001
Total eroded887,800 12,100 141,900 36,600 289,900
Sedimentationm3%m3%m3%m3%m3%
Mud flows250,9006265,5003360,4005730,9008288,00089
Flooding areas153,0003846,7002426,1002563001750005
Crevasse splays0083,7004320,00019300159006
Total sedimented403,800 195,900 106,500 37,500 98,900
Soil loss−484,000−55183,800+1519−35,400−25+900+2−191,000−66
Table 4. Summary of rainfall and soil erosion–sedimentation in the investigated rainfall events. Negative values indicate sediment loss; positive values indicate sedimented volumes higher than the eroded (see text for explanation).
EventCumulative Rainfall (mm)Hourly Rainfall Intensity Max (mm/h)Hourly Rainfall Intensity Mean (mm/h)Rainfall Duration (h)Eroded Volume (m3)Average Erosion (cm)Sedimented Volume (m3)Soil Loss (m3)
1Tortoreto 20072104014.714–16887,7003.08403,800−483,900
2aSalinello 2011211358.822–2610,100< 0.01196,000185,900
2bPineto 2011120355.022–26141,9000.29106,500−35,400
3aPineto 2012-1120606.71836,6000.0837,500900
3bPineto 2012-2~160457.022–24289,9000.6098,900−191,000
Table 5. Erosion rates in Mediterranean and surrounding areas (modified after Buccolini et al. [41]).
IDLocalityEnvironmentLithologyMethodErosion RatePeriodReference
1AlpsMountain chainVariousSediment volume trapped in valleys and lake basin1.77 mm/yearLate Glacial[67]
2Black Sea source areaMountain chains, hills and plainsVariousSediment volume trapped in Black Sea0.063 mm/yearHolocene[68]
3Adriatic Central ItalyMain fluvial basinAlluvial depositsThermochronometry0.7–1.5 mm/yearLast 20,000 year[69]
4Lac Chambon (Massif Central, France)Mountain basinLacustrine depositsQualitative estimation0.12 mm/yearLast deglaciation[72]
5Ebro Basin (NE Spain)Badlands on hilly areaClayey bedrockDirect measures on erosion plots in badland a5.6–11.2 mm/yearPresent (1991–1993)[73]
6Southern TuscanyHilly areaClayey bedrockDirect measures15–30 mm/year
(badlands)
Present[18]
60–90 mm/year
(landslides)
7Central ItalyHilly areasClayey bedrockDirect measures compared with indirect estimation from geomorphometry of drainage network10–25 mm/year (badlands)
30–40 mm/year (landslides)
Present[39,74]
8EuropeVariousSoilVarious10–20 t ha−1 year−1 (overall)Present[75]
455 t ha−1 year−1 (gully erosion max. value)
9Mt. Ascensione (Area 1)High hillsSlope deposits, clayey bedrockRadiometric dating and GIS analysis7.8 mm/year
15.6 mm/year
Last 20,000 year
Holocene
[41]
10Atri (Area 2)Coastal hillsColluvial deposits, clayey bedrockRadiometric dating and GIS analysis2.4–3 mm/year
4.8–6 mm/year
Last 20,000 year
Holocene
[41]
11Camastra
reservoir
Basilicata)
Mountain basinClayey–marly–calcareous bedrockIndirect assessment (Tu, RUSLE, USPED)1392 T km2 year1
~1 mm/year
Present[37]
12Verde BasinMountain-piedmont basinClayey–marly–calcareous bedrockIndirect assessment (Tu)~0.05–8.0 mm/yearPresent[69]

