Four Decades of Estuarine Wetland Changes in the Yellow River Delta Based on Landsat Observations Between 1973 and 2013


1
Department of Geography and Geomatics, Jiangsu Normal University, Xuzhou 221116, China
2
State Key Laboratory of Remote Sensing Science, Institute of Remote Sensing and Digital Earth, Chinese Academy of Sciences, Beijing 100101, China
3
Department of Geography and Geomatics, Jiangsu Normal University, Xuzhou 221116, China
*
Author to whom correspondence should be addressed.
Water 2018, 10(7), 933; https://0-doi-org.brum.beds.ac.uk/10.3390/w10070933
Submission received: 30 April 2018
/
Revised: 28 June 2018
/
Accepted: 3 July 2018
/
Published: 13 July 2018
(This article belongs to the Special Issue Climate Variability and Climate Change Impacts on Land Surface, Hydrological Processes and Water Management)
Abstract
:Yellow River Delta wetlands are essential for the migration of endangered birds and breeding. The wetlands, however, have been severely damaged during recent decades, partly due to the lack of wetland ecosystem protection by authorities. To have a better historical understanding of the spatio-temporal dynamics of the wetlands, this study aims to map and characterize patterns of the loss and degradation of wetlands in the Yellow River Delta using a time series of remotely sensed images (at nine points in time) based on object-based image analysis and knowledge transfer learning technology. Spatio-temporal analysis was conducted to document the long-term changes taking place in different wetlands over the four decades. The results showed that the Yellow River Delta wetlands have experienced significant changes between 1973 and 2013. The total area of wetlands has been reduced by 683.12 km2 during the overall period and the trend of loss continues. However, the rates and trends of change for the different types of wetlands were not the same. The natural wetlands showed a statistically significant decrease in area during the overall period (36.04 km2·year−1). Meanwhile, the artificial wetlands had the opposite trend and showed a statistically significant increase in area during the past four decades (18.96 km2·year−1). According to the change characteristics revealed by the time series wetland classification maps, the evolution process of the Yellow River Delta wetlands could be divided into three stages: (1) From 1973–1984, basically stable, but with little increase; (2) from 1984–1995, rapid loss; and (3) from 1995–2013, slow loss. The area of the wetlands reached a low point around 1995, and then with a little improvement, the regional wetlands entered a slow loss stage. It is believed that interference by human activities (e.g., urban construction, cropland creation, and oil exploitation) was the main reason for wetland degradation in the Yellow River Delta over the past four decades. Climate change also has long-term impacts on regional wetlands. In addition, due to the special geographical environment, the hydrological and sediment conditions and the location of the Yellow River mouth also have a significant influence on the evolution process of the wetlands.
1. Introduction
The Yellow River Delta wetlands are a critical ecological system and are a transitional buffer zone between the sea and inland areas [1,2,3]. They play a very important role because they affect nitrogen absorption, geochemical cycles, climate regulation, and act as a carbon sink; they also provide a breeding ground and habitat for birds and land for bioconservation [4,5]. This area is also a very important migratory route for nationally rare and endangered birds [6]. In 1992, the Chinese government created the largest national wetland nature reserve (Yellow River Delta National Nature Reserve, YRDNNR) as a stopover and breeding ground for globally endangered birds. In addition, the Yellow River Delta is also one of the biggest and fastest growing deltas in the world due to continuous sedimentation [7,8]. The average rate of newly created land is about 21.3 km2 per year [8]. It is characterized by extensive coverage of saline and wet soils due to a high groundwater table and inundation by sea water [7]. Within the delta, there are a large number of shallow water areas with an abundance of wetland vegetation and aquatic biological resources. The area of the wetlands is 4167 km2, and it occupies over 50% of the total area of the delta [9].
Globally, nearly half of all wetlands have been lost over the past century because of human disturbance and climate change [7,8,10,11,12,13]. China’s wetlands have also suffered tremendous loss in recent decades [14,15]. These trends are still generally continuing and result in serious environmental problems [4,16,17,18,19,20,21]. Coastal wetland systems have, in particular, become one of the most vulnerable ecosystems around the world [4,16,17,18,19,20,21]. The Yellow River delta is not only a highly dynamic area, but it is also very important for ecological functions. Therefore, the conservation of wetland resources has attracted the attention of scientists and local authorities. Existing research has found that the degradation of the Yellow River Delta wetlands has triggered numerous environmental problems and seriously threatened sustainable economic development in the region [7,8,22,23]. In a study from the perspective of landscape ecology, using remote-sensing data from three different years (2000, 2005, 2010), Liu confirmed that the regional wetland landscape patches became more complex and decentralized due to rapid economic development [22]. However, studies examining long-term time series of change are lacking. The distribution of wetlands and their historical changes in this region are not very clear. Timely surveying and mapping of wetlands is a fundamental task for the research, management, and conversation of wetlands. So, it is imperative to examine the current status of wetlands, how it has changed, and trends in the delta.
However, because of the complexity and poor accessibility of wetland areas, traditional field surveys are limited by either spatial or temporal coverage. As a result, there is a lack of long-term time series of wetland maps and no systematic temporal analyses of wetlands. Until now, we have not had adequate knowledge of the characteristics of the majority of wetlands over the past few decades. Therefore, it is imperative to quantify the spatio-temporal characteristics and status-trends of regional wetlands and to determine the best ways to develop scientific strategies for wetland management, conservation, and restoration. With the development of remote-sensing technology, there are abundant multi-source satellite data (e.g., Landsat1~8, H-J1/2, MODIS) available online at no cost. These data may provide accurate, reliable, and economical means for a wetland inventory. Currently, more than 90% of wetland maps in China were obtained by means of remote-sensing surveys [24], and remote sensing has become one of the most efficient means for wetland monitoring [25].
Numerous methods have been developed to automatically identify and classify wetlands from multisource remotely sensed imagery; they include unsupervised/supervised classification, spectral angle mapping (SAM), artificial neural networks (ANN), Support vector machine (SVM), and “TUPU” coupled hybrid classification [26,27,28,29,30,31,32,33,34,35,36,37]. The automatic extraction technique has been pursued by researchers to extract the geographic area of wetlands. Due to the complexity, wetland remote sensing has undergone manual interpretation, semi-automatic, and intelligent extraction periods [14,29,36,38,39,40,41,42,43,44]. Wetland remote sensing has experienced changes in terms of data sources; it has gone from a single data source to multi-phase, multi-angle, and multi-data sources for wetland detection [36,37,45,46]. In terms of the scale of information extraction, wetland classifications have been performed from the individual pixel level to the level of objects, which are equivalent to wetland patches [2,28]. Although wetland extraction has been moderately successful in some applications, automatic mapping remains a challenge, largely due to the ambiguous spectral characteristics and complex shapes, sizes, and forms of wetlands [10,47,48].
In order to assess the change characteristics and dynamics of wetlands in the Yellow River Delta over the past four decades, we proposed a per-parcel level classification approach based on the knowledge transfer classification and machine learning for automatic classification of wetlands. This study produced time-series maps that document how these reginal wetlands have changed. We examined the spatial distribution, change process, and drive mechanism of wetlands in the Yellow River Delta over the past four decades. The results provide data and a scientific reference for wetland management, conservation, and restoration.
2. Study Area
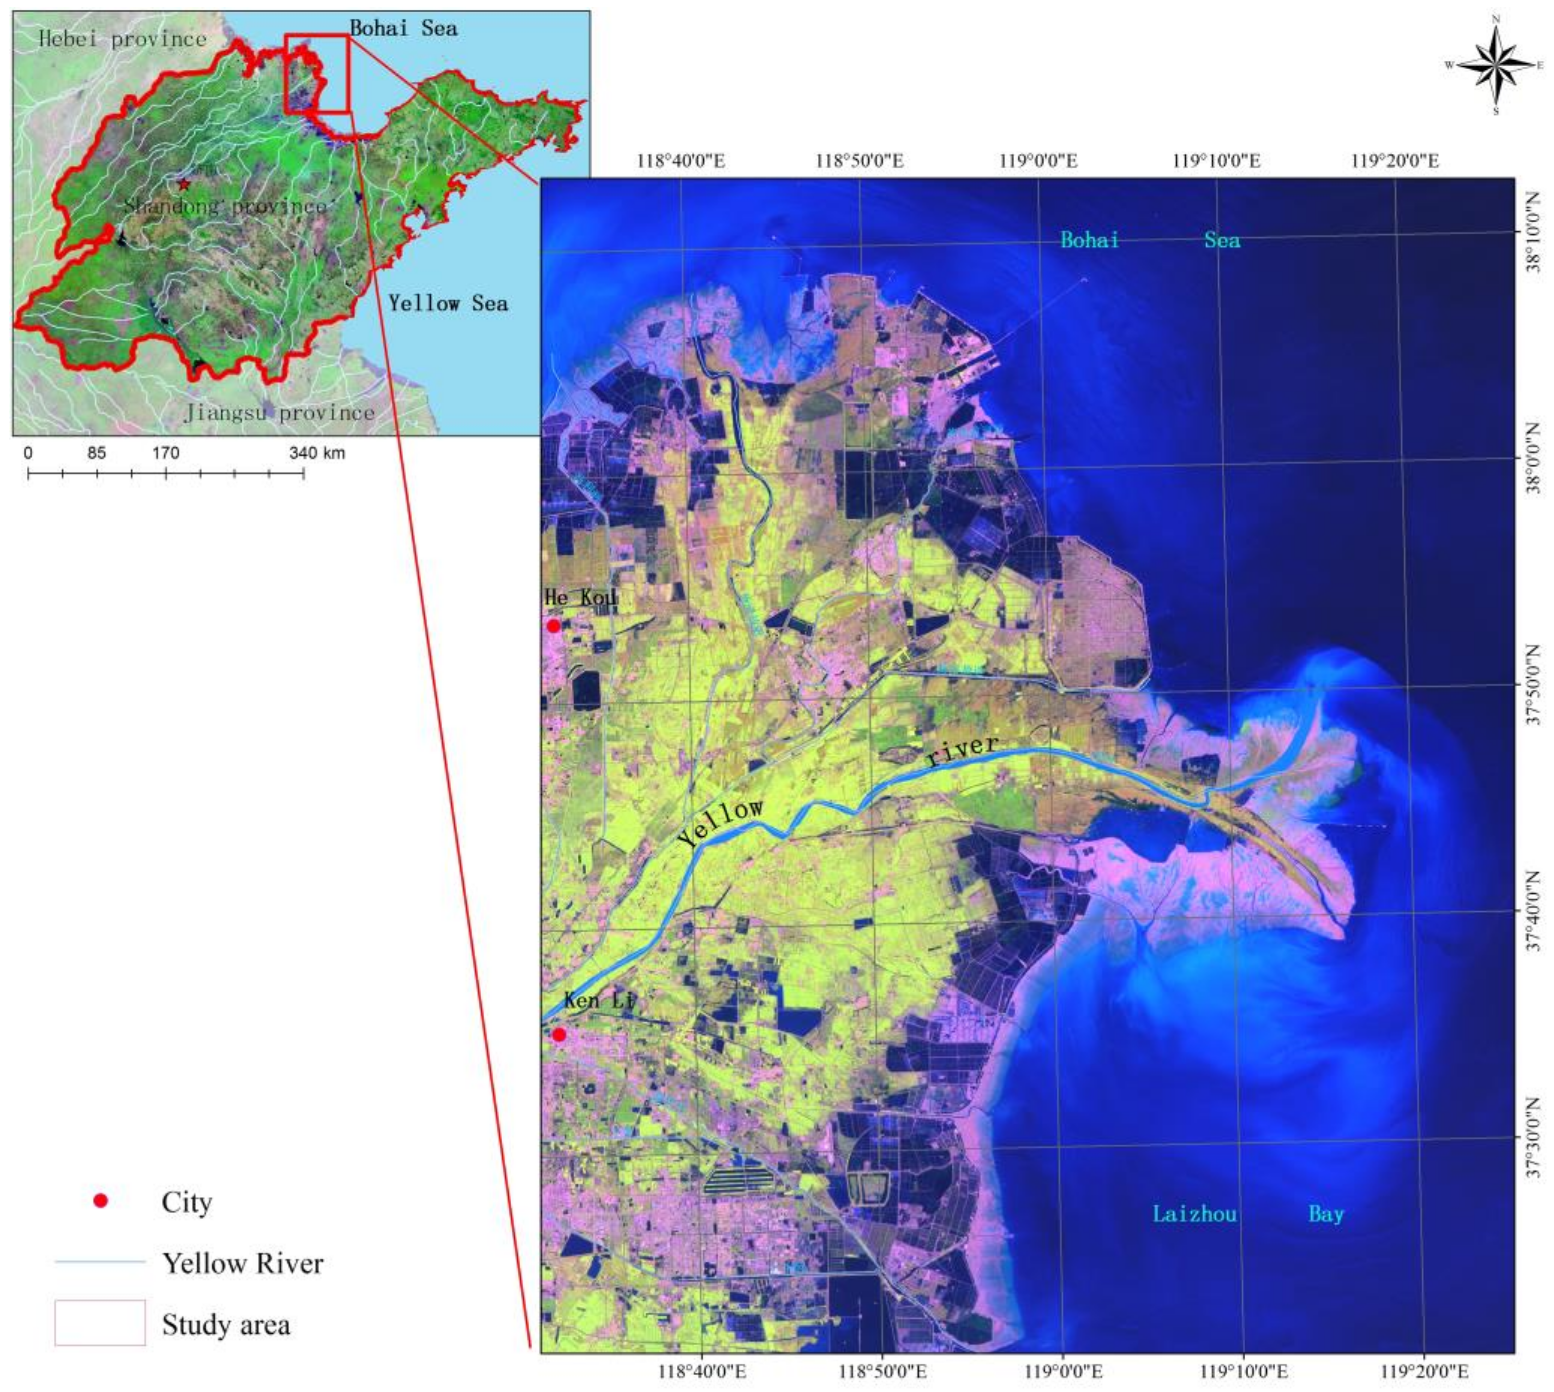
The Yellow River Delta is the fastest growing delta in the world (Figure 1); it is located in the north-east of Shandong province, China, in the estuary of the Yellow River. The wetlands of the Yellow River Delta are not only important for protection of the eco-environmental system but also for internationally endangered bird species [22,49,50]. Generally, the modern Yellow River Delta is located from Wu Hao Zhuang (north) to Song Chun Rong Gou (south) (longitude 118.30~119.30° E, latitude 37.05~38.20° N) [51]. This area has a temperate monsoon climate; the annual mean temperature is 11.9 °C and the average precipitation is about 640 mm with 196 frostless days [22,52,53]. Because of the sedimentation in the Yellow River, the sediment builds and rebuilds the delta continuously. There is an abundance of coastal wetland resources, and it has been named one of the most beautiful six wetlands in China [2].
Historically, wetlands have covered 80% of the total land area in the Yellow River Delta [2]. Natural wetlands (including lakes, rivers, marshes, swamps, lagoons, and intertidal zones) are mainly distributed in the east of the delta from the Xiaodao River to the Tuhai River. Artificial wetlands (including cultivated areas and salt pans) are primarily distributed in the mid-west of the delta. The Yellow River Delta is an important breeding ground for birds and it is a migratory stopover location. In 1992, the Yellow River Delta National Nature Wetland Reserve (YRDNNW) was established to protect the native wetland ecosystem and rare and endangered birds in the estuary. Hundreds of kinds of rare and endangered birds are found in this area every year, including nationally protected birds [22,50]. However, according to the second wetland survey report of Shandong province, the wetland has suffered tremendous degradation, but how this occurred and the causes are not clearly understood. This study addressed this challenge by using four decades of Landsat observations ranging from 1973 to 2013.
3. Materials and Methods
3.1. Data Used for Wetlands Mapping
In this research, Landsat satellite series data (MSS: Multi spectral scanner, TM: Thematic mapper, and OLI: Operational Land Imager) from the period of 1973–2013 were used to map regional wetlands. Because they are affected by phenology and precipitation, wetlands are dynamic and have seasonal changes throughout the year. Because wetlands have seasonal changes throughout the year, annual seasonal changes impact time-series change analysis. In order to ensure comparability among the results, the image acquisition time is very important. In order to ensure the comparability among the results, Landsat images from nine different points in time were selected as the main data source. These images’ acquisition times are mainly distributed in September and October (Table 1). During this period, the regional hydrological characteristics are relatively stable. These images were used to assess changes in the Yellow River Delta wetlands over the past four decades. These images, downloaded from the United States Geological Survey (USGS) website (http://glovis.usgs.gov/), have gone through radiometric calibration and geometric correction and were saved as 8-bit digital numbers (DNs) with a coordinate system of Universal Transverse Mercator (UTM).
In the preprocessing stage, all images were converted to radiance (or reflectance). The image DN-to-Lλ transform calculation was carried out using Formula (1) or (2) [54,55,56]. All images were re-projected to Lambert azimuthal equal area projection for wetlands area qualitative statistics at different times.
which is also expressed as,
where, is the spectral radiance at the sensor’s aperture in mW/(cm2·sr·μm). DN is the digital number of the quantized calibrated pixel value. is the band-specific rescaling gain factor in (mW/(cm2·sr·μm))/DN. is the band-specific rescaling bias factor in mW/(cm2·sr·μm). is the maximum spectral radiance that is scaled to . is the minimum spectral radiance that is scaled to . is the maximum quantized calibrated pixel value in DN (corresponding to ). is the minimum quantized calibrated pixel value in DN (corresponding to ).
3.2. Classification System for the Yellow River Delta Wetlands
Several classification systems have been developed to describe coastal wetlands (e.g., Ramsar Convention (Convention on Wetlands of Importance Especially as Waterfowl Habitat) wetlands classification system, Technical Specification of Survey National Wetlands Resources 2008, Chinese Wetland Remote-Sensing mapping Classification System) [14]. Each classification system has its specific purpose. In this study, the aim is to examine the status and change process of the regional wetlands. Therefore, our main concerns are the number, distribution, and composition of wetlands. In accordance with the regional characteristics and wetland types [57] and the international wetland classification system (i.e., the Ramsar), and taking into account the spectral separability on the medium resolution remotely sensed image, we classified the Yellow River Delta wetlands as natural wetlands or artificial wetlands with six subclasses (Table 2). The minimum mapping unit of the wetlands was 0.01 km2.
3.3. Wetland Automatic Classification and Updating via Transfer Learning
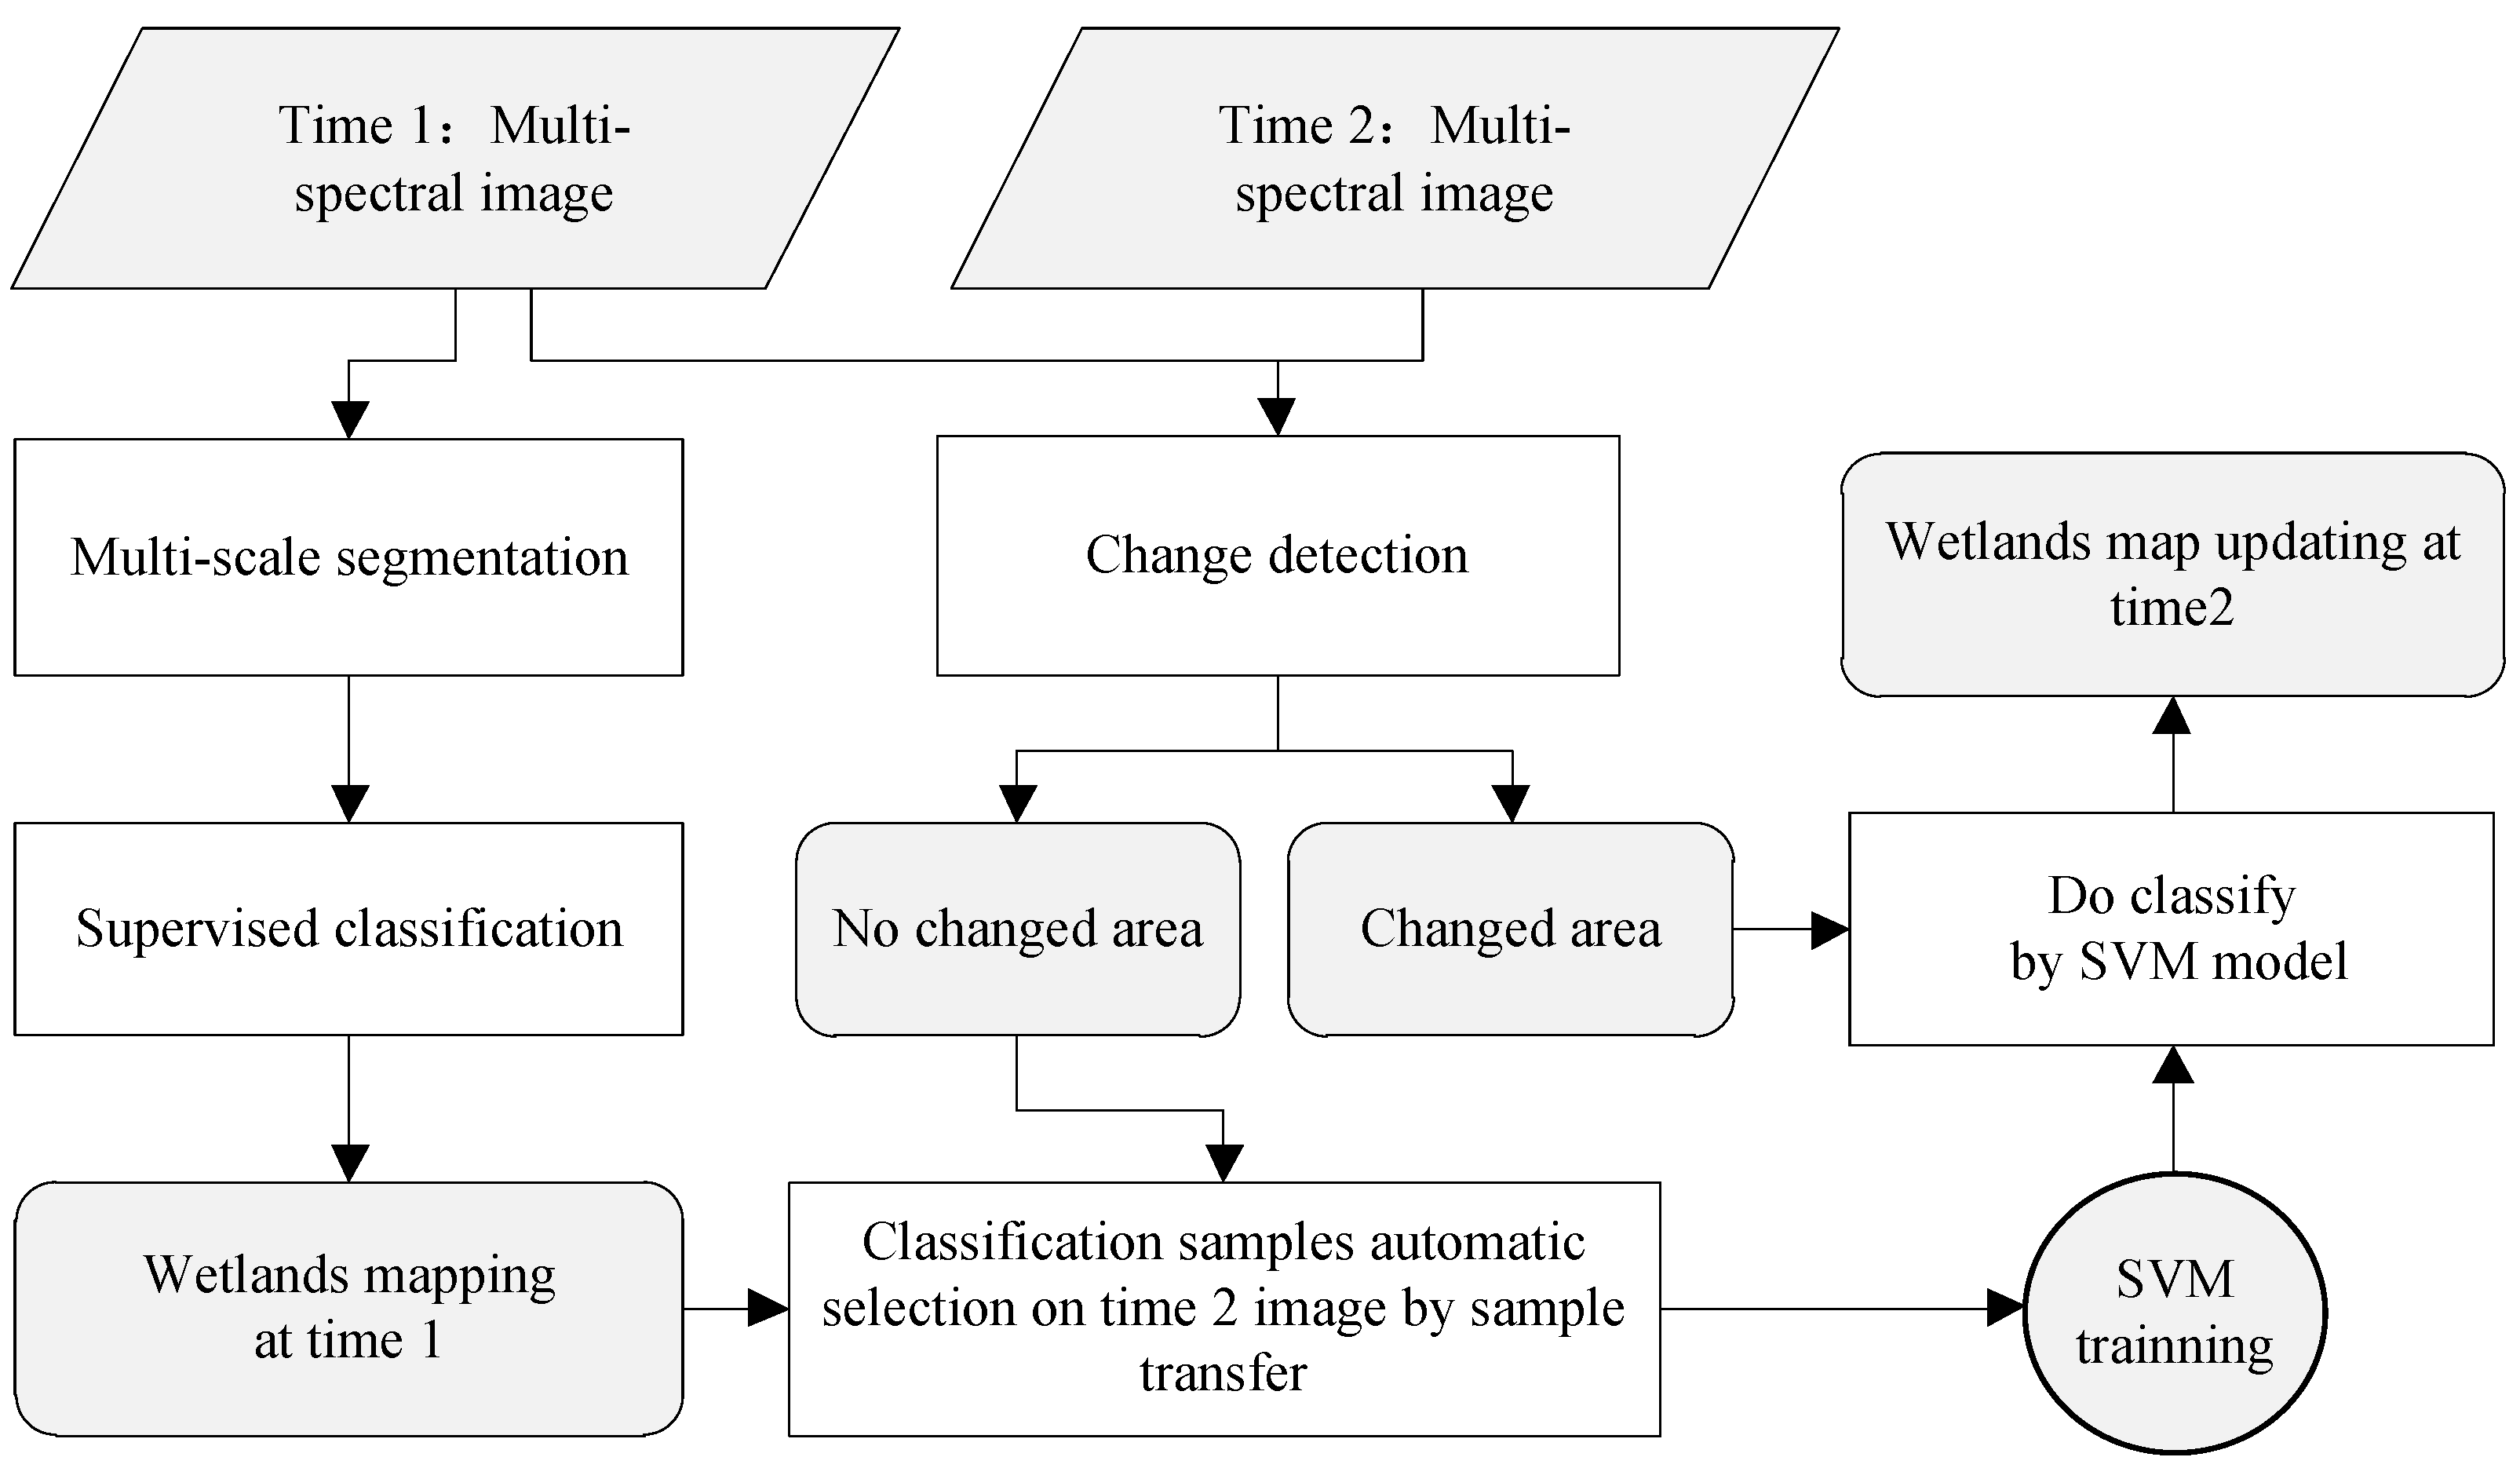
The object-oriented classification technology has many advantages, including that there are more features that can be used, it avoids salt-and-pepper noise, it is convenient for spatial relations and reasoning, and it reduces post-processing work [28]. However, the structure and spectral signature of the different wetlands are heterogeneous across space and time [27,29,58]. It is hard to select representative samples at the per-parcel level. This process requires a lot of manual intervention, which greatly affects the classification accuracy and comparability of the classification results. Therefore, the way in which to automatically select the classification of samples is the current technical obstacle [59]. This study proposed a hybrid method for automatic classification of wetland thematic maps and updating these by integrating the use of knowledge transfer and machine learning (Figure 2). To improve the automation of wetland information extraction, knowledge transfer was used to create classification training samples to aid in automatic selection.
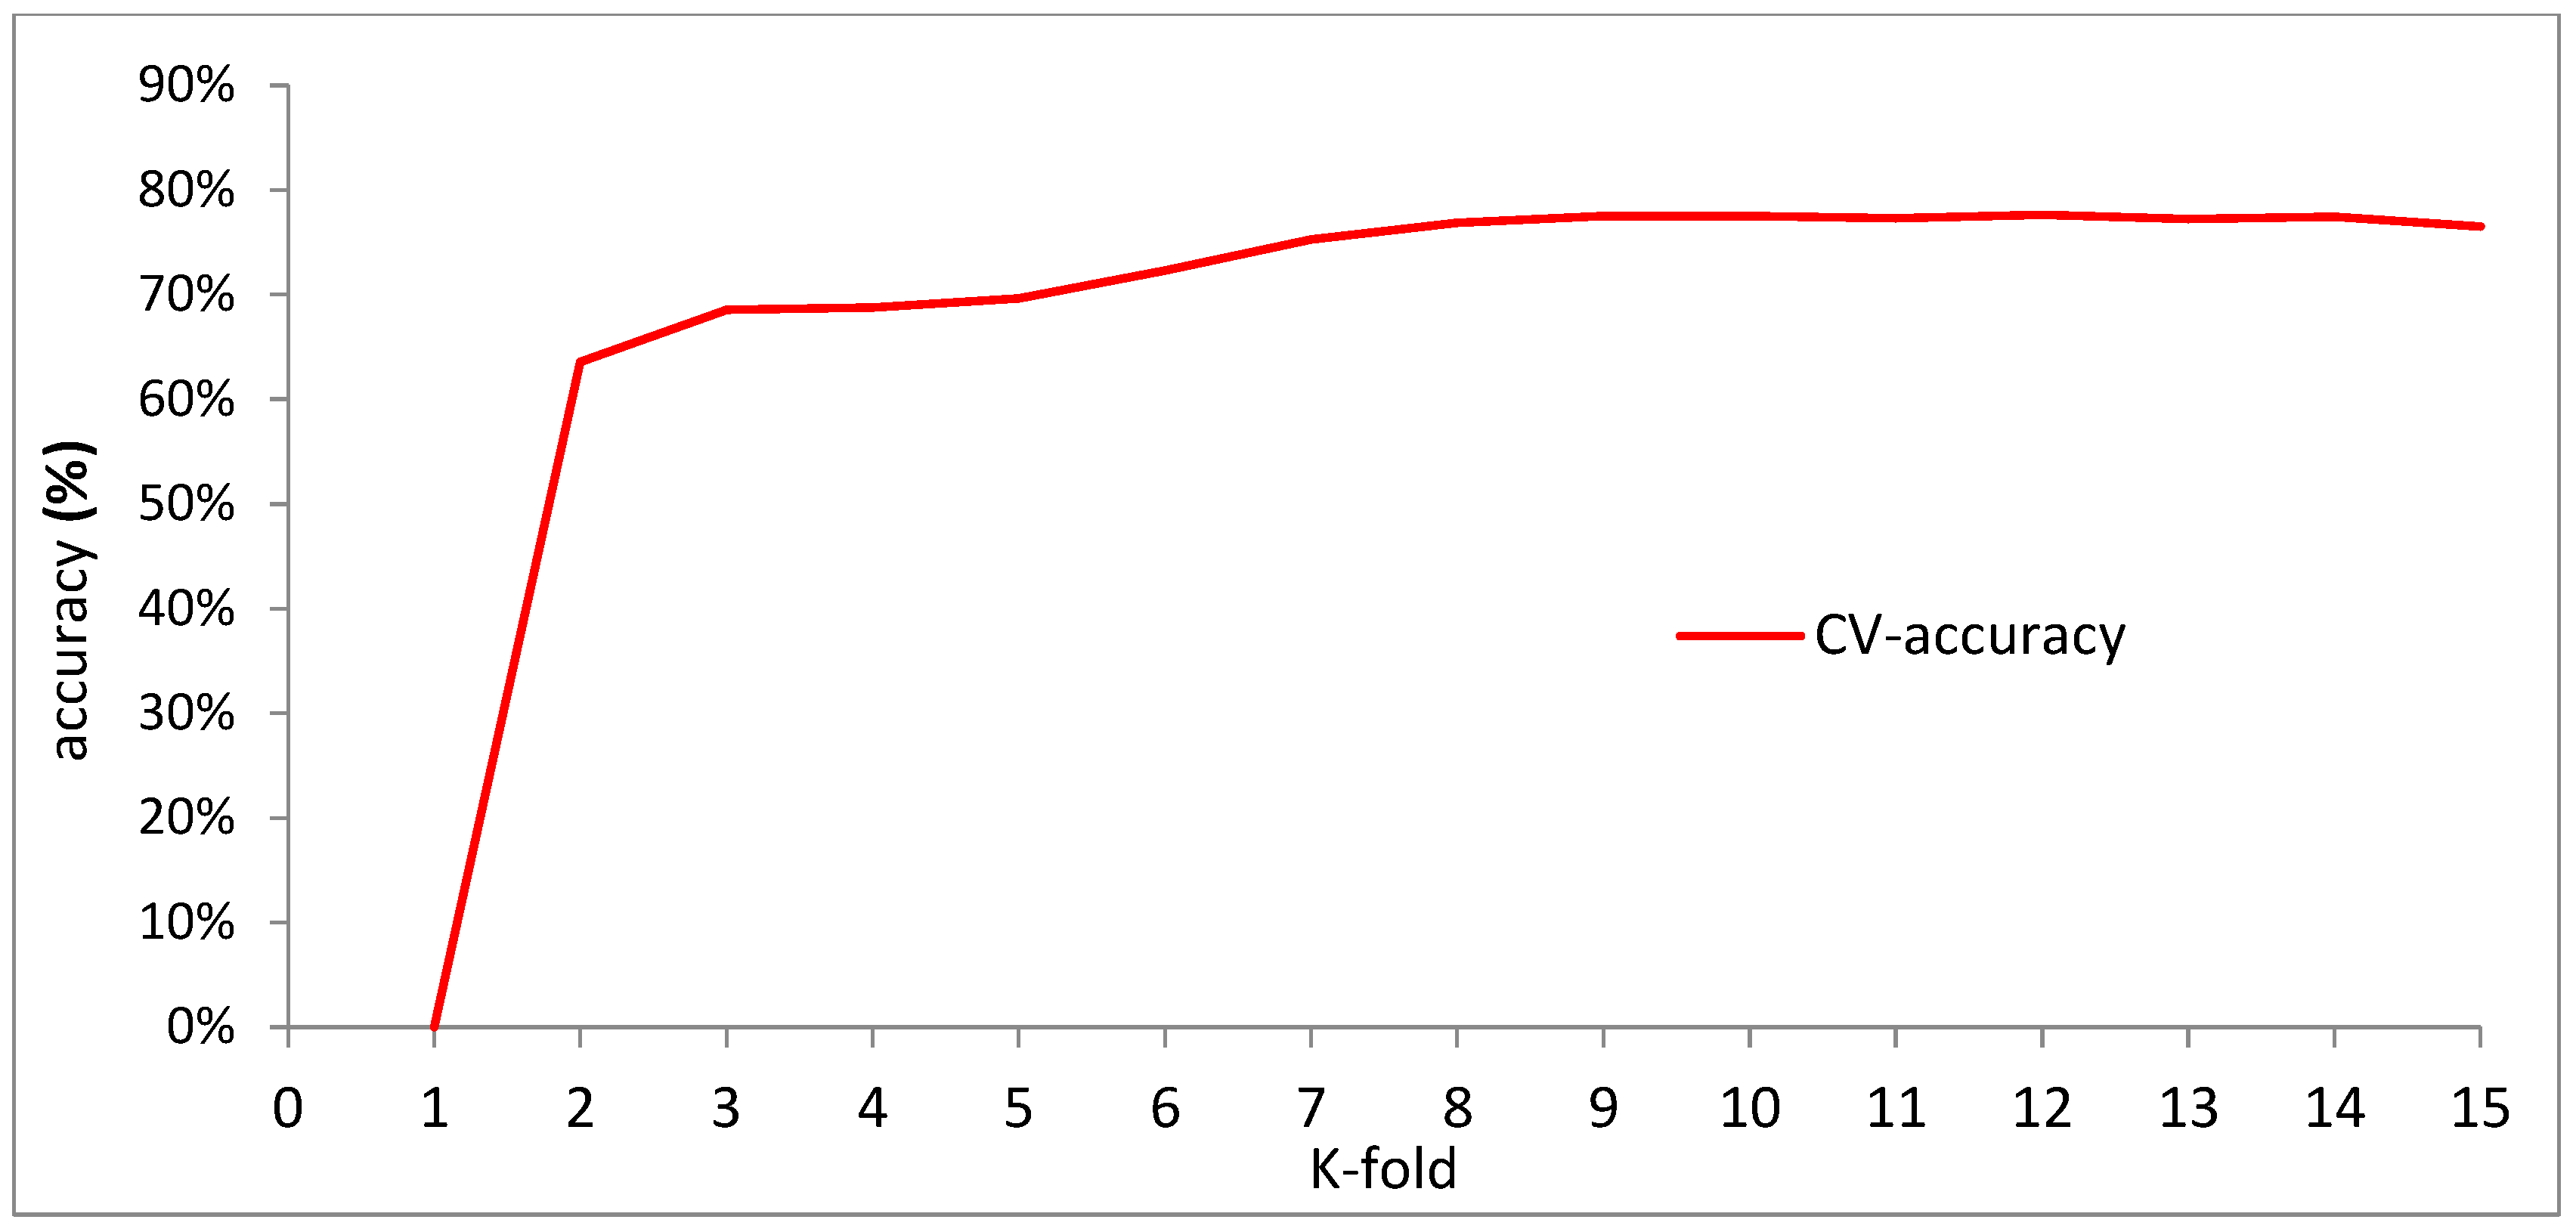
The whole procedure of wetland classification and updating through sample transfer learning can be summarized by the following six steps. In the first step, the first phase (Time 1) image is segmented and classified by a supervised method based on object-oriented classification technology. Next, change detection is calculated between the first (Time 1) and second phase (Time 2) data. The objective of this step is to detect the changed region and the unaltered area on the second phase (Time 2) image. For the third step, if there is no change area between the Time 1 and Time 2 images, then the classification of the Time 1 image is used to label the samples on the Time 2 image as unchanged areas and the classification sample automatic transfer is complete. The fourth step is the machine (SVM) learning and training. Cross-validation (CV) is mainly used to evaluate the generalization ability of machine-learning algorithms. The most commonly used cross-validation method is K-fold cross-validation. The initial sample is divided into K sub-samples. A single sub-sample is retained as the data for the validation model. The other K-1 samples are used for training. So, the new labeled samples on the Time 2 image are classified into K parts (datasets); one part is used for the SVM training and the other is used for model validation. Each time the results are verified once, and k = 10 is the optimal parameter through the trial-and-error method (Figure 3). K is greater than 10, the improvement of the classification accuracy is limited, and the training time of the model is too long. So, through the 10-fold cross-validation, the SVM model initialization training was completed. The fifth step is wetlands identification. The Time 2 image changed areas were reclassified by the trained SVM model. At this point, the wetland updating is performed automatically. The last step is wetland remote-sensing mapping on the Time 2 imagery followed by accuracy checking and validation. The results are checked by overlaying the vector of wetland thematic map on the remotely sensed image. We performed detailed manual editing of the classification results. Misclassified and missing points are corrected one by one. This is done to test the accuracy of the classification of the wetlands and to revised the intertidal zone manually according to optical remote elevation data (DEM: Digital elevation model) and the average tidal range (0.9 m). The accuracy of the wetland thematic map was assessed by comparing the map with reference data (obtained from visual interpretation and field surveys).
3.4. Wetland Change Analysis
3.4.1. Dynamic Change
To quantify the degradation of wetlands in the Yellow River Delta, the dynamic change (DC) model was implemented [60,61]. Dynamic change, also known as the change degree, is an important model for the study of wetland changes. The DC is defined as:
where DC is the dynamic change, is the initial wetland area, is the wetland area at a later time, and is the time. The DC model can describe not only the degree of wetland area variation but also the temporal features of the wetland changes.
3.4.2. Land-Use Transition Matrix
In order to better grasp the regional wetland change characteristics and reasons for change, change intensity needs to be understood, but it is also essential to know the spatial change and transformation. In this study, the land-use/cover transition matrix [62,63] was employed to analyze the theoretical frequency of inter-class conversions. Through the superposition of wetland maps from two points in time, we can find the number of mutual conversions between different types of land cover in a period of time and then reveal the spatial variation between the different types. Generally, a land-use transition matrix is expressed as a table (Table 3). In Table 3, the rows are the land types in time T1 and the columns are the land types in time T2. Pij was the area or percentage of the type Ai transformed into the type Aj between T1 and T2. Pij indicates that there was no change in area for the type Ai during the period of the time from T1 to T2.
4. Results: Long-Term Wetland Changes in the Yellow River Delta
4.1. 1973–2013 Wetlands Remote-Sensing Mapping
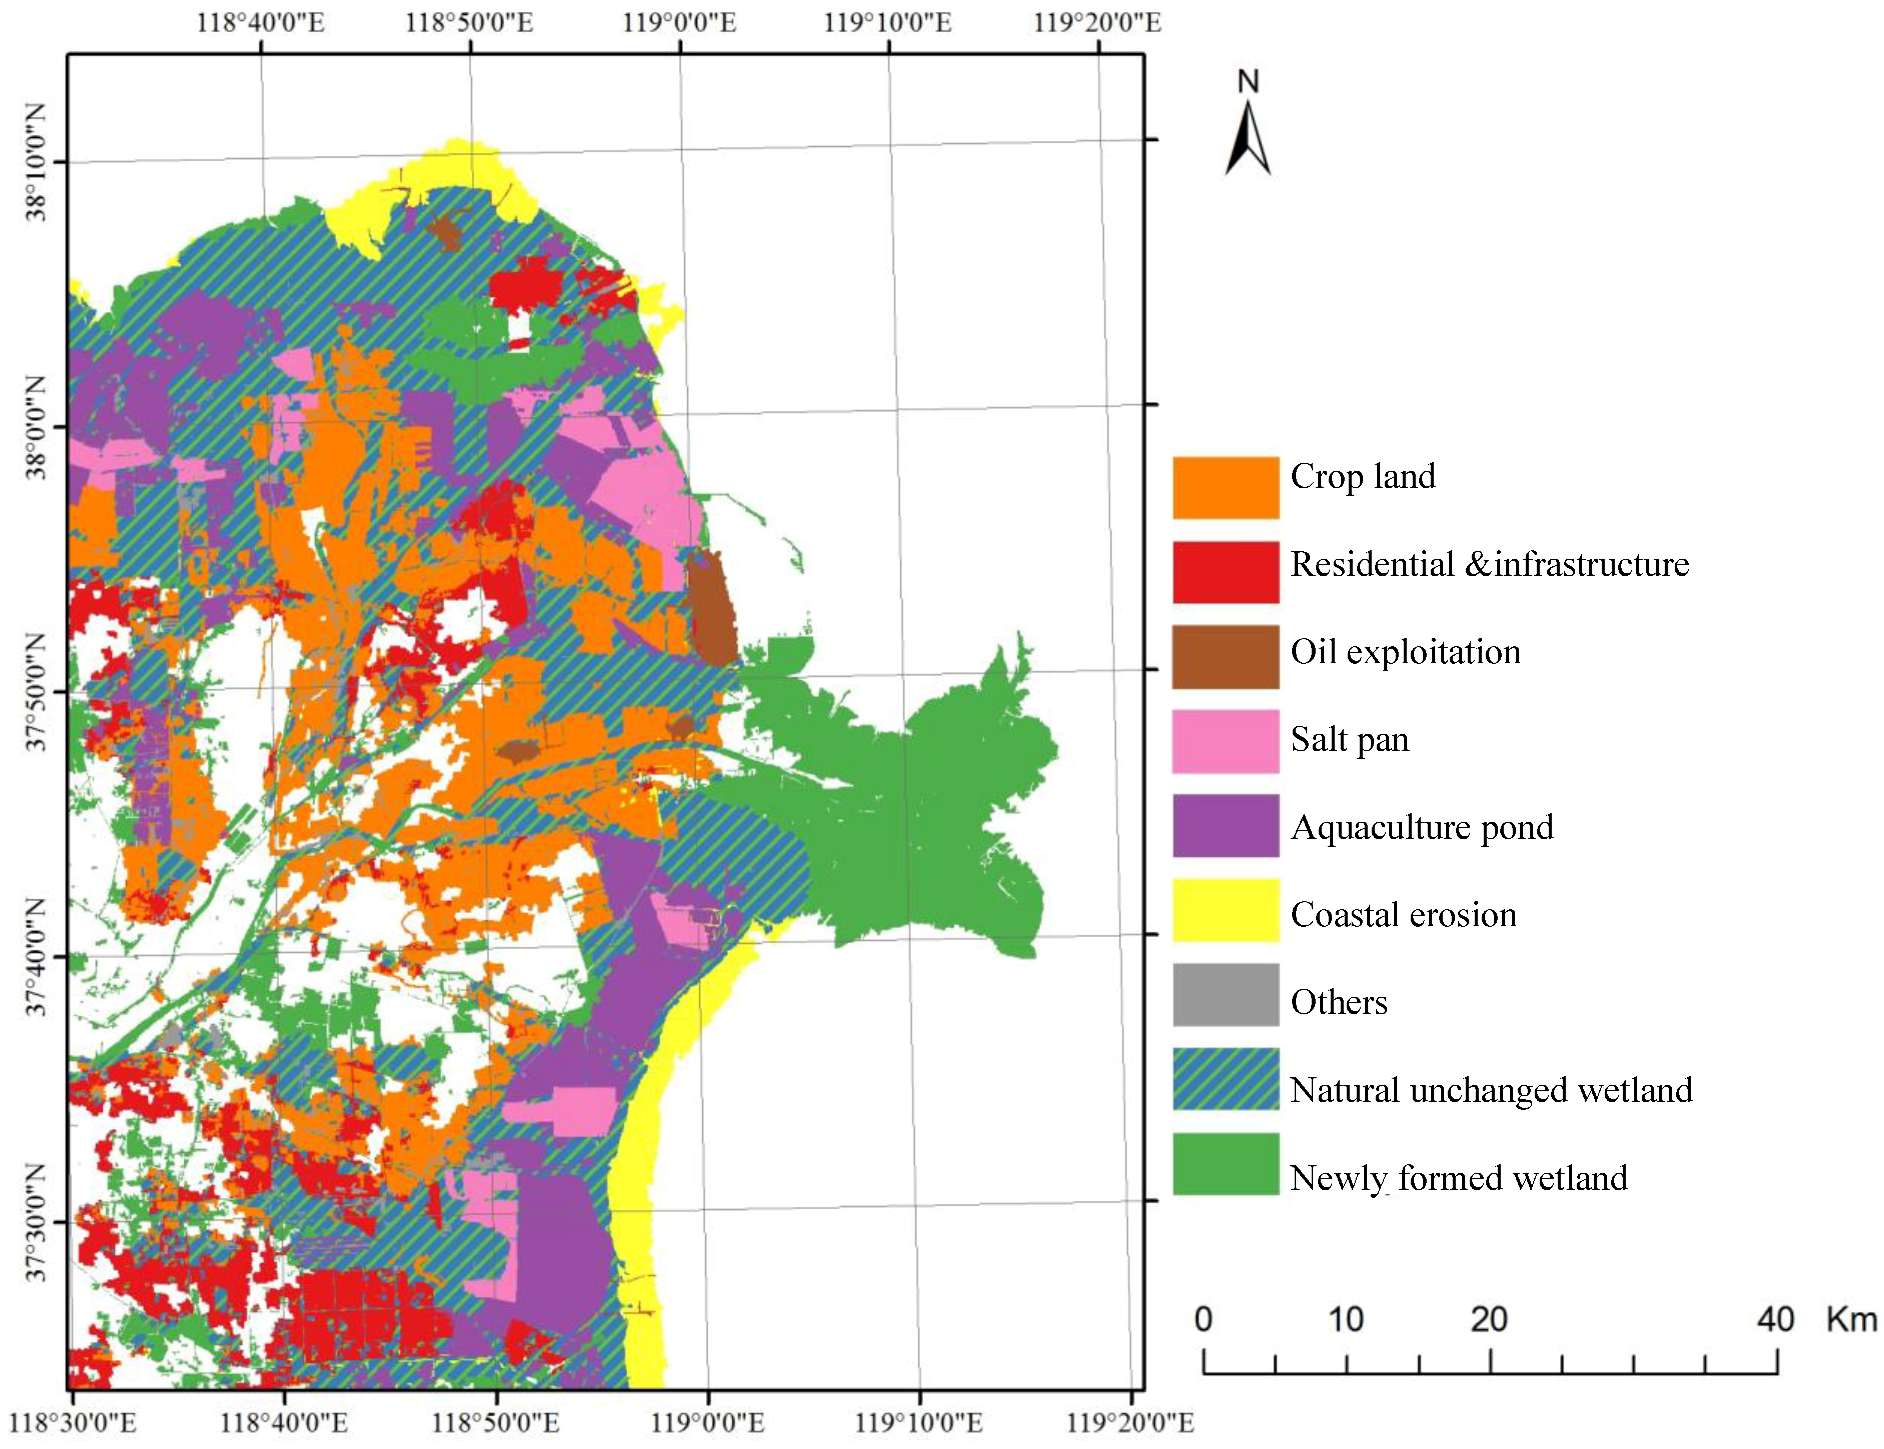
The pattern of wetlands in the Yellow River Delta has undergone a significant change over the past four decades (Figure 4). Initially (1973–1984), there were abundant natural wetlands and the landscape was relatively simple. The main wetland types were marsh and intertidal zone. There were almost no artificial wetlands. Later (1984–2013), wetland coverage was reduced markedly with a large amount of marsh and swamp degradation. Large areas of artificial wetlands appeared and added to the regional wetland landscape. The natural wetland patches were shrinking. Also, due to the sedimentation in the Yellow River and the movements of the channel, the delta area has been increasing constantly. The newly formed land contained natural wetlands at the beginning and was later dominated by human activities. This caused the shape of the delta to change continuously and the local shoreline to erode into the sea.
To ensure classification accuracy is reliable and classification results are credible, accuracy verification of results is an essential task. All results are checked by overlaying the vector of the wetland thematic map on the remotely sensed image. On that basis, through the accuracy analysis of classification maps and manual samples (manual interpretation), each phase of the classification results has a detailed accuracy assessment report (Table 4). Overall accuracy reaches 85% or more. Average producer accuracy is above 86%. Average user accuracy is above 85%. The Kappa coefficient is more than 0.80.
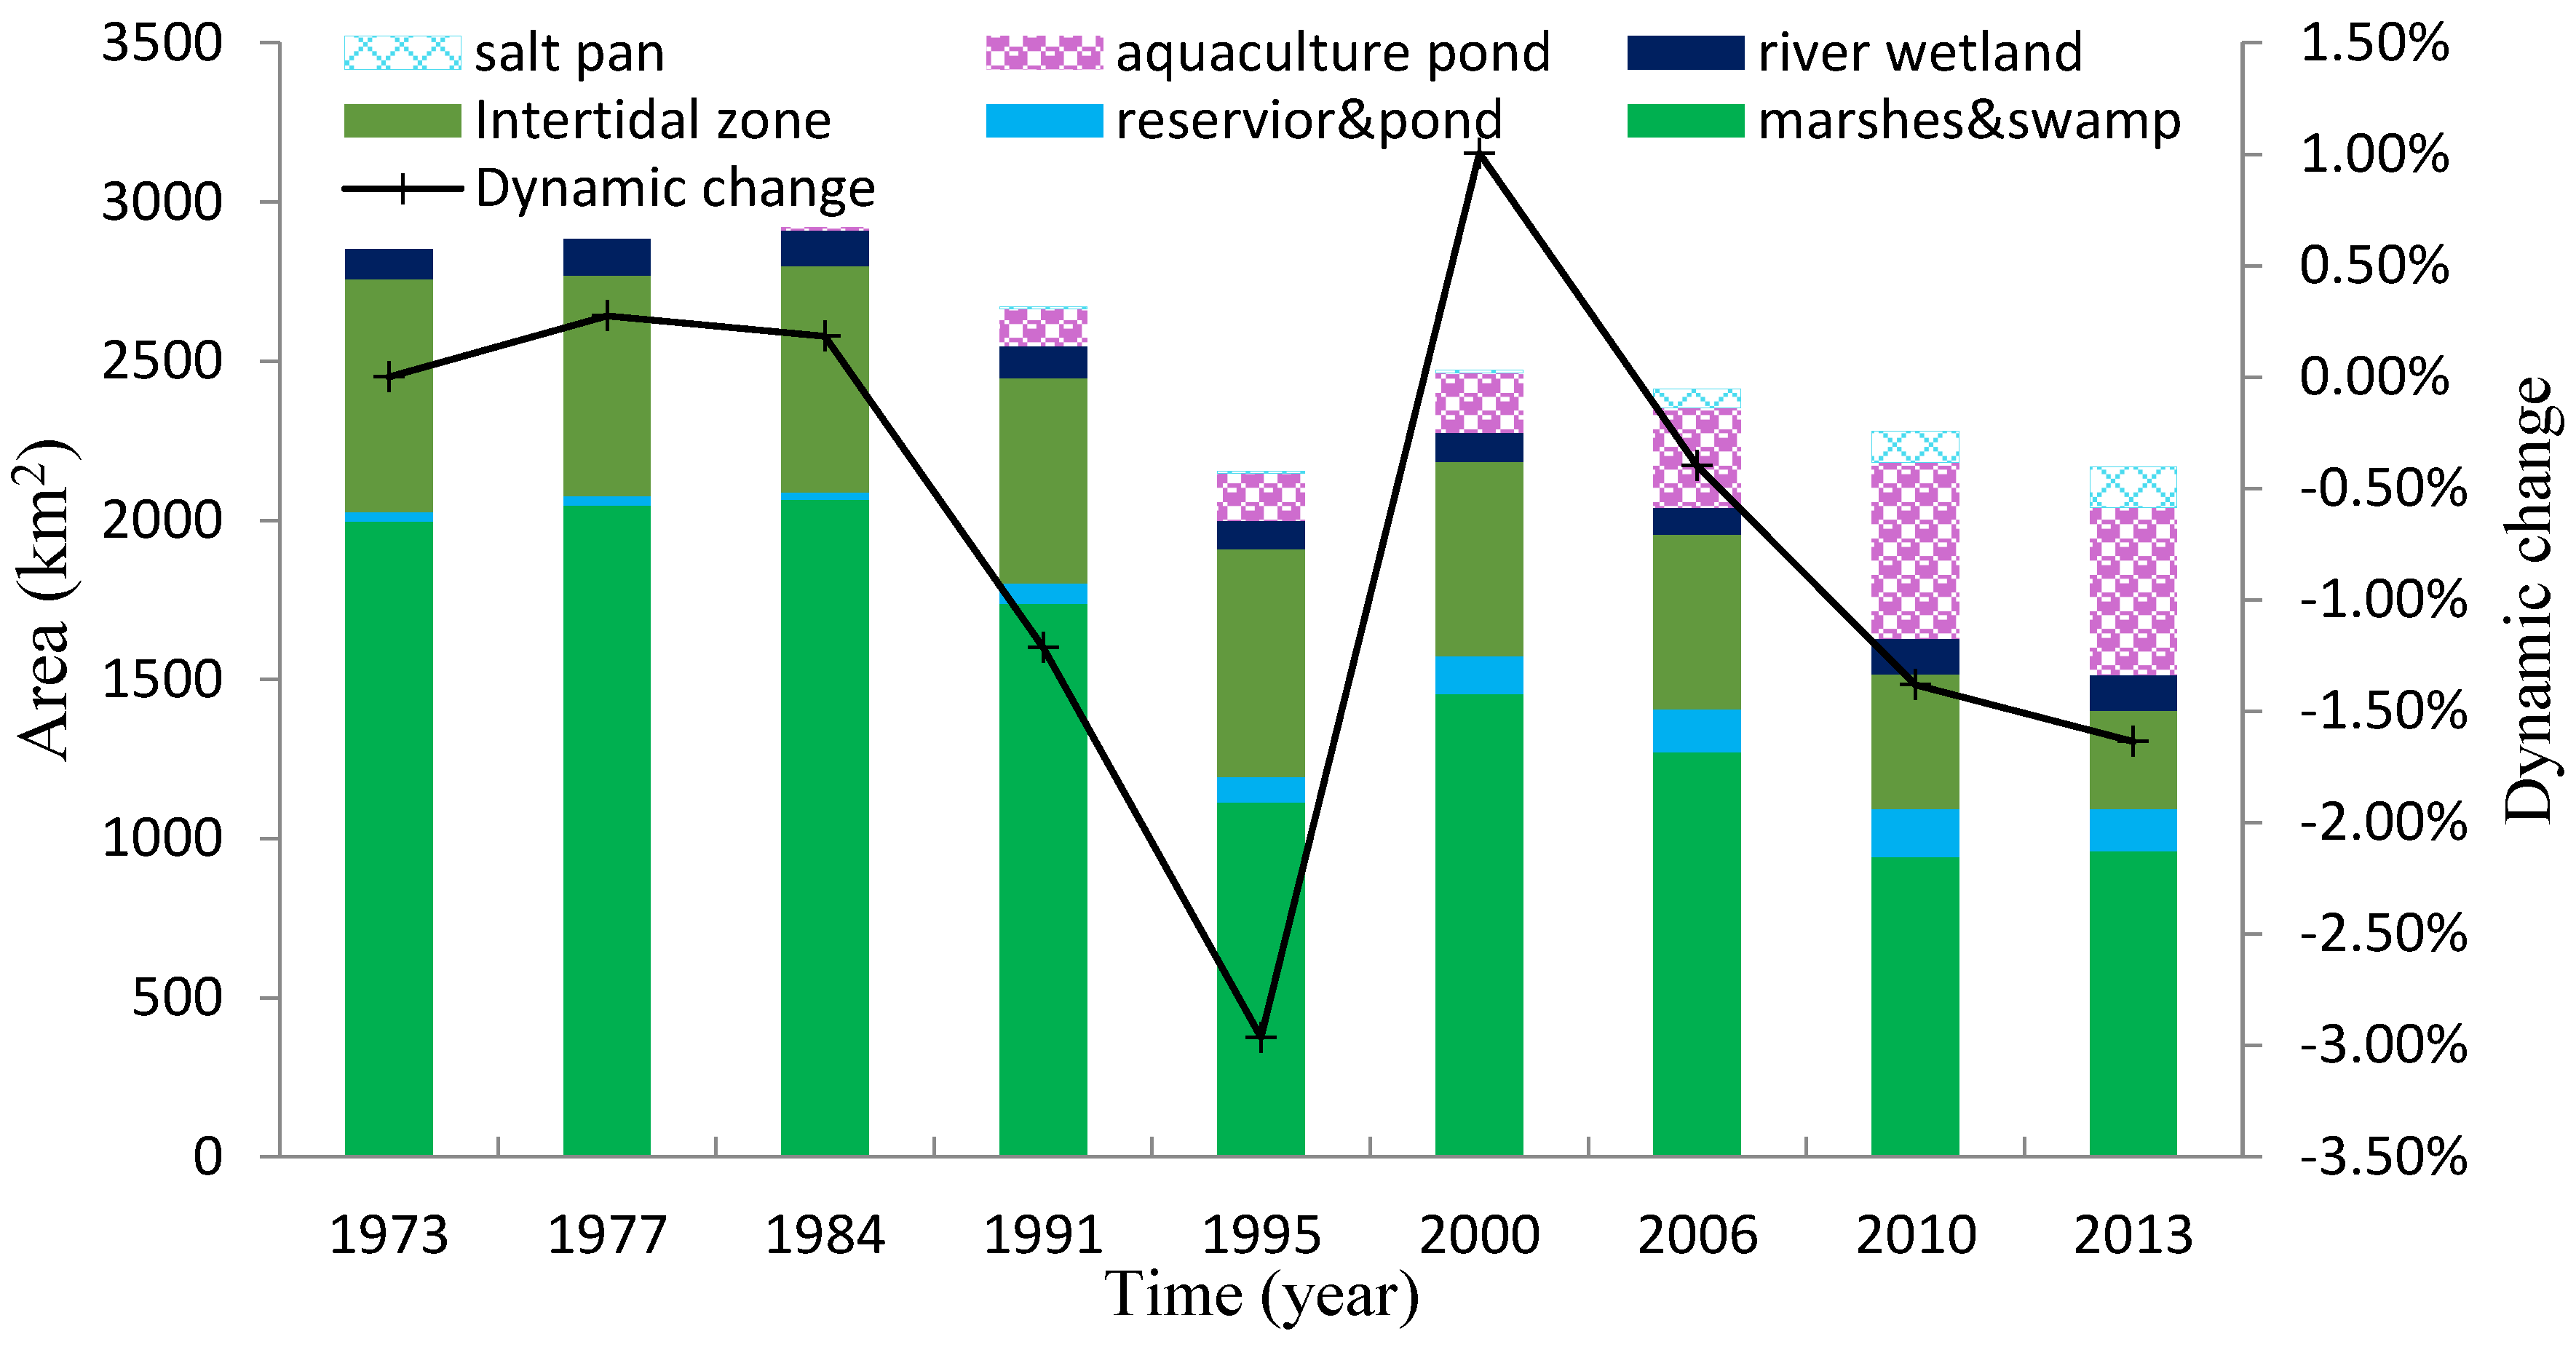
The Yellow River Delta wetlands have experienced considerable degradation from 1973 to 2013 (Figure 5 and Table 5). The total area of wetlands in this region has decreased 683.12 km2, but not all kinds of wetlands have decreased in the same way. Different types of wetlands have their own individual change characteristics. The natural wetlands decreased by 1441.5 km2 (36.04 km2·year−1 on average). The largest reduction was marsh and swamp, its total area declined by 1036.22 km2. The second largest decrease was intertidal zone (beach) and the total area decrease by 425.16 km2. Although the river wetlands experienced fluctuations from 1991–2006, the area remained relatively stable. Meanwhile, the extent of artificial wetlands has increased by 758.47 km2 (18.96 km2·year−1 on average). Specifically, aquaculture pond, salt pan, and reservoir and pond area have increased by 526.7 km2, 128.2 km2 and 103.57 km2, respectively.
4.2. Wetlands Spatio-Temporal Changes Analysis
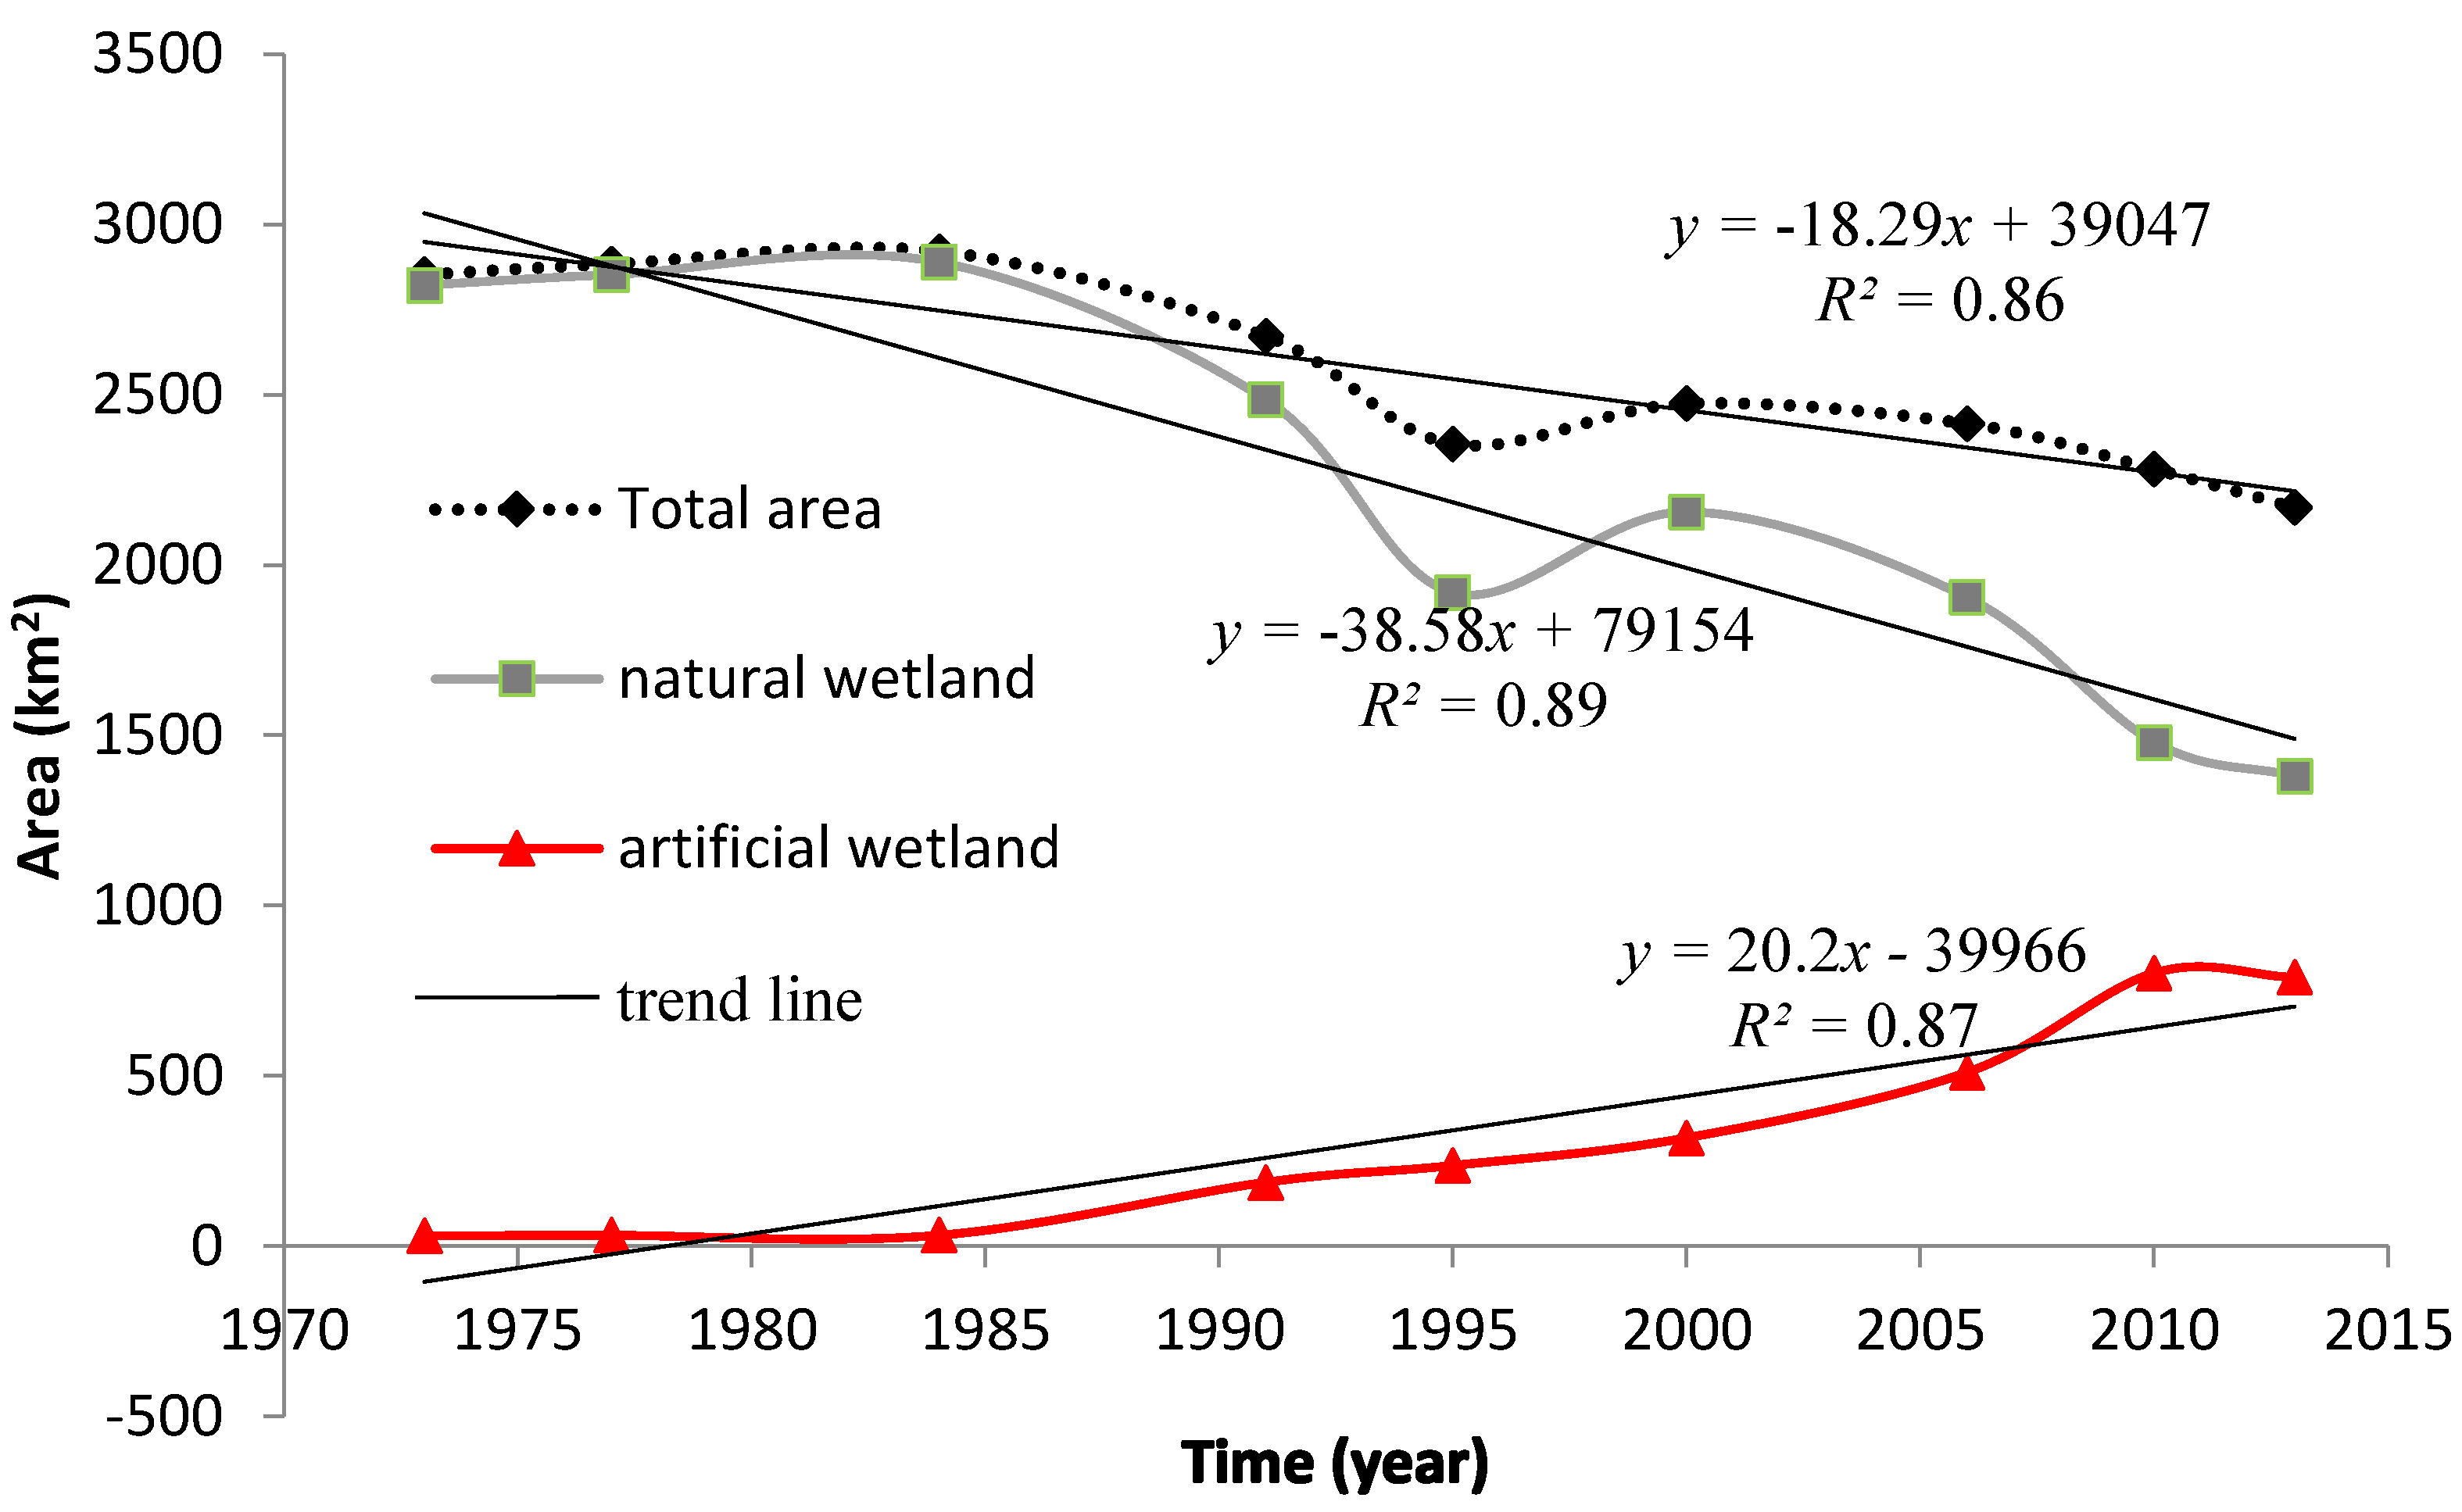
The total area of wetland was reduced by 683.12 km2; the natural wetland area decreased by 1441.59 km2, while the artificial wetland area increased by 758.47 km2 (Figure 6). The total area of wetlands in this region had a statistically significant decreasing trend (18.29 km2·year−1, p < 0.05). At the same time, the natural wetlands also had a statistically significant decreasing trend (38.52 km2·year−1, p < 0.05). Meanwhile, the area of artificial wetlands had a statistically significant increasing trend during the entire period (20.2 km2·year−1, p < 0.05). Additionally, natural wetlands had a fluctuating downward trend, but the artificial wetlands showed a steadily rising trend.
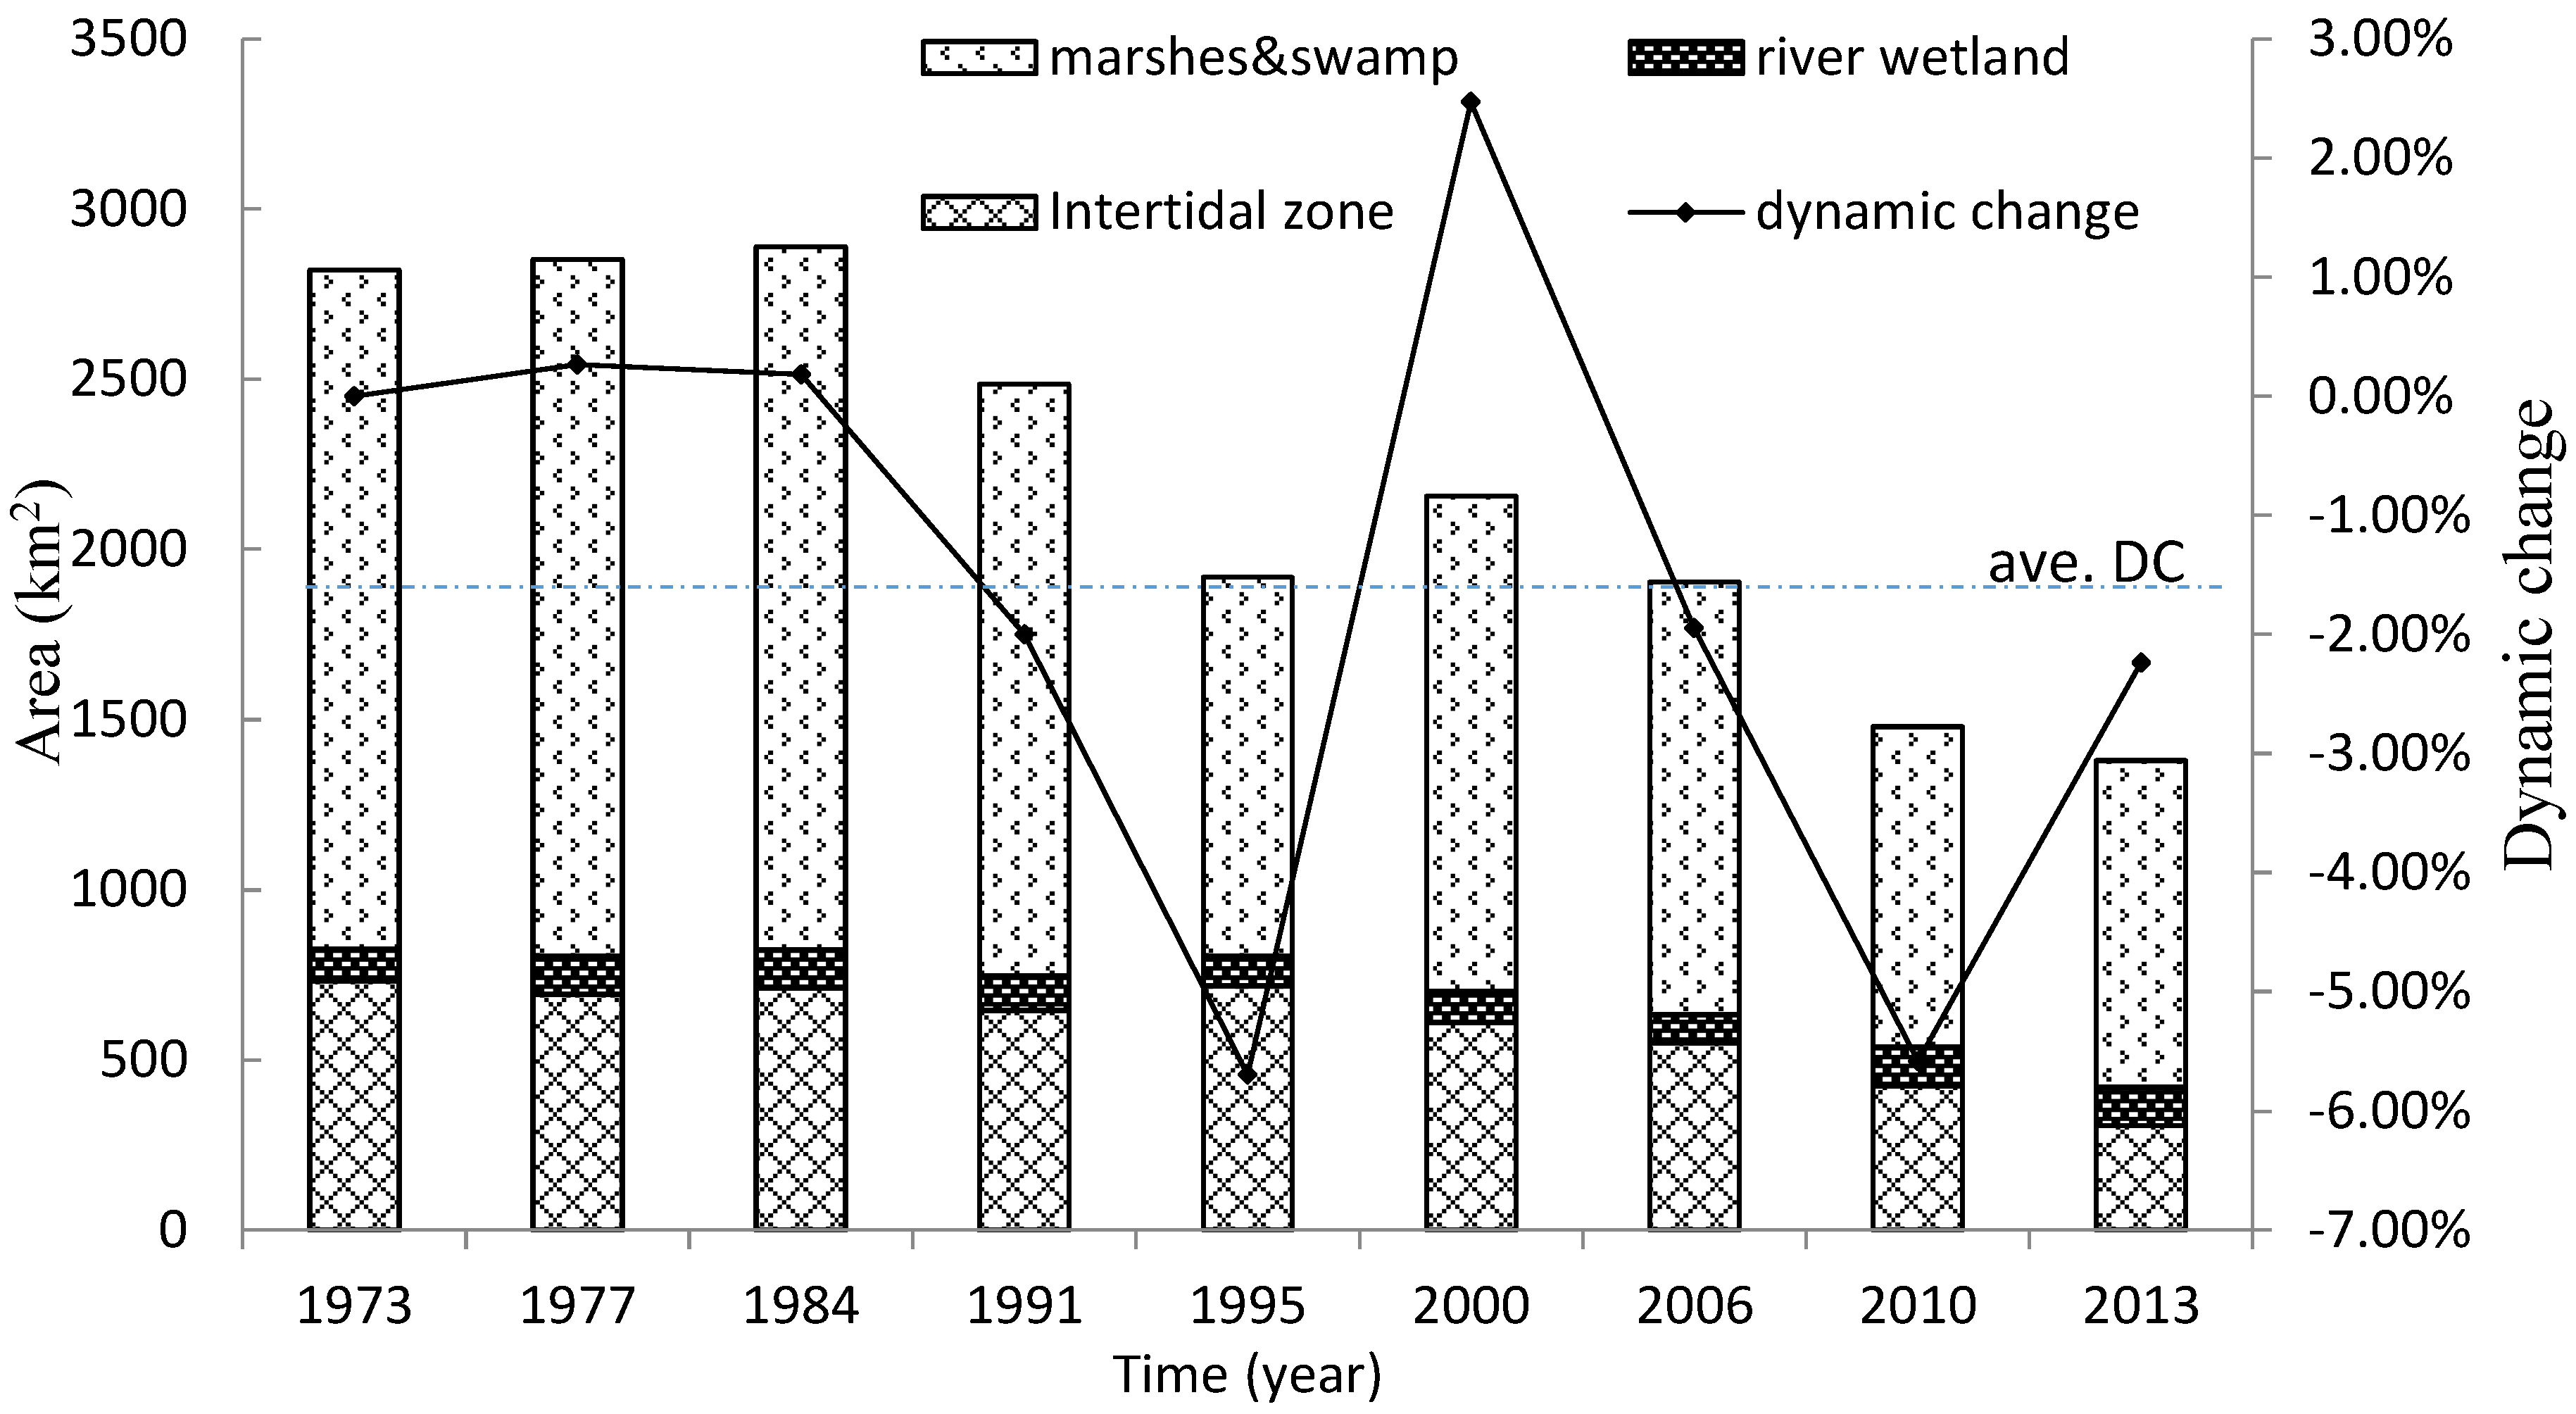
The change process had three stages: steady increase (1973–1984), sharp decline (1984–1995), and slow decrease (2000–2013). The average dynamic change rate was −1.61% (Figure 7). The marsh and swamp had the most degradation, the intertidal zone area had a steady and slow decline over the time period, and the river wetland area was relatively stable. For the artificial wetlands, the average dynamic change rate was 12.09% (Figure 8). The area of the three types of artificial wetlands increased consistently and aquaculture ponds had the biggest increase.
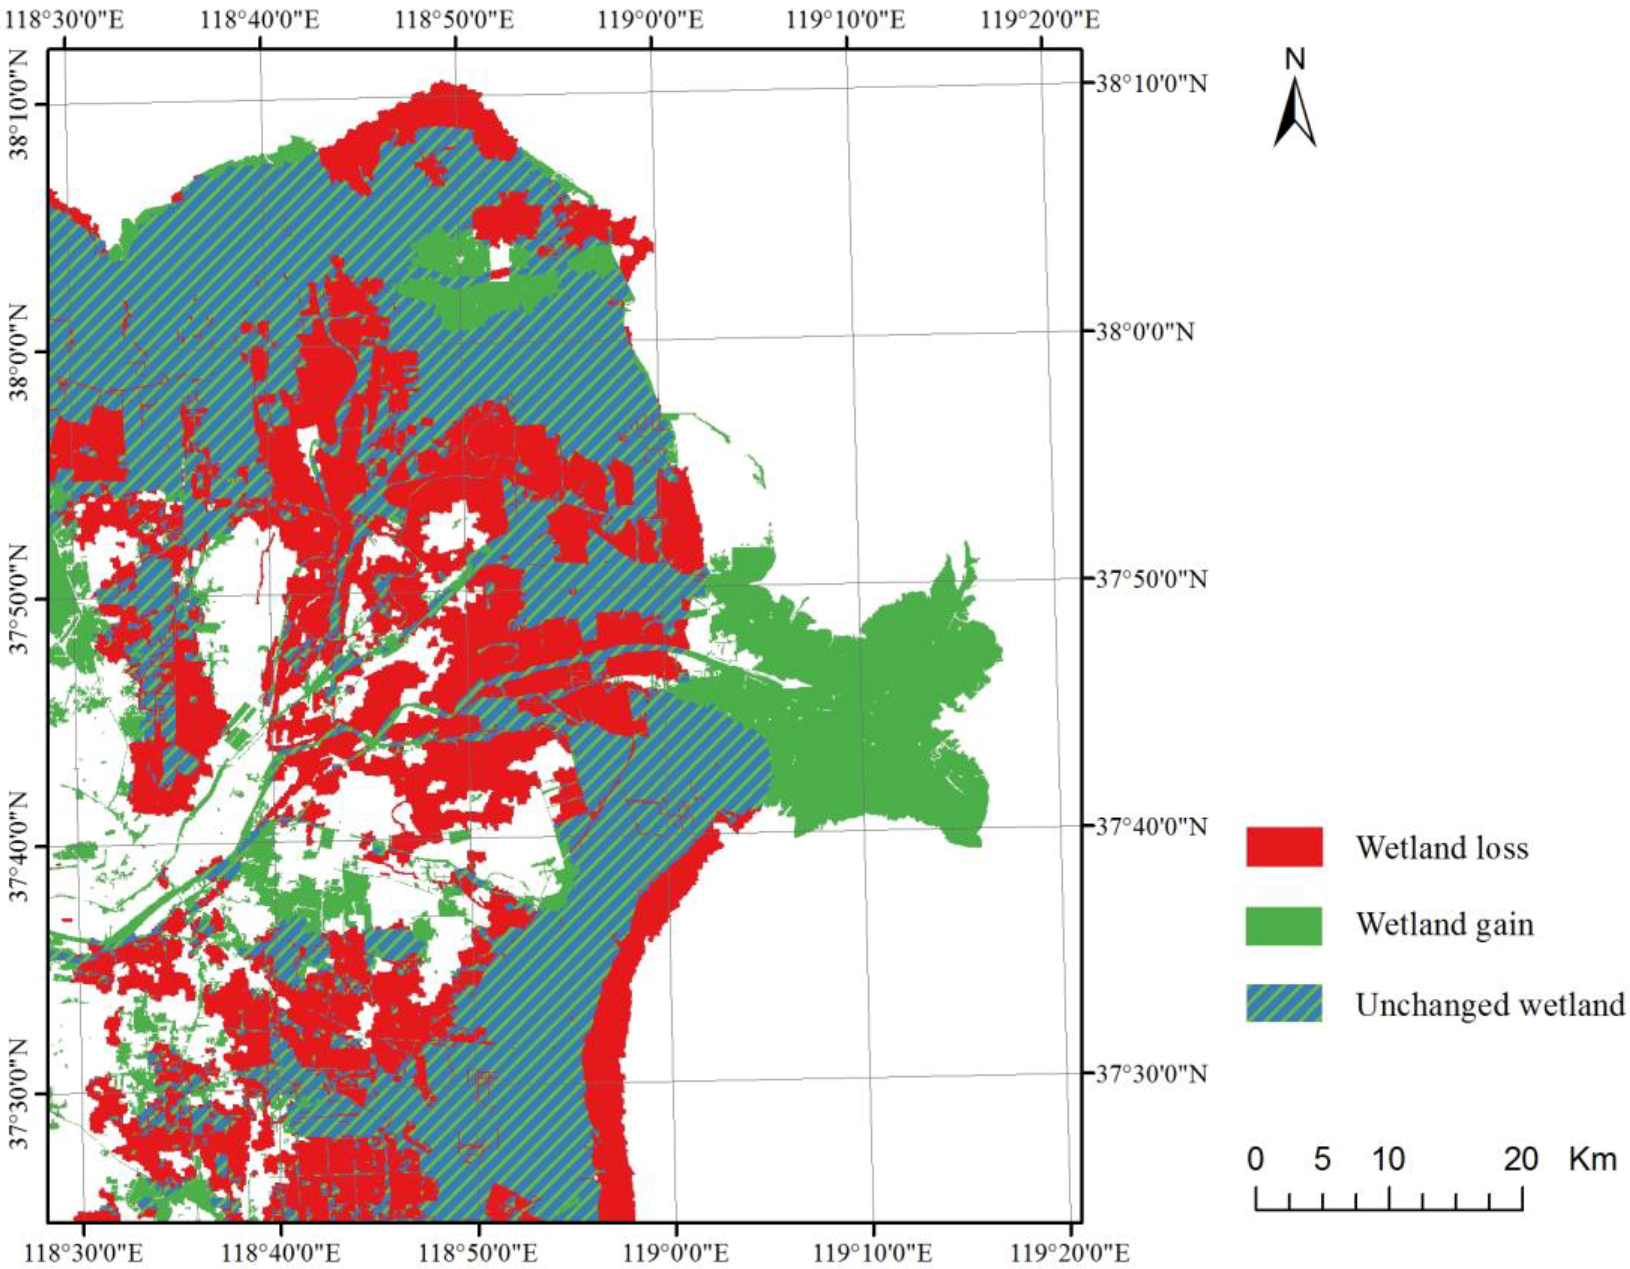
Figure 9 shows the wetland gain, loss and unchanged area. Wetland reduction areas were mainly distributed in the center of the Yellow River Delta. The area where wetlands were expanding predominantly occurred in the coastal zone and the mouth of the river. Also, natural wetland landscapes were severely destroyed. The new wetlands formed from the deposition of sediment and the creation of aquaculture. The newly formed land became colonized by natural wetlands (e.g., swamp and intertidal zone), but it was later occupied by humans and converted into other land uses.
Various natural wetlands were converted into artificial wetlands, farmland, city, and other land uses (Table 6). Firstly, a large area of river wetland became marsh and swamp (33.85%). The original ponds were primarily transformed into marsh and swamp (44.67%), aquaculture pond (16.39%), and cropland (27.46%). A large area of marsh and swamp were converted into cropland (30.08%), city (15.16%), and artificial wetland (23.18%). The intertidal zone was mainly transformed into marsh and swamp, salt pan, aquaculture pond, and oil fields. In addition, there was a large area of intertidal zone (18.84%) that converted to sea because of sediment erosion. This was another factor in the reduction of regional natural wetlands. In total, more than half of the natural wetlands have been damaged. Meanwhile, some of the shallow sea (26.99%) in the study area transitioned into marsh and swamp, intertidal zone, aquaculture pond, and other land types. This is an incremental increase for regional wetland area and effectively slows down the rate of wetland loss.
5. Discussion
5.1. Change Mode and Trend
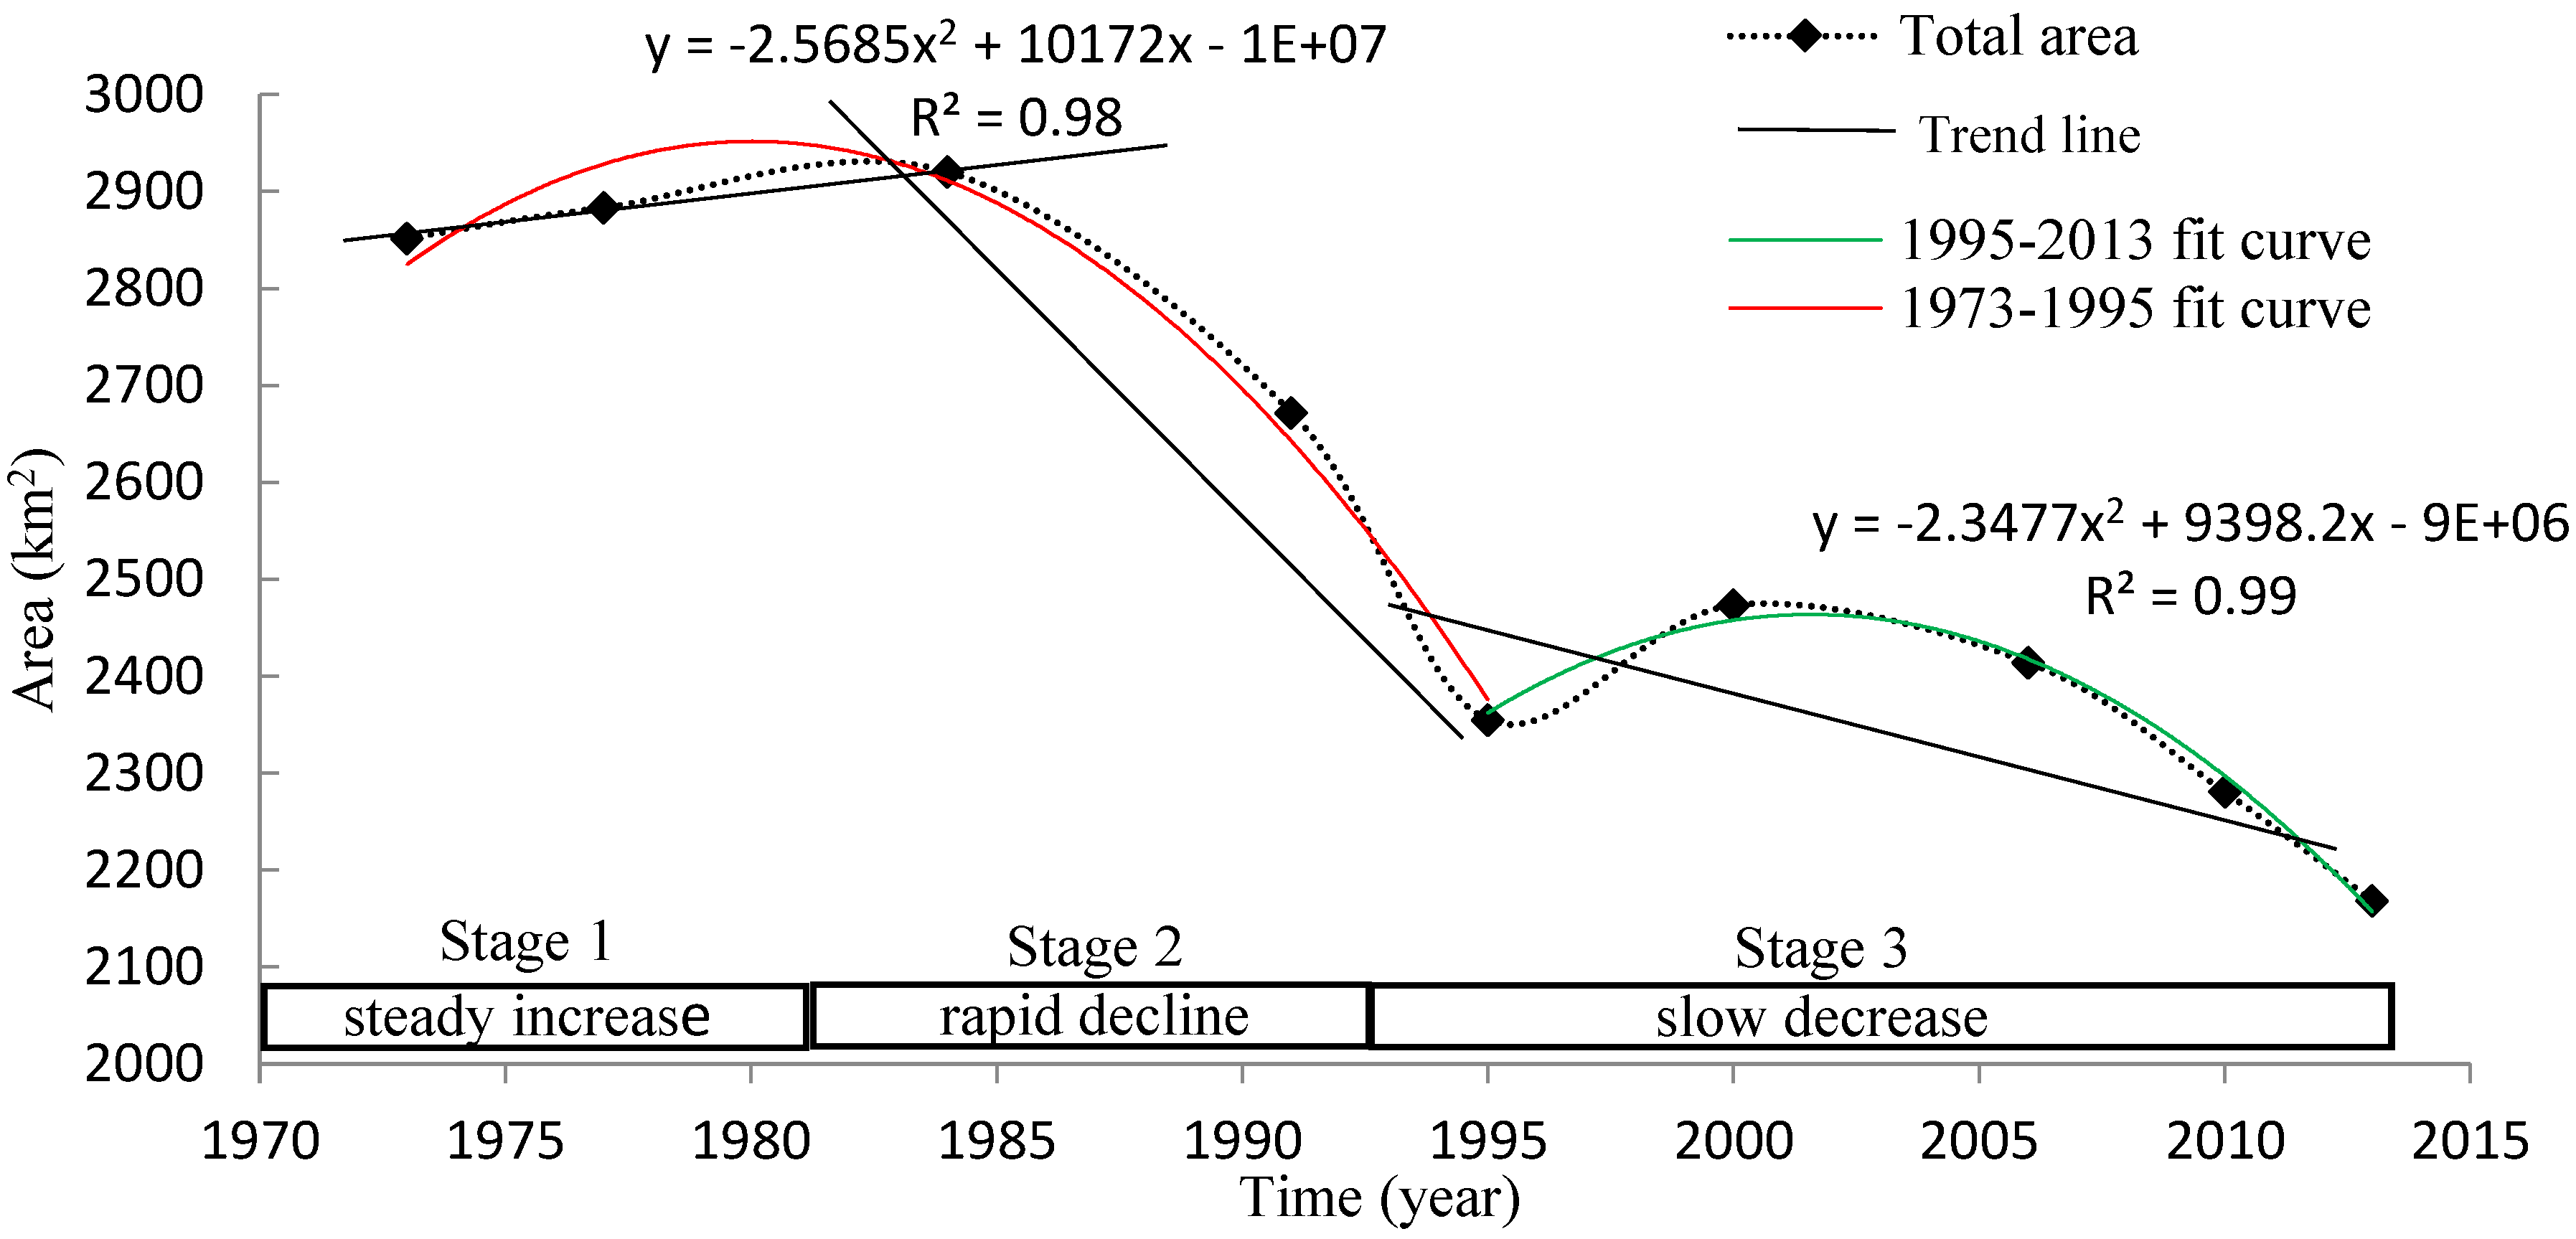
From a comprehensive analysis of the change process of the total area of wetland in the Yellow River Delta from 1973 to 2013, there are two significant turning points on the change curve (Figure 10). One is in 1984 and the other in 1995. From 1973 to 1984, the regional wetland area was steady with a small increase. Then, the total area of the regional wetlands rapidly dropped to the lowest point in 1995, followed by a little rebound in 2000. Since then, the area of regional wetlands has slowly decreased. According to these change characteristics, the entire change process can be divided into three stages: (1) Stable with a little increase (1973–1984). In this stage, the regional wetlands area steadily increased. This was possibly linked to the change in channel of the Yellow River which occurred two times during this period (1976 and 1979). (2) Rapid decline (1984–1995). In this stage, the regional natural wetlands showed a sharp decline in area. At the same time, artificial wetlands were gaining significant area. This was possibly due to the high intensity of human activity (e.g., urban construction, cropland creation, and oil exploitation). From reviewing historical literature, the lowest point of wetland area was likely around 1997, because in 1997 the amount of precipitation was very low, which resulted in the longest duration of no flow in the lower Yellow River and the river went dry in this area. Also, the area suffered a major storm surge, which resulted in the destruction of a large number of natural wetlands [57,64,65,66,67]. (3) Slow decline (1995–2013). In this stage, the wetland experienced a little improvement and then slowly decreased in area. This may be associated with the creation of regional wetland reserves and climate change. The regional wetlands had a small increase in area around 2000, which could be related to the unified water resources scheduling that began in 1999 within the watershed.
5.2. Attribution Analysis
There are many reasons for wetland degradation in the Yellow River Delta over the past decades (e.g., farmland reclamation, beach development, coastal erosion, and climate change). The original natural wetlands in the Yellow River Delta were mainly converted to cropland, aquaculture ponds, salt pans, oil fields, city, residential areas, and infrastructure (Figure 11). The reasons for this can be summarized into four major categories: (1) Human activities (e.g., farmland reclamation, beach development, hydraulic engineering, oil exploitation, infrastructure construction); (2) climate change (e.g., temperature increase, precipitation decrease, evaporation enhancement, sea-level rise); (3) the Yellow River diversion (e.g., river mouth migration, coastal erosion); (4) policies (e.g., conservation policy and management regulations, restoration projects).
5.2.1. Human Activities
Land reclamation for farming, the census data showed that the Yellow River Delta has been a key area for land reclamation. This directly resulted in a large number of low-lying swamps being drained and converted into farmland. In the late 1990s, in particular, there was an increase in cotton production, so a lot of swamp land was transformed into cotton fields [68]. Beach resource development, aquaculture, and salt production have been the major development activities in the Yellow River Delta tidal flat for a long time. Beach aquaculture was developing rapidly (mainly shrimp farming, tilapia, and artemia) in the mid-to-late 1980s, and the area of the aquaculture ponds increased exponentially. A census of the aquaculture area showed that the area increased 10-fold in the estuary region between 1995 and 2002 [67]. Additionally, Dongying city has a long history of salt production. The city had 34 raw salt production fields, a total salt area of 10.82 km2 in 1983, and by 2000, the area reached 70.72 km2 [67]. To create these salt fields, a large area of natural wetlands was changed to artificial wetland. This is why the natural wetland loss rate was 50.55% from 1973 to 2013, but the total area of wetland only decreased by 23.95%.
Oil exploitation, the Yellow River Delta was a critical oil production location in China. Shngli oilfield has been exploring and developing since 1961 and has become China’s second largest crude oil production location. With the discovery and exploitation of new oilfields, the invasion and destruction of wetlands were inevitable [22,57]. The area of the Shengli oilfield increased by 2.28 times from 1984 to 2001, with a total area of 853 km2 in Dongying City [69]. The competition between oil production and wetland protection cannot be reconciled in the short-term. Water conservancy construction, as a result of an increase in water demand by industry and agriculture, a large number of water storage and water diversion projects have been built in the Yellow River Basin. At present, the Yellow River Basin has more than 10,000 water storage projects and over 3 million water pumping projects [67]. The volume of water diverted reached 4.7 × 10¹⁰ m3 in the 1990s [67,70]. The various water conservation projects allowed a rapid increase in water consumption and increased the competition between water supply and demand in the basin. In 1972, part of the Yellow River channel dried up. Thereafter, periods when no water reached the lower part of the Yellow River became a common phenomenon; from 1972–1999, this occurred 22 times. The most extreme occurrence of the river water drying up was in 1997, lasting 226 days and with no water in the channel up to 704 km up stream [65,66,67,71]. The absence of water in the Yellow River fundamentally changed the water environment of the delta and directly resulted in loss in the regional ecosystem, deterioration, and irreversible damage [72]. Because there is less water, it is bringing less sediment to the area [67,73]. This not only slowed down the sedimentation, but also reduced the area of newly formed coastal wetlands. It directly threatened the coastal wetland ecosystem [57,72,74].
Additionally, economic development, population growth, and urban expansion, especially the development of the Shengli oilfield, caused a number of wetlands to be destroyed by the building of roads, dams, ports, and other infrastructure [7,8,22,75,76]. The integrity of the wetlands has been undermined due to the infrastructure construction and the original wetland landscape has become increasingly degraded and fragmented. Overall, this research has shown that human activities were the main driver of wetland landscape changes in the Yellow River Delta [22,77,78].
5.2.2. Climate Change
Global warming has been accelerating sea-level rise, which has led to the submersion of low-lying areas of coastal wetlands [79,80]. According to the China Sea Level Bulletin 2016, China’s sea-level rise is generally higher than the global average over the period from 1980 to 2016 (3.2 mm/a) [81]. In the Yellow River estuary coastal district, the relative increase in sea level over the past 30 years was 4.5–5.5 mm/a, including regional crustal subsidence [82]. Climate warming has also led to the redistribution of water resources and exacerbated regional water resource imbalances. During the period from 1961 to 2010, the annual average temperature in the coastal wetlands of the Yellow River Delta increased by 1.85 °C, while the annual precipitation decreased by 121.42 mm [83]. A large number of studies have shown that over the past four decades precipitation decreased in the Yellow River Basin and the area showed a warm and dry trend [83,84,85,86]. The precipitation in the upper and middle reaches of the river has decreased due to the warm and dry regional climate. Meanwhile, the water demand for industry and resident life increased, which accelerated the crisis of the downstream ecological water resources. The annual flow of the Yellow River has decreased dramatically in the past decade, and the flow has a significant negative correlation with the temperature and positive correlation with precipitation [49,86,87,88,89,90]. Climate change was a long-term critical impact factor on the reduction of flow. However, it is understood that water diversion was the main cause of the flow changes in the lower reaches of the Yellow River [91].
5.2.3. Yellow River Diversion
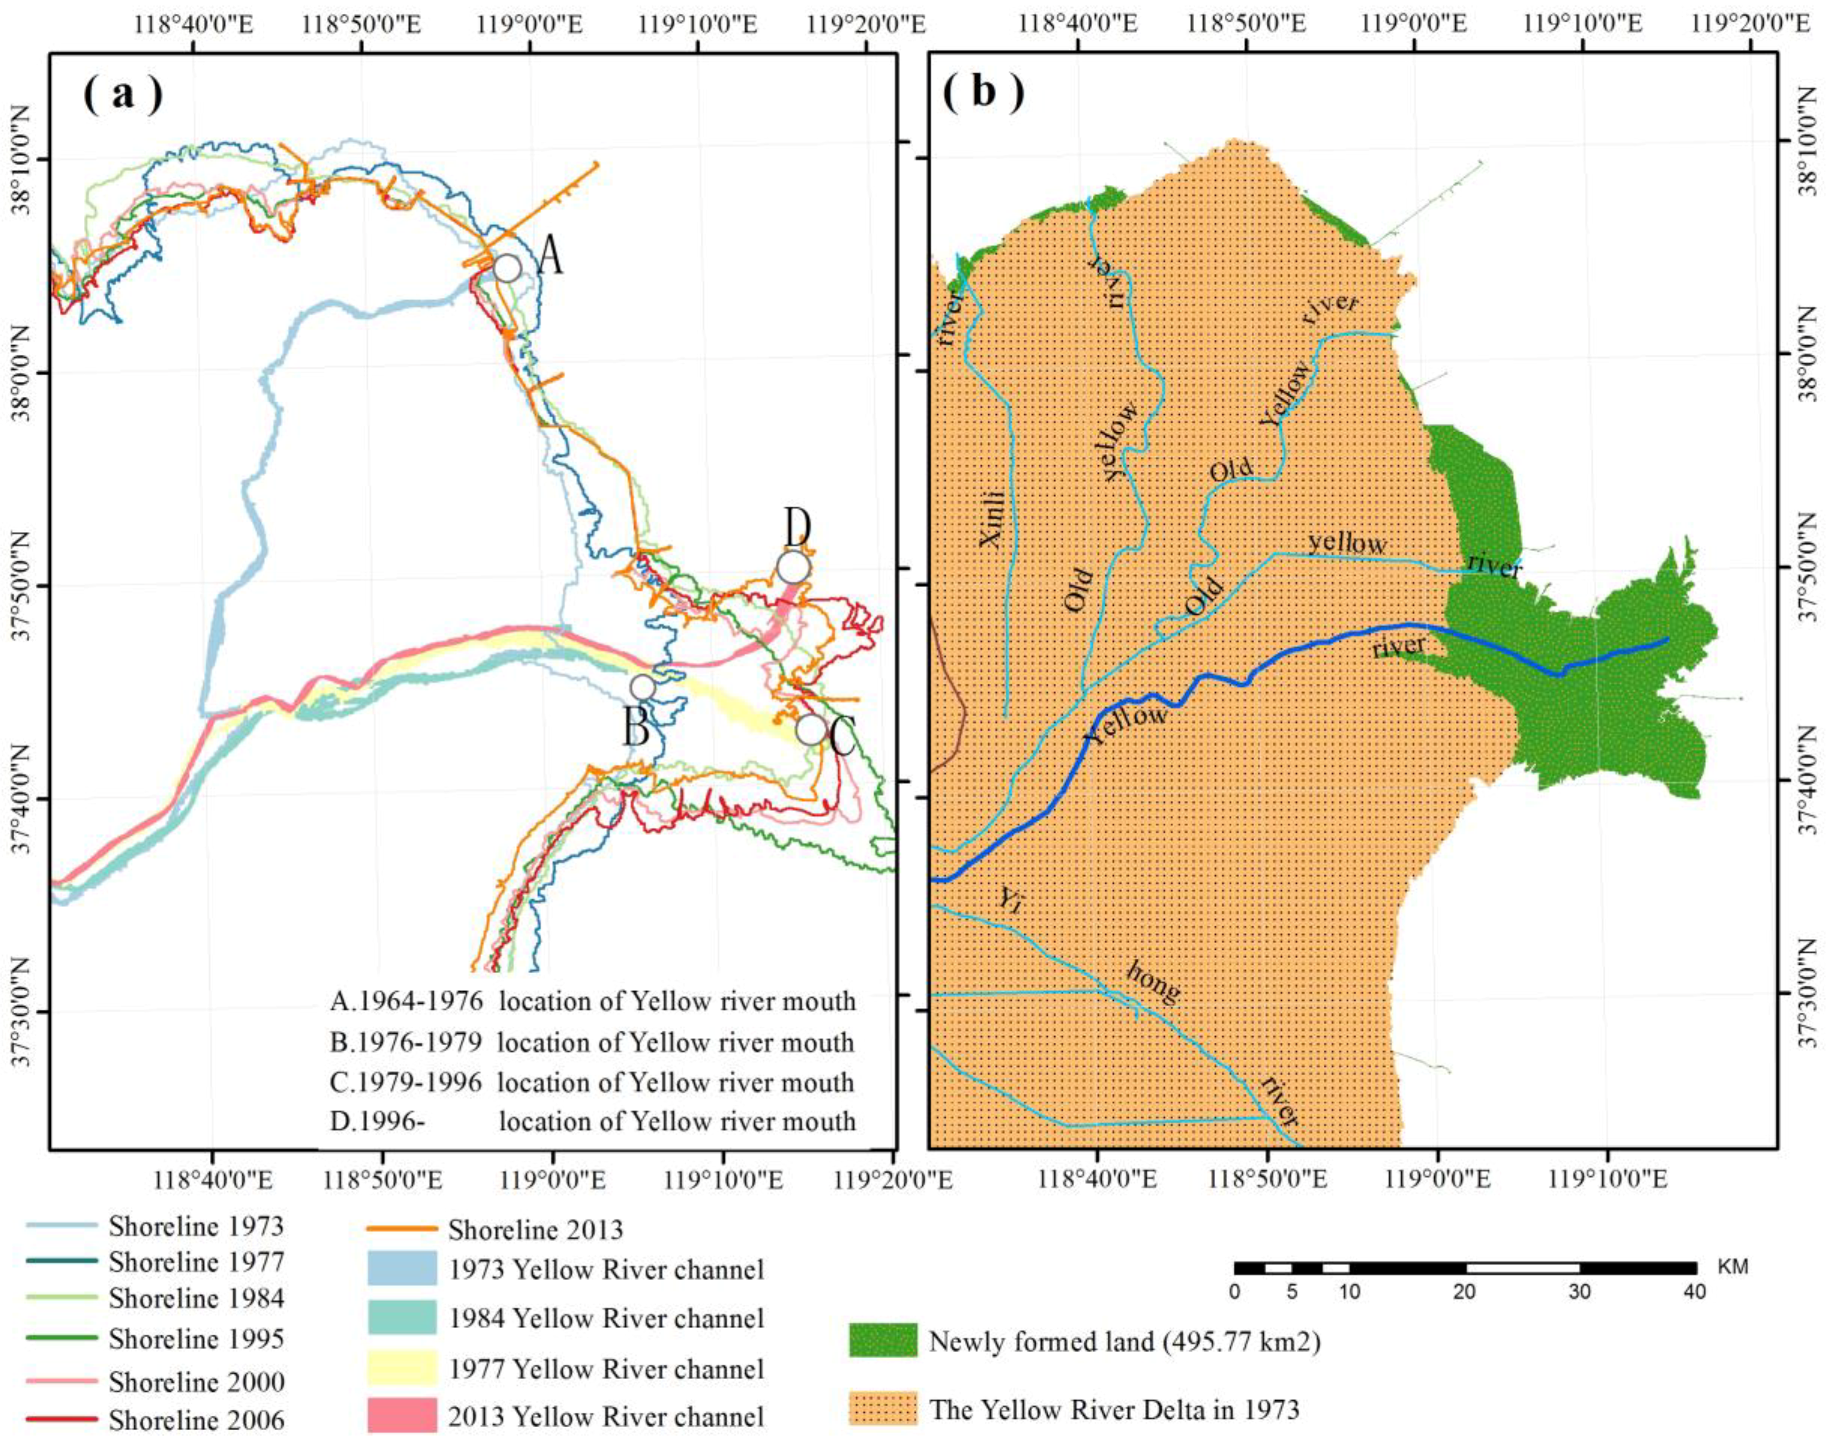
From 1973 to 2013, the Yellow River Delta had a great increase in area (495.77 km2) due to sedimentation (Figure 12b), with an annual expansion rate of 21.3 km2/a. These newly formed lands are the source of increased wetland area. Also, the Yellow River channel location has changed periodically. The site of the river mouth not only affected the speed of siltation but it influenced the direction of the delta’s expansion. Once the river mouth changed location to the other sites, the source of sediment in the old Yellow River channel was cut off and the coastal erosion increased. Over the period from 1973–2013, the mouth of the Yellow River has moved four times (Figure 12).
From 1964–1976, the Yellow River flowed north into the sea from the Diao Mouth (Figure 12a site A). The Yellow River was rechanneled in 1976 at the west river mouth. Between 1976 and 1979, it flowed into the sea from the Qingshuigou (Figure 12a, site B). In the period from 1979 to 1996, the location of the Yellow River channel was in an unstable condition and with little change at flood season (Figure 12a, site C). In 1996, the Yellow River was diverted by human intervention at the location of the Qing No.8 Brouch, which blocked the main channel and forced the river to veer north-east. Since then, the Yellow River has flowed into the sea north-east of the Qing No.8 Brouch (Figure 12a, site D). With all of these change in the estuary, the coastline also varied constantly over the past four decades (Figure 12a). Wherever the mouth of the Yellow River was located, the delta expanded. Since the mouth of the Yellow River moved from the Diao Mouth, the coastline there eroded severely.
Additionally, due to the special terrain and geographical environment, the Yellow River estuary was prone to storm surge. There was a serious storm surge every 3 to 4 years on average [67]. Storm surges led to coastal erosion and coastal wetlands being destroyed. According to the weather record data, the storm surge in 1992 contributed to part of the coastline retreating up to 30 m, the direct loss of land was 4.66 km2 [92]. The storm surge in 1997 directly destroyed the region’s largest area of Robinia pseudoacacia [67]. From the discussion above, the mouth migration and coastal erosion obviously had major impacts on the regional wetland changes.
5.2.4. Conservation Policies and Projects
Over past decades, natural wetlands in China have suffered a great loss of area and degradation. This is inextricably linked to the development of agriculture, the lack of awareness of the importance of wetlands, and government policies and laws [7,14,15,93,94]. The Yellow River Delta wetlands were no exception; in the middle stage of wetland change (stage 2: 1984–1995), because of the lack of ecological protection awareness and the excessive pursuit of economic interests, a large area of wetland was converted into farmland, aquaculture ponds, salt pans and other uses (Table 2). After the regional wetland ecosystem was severely degraded, relevant government departments and authorities realized the importance of wetlands and developed a series of protection policies and laws. For example, in 1990, Dongying Municipal People’s Government approved the establishment of the Yellow River Delta Nature Reserve (YRDNR). In 1991, the Yellow River Delta Nature Reserve was upgraded to a provincial protected area. In 1992, the State Council of China approved the establishment of the Yellow River Delta National Nature Reserve (YRDNNR). In 1999, the implementation of the Yellow River basin unified water resources scheduling rectified the lack of flow (the river drying up) in the lower reaches of the river and this has been fundamentally reversed. In 2004, the Yellow River Delta Nature Reserve Phase II project was completed and passed the national acceptance. In the same year, the Yellow River Delta National Nature Reserve wetlands monitoring project began, and it used remote sensing, global position system (GPS), geographic information system (GIS), and other technology to determine the timing and locations of fixed-point monitoring for the study area. In 2006, the Yellow River Delta National Geo-park was opened.
In stage 3 (1996–2013) of wetland change, the degradation rate of the regional wetlands has slowed down, which was potentially linked to these protection projects and laws. It should be noted that there may have been some time lag between the implementation and effectiveness of the protection policy. From the results of this study, in the late 1990s the effects of the conservation efforts began to be visible. There was probably a five- to 10-year time lag. The unified water resources scheduling which was begun in 1999 seems to be very effective, because the area of wetland rebounded in about 2000 (Figure 3). There were likely links between these two events. However, the effective protection of wetland resources was not a simple matter, it involved trade-offs among the interests and behaviors of the various stakeholders (e.g., the petroleum industry, government departments at all levels, urban developers). There is still a lot to be done to protect and restore these regional wetlands. However, from the results of this study, great success in slowing down the rate of regional wetland degradation has been achieved so far. The above discussion showed some possible, preliminary reasons for the Yellow River Delta wetland degradation over the past four decades. To eventually confirm the cause–effect relationship in this system, there needs to be more integrated and systematic analysis using comprehensive technologies, such as multisource remote sensing and metrological and hydrological models.
5.3. Credibility and Error Sources
5.3.1. Validity
Creating time-series maps over an extended period of time for the Yellow River Delta wetlands is essential for wetland research and change analysis. It is also necessary to determine if it is possible that the time-series changes came from misclassification. To insure that the classification results are credible, the wetland information inferred from remotely sensed images should be validated. All of the multispectral images used in the study have been carefully selected and strictly preprocessed. The radiometric calibration and atmospheric correction was applied to polish the path radiance and improve the clarity based on the ENVI 5.3 FLAASH model. The classification method used in this study addressed the changed area map-updating by samples transfer learning rather than reclassification of the whole image. The changed area machine identification improved the efficiency of classification, and it also ensured classification accuracy. In addition, each section of the data change area was manually checked carefully. Logical judgment was essential (e.g., wetlands can be transformed into impervious surfaces, but the city’s impervious surfaces do not change into wetlands) to ensure that errors of commission and omission were as small as possible. Therefore, we have confidence in the accuracy of the wetlands classification maps.
The wetland area changes were possibly caused by inter-annual variation or linked to intra-annual fluctuation. Sometimes, these two variables tend to interact. To discriminate the two different changes in order to ensure that inter-annual variability was comparable in this study, the images used for wetland detection were from the same season (autumn—September to October), except for the two earliest images. The river flow was relatively stable during this period each year [83,95]. So, the uncertainties of the inter-annual observed changes caused by intra-annual fluctuation was very little and acceptable.
5.3.2. Error Source
Regardless of the methodology, to perform wetland classification and updating successfully, the limitations (e.g., map scales, data acquisition time, spatial and spectral resolution, characteristics of wetlands, algorithms) of remote sensing inevitably affected the accuracy of the mapping [96]. From analyzing potential error sources in this study, the cartographic errors were mainly from scale and technical error.
Scale Errors
The scale factors were the inherent errors, which included both time scale and space scale errors [97]. Time scale errors were due to the variation in precipitation and wetness from year to year (i.e., drought or flood years). Accordingly, the ideal time for observations was at a time with average weather conditions [96,98,99], but that is only an ideal condition. The time and weather conditions of the images were not controllable. It cannot be known whether images captured during weather extremes would affect the mapping of the wetlands, but using nine observations to characterize and infer the change process and mode over the past four decades of the wetlands. This was a sample survey to some extent because the images were spread out over so many years. It was not possible to determine the exact time of a change. Therefore, the time scale error was not only related to the image acquisition time but also linked to the time density of the observations.
The space scale factors included the spatial resolution of the images and the map scale. The spatial resolution of the image reflects the ability to distinguish different category information, but it also has a negative impact on the classification accuracy [97,100,101,102]. The richness of wetland information derived from an image positively relates to its spatial resolution [100]. However, the specifications necessary for a “good” wetland map is heavily dependent on what the map was to be used for [96,98,99]. Therefore, neither a high nor low spatial resolution is better [102,103]. In this study, the image resolution of the earlier multiple spectral scanner (MSS) images was 60 m and the later (TM/OLI) images was 30 m. The difference in spatial resolution between MSS and TM is the size of one TM pixel (30 m). The lower spatial resolution increased the mixed pixels problem and decreased the separability of wetlands spectra. Also, the mis-registration between the different spatial resolution images is 15 m, which has a direct impact on the transitions between wetland type. Furthermore, the minimum mapping unit was 0.01 km2, which means an area of wetland less than that size was ignored. The map scale also affects the map accuracy.
Technical Errors
No matter how good the algorithm, the classification accuracy cannot be 100% and errors are unavoidable. The technical errors were mainly caused by the characteristics of the wetlands, such as changes in different season, they have complex spectra, they are heterogeneous, and the same land cover types have multiple spectrums. To improve the classification accuracy in the future, more research can be done on the following aspects: (1) To discover more effective features, not just in spectrum, new technologic methods maybe good alternative choices (e.g., synthetic aperture radar, lidar, and geospatial modeling); (2) to enhance the intensity of machine learning; taking into account the all possible situations via the new learning structures (e.g., deep convolutional artificial neural network (ANN) and deep learning) [104,105,106,107,108,109,110,111,112]. The deep convolutional neural network algorithm, in particular, has better learning and generalization performance for multiple variables and large datasets.
Nevertheless, this is the first time that the Yellow River Delta wetlands have been mapped and had a long time-series change analysis performed on them. The results provided important information and scientific support to help the local government agencies develop robust strategies for wetland management, conservation, and restoration in the future. The study attempted to label classification samples automatically by the transfer learning method. This methodology emphasized the importance of existing thematic map knowledge. The entire technological procedure has greatly improved the efficiency of the work and the level of automatic wetland classification. The hybrid method used in this research could be extended to other regions for wetland surveys and mapping.
6. Conclusions
This study developed a new methodology to identify wetlands automatically and documented the time-series changes from 1973 to 2013 in the Yellow River Delta using remotely sensed data. Spatio-temporal change analysis was conducted to examine the long-term change processes and modes of different wetlands over the last four decades using nine images for classification and mapping. The results quantitatively assessed the temporal and spatial changes within the wetlands as well as between wetland and non-wetland areas to determine the main reason for degradation. Several findings were revealed and communicated in this study.
(1) The Yellow River Delta wetlands have been severely damaged over the past four decades (683.12 km2 were lost). Over half (50.55%) of the original natural wetland area was lost between 1973 and 2013. Meanwhile, the regional artificial wetland area had a significant increasing trend (20.2 km2·year−1, p < 0.05).
(2) The whole change process can be divided into 3 stages: relatively stable (1973–1984), rapid reduction (1984–1995), and slow degradation (1995–2013). Moreover, the total area of the regional wetlands dropped to the lowest point in the second stage and then began to rebound around 1995.
(3) The designed hybrid method for wetland map automatic updating based on sample transfer and machine learning has greatly improved the work efficiency. This approach provided a new way to make full use of existing thematic maps and could be extended to other areas.
(4) Regional human activities (e.g., farmland creation, salt development, oilfield exploration, aquaculture, industrialization) were the main cause of the regional wetland degradation in the short-term. Climate change was a long-term factor that has been affecting the evolution of regional wetlands. The hydrological factors and the channel diversion of the Yellow River directly affected the formation and development of the regional wetlands. Regional wetland protection policies and engineering have played an important role in slowing down the process of regional wetland degradation to a certain extent. In order to fully understand the cause–effect relationship of the wetland change, more integrated and systematic analysis by comprehensive technologies is needed.
Author Contributions
Changming Zhu conducted data collection and processing, result analysis and preparation of the manuscript. Xin Zhang designed the research procedure and conducted result analysis and preparation of the manuscript. Qiaohua Huang provided the editing and discussion of this manuscript.
Funding
This research was funded by the Natural Science Foundation of China (Grant No. 61473286 and 401201460) and the National R&D Program of China (Granted No. 2017YFB0504201).
Acknowledgments
The authors would like to thank the anonymous reviewers for their constructive comments and suggestions.
Conflicts of Interest
The authors declare no conflict of interest.
References
- Zhao, H.; Wang, L. Classification of the coastal wetland in China. Mar. Sci. Bull. 2000, 19, 72–82. [Google Scholar]
- Zhang, X.; Wang, L.; Jiang, X.; Zhu, C. Modeling with Digital Ocean and Digital Coast; Springer International Publishing: Cham, Switzerland, 2017. [Google Scholar]
- Bao, K. Coastal wetlands: Coupling between ocean and land systems. J. Coast. Res. 2015, 313, iv. [Google Scholar] [CrossRef]
- Boesch, D.F.; Josselyn, M.N.; Mehta, A.J.; Morris, J.T.; Nuttle, W.K.; Simenstad, C.A.; Swift, D.J. Scientific assessment of coastal wetland loss, restoration and management in Louisiana. J. Coast. Res. 1994, 20, 1–103. [Google Scholar]
- Sklar, F.H.; Costanza, R.; Day, J.W. Dynamic spatial simulation modeling of coastal wetland habitat succession. Ecol. Model. 1985, 29, 261–281. [Google Scholar] [CrossRef]
- Sun, Z.; Mou, X.; Chen, X.; Wang, L.; Song, H.; Jiang, H. Actualities, problems and suggestions of wetland protection and restoration in the Yellow River delta. Wetl. Sci. 2011, 9, 107–116. [Google Scholar]
- Wang, M.; Qi, S.; Zhang, X. Wetland loss and degradation in the Yellow River delta, ShanDong Province of China. Environ. Earth Sci. 2011, 67, 185–188. [Google Scholar] [CrossRef]
- Zhang, J.; Sun, Q. Causes of wetland degradation and ecological restoration in the Yellow River delta region. For. Stud. China 2005, 7, 15–18. [Google Scholar] [CrossRef]
- Xu, X.; Lin, H.; Fu, Z. Probe into the method of regional ecological risk assessment a case study of wetland in the Yellow River delta in China. J. Environ. Manag. 2004, 70, 253–262. [Google Scholar] [CrossRef] [PubMed]
- Zhu, P.; Gong, P. Suitability mapping of global wetland areas and validation with remotely sensed data. Sci. China Earth Sci. 2014, 57, 2283–2292. [Google Scholar] [CrossRef]
- Development Assistance Committee Organisation for Economic Co-operation Development (OECD). Guidelines for Aid Agencies for Improved Conservation and Sustainable Use of Tropical and Sub-Tropical Wetlands; Development Assistance Committee Organisation for Economic Co-operation Development (OECD): Paris, France, 1996. [Google Scholar]
- O’Connell, M.J. Detecting, measuring and reversing changes to wetlands. Wetl. Ecol. Manag. 2003, 11, 397–401. [Google Scholar] [CrossRef]
- Hu, S.; Niu, Z.; Zhang, H.; Chen, Y.; Gong, N. Simulation of spatial distribution of China potential wetland. Chin. Sci. Bull. 2015, 60, 3251. [Google Scholar]
- Gong, P.; Niu, Z.; Cheng, X.; Zhao, K.; Zhou, D.; Guo, J.; Liang, L.; Wang, X.; Li, D.; Huang, H.; et al. China’s wetland change (1990–2000) determined by remote sensing. Sci. China Earth Sci. 2010, 53, 1036–1042. [Google Scholar] [CrossRef] [Green Version]
- Sun, Z.; Sun, W.; Tong, C.; Zeng, C.; Yu, X.; Mou, X. China’s coastal wetlands: Conservation history, implementation efforts, existing issues and strategies for future improvement. Environ. Int. 2015, 79, 25–41. [Google Scholar] [CrossRef] [PubMed]
- Nicholls, R.J. Coastal flooding and wetland loss in the 21st century: Changes under the sres climate and socio-economic scenarios. Glob. Environ. Chang. 2004, 14, 69–86. [Google Scholar] [CrossRef]
- Gedan, K.B.; Kirwan, M.L.; Wolanski, E.; Barbier, E.B.; Silliman, B.R. The present and future role of coastal wetland vegetation in protecting shorelines: Answering recent challenges to the paradigm. Clim. Chang. 2011, 106, 7–29. [Google Scholar] [CrossRef]
- Li, Q.; Wu, Z.; Chu, B.; Zhang, N.; Cai, S.; Fang, J. Heavy metals in coastal wetland sediments of the Pearl River estuary, China. Environ. Pollut. 2007, 149, 158–164. [Google Scholar] [CrossRef] [PubMed]
- Simenstad, C.; Reed, D.; Ford, M. When is restoration not?: Incorporating landscape-scale processes to restore self-sustaining ecosystems in coastal wetland restoration. Ecol. Eng. 2006, 26, 27–39. [Google Scholar] [CrossRef]
- Cahoon, D.R.; Hensel, P.F.; Spencer, T.; Reed, D.J.; McKee, K.L.; Saintilan, N. Coastal wetland vulnerability to relative sea-level rise: Wetland elevation trends and process controls. In Wetlands and Natural Resource Management; Springer: Berlin, Germany, 2006; pp. 271–292. [Google Scholar]
- Lee, S.Y.; Dunn, R.J.K.; Young, R.A.; Connolly, R.M.; Dale, P.; Dehayr, R.; Lemckert, C.J.; McKinnon, S.; Powell, B.; Teasdale, P. Impact of urbanization on coastal wetland structure and function. Aust. Ecol. 2006, 31, 149–163. [Google Scholar] [CrossRef]
- Liu, G.; Zhang, L.; Zhang, Q.; Musyimi, Z.; Jiang, Q. Spatio–temporal dynamics of wetland landscape patterns based on remote sensing in Yellow River delta, China. Wetlands 2014, 34, 787–801. [Google Scholar] [CrossRef]
- Ye, Q.; Tian, G.L.; Liu, G.H.; Ye, J.; Lou, W. Tupu analysis on the land cover evolving patterns in the new-born wetland of the Yellow River delta. Geogr. Res. 2004, 23, 257–264. [Google Scholar]
- Liu, H.; Li, Y.; Cao, X.; Hao, J.; Junna, H.; Zheng, N. The current problems and perspectives of landscape research of wetlands in China. Acta Geogr. Sin. 2009, 64, 1394–1401. [Google Scholar]
- Adam, E.; Mutanga, O.; Rugege, D. Multispectral and hyperspectral remote sensing for identification and mapping of wetland vegetation: A review. Wetl. Ecol. Manag. 2009, 18, 281–296. [Google Scholar] [CrossRef]
- Frohn, R.C.; Autrey, B.C.; Lane, C.R.; Reif, M. Segmentation and object-oriented classification of wetlands in a karst florida landscape using multi-season landsat-7 ETM+ imagery. Int. J. Remote Sens. 2011, 32, 1471–1489. [Google Scholar] [CrossRef]
- Dronova, I.; Gong, P.; Wang, L. Object-based analysis and change detection of major wetland cover types and their classification uncertainty during the low water period at Poyang lake, China. Remote Sens. Environ. 2011, 115, 3220–3236. [Google Scholar] [CrossRef]
- Zhu, C.; Li, J.; Zhang, X.; Luo, J. Wetlands information automatic extraction from high resolution remote sensing imagery based on object-orient technology (in Chinese with English Abstract). Bull. Surv. Mapp. 2014, 10, 23–28. [Google Scholar]
- Han, X.; Chen, X.; Feng, L. Four decades of winter wetland changes in poyang lake based on landsat observations between 1973 and 2013. Remote Sens. Environ. 2015, 156, 426–437. [Google Scholar] [CrossRef]
- Augusteijn, M.F.; Warrender, C.E. Wetland classification using optical and radar data and neural network classification. Int. J. Remote Sens. 1998, 19, 1545–1560. [Google Scholar] [CrossRef]
- Islam, M.A.; Thenkabail, P.S.; Kulawardhana, R.W.; Alankara, R.; Gunasinghe, S.; Edussriya, C.; Gunawardana, A. Semi-automated methods for mapping wetlands using landsat ETM+ and SRTM data. Int. J. Remote Sens. 2008, 29, 7077–7106. [Google Scholar] [CrossRef]
- Bwangoy, J.-R.B.; Hansen, M.C.; Roy, D.P.; Grandi, G.D.; Justice, C.O. Wetland mapping in the Congo Basin using optical and radar remotely sensed data and derived topographical indices. Remote Sens. Environ. 2010, 114, 73–86. [Google Scholar] [CrossRef] [Green Version]
- Davranche, A.; Lefebvre, G.; Poulin, B. Wetland monitoring using classification trees and spot-5 seasonal time series. Remote Sens. Environ. 2010, 114, 552–562. [Google Scholar] [CrossRef] [Green Version]
- Zhang, Y.; Wang, G.; Wang, Y. Changes in alpine wetland ecosystems of the Qinghai-Tibetan plateau from 1967 to 2004. Environ. Monit. Assess. 2011, 180, 189–199. [Google Scholar] [CrossRef] [PubMed]
- Zhang, Y.; Lu, D.; Yang, B.; Sun, C.; Sun, M. Coastal wetland vegetation classification with a landsat thematic mapper image. Int. J. Remote Sens. 2011, 32, 545–561. [Google Scholar] [CrossRef]
- Margono, B.A.; Bwangoy, J.R.B.; Potapov, P.V.; Hansen, M.C. Mapping wetlands in indonesia using landsat and palsar data-sets and derived topographical indices. Geo-Spat. Inf. Sci. 2014, 17, 60–71. [Google Scholar] [CrossRef]
- Lunetta, R.S.; Balogh, M.E. Application of multi-temporal LANDSAT 5 Tm imagery for wetland identification. Photogr. Eng. Remote Sens. 1999, 65, 1303–1310. [Google Scholar]
- Klemas, V. Remote sensing of wetlands: Case studies comparing practical techniques. J. Coast. Res. 2011, 27, 418–427. [Google Scholar] [CrossRef]
- Bai, Q.; Chen, J.; Chen, Z.; Dong, G.; Dong, J.; Dong, W.; Fu, V.W.K.; Han, Y.; Lu, G.; Li, J.; et al. Identification of coastal wetlands of international importance for waterbirds: A review of China coastal waterbird surveys 2005–2013. Avian Res. 2015, 6, 12. [Google Scholar] [CrossRef]
- Best, R.G.; Moore, D.G. Landsat interpretation of prairie lakes and wetlands of eastern South Dakota. Can. J. Math. 1979, 59, 421–426. [Google Scholar]
- Szantoi, Z.; Escobedo, F.; Abd-Elrahman, A.; Smith, S.; Pearlstine, L. Analyzing fine-scale wetland composition using high resolution imagery and texture features. Int. J. Appl. Earth Obs. Geoinf. 2013, 23, 204–212. [Google Scholar] [CrossRef]
- O’Hara, C.G. Remote sensing and geospatial application for wetland mapping, assessment and mitigation. In Proceedings of the Integrating Remote Sensing at the Global, Regional and Local Scale, Pecora 15/Land Satellite Information IV Conference, Denver, CO, USA, 10–15 November 2002. [Google Scholar]
- Gluck, M.J.; Rempel, R.S.; Uhlig, P. An Evaluation of Remote Sensing for Regional Wetland Mapping Applications; Ontario Forest Research Institute: Sault Ste. Marie, ON, Canada, 1996. [Google Scholar]
- Hinson, J.M.; German, C.D.; Pulich, W., Jr. Accuracy assessment and validation of classified satellite imagery of Texas coastal wetlands. Mar. Technol. Soc. J. 1994, 28, 4–9. [Google Scholar]
- Niu, Z.; Zhang, H.; Wang, X.; Yao, W.; Zhou, D.; Zhao, K.; Zhao, H.; Li, N.; Huang, H.; Li, C.; et al. Mapping wetland changes in China between 1978 and 2008. Chin. Sci. Bull. 2012, 57, 2813–2823. [Google Scholar] [CrossRef] [Green Version]
- Töyrä, J.; Pietroniro, A. Towards operational monitoring of a northern wetland using geomatics-based techniques. Remote Sens. Environ. 2005, 97, 174–191. [Google Scholar] [CrossRef]
- Schmidt, K.; Skidmore, A. Spectral discrimination of vegetation types in a coastal wetland. Remote Sens. Environ. 2003, 85, 92–108. [Google Scholar] [CrossRef]
- Mwita, E.; Menz, G.; Misana, S.; Nienkemper, P. Detection of small wetlands with multi sensor data in East Africa. Adv. Remote Sens. 2012, 1, 64–73. [Google Scholar] [CrossRef]
- Li, S.N.; Wang, G.X.; Deng, W.; Hu, Y.M.; Hu, W.W. Influence of hydrology process on wetland landscape pattern: A case study in the Yellow River delta. Ecol. Eng. 2009, 35, 1719–1726. [Google Scholar] [CrossRef]
- Jiang, Q.O.; Deng, X.; Zhan, J.; Yan, H. Impacts of economic development on ecosystem risk in the Yellow River delta. Procedia Environ. Sci. 2011, 5, 208–218. [Google Scholar] [CrossRef]
- Yang, H.; Guo, H.; Wang, C. Coast line dynamic inspect and land cover classification at Yellow River mouth using TM-SAR data fusion method. Geogr. Terrance Res. 2001, 17, 185–191. [Google Scholar]
- Cui, B.; He, Q.; Zhao, X. Ecological thresholds of suaeda salsa to the environmental gradients of water table depth and soil salinity. Acta Ecol. Sin. 2008, 28, 1408–1418. [Google Scholar]
- Cui, B.; Tang, N.; Zhao, X.; Bai, J. A management-oriented valuation method to determine ecological water requirement for wetlands in the Yellow River delta of China. J. Nat. Conserv. 2009, 17, 129–141. [Google Scholar] [CrossRef]
- Chander, G.; Markham, B.L.; Helder, D.L. Summary of current radiometric calibration coefficients for landsat mss, tm, ETM+, and EO-1 ali sensors. Remote Sens. Environ. 2009, 113, 893–903. [Google Scholar] [CrossRef]
- McFeeters, S.K. The use of normalized difference water index (NDWI) in the delineation of open water features. Int. J. Remote Sens. 1996, 17, 1425–1432. [Google Scholar] [CrossRef]
- Zhu, C.; Zhang, X.; Qi, J. Detecting and assessing spartina invasion in coastal region of China: A case study in the Xiangshan Bay. Acta Oceanol. Sin. 2016, 35, 35–43. [Google Scholar] [CrossRef]
- Zhang, G.; Li, K.; Zhan, L. Dynamics of wetland and protection measures for the modern Yellow River delta. Ecol. Environ. Sci. 2009, 18, 394–398. [Google Scholar]
- Houlahan, J.E.; Keddy, P.A.; Makkay, K.; Findlay, C.S. The effects of adjacent land use on wetland species richness and community composition. Wetlands 2006, 26, 79–96. [Google Scholar] [CrossRef]
- Wu, T.; Luo, J.; Xia, L.; Yang, h.; Shen, Z.; Hu, X. An automatic sample collection method for object-oriented classification of remotely sensed imageries based on transfer learning. Acta Geod. Cartogr. Sin. 2014, 43, 908–916. [Google Scholar]
- Jiang, Y.; Cui, H.; Li, Y. Study on dynamic change of wetland in Sanjiang Plain, northeast area. J. Jilin Univ. (Earth Sci. Ed.) 2009, 39, 1127–1136. [Google Scholar]
- Xing, Y.; Jiang, Q.G. Landscape spatial patterns changes of the wetland in Qinghai-Tibet plateau. Ecol. Environ. Sci. 2009, 18, 1010–1015. [Google Scholar]
- Qiao, W.; Fang, B.; Wang, Y. Land use change information mining in highly urbanized area based on transfer matrix: A case study of Suzhou, Jiangsu Province. Geogr. Res. 2013, 32, 1497–1507. [Google Scholar]
- Liu, R.; Zhu, D. Methods for detecting land use changes based on the land use transition matrix. Resour. Sci. 2010, 32, 1544–1550. [Google Scholar]
- Wang, J.; Wang, L.; Shi, G.; Liu, X.; Yao, J.; Han, X. The situation and strategy of Huanghe runoff drying up. China Water Resour. 1999, 04, 10–13. [Google Scholar]
- Liu, C.; Cheng, L. Anlysis on runoff series with special reference to drying up courses of Huanghe River. Acta Geogr. Sin. 2000, 55, 257–265. [Google Scholar]
- Dai, T.; Chen, S. Causes, effects and countermeasures of Huanghe drying up. Shandong Water Conserv. Sci. Technol. 1997, 2, 2–5. [Google Scholar]
- Zhang, X.; Li, P.; Liu, L.; Li, P. China’s Coastal Wetland Degradation; Maritime Press: Beijing, China, 2010. [Google Scholar]
- Li, X.; Wang, S.; Li, P.; Zhang, Z. Problems of wetland agricultural exploitation and sustainable developing countermeasures for Yellow River delta. Mod. Agric. Sci. Technol. 2013, 15, 272–275. [Google Scholar]
- Mu, C.; Yang, L.; Hu, Y. Yellow River delta swamp protection and the concord progresswith oil field development. Environ. Prot. Oil Gas Fields 1998, 8, 34–37. [Google Scholar]
- Xu, J.; Li, X.; Yang, H.; Luo, J. Water and sediment reduction effects through hydraulic and water and soil conservation measures in the middle Yellow River and its influence on the lower Yellow River. Yellow River 1997, 7, 45–47. [Google Scholar]
- Wang, J.; Meng, Y.; Zhang, L. Remote sensing monitoring and change analysis of Yellow River estuary coastline in the past 42 years. Remote Sens. Land Resour. 2016, 28, 188–193. [Google Scholar]
- Ye, Q. Flow interruptions and their environmentalimpact on the Yellow River delta. Acta Geogr. Sin. 1998, 53, 385–392. [Google Scholar]
- Shi, F.; Zhang, R. Cause analysis and recognitions on the recent sharp decreasing ofthe Yellow River water and sediment amount. Yellow River 2013, 35, 1–3. [Google Scholar]
- Cui, S. Influence of water discharge cutoff ofhuanghe on environment of its delta. Mar. Sci. 2002, 26, 42–46. [Google Scholar]
- Chen, J.; Wang, S.; Mao, Z. Monitoring wetland changes in Yellow River delta byremote sensing during 1976–2008. Prog. Geogr. 2011, 30, 585–592. [Google Scholar]
- Zhang, Q.; Zhu, C.; Liu, C.L.; Jiang, T. Environmental change and its impacts on human settlement in the Yangtze delta, China. Catena 2005, 60, 267–277. [Google Scholar] [CrossRef]
- Li, Y.; Yu, J.; Han, G.; Wang, X.; Wang, Y.; Guan, B. Dynamic evolution of natural wetlands and its driving factors in the Yellow River delta. Chin. J. Ecol. 2011, 30, 1535–1541. [Google Scholar]
- Wang, Y.; Yu, J.; Dong, H.; Li, Y.; Zhou, D.; Fu, Y.; Han, G.; Mao, P. Spatial evolution of landscape pattern of coastal wetlands in Yellow River delta. Sci. Geogr. Sin. 2012, 32, 717–724. [Google Scholar]
- Stocker, T. Climate Change 2013: The Physical Science Basis: Working Group I Contribution to the Fifth Assessment Report of the Intergovernmental Panel on Climate Change; Cambridge University Press: Cambridge, UK, 2014. [Google Scholar]
- Solomon, S. Climate Change 2007—The Physical Science Basis: Working Group I Contribution to the Fourth Assessment Report of the IPCC; Cambridge University Press: Cambridge, UK, 2007; Volume 4. [Google Scholar]
- Wang, K. China rate of sea level rise than the global average. Sci. Technol. Commun. 2017, 6, 2. [Google Scholar] [CrossRef]
- Wu, Q.; Zheng, X.; Ying, Y.; Hou, Y.; Xie, X. Relative sea level rise in coastal areas of China in the 21st century and its control strategies. Sci. China 2002, 32, 760–766. [Google Scholar]
- Song, D.; Yun, J.; Wang, G.; Han, G.; Guan, B.; Li, Y. Change characteristics of average annual temperature and annual precipitationin costal wetland region of the Yellow River delta from 1961 to 2010. Wetl. Sci. 2016, 14, 248–253. [Google Scholar]
- Jiang, D.; Fu, X.; Wang, K. Vegetation dynamics and their response to freshwater inflow and climate variables in the Yellow River delta, China. Quat. Int. 2013, 304, 75–84. [Google Scholar] [CrossRef]
- Wang, D.; Ma, F.; Hou, D. Multi-time scales analysis of precipitation in Yellow River delta reserve. J. Southwest For. Univ. 2010, 30, 33–37. [Google Scholar]
- Li, G.; Han, M.; Zhang, D. Climatic change tendency in Yellow River delta during 1961–2013. Yellow River 2017, 39, 30–37. [Google Scholar]
- Li, X.; Xue, Z.; Gao, J. Dynamic changes of plateau wetlands in madou county, the Yellow River source zone of China: 1990–2013. Wetlands 2016, 36, 299–310. [Google Scholar] [CrossRef]
- Saito, Y.; Yang, Z.; Hori, K. The Huanghe (Yellow River) and changjiang (Yangtze River) deltas: A review on their characteristics, evolution and sediment discharge during the holocene. Geomorphology 2001, 41, 219–231. [Google Scholar] [CrossRef]
- Lan, Y.; Zhao, G.; Zhang, Y.; Wen, J.; Hu, X.; Liu, J.; Gu, M.; Chang, J.; Ma, J. Response of runoff in the headwater region of the Yellow River to climate change and its sensitivity analysis. J. Geogr. Sci. 2010, 20, 848–860. [Google Scholar] [CrossRef]
- Li, L.; Shen, H.; Dai, S.; Xiao, J.; Shi, X. Response to climate change and prediction of runoffin the source region of Yellow River. Acta Geogr. Sin. 2011, 66, 1261–1269. [Google Scholar]
- Ding, Y.; Pan, S. Evolutionary characteristics of runoff into the sea ofthe Huanghe River and their causes in recent 50 years. Quat. Sci. 2007, 27, 709–717. [Google Scholar]
- Wu, S.; Wang, W.; Wu, G. The calamity caused by the storm tide of the No.9216 typhoon in Shandong Province. J. Catastrophol. 1994, 9, 44–47. [Google Scholar]
- Liu, J. China’s road to sustainability. Science 2010, 328, 50. [Google Scholar] [CrossRef] [PubMed]
- Wang, Z.; Wu, J.; Madden, M.; Mao, D. China’s wetlands: Conservation plans and policy impacts. Ambio 2012, 41, 782–786. [Google Scholar] [CrossRef] [PubMed]
- Zhang, C.; Han, M.; Shi, L. Runoff into the sea of the Yellow River: Characteristics and its response to climate change. Yellow River 2015, 37, 10–14. [Google Scholar]
- Tiner, R.W. Wetland Indicators: A Guide to Wetland Identification, Delieation, Classification and Mapping; Taylor and Francis: New York, NY, USA, 1999. [Google Scholar] [CrossRef]
- Ming, D.; Wang, Q.; Yang, J. Spatial scale of remote sensing image and selection of optimal spatial resolution. J. Remote Sens. 2008, 12, 529–537. [Google Scholar]
- Klemas, V.V. Remote sensing of landscape-level coastal environmental indicators. Environ. Manag. 2001, 27, 47–57. [Google Scholar] [CrossRef] [PubMed]
- Koeln, G.; Bissonnette, J. Cross-correlation analysis: Mapping landcover change with a historic landcover database and a recent, single-date multispectral image. In Proceedings of the 2000 ASPRS Annual Convention, Washington, DC, USA, 22–26 May 2000. [Google Scholar]
- Gong, H.; Jiao, C.; Zhou, D.; Li, N. Scale issues of wetland classification and mapping using remote sensing images: A case of honghe national nature reserve in Sanjiang Plain, northeast China. Chin. Geogr. Sci. 2011, 21, 230–240. [Google Scholar] [CrossRef]
- Woodcock, C.E.; Strahler, A.H. The factor of scale in remote sensing. Remote Sens. Environ. 1987, 21, 311–332. [Google Scholar] [CrossRef]
- Bo, Y.; Wang, J. Exploring the scale effecting thematic classification of remotely sensed data: The statistical separability based method. Remote Sens. Technol. Appl. 2004, 19, 443–450. [Google Scholar]
- Pan, J.; Zhu, D.; Yan, T.; Sun, L. Application of the relationship between spatial resolution of rs image and mapping scale. Trans. CASE 2005, 21, 124–128. [Google Scholar]
- Arvor, D.; Jonathan, M.; Meirelles, M.S.P.; Dubreuil, V.; Durieux, L. Classification of modis EVI time series for crop mapping in the state of Mato Grosso, Brazil. Int. J. Remote Sens. 2011, 32, 7847–7871. [Google Scholar] [CrossRef]
- Brown, J.C.; Kastens, J.H.; Coutinho, A.C.; Victoria, D.D.C.; Bishop, C.R. Classifying multiyear agricultural land use data from Mato Grosso using time-series modis vegetation index data. Remote Sens. Environ. 2013, 130, 39–50. [Google Scholar] [CrossRef]
- Kehl, T.N.; Todt, V.; Veronez, M.R.; Cazella, S.C. Amazon rainforest deforestation daily detection tool using artificial neural networks and satellite images. Sustainability 2012, 4, 2566–2573. [Google Scholar] [CrossRef]
- Zheng, B.; Myint, S.W.; Thenkabail, P.S.; Aggarwal, R.M. A support vector machine to identify irrigated crop types using time-series landsat NDVI data. Int. J. Appl. Earth Obs. Geoinf. 2015, 34, 103–112. [Google Scholar] [CrossRef]
- Chen, Y.; Lin, Z.; Zhao, X.; Wang, G.; Gu, Y. Deep learning-based classification of hyperspectral data. IEEE J. Sel. Top. Appl. Earth Obs. Remote Sens. 2014, 7, 2094–2107. [Google Scholar] [CrossRef]
- Yue, J.; Zhao, W.; Mao, S.; Liu, H. Spectral–spatial classification of hyperspectral images using deep convolutional neural networks. Remote Sens. Lett. 2015, 6, 468–477. [Google Scholar] [CrossRef]
- Castelluccio, M.; Poggi, G.; Sansone, C.; Verdoliva, L. Land use classification in remote sensing images by convolutional neural networks. J. Mol. Struct. 2015, 537, 163–172. [Google Scholar]
- Hu, X.; Weng, Q. Estimating impervious surfaces from medium spatial resolution imagery using the self-organizing map and multi-layer perceptron neural networks. Remote Sens. Environ. 2009, 113, 2089–2102. [Google Scholar] [CrossRef]
- Hu, F.; Xia, G.S.; Hu, J.; Zhang, L. Transferring deep convolutional neural networks for the scene classification of high-resolution remote sensing imagery. Remote Sens. 2015, 7, 14680–14707. [Google Scholar] [CrossRef]
Figure 1.
Location of study area.

Figure 2.
Diagram of wetland classification and updating process based on sample transfer learning.

Figure 3.
Accuracy of K-fold cross-validation.

Figure 4.
A time series of wetland distribution in the Yellow River Delta from 1973 to 2013. Maps were created using remote sensing.
Figure 4.
A time series of wetland distribution in the Yellow River Delta from 1973 to 2013. Maps were created using remote sensing.

Figure 5.
Accumulation histogram of area and dynamic change for all types of wetlands through time.

Figure 6.
Area of natural and artificial wetlands in theYellow River Delta from 1973–2013.

Figure 7.
Accumulation histogram of natural wetland area and dynamic change. The blue line is the average dynamic change (ave. DC).
Figure 7.
Accumulation histogram of natural wetland area and dynamic change. The blue line is the average dynamic change (ave. DC).

Figure 8.
Accumulation histogram of artificial wetland area and dynamic change. The blue line is the average dynamic change (ave. DC).
Figure 8.
Accumulation histogram of artificial wetland area and dynamic change. The blue line is the average dynamic change (ave. DC).

Figure 9.
Map showing changes in area of wetlands in the Yellow River Delta over the past four decades. Three scenarios of wetland change are shown: wetland loss, wetland expansion (wetland gain), and unchanged wetland areas.
Figure 9.
Map showing changes in area of wetlands in the Yellow River Delta over the past four decades. Three scenarios of wetland change are shown: wetland loss, wetland expansion (wetland gain), and unchanged wetland areas.

Figure 10.
Change trends and mode of total wetlands area in the Yellow River Delta from 1973–2013.

Figure 11.
Changes in land use for natural wetland areas from 1973 to 2013.

Figure 12.
(a) Map showing different locations of the Yellow River channel and mouth and the coastal shoreline at different points in time. (b) Map showing past locations of the Yellow River and new areas of land that formed in the Yellow River Delta since 1973.
Figure 12.
(a) Map showing different locations of the Yellow River channel and mouth and the coastal shoreline at different points in time. (b) Map showing past locations of the Yellow River and new areas of land that formed in the Yellow River Delta since 1973.


Table 1.
List of remotely sensed images of the Yellow River Delta wetlands used for mapping.
| No. | Acquisition Time | Orbits Path/Row | Satellite No. | Sensor Type | Spatial Resolution | Cloud Cover | Image Quality |
|---|---|---|---|---|---|---|---|
| 1 | 1973/12/06 | 130/034 | Landsat 1 | MSS | 60 m | 0.0% | 9 |
| 2 | 1977/10/05 | 130/034 | Landsat 3 | MSS | 60 m | 0.0% | 9 |
| 3 | 1984/10/05 | 121/034 | Landsat 4 | MSS | 60 m | 0.0% | 5 |
| 4 | 1991/09/03 | 121/034 | Landsat 5 | TM | 30 m | 0.0% | 7 |
| 5 | 1995/09/18 | 121/034 | Landsat 5 | TM | 30 m | 0.0% | 9 |
| 6 | 2000/09/15 | 121/034 | Landsat 5 | TM | 30 m | 3.0% | 9 |
| 7 | 2006/10/02 | 121/034 | Landsat 5 | TM | 30 m | 0.0% | 9 |
| 8 | 2010/09/11 | 121/034 | Landsat 5 | TM | 30 m | 0.3% | 9 |
| 9 | 2013/10/05 | 121/034 | Landsat 8 | OLI | 30 m | 2.5% | 9 |
Table 2.
Classification system for regional wetland remote-sensing maps.
| Wetland | Type | Code | Subtype |
|---|---|---|---|
| The Yellow River Delta wetlands | 01 Natural wetlands | 11 | River wetland |
| 12 | Marsh and swamp | ||
| 13 | Intertidal zone | ||
| 02 Artificial wetlands | 14 | Reservoir and pond | |
| 15 | Salt pan (salt evaporation pond) | ||
| 16 | Aquaculture |
Table 3.
Land-use/cover transition matrix.
| Time | Types | T2 | ||||||
|---|---|---|---|---|---|---|---|---|
| A1 | A2 | A3 | … | Aj | … | An | ||
| T1 | A1 | P11 | P12 | P13 | … | P1j | … | P1n |
| A2 | P21 | P22 | P23 | … | P2j | … | P2n | |
| A3 | P31 | P32 | P33 | … | P3j | … | P3n | |
| … | … | … | … | … | … | … | … | |
| Ai | Pi1 | Pi2 | Pi3 | … | Pij | … | Pin | |
| An | Pn1 | Pn2 | Pn3 | … | Pnj | … | Pnn | |
Table 4.
Wetlands classification accuracy evaluation in 2013.
| Types | Manual Interpretation | Total | User Accuracy/% | |||||
|---|---|---|---|---|---|---|---|---|
| Aquaculture Pond | River Wetland | Marsh and Swamp | Salt Pan | Reservoir and Pond | Intertidal Zone | |||
| Aquaculture pond | 185 | 6 | 10 | 5 | 0 | 0 | 206 | 89.81 |
| River wetland | 5 | 158 | 7 | 0 | 2 | 2 | 174 | 90.80 |
| Marsh and swamp | 7 | 20 | 162 | 9 | 2 | 5 | 205 | 79.02 |
| Salt pan | 0 | 4 | 7 | 168 | 8 | 1 | 188 | 89.36 |
| Reservoir and pond | 3 | 10 | 11 | 16 | 180 | 8 | 228 | 78.95 |
| Intertidal zone | 0 | 2 | 3 | 2 | 8 | 184 | 199 | 92.46 |
| Total | 200 | 200 | 200 | 200 | 200 | 200 | 1200 | |
| Producer accuracy/% | 92.50 | 79.00 | 81.00 | 84.00 | 90.00 | 92.00 | ||
| Overall accuracy = 86.0% | Kappa coefficient = 0.837 | |||||||
Table 5.
Wetland area by type in the Yellow River Delta at different periods from 1973 to 2013 (units: km2).
Table 5.
Wetland area by type in the Yellow River Delta at different periods from 1973 to 2013 (units: km2).
| Time | Marsh and Swamp | River Wetland | Reservoir and Pond | Aquaculture Pond | Salt Pan | Intertidal Zone | Total Area |
|---|---|---|---|---|---|---|---|
| 1973 | 1996.44 | 92.18 | 30.23 | 0.00 | 0.00 | 732.90 | 2851.75 |
| 1977 | 2046.74 | 113.28 | 31.29 | 0.00 | 0.00 | 691.86 | 2883.16 |
| 1984 | 2064.86 | 113.22 | 23.08 | 8.13 | 0.20 | 710.64 | 2920.23 |
| 1991 | 1738.98 | 100.03 | 63.13 | 117.52 | 6.49 | 645.76 | 2671.90 |
| 1995 | 1114.18 | 87.80 | 79.78 | 149.09 | 7.60 | 716.60 | 2355.05 |
| 2000 | 1453.79 | 91.12 | 119.86 | 188.20 | 9.68 | 610.64 | 2473.29 |
| 2006 | 1271.25 | 83.78 | 136.43 | 313.22 | 60.36 | 549.09 | 2414.13 |
| 2010 | 942.42 | 112.68 | 150.18 | 552.67 | 98.77 | 423.88 | 2280.60 |
| 2013 | 960.22 | 111.97 | 133.8 | 526.70 | 128.20 | 307.74 | 2168.63 |
Table 6.
The land cover transition matrix for the Yellow River Delta 1973–2013 (units: km2).
| Types | Sea | River | Reservoir and Pond | Marsh and Swamp | Intertidal Zone | City | Cropland | Aquaculture | Salt Pan | Oil Field | Others |
|---|---|---|---|---|---|---|---|---|---|---|---|
| Sea | 1300.91 | 14.38 | 26.65 | 133.04 | 134.77 | 3.26 | 37.38 | 19.94 | 5.94 | 99.49 | 0.19 |
| River | 1.25 | 2.88 | 2.20 | 24.83 | 0.00 | 5.27 | 29.33 | 5.37 | 0.00 | 0.00 | 2.20 |
| Reservoir and pond | 0.00 | 0.58 | 0.00 | 10.45 | 0.00 | 2.01 | 6.42 | 3.83 | 0.00 | 0.00 | 0.10 |
| Marsh and swamp | 5.18 | 41.31 | 73.42 | 506.87 | 33.55 | 285.06 | 565.53 | 295.03 | 67.29 | 3.74 | 2.97 |
| Intertidal zone | 136.36 | 17.16 | 8.63 | 130.17 | 120.87 | 14.76 | 57.61 | 149.05 | 60.96 | 26.74 | 0.00 |
| City | 0.00 | 1.44 | 1.44 | 6.71 | 0.00 | 41.31 | 7.28 | 1.25 | 0.00 | 0.00 | 0.00 |
| Cropland | 0.00 | 9.68 | 5.66 | 39.20 | 0.00 | 63.26 | 216.05 | 11.50 | 0.00 | 0.00 | 1.73 |
| Others | 1.15 | 0.67 | 9.20 | 47.83 | 0.19 | 3.26 | 16.87 | 18.88 | 0.29 | 0.00 | 0.10 |
© 2018 by the authors. Licensee MDPI, Basel, Switzerland. This article is an open access article distributed under the terms and conditions of the Creative Commons Attribution (CC BY) license (http://creativecommons.org/licenses/by/4.0/).
Share and Cite
MDPI and ACS Style
Zhu, C.; Zhang, X.; Huang, Q. Four Decades of Estuarine Wetland Changes in the Yellow River Delta Based on Landsat Observations Between 1973 and 2013. Water 2018, 10, 933. https://0-doi-org.brum.beds.ac.uk/10.3390/w10070933
AMA Style
Zhu C, Zhang X, Huang Q. Four Decades of Estuarine Wetland Changes in the Yellow River Delta Based on Landsat Observations Between 1973 and 2013. Water. 2018; 10(7):933. https://0-doi-org.brum.beds.ac.uk/10.3390/w10070933
Chicago/Turabian StyleZhu, Changming, Xin Zhang, and Qiaohua Huang. 2018. "Four Decades of Estuarine Wetland Changes in the Yellow River Delta Based on Landsat Observations Between 1973 and 2013" Water 10, no. 7: 933. https://0-doi-org.brum.beds.ac.uk/10.3390/w10070933
Note that from the first issue of 2016, this journal uses article numbers instead of page numbers. See further details here.