Effects of Climate Change and Human Activities on Soil Erosion in the Xihe River Basin, China

College of Urban and Environment, Liaoning Normal University, Dalian 116029, China
*
Author to whom correspondence should be addressed.
Water 2018, 10(8), 1085; https://0-doi-org.brum.beds.ac.uk/10.3390/w10081085
Submission received: 27 June 2018
/
Revised: 12 August 2018
/
Accepted: 13 August 2018
/
Published: 15 August 2018
(This article belongs to the Special Issue Modeling and Practice of Erosion and Sediment Transport under Change)
Abstract
:Climate change and human activities are the major factors affecting runoff and sediment load. We analyzed the inter-annual variation trends of the annual rainfall, air temperature, runoff and sediment load in the Xihe River Basin from 1969–2015. Pettitt’s test and the Soil and Water Assessment Tool (SWAT) model were used to detect sudden changes in hydro-meteorological variables and simulate the basin hydrological cycle, respectively. According to the simulation results, we explored spatial distribution of soil erosion in the watershed by utilizing ArcGIS10.0, analyzed the average soil erosion modulus by different types of land use, and quantified the contributions of climate change and human activities to runoff and sediment load in changes. The results showed that: (1) From 1969–2015, both rainfall and air temperature increased, and air temperature increased significantly (p < 0.01) at 0.326 °C/10 a (annual). Runoff and sediment load decreased, and sediment load decreased significantly (p < 0.01) at 1.63 × 10⁵ t/10 a. In 1988, air temperature experienced a sudden increased and sediment load decreased. (2) For runoff, R2 and Nash and Sutcliffe efficiency coefficient (Ens) were 0.92 and 0.91 during the calibration period and 0.90 and 0.87 during the validation period, for sediment load, R2 and Ens were 0.60 and 0.55 during the calibration period and 0.70 and 0.69 during the validation period, meeting the model’s applicability requirements. (3) Soil erosion was worse in the upper basin than other regions, and highest in cultivated land. Climate change exacerbates runoff and sediment load with overall contribution to the total change of −26.54% and −8.8%, respectively. Human activities decreased runoff and sediment load with overall contribution to the total change of 126.54% and 108.8% respectively. The variation of runoff and sediment load in the Xihe River Basin is largely caused by human activities.
1. Introduction
Soil erosion can be differentiated into natural erosion, which is a geographical phenomenon affecting the surface of the Earth, and human activities-accelerated erosion. The speed of soil erosion arising from human activities significantly exceeds the rate of soil formation. Soil erosion leads to the loss of soil nutrients, decline in soil fertility [1], deterioration of the ecological environment, and changes to the ecological landscape [2]. Soil erosion can also result in the accumulation of sediment in river channels, rising of river beds, sediment accumulation in reservoirs, and increased risk of flooding [3]. The dangers of soil erosion are compelling, and it is among the most significant global environmental concerns [4,5]. Scholars have conducted extensive research in various regions around the world with the aim of distinguishing the factors that influence soil erosion and developing new control methods [6,7,8,9,10,11,12,13,14]. The Soil and Water Assessment Tool (SWAT) [15,16] is a large-scale watershed hydrological model developed by the Agricultural Research Center of the US Department of Agriculture. The model contains three sub-models, namely the hydrological process, soil erosion, and pollution load and can simulate runoff and sediment load, nonpoint source pollution, and pesticide diffusion [17]. The tool is widely applied today in studying the water and sediment simulation and soil erosion of the basin [18,19,20,21,22,23]. Using the SWAT model, Wu et al. [24] quantified the impacts of climate change and human activities on runoff and sediment in the Yanhe River Basin and found that climate change and human activities are the main factors affecting runoff and sediment, respectively. Alighalehbabakhani et al. [25] used the SWAT model to evaluate sediment accumulation rates within the Lake Rockwell and Ballville reservoirs and concluded that sediment accumulation efficiency is closely related to the characteristics of the inflow, reservoir inflow time, and reservoir size. Yen et al. [26] built the Arroyo Colorado watershed SWAT model and studied the effects of the four different sediment transport functions to predict sediment. They demonstrated that without complete observation data, four sediment transport equations might produce similar sediment yield and the default model might not necessarily simulate the best results. At present quantitatively distinguish the effects of climate change and human activities on runoff and soil erosion has attracted much attention from scholars and identifying the impacts of each factor has important applications value in controlling soil erosion [27].
China is one of the countries with the most serious soil erosion in the world. The soil erosion types are various, and the erosion process is complex. It mainly occurs in the Loess Plateau of the middle and upper reaches of the Yellow River, the hilly areas in the middle and upper reaches of the Yangtze River, and the Northeast Plain area. According to the second national remote sensing survey of soil erosion in 2001, the area of water and wind erosion in China is 3.569 million km2, accounting for 37% of the land area. These phenomena seriously affect China’s ecological environment construction, hindering social and economic development.
The continuously increasing population of the basin and the rapid development of companies such as Benxi Steel Group and Bei Steel Group along the Xihe River have increased domestic as well as industrial and agricultural water use, resulting in a reduction of runoff in the basin. In addition, the accelerated urbanization rate has increased the urban land area, the ground is hardened and the soil is not easily eroded. From 2006–2008, the Nanfen District of the Xihe River Basin implemented numerous control measures including automation of dams, flood dikes, and dredging, therefore sediment discharge from the upper stream into the channel was intercepted and cleared, resulting in a significant reduction in sediment load [28]. The Nanfen tailings pool has also achieved ecological benefits. The forest surface has increased, effectively decreased runoff and soil erosion in the tailings reservoir area. In 2012, to restore the natural environment of the Xihe River Basin, the Nanfen District implemented the “Blue Water Project” for Xihe River and its tributaries, including river closure and protection. A land area of 1299 ha of land was preserved, and 264 ha of forest were planted, which effectively reduced soil erosion and sediment transported downstream.
The overall objective of this study is to investigate changes in runoff and sediment load from climatic change and human activities in Xihe River Basin of Northeast China. The primary objectives are: (1) to identify abrupt change points in annual hydro-meteorological series from 1969–2015; (2) to apply a SWAT model in the Xihe River Basin; (3) to evaluate the impacts of climate change and human activities on runoff and soil erosion. The results can provide valuable reference information for controlling soil erosion in this basin.
2. Materials and Methods
2.1. Research Area Overview
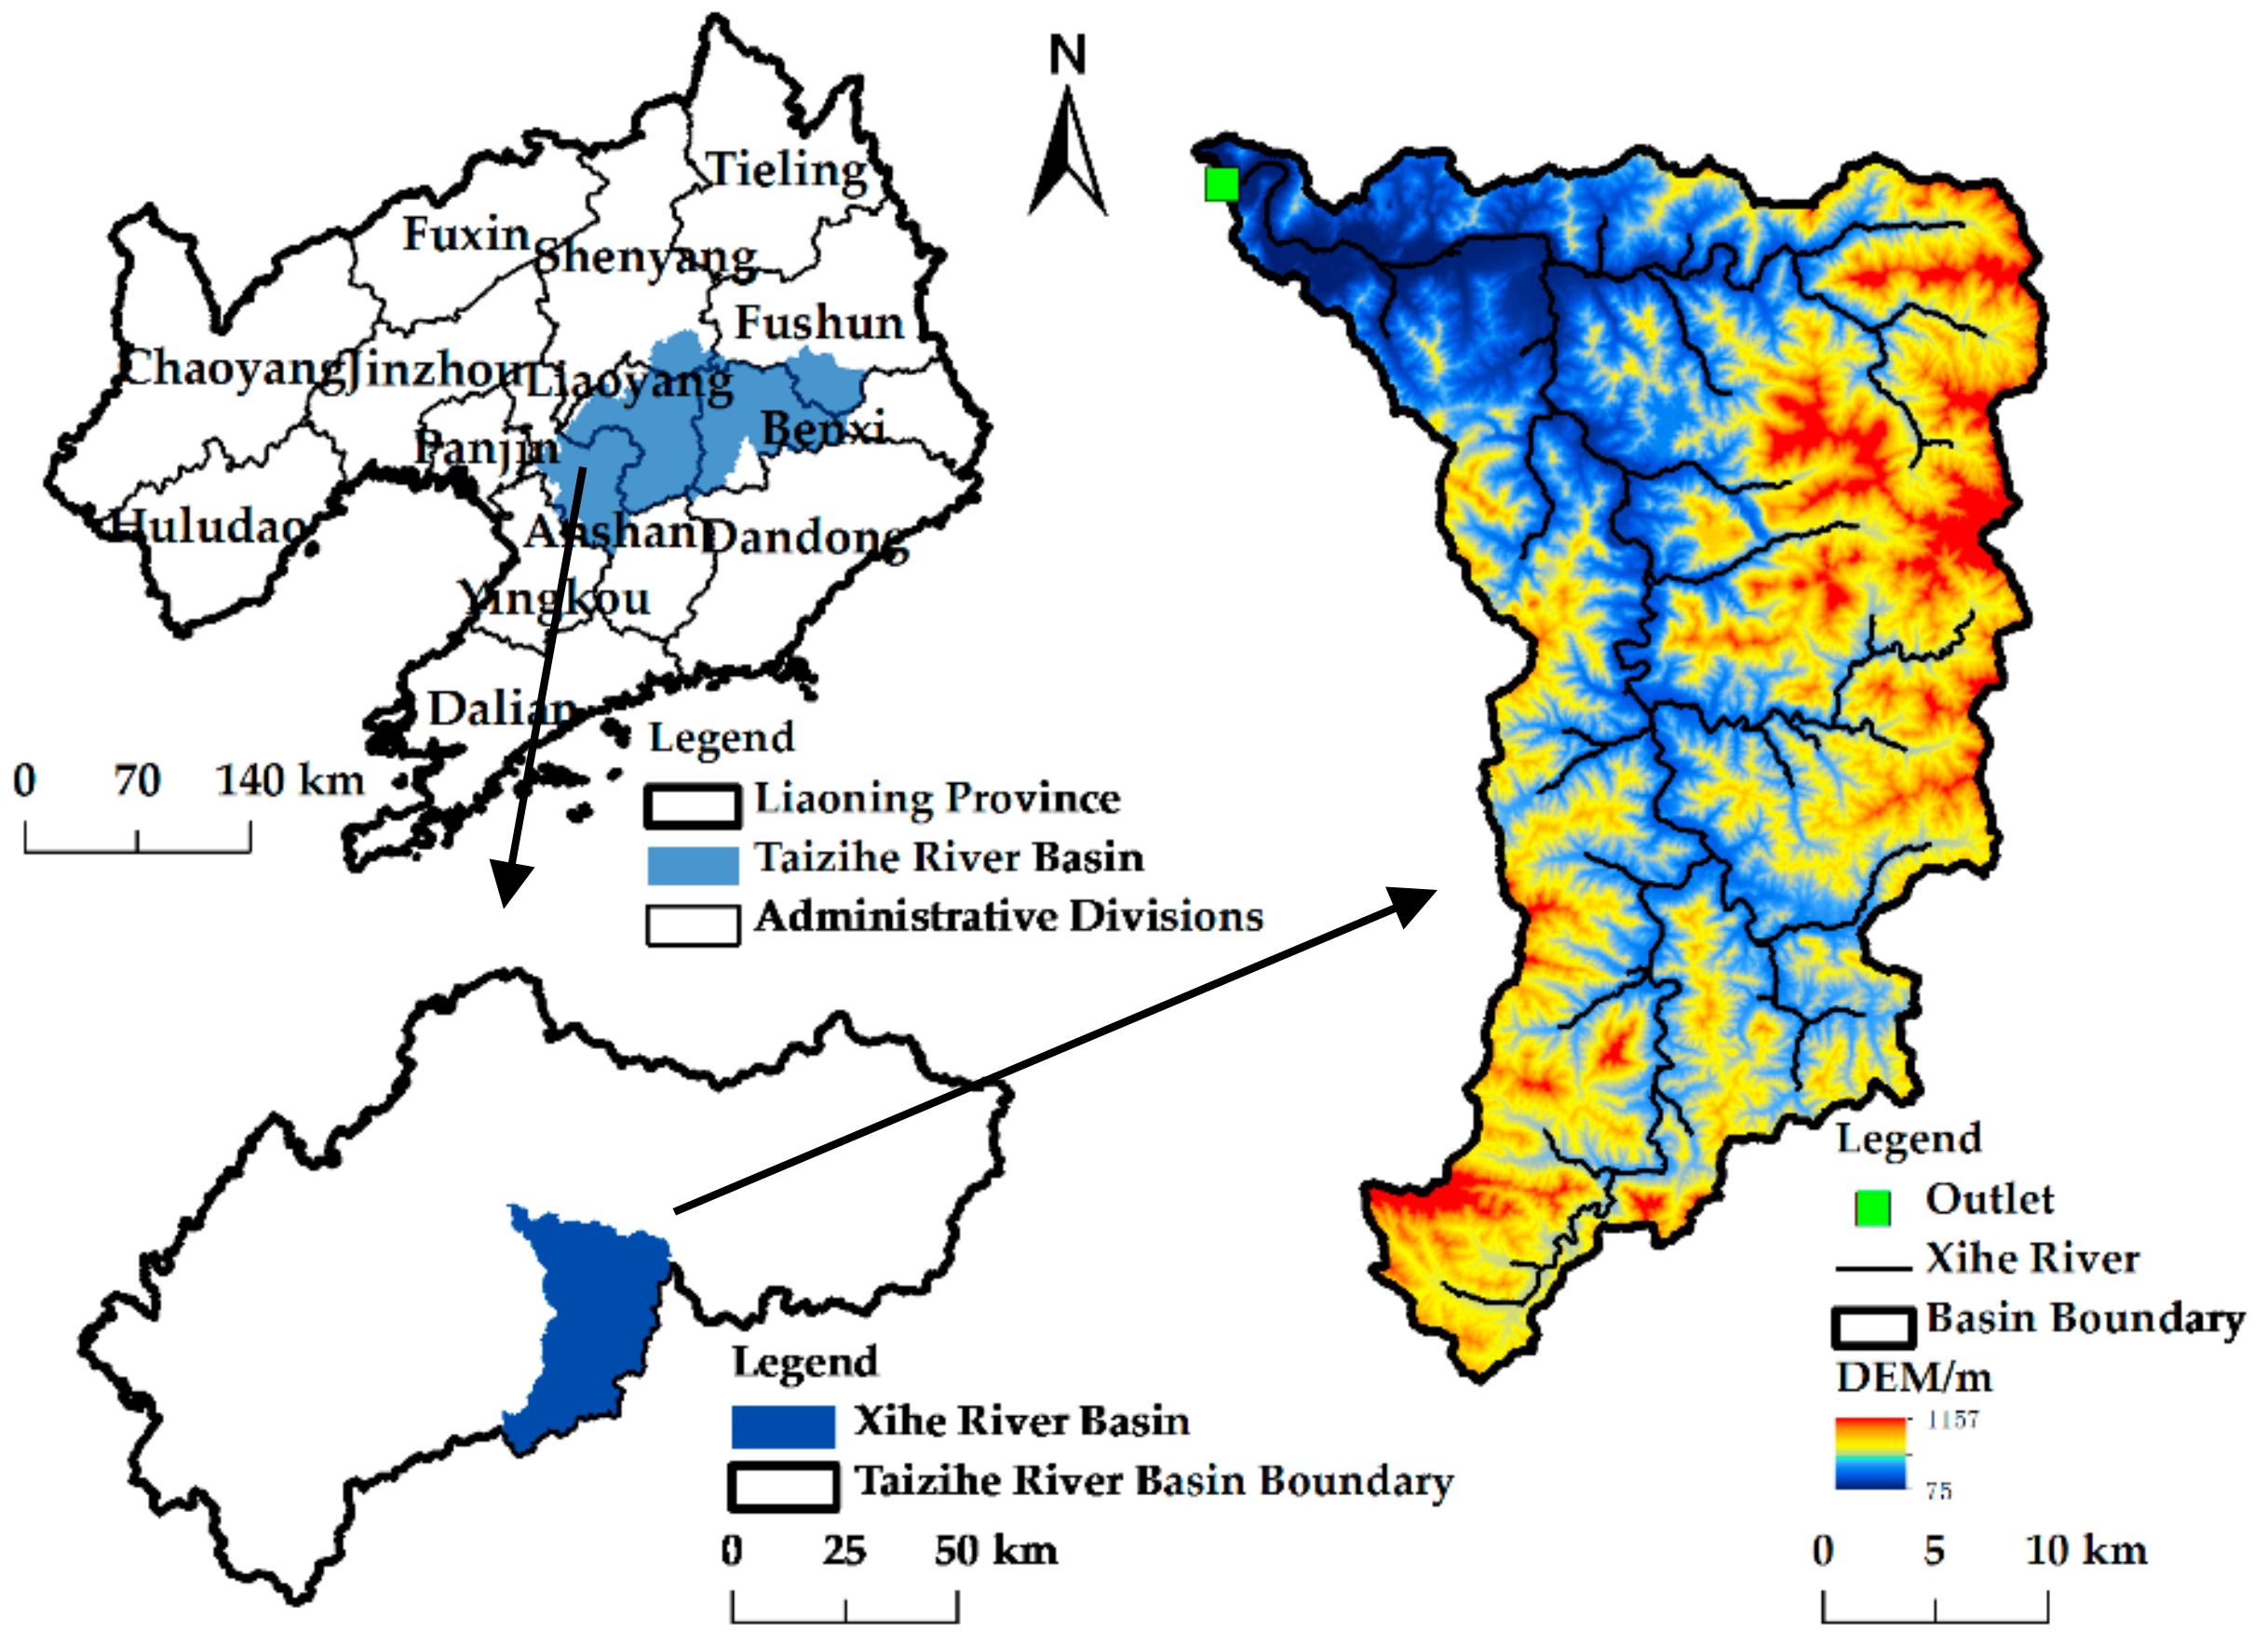
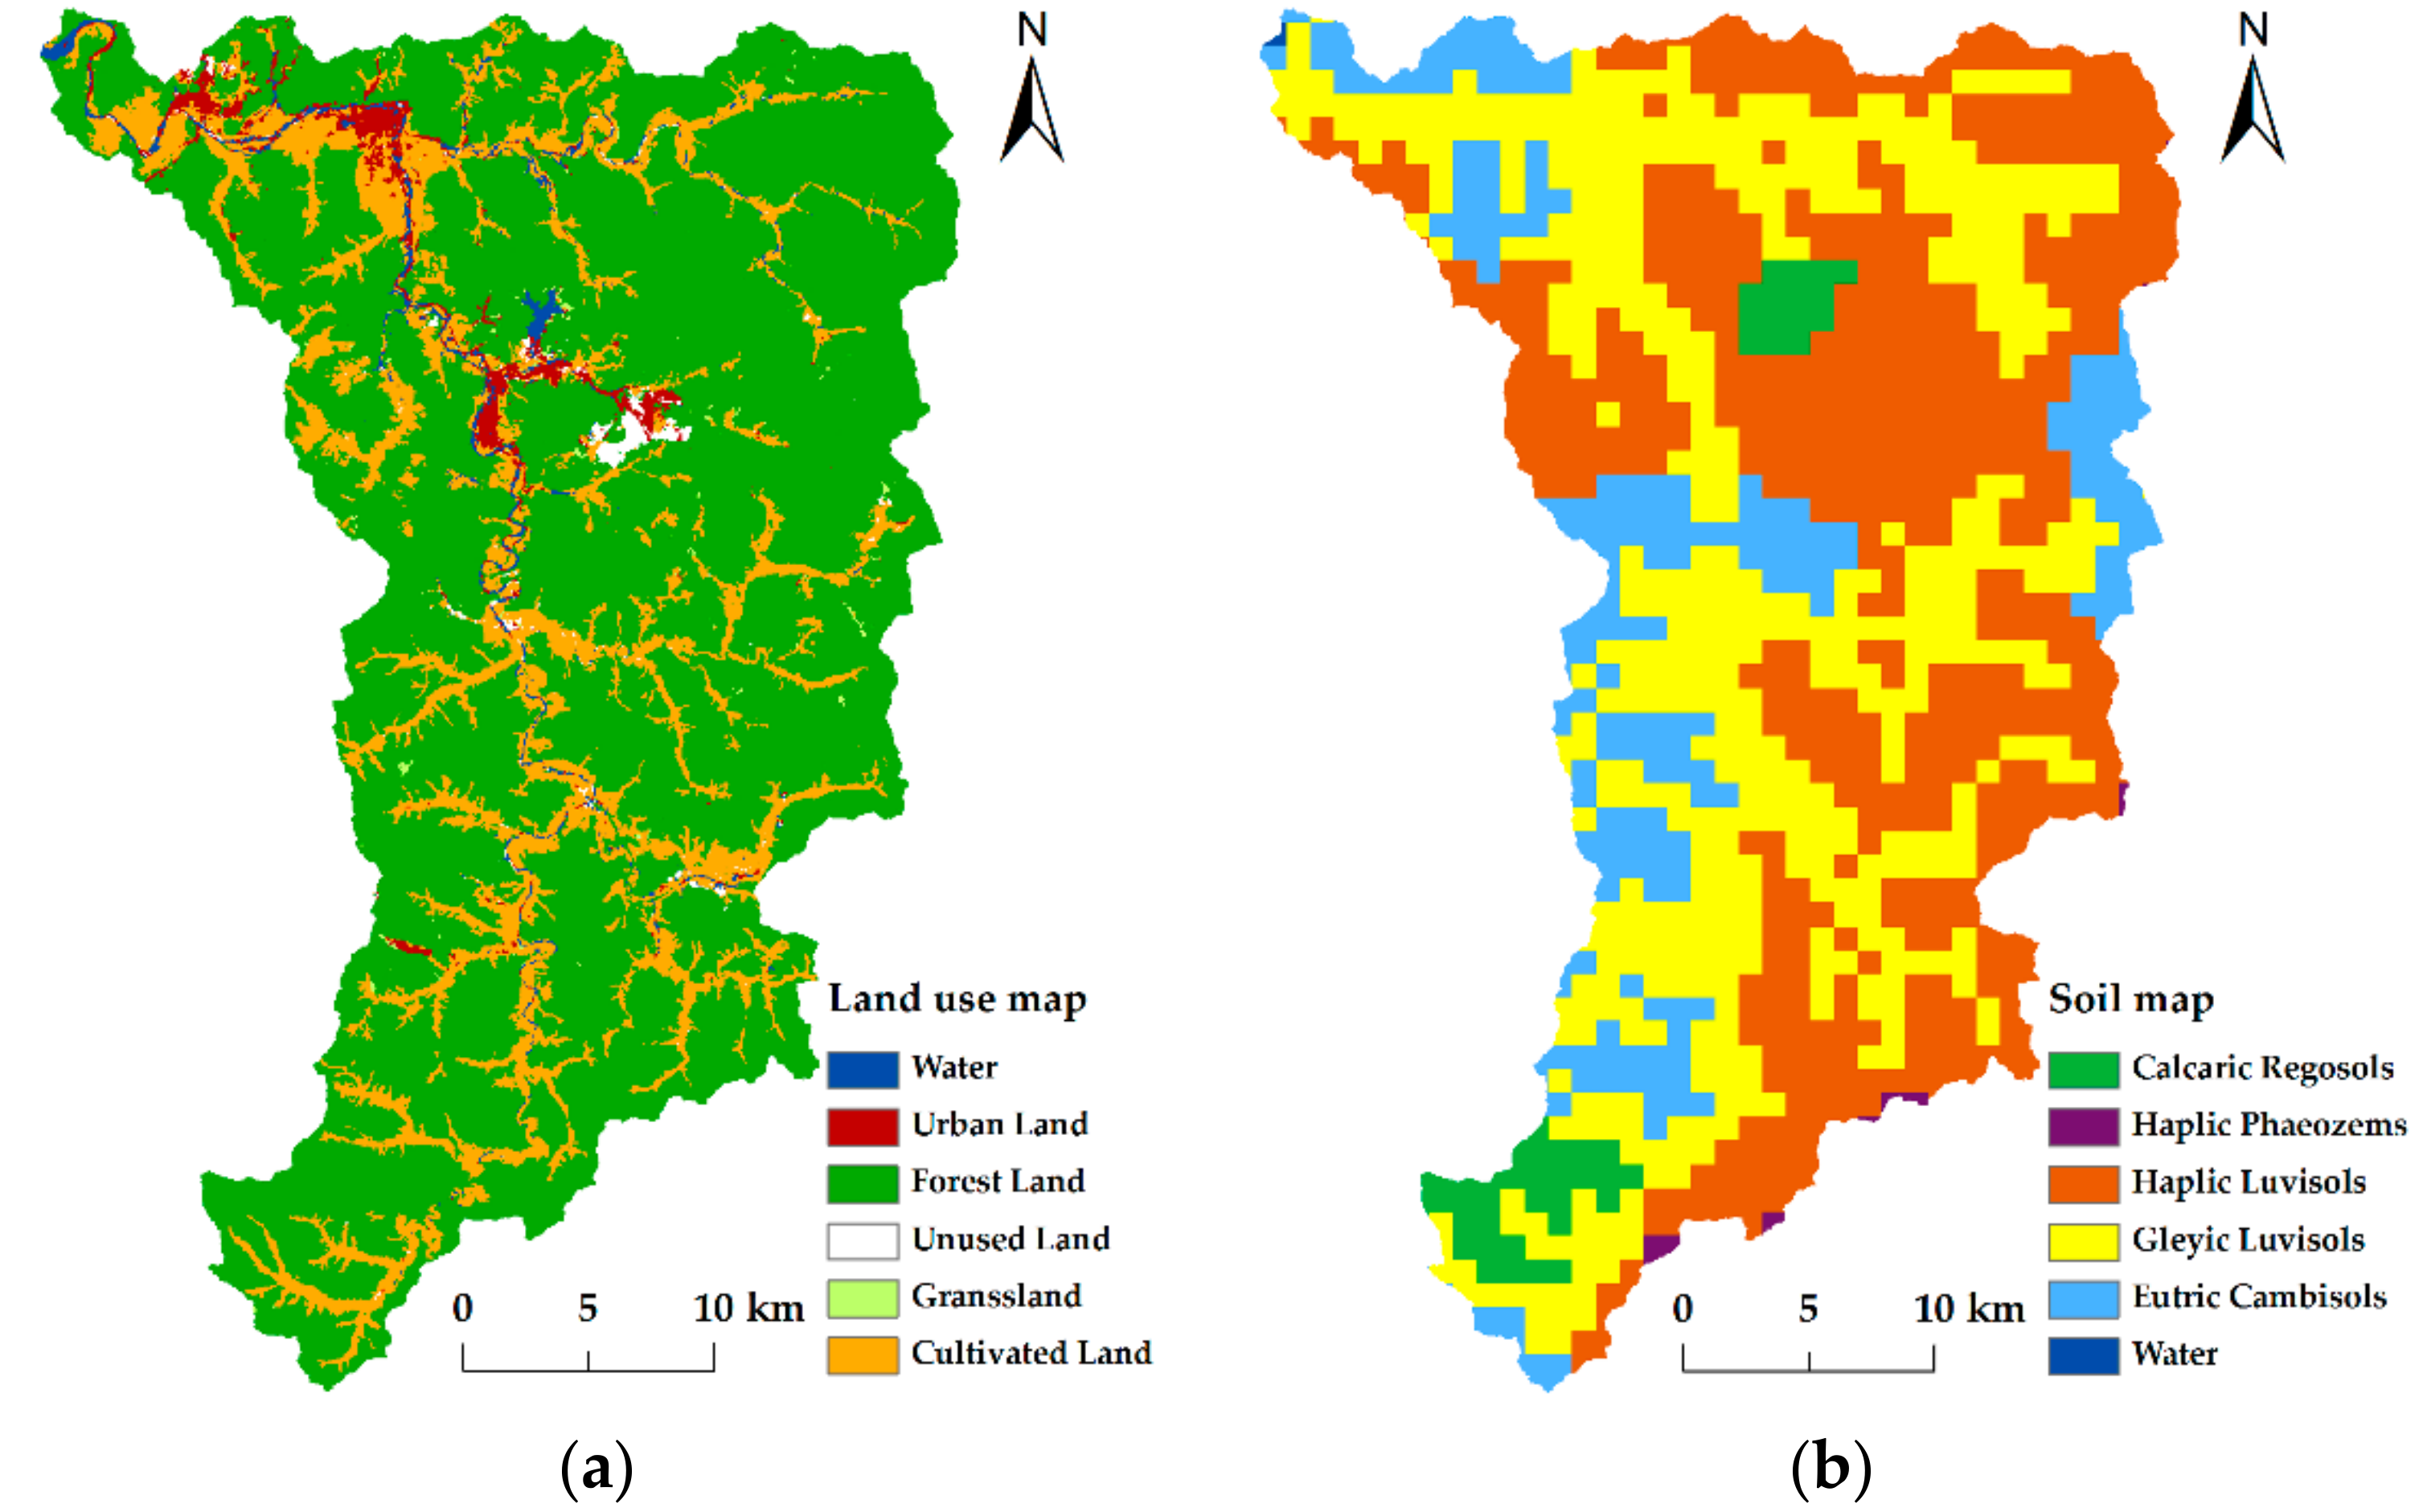
The Xihe River Basin is in the eastern region of Liaoning Province (China), centered in Benxi City and is a tributary of the Taizihe River, which is located between 40°47′–41°16′ N and 123°32′–123°59′ E. The diagram of the research area is shown in Figure 1. Its source lies in Fengcheng County, Dandong City, Liaoning Province and the basin has a total area of 1047 km2. It is the main source of water for industrial, agricultural, and residential consumption in Benxi City. The area is dominated by mountains ranging from 75 to 1157 m a.s.l (above sea level). The characteristic of the area is high lands in the east and south, and low lands in the center and northwest. The east belongs to the Changbai Mountains. The region is in the semi-humid and semi-arid monsoon climate zones. The months with the highest and lowest temperature are July and January respectively, with an annual average temperature and annual rainfall of 8.4 °C and 772.18 mm, respectively. There are five types of land uses in the basin: woodland, cultivated land, towns, water areas, and unused land. The soil types are Calcaric Regosols, Haplic Phaeozem, Haplic Luvisols, Gleyic Luvisol, and Eutric Cambisols.
2.2. Data Sources and Research Methodology
2.2.1. Data Sources
2.2.2. Analysis of the Changed Characteristics of Hydro-Meteorological Elements
In this study, linear regression analysis and the Pettitt sudden change point detection method [29] were used to analyze the inter-annual variation trends and sudden changes in rainfall, air temperature, runoff, and sediment load in the Xihe River Basin from 1969–2015. The Pettitt sudden change detection method is a non-parametric test that can quantify the statistically significant level of change points while varying the hydrological and meteorological factors, which has been widely used by scholars [30,31,32]. This method uses the Mann–Whitney statistical function Ut,N, and considers the samples x1, x2, …, xt and xt+1, …, xN to be independently and identically distributed. N represents the sample size. Ut,N is calculated as:
If time t is satisfied by then t represents a sudden change point and the formula for the significant level of p of the change point is as follows:
If p ≤ 0.05 then the detected variations are considered statistically significant.
According to the sudden change analysis, the time series of runoff and sediment load from 1969–2015 were divided into two periods. The period prior to the sudden change was considered as ‘the baseline period’ and used as the calibration period. The period after the sudden change was considered as ‘the impacted period’ and used as the validation period [33,34,35].
2.2.3. SWAT Model Set Up
The SWAT model is a physically based distributed model that can evaluate the impact of land management practices on water resources, sediments and agricultural chemical yields in large and complex basins. The major components of SWAT include climate, hydrology, sediment movement, crop growth, nutrient cycling and agricultural management. SWAT model divide the basin into numerous sub-basins based on topography, and then further subdivided into a series of Hydrologic Response Units (HRU) with unique soil, land cover and slope characteristics [16].
In this study, we chose the Soil Conservation Service curve number (SCS-CN) procedure that SWAT model provides [36] to estimate surface runoff. SWAT calculates the peak runoff rate using a modified rational method. The potential evapotranspiration is estimated by using the Penman–Monteith method [37]. It is calculated by the following formula:
where is latent heat flux density (MJ/( m2·d)); is evaporation rate (mm/d); is saturation vapor pressure-the slope of the temperature curve; is net radiation (MJ/( m2·d)); is ground heat flux density (MJ/( m2·d)); is air density (kg/m3); is specific heat at fixed air pressure (MJ/kg °C); is saturated vapor pressure at z height (kPa); is the vapor pressure at z height (kPa); is psychrometric constant (kPa/°C); is the impedance of the vegetation canopy (s/m); is the diffusion impedance of the air layer (s/m).
The SWAT model uses the Modified Universal Soil Loss Equation (MUSLE) to simulate sediment yield [38]. Sediment transport is a function of deposition and degradation, which are determined through comparing the sediment concentration and maximum sediment concentration [39]. Further details of hydrological and sediment transport processes can be found in the SWAT Theoretical Documentation [39].
We used the ArcSWAT 2009 interface to establish and parameterize the model. First, we chose a threshold drainage area of 22.13 km2, which is recommended by SWAT model, to delineate the basin. And the basin was divided into 27 sub-basins. Furthermore 960 HRUs were generated according to the thresholds of land use (0%), soil type (0%), and slope class (0%), respectively. The HWSD database provides partial physical attribute data for the soil, the effective field water content (SOL_AWC) and other attributes were calculated using the soil water characteristic software “SPAW”. The minimum infiltration rate was calculated according to the empirical formula introduced in literature [40], and the soil erosion factor USLE_K was calculated according to the basic principle of SWAT [39]. Finally, we set up the SWAT model using daily meteorological data from 1969–2015, and calibrated the parameters using runoff and sediment load data of the baseline period, therefore the natural rainfall-runoff process was simulated.
2.2.4. Model Sensitivity Analysis, Calibration and Validation
There are many parameters in SWAT model that affect the results of runoff and sediment load simulations. In order to select the main parameters to improve the usability of the model, the sensitivity analysis of the parameters should be carried out first. We use the sequential uncertainty fitting algorithm (SUFI-2) algorithm [41] in SWAT-CUP 2012 to carry out sensitivity analysis. The ‘baseline period’ was used as the calibration period, and the ‘impacted period’ was used as the validation period. The model performance was assessed by the coefficient of determination (R2) and Nash and Sutcliffe efficiency coefficient (Ens) [42]. R2 is the square of the correlation coefficient, and the closer it is to 1, the higher the degree of agreement between the simulated value and the observed value is. Ens is a statistical measure that determines the relative magnitude of the residual variance compared to the measured data variance, and the closer it is to 1, the closer the simulated value is to the observed value. When R2 ≥ 0.6 and Ens ≥ 0.5, the simulation results may be deemed satisfactory [43].
2.2.5. Quantitative Analysis of the Effects of Climate Change and Human Activities on Runoff and Sediment load
Runoff and sediment load are simultaneously affected by climate change and human activities, the total changes in runoff and sediment load is the difference between the baseline period and the impacted period of the observed value, and was calculated as follows:
where represents total change, while and represent the observed annual average values of the baseline period and the impacted period, respectively. Change in total runoff and sediment load can be separated into climate change and human activities, as follows:
where represents hydrological changes attributable to climate change, and represents hydrological changes attributable to human activities, calculated as follows:
where represents the SWAT model simulated baseline period annual average values, and represents the SWAT model simulated impacted period annual average values. The difference between and represents the amount of runoff and sediment load attributable to climate change. According to Equation (5), the difference between and is the amount of change attributable to human activities. The percent contributions of change in runoff and sediment load attributable to climate change and human activities can be calculated as follows:
3. Results
3.1. Temporal Trends and Sudden Changes Analysis of Hydrological and Meteorological Variables
3.1.1. Inter-Annual Variation Trends in Hydrological and Meteorological Variables
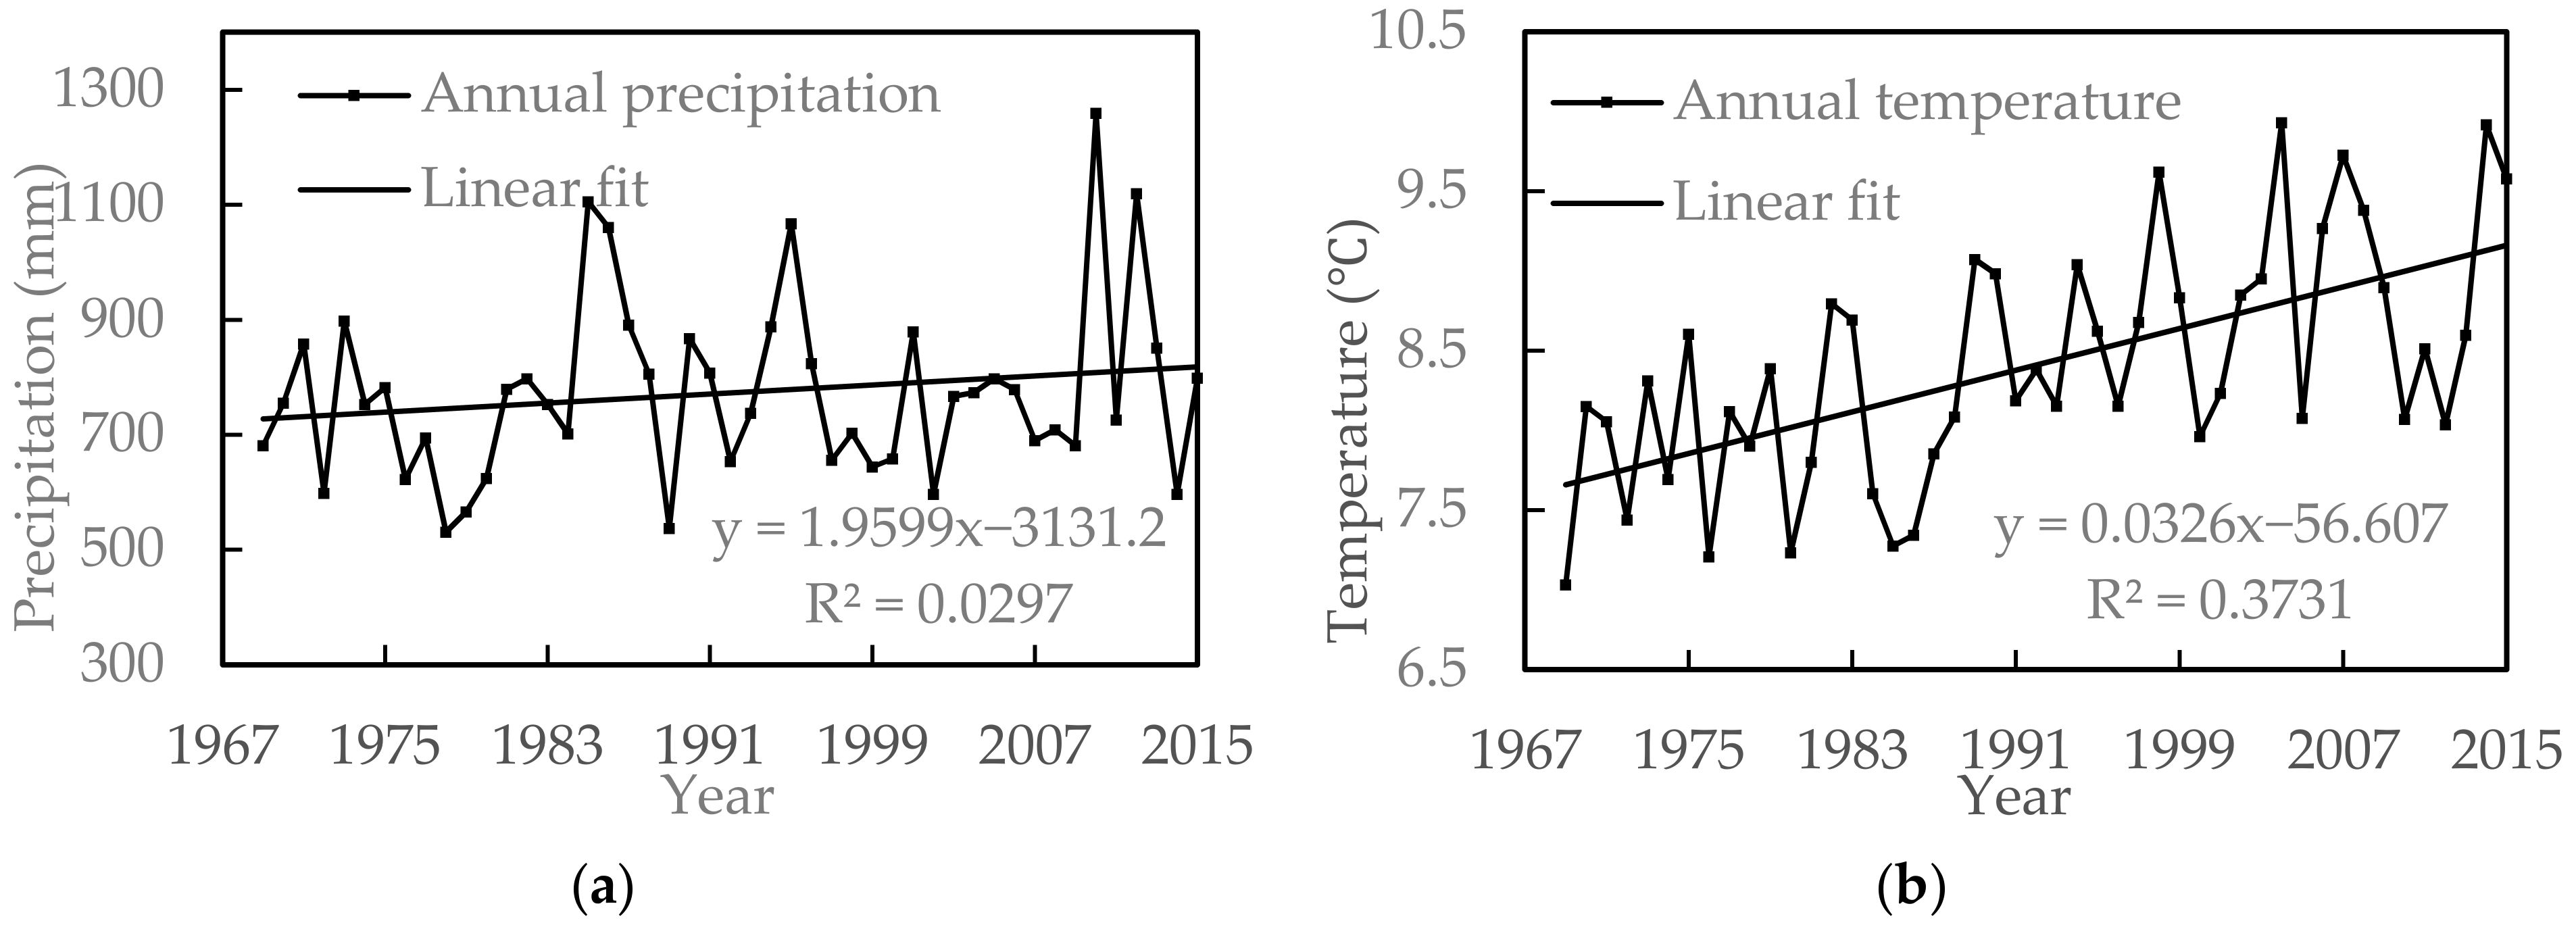
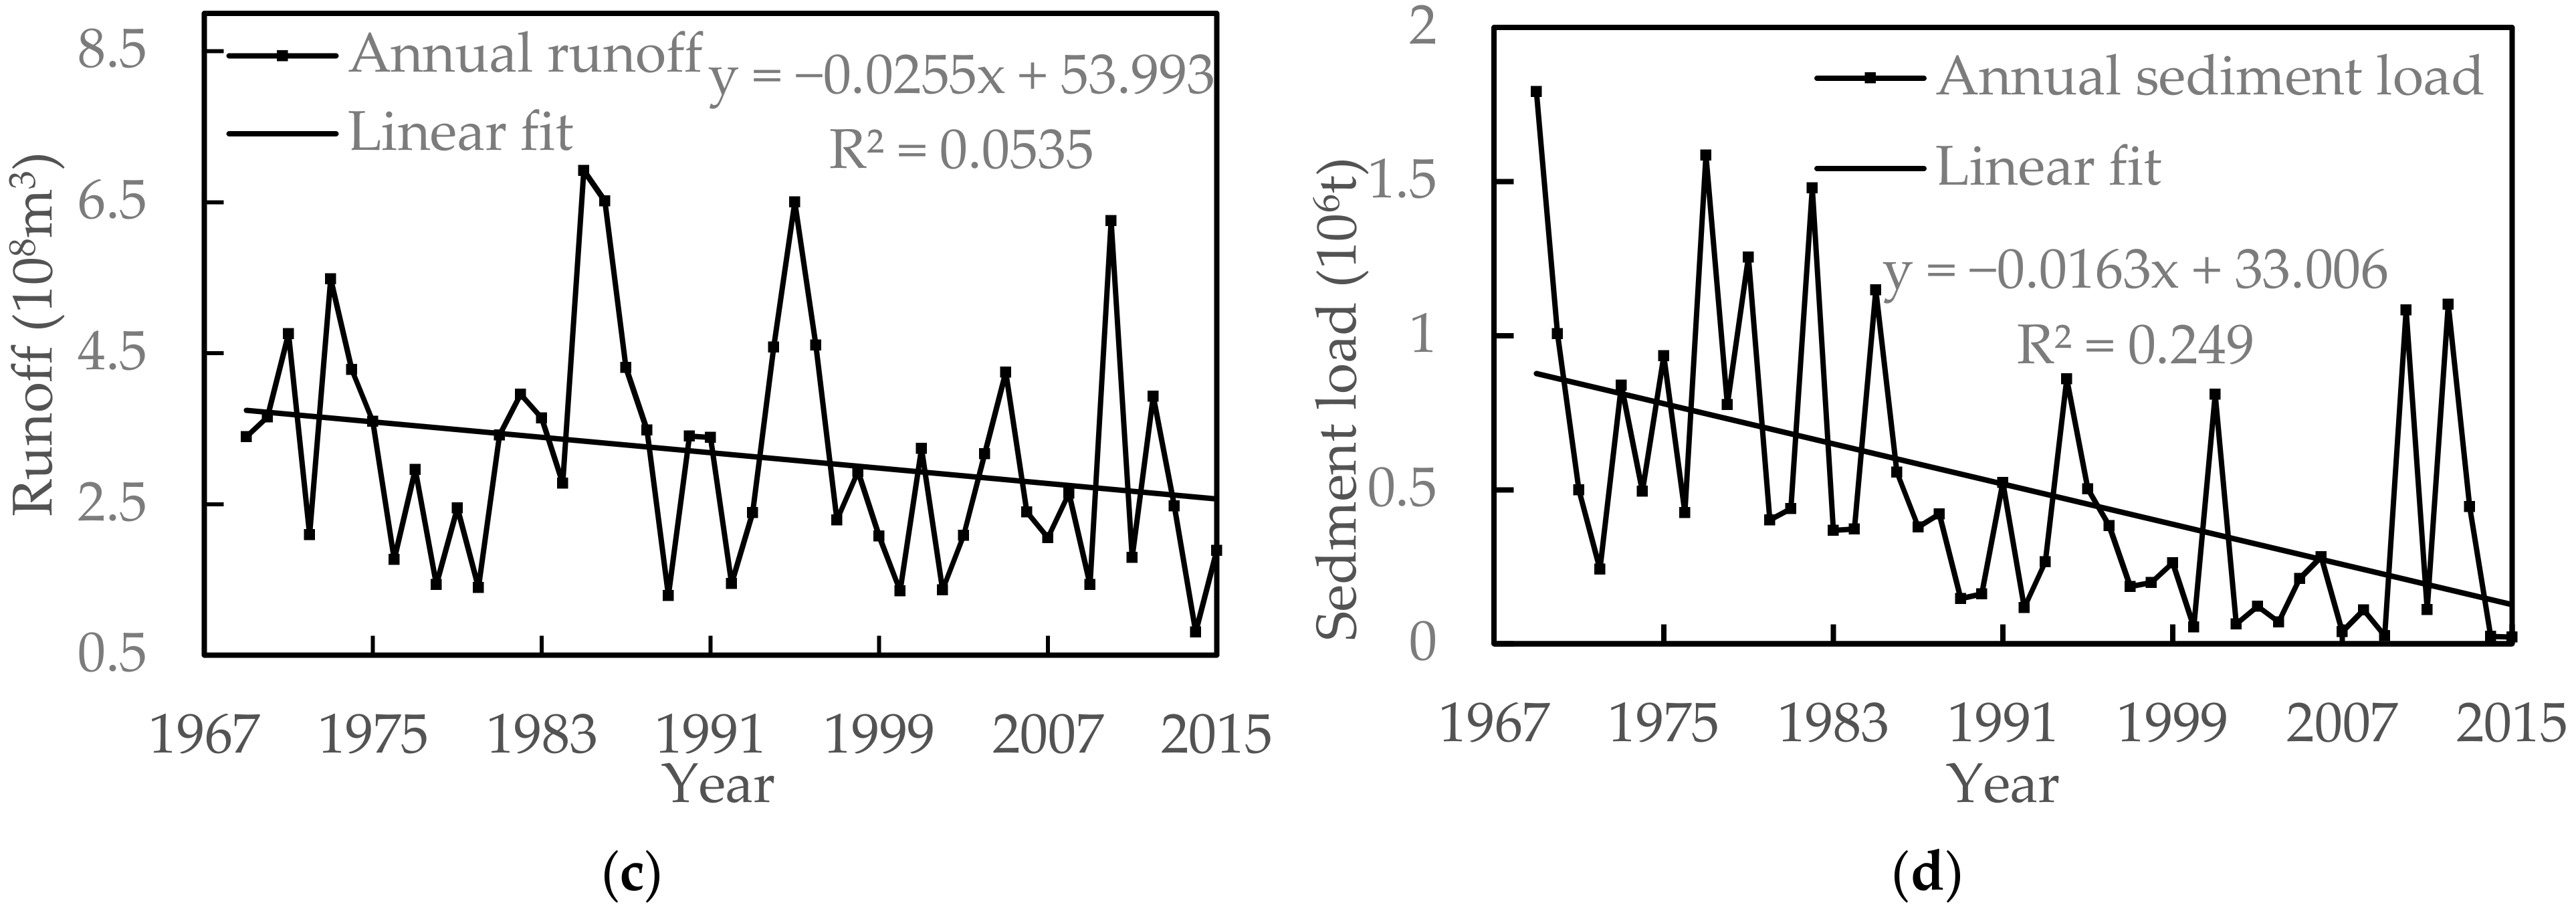
The variation trends of annual precipitation, temperature, runoff, and sediment load in the Xihe River Basin from 1969–2015 can be found in Figure 3a,d. In the basin, the annual precipitation showed an insignificant increasing trend and the annual runoff showed an insignificant decreasing trend. The annual average precipitation and runoff was 772.18 mm and 3.16 × 10⁸ m3, respectively. The annual average temperature was 8.4 °C and annual temperature showed a significantly increasing trend (p < 0.01) at a rate of 0.326 °C/10 a. The annual average sediment load was 5.02 × 10⁵ t, and annual sediment load showed a significantly decreasing trend (p < 0.01) at a rate of 1.63 × 10⁵ t/10 a.
3.1.2. Hydrological and Meteorological Variables Sudden Changes Analysis
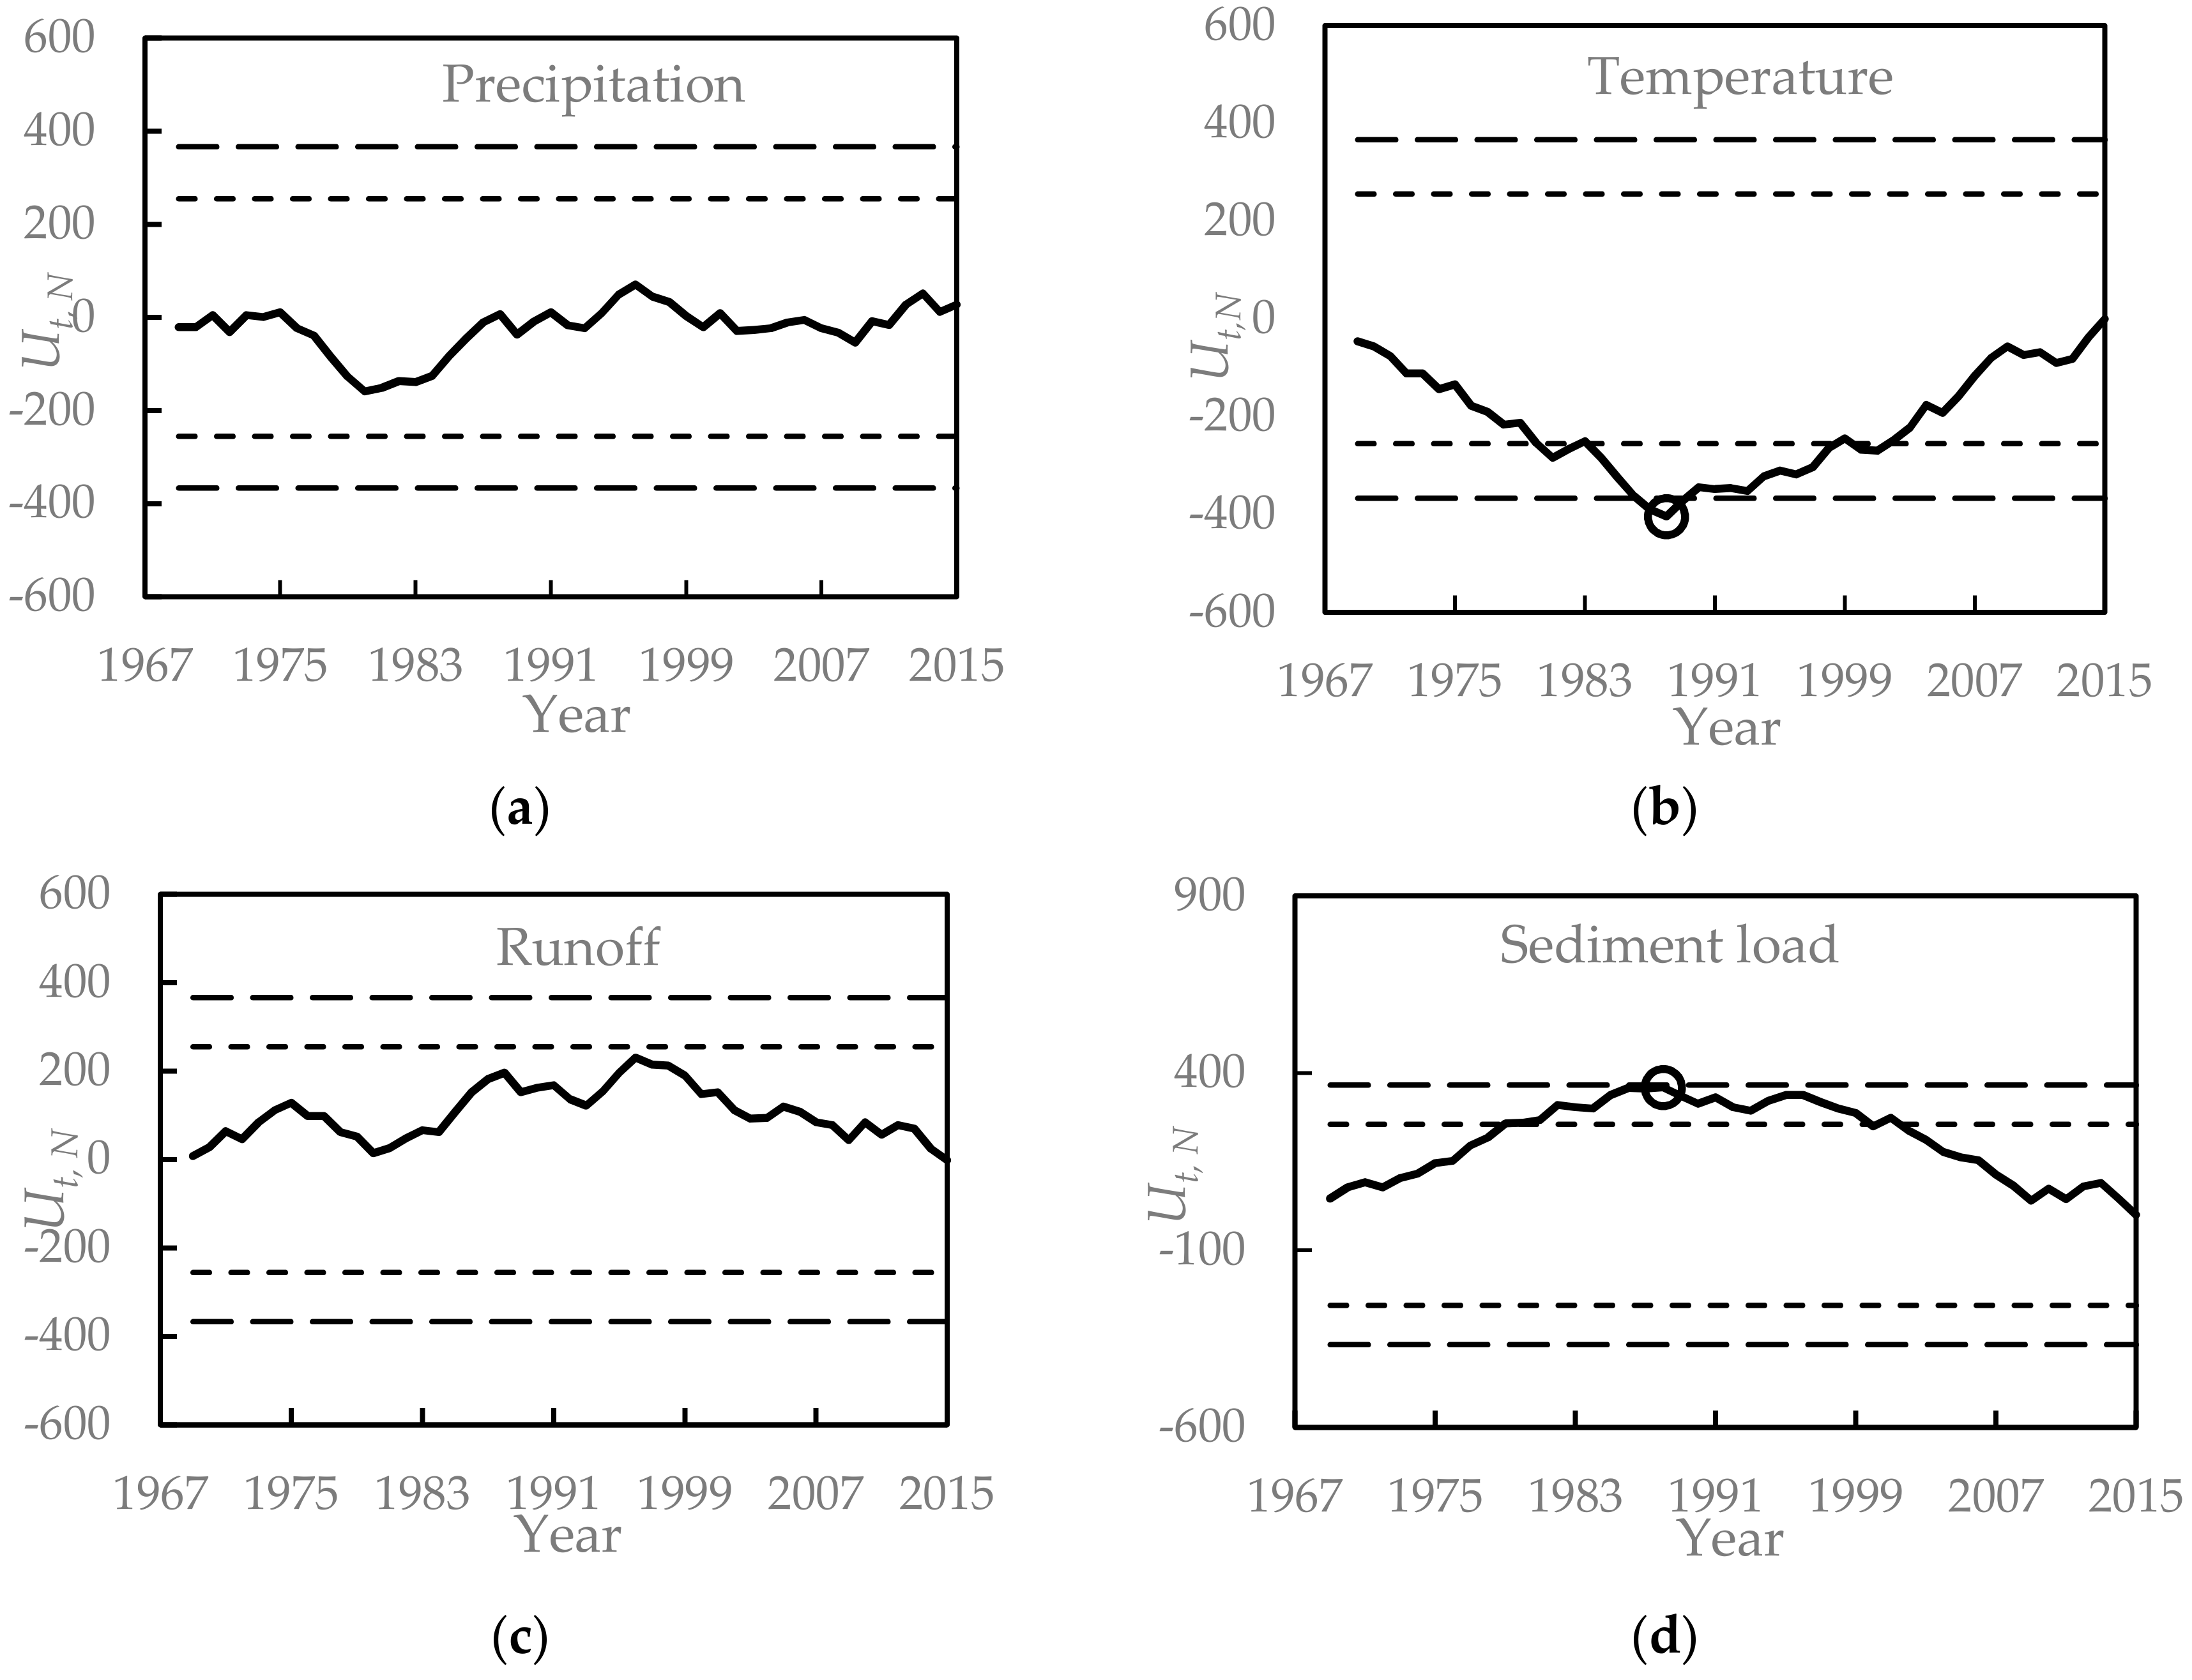
The results of the Pettitt sudden changes analysis of annual precipitation, temperature, runoff, and sediment load in the Xihe River Basin from 1969–2015 can be found in Figure 4a–b. The results showed no sudden changes in precipitation and runoff. The results of the temperature tests |Ut,N| showed that the largest year was 1988 (p < 0.01). Prior to the change point, the annual average temperature was 7.88 °C, and afterwards it was 8.78 °C. Following the change point, the annual average temperature increased by 11.56%. Sediment load in 1988 also experienced a sudden change (p < 0.05). Prior to the change point, the annual average sediment load was 7.89 × 10⁵ t and after the change point was 3.75 × 10⁵ t. After the change point, the annual average sediment load decreased by 52.47%. To study the effect of climate change and human activities on runoff and sediment load, the study period was divided into two periods, the baseline period 1971–1987 and the impacted period 1988–2015.
3.2. SWAT Model Simulation Results
The results of parameters sensitivity analysis for runoff and sediment load are showed in Table 2. The most sensitive parameters for runoff and sediment load are the base flow alpha factor (ALPHA_BF) and sediment movement linear compensation coefficient (SPCON), respectively. What needs illustration is that the final range of USLE_P is 0.56–1; this corresponds to the farming practices in the Xihe River Basin. In this watershed, the cultivated land is mainly distributed along the river. Contour tillage with conservative farming methods is most common.
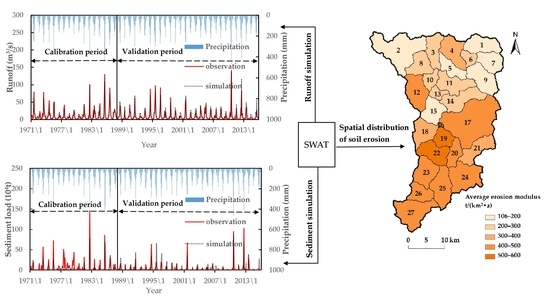
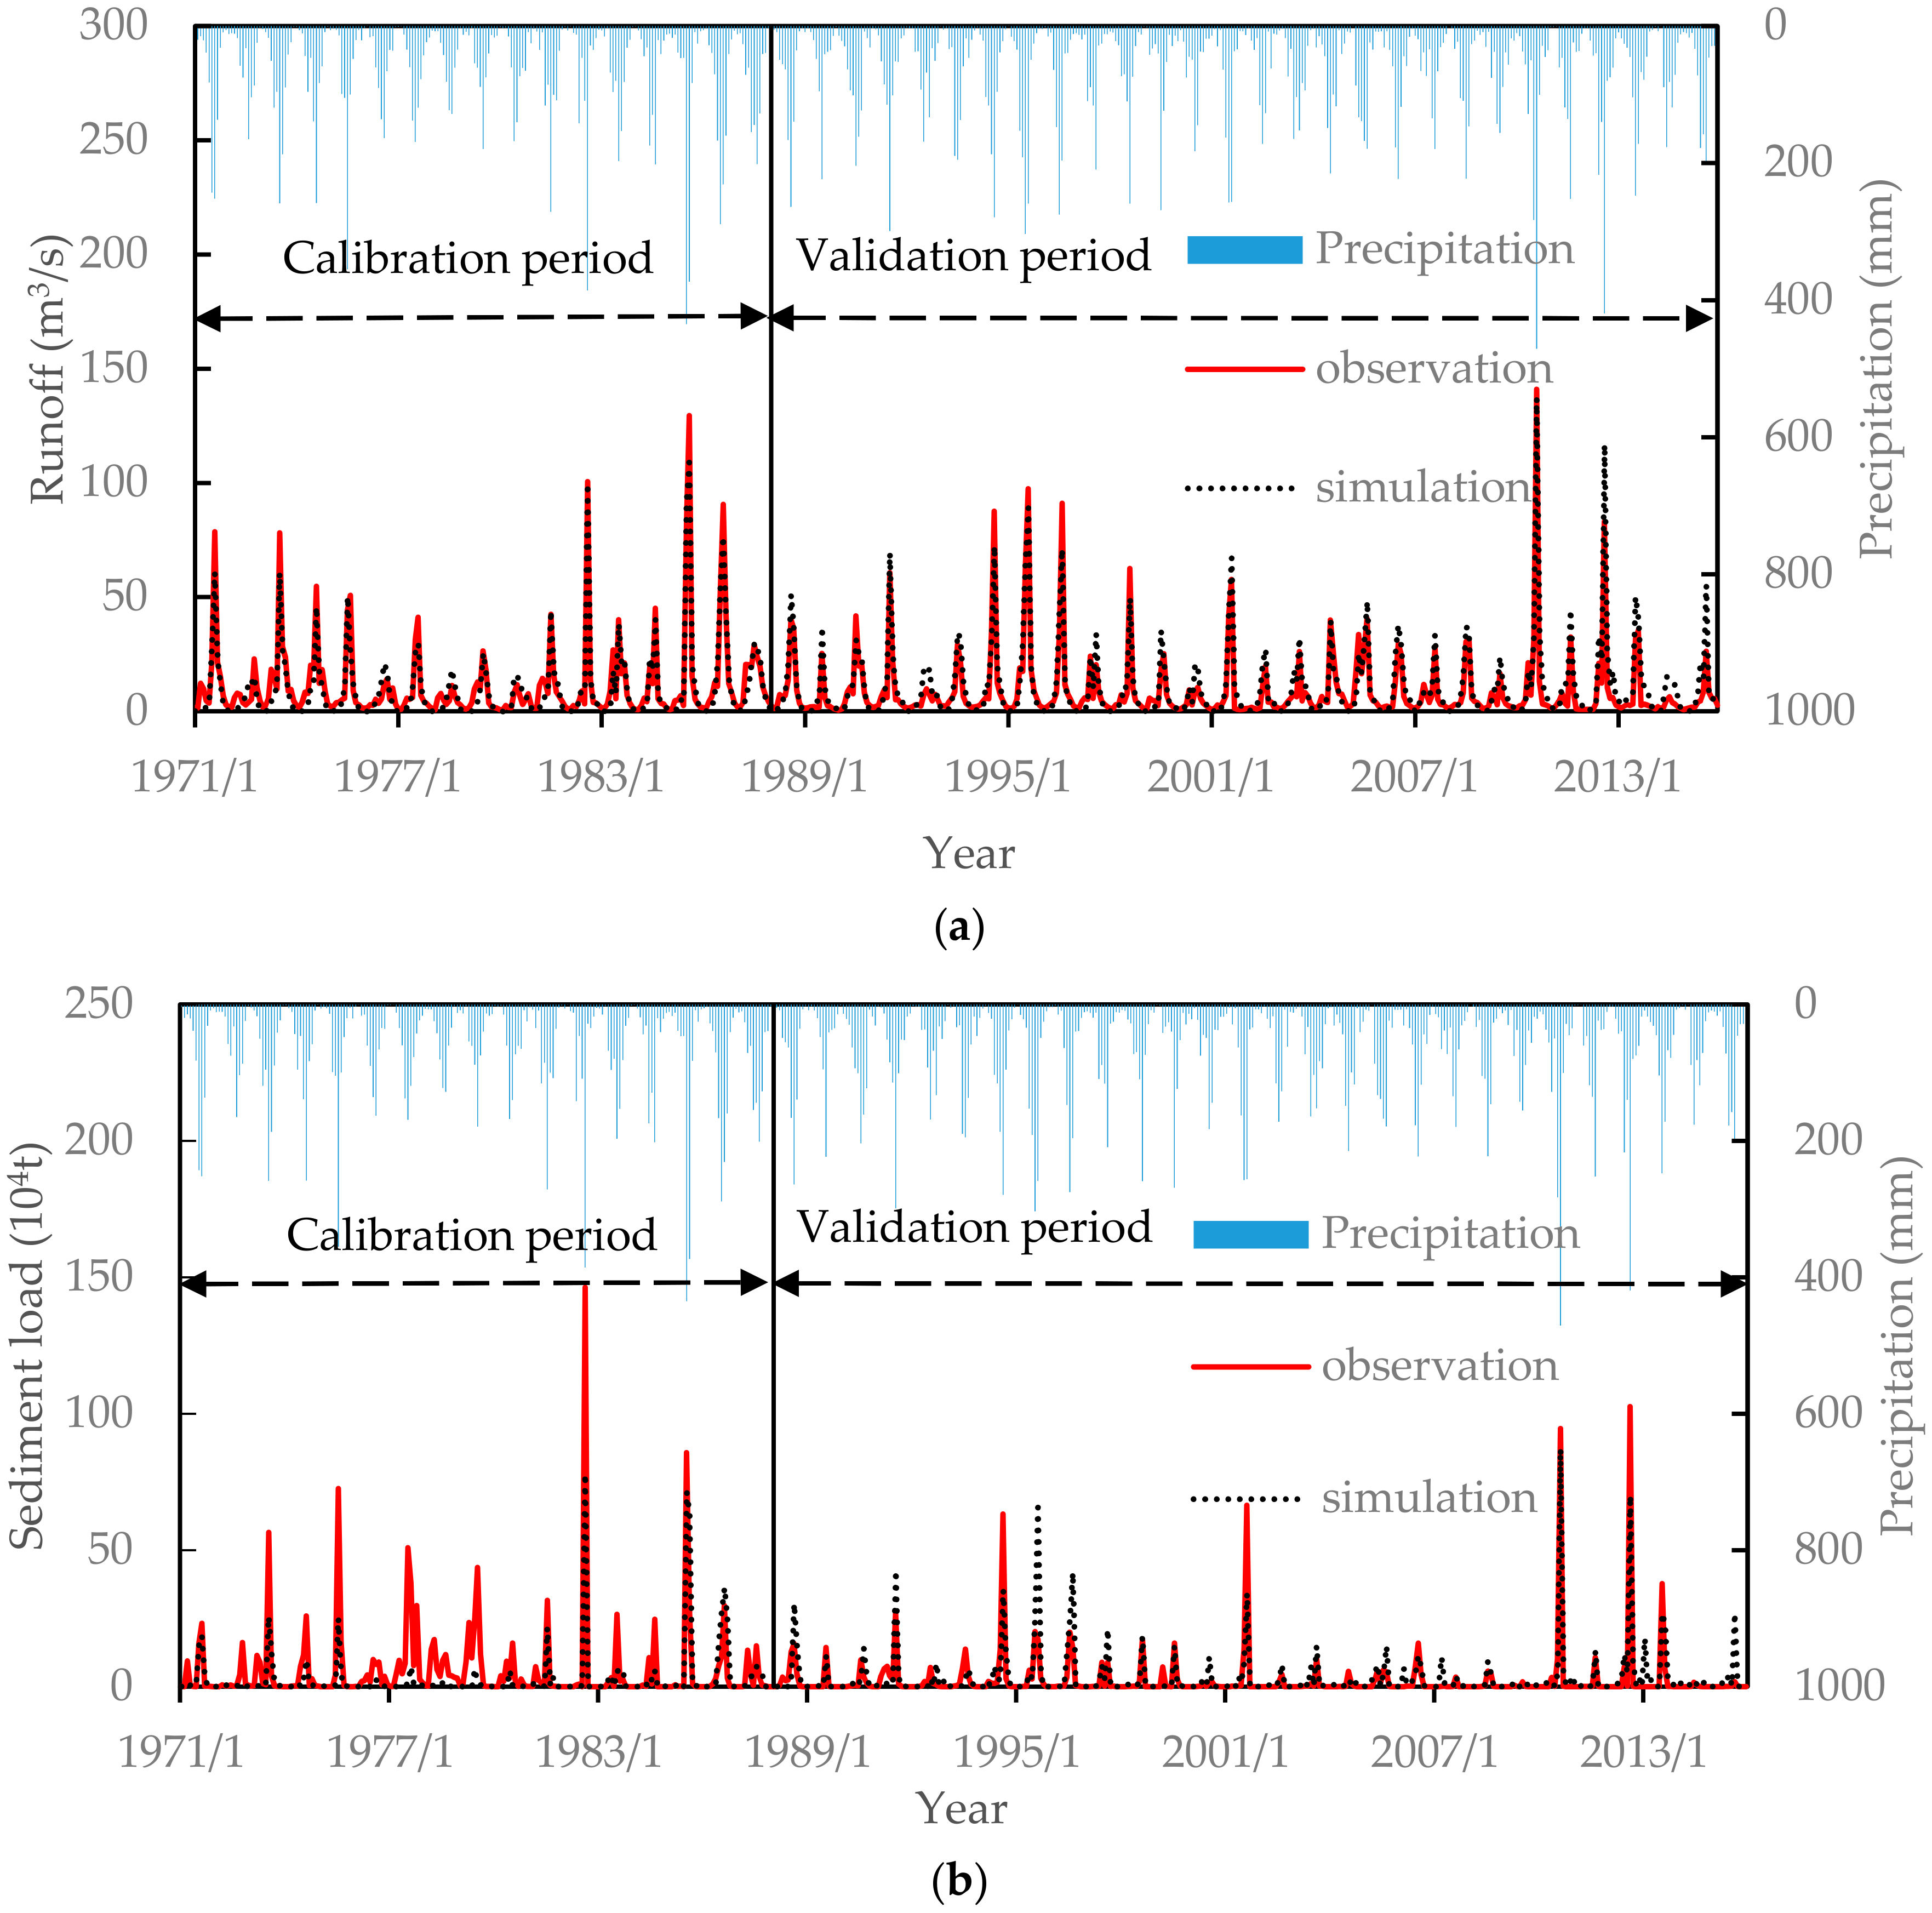
According to the results of sudden change analysis, 1969–1987 and 1986–2015 were considered as the calibration and validation periods. The preheating period for both the calibration and validation periods was 2 years, and the runoff was calibrated first, followed by sediment load. The R2 and Ens of the runoff simulation in the calibration period were 0.92 and 0.91, respectively, while the corresponding values of the validation period were 0.90 and 0.87 with high simulation accuracy. The R2 and Ens for sediment load simulation in the calibration period were 0.60 and 0.55, respectively, the corresponding values of the validation period were 0.70 and 0.69, which simulation effect are satisfactory. The comparison of the simulated and observed values of the runoff and sediment load is shown in Figure 5a,b.
3.3. Xihe River Basin Soil Erosion Conditions
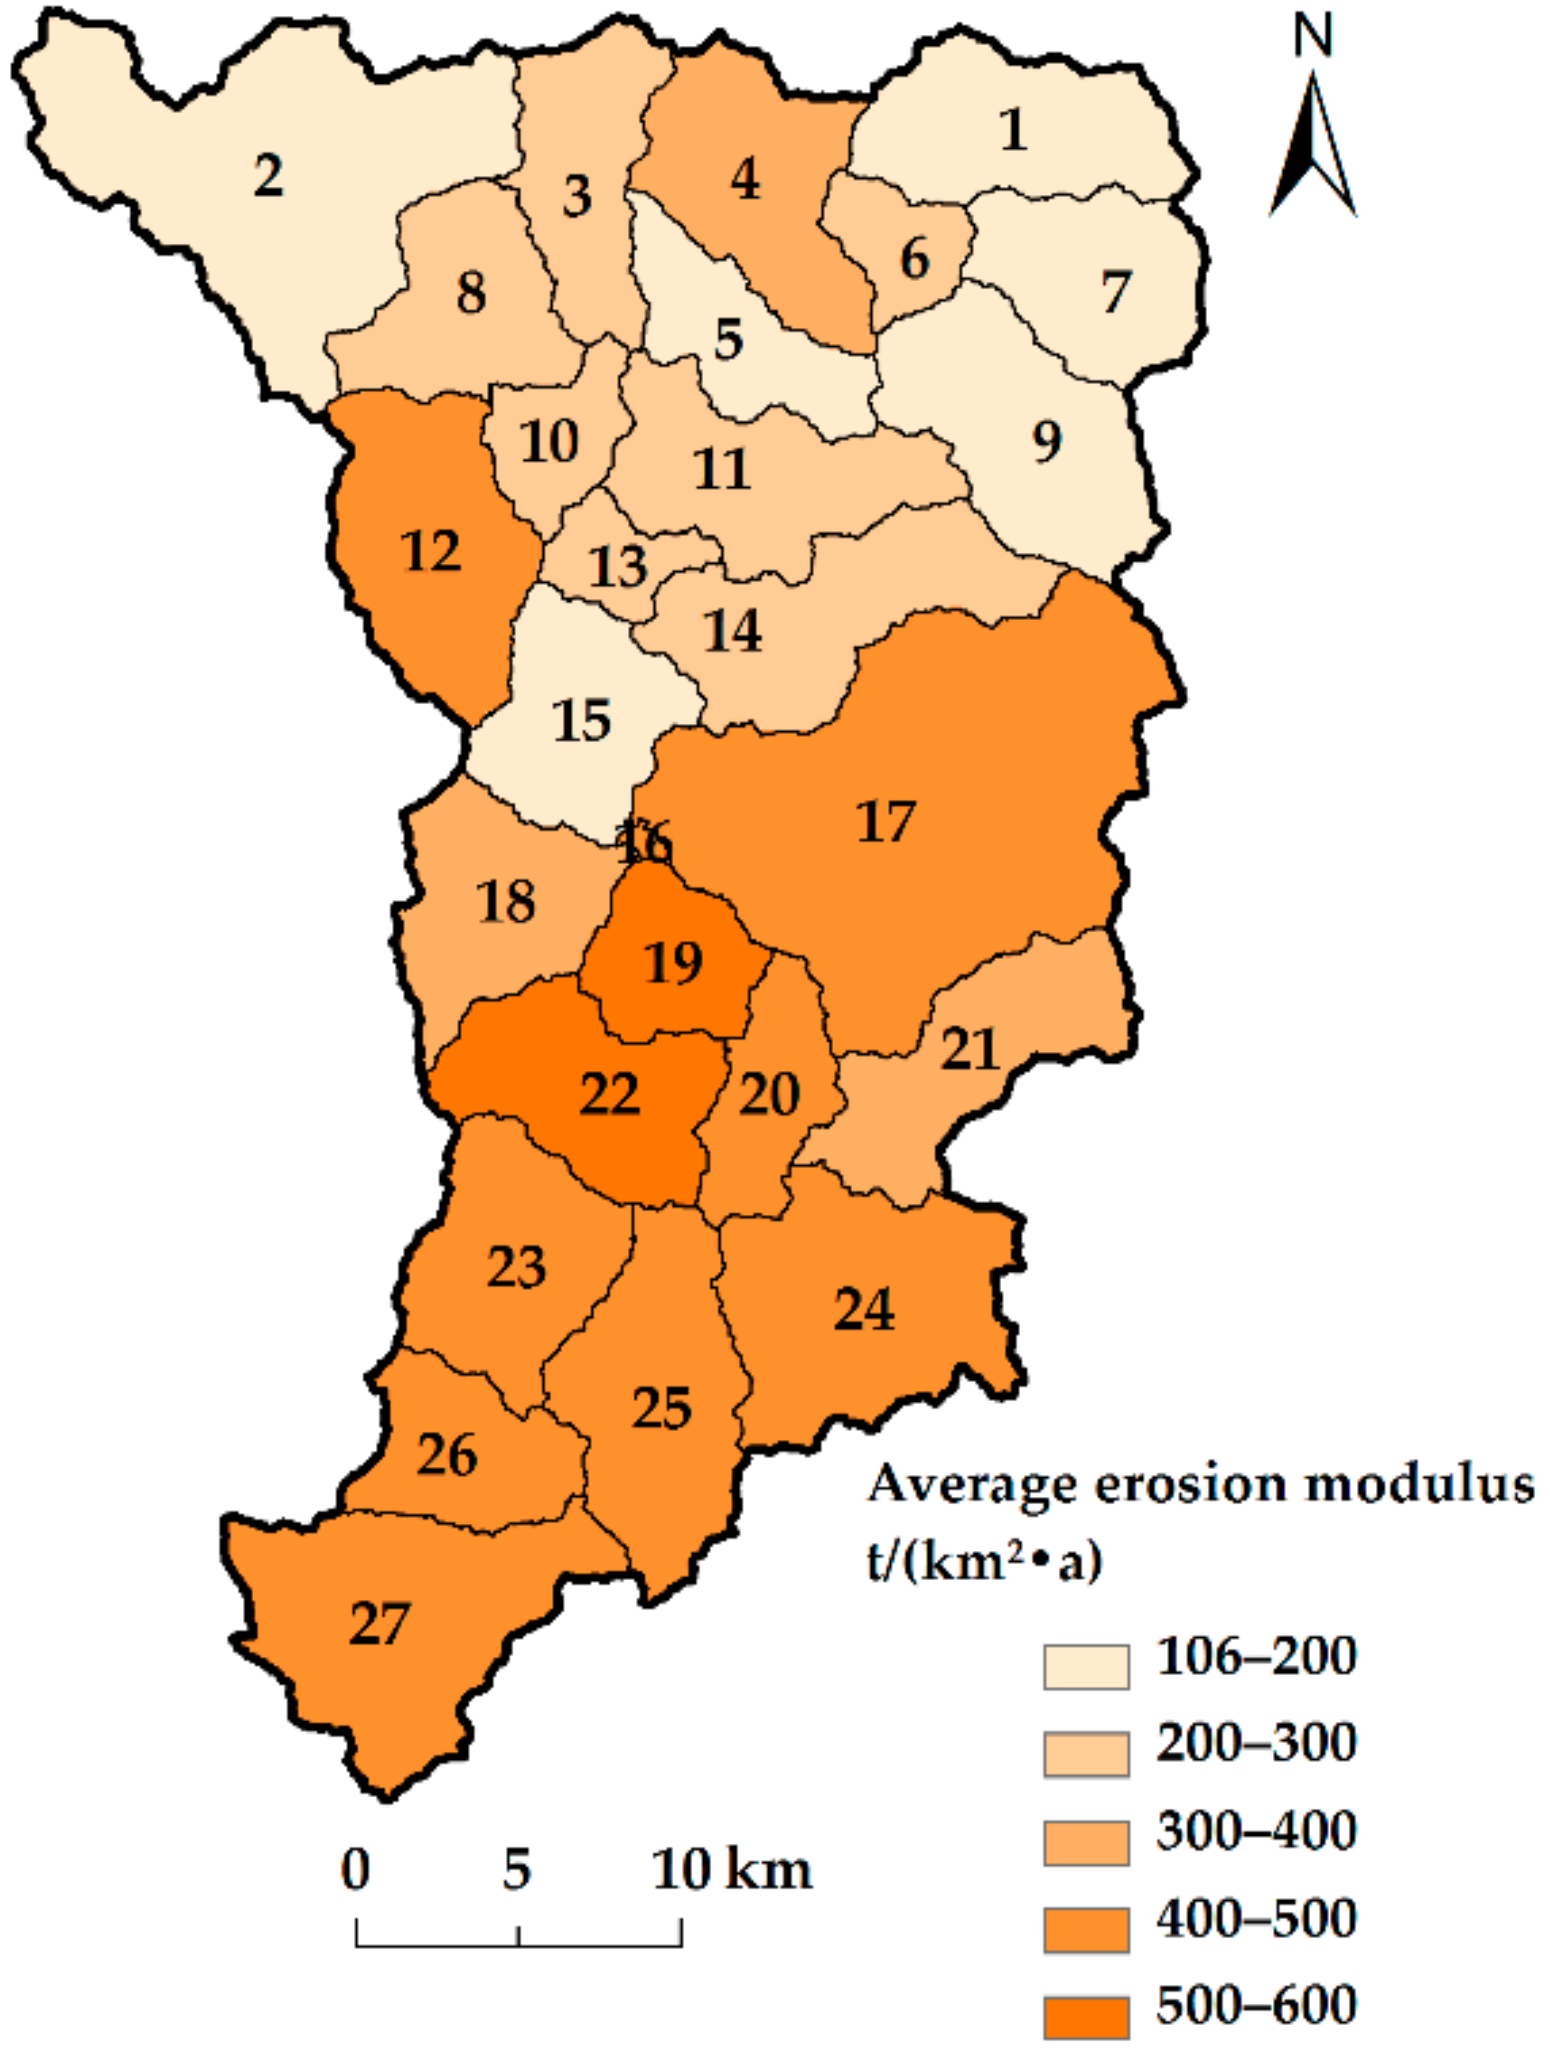
Figure 6 shows the spatial distribution of annual average soil erosion modulus in the Xihe River Basin. The study area lies in the northeast black soil region. According to the Classification Standard for Soil Erosion SL 190-2007 [44], the allowable soil loss in the region is 200 t/(km2∙a). Soil erosion modulus under 200 t/(km2∙a) is classified as micro erosion, and soil erosion modulus between 200 and 2500 t/(km2∙a) is classified as mild erosion. As can be seen in Figure 6, only sub-basin regions 1, 2, 5, 7, 9, and 15 are within the allowable range of soil erosion and have an area of 279.063 km2, occupying 25.23% of the study area. Other areas of sub-basin experience more erosion, representing an area of 826.937 km2, occupying 74.77% of the study area. Furthermore, the most severe soil erosion is in sub-basin region 19 in the Xihe River Basin, which has an average soil erosion modulus of 595.4 t/(km2∙a). Overall, the upper part of the basin has a higher erosion rate than the lower part.
Table 3 shows the annual average soil erosion volume and modulus by types of land use. Cultivated land exhibited the highest levels of erosion, 3.6561 × 10⁵ t, followed by forest land, and lastly grassland. The highest levels of soil erosion modulus are also exhibited by cultivated land, 1856.56 t/(km2∙a), followed by grassland, then urban land, unused land and lastly forest land.
3.4. Effects of Climate Change and Human Activities on Runoff and Sediment Load
Table 4 shows the contributions of climate change and human activities on runoff and sediment load. Compared to the baseline period, annual average runoff decreased by 29.95 m3/s in the impact period. Climate change contributed an increase of 7.95 m3/s accounting for −26.54% of the total change, and human activities contributed a decrease of 37.9 m3/s accounting for 126.54% of the total change. Annual average sediment load decreased by 4.1 × 10⁵ t in the impact period, to which climate change and human activities contributed an increase of 0.36 × 10⁵ t (−8.8% of the total) and a decrease of 4.45 × 10⁵ t (108.8% of the total), respectively. The overall decrease in runoff and sediment load can be attributed to human factors, which exceeded the effect of climate change and may be considered a main factor impacting the hydrological cycle of the Xihe River Basin.
4. Discussion
Accuracy of runoff simulation of the SWAT model is better than sediment load simulation. The same phenomenon has also been found in other studies [45,46]. In the SWAT model, runoff and peak rate are the main input factors in estimating the sediment discharge equation, but when SWAT model estimates runoff, precipitation intensity, frequency and duration are neglected [47], which would lead to an underestimation of the runoff, finally, the sediment load simulation results in large differences.
The average soil erosion modulus of the Xihe River Basin is 334.06 t/(km2∙a), which is similar to the counties and cities in Chaoyang city in the Liaoning Province, the results of which were studied by Yi Kai et al. [48] using the RUSLE (Revised Universal Soil Loss Equation) model. However, our result is lower than that study. The difference is not only because of the difference between climatic conditions and human activities in these two regions, but is also related to the different methods applied. In SWAT, soil erosion is calculated by the USLE (Universal Soil Loss Equation) model. Firstly, the USLE model only considers the changes in rainfall erosivity factor, and does not consider other changes in related to soil erosion, such as the vegetation coverage, the RUSLE model is more complete. Secondly, the RUSLE model obtained parameters through observing or taking similar empirical values, such as soil and water conservation measures factor and vegetation cover factor, without calibrating and validating. The SWAT model selected parameters by sensitivity analysis and calibrated these parameters with observed runoff and sediment load. Then soil erosion was calculated using the best simulated value.
The method of quantifying the contribution rate of climate change and human activities to runoff and sediment load in changes is simple, the disadvantage of it is that it cannot reflect the changes of runoff and sediment load caused by the changes of soil type, topography and geomorphology. During the study period, the contribution rates of human activities to runoff and sediment load reduction were 126.54% and 108.8%, respectively, which were far greater than the impact of climate change. This result is similar to the Jinghe River Basin, an arid inland basin in northwest China [49]. Climate change usually impacts runoff variation periodically and lastingly, whereas human activities impacts runoff variation suddenly and directionally [50]. The results could be useful for understanding the variation and driving factors for runoff and sediment load reduction in the basin.
5. Conclusions
This study analyzed the inter-annual validation trends and sudden changes in hydrological and meteorological variables in the Xihe River Basin from 1969–2015. The SWAT model was used to simulate the hydrological cycle and the spatial distribution characteristics of soil erosion. The study quantified the contributions of climate change and human activities to runoff and sediment load in changes. Which are summarized as follows:
- (1)
- During the period 1969–2015, annual rainfall and temperature exhibited an increasing trend. Whereas annual runoff and sediment exhibited a decreasing trend. A significant trend was observed in the annual temperature and sediment load. In 1988, the annual temperature exhibited a sudden increase, but sediment load showed a sudden decline.
- (2)
- The evaluating indicators showed that the R2 and Ens of the SWAT model rose to an acceptable level after calibration, which indicated that the hydrological cycle of the Xihe River Basin could be accurately simulated using the SWAT model. The simulation effect of runoff was better than that of the sediment load.
- (3)
- Soil erosion in the upper part of the Xihe River Basin was more serious than that of the lower part, and the soil erosion modulus for cultivated land was highest. The contribution of human activities to runoff and sediment load changes was greater than that of climate change. Therefore, human activities is the primary factor that affects the hydrological cycle in the Xihe River Basin. In addition, it should be noted that the upstream should be paid more attention. Finally, the specific human activities that affect runoff and sediment load, as well as their modes of action, require further study.
Author Contributions
Conceptualization, S.G. and L.L.; Methodology, S.G. and L.L.; Software, S.G. and L.L.; Validation, L.L. and Z.Z.; Formal Analysis, S.G.; Investigation, S.G.; Resources, L.L. and Z.Z.; Data Curation, S.G.; Writing-Original Draft Preparation, S.G.; Writing-Review & Editing, L.L.; Visualization, S.G.; Supervision, L.L. and Z.Z.; Project Administration, L.L.; Funding Acquisition, L.L.
Funding
This research was funded by National Natural Science Foundation of China grant number 41701208.
Conflicts of Interest
The authors declare no conflicts of interest.
References
- Pimentel, D. Soil Erosion: A Food and Environmental Threat. Environ. Dev. Sustain. 2006, 8, 119–137. [Google Scholar] [CrossRef]
- Munro, R.N.; Deckers, J.; Haile, M.; Grove, A.T.; Poesen, J.; Nyssen, J. Soil landscapes, land cover change and erosion features of the Central Plateau region of Tigrai, Ethiopia: Photo-monitoring with an interval of 30 years. Catena 2008, 75, 55–64. [Google Scholar] [CrossRef]
- Hu, S.; Cao, M.M.; Liu, Q.; Zhang, T.Q.; Qiu, H.J.; Liu, W.; Song, J.X. Comparative study on the soil conservation function of InVEST model under different perspectives. Geogr. Res. 2014, 33, 2393–2406. [Google Scholar] [CrossRef]
- Qiao, Y.; Qiao, Y. Fast soil erosion investigation and dynamic analysis in the loess plateau of China by using information composite technique. Adv. Space Res. 2002, 29, 85–88. [Google Scholar]
- Dotterweich, M. The history of human-induced soil erosion: Geomorphic legacies, early descriptions and research, and the development of soil conservation—A global synopsis. Geomorphology 2013, 201, 1–34. [Google Scholar] [CrossRef]
- Hamel, P.; Chaplin-Kramer, R.; Sim, S.; Mueller, C. A new approach to modeling the sediment retention service (InVEST 3.0): Case study of the Cape Fear catchment, North Carolina, USA. Sci. Total Environ. 2015, 524–525, 166–177. [Google Scholar] [CrossRef] [PubMed]
- Khanal, S.; Parajuli, P.B. Evaluating the Impacts of Forest Clear Cutting on Water and Sediment Yields Using SWAT in Mississippi. J. Water Resour. Prot. 2013, 5, 474–483. [Google Scholar] [CrossRef]
- Li, T.; Liu, K.; Ma, L.Y.; Bao, Y.B.; Wu, L. Evaluation on Soil Erosion Effects Driven by Land Use Changes over Danjiang River Basin of Qinling Mountain. J. Nat. Resour. 2012, 23, 2249–2256. [Google Scholar] [CrossRef]
- Nicu, I.C. Natural risk assessment and mitigation of cultural heritage sites in North-eastern Romania (Valea Oii river basin). Area 2018. [Google Scholar] [CrossRef]
- Chen, S.X.; Yang, X.H.; Xiao, L.L.; Cai, H.Y. Study of Soil Erosion in the Southern Hillside Area of China Based on RUSLE Model. Resour. Sci. 2014, 36, 1288–1297. [Google Scholar]
- Golosov, V.; Koiter, A.; Ivanov, M.; Maltsev, K.; Gusarov, A.; Sharifullin, A.; Radchenko, I. Assessment of soil erosion rate trends in two agricultural regions of European Russia for the last 60 years. J. Soils Sediments 2018. [Google Scholar] [CrossRef]
- Panagos, P.; Borrelli, P.; Poesen, J.; Ballabio, C.; Lugato, E.; Meusburger, K.; Montanarella, L.; Alewell, C. The new assessment of soil loss by water erosion in Europe. Environ. Sci. Policy 2015, 54, 438–447. [Google Scholar] [CrossRef] [Green Version]
- Labrière, N.; Locatelli, B.; Laumonier, Y.; Freycon, V.; Bernoux, M. Soil erosion in the humid tropics: A systematic quantitative review. Agric. Ecosyst. Environ. 2015, 203, 127–139. [Google Scholar] [CrossRef] [Green Version]
- Keesstra, S.; Pereira, P.; Novara, A.; Brevik, E.C.; Molina, C.A.; Alcántara, L.P.; Jordán, A.; Cerdà, A. Effects of soil management techniques on soil water erosion in apricot orchards. Sci. Total Environ. 2016, 551–552, 357–366. [Google Scholar] [CrossRef] [PubMed]
- Arnold, J.G.; Allen, P.M.; Bernhardt, G. A comprehensive surface-groundwater flow model. J. Hydrol. 1993, 142, 47–69. [Google Scholar] [CrossRef]
- Arnold, J.G.; Srinivasan, R.; Muttiah, R.S.; Williams, J.R. Large area hydrologic modeling and assessment part I: Model develepment. J. Am. Water Resour. Assoc. 1998, 34, 73–89. [Google Scholar] [CrossRef]
- Hajigholizadeh, M.; Melesse, A.; Fuentes, H. Erosion and Sediment Transport Modelling in Shallow Waters: A Review on Approaches, Models and Applications. Int. J. Environ. Res. Public Health 2018, 15, 518. [Google Scholar] [CrossRef] [PubMed]
- Cornelissen, T.; Diekkrüger, B.; Giertz, S. A comparison of hydrological models for assessing the impact of land use and climate change on discharge in a tropical catchment. J. Hydrol. 2013, 498, 221–236. [Google Scholar] [CrossRef]
- Abdelwahab, O.M.M.; Ricci, G.F.; De Girolamo, A.M.; Gentile, F. Modelling soil erosion in a Mediterranean watershed: Comparison between SWAT and AnnAGNPS models. Environ. Res. 2018, 166, 363–376. [Google Scholar] [CrossRef] [PubMed]
- Aghakhani Afshar, A.; Hassanzadeh, Y. Determination of Monthly Hydrological Erosion Severity and Runoff in Torogh Dam Watershed Basin Using SWAT and WEPP Models. Iran. J. Sci. Technol. Trans. Civ. Eng. 2017, 41, 221–228. [Google Scholar] [CrossRef]
- Hasan, Z.A.; Hamidon, N.; Yusof, M.S.; Ghani, A.A. Flow and sediment yield simulations for Bukit Merah Reservoir catchment, Malaysia: A case study. Water Sci. Technol. 2012, 66, 2170–2176. [Google Scholar] [CrossRef] [PubMed]
- Xiao, J.C.; Luo, D.G.; Wang, Z.Z. Soil Erosion Simulation in Fuhe Basin Based on SWAT Model. Res. Soil Water Conserv. 2013, 20, 18–24. [Google Scholar]
- Zuo, D.P.; Xu, Z.X.; Yao, W.Y.; Jin, S.Y.; Xiao, P.Q.; Ran, D.C. Assessing the effects of changes in land use and climate on runoff and sediment yields from a watershed in the Loess Plateau of China. Sci. Total Environ. 2016, 544, 238–250. [Google Scholar] [CrossRef] [PubMed]
- Wu, J.W.; Miao, C.Y.; Yang, T.T.; Duan, Q.Y.; Zhang, X.M. Modeling streamflow and sediment responses to climate change and human activities in the Yanhe River, China. Hydrol. Res. 2018, 49, 150–162. [Google Scholar] [CrossRef]
- Alighalehbabakhani, F.; Miller, C.J.; Selegean, J.P.; Barkach, J.; Sadatiyan Abkenar, S.M.; Dahl, T.; Baskaran, M. Estimates of sediment trapping rates for two reservoirs in the Lake Erie watershed: Past and present scenarios. J. Hydrol. 2017, 544, 147–155. [Google Scholar] [CrossRef]
- Yen, H.; Lu, S.L.; Feng, Q.Y.; Wang, R.Y.; Gao, J.G.; Brady, D.; Sharifi, A.; Ahn, J.; Chen, S.T.; Jeong, J.; et al. Assessment of Optional Sediment Transport Functions via the Complex Watershed Simulation Model SWAT. Water 2017, 9, 76. [Google Scholar] [CrossRef]
- Dong, L.H.; Xiong, L.H.; Yu, K.X.; Li, S. Research advances in effects of climate change and human activities on hydrology. Adv. Water Sci. 2012, 23, 278–285. [Google Scholar]
- Yang, C.L.; Ma, X.P.; Hou, W.; Li, F.Y.; Liu, Q.; Li, Y.; Cheng, Z.H.; Kong, W.J. Soil Physical and Chemical Properties of Riparian Zone Along Xi River. Sci. Technol. Rev. 2012, 30, 61–66. [Google Scholar] [CrossRef]
- Pettitt, A.N. A non-parametric approach to the change point problem. J. R. Stat. Soc. 1979, 28, 126–135. [Google Scholar] [CrossRef]
- Zuo, D.P.; Xu, Z.X.; Wu, W.; Zhao, J.; Zhao, F.F. Identification of Streamflow Response to Climate Change and Human Activities in the Wei River Basin, China. Water Resour. Manag. 2014, 28, 833–851. [Google Scholar] [CrossRef]
- Liu, M.F.; Gao, Y.C.; Gan, G.J. Long-Term Trends in Annual Runoff and the Impact of Meteorological Factors in the Baiyangdian Watershed. Resour. Sci. 2011, 33, 1438–1445. [Google Scholar]
- Wang, J.; Gao, Y.; Wang, S. Assessing the response of runoff to climate change and human activities for a typical basin in the Northern Taihang Mountain, China. J. Earth Syst. Sci. 2018, 127, 1–15. [Google Scholar] [CrossRef]
- Li, Y.Y.; Chang, J.X.; Wang, Y.M.; Jin, W.T.; Guo, A.J. Spatiotemporal Impacts of Climate, Land Cover Change and Direct Human Activities on Runoff Variations in the Wei River Basin, China. Water 2016, 8, 220. [Google Scholar] [CrossRef]
- Li, P.F.; Mu, X.M.; Holden, J.; Wu, Y.P.; Irvine, B.; Wang, F.; Gao, P.; Zhao, G.J.; Sun, W.Y. Comparison of soil erosion models used to study the Chinese Loess Plateau. Earth Sci. Rev. 2017, 170, 17–30. [Google Scholar] [CrossRef] [Green Version]
- Yin, J.; He, F.; Xiong, Y.J.; Qiu, G.Y. Effects of land use/land cover and climate changes on surface runoff in a semi-humid and semi-arid transition zone in northwest China. Hydrol. Earth Syst. Sci. 2017, 21, 183–196. [Google Scholar] [CrossRef]
- USDA Soil Conservation Service (SCS). National Engineering Handbook Section 4 Hydrology; USDA: Washington, DC, USA, 1972. [Google Scholar]
- Monteith, J.L. Evaporation and the environment. In The State and Movement of Water in Living Organism; Cambridge University Press: Swansea, UK, 1965. [Google Scholar]
- William, J.R. Chapter 25: The EPIC model. In Computer Models of Watershed Hydrology; Singh, V.P., Ed.; Water Resources Publications, LLC: Highlands Ranch, CO, USA, 1995; pp. 909–1000. [Google Scholar]
- Neitsch, S.L.; Arnold, J.G.; Kiniry, J.R.; Williams, J.R. Soil and Water Assessment Tool Theoretical Documentation Version 2009; Technical Report No. 406; Texas Water Resources Institute: College Station, TX, USA, 2011. [Google Scholar]
- Che, Z.H. The empirical formulas and curves of soil permeability system number are discussed. Water Resour. Hydropower Northeast China 1995, 19, 17–19. [Google Scholar] [CrossRef]
- Abbaspour, K.C.; Yang, J.; Maximov, I.; Siber, R.; Bogner, K.; Mieleitner, J.; Zobrist, J.; Srinivasan, R. Modelling hydrology and water quality in the pre-alpine/alpine Thur watershed using SWAT. J. Hydrol. 2007, 333, 413–430. [Google Scholar] [CrossRef]
- Nash, J.E.; Sutcliffe, J.V. River flow forecasting through conceptual models part I-a discussion of principles. J. Hydrol. 1970, 10, 282–290. [Google Scholar] [CrossRef]
- Moriasi, D.N.; Arnold, J.G.; Van Liew, M.W.; Bingner, R.L.; Harmel, R.D.; Veith, T.L. Model Evaluation Guidelines for Systematic Quantification of Accuracy in Watershed Simulations. Am. Soc. Agric. Biol. Eng. 2007, 50, 885–900. [Google Scholar]
- SL 190-2007. Classification Standard for Soil Erosion; WaterPower Press: Beijing, China, 1977. [Google Scholar]
- Zeng, Y.; Wei, L. Runoff and Sediment Simulation in Purple Hilly Area Based on SWAT Model. J. Geo-Inf. Sci. 2013, 15, 401–407. [Google Scholar] [CrossRef]
- Pang, J.P.; Liu, C.M.; Xu, Z.X. Streamflow and Soil Erosion Simulation Based on SWAT Model. Res. Soil Water Conserv. 2007, 14, 88–93. [Google Scholar]
- Assouline, S.; Ben-Hur, M. Effects of rainfall intensity and slope gradient on the dynamics of interrill erosion during soil surface sealing. Catena 2006, 66, 211–220. [Google Scholar] [CrossRef]
- Yi, K.; Wang, S.Y.; Wang, X.; Yao, H.L. The Characteristics of Spatial-temporal Differentiation of Soil Erosion Based on RUSLE Model: A Case Study of Chaoyang City. Sci. Geogr. Sin. 2015, 35, 365–372. [Google Scholar]
- Dong, W.; Cui, B.; Liu, Z.; Zhang, K. Relative effects of human activities and climate change on the river runoff in an arid basin in northwest China. Hydrol. Process. 2013, 28, 4854–4864. [Google Scholar] [CrossRef]
- Miao, C.; Yang, Y.; Liu, B.; Gao, Y.; Li, S. Streamflow changes and its influencing factors in the mainstream of the Songhua River basin, Northeast China over the past 50 years. Environ. Earth Sci. 2011, 63, 489–499. [Google Scholar] [CrossRef]
Figure 1.
Research Area Overview.

Figure 2.
Land use map (a) and Soil map (b).

Figure 3.
Inter-annual variation trends of the annual (a) precipitation, (b) temperature, (c) runoff and (d) sediment load from 1969–2015 in the Xihe River Basin.
Figure 3.
Inter-annual variation trends of the annual (a) precipitation, (b) temperature, (c) runoff and (d) sediment load from 1969–2015 in the Xihe River Basin.


Figure 4.
Results of sudden changes in annual (a) precipitation, (b) temperature, (c) runoff and (d) sediment load from 1969–2015 in the Xihe River Basin.
Figure 4.
Results of sudden changes in annual (a) precipitation, (b) temperature, (c) runoff and (d) sediment load from 1969–2015 in the Xihe River Basin.

Figure 5.
(a) runoff and (b) sediment load calibration and validation periods simulation results at Xihe River Basin during the period 1971–2015.
Figure 5.
(a) runoff and (b) sediment load calibration and validation periods simulation results at Xihe River Basin during the period 1971–2015.

Figure 6.
Soil erosion modulus spatial distribution in the Xihe River Basin.


Table 1.
Input data of Soil and Water Assessment Tool (SWAT) model in the Xihe River Basin.
| Data Type | Data Input | Accuracy | Data Source |
|---|---|---|---|
| Spatial data | Digital Elevation Model (DEM) | 30 m | Geospatial Data Cloud. http://www.gscloud.cn/ 16 August 2017 |
| Land use map | 30 m | Geospatial Data Cloud Remote Sensing Map | |
| Soil type map | 1000 m | Harmonized World Soil Database, HWSD | |
| Meteorological data | Precipitation, Temperature, Wind, Solar radiation, Humidity | Daily 1969–2015 | China Meteorological Data Center. http://data.cma.cn/ 2 October 2017 |
| Hydrological data | Runoff, Sediment | Daily | Hydrological Yearbook |
| Soil data | Soil moisture density, Effective water content | 1969–2015 | Harmonized World Soil Database, HWSD |
Table 2.
Parameters sensitivity analysis results in the Xihe River Basin.
| Parameter Name and Document Type | Parameter Description | Process | Rank | Beg. Range | End Range |
|---|---|---|---|---|---|
| v__ALPHA_BF.gw | Base flow α coefficient | Runoff | 1 | 0.0~1.0 | −0.13~0.62 |
| r__CN2.mgt | Runoff curve parameter | 6 | −0.2~0.2 | −0.06~0.23 | |
| v__SLSUBBSN.hru | Average grade length | 9 | 10~150 | 14.03~22.41 | |
| v__ESCO.hru | Soil evaporation coefficient | 4 | 0.0~1.0 | 0.06~0.69 | |
| r__SOL_K().sol | Saturated water conductivity coefficient | 10 | 0.0~25 | 0.88~2.66 | |
| r__SOL_Z().sol | Soil depth | 8 | −0.5~0.5 | 0.10~0.31 | |
| v__CH_K2.rte | River effective water conductivity coefficient | 2 | −0.01~150 | 47.97~144.52 | |
| v__RCHRG_DP.gw | Water table permeation | 3 | 0.0~1.0 | 0.26~0.79 | |
| v__EPCO.hru | Material transpiration coefficient | 5 | 0.0~1.0 | 0.37~1.12 | |
| v__BIOMIX.mgt | Biological mix efficiency coefficient | 7 | 0.0~1.0 | 0.03~0.68 | |
| v__SPCON.bsn | Sediment movement linear compensation coefficient | Sediment load | 1 | 0.0001~0.01 | 0.0057~0.0097 |
| v__CH_COV2.rte | River coverage coefficient | 2 | 0.0~1.0 | 0.63~1.00 | |
| v__SPEXP.bsn | Sediment movement index coefficient | 4 | 0.0~1.5 | 1.20~1.42 | |
| v__CH_ERODMO().rte | River erosion coefficient | 3 | 0.0~1.0 | 0.75~1.00 | |
| v__USLE_P.mgt | Water and land conservation measure factors | 5 | 0.0~1.0 | 0.56~1.00 |
Notes: Beg. Range shows beginning range. .gw shows groundwater hydrology; .rte shows river hydrology; .hru shows HRU conventional data entry; .mgt shows HRU management; .sol shows soil data entry; .bsn shows conventional basin parameters; v shows parameter changes by the specified value; r shows parameter changes by the original value, 1+ specified value.
Table 3.
Xihe River Basin soil erosion by types land use.
| Land Use Type | Area/km2 | Soil Erosion Volume/104 t | Average Soil Erosion Modulus (t∙km−2∙a−1) |
|---|---|---|---|
| Cultivated land | 194.5 | 36.11 | 1856.56 |
| Forest land | 865.06 | 1.11 | 12.83 |
| Grassland | 2.78 | 0.0099 | 35.61 |
| Unused land | 7.3 | 0.0158 | 21.64 |
| Urban land | 22.04 | 0.0633 | 28.72 |
| Water | 14.32 | - | - |
Table 4.
Relative contributions of climate change and human activities to runoff and sediment load.
| Period | ||||||||
|---|---|---|---|---|---|---|---|---|
| Runoff (m3/s) | Calibration | 136.94 | 119.62 | −29.95 | 7.95 | −37.9 | −26.54 | 126.54 |
| Validation | 106.99 | 127.57 | ||||||
| Sediment load (105 t) | Calibration | 7.18 | 3.52 | −4.1 | 0.36 | −4.45 | −8.8 | 108.8 |
| Validation | 3.08 | 3.88 |
Notes: shows the calibration and validation period observed values, shows simulated values.
© 2018 by the authors. Licensee MDPI, Basel, Switzerland. This article is an open access article distributed under the terms and conditions of the Creative Commons Attribution (CC BY) license (http://creativecommons.org/licenses/by/4.0/).
Share and Cite
MDPI and ACS Style
Guo, S.; Zhu, Z.; Lyu, L. Effects of Climate Change and Human Activities on Soil Erosion in the Xihe River Basin, China. Water 2018, 10, 1085. https://0-doi-org.brum.beds.ac.uk/10.3390/w10081085
AMA Style
Guo S, Zhu Z, Lyu L. Effects of Climate Change and Human Activities on Soil Erosion in the Xihe River Basin, China. Water. 2018; 10(8):1085. https://0-doi-org.brum.beds.ac.uk/10.3390/w10081085
Chicago/Turabian StyleGuo, Shanshan, Zhengru Zhu, and Leting Lyu. 2018. "Effects of Climate Change and Human Activities on Soil Erosion in the Xihe River Basin, China" Water 10, no. 8: 1085. https://0-doi-org.brum.beds.ac.uk/10.3390/w10081085
Note that from the first issue of 2016, this journal uses article numbers instead of page numbers. See further details here.