Article

Design of a Pressurized Rainfall Simulator for Evaluating Performance of Erosion Control Practices

1
Department of Civil Engineering, Auburn University, Auburn, AL 36849-5337, USA
2
Liberty Utilities, 2300 Victory Drive, Columbus, GA 31902, USA
3
HDR, 25 W. Cedar Street, Suite 200, Pensacola, FL 32502, USA
4
Department of Civil, Construction, and Environmental Engineering, The University of Alabama at Birmingham, Birmingham, AL 35294-4440, USA
*
Author to whom correspondence should be addressed.
Submission received: 16 October 2019 / Revised: 10 November 2019 / Accepted: 10 November 2019 / Published: 14 November 2019
(This article belongs to the Special Issue Rainfall Erosivity in Soil Erosion Processes)

Abstract

:
Construction site erosion and resulting sedimentation constitutes one of the greatest non-point source pollution threats to our nation’s waterways. Erosion control practices are important aspects of any construction project due to their ability to limit the process of erosion. Testing erosion control practices under simulated rainfall representative of conditions experienced on construction sites is important to better understand their erosion reduction capabilities. Full-scale testing using simulated rainfall has been shown to provide controllable and repeatable results, in comparison to field-testing under natural conditions. Therefore, the focus of this study was to design, construct, and calibrate a pressurized rainfall simulator testing apparatus capable of accurately and repeatedly simulating rainfall intensities of 50.8, 101.6, and 152.4 mm/hr (2.0, 4.0, and 6.0 in/hr) for 20-min intervals. The developed testing apparatus consisted of a 12 m (40 ft) long by 2.4 m (8.0 ft) earthen slope at a 3H:1V slope. Ten sprinkler risers at a height of 4.27 m (14 ft) were installed around the perimeter of the slope to create a uniform distribution of rainfall. Data collection procedures consisted of collecting and analyzing rainfall depth, drop size distributions, and sediment concentrations. The optimum location for each sprinkler riser, as well as the most accurate nozzle configuration, were determined through test procedures developed for this study. Through calibration testing, the simulator was found to produce accurate rainfall intensities with relative errors of 1.17–4.00% of the target intensities. Uniformity of rainfall distribution ranged from 85.7 to 87.5%. Average drop sizes were determined to be between 2.35 and 2.58 mm (0.093 to 0.102 in.).

1. Introduction

Construction projects typically create large areas of exposed soil due to clearing, grubbing, and land grading activities. Lack of vegetative cover leaves these areas susceptible to erosion during rain events. In the U.S. alone, it is estimated that as much as 73 million metric tons (80 million tons) of sediment is eroded from construction sites each year [1]. Highly concentrated sediment-laden stormwater runoff degrades existing ecosystems and water quality through the process of sedimentation and by increasing turbidity, making it difficult for aquatic organisms to survive. These concerns led the U.S. Congress to include sediment discharge into the National Pollutant Discharge Elimination System (NPDES) permit program in 1990 under the Clean Water Act. Regulations under NPDES require sediment pollution generated by construction activities be controlled on-site by the site operator [2].
Several factors contribute to the erosive potential of a particular project site, including soil properties, topography, local climate (i.e., rainfall intensity, frequency, and duration), and vegetative cover. While there are many different types of erosion (e.g., interrill, rill, gully, channel, etc.) and subsequent control practices and products, the focus of this paper is on the testing and evaluation of erosion control practices and products used on earthen slopes to minimize interrill and rill erosion.
With the increasing usage of erosion control practices and products, it is important for researchers, practitioners, contractors, inspectors, and regulatory agencies to understand their in-field performance along with suitable applications. Small-scale testing has been conducted in the past to accomplish these objectives; however, it does not adequately represent conditions that practices and products would experience in the field [3]. To effectively recreate field-like scenarios, full-scale testing on a field-scale plot must be performed. To date, the most representative and controllable method to accomplish this has been through the use of rainfall simulators [4,5,6,7]. The purpose of this study was to design and calibrate a test apparatus that is capable of evaluating the effectiveness of erosion control practices and products, and enables the researchers to replicate these results.

1.1. Rainfall Simulators

Rainfall simulation has long been used to study the effects of rainfall-induced erosion [8,9,10,11,12]. The need for rainfall simulators arose when researchers determined that simulated rainfall provided more uniform control over experiments in comparison to natural rainfall. While natural rainfall is most desirable for testing of erosion control practices, simulated rainfall allows for expedited data collection and reproducible testing [13,14,15].
The earliest rainfall simulators used drop forming mechanisms (i.e., hypodermic needles and string) to form droplets [6]. Unpressurized systems need to release raindrops from heights of up to 9.1 m (30 ft) to ensure they reach terminal velocity, representative of natural rainfall. Furthermore, these systems are highly susceptible to environmental conditions (i.e., wind), leading to these type of simulators being employed almost exclusively in enclosed laboratory settings.
Beginning in the mid-20th century, pressurized rainfall simulation systems became more desirable to conduct large-scale, outdoor experiments [7,9,14,16,17]. Pressurized rainfall simulators rely on nozzles or sprinkler heads to produce rain-like droplets. With a pressurized system, raindrops have the ability to reach terminal velocity quickly, thereby allowing for shorter, more portable simulators. Furthermore, pressurized rainfall simulators provide some resistance to environmental conditions, allowing researchers to conduct evaluations outdoors.
Moore et al. [14] designed, what is referred to as a Kentucky rainfall simulator, using the following four criteria to generate conditions similar to natural rainfall: (1) uniform distribution, (2) rainfall intensities, (3) drop size distributions, and (4) raindrop velocities that create kinetic energy. Furthermore, a plot size large enough to effectively simulate field-like conditions is required. In addition to the above criteria, Meyer [18] identified five supplementary design criteria that must be satisfied to adequately simulate natural rainfall: (1) intensities similar to storms producing medium to high rates of runoff and erosion, (2) near-continuous rainfall application, (3) near vertical impact of most drops, (4) satisfactory performance in windy conditions, and (5) portability of the system.

1.2. Previous Erosion Studies Using Simulated Rainfall

Pressurized rainfall simulators (Table 1) differ between studies due to varying research objectives and plot sizes. Shoemaker et al. [19] developed a laboratory-scale rainfall simulator to conduct studies on the effectiveness of anionic polyacrylamide as an erosion control measure. The simulator consisted of a single solenoid operated nozzle. The nozzle was installed at a height of 3.05 m (10 ft) and used a pressure regulator to control flow. Two 3H:1V sloped plots, each with a surface area of 0.74 m2 (8.0 ft2), were constructed and placed under the simulator. The nozzle was capable of producing a rainfall intensity of 11.2 cm/hr (4.4 in./hr). Tests consisted of four, 15-min rainfall events separated by 15-min intervals of no rainfall to allow for data collection. Using Christiansen’s Uniformity Coefficient (CUC), Shoemaker et al. [19] calculated an average uniformity of rainfall distribution of 83 to 87% on the test plots.
Kim et al. [20] conducted a study examining the effectiveness of flocculant treatments on steep vegetable fields in South Korea. Six test plots were constructed on slopes ranging from 29% to 30% with surface areas of 2.4 m2 (26 ft2). Kim et al. [20] constructed a rainfall simulator with steel angle iron and sprinklers set at a height of 2.4 m (8.0 ft). The simulator was capable of generating rainfall intensities from 70 to 85 mm/hr (2.8 to 3.3 in./hr).
McLaughlin and Brown [9] conducted a rainfall simulation study with the objective of determining if application of flocculant to mulches provided erosion control improvements. For this study, 1 m (3.3 ft) wide by 2 m (6.6 ft) long test plots were constructed on slopes of 10 and 20%. A rainfall simulator based on a similar design to that of Miller’s [21] was constructed for this experiment. A 1/2HH-SS50WSQ Fulljet nozzle (Spraying Systems Co.®, Wheaton, IL, USA) was installed 3.96 m (13.0 ft) above the test plots to produce rain drops. The nozzle was set at a pressure of 34 kPa (5.0 psi) and produced droplet sizes similar to natural rainfall. During tests, the simulator produced constant rainfall intensity of 68 mm/hr (2.6 in./hr). The intensity was reduced to a rate of 33 mm/hr (1.3 in./hr) by programming a solenoid valve to cycle off-and-on in 10 s intervals. Tests were performed until 5 min after runoff was observed from the test plots.

2. Current Standard Test Methods and Installment Procedures

ASTM D6459-15 [22] is the ASTM International standard test method for determining the performance of rolled erosion control product (RECP) using rainfall simulation. This standard test method is used to quantify rainfall-induced erosion of hillslopes under the protection of RECPs [22]. The test determines the soil erodibility factor, K, of the soil used and the cover management factor, C, of a RECP tested. The data analysis allows for the comparison of C values of different RECPs to understand their relative performance for controlling erosion. To determine K and C from the Revised Universal Soil Loss Equation (RUSLE), the rainfall-runoff erosivity factor, R, must first be determined, which is calculated from the erosion index (EI) using Equation (1) [23]:
R = 1 n j = 1 n [ k = 1 m E I k ]
where EIk is the erosion index for the rainfall event k, m is the total number of the rainfall events in a year, and n is the number of years used to obtain average R in hundreds of ft∙tonf∙in./(acre∙hr∙yr). EI is the product of total storm energy (E) multiplied by the maximum 30-min intensity (I30) for a given storm event, where E is in hundreds ft∙tonf/acre and I30 is in in./hr [23]. E is the total kinetic energy of all raindrops of the storm and directly related to the rainfall intensity. Since R is the average erosivity potential from a known set of storm events over a known period of time, each storm within that time period must be individually analyzed using Equation (2) to determine erosivity for each storm event:
E I = ( E ) I 30 = ( r = 1 p e r Δ V r ) I 30 ( 10 2 )
where er is the rainfall energy per unit depth of rainfall per unit area in ft∙tonf/(acre∙in.), Δ V r is the depth of rainfall (in.) for the rth increment of the storm hyetograph which is divided into p parts, each with essentially constant rainfall intensity. For natural rainfall events, each raindrop reaches its terminal velocity when reaching the ground, and er can be calculated as a function of rainfall intensity ir (in./hr) using Equation (3) in the United States [23]:
e r = 1099 [ 1 0.72 e x p ( 1.27 i r ) ]   a n d   i r = Δ V r / Δ t r
For large-scale testing in ASTM D6459-15, evaluations for each RECP are repeated three times, therefore, an annual R cannot be developed, only an average EI and C for three tests are determined for comparing the relative performance of different RECPs. ASTM D6459-15 suggests using Equation (4) to compute EI [22]:
E I = I × 1099 × [ 1 0.72 e ( 1.27 I ) ]
ASTM D6459-15 does not provide any specific details to apply Equation (4) but refers to the U.S. Department of Agriculture (USDA) Agriculture Handbook 703 [23]. Equation (4) as described by ASTM D6459-15 misrepresents the original Equations (2) and (3) since there are two Is in Equation (4) that represent two different intensities: the first I represents I30 and the second I is intended to represent ir for the rth increment of the storm hyetograph. Also, when using the rainfall simulator (not natural rainfall), each rainfall drop may not reach its terminal velocity and the unit rainfall energy, er, cannot be calculated using Equations (3) or (4) directly. In this study, we will discuss the use of the original method in the USDA Agriculture Handbook 703 [23] to directly compute the erosion index for the large-scale test.
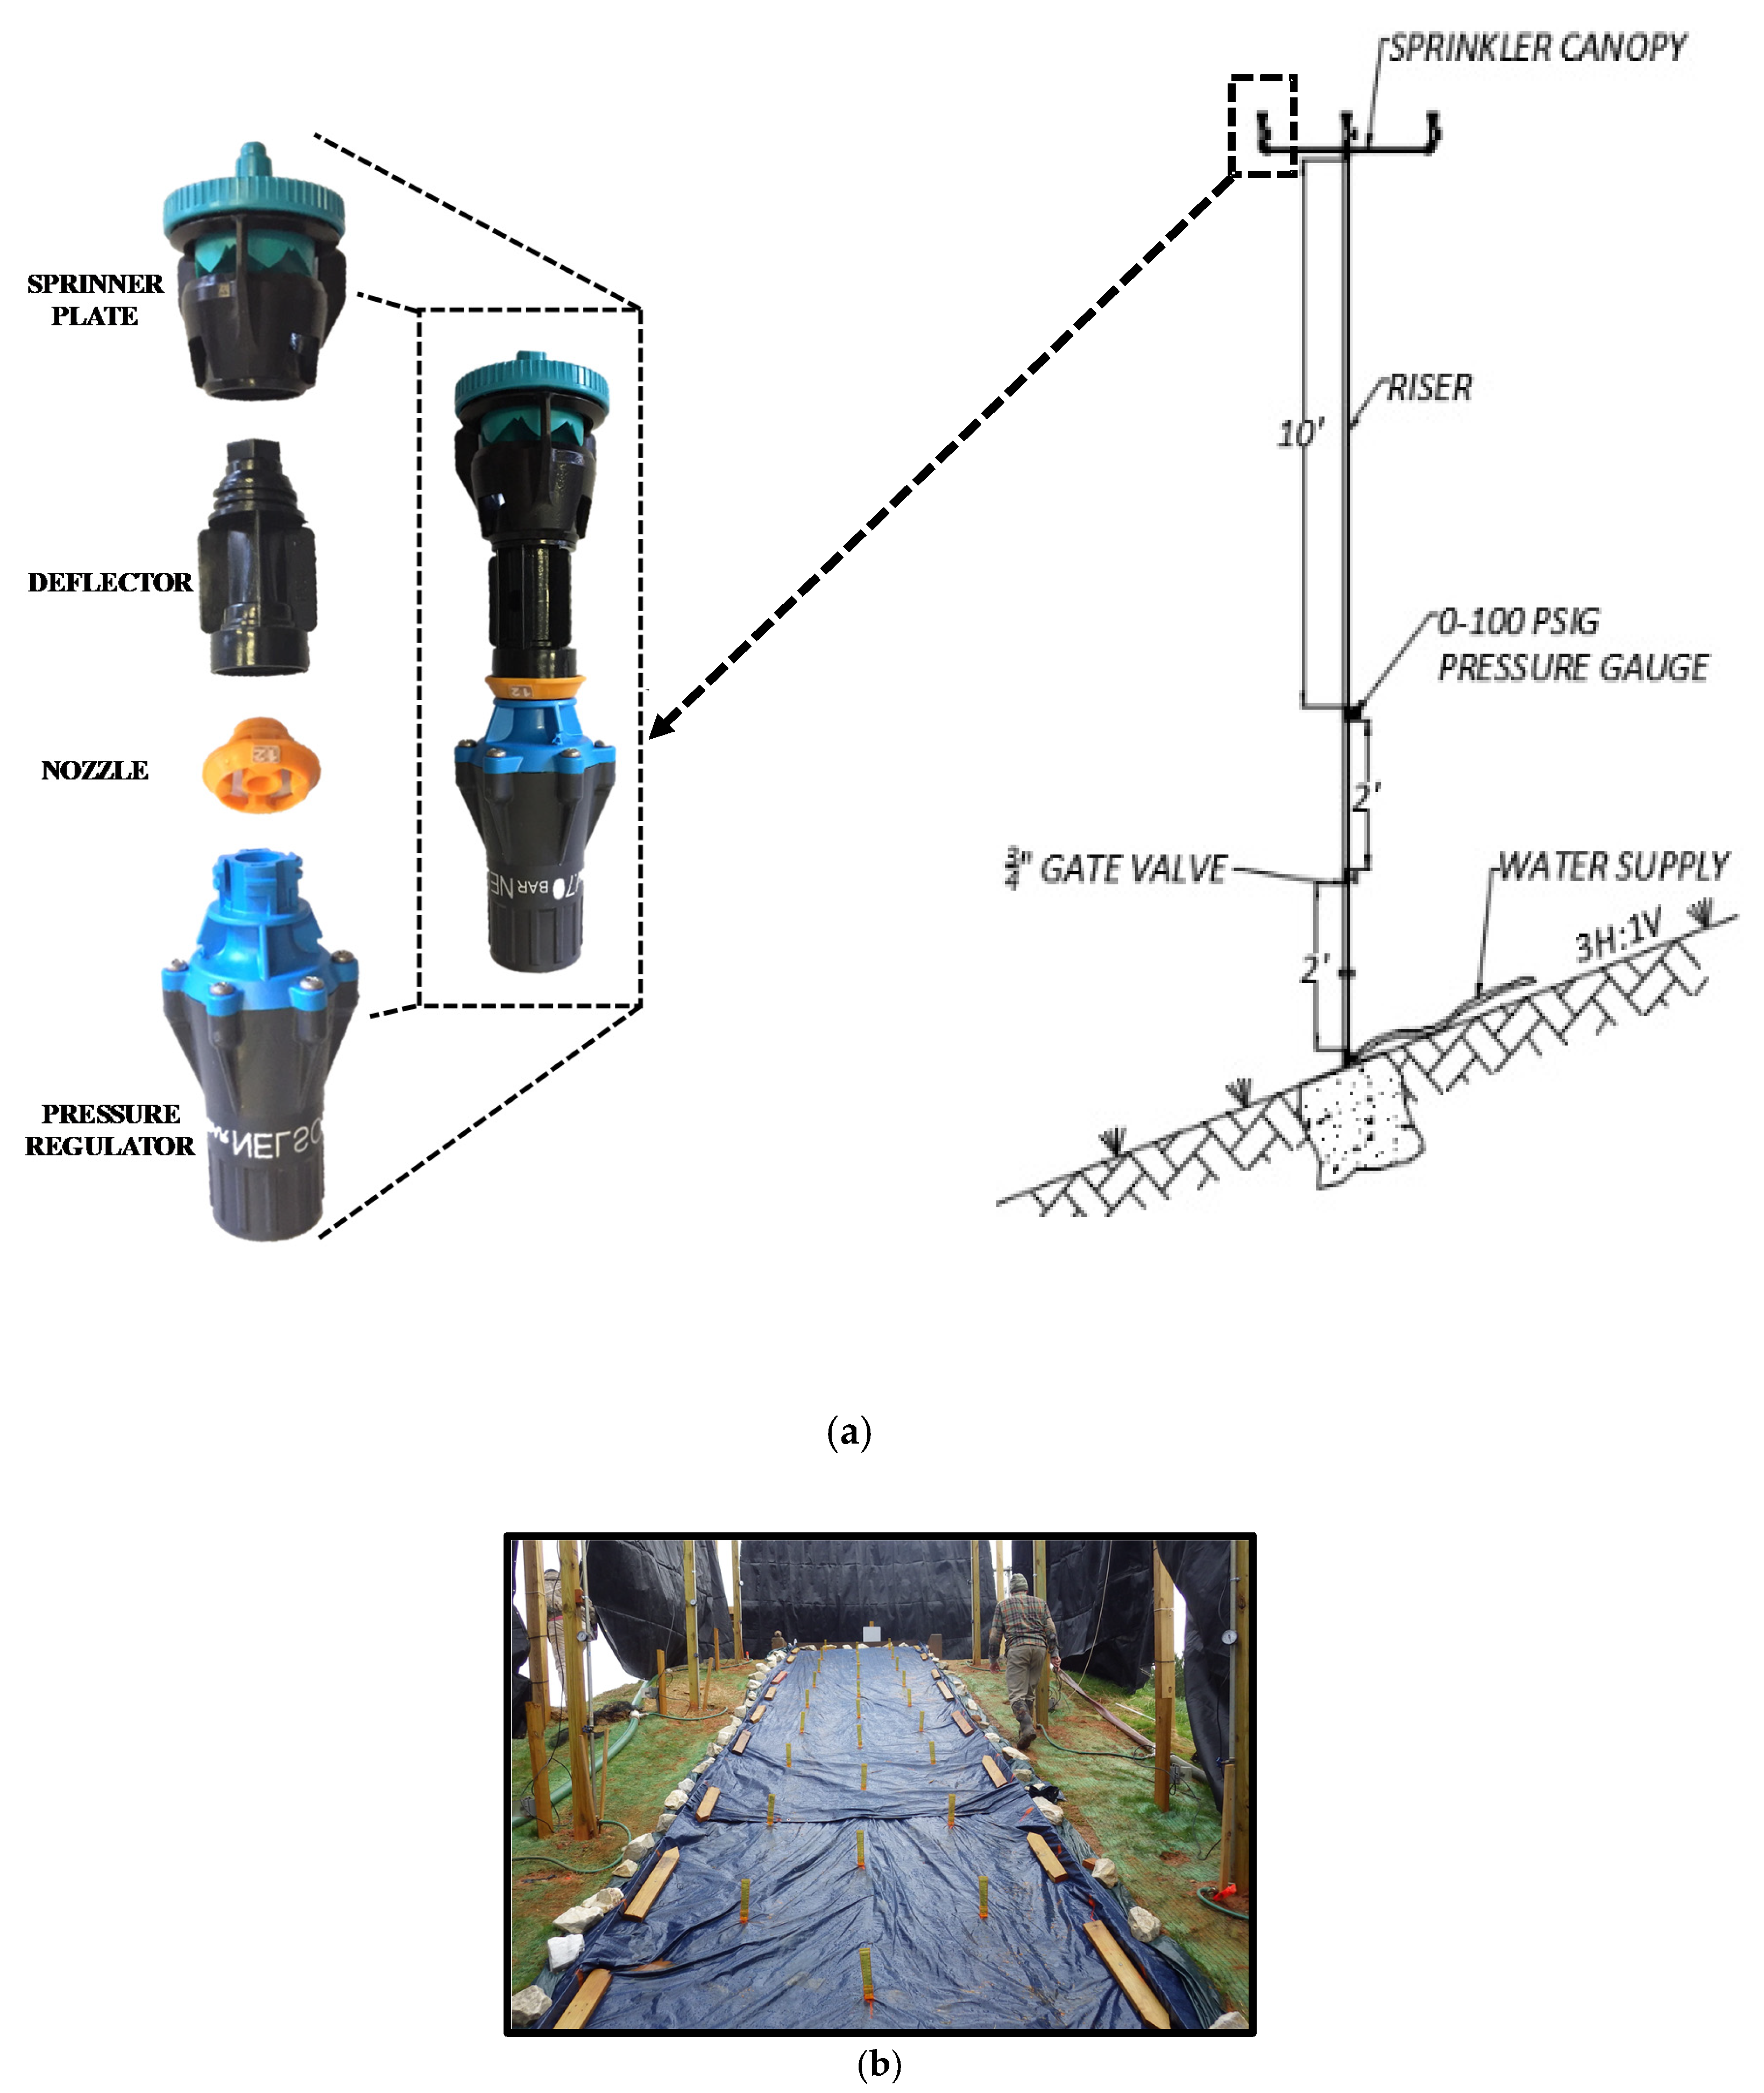
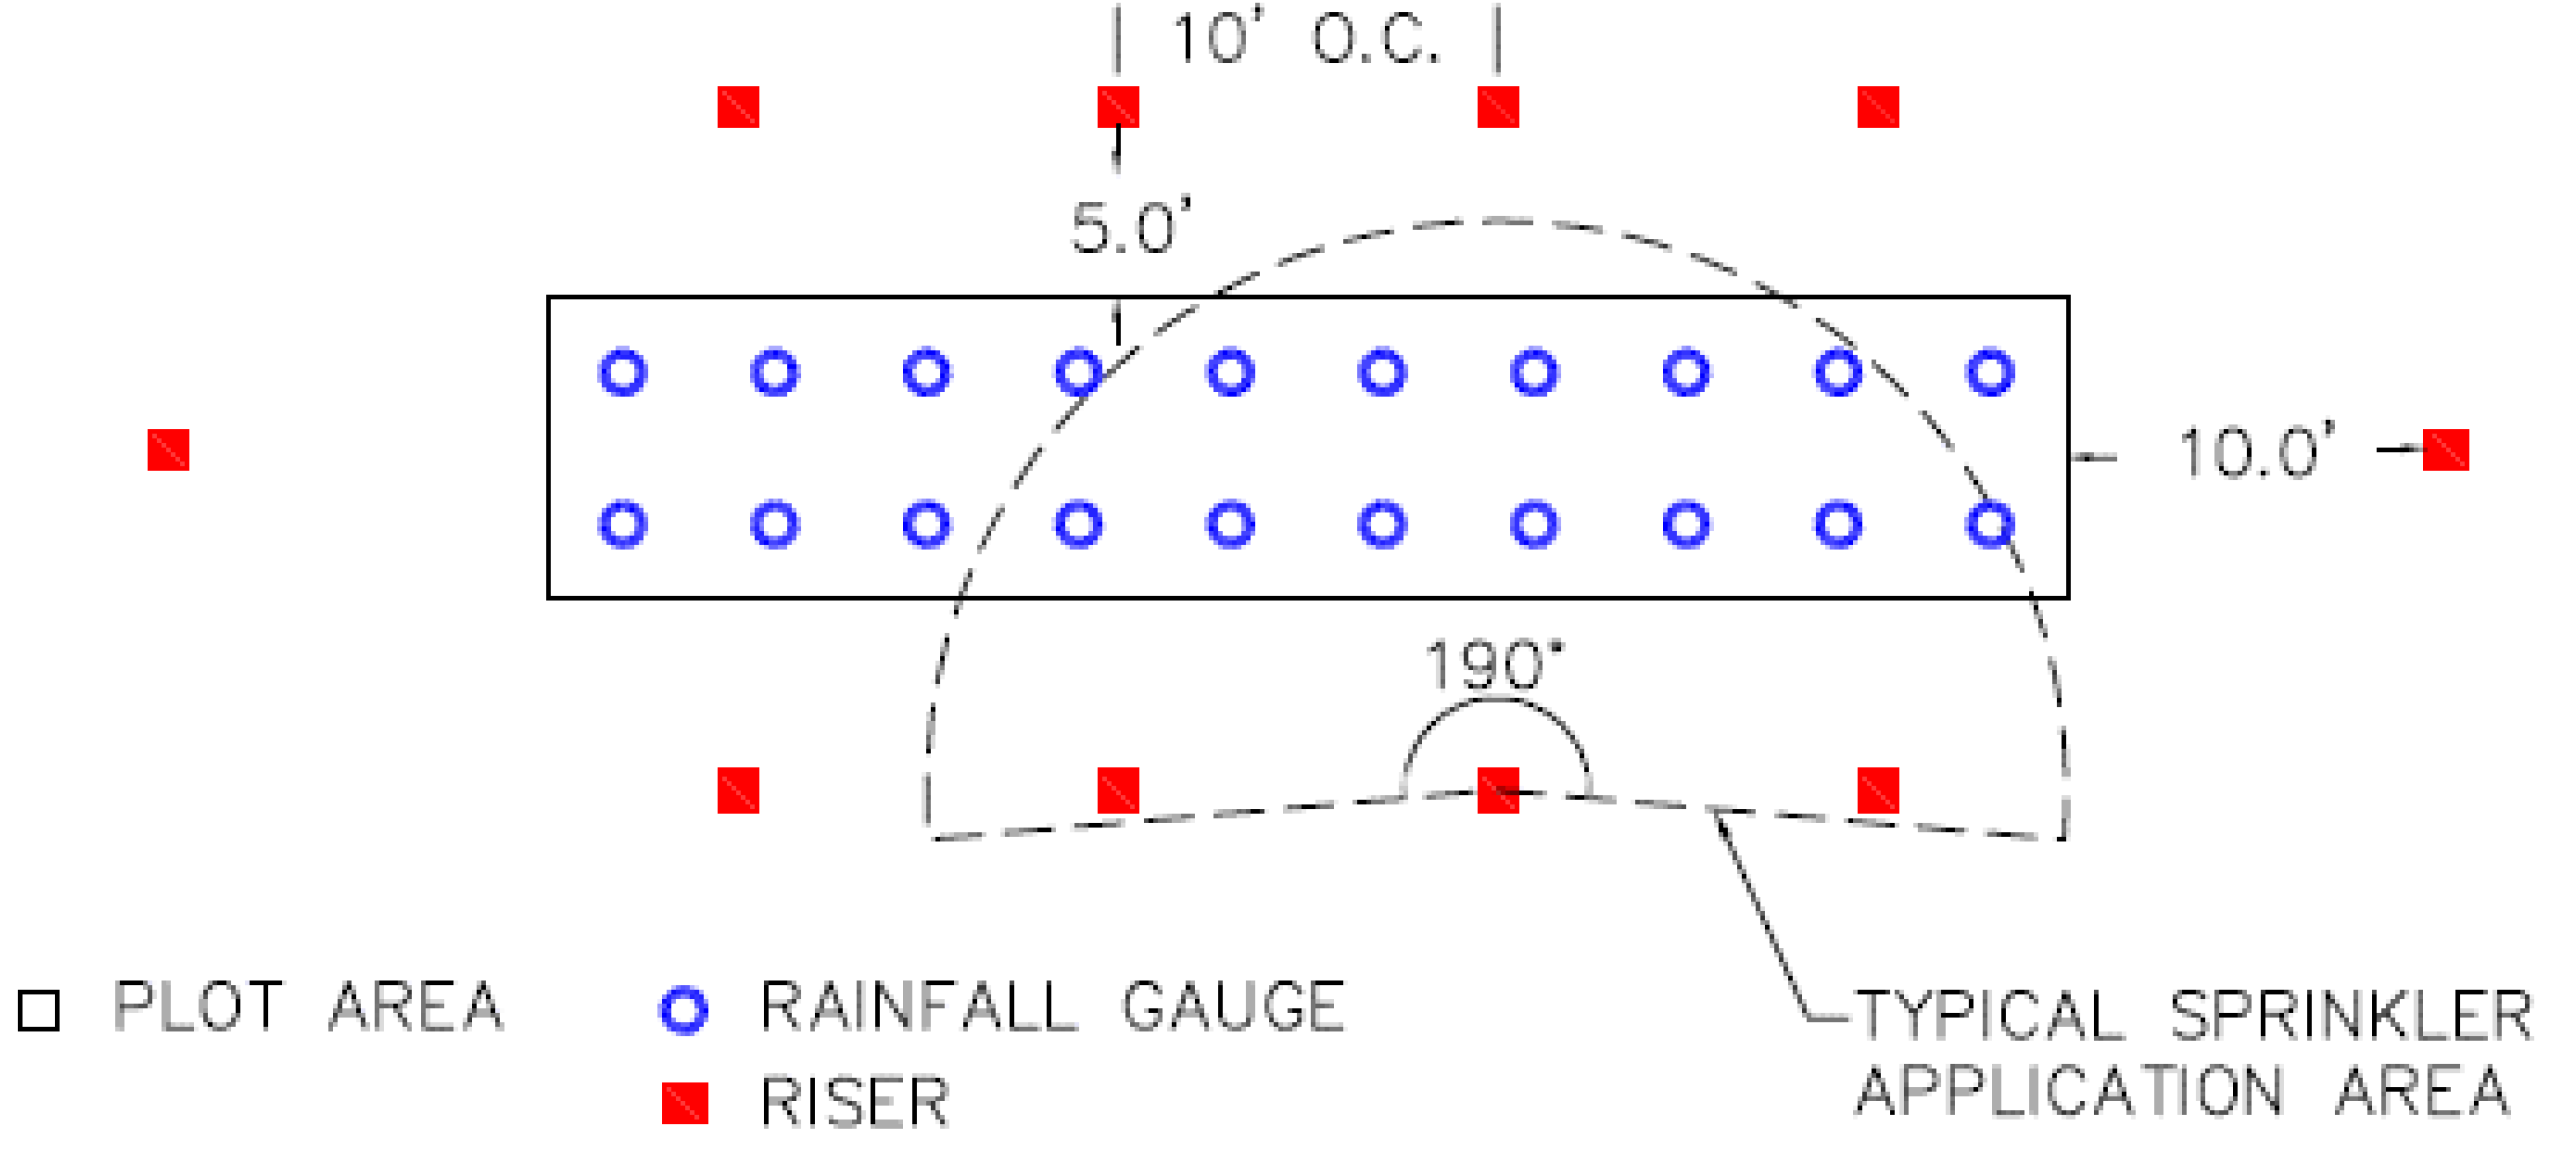
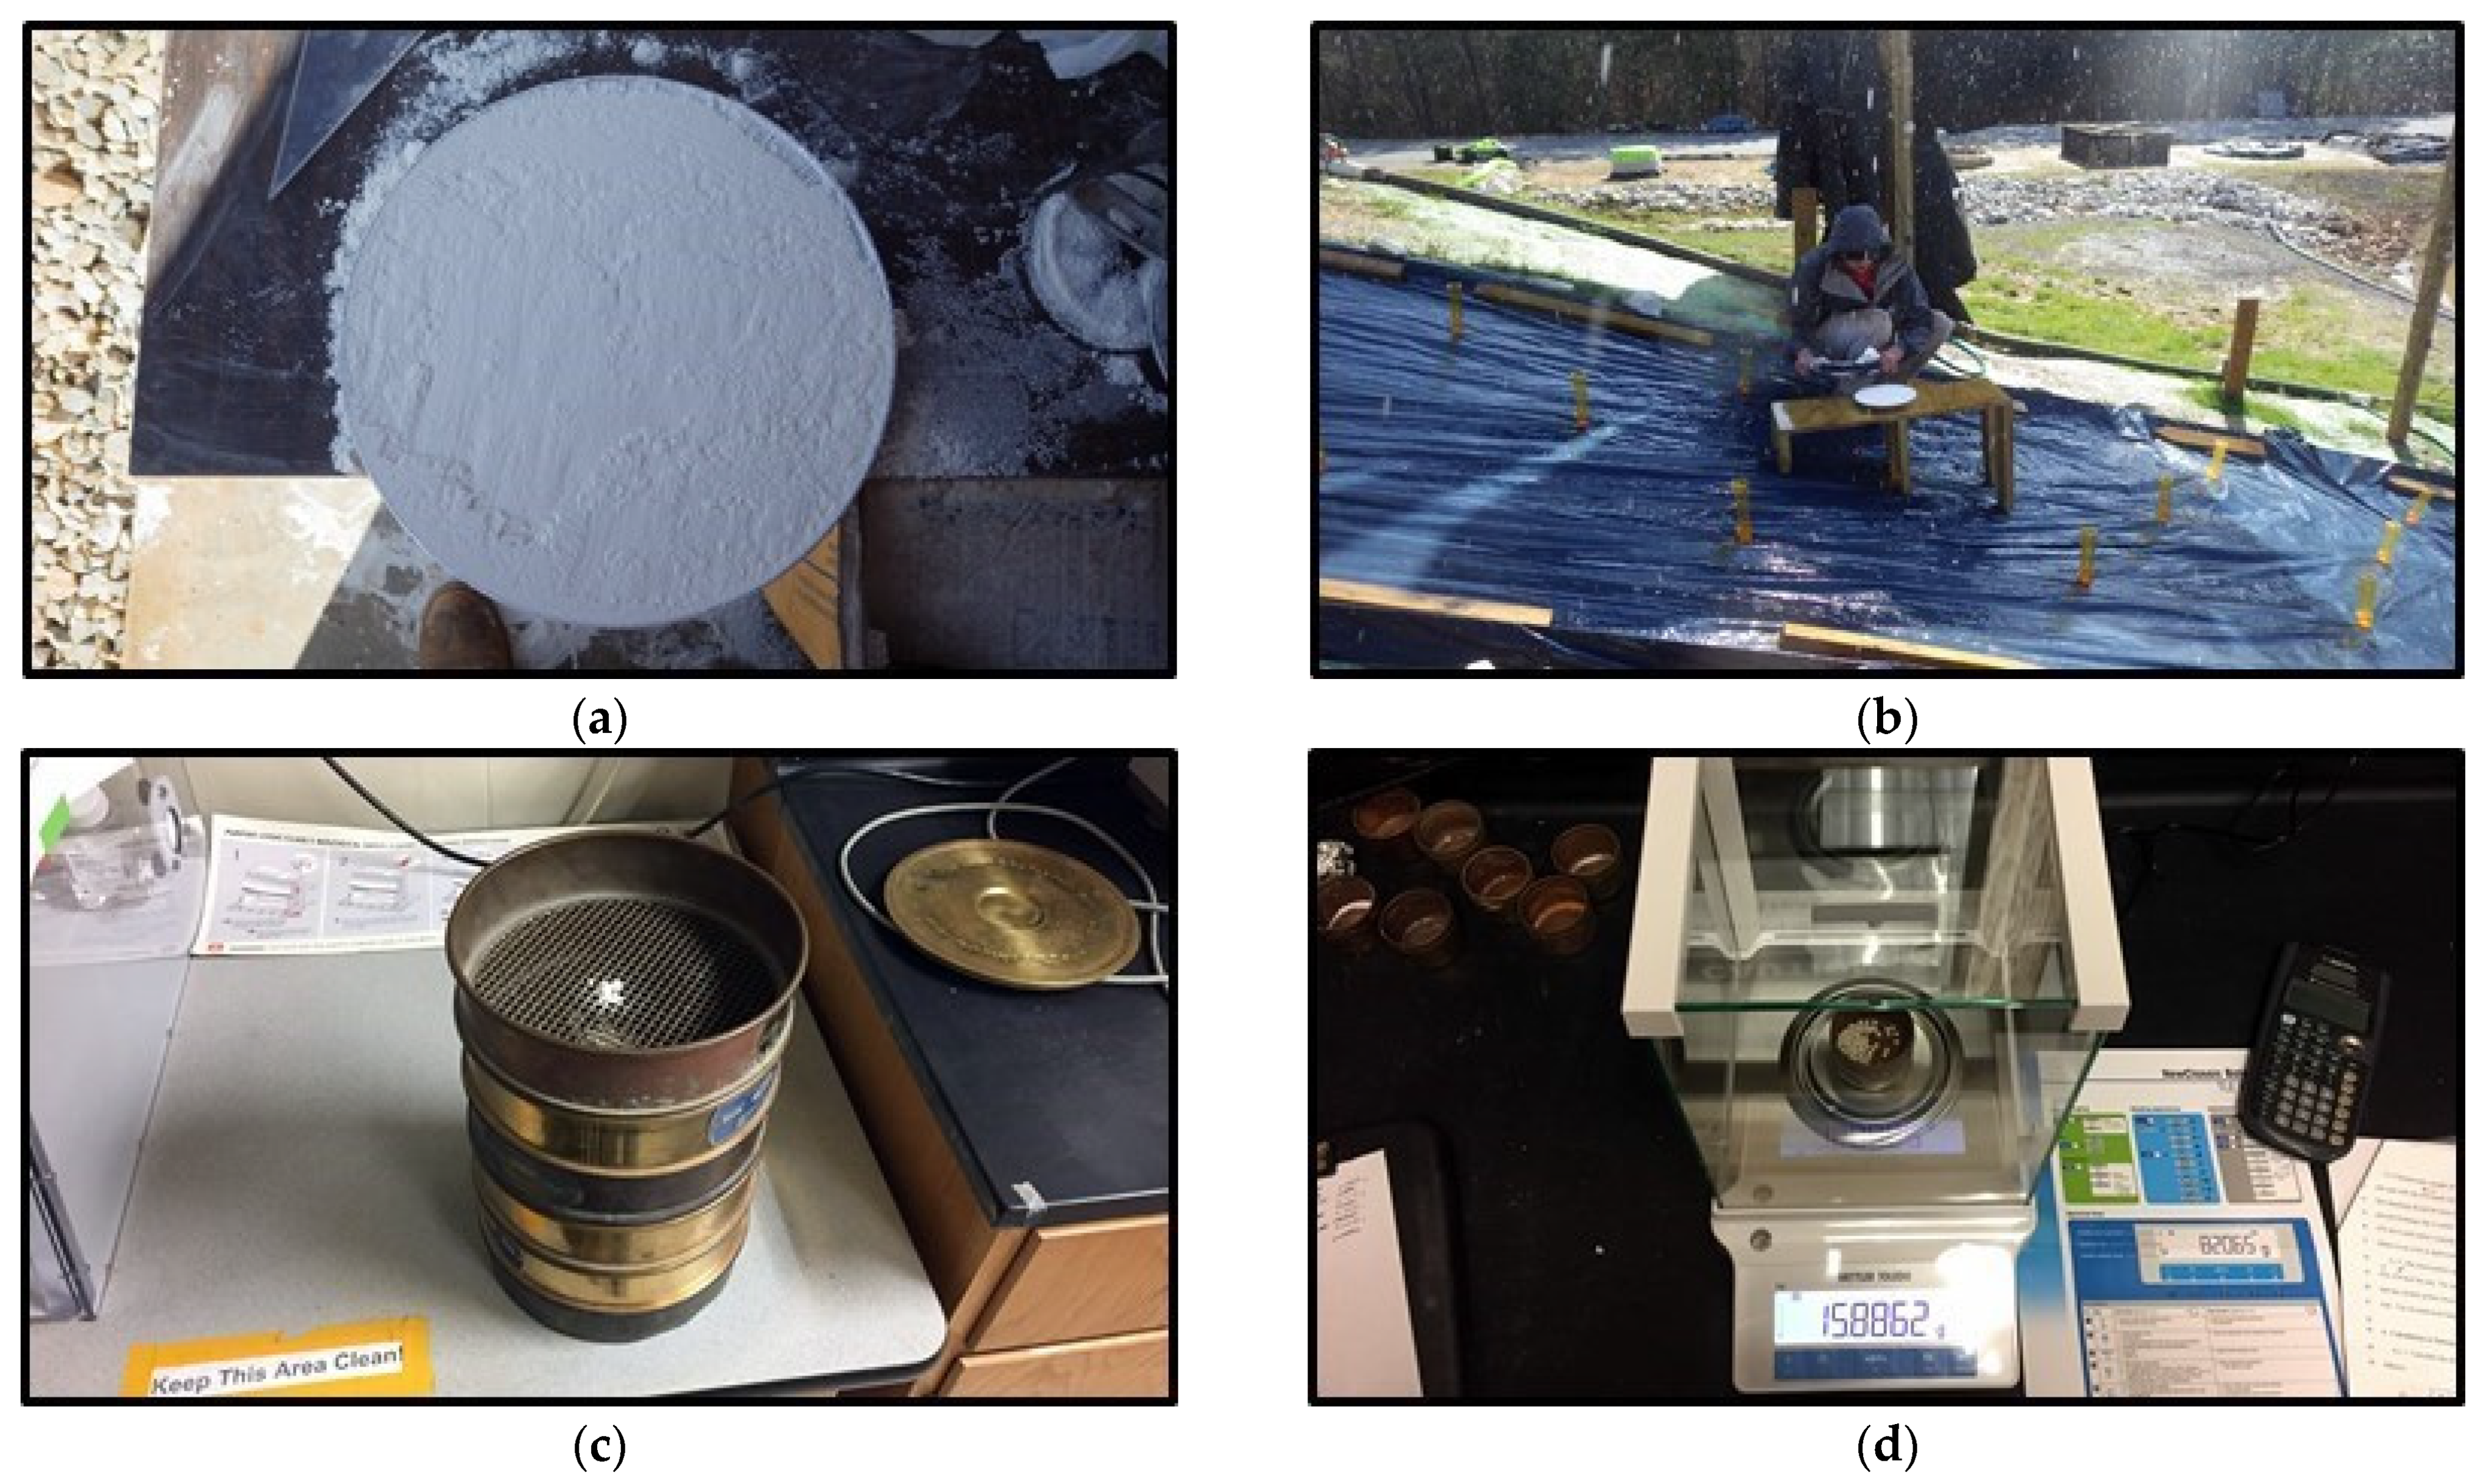
Following ASTM D6459-15, the rainfall simulator includes the use of sprinkler heads, sprinkler risers, pressure gauges, and valves. The ASTM design consists of nine sprinkler risers spaced evenly around the test plot. Raindrop sizes should vary from 1.0 to 6.0 mm (0.04 to 0.25 in.). Furthermore, the risers should be constructed to generate a minimum raindrop fall height of 4.3 m (14 ft). To conduct large-scale testing, a 12 m (40 ft) long by 2.4 m (8.0 ft) wide test plot must be constructed on a 3H:1V slope. The soil veneer used for testing should be placed in two, 15 cm (6.0 in.) lifts and must consist of either a loam, sand, or clay soil. The drop size distribution for a specific intensity is determined using the flour pan method [24,25]. Specified rainfall intensities are 50.8, 101.6, and 152.4 mm/hr (2.0, 4.0, and 6.0 in./hr). The test consists of three, 20-min intervals of increasing rainfall intensity for a total of 60 min.
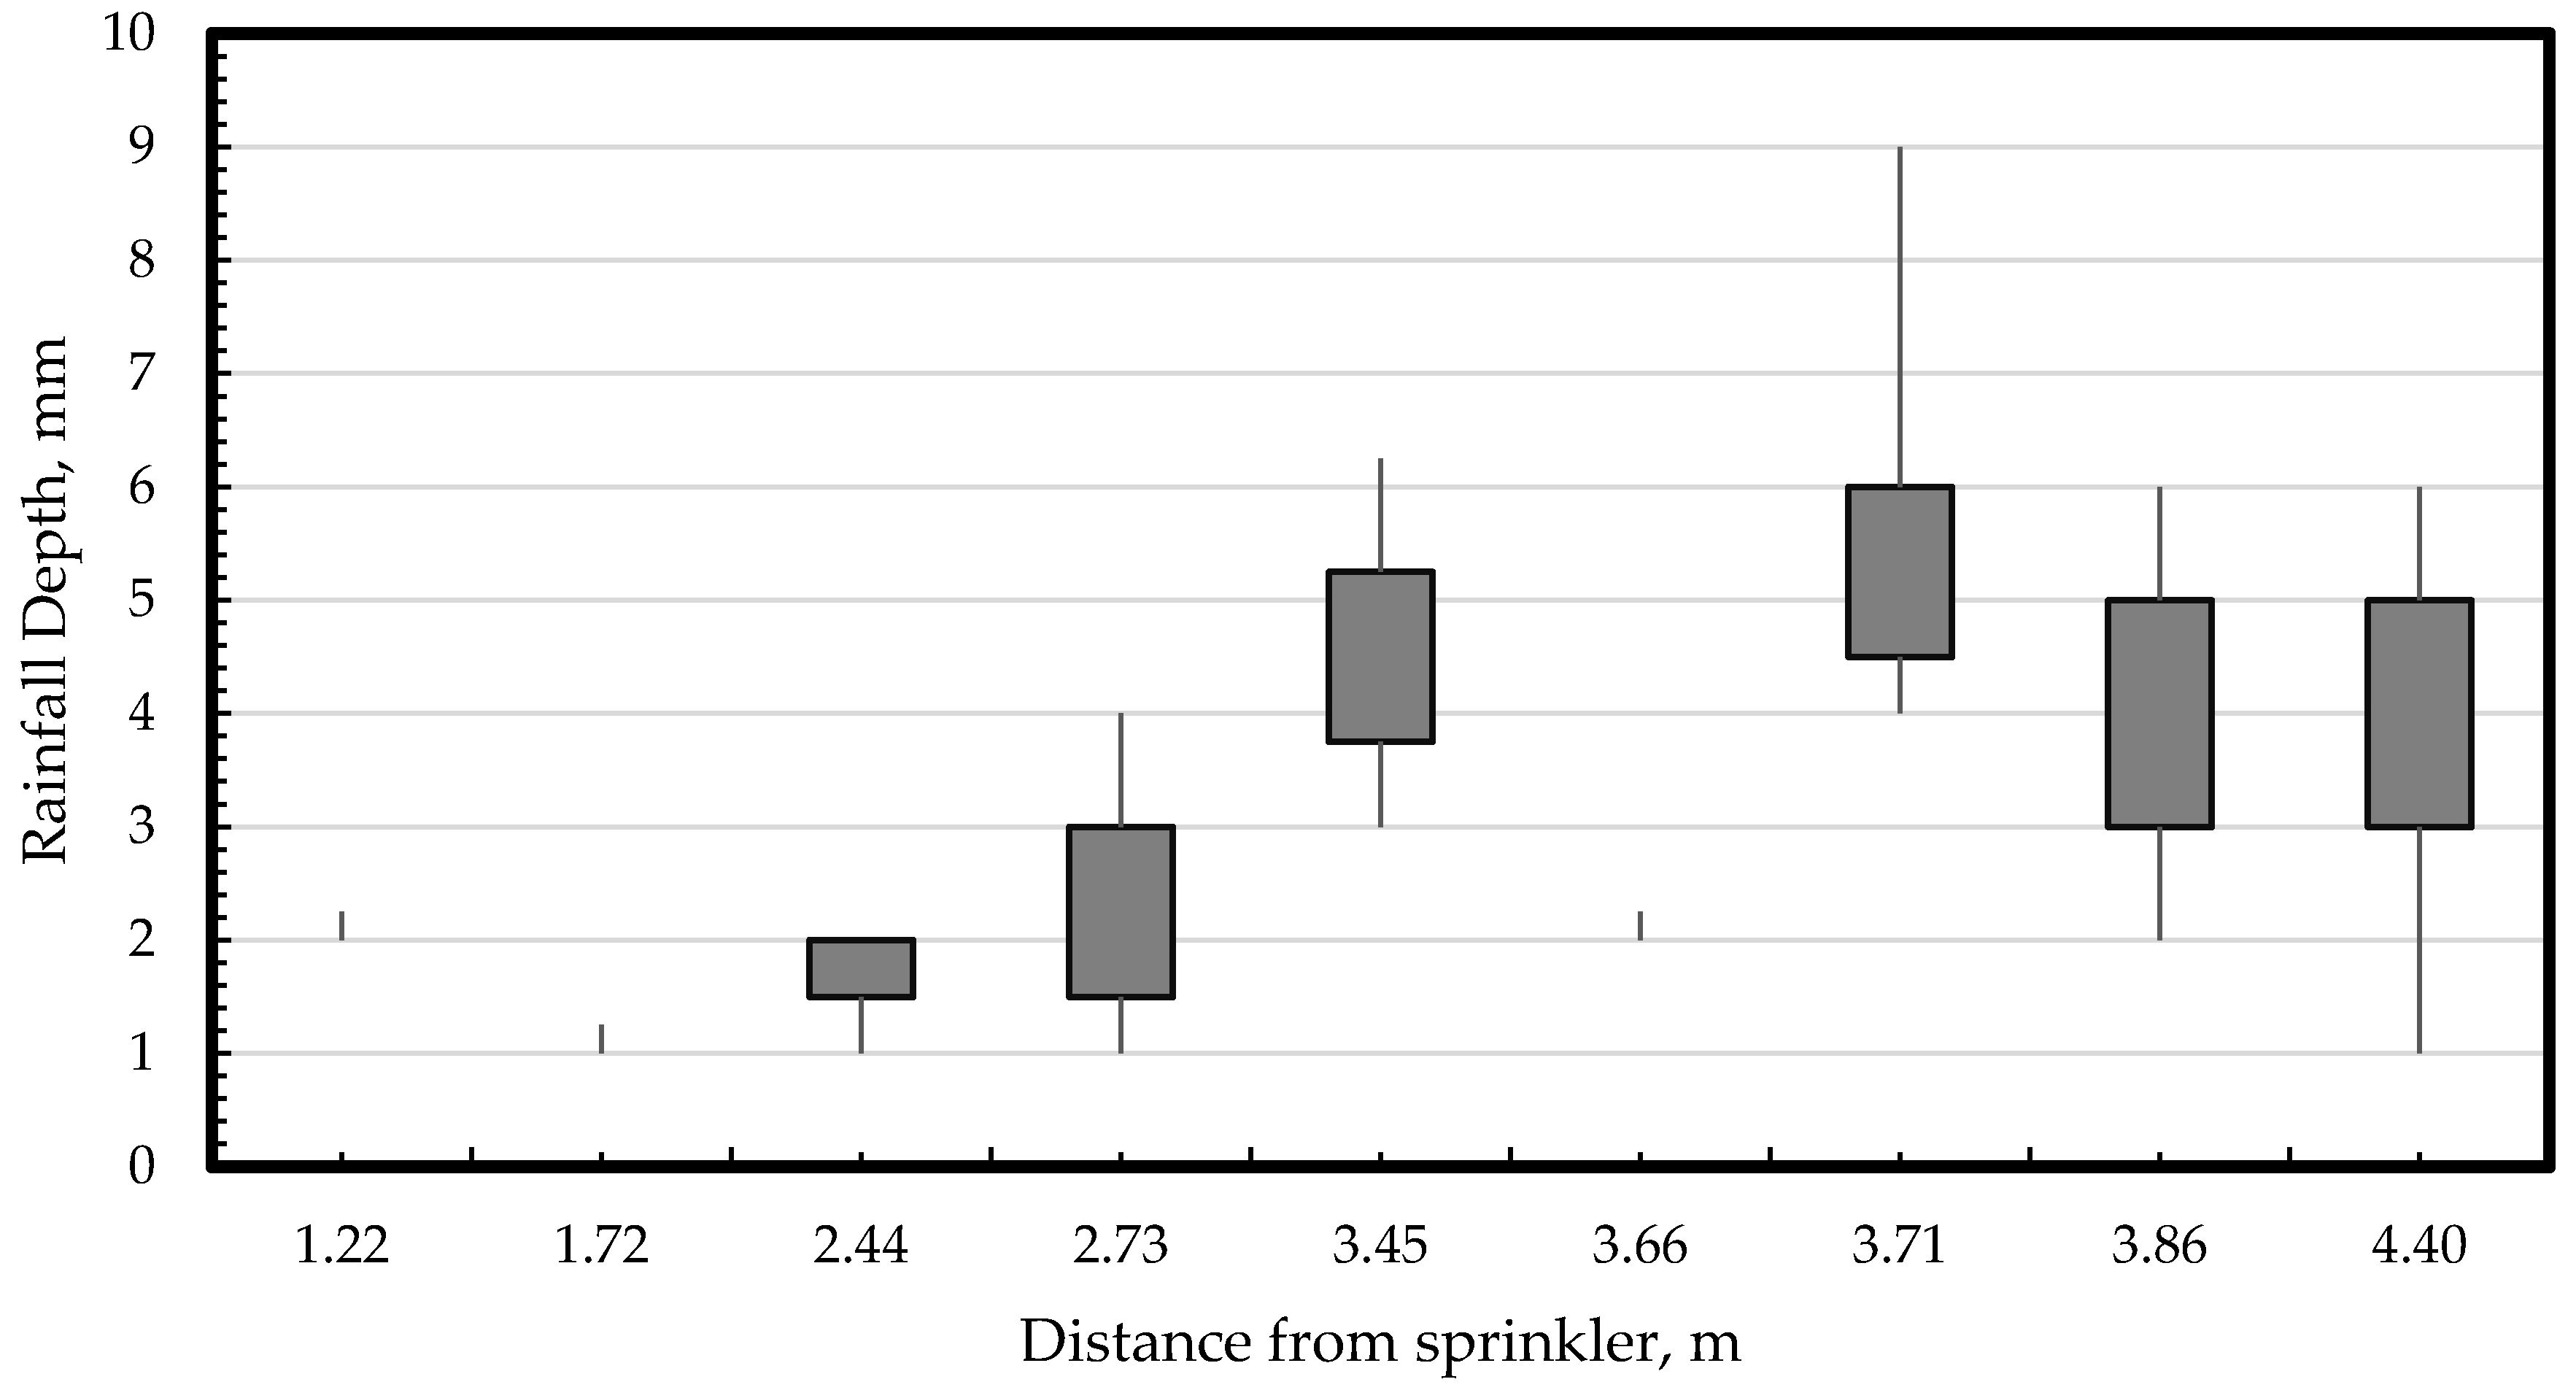
The ASTM standard requires apparatus calibration to ensure experimental values for uniformity of rainfall distribution, rainfall intensity, and drop size distribution are similar to natural rainfall. A calibration test consists of running the simulator at a specific intensity for 15 min. A collection of 20 rain gauges should be spaced throughout the test plot to collect rainfall data. The recorded rainfall depth in each rain gauge is analyzed to determine the experimental values for rainfall uniformity and intensity.

3. Design and Construction of the Auburn Rainfall Simulator

The purpose of this manuscript is to document the design and construction of a pressurized rainfall simulator with the aim of developing a portable, calibrated simulator capable of producing replicable, simulated rainfall events. The development of this rainfall simulator is in collaboration with the Alabama Department of Transportation to provide the capability to evaluate erosion control practices and products based upon performance under simulated rainfall. This simulator will also provide the industry with much need additional testing options, as there is currently only one simulator within the U.S. that is certified to ASTM D6459 and American Association of State Highway and Transportation Officials (AASHTO) testing requirements. In this study, a rainfall simulator and full-scale test plot were constructed at the Auburn University-Erosion and Sediment Control Test Facility (AU-ESCTF) in Opelika, Alabama. The rainfall simulator design was based on specifications listed in ASTM D6459-15 [22].

3.1. Sprinkler Head Design

As specified in ASTM D6459-15 [22], the targeted rainfall intensities for the rainfall simulator was designed for 20-min intervals of 50.8, 101.6, and 152.4 mm/hr (2.0, 4.0, and 6.0 in./hr), respectively. The rainfall simulator apparatus incorporates solenoid valves to instantaneously alter flow rates by turning on sprinklers to achieve the required intensity over the 60-min experiment.
After reviewing several commercially available pressurized sprinkler heads, Nelson Irrigation (Walla Walla, Washington, USA) PC-S3000 sprinkler heads Figure 1a were selected in lieu of nozzles specified in ASTM D6459-15, as the specified nozzles are no longer commercially available. The PC-S3000 sprinkler heads were selected in part due to: their ability to operate at pressures as low as 41.4 kPa (6.0 psi); apply water in a 190° arc; the ability of the equipped spinner plates to shear apart flow in the sprinkler head to generate rain-like droplets; and their capability in interchangeable nozzles that allow for various flow rates. The PC-S3000 use nozzles to control the flow rate through each sprinkler head. At any given pressure, each nozzle allows a specific flow rate through the sprinkler, depending on its size. Furthermore, the sprinkler heads can be equipped with pressure regulators to ensure uniform pressure and thereby a constant flow rate. Manufacturer specifications for each nozzle size were used to determine the appropriate nozzle sizes for this study.
Several combinations of selected nozzles (Table 2) were used to achieve the variable intensities required to simulate the rainfall event. Initial testing was conducted for the selected nozzle sizes to determine the optimal spacing of sprinkler heads in relation to the rainfall plot gauges. This testing was conducted for each sprinkler considered to determine the optimal distance from a riser to the predetermined rain gauge layout as shown above. One example of the test data is shown in Figure 2, below. The 15-min duration tests were repeated many times for each sprinkler to generate a data series of rainfall depths at nine rainfall gauges (different distances to the sprinkler) in order to develop the box plots on Figure 2. At three rainfall gauges (1.22, 1.72, and 3.66 m) measured rainfall depths did not have much variation so no box plots are shown for them on Figure 2.
Based on the testing conducted, the following distances were selected for the riser spacing: 1.52 m (5.0 ft) from plot edge and 3.05 m (10.0 ft) center to center as shown in Figure 3. As detailed in ASTM 6459-15 [22], nine risers are specified for the test plot. For this study, an additional riser was installed at the top of the test slope as shown below to provide for a more uniform delivery of simulated rainfall across the plot. As shown in Figure 3, the 190° application allows for a large portion of the rainfall to be applied outside the plot area. The ratio of the plot area of application to the overall sprinkler application area is approximately 36%. As shown in Table 2, the percentage for the theoretical flow requirement (rainfall depth x plot area) versus the total flow produced (total output for all nozzles) is fairly consistent throughout all three rainfall intensities.

3.2. Sprinkler Canopy Design

To effectively distribute water over the test plot, a rain canopy, Figure 1b, with three sprinkler heads was designed for each of the ten risers. The canopy was designed to allow for each sprinkler head to be individually operated to achieve flow rates displayed in Table 2. The Nelson Irrigation sprinkler heads, Figure 1a, spray directly out and downward, and the height of the risers was set at 4.3 m (14 ft) to satisfy ASTM D6459 standard for fall height and terminal velocity.
The canopy and all components were constructed of 19 mm (0.75 in.) diameter galvanized steel pipe to provide structural stability as well as to resist corrosion. The canopy connected to the supporting riser through a galvanized steel pipe cross in the center of the canopy. Solenoid valves were installed upstream of each sprinkler head to allow for individual and automated operation. The use of solenoid valves represents a change from the manually operated ball valves in ASTM D6459-15.

3.3. Sprinkler Riser Design and Water Supply

A reducer tee was installed to allow for the attachment of a 0 to 690 kPa (0 to 100 psi) pressure gauge. This gauge was used to verify that adequate pressure was generated by the water delivery system. The riser is supported by a concrete footing as shown in Figure 1b. The risers were also anchored to a 10.2 cm by 10.2 cm (4 in. by 4 in.) nominal pressure treated post to ensure the riser remains plumb and level. A 7.62 cm (3 in.) high pressure water pump, capable of producing 80.2 m (263 ft) of pump head, was used to supply and pressurize water to the rainfall simulator.

3.4. Wind Screen Design

To minimize the impact of cross winds on rainfall simulation experiments, a series of wind screens, suspension cables, and support posts were designed with the goal of reducing wind speeds on the plot to at most 1.6 km/hr (1.0 mi/hr). To support the screens, six, 12 cm by 12 cm, 6.0 m (6.0 in. by 6.0 in., 20 ft) nominal lumber posts were installed around the perimeter of the test plot, Figure 1b.

3.5. Electrical Systems Design

Simulation of variable intensity rainfall was accomplished by installing solenoid valves on the sprinkler canopy. The valves on each canopy were wired via direct burial irrigation cable to a custom designed electrical control box. The electrical control box consisted of a series of terminal blocks and was designed with three switches to provide control over which valves were active during testing. Two 12-V batteries were wired in parallel to the control box to power the entire valve system. Utilization of electronically controlled valves is an improvement over the current standard [22] which has been utilized in other rainfall simulators [27].

3.6. Methods and Procedures

Initially, the rainfall simulator apparatus was calibrated to determine the experimental values for rainfall intensity and uniformity. This process was critical in proving accurate and repeatable simulated conditions similar to natural rainfall (i.e., uniformity, drop size, and terminal velocity).
According to ASTM D6459-15 [22], twenty rainfall gauges are required when measuring and calibrating rainfall intensity and distribution. For this study, an additional nine rainfall gauges were installed along the center of the test plot as shown in Figure 1b.
For each target rainfall intensity, a calibration test was performed for a duration of 15 min. At the end of the test, the rainfall depth in each of the 29 gauges was measured and recorded in centimeters. The recorded values for rainfall depth were then used to calculate CUC using Equation (5), and average rainfall intensity:
C U C = 100 [ 1.0 ( | D i D a v g | ) n × D a v g ]
where CUC = Christiansen’s Uniformity Coefficient used to express uniformity of rainfall (%), Di = depth of rainfall in the ith gauge (cm), Davg = average rainfall depth in all gauges (cm), and n = number of gauges.
Using Equation (6), experimental rainfall intensities on the test plot were computed and compared to the targeted rainfall intensities for determining the relative errors:
i = 60 [ j = 1 J D j J t ]
where i = rainfall intensity (cm/hr), Dj = depth of rainfall (cm), J = number of rain gauges, and t = test duration (min).
Once the uniformity of rainfall was at least 80% for each target intensity, the raindrop size distribution for each intensity was measured using the flour pan method [24,25]. For each intensity, pans were filled with sifted flour and exposed to rainfall for 2.0 to 4.0 s. Raindrops impacting the flour created small pellets that were then sifted, baked, and separated using sieves. The pellets on each sieve were then weighed and counted. This process was repeated three times (at the top, middle, and bottom part of the slope) for each test intensity. Each of the four steps for the flour pan method are depicted in Figure 4. Using this information, the average raindrop diameter for each sieve was then calculated using Equation (7) [25]:
D r = ( 6 π ) M   m R 3
where Dr = average raindrop diameter (mm), M = average pellet mass (mg), which is the total mass divided by the number of pellets in each sieve for all three repetitions, and mR is the ratio of the mass of the raindrop to the mass of the pellet and determined using the flour-calibration figure developed by Laws and Parsons [25]. At the same time, the percent of the mass of the raindrops for each sieve can be determined with respect to total mass of all raindrops measured. The calculated results are shown in Figure 5, below.
Following the calculation of the raindrop size distribution, the kinetic energy generated at each rainfall intensity was calculated to determine rainfall energy, E. First, the raindrop fall height was determined by holding a surveyor’s rod vertically in front of the center of a single sprinkler riser, extended above the height of the sprinkler nozzles, while the riser was operational. The wetted height was recorded as the average fall height for the raindrops. Next, using the average raindrop diameters computed from the flour pan method, the average volume of the raindrops was calculated using Equation (8):
V a v g = 4 π 3 ( D r 2 ) 3
where Vavg = average volume of raindrops (mm3), and Dr = average diameter of raindrops (mm). The diameter of the drops is used with Figure 6 to determine the velocity of the drops falling from the height of the rainfall simulator and the terminal velocity. From this, the values for kinetic energy were calculated using Equation (9):
K E = 0.5 m v 2
where, KE = kinetic energy (J), m = average mass of raindrop (kg), and v = velocity of raindrop (m/s).
The final step of the calibration process was to calculate the erosion index using Equation (4).

4. Results and Discussion

Calibration experiments were conducted to provide a means to quantify the performance of the rainfall simulator and determine if the apparatus is capable of simulating rainfall with characteristics similar to natural rainfall on a consistent basis. The methods and procedures previously discussed produced a multitude of data in the form of rainfall depth measured from each of the 29 rain gauges after each calibration test. The data from each test were analyzed to determine the average rainfall intensity and CUC. Finally, the values calculated from the calibration tests for each target rainfall intensity were averaged to provide a generalized report on the performance of the rainfall simulator in terms of experimental rainfall intensity and uniformity of rainfall distribution.
To validate the calibration process, a minimum of ten calibration tests for each intensity were conducted. If the standard deviation was less than or equal to 2.54 mm/hr (0.10 in./hr), testing efforts would proceed to the next interval. A maximum deviation of 2.54 mm/hr was set as the realistic limit for the simulator performing in a consistent and repeatable fashion. A total of 30, 15-min calibration tests were performed. The results from the calibration tests for all test intervals are summarized in Table 3. The flow rate column represents the sum of the flow rates provided by the nozzles at a constant pressure of 41.4 kPa (6.0 psi).
After analyzing the values in Table 3, it was concluded that the rainfall simulator consistently produced rainfall intensities slightly higher than the theoretical target. According to Meyer [3] the experimental intensities should only vary from the theoretical intensities by a few percent. For the purpose of this study, the benchmark was set at 5.0%. Although the average rainfall intensities were higher than the theoretical target, the standard deviation between the 30 calibration tests was only 1.78 mm/hr (0.07 in./hr). This result ensured that the rainfall simulator was producing repeatable results in terms of rainfall intensity for all test intervals. 
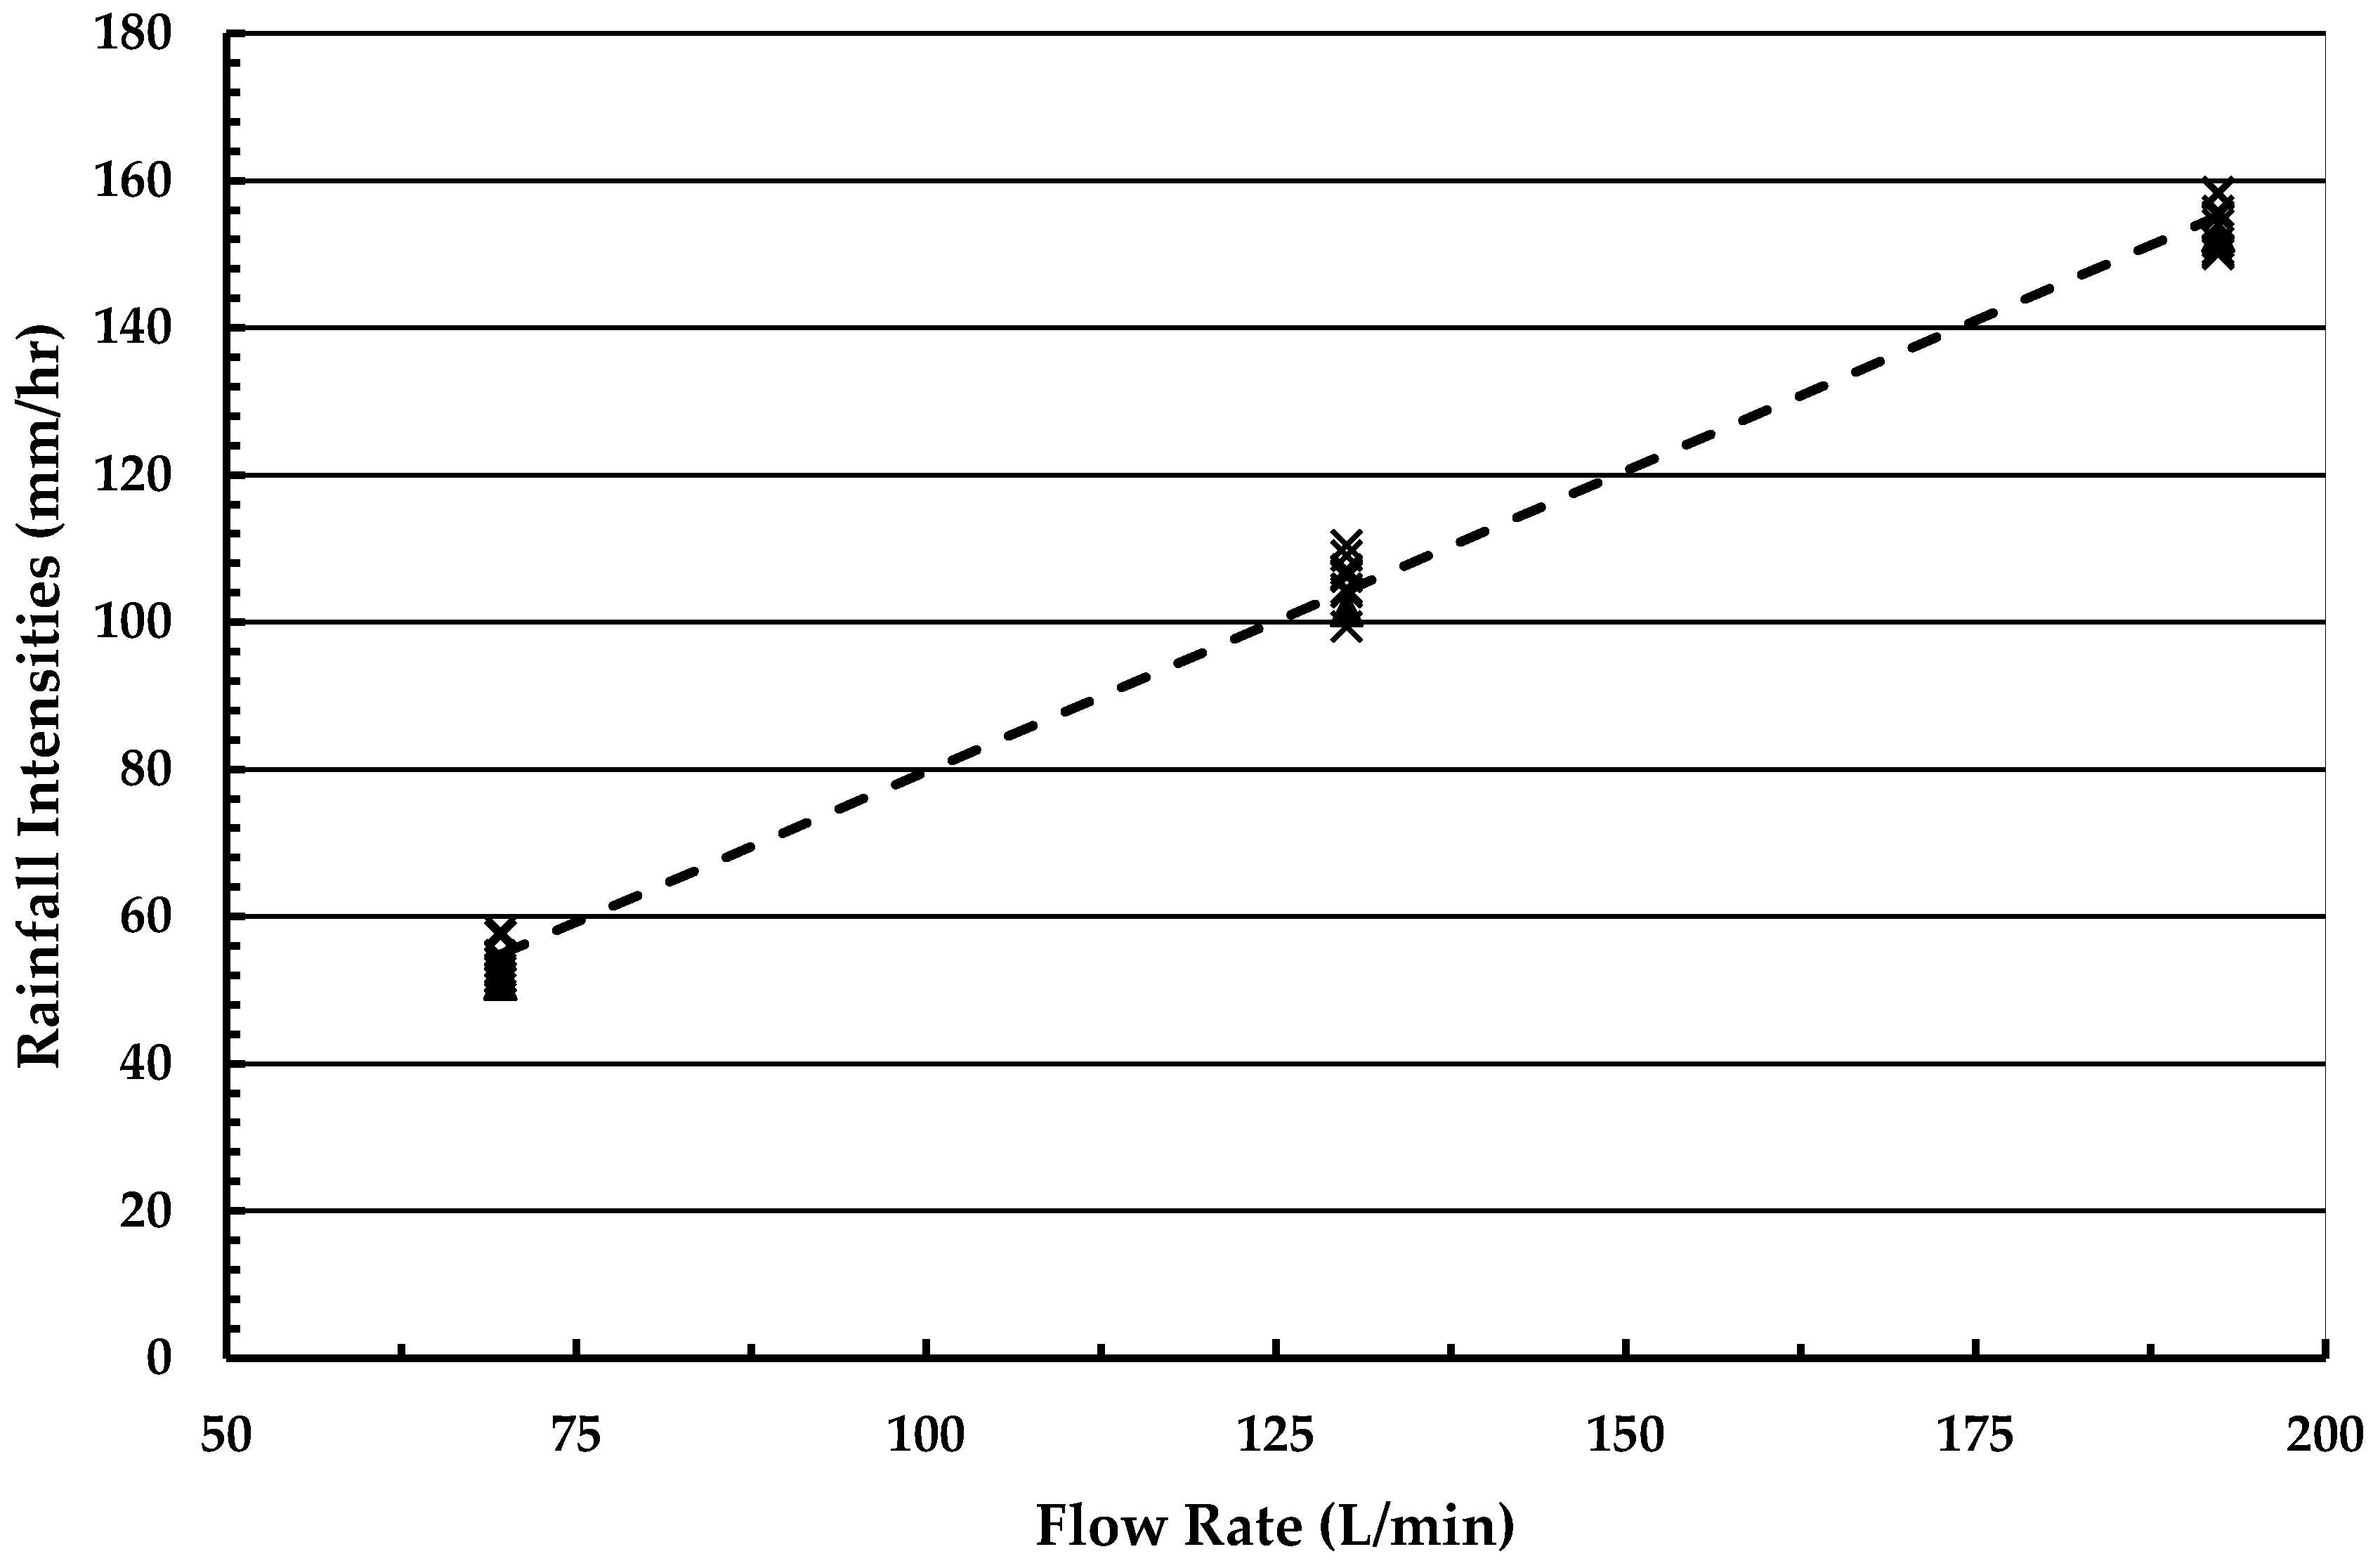
Figure 7 graphically illustrates that the experimental rainfall intensities calculated during calibration were typically slightly higher than the theoretical targets. The intensity produced by the rainfall simulator follows a linear pattern based on the total flow rate in the sprinkler heads. The R2 value quantifies how accurately the trend line fits the data. With a R2 value of 0.994, the linear trend line serves as a reliable means for estimating flow rates and corresponding nozzle sizes required to simulate specific rainfall intensities.
The average experimental rainfall intensities were used to calculate the EI using Equation (6) and to compare against theoretical values. EI is used in calculating the rainfall-runoff erosivity factor (R-factor) used in the RUSLE calculations for expected erosion over a given area. The R-factor is used to quantify the erosive energy of rainfall associated with specific storm events. The results from this analysis are presented in Table 4.
The calculated values in Table 4 correspond with the results from Figure 6. The higher rainfall intensities produced by the rainfall simulator result in greater erosive potential on the test slope. The ensuing result is that higher rates of soil erosion are generated by the simulated rainfall versus what should be expected from the actual storm event. However, as the rainfall intensities increase, the relative error between the experimental and theoretical values decrease.
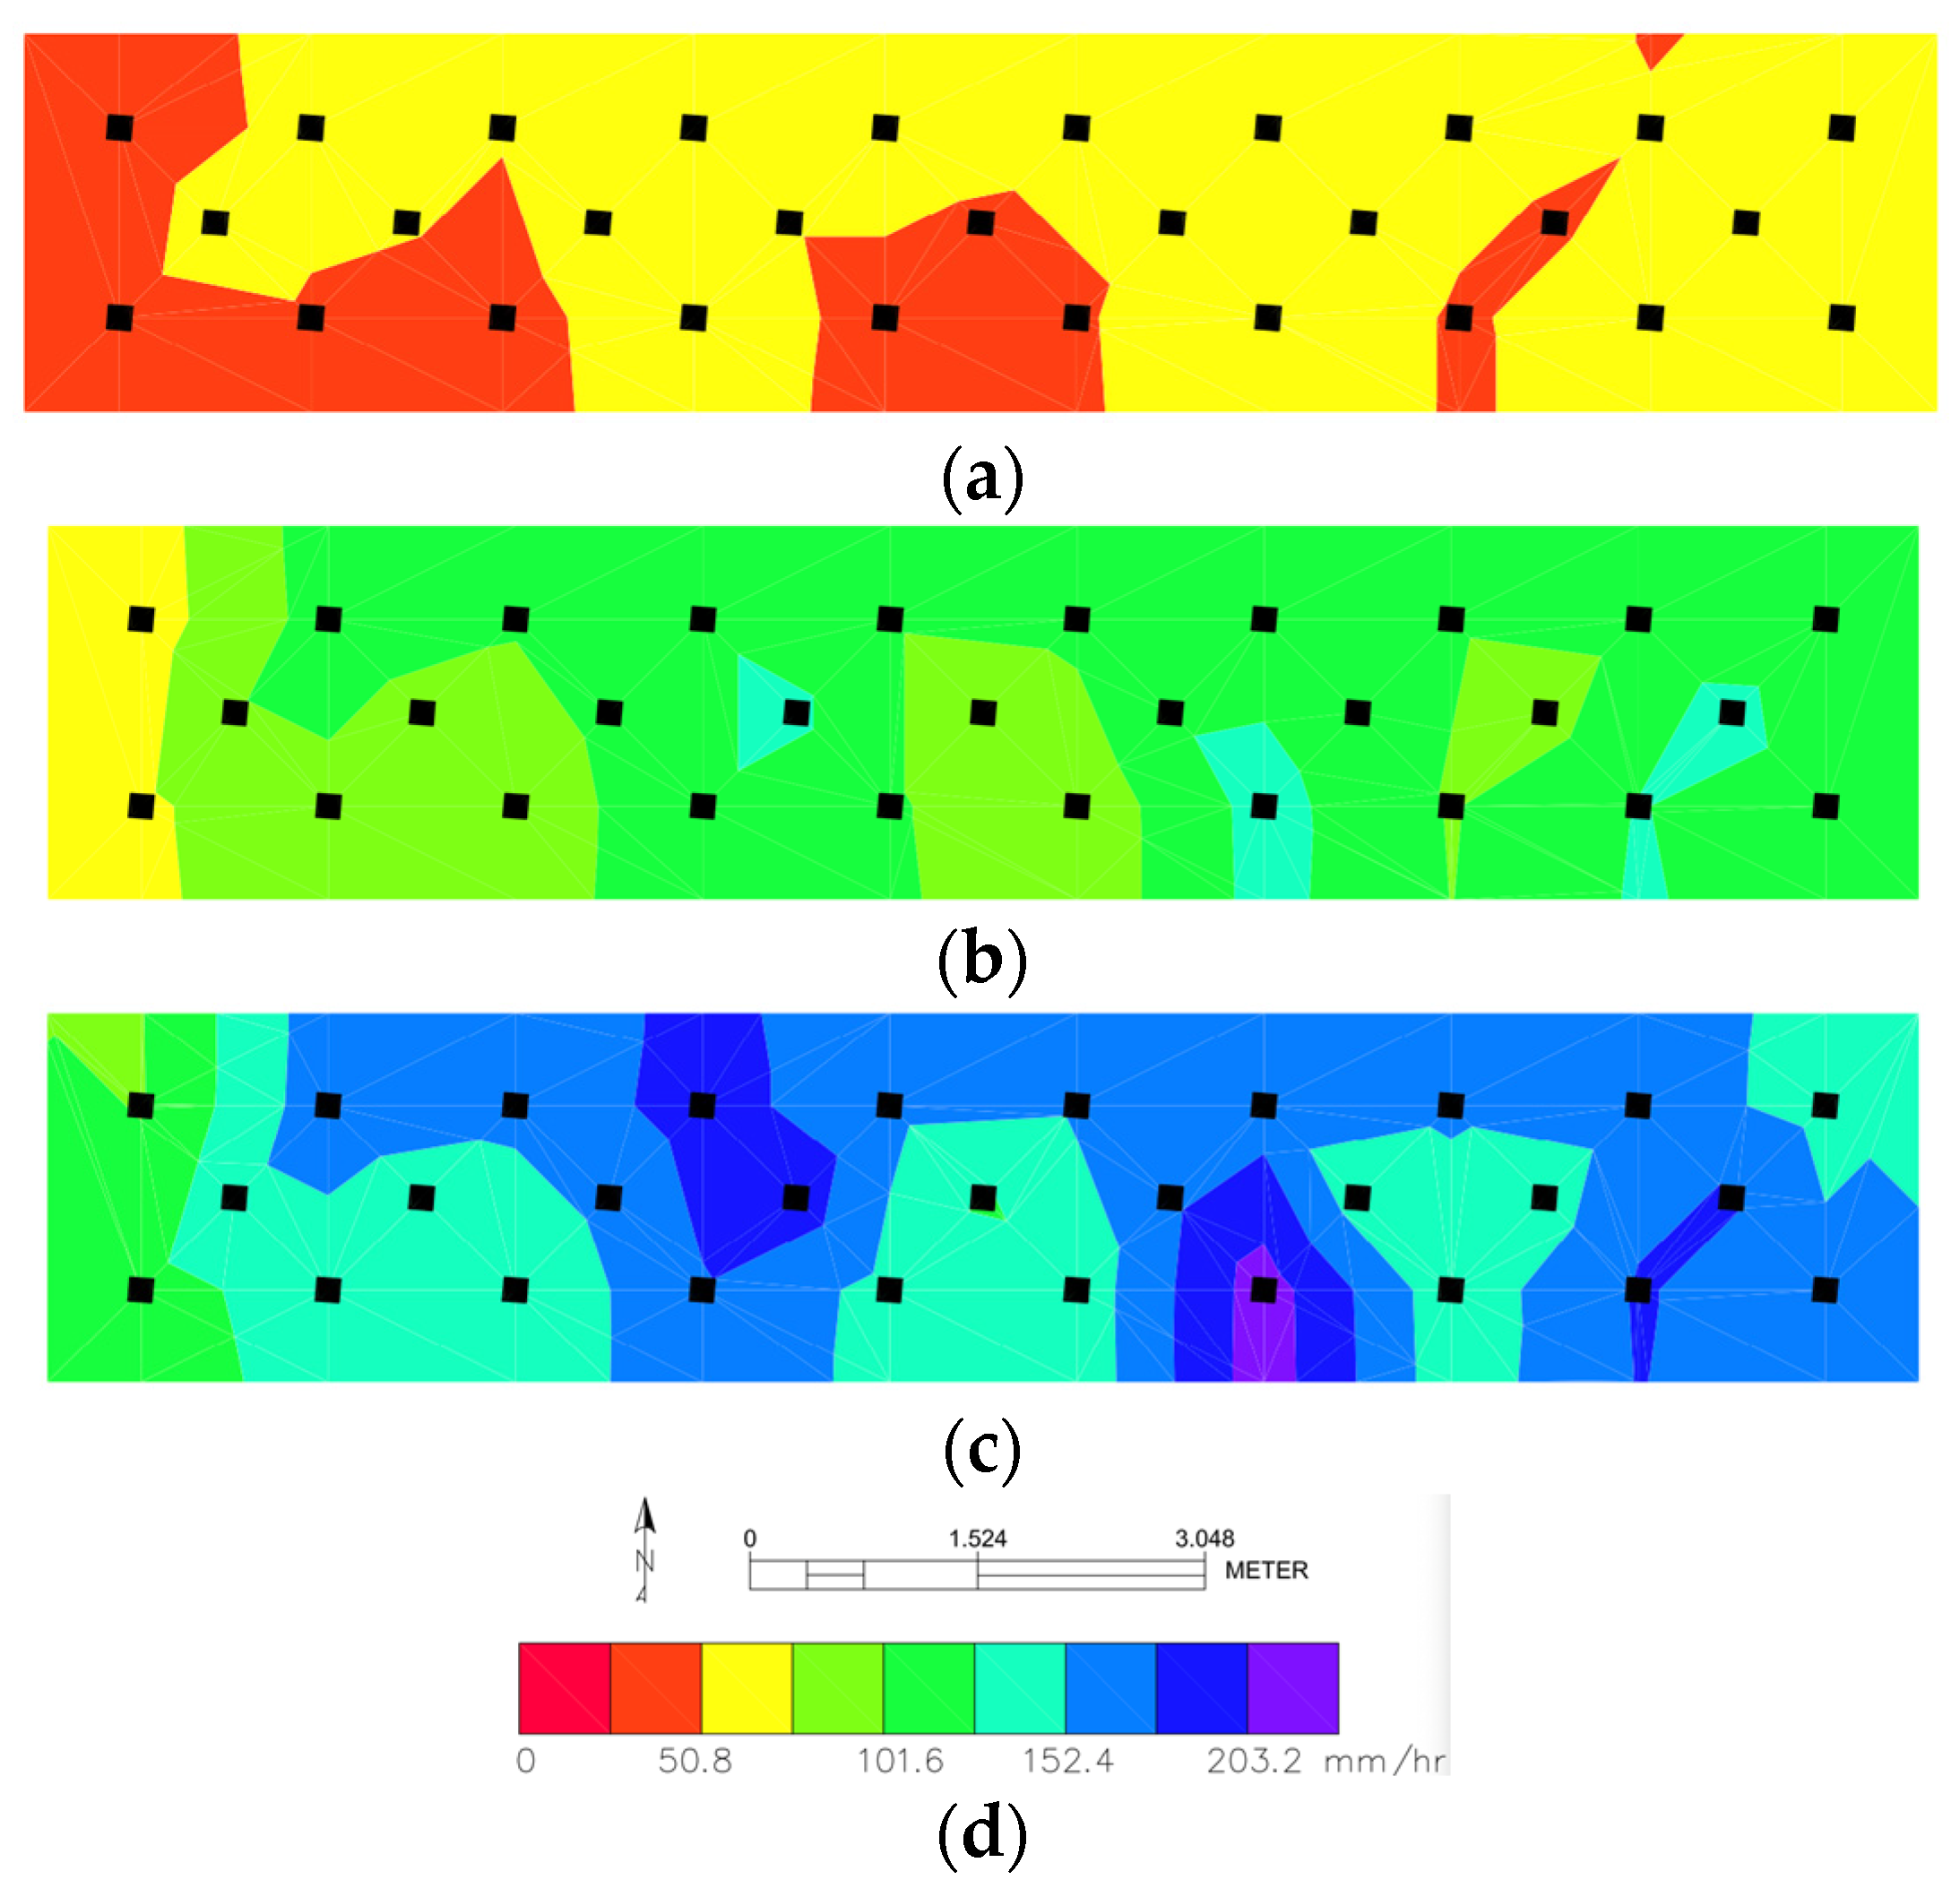
To aid in the visualization of the uniformity of rainfall distribution for each test interval, raster surfaces showing rainfall intensity were generated using AutoCAD Civil 3DTM and overlaid on an aerial photo of the test plot as shown in Figure 8. For each test interval, the rainfall intensities, Figure 8a–c, were greatest in the middle of the test plot and lowest at the bottom of the test plot. The average uniformity of rainfall distribution for all tests performed ranged between 87.0 to 87.7%.
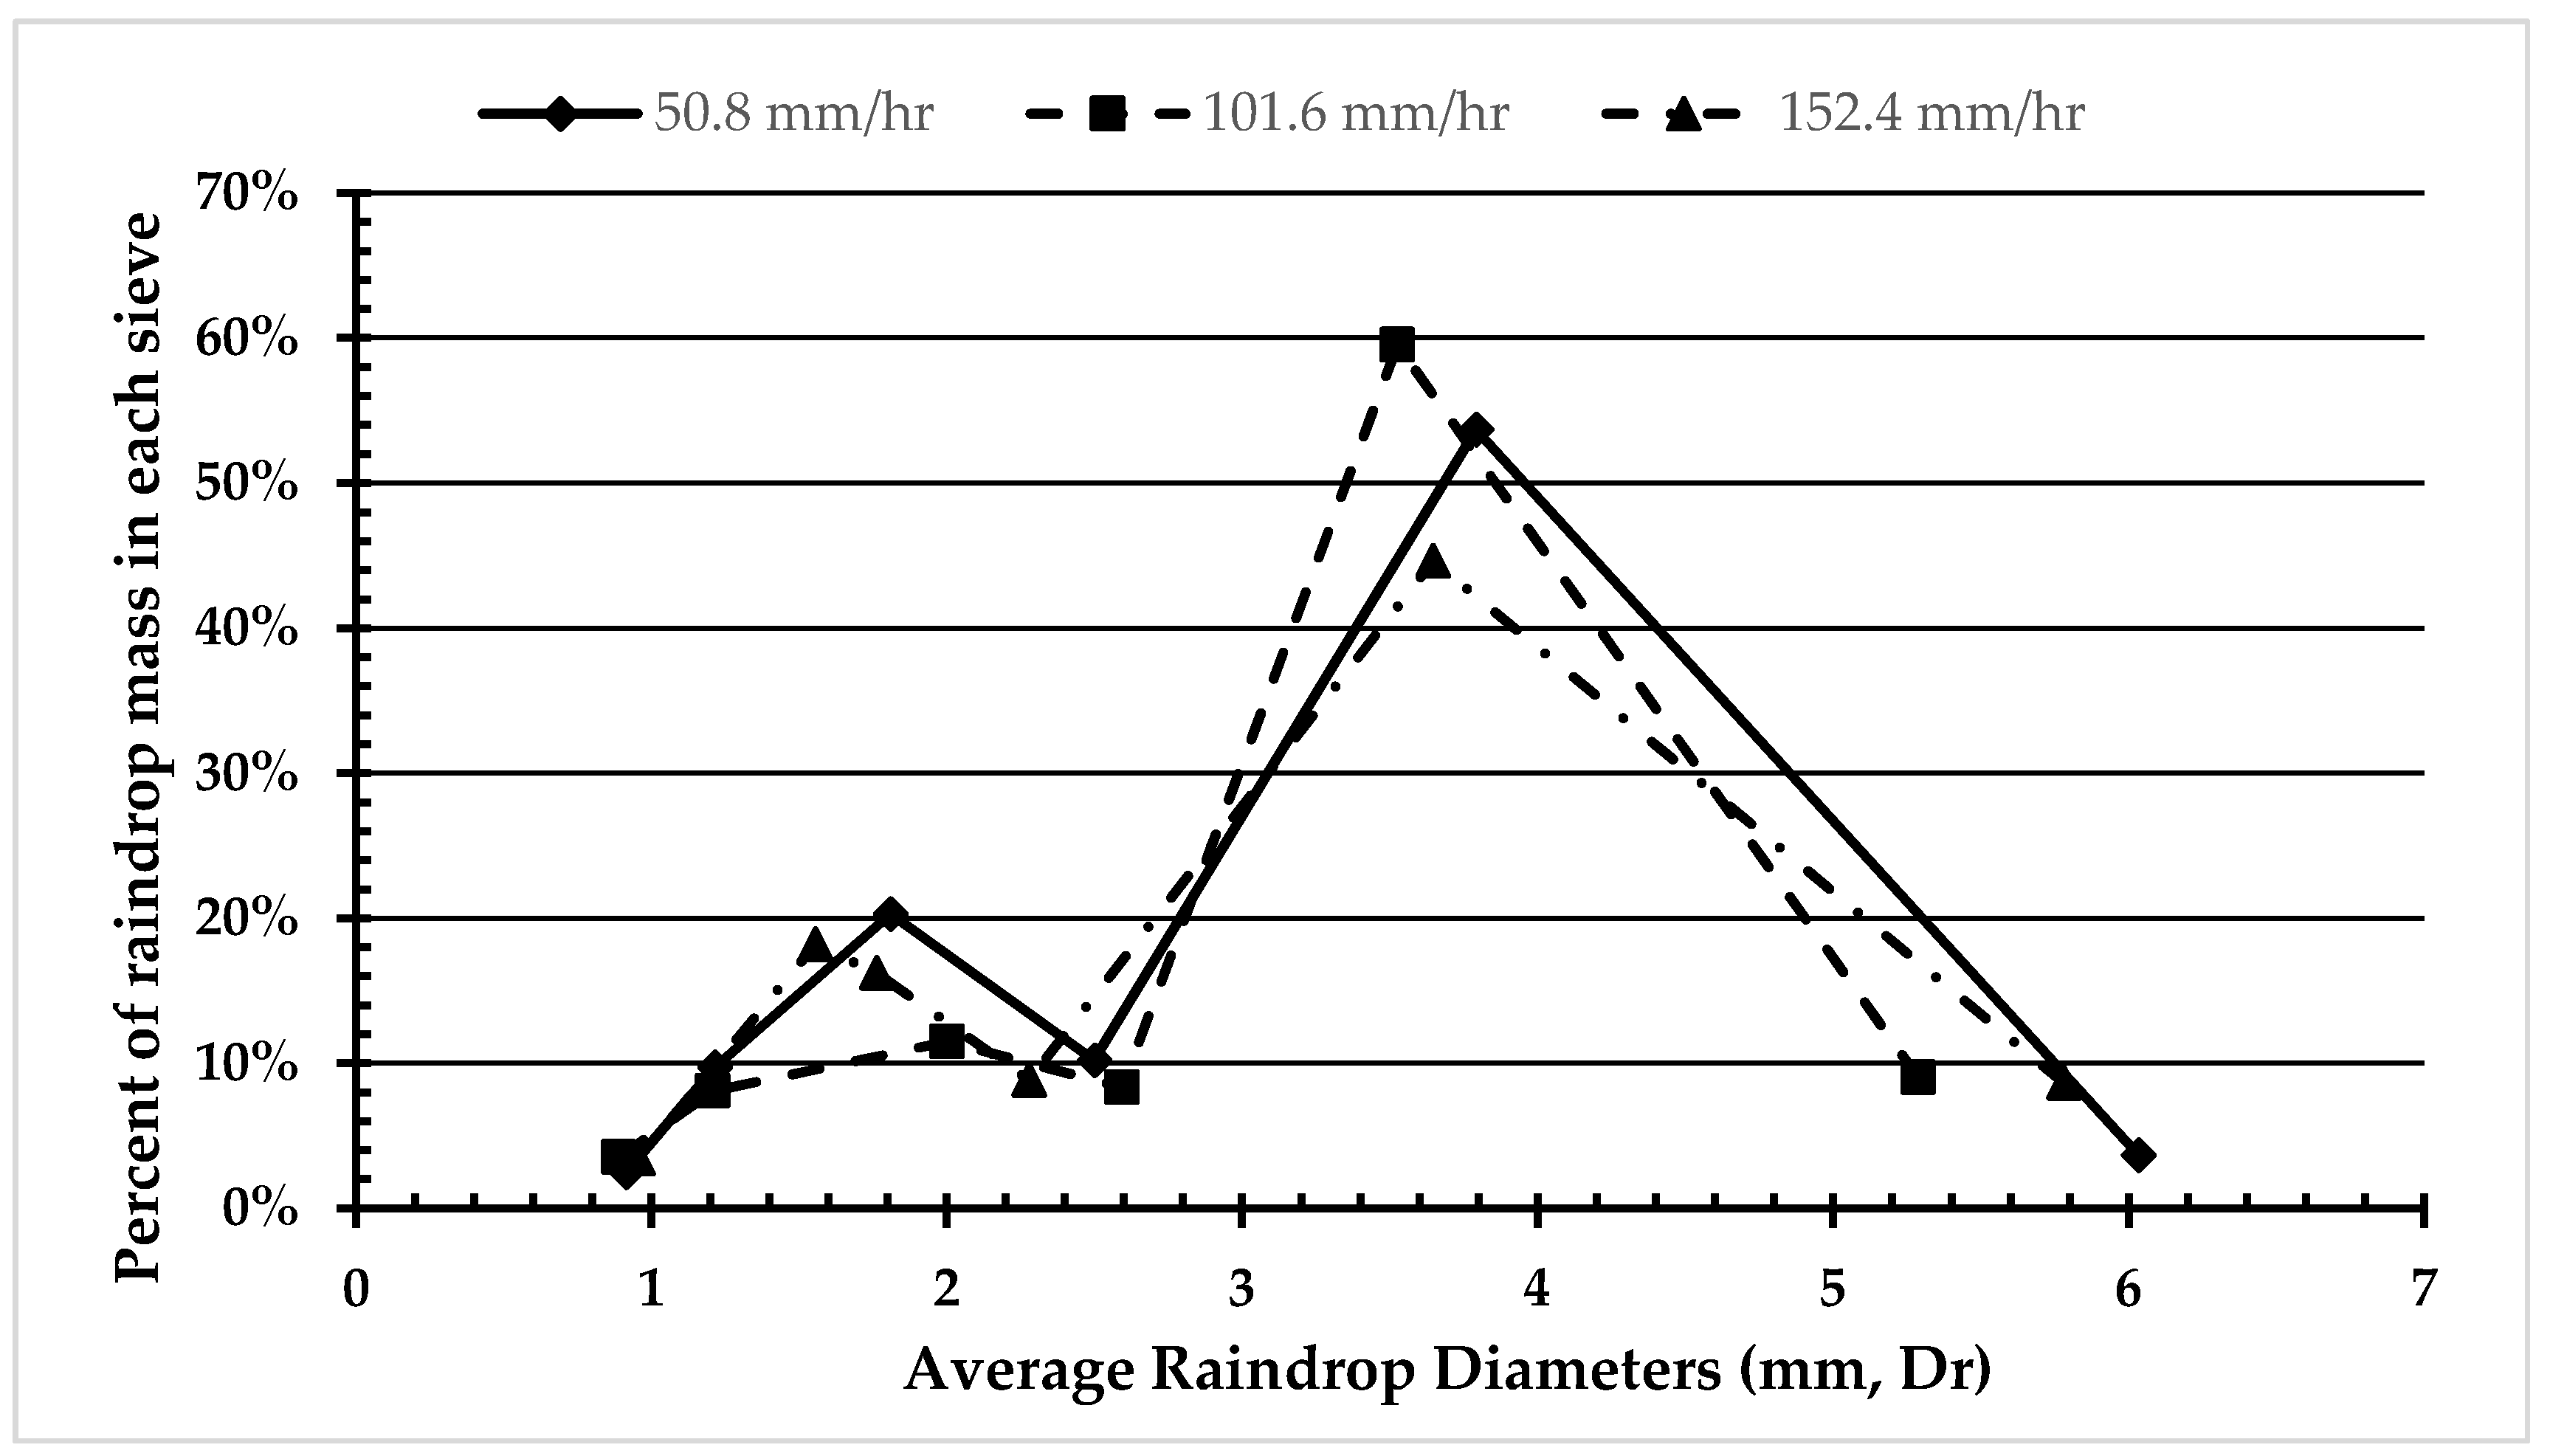
The rain drop diameters produced by the simulator were calculated using the flour pan method. The average drop diameter was then used to calculate the average mass of the rain drops (Table 5). At each intensity, the calculated drop diameter was smaller than the theoretical value. Smaller diameter raindrops are produced when pressurized flow is discharged through small nozzle openings.
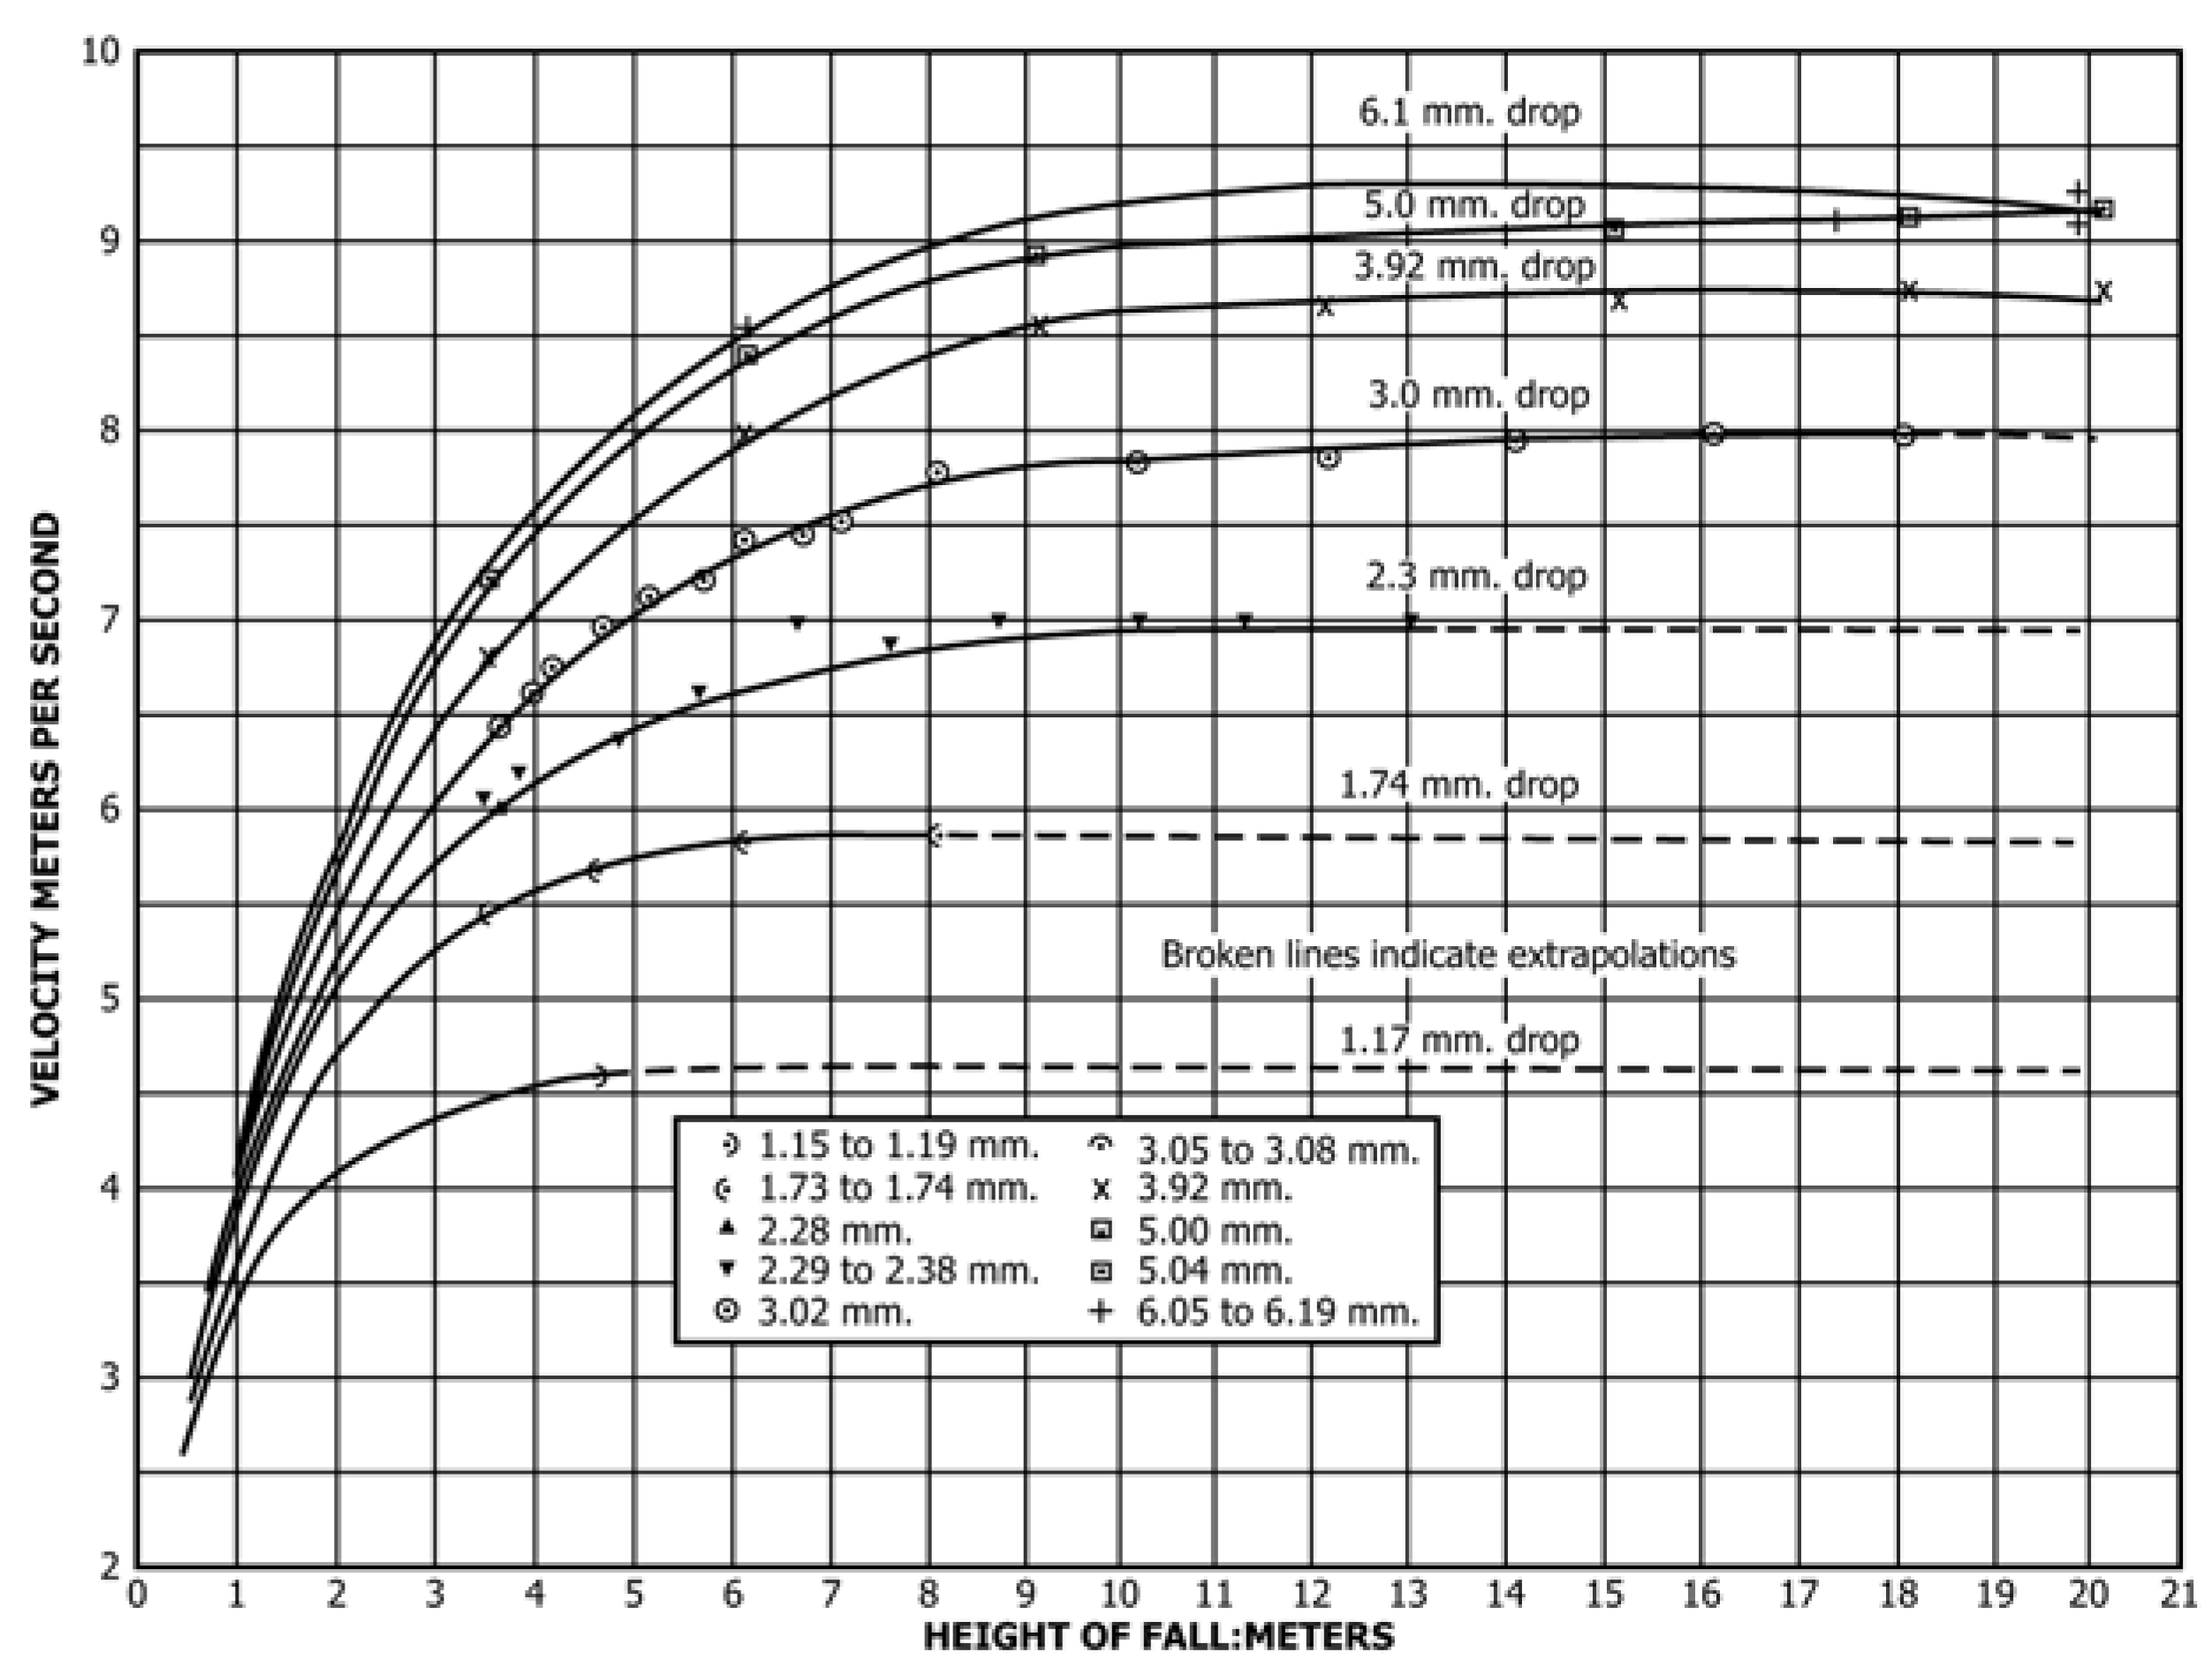
The values for average drop mass calculated previously were used to determine the experimental kinetic energy generated by the rainfall simulator (Table 5). Values for rain drop velocity were estimated based on the diameter of the drop and the height from which the drops fell. In reality, the velocity of the drops is greater than estimated since the drops are projected from the sprinkler head with an initial outward and downward vector velocity. However, the actual velocities of raindrops were not quantified in this study.
As shown in Table 5 above, the measured average drop diameter (D50, in mm) for each interval was less than the theoretical drop diameters. However, the experimental drop diameters are consistent with other pressurized rainfall simulators as detailed in Bubenzer [28]. As shown in Bubenzer [28], the median drop diameter for pressured simulators ranged from 0.6 to 2.6 mm (0.02 to 0.10 in.), with the majority of the simulators producing a median drop diameter of 2.1 mm (0.08 in.).
For each rainfall intensity, the kinetic energy of a single raindrop is negligible. However, when combined with the energy of the thousands of other raindrops impacting the slope each second, the summation of this energy would be much more considerable.

4.1. Bare Soil Control Testing

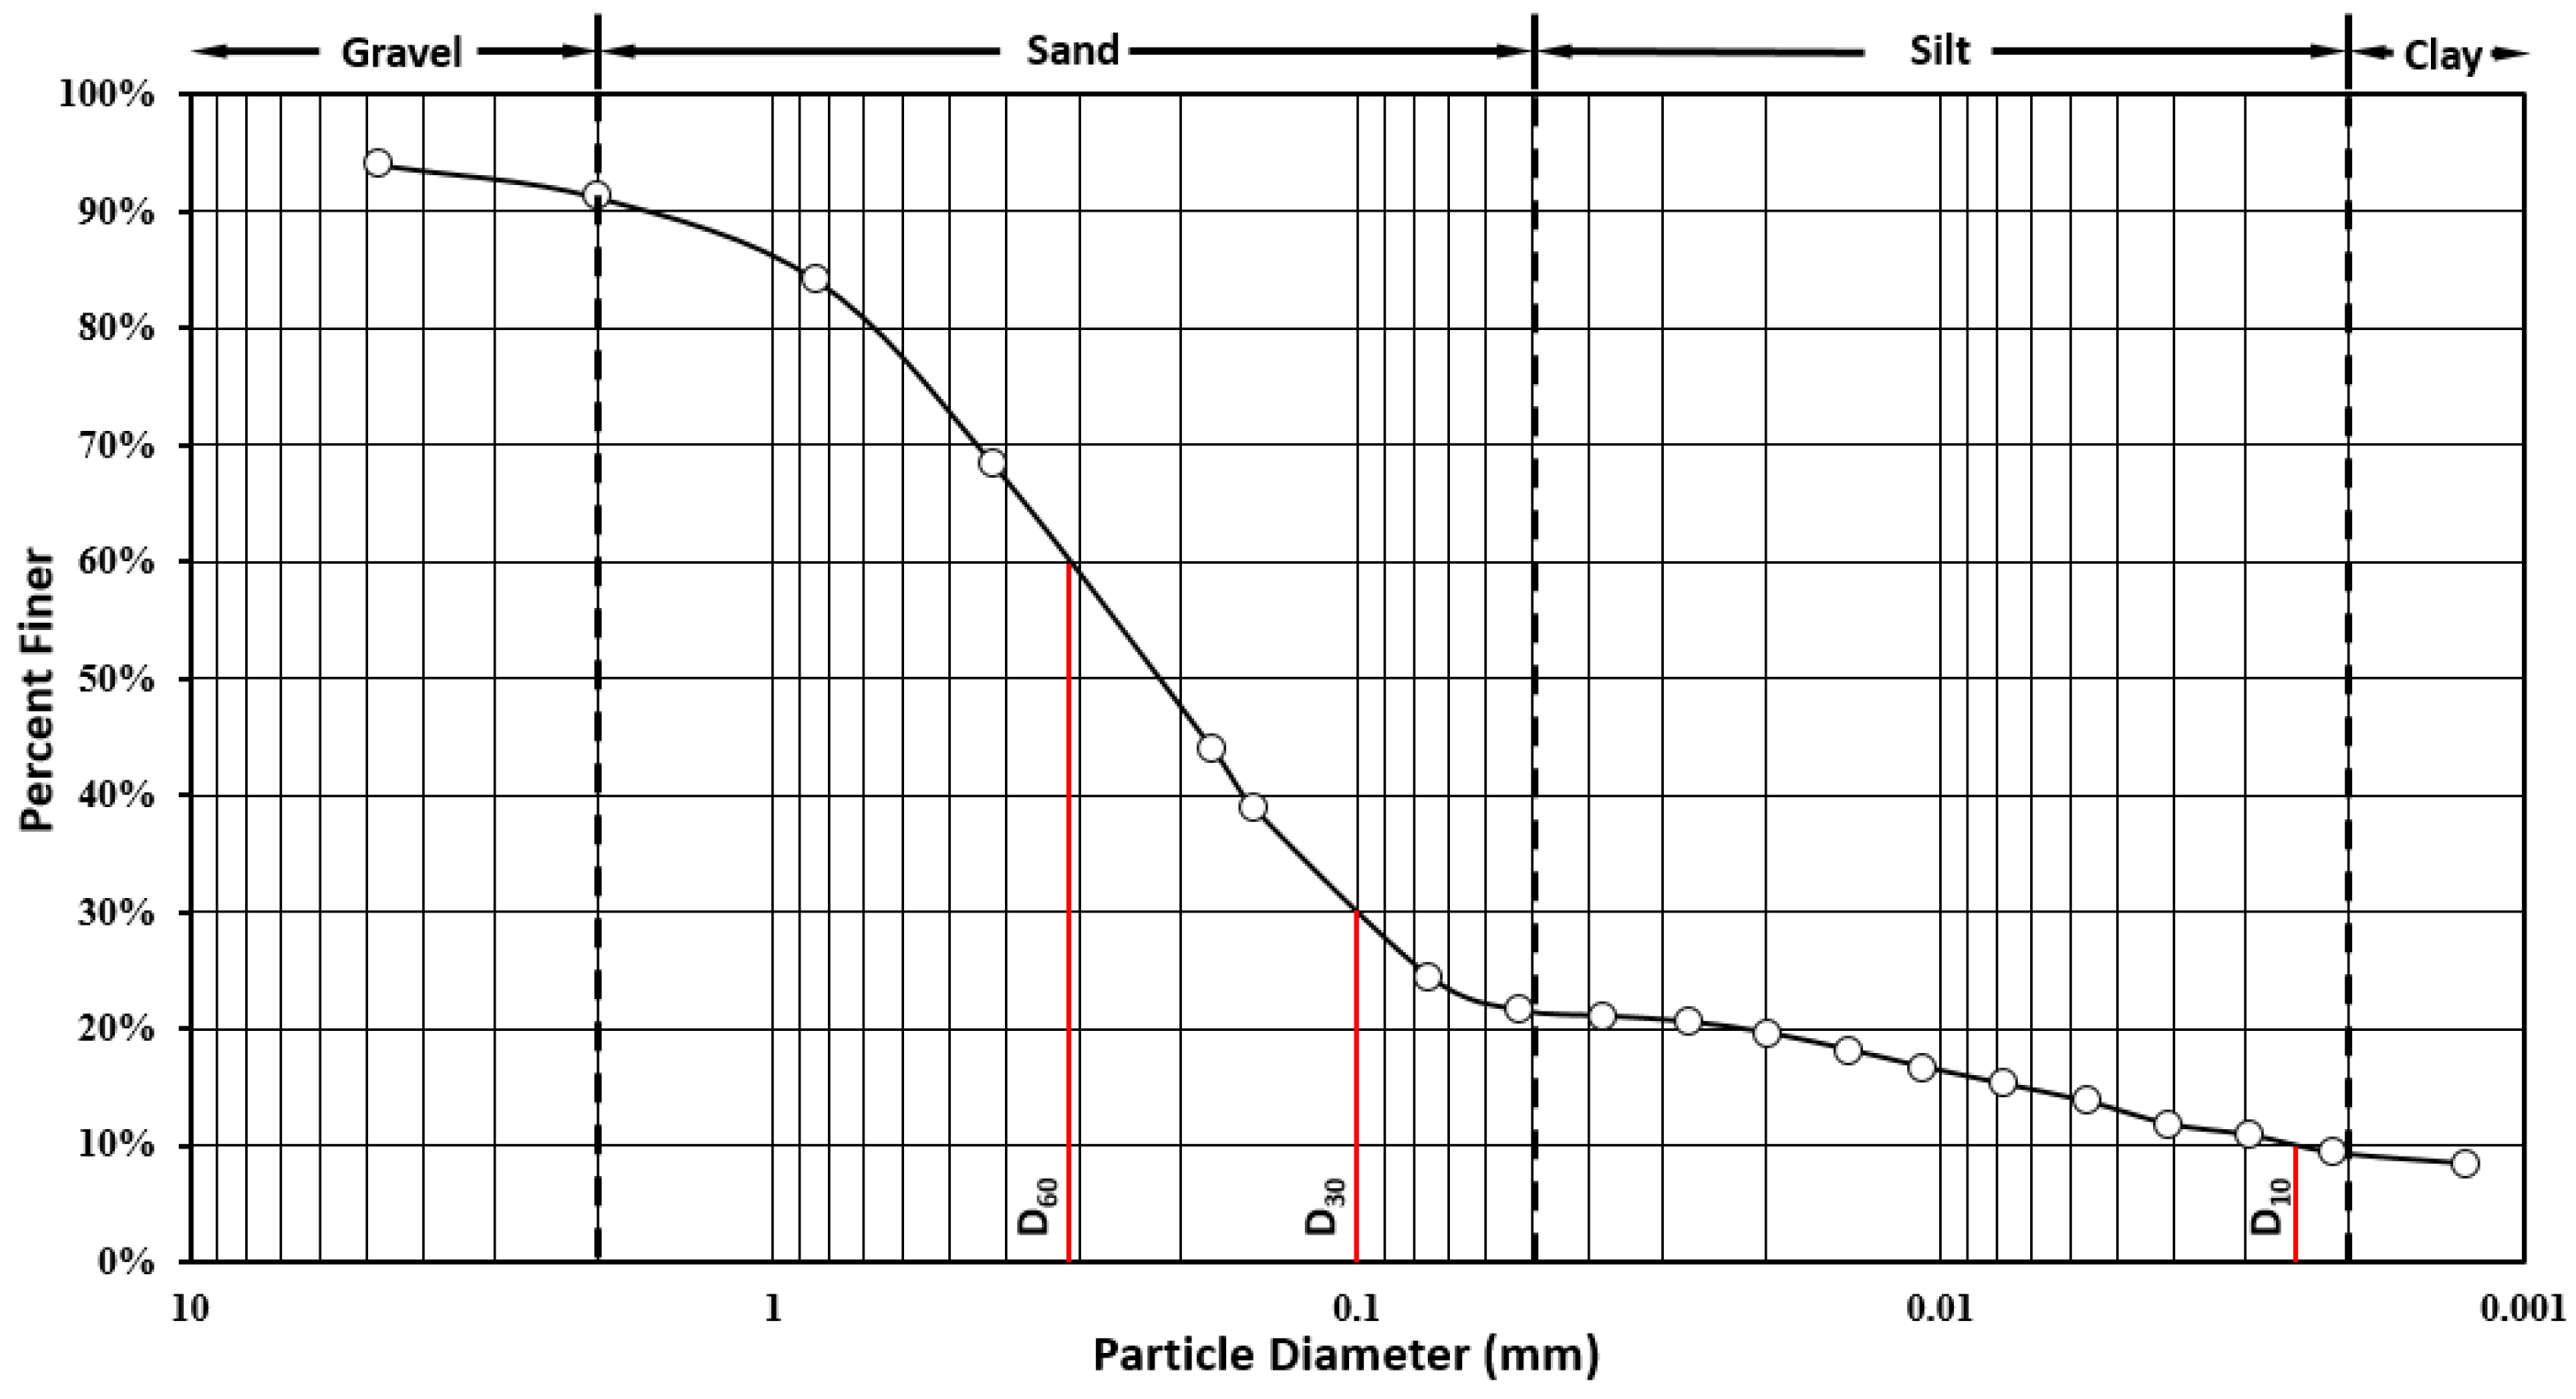
Once the rainfall simulator was calibrated, the next phase of the study involved performing a series of bare soil control tests for the design storm as specified in ASTM D6459-15. The tests consisted of a 60-min rainfall simulation with three separate intensities of 50.8, 101.6, and 152.4 mm/hr (2.0, 4.0, and 6.0 in/hr) for 20 min each. For these control tests, the soil tested was classified as a sandy loam as per the USDA soil texture triangle. The particle size distribution is shown below in Figure 9.
Prior to performing each simulation, the test slope was prepared by tilling to a minimum depth of 10.2 cm (4.0 in.) and then compacting through the use of a lawn roller apparatus. The moisture content and compaction of the soil is then determined using the procedures outlined in ASTM D2937-10. During the simulation, grab samples of the runoff generated from the plot were captured at a maximum of every three minutes beginning once runoff began exiting the plot and continuing until the runoff ceased.
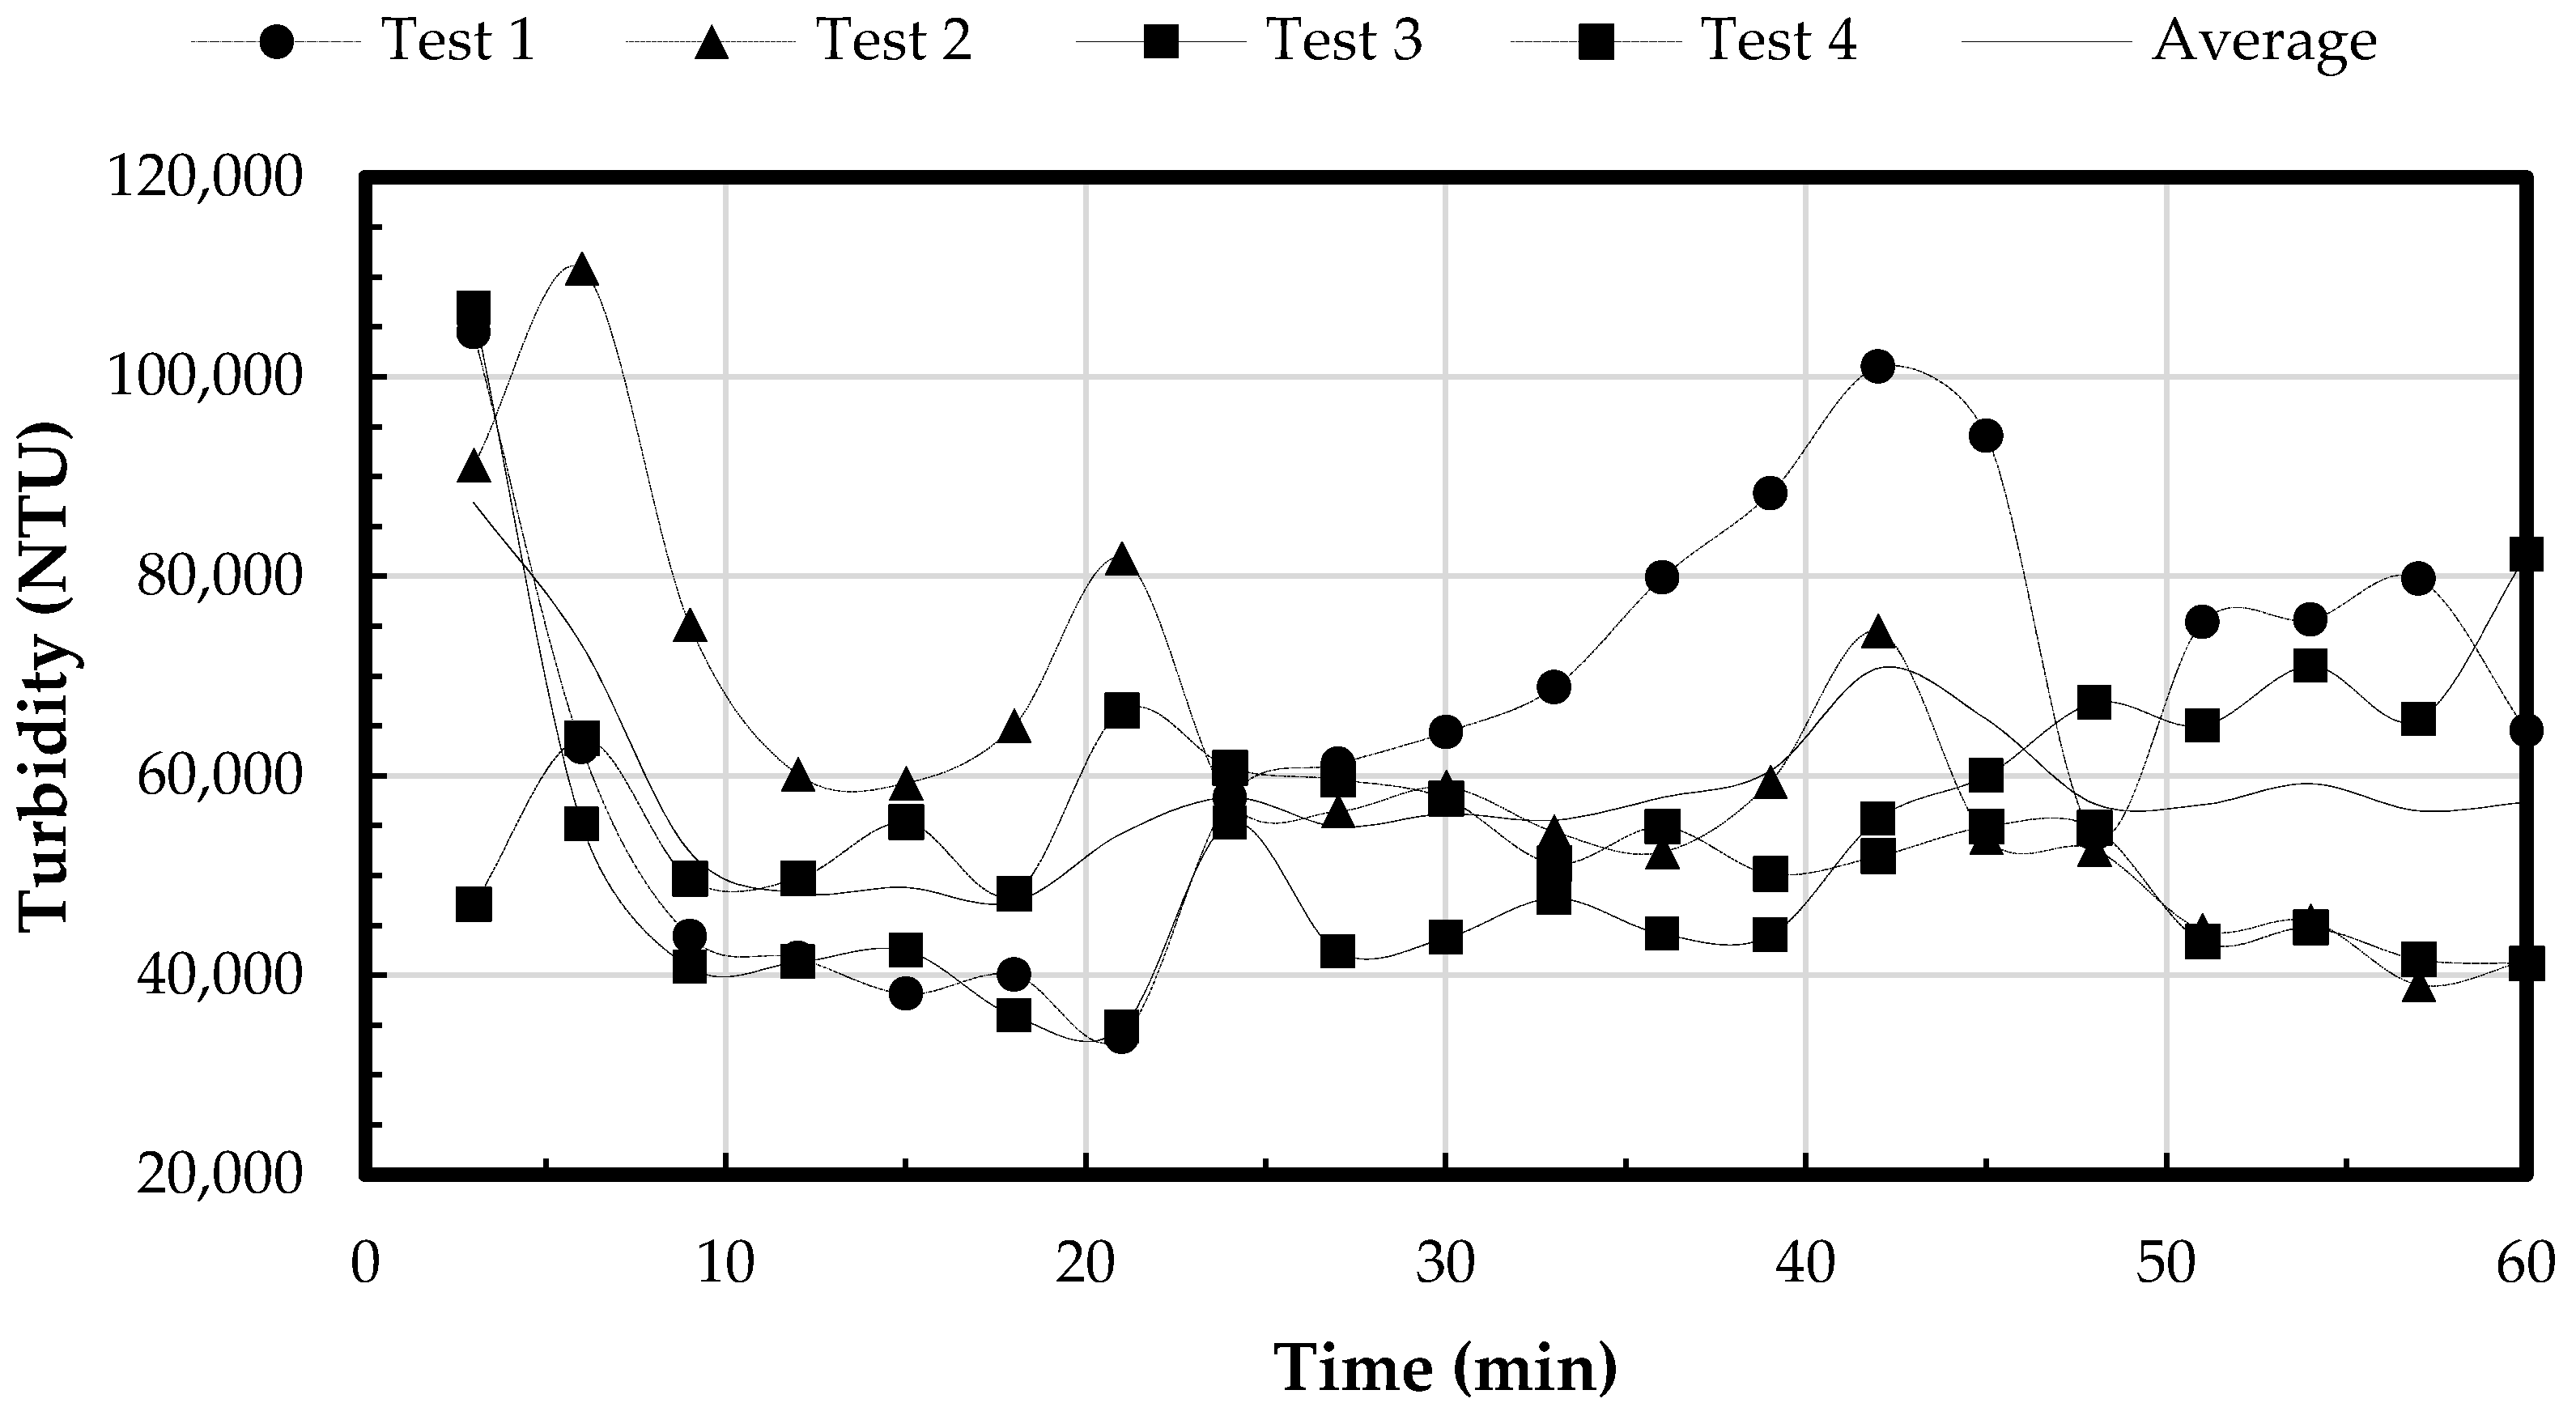
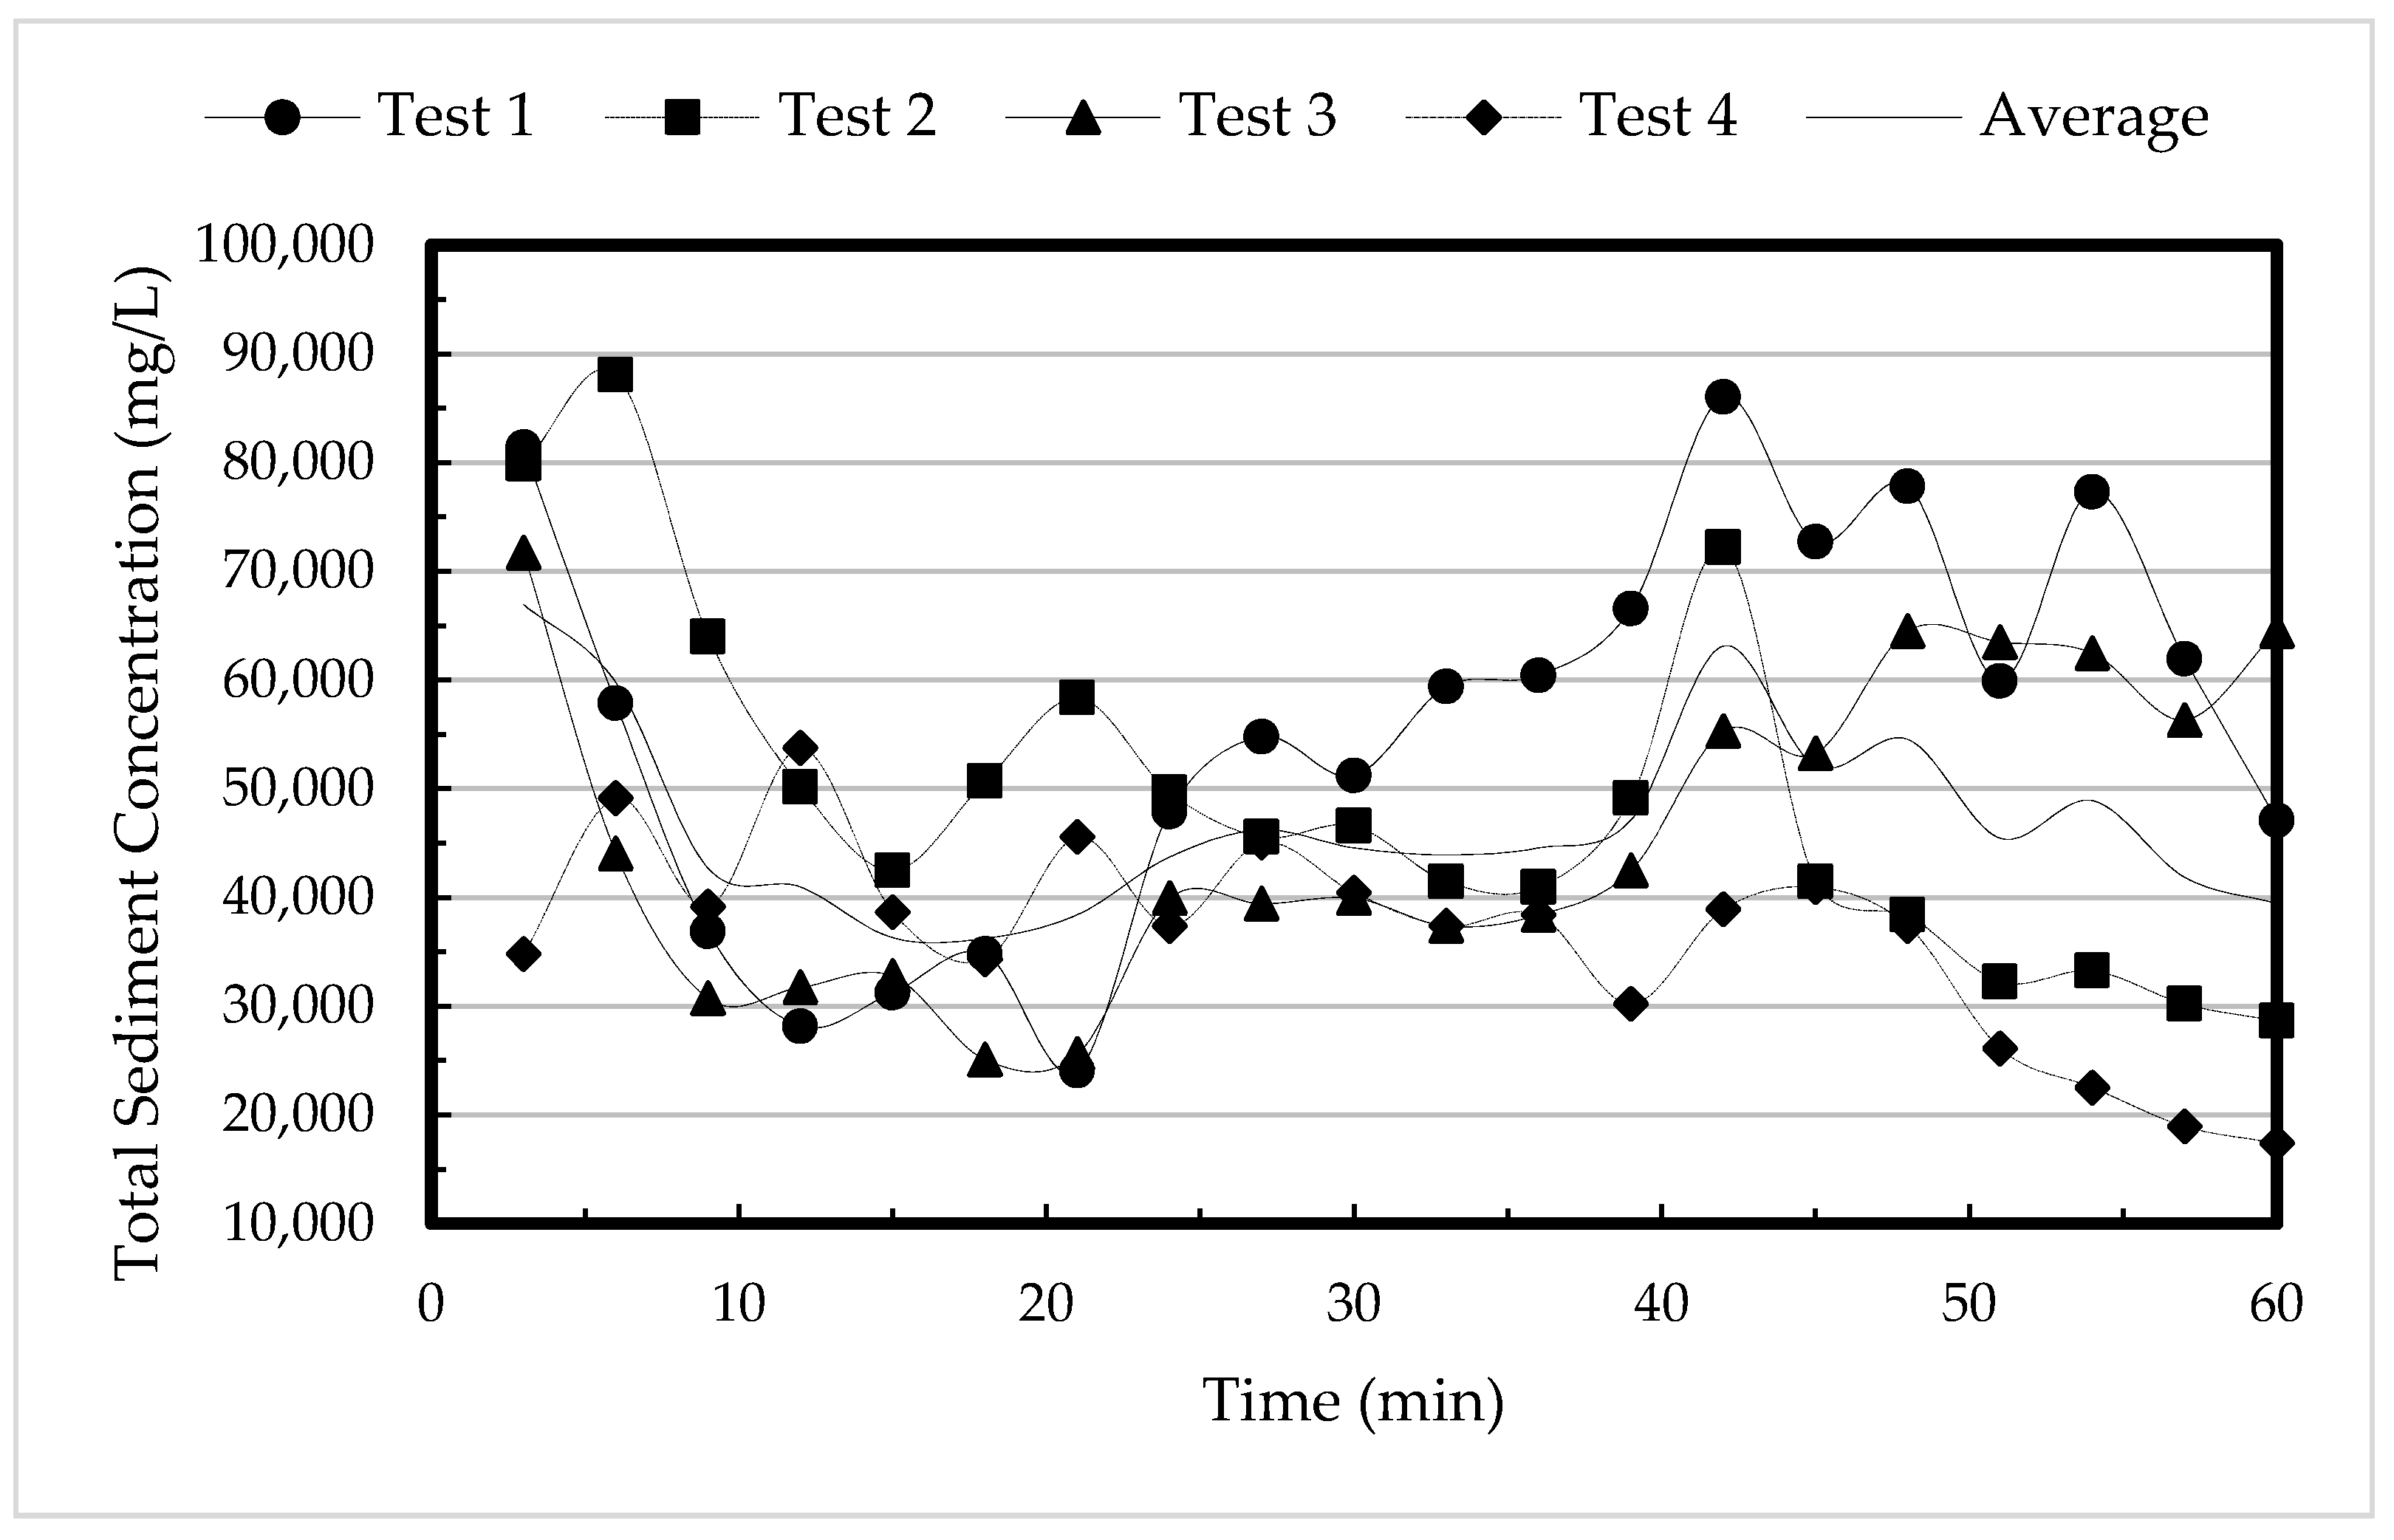
Summary plots are provided below in Figure 10 and Figure 11 for both turbidity and total sediment concentration, respectively, for the four bare soil control tests conducted. A summary of the results is shown below in Table 6.

4.2. Use of the Erosion Index Equation for Simulated Rainfall

It should be considered that the erosion index described in Equation (4) was developed from analyzing soil erosion resulting from years of naturally occurring rainfall events. This results in an assumption of naturally occurring drop size distribution and the raindrops falling at terminal velocity. For predicting naturally occurring erosion rates based upon this Equation, these assumptions are relatively valid for in-field conditions. However, for synthetic rainfall produced by rainfall simulators, these conditions are difficult to create. For instance, based upon Figure 6, a 3.0 mm (0.12 in.) raindrop has to fall approximately 16.0 m (52.5 ft) in a wind-free environment before reaching terminal velocity. ASTM D6459-15 only requires a minimum fall height of 4.26 m (14.0 ft). The nearest drop size plotted for this height in Figure 6 is 1.17 mm (0.05 in.) drop diameter, which is smaller than the average drop size produced by most rainfall simulators used for erosion testing. This issue is addressed in ASTM D 6459-15, but only minimally. After calculating the erosion index using Equation (4), the standard specifies that the results of this calculation must then be corrected for the kinetic energy of the drops that are falling at less than terminal velocity. Since no further guidance in the standard is provided for correcting the results of Equation (4), it is left to the user to determine how to adjust.
However, adjusting the output of Equation (4) as the ASTM standard stipulates may not be necessary and potentially improper. It can be seen from this previous discussion that intensity is the correlative variable that helps define the energy of a naturally occurring storm event using Equations (3), (4), and (9). However, should “correcting Equation (4) for kinetic energy” be performed since the simulators are not producing naturally occurring rainfall energy? The point of using Equations (3), (4), and (9) is to bypass determining the kinetic energy of each storm directly by using intensity as a means of estimating energy. To be able to adjust EI from Equation (4), the kinetic energy from the simulated storm must be known. Therefore, since the storm is not naturally occurring and may not be adequately represented by Equation (4), it may be more prudent to simply use the kinetic energy calculations from Equation (9) and directly calculate EI30 using the simulator’s actual measured kinetic energy, instead of correcting Equation (4) that represents naturally occurring kinetic energy. These concepts require further evaluation and research, which is beyond the scope of this paper.

5. Summary and Conclusions

The purpose of this research study was to design and construct a large-scale rainfall simulator capable of repeatedly simulating rainfall with characteristics similar to natural rainfall. The design for the rainfall simulator was largely based on existing designs in ASTM D6459-15. However, changes were made due to the lack of specified products available for purchase and a desire to improve upon the existing ASTM standard testing method. Changes included: (1) using Nelson Irrigation PC-S3000 sprinkler heads in lieu of nozzles, no longer commercially available, stated in ASTM D6459-15) and (2) substituting solenoid valves in lieu of manual ball values. Discussion into the proper use of ASTM specified equations and their appropriateness were also introduced.
In accordance with ASTM D6459-15, rainfall intensities of 50.8, 101.6, 152.4 mm/hr (2.0, 4.0, and 6.0 in./hr) were simulated. Thirty, 15-min calibration experiments were conducted to determine the average experimental rainfall intensities and uniformities, drop size distribution, and erosive energy produced by the rainfall simulator. The experimental values were then compared with their corresponding theoretical targets to determine if the apparatus was adequately simulating natural rainfall. The theoretical target rainfall intensities for this study were 50.8, 101.6, and 152.4 mm/hr (2.0, 4.0, and 6.0 in./hr). The average experimental rainfall intensities produced by the rainfall simulator were found to be 53.8, 105.9, and 154.2 mm/hr (2.12, 4.17, and 6.07 in./hr), respectively. The uniformity of the rainfall distribution, quantified using CUC, was calculated to range between 87.0 to 87.7%. The corresponding average drop size were calculated to be 2.39, 2.58, and 2.35 mm (0.094, 0.101, and 0.093 in.), respectively. These results indicate that the rainfall simulator provides repeatable rainfall intensities, achieves uniformity, and produces consistent drop sizes.
As shown in Figure 9 and Figure 10 above, the simulator was also used to perform a series of bare soil control tests to establish a baseline for future evaluation of hillslope erosion control products. The results summarized in Table 6 as well as the visual inspection of the test plot after each control test provide evidence that the rainfall simulator produced erosion results consistent within expected ranges. Visual inspections provided evidence of the occurrence of consistent splash erosion, sheet erosion, and rill erosion patterns; as well as consistent sediment yield, turbidity, and sediment concentrations measurements. Future research is also planned to test and evaluate various erosion control measures (i.e., rolled erosion control products, hydromulch, conventional mulching practices, etc.) on the test slope and to compare the performance and effectiveness of each respective practice in reducing erosion.

Author Contributions

M.D.R. conducted the simulations and analysis of the results, prepared the manuscript draft. M.A.H. designed the rainfall simulator and prepared the manuscript draft, B.F. conducted the simulations and analysis of the results, W.C.Z. supervised the design and simulations and revised the manuscript, X.F., W.N.D., and M.A.P. provided inputs on the writing, data analysis, and revised the manuscript. All authors made contributions to the study and writing the manuscript.

Funding

This research was funded by the Alabama Department of Transportation, Research Project 930-962.

Acknowledgments

The authors would like to thank the Alabama Department of Transportation for its sponsorship of this research. The authors gratefully acknowledge this financial support. The findings, opinions, and conclusions presented are those of the authors and do not necessarily reflect the view of the sponsors.

Conflicts of Interest

The authors declare no conflict of interest.

References

  1. Novotny, V. Water Quality: Diffuse Pollution and Watershed Management; John Wiley & Sons, Inc.: New York, NY, USA, 2003. [Google Scholar]
  2. United States Environmental Protection Agency (US EPA). Stormwater Phase II Final Rule: An Overview; US EPA: Washington, DC, USA, 2005.
  3. Meyer, L.D. Rainfall Simulators for Soil Conservation Research. In Soil Erosion Research Methods; Lal, R., Ed.; Soil and Water Conservation Society: Ankeny, IA, USA, 1988; pp. 75–95. [Google Scholar]
  4. Cullum, R.F. Electronic Controls for Rainfall Simulators. Trans. ASAE 1997, 40, 643–648. [Google Scholar] [CrossRef]
  5. Hirschi, M.C.; Mitchell, J.K.; Feezor, D.R.; Lesikar, B.J. Microcomputer-Controlled Laboratory Rainfall Simulator. Trans. ASAE 1990, 33, 1950–1953. [Google Scholar] [CrossRef]
  6. Mutchler, C.K.; Hermsmeier, L.F. A Review of Rainfall Simulators. Trans. ASABE 1965, 8, 67–68. [Google Scholar]
  7. Paige, G.B.; Stone, J.J.; Smith, J.R.; Kennedy, J.R. The Walnut Gulch Rainfall Simulator: A Computer-Controlled Variable Intensity Rainfall Simulator. Trans. ASAE 2003, 20, 25–31. [Google Scholar]
  8. Foltz, R.B.; Dooley, J.H. Comparison of Erosion Reduction Between Wood Strands and Agricultural Straw. Trans. ASABE 2003, 46, 1389–1396. [Google Scholar]
  9. McLauglin, R.A.; Brown, T.T. Evaluation of erosion control products with and without added polyacrylamide. J. Am. Water Resour. Assoc. 2006, 42, 675–684. [Google Scholar] [CrossRef]
  10. Ming-Han, L.; Harlow, C.L.; Jett, M. Comparison of Field and Laboratory Experiment Test Results for Erosion Control Products. In Proceedings of the ASAE Annual International Meeting, Las Vegas, NV, USA, 27–30 July 2003. [Google Scholar]
  11. Shoemaker, A.L. Evaluation of Anionic Polyacrylamide as an Erosion Control Measure Using Intermediate-Scale Experimental Procedures; Auburn University: Auburn, AL, USA, 2009. [Google Scholar]
  12. Xiao, M.; Reddi, L.N.; Howard, J. Erosion Control on Roadside Embankment Using Compost. Appl. Eng. Agric. 2010, 26, 97–106. [Google Scholar] [CrossRef]
  13. McLauglin, R.A.; Rajbhandari, N.; Hunt, W.F.; Line, D.E.; Sheffield, R.E.; White, N.M. The Sediment and Erosion Control Research and Education Facility at North Carolina State University. In Proceedings of the Soil Erosion Research for the 21st Century, Proceedings of the International Symposium, Honolulu, HI, USA, 3–5 January 2001. [Google Scholar]
  14. Moore, I.D.; Hirschi, M.C.; Barfield, B.J. Kentucky Rainfall Simulator. Trans. ASABE 1983, 26, 1085–1089. [Google Scholar] [CrossRef]
  15. Thomas, N.P.; El Swaify, S.A. Construction and Calibration of a Rainfall Simulator. J. Agric. Eng. Res. 1989, 43, 1–9. [Google Scholar] [CrossRef]
  16. Sharpley, A.N.; Kleinman, P. Effect of Rainfall Simulator and Plot Scale on Overland Flow and Phosphorus Transport. J. Environ. Qual. 2003, 32, 2172–2179. [Google Scholar] [CrossRef] [PubMed]
  17. Swanson, N.P. Rotating-Boom Rainfall Simulator. Trans. ASABE 1965, 8, 71–72. [Google Scholar] [CrossRef]
  18. Meyer, L.D. Simulation of Rainfall for Soil Erosion Research. Trans. ASABE 1965, 8, 63–65. [Google Scholar] [CrossRef]
  19. Shoemaker, A.L.; Zech, W.C.; Clement, T.P. Laboratory-Scale Evaluation of Anionic Polyacrylamide as an Erosion and Sediment Control Measure on Steep-Sloped Construction Sites. Trans. ASABE 2012, 55, 809–820. [Google Scholar] [CrossRef]
  20. Kim, K.S.; Choi, J.D.; Kweon, K.S. Effect of PAM Application on Soil Erosion of a Sloping Field with a Chinese Cabbage Crop. In Proceedings of the ASAE Annual International Meeting, Sacramento, CA, USA, 29 July–1 August 2001. [Google Scholar]
  21. Miller, W.P. A Solenoid-Operated, Variable Intensity Rainfall Simulator. Soil Sci. Soc. Am. J. 1987, 51, 832–834. [Google Scholar] [CrossRef]
  22. ASTM. Standard Test Method for Determination of Rolled Erosion Control Product Performance in Protecting Hillslopes from Rainfall-Induced Erosion; ASTM: West Conshohocken, PA, USA, 2015. [Google Scholar]
  23. USDA. Predicting Soil Erosion by Water: A Guide to Conservation Planning With the Revised Universal Soil Loss Equation (RUSLE); USDA: Washington, DC, USA, 1997.
  24. Bentley, W.A. Studies of Raindrops and Raindrop Phenomena. Mon. Weather Rev. 1904, 32, 450–456. [Google Scholar]
  25. Laws, J.O.; Parsons, D.A. The Relation of Raindrop Size to Intensity. Trans. Am. Geophys. Union 1943, 24, 452–460. [Google Scholar] [CrossRef]
  26. Nelson Irrigation. Available online: http://www.nelsonirrigation.com (accessed on 7 August 2019).
  27. Sprague, C.J.; Sprague, J.E. Large-scale Performance Testing of Erosion Control Products. In Proceedings of the GeoAmericas 2012, Lima, Peru, 1–4 May 2012. [Google Scholar]
  28. Bubenzer, G.D. Rainfall Characteristics Important for Simulation. In Proceedings of the Rainfall Simulator Workshop, Tuscon, AZ, USA, 7–9 March 1979; pp. 22–34. [Google Scholar]
Figure 1. Pressurized rainfall simulator layout and components [26]. (a): canopy, riser, and anchor detail; (b): rain gauge layout constructed.
Water 11 02386 g001
Figure 2. Rainfall depth relative to distance from Nelson PC-S3000 sprinkler head with #21 nozzle at 41.4 kPa (6 psi) for 15-min duration tests.
Water 11 02386 g002
Figure 3. Detailed plan view of riser and rainfall gauge locations.
Water 11 02386 g003
Figure 4. Drop size distribution testing procedures. (a): sifted flour in 9 in. (23 cm) pan; (b): collection of flour pellets; (c): separating pellets in a sieve stack; (d): weighing flour pellets.
Water 11 02386 g004
Figure 5. Percent of raindrop mass versus average raindrop diameter, Dr, in each sieve for three rainfall intensities.
Water 11 02386 g005
Figure 6. Fall velocity of raindrops as function of raindrop size and fall height [22]. Note: 1.0 ft = 0.305 m.
Water 11 02386 g006
Figure 7. Experimental vs. theoretical rainfall intensities at different flow rates.
Water 11 02386 g007
Figure 8. Rainfall intensity raster surfaces from calibration testing. (a) intensity–test interval 1; (b) intensity–test interval 2; (c) intensity–test interval 3; (d) legend.
Water 11 02386 g008
Figure 9. Particle size distribution for control soil.
Water 11 02386 g009
Figure 10. Turbidity versus time for control tests.
Water 11 02386 g010
Figure 11. Total sediment concentration versus time for control tests.
Water 11 02386 g011
Table 1. Summary of rainfall simulators and testing.
StudyDrop Size Distribution, mm (in.)UniformitySimulator Height, m (ft)Rainfall Intensity, mm/hr (in./hr)Plot Sizes, m2 (ft2)Slopes, %
ASTM [a] D6459-15 [22]Less than 10% > 6 (0.24)
Less than 10% < 1 (0.04)
>80%4.27 (14)50.8, 101.6, 152.4
(2, 4, 6)
29.7 (320)33
Moore et al. [14]D50 = 2.25 (0.089)80.2 to 83.73 (9.84)3.5 to 185
(0.138 to 7.28)
4.5 (48.4) or
99 (1065)
Shoemaker et al. [19] 83 to 873.05 (10)111.8 (4.4)0.74 (8)33
Kim et al. [20] 2.44 (8)71.12 to 83.82
(2.8 to 3.3)
8 (86)29 to 30
McLauglin and Brown [9], Miller [21]2.25 to 2.5 (0.089 to 0.098)85.7 to 93.23.96 (13)33 and 66
(1.3 and 2.6)
2 (21.8)10 and 20
Note: [a] ASTM International.
Table 2. Nozzle combinations.
20-min Test IntervalNumber and Type of Nozzles UsedTotal Flow, L/min. (gpm)Theoretical Flow Requirement, L/min. (gpm)Theoretical vs. Total Flow (%)
110–#21 [a]18.4
(69.65)
6.65
(25.17)
36.1
215–#21
5–#18 [b]
34.4
(130.22)
13.30
(50.35)
38.7
321–#21
9–#18
50.9
(192.68)
19.95
(75.52)
39.2
Note: [a] #21–Turquoise yellow nozzle, flow rate at 41.4 kPa (6 psi) = 6.96 L/min. (1.84 gpm); [b] #18–Gray nozzle, flow rate at 41.4 kPa (6 psi) = 5.14 L/min (1.36 gpm).
Table 3. Calibration summary for all test intervals.
Test Intervals 1Average Rainfall Intensity (mm/hr)Sample SizeStandard Deviation (mm/hr)Target Intensity (mm/hr)Error (%)
152.83101.0250.84.00
2104.65101.52101.63.00
3154.18101.78152.41.17
Note: 1 test rainfall intervals are shown on Figure 6, 1.0 gal = 3.79 L, 1.0 in. = 25.4 mm.
Table 4. Experimental vs. theoretical erosion index (EI) values.
Experimental Intensity (mm/hr)Target Intensity (mm/hr)Experimental Erosion IndexTarget Erosion IndexPercent Error (%)
52.8350.8216920734.60
104.65101.6451043763.07
154.18152.4666965921.17
Table 5. Drop size distribution testing and kinetic energy of raindrops.
Rainfall Intensity, mm/hr (in./hr)50.8 (2.0)101.6 (4.0)152.4 (6.0)
Average Drop Diameter, mm (in.)2.39 (0.094)2.58 (0.102)2.35 (0.093)
Theoretical Drop Diameter, mm (in.)2.53 (0.100)2.87 (0.113)3.09 (0.122)
Percent Error (%)5.5310.1023.94
Average Drop Mass, mg (lbs)7.13
(1.57 × 10⁻⁵)
8.97
(1.98 × 10⁻⁵)
6.77
(1.49 × 10⁻⁵)
Velocity of Drop, m/s (ft/s)6.2 (20.3)6.3 (20.7)6.2 (20.3)
Kinetic Energy, J (lbs-ft2/s2)7.24 × 10−5
(1.71 × 10⁻³)
8.37 × 10⁻⁵
(1.98 × 10⁻³)
7.00 × 10⁻⁴
(1.66 × 10⁻⁴)
Note: 1.0 in. = 25.4 mm.
Table 6. Summary of bare soil control test results.
Test ParametersTest 1Test 2Test 3Test 4Average
Rainfall Depth (mm)103.63103.63104.90102.87103.76
Compaction (%)87.2587.5786.9985.6786.87
Moisture Content (%)15.0816.0818.5316.8216.63
Catch Basin Sediment (kg)329.16322.87341.34346.83335.05
Total Soil Loss per Unit Area (kg/ha)110,819108,699113,644116,770112,483
Average Sediment Concentration (mg/L)55,87249,17847,32336,32647,175
Average Turbidity (NTU)66,49361,68356,11952,37459,167

