Analysis of Wet Soil Granular Flow down Inclined Chutes Using Discrete Element Method


1
Sichuan Academy of Water Conservancy, Chengdu 610072, China
2
Department of Architectural Engineering, Tianjin University Renai College, Tianjin 301636, China
*
Author to whom correspondence should be addressed.
†
These authors contribute equally to this work.
Water 2019, 11(11), 2399; https://0-doi-org.brum.beds.ac.uk/10.3390/w11112399
Submission received: 11 October 2019
/
Revised: 6 November 2019
/
Accepted: 11 November 2019
/
Published: 15 November 2019
(This article belongs to the Section Hydraulics and Hydrodynamics)
Abstract
:This paper presents numerical simulation and analysis of two numerical experiments of wet soil granular flow down inclined chutes based on the JKR(Johnson-Kendall-Roberts)-cohesion model of the discrete element method. JKR is a cohesive contact model, which can reflect the influence of van der Waals forces in the contact range to simulate cohesive granular matter. A surface energy coefficient kw was proposed to reflect the liquid surface tension between particles, and maximum surface energy (γmax) of wet soil composed of uniform particles was obtained at 0.2 J/m2. Computational results show that surface energy (γ) and granular size play significant roles in the simulation of wet soil granular flow. The larger surface energy is, and the stronger of adhesion between soil grains. Besides, surface energy also has a great effect on the average velocity and kinetic energy of the moist soil avalanches. With baffles on both sides of the inclined chute, the dry soil granular flow has the longest runout distance on the horizontal plane; with the increase of surface energy, the runout distance decreased gradually. However, without baffles on both sides of the geometric model, the runout distance of wet soil granular flow is farther, though expansion to the sides is more obvious. Wet soil with larger grains requires larger surface energy to maintain the soil structure intact during the sliding process. Furthermore, with the increase of granular size, the soil structure is not compact enough, and the cohesion between water and soil grains is extremely poor, which lead to the impact scope expanded of wet soil landslide disasters.
1. Introduction
In recent years, a large amount of soil avalanches have occurred in wet loose deposits in southwestern China, which usually led to road collapses, vehicle damages and casualties; soil granular flows are characterized by high density, impact force and destructiveness [1], and excessive floods is the key factor to induce these geologic hazards [2,3]. Depending on the investigations of these disasters, the final deposition of landslides is mostly composed of fine soil particles [4,5]. Therefore, the essence of soil landslides is the movement of wet particulate matter. In order to further explore the nature of soil landslides [6,7], it is necessary to start with the study of wet soil granular matter.
In previous studies, the granular simulation includes laboratory test and numerical analysis mainly [8,9]. The discrete element method (DEM) is a commonly used numerical analysis method which is usually employed to simulate the motion of particles [10,11]. DEM is a meshless method initially proposed by Cundall and Strack, which models the motion of individual particles within a granular mass [12,13]. A three-dimensional dry granular flow is numerically modeled to study the contact behavior of solid particles along sloping channels, and the combination of granular temperature and the savage number is an effective way to identify the flow regimes of granular flows [14]. Chia simulated and reanalyzed the kinematic process of a landslide in Hsiaolin village by PFC 3D, which lead to destruction of Hsiaolin village and form an earth dam [15]. Moreover, DEM was also found to accurately reproduce transient and static features of the avalanche [16]. The dry granular flow regime is primarily controlled by the particle friction, viscous normal damping and particle rotation rather than the contact stiffness [17].
To sum up, the numerical simulation of fine particle flow mainly focuses on dry particles at present, few studies have been carried out on the motion of wet particles. However, real soil landslides usually involve water and rarely involve completely dry soil landslides. Therefore, based on the discrete element method, the JKR-cohesion model which considersliquid surface tension is proposed to simulate the wet soil granular flow, and the formula for calculating the surface energy parameters of the wetting degree is also derived. The purpose of this study is to analyze the kinetic characters of wet soil granular flow with a particular focus on the sliding velocity, runout distance and interactions. In addition, the effect on the wet soil granular flow process of surface energy and grain size is also considered in this study.
2. Materials and Methods
2.1. DEM Concept
The discrete element method is an effective numerical method first proposed by Cundall in the 1970s to describe the mechanical behavior of jointed rock mass and non-continuum [12,13]. In recent years, DEM has been widely developed in applications ranging from two-dimensional to three-dimensional applications and from rigid finite element to deformable finite elements. The DEM regards that jointed rock mass as composed of discrete rock blocks and joint planes between rock blocks, which considers a large displacement, rotation and sliding of internal structure and even separation of rock blocks. This could objectively reflect the characteristics of non-linear large deformation in jointed rock mass, especially suitable for stress and deformation analysis of jointed rock mass [18].
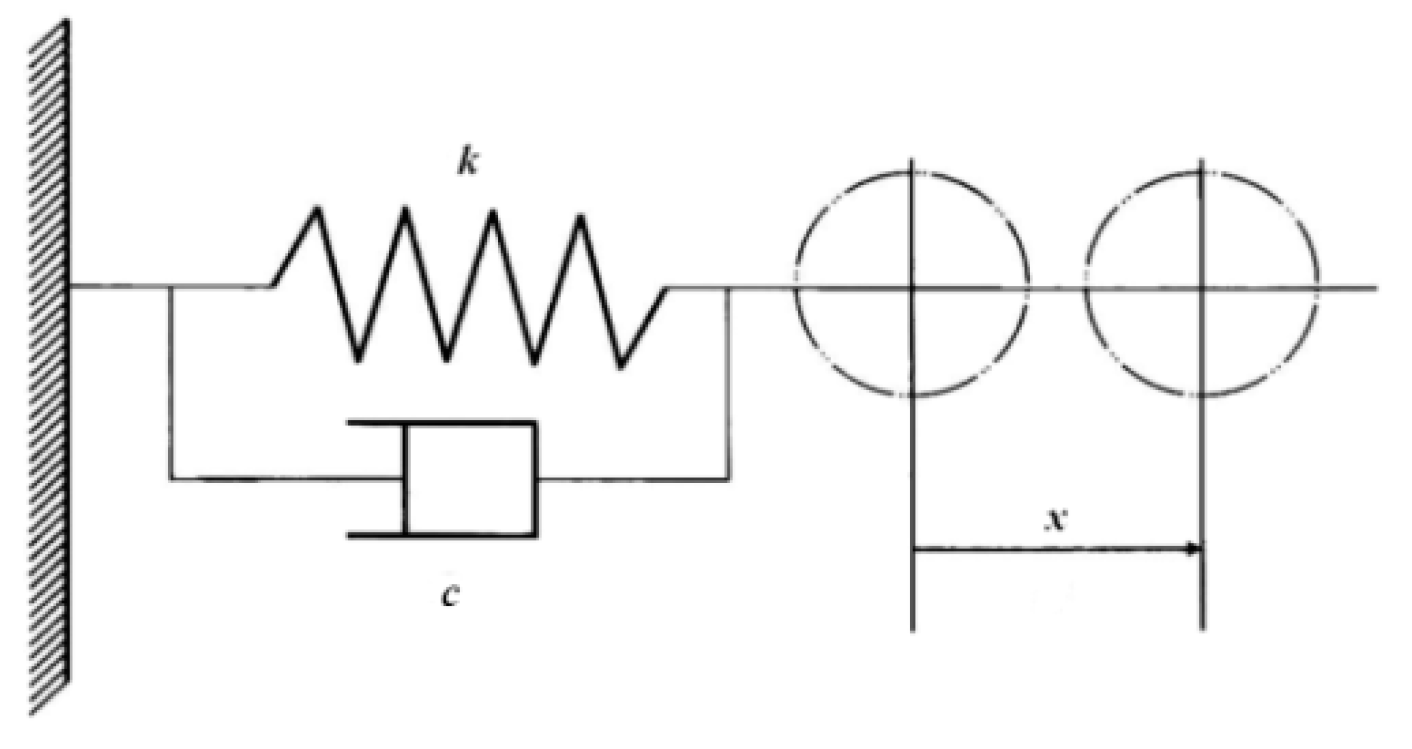
At present, there are two types of particle simplified models applied in DEM, including the soft sphere model and hard sphere model. The soft sphere model simplifies the normal force between particles into spring and damper. The tangential force is simplified to spring, but neglects the surface deformation of particles. The contact force is calculated by the normal overlap and the tangential displacement between particles, without considering the loading history of the contact force, which is suitable for numerical analysis of practical geotechnical engineering problems [19]. As shown in Figure 1, the soft sphere model simplifies the contact process between particles into the damped vibration of spring oscillator, and the motion equation can be expressed as follows:
where x represents the displacement from the equilibrium position; m is the mass of the oscillator, c and k are the spring damping coefficient and the elastic coefficient respectively.
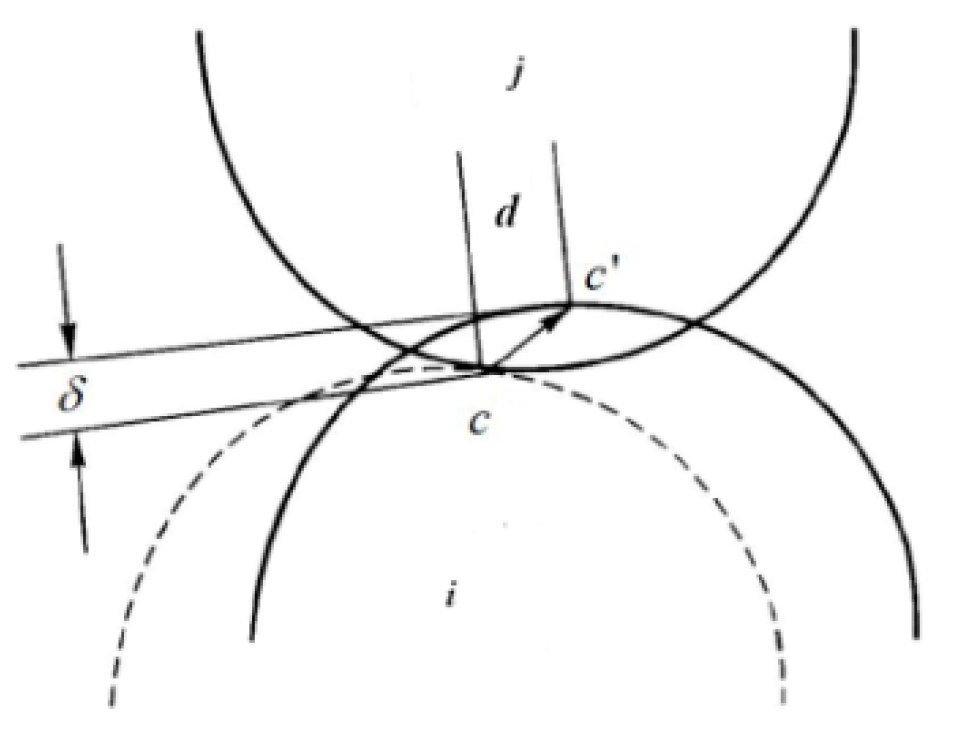
It can be seen from Equation (1) that the restoring force of particles is proportional to the displacement, the viscous force is proportional to the velocity, and the energy of spring oscillator decreases gradually. Figure 2 shows that particle i contacts particle j at point C under inertia force or external force; dotted lines indicates the position of particle i at the beginning contact. With the relative movement of the two particles, the surface of particles gradually deforms and generates a contact force. The soft sphere model without considering the deformation details, only calculates the normal overlap and the tangential displacement d.
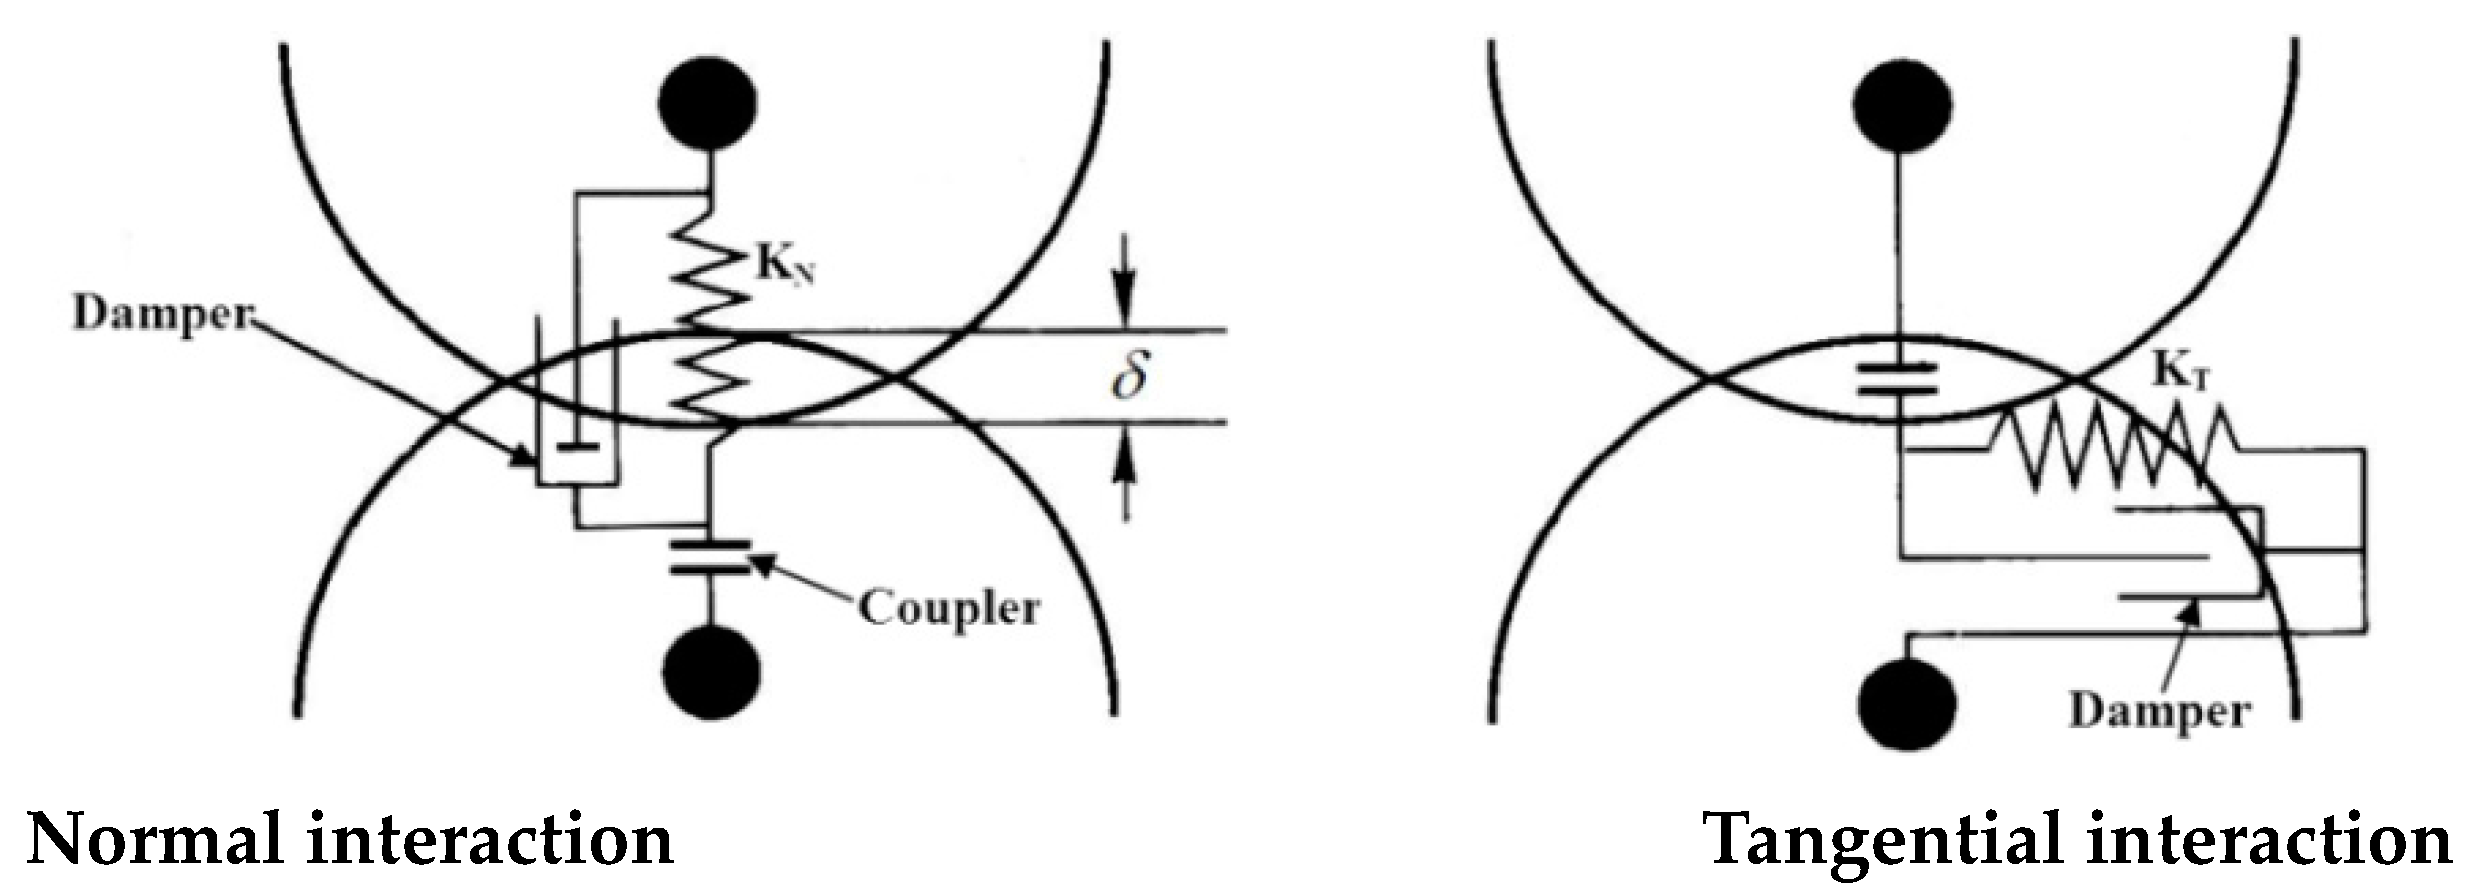
The soft sphere model installs damper, spring, slider, and coupler between the granular i and j. The coupler is applied to identify the granular pairing relationship in contact without introducing any force. In the tangential direction, when the tangential force exceeds the yield value, the sliding damper can lead the two particles to slide under the normal force and the friction force. Parameters such as elastic coefficient k and damping coefficient c are used to reflect the effects of spring, damper and coupler in the soft sphere model, as shown in Figure 3.
2.2. Comparison of Numerical and Laboratory Experiments
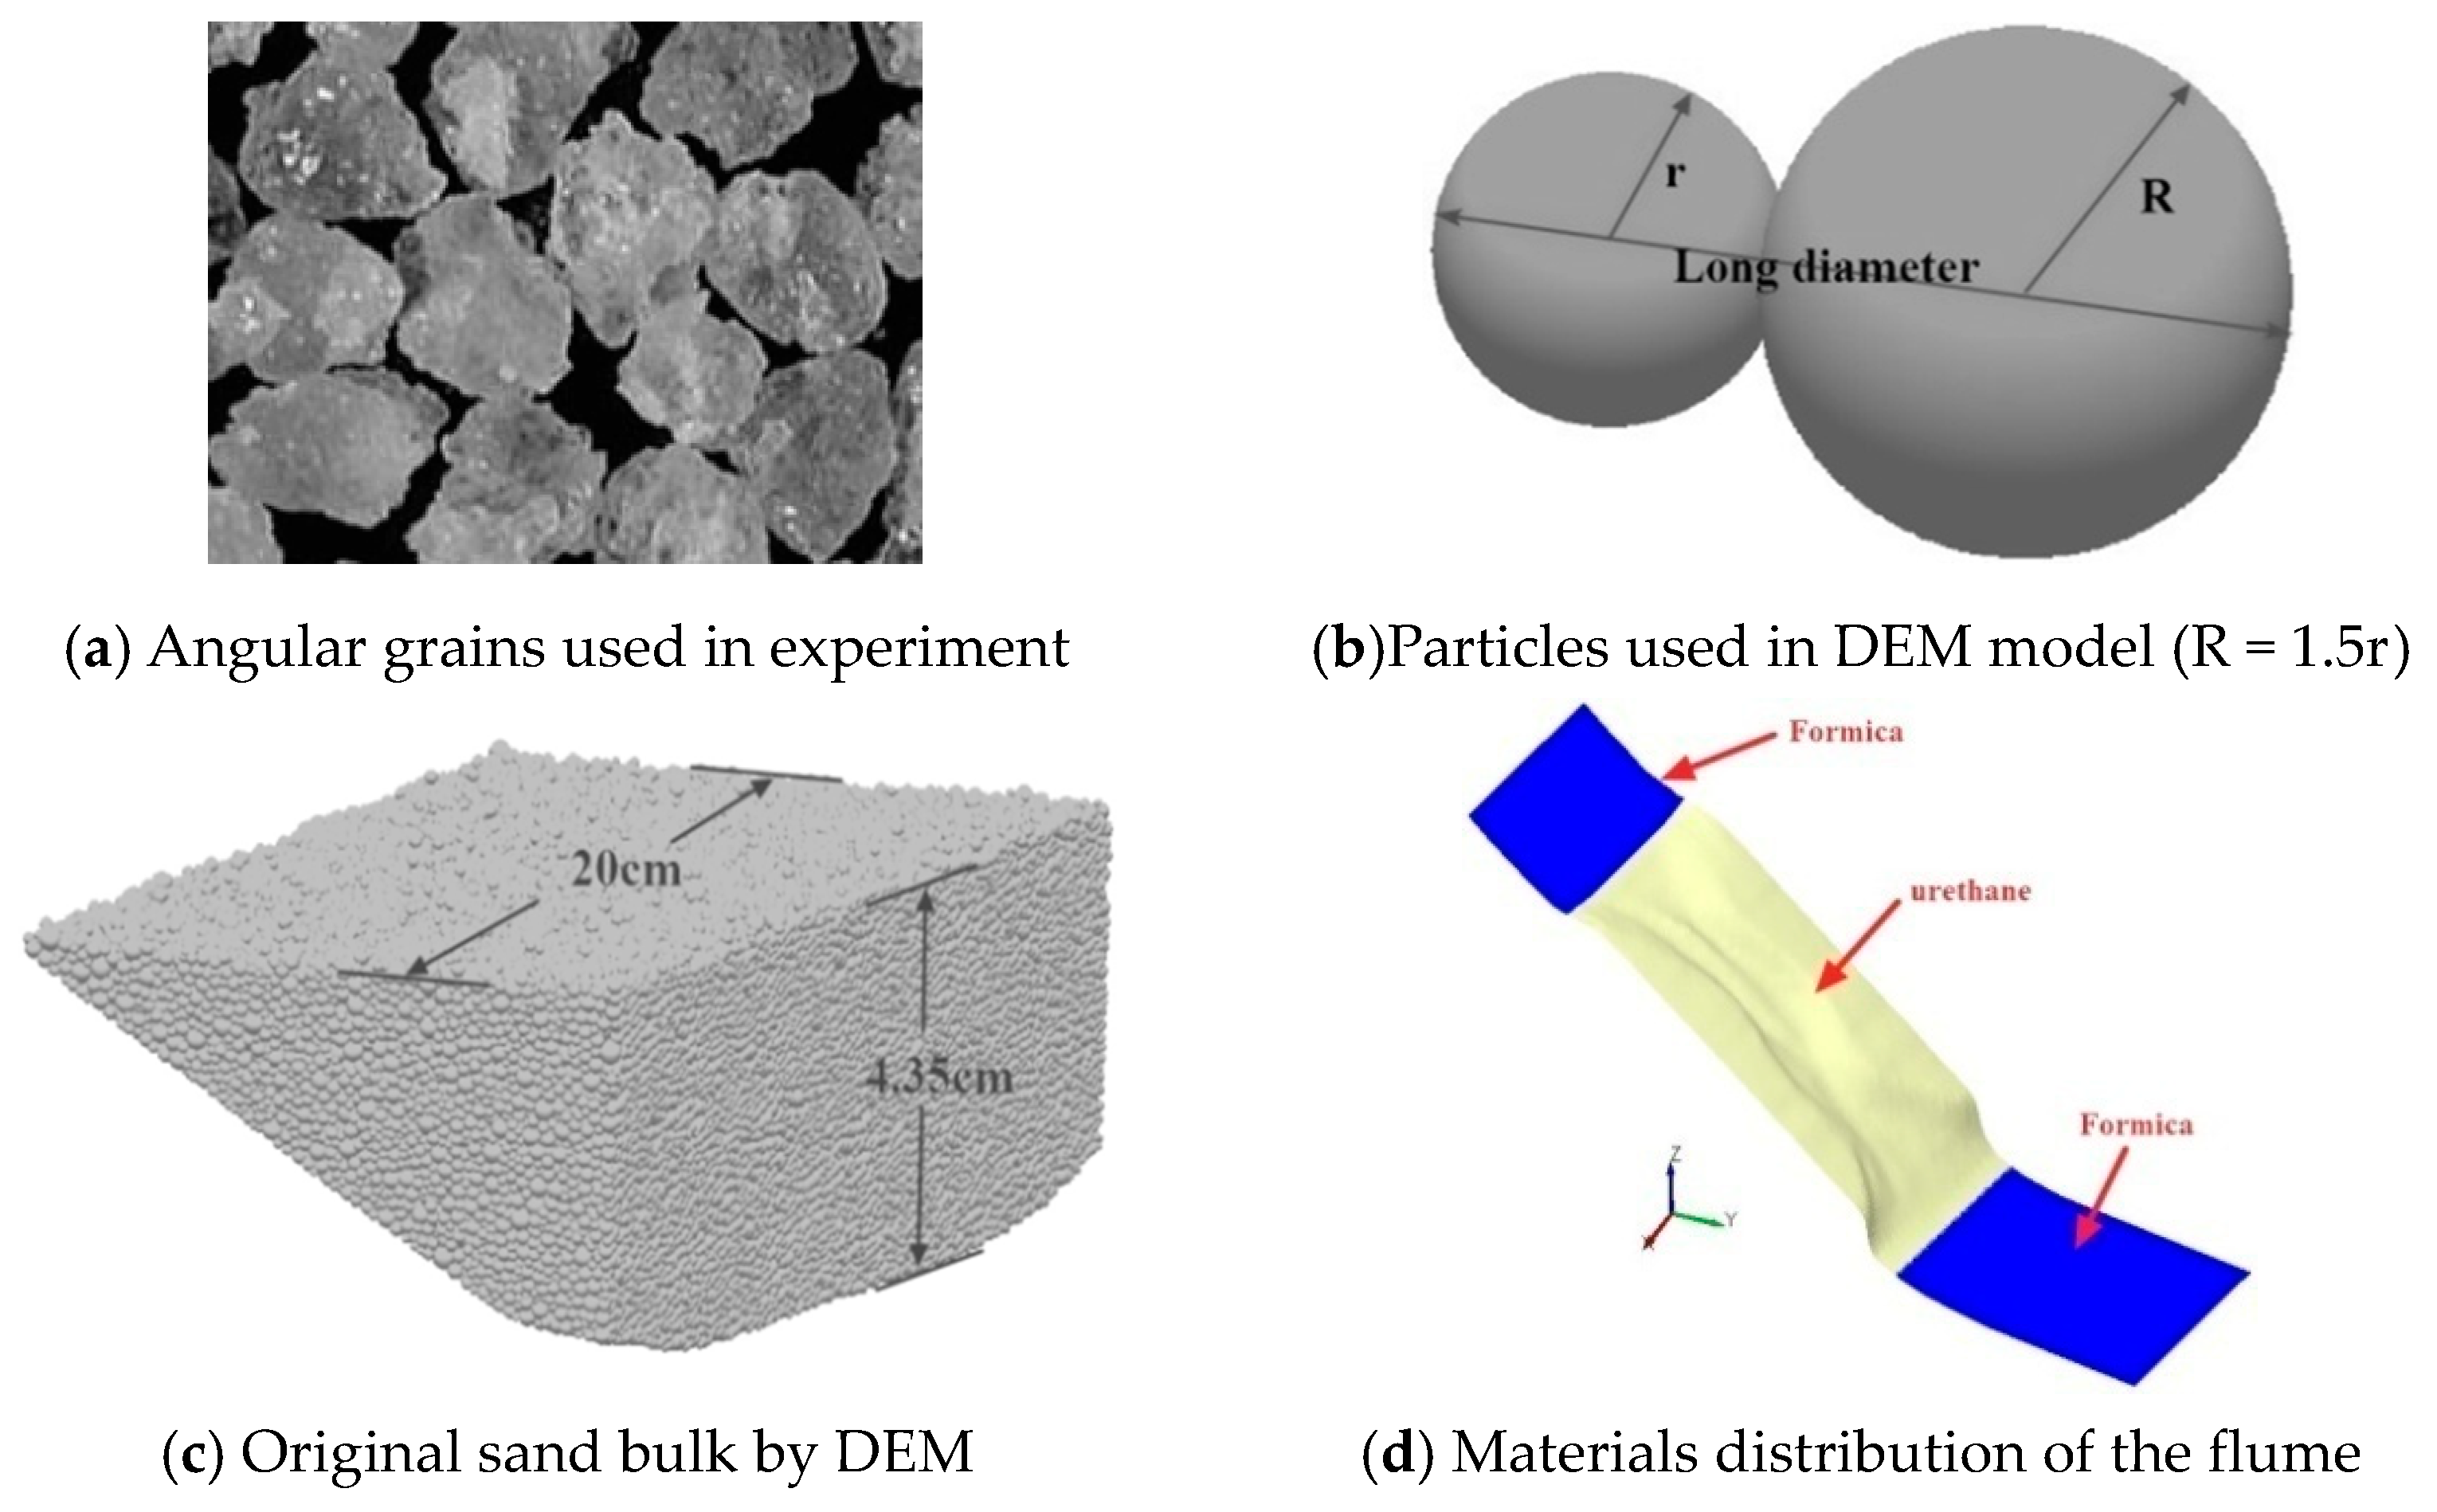
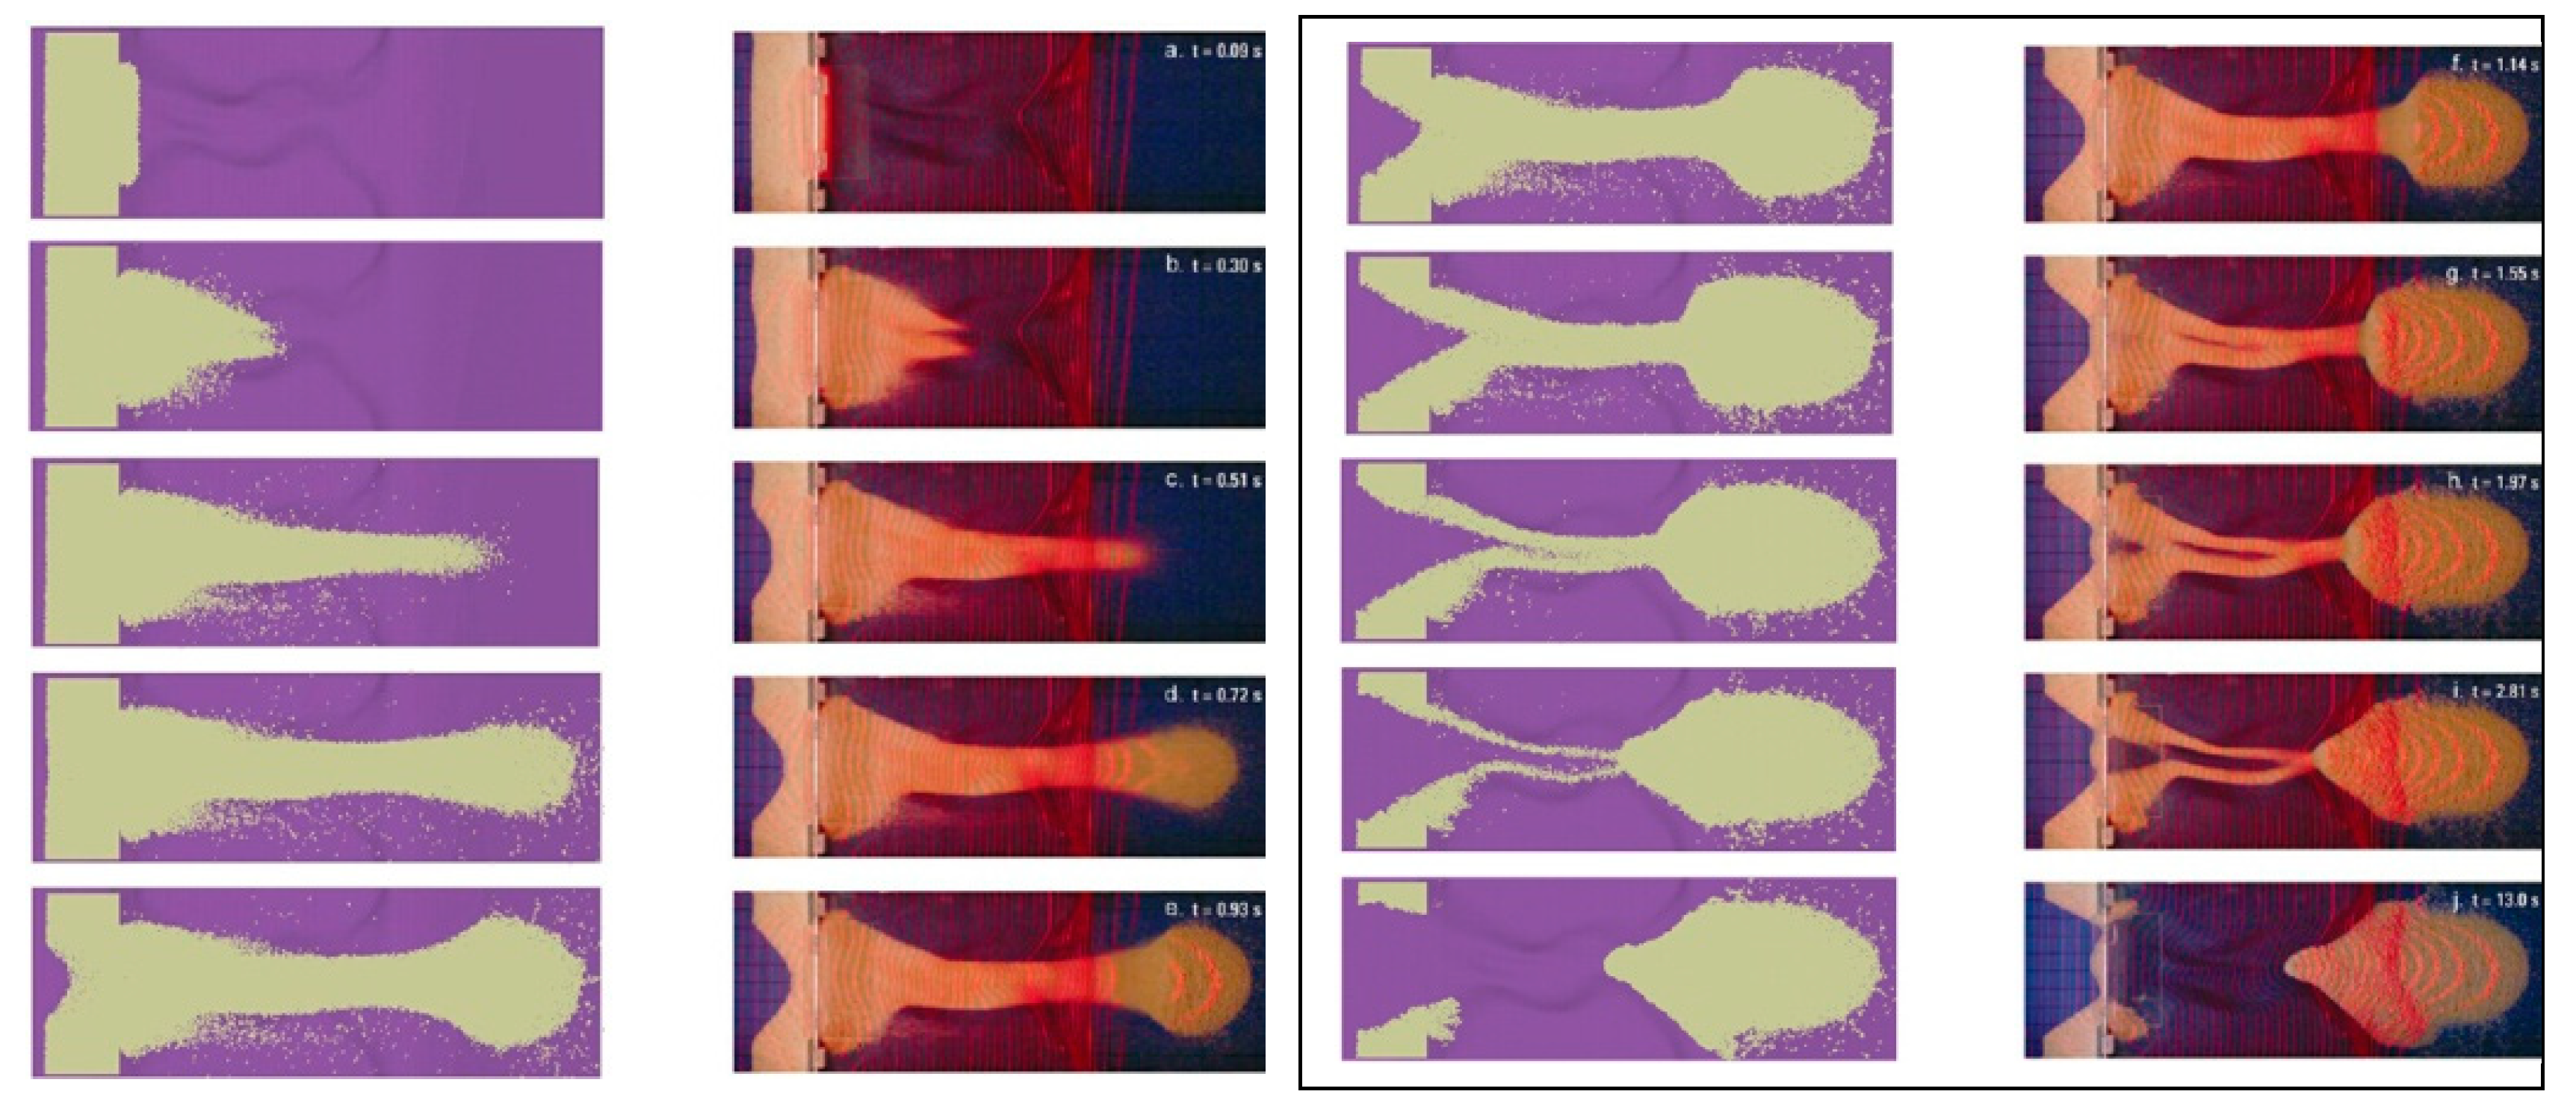
We first calibrate the DEM program applied in this simulation on laboratory experiments of granular flows. The experiment is Iverson’s laboratory experiment of sand avalanches [20]; diameters of angular grains used in the experiment is between 0.5–1mm, as shown in Figure 4a, and the bulk volume is about 308 cm3, meaning millions of grains in DEM simulation, which directly leads to very low computational efficiency in the program. Therefore, we used 70,017 particles with a long diameter between 2–4 mm to replace the same sand volume of experiment, and the single particle is composed of a large and small particle, the radius of larger one is 1.5 times than the smaller one [21], shown in Figure 4b,c. The flume width and length are 20 cm and 58.8 cm, respectively.
The basal friction angle of sand on incline (Formica) and sand on horizontal plane (urethane) are 23.47 deg and 19.85 deg, and the internal friction angle of sand is 43.99 deg, furthermore, the sand bulk density is 1.26 g/cm3, mean angle of sloping flume bed is 31.6 deg. Moreover, the ambient relative humidity is 36%, and the ambient temperature is 21 °C.
By comparing the simulated deposition with laboratory experimental results, the reliability of the DEM program has been verified, as shown in Figure 5. The results in Figure 5 show that the deposit shape and range of discrete element simulation at each moment are very close to the laboratory experiment. As a result, the accuracy of DEM program in dry sand flow simulation is verified by comparing the results of discrete element calculation with laboratory experimental results.
2.3. JKR-Cohesion Model
Hertz-Mindlin with JKR (Johnson-Kendall-Roberts) Cohesion is a cohesive contact model that considers the effects of van der Waals forces in the contact area and allows simulating strong viscous systems such as dry powder or wet granules [19,22]. JKR normal force is calculated as follows:
where γ represents the surface energy, E* is the equivalent Young’s modulus, α is the contact radius, R* is the equivalent radius, α and R* are given by
where Ri and Rj are the radius of two particles, is the JKR overlap. When surface energy = 0, the JKR normal force is calculated by Equations (2) and (3), and then it becomes Hertz-Mindlin normal force can be expressed as follows:
The JKR model provides attractive cohesion even if the particles are not contact directly. The maximum gap with non-zero cohesion between particles is defined as follows:
When particles are not in actual contact and the gap is less than , the maximum cohesive force is called pull-out force and can be expressed as follows:
When the JKR model is used to simulate wetted particles, the force Fpullout required to separate the two particles depends on the surface tension of the liquid γs and the wetted angle . The influence of van der Waals force in the contact area could be considered, and the mechanical behavior of wet particles also could be simulated very well. The model stipulates that the force formula needed to separate the two wet particles in contact is calculated follows:
where γs is liquid surface tension; is the wetted angle.
If the particle size is not scaled, according to Equations (8) and (9) above, we can estimate the surface energy value of JKR model, which is deduced as follows:
Note that within a flowing water; other forces in addition to those mentioned in this study act on sediments placed on a slopping bed [23].
3. Results and Discussions of Two Numerical Experiments
3.1. Case 1
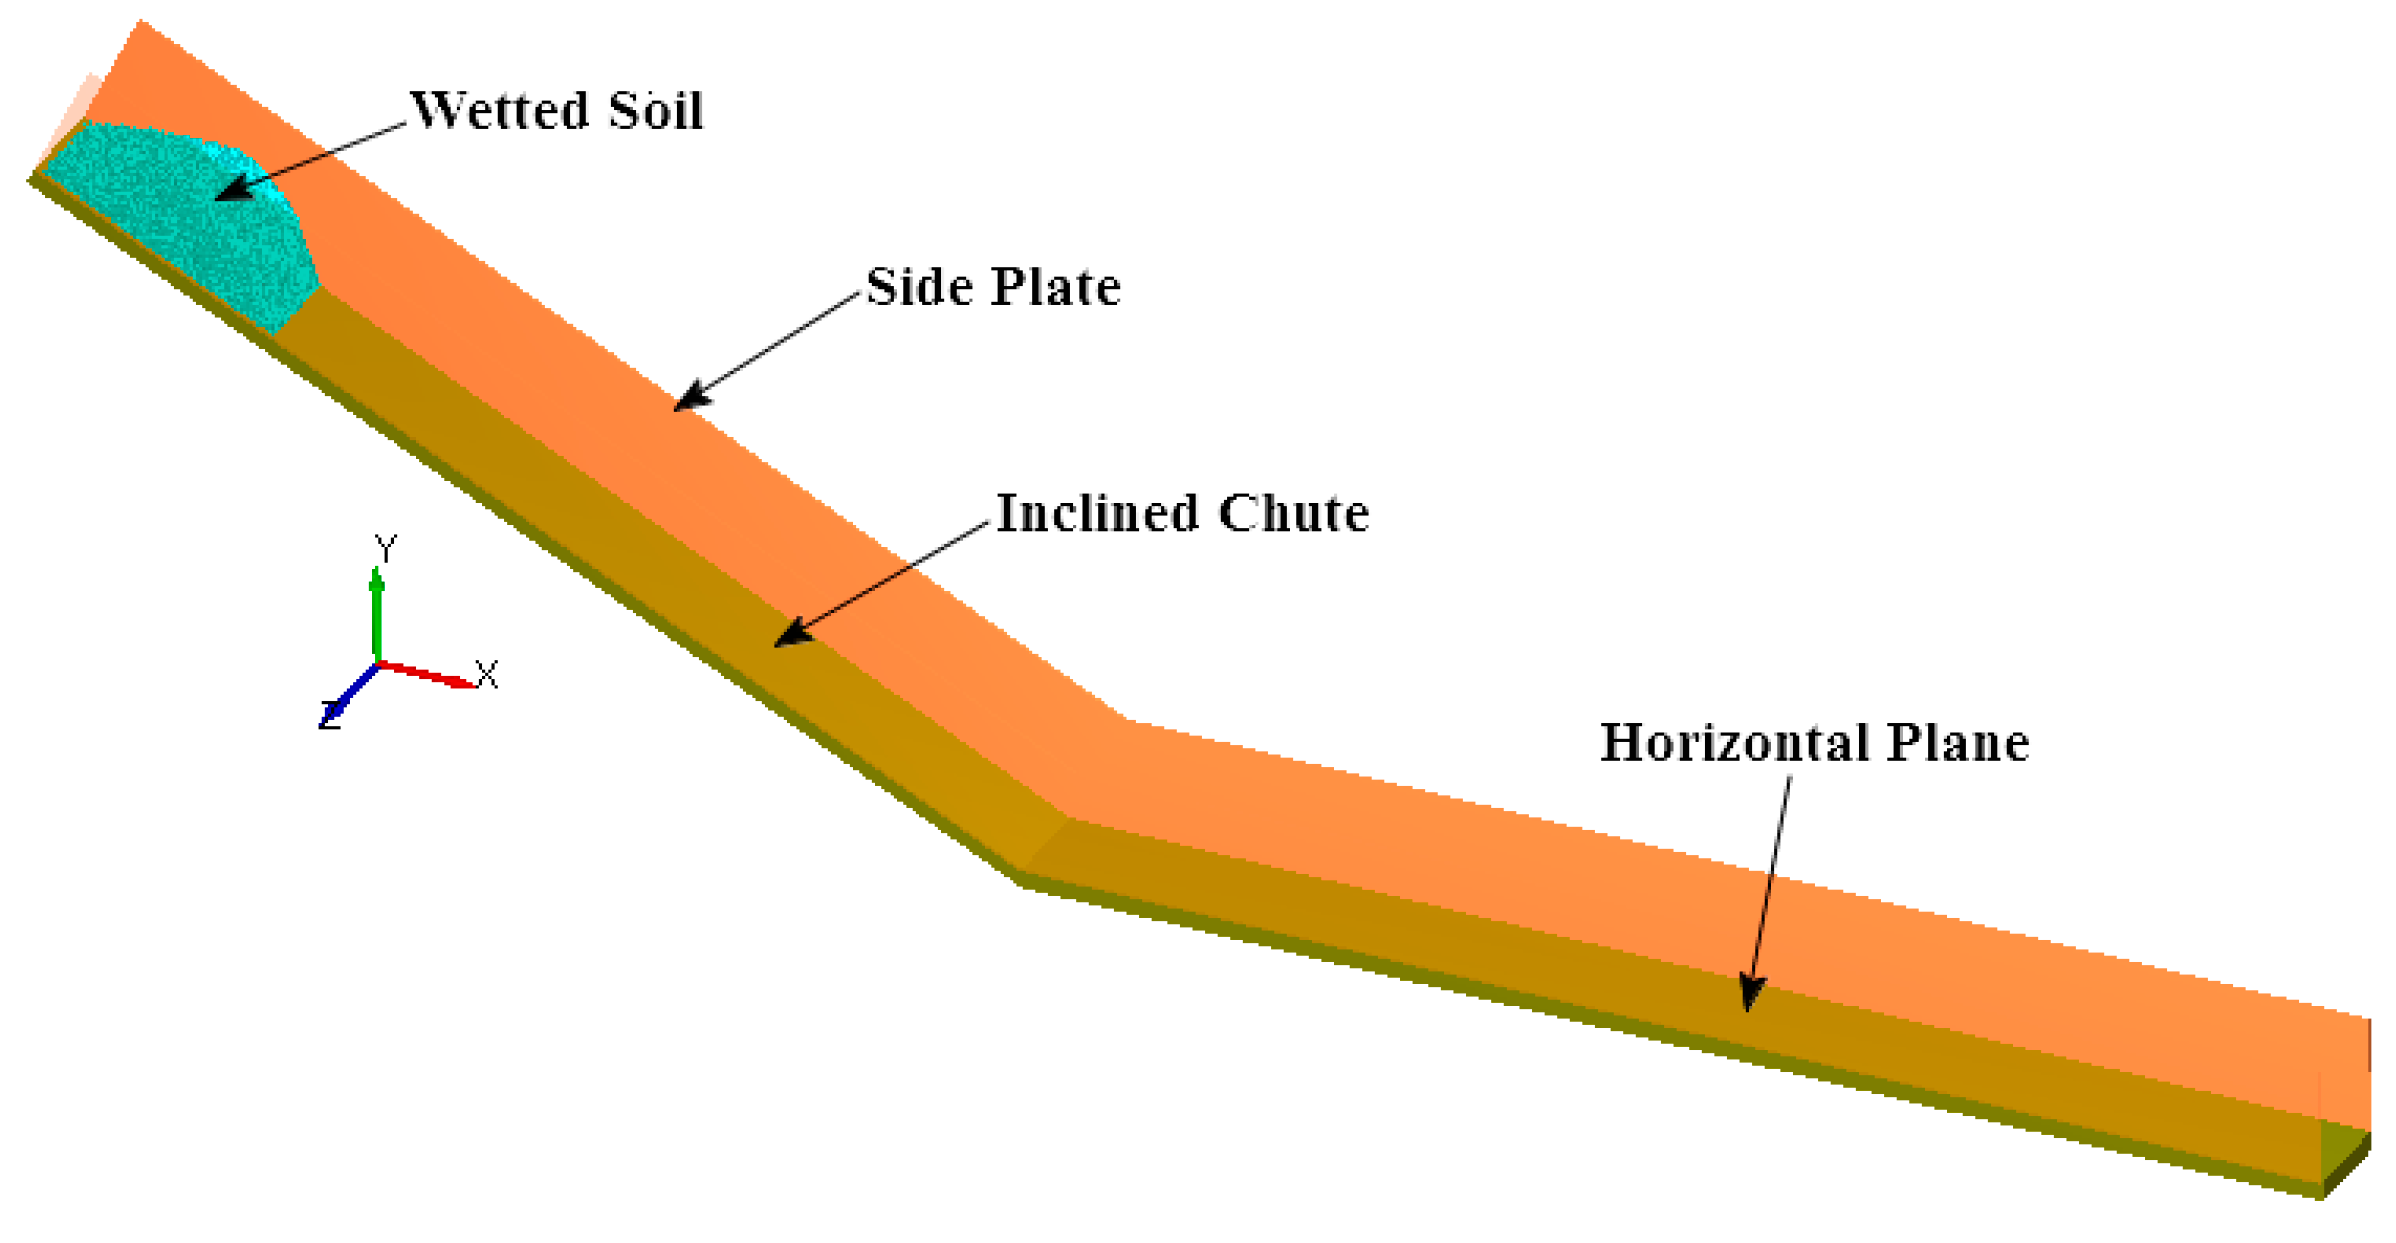
The wet soil granular flow model was imported into the commercial software EDEM for simulation, the computational efficiency is limited by the large number of granular elements, thus the size of the DEM model established is very small, which can reflect real diameter of soil granular with a certain amount of particles. The model is shown in Figure 6, the model consists inclined chute, side plate and wetted soil provenance and horizontal plane. The horizontal length of the base plate is 20 cm, the slope length is 16.77 cm, and the flume with a very thin width of 1.5 cm. The slope angle of this model is set to 27° (1:2), the vertical height of the slope is 7.5 cm, and the horizontal length of the chute is 15 cm.
In this numerical experiment of Case 1, two particle size models were considered, with diameters of soil particles are 0.7 mm and 1 mm respectively, nevertheless, the original total deposit volume of the wet soil is the same. Consequently, the wet soil model with small particle size contains 13,604 particles, yet another wet soil model only contains 4645 particles.
For this study, the key factor to simulate wet soil granular flow using the JKR model is the surface energy (γ). The value of surface energy (γ) is solved by Equation (10). Under the condition that the soil granular is wetted by water at 20 °C, the degree of wetting is considered in two cases including complete wetted and incomplete wetted, thus the wetted angles are set at 0° and 60° in this experiment respectively, moreover, the diameter of soil particles in each model is the same.
When the liquid in wet soil is water and the temperature is about 20 °C, the surface tension of water . In order to facilitate the calculation, we further proposed a liquid (water) surface energy coefficient kw. According to Equation (4), the equation for calculating the surface energy of wetted soil is defined as
where the surface energy coefficient of water is kw = = . When the soil particles are completely wetted, the wetted angle = 0°.
As a result, the parameters of surface energy were solved through the above equations in 2 cases are 0.2 J/m2 and 0.1 J/m2 respectively, which represents two states of complete wetted and incomplete wetted. The other parameters used in this numerical experiment also include the density of granular element, Poisson’s ratio and friction coefficient. According to relevant references [11,15], other parameters used in this numerical test are listed in Table 1.
Based on the formula derivation and calculation in the second and third parts above, the maximum surface energy of the wet soil granular flow numerical model is 0.2 J/m2 when the diameter of soil particles is the same. In order to facilitate comparative analysis, the numerical experiment considers three states of soil including complete wetting, incomplete wetting and non-wetting, the corresponding surface energy is 0.2 J/m2, 0.1 J/m2 and 0 J/m2, and the non-wetting state of soil is regarded as dry state. In addition, two calculation conditions including diameters of 0.7 mm and 1 mm are set for simulation.
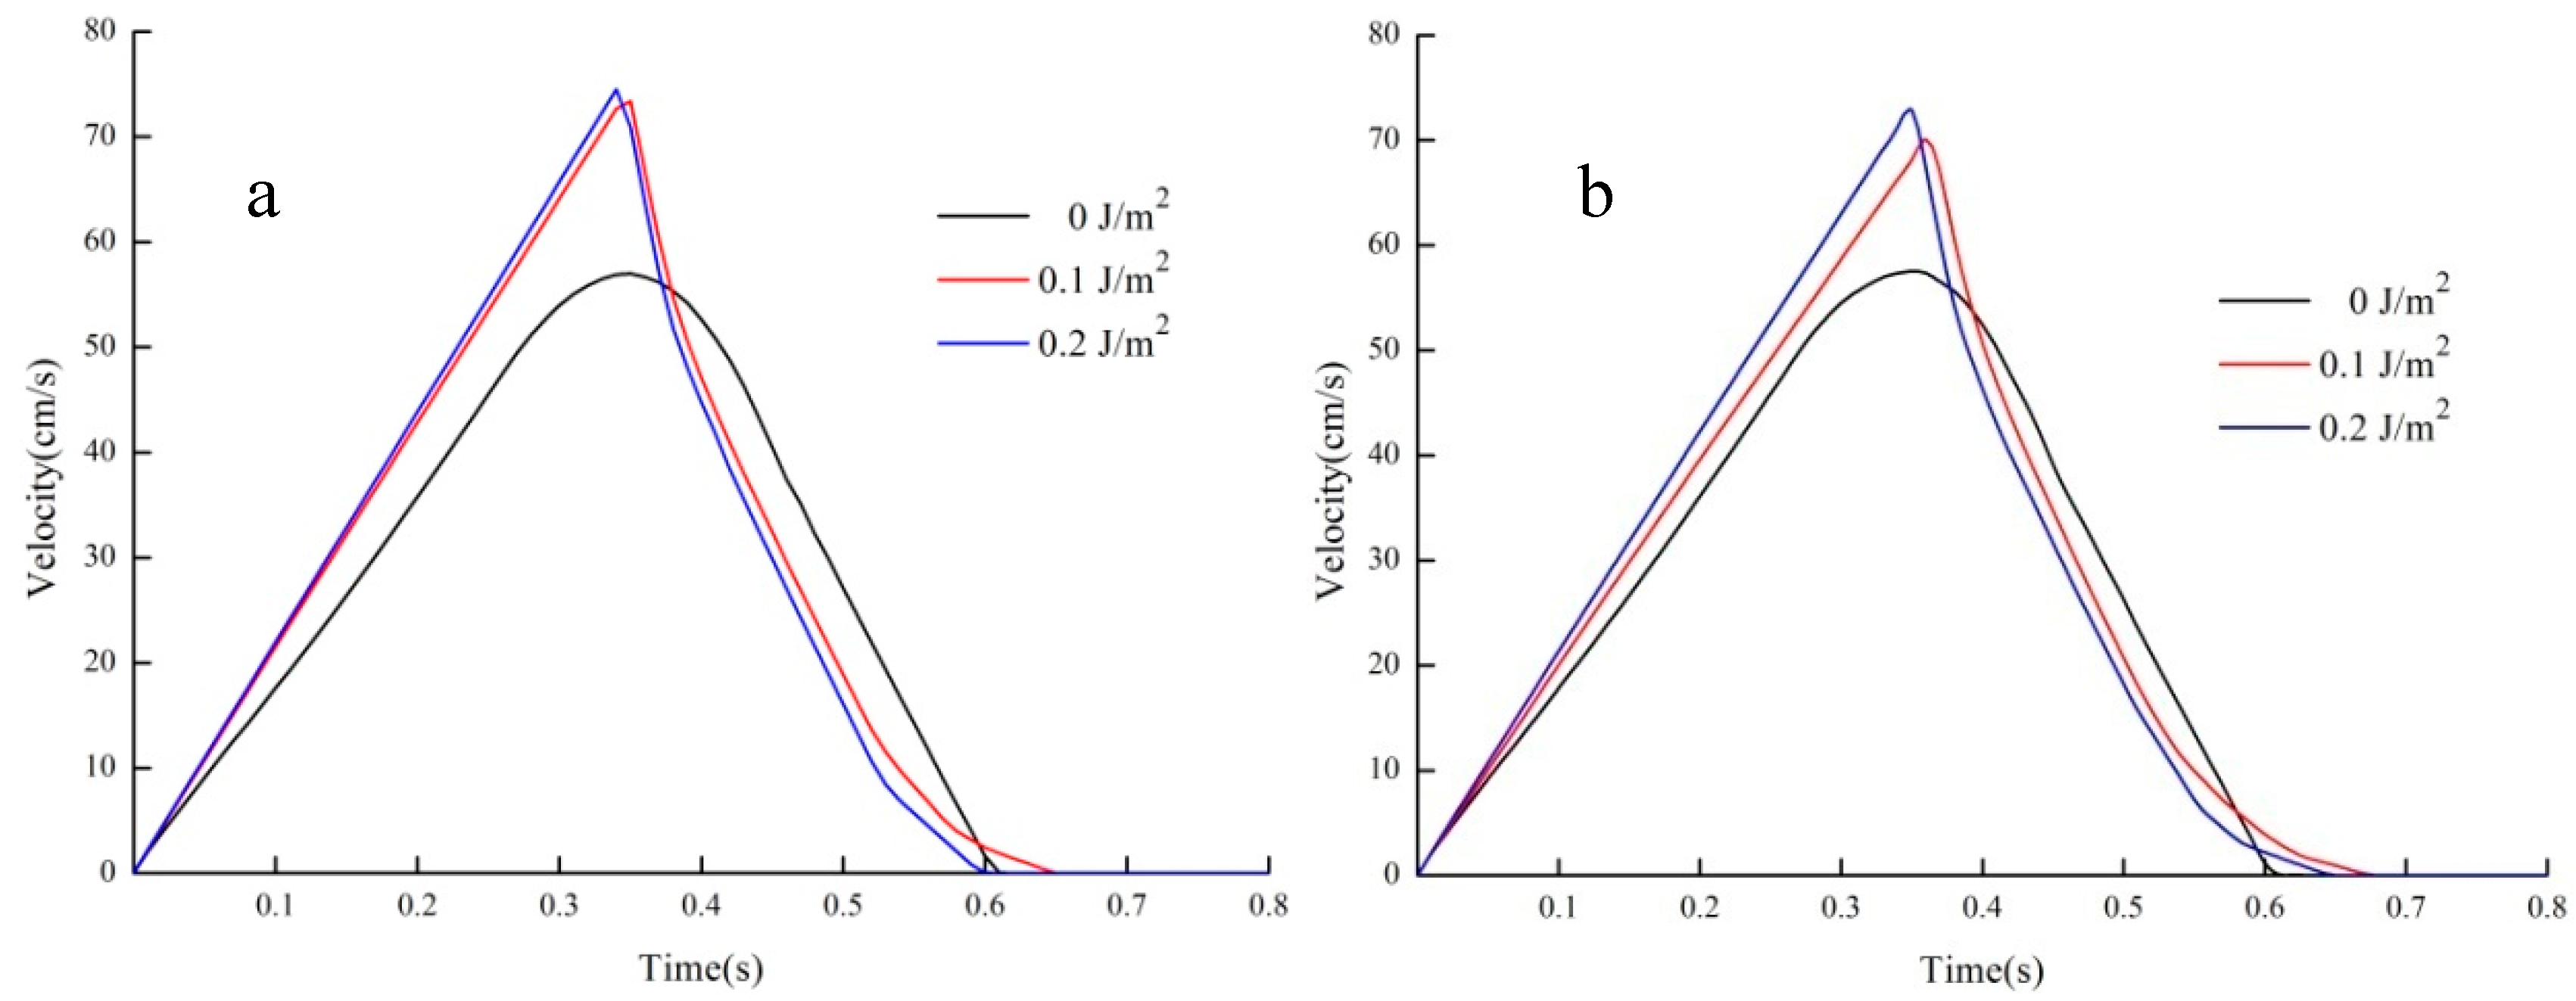
Figure 7 presents the overall sliding velocity of two sizes of soil particles with different surface energy, and Figure 8 shows the kinetic energy at the corresponding time. Figure 7a indicates that the sliding velocity of the whole soil increased first and then decreased, and finally stopped after about t = 0.6 s when the diameter of soil grains is 0.7mm. When the effect of water is considered, the motion characteristics of wet soil are almost the same when the surface energy is 0.2 J/m2 and 0.1 J/m2. When the surface energy is 0.2 J/m2, the maximum velocity of soil avalanche is 74.5 cm/s with the corresponding time of t = 0.34 s, and when the surface energy is 0.1 J/m2, the maximum velocity of soil is 73.4 cm/s and the corresponding time is t = 0.35 s. When the water is not considered, that the soil is composed of dry particles, the maximum velocity of the dry soil is 57 cm/s and the corresponding time is t = 0.35 s, which is much less than the velocity of the wet soil with surface energy applied.
In addition, Figure 7b shows that when the diameter of soil granular increases to 1 mm, the sliding velocity of the whole soil increased firstly and then decreased gradually, which is similar to that of 0.7 mm. Nevertheless, the sliding process stopped after about t = 0.65 s, which is 0.05 s later than that of 0.7 mm, especially when the wetting effect of water considered. When the surface energy is 0.2 J/m2, the maximum velocity of soil avalanche is 72.8 cm/s with the corresponding time is t = 0.35 s, yet when the surface energy is 0.1 J/m2, the maximum velocity of soil is 70 cm/s, corresponding time is t = 0.36 s, it is obvious that the maximum velocity is smaller than diameter of soil particle 0.7mm, and the time to reach the peak velocity is also 0.01 s later. If water is not considered, the maximum velocity of soil sliding is 57 cm/s and the corresponding time is t = 0.35 s, which is same as that granular diameter of 0.7 mm.
The above results show that when the volume of the soil is the same, the average velocity of the dry soil is less affected by the granular size, while the granular size has a greater impact on the average velocity of the wet soil granular flow.
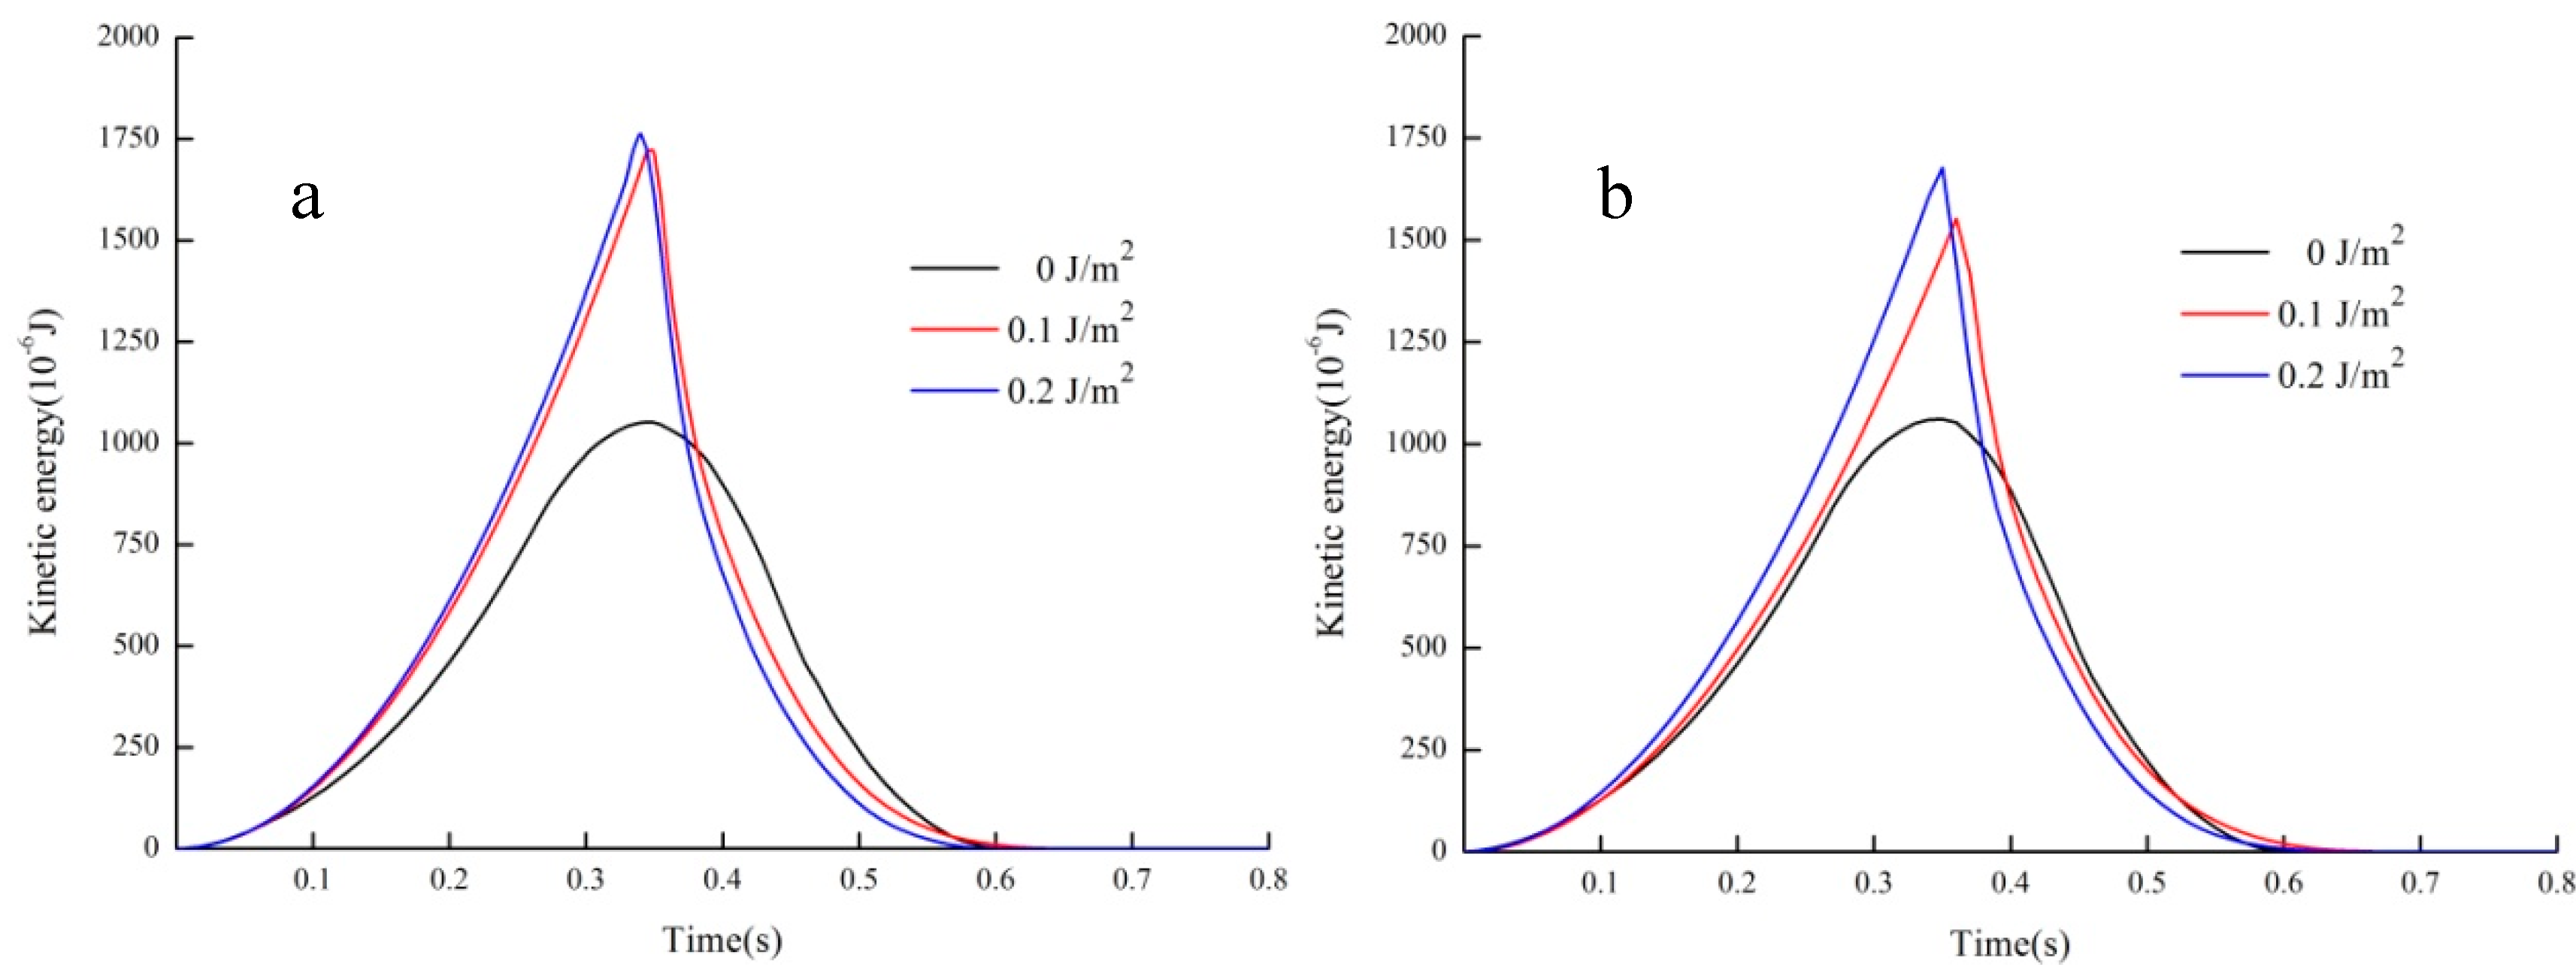
Moreover, Figure 8 shows the total kinetic energy of two sizes of soil particles flow with different surface energy. The curve trend is almost the same as Figure 7. Further analyses indicate that the larger surface energy is, the larger the maximum kinetic energy of soil sliding is when the particle size is the same. For example, Figure 8a shows that the maximum kinetic energy of soil granular flow under three conditions of 0.2 J/m2, 0.1 J/m2 and 0 J/m2 are 1763 × 10−6 J, 1712 × 10−6 J and 1050 × 10−6 J respectively, while those with the diameter of 1 mm are 1677 × 10−6 J, 1552 × 10−6 J and 1061 × 10−6 J, as shown in Figure 8b.
As different surface energy and different soil granular sizes have different influences on the energy dissipation in the process of wet soil granular flow, further study of the wet soil granular flow motion characters is very important because the soil under natural conditions often changes between unsaturated and saturated states. Figure 9 presents the final deposition of wet soil after the avalanche triggered, the left and right diagrams represent deposit results of soil-grain diameters of 0.7 mm and 1 mm respectively. The length of the bottom chute is 20 cm, which is sufficiently long to observe the runout distance of the soil granular flow.
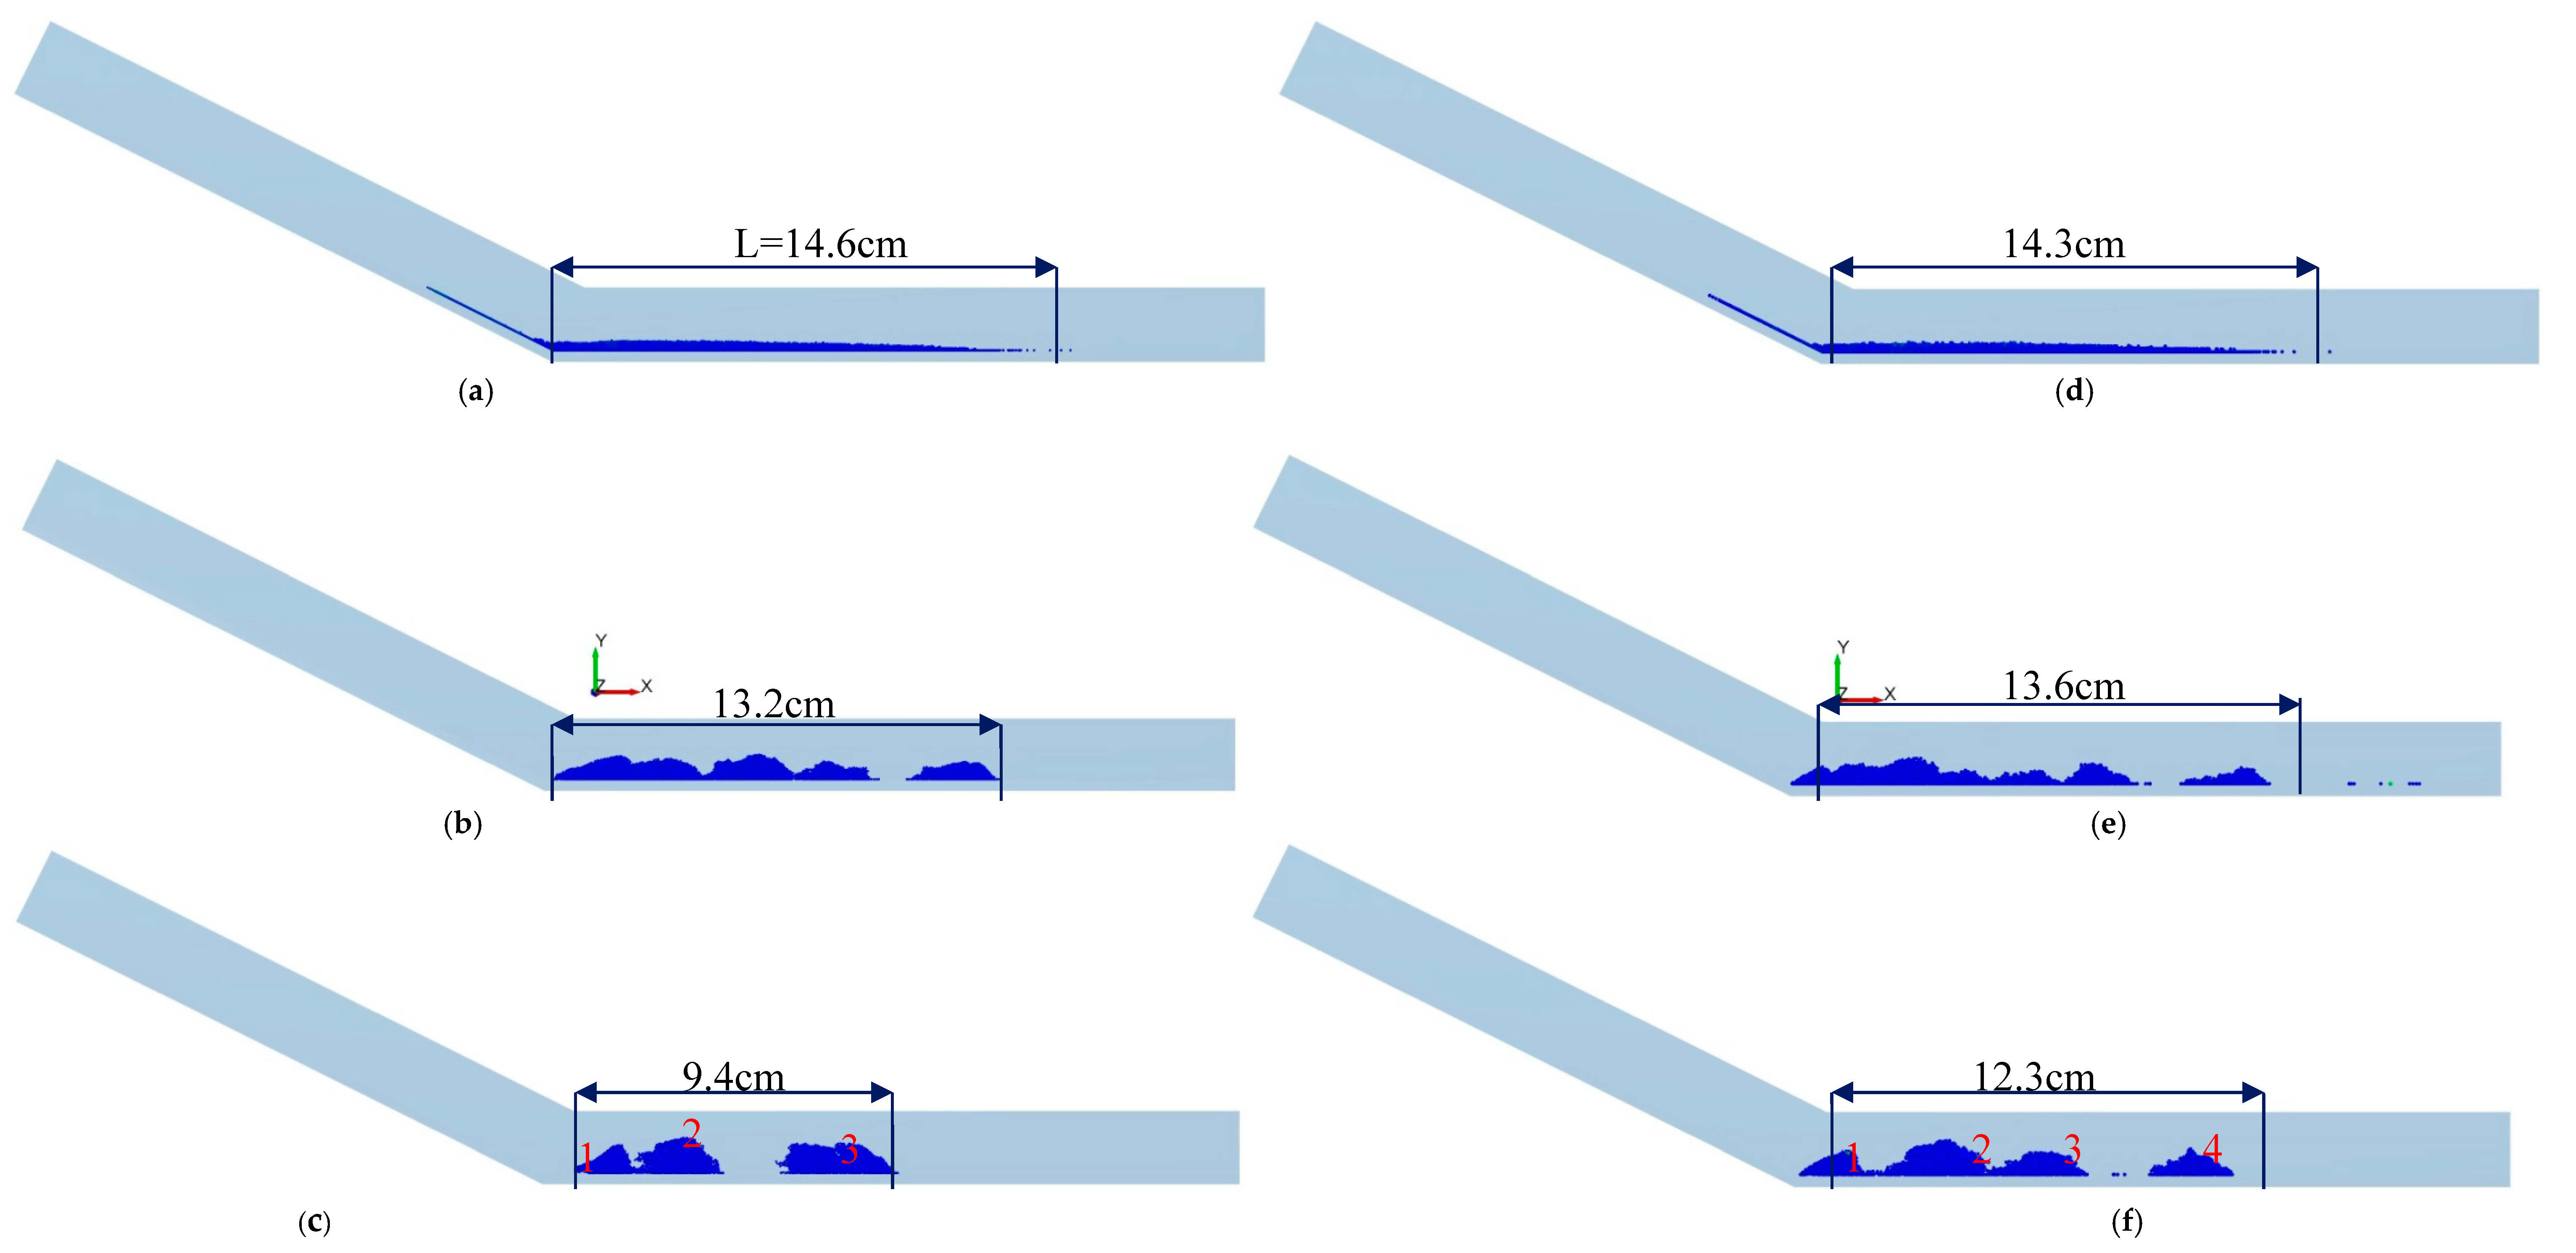
As shown in Figure 9, when the surface energy is zero and the water in soil is not considered. The dry soil granular avalanche has the longest runout distance on the horizontal plane. At this time, the runout distance is little affected by the diameter of soil particles, for instance, when the soil granular size is 0.7 mm, the runout distance is 14.6 cm, and when the soil particle size is 1 mm, the deposit length is 14.3 cm. With the increase of surface energy, the runout distance decreased gradually. When the soil is completely wetted with the surface energy of 0.2 J/m2, the runout distance is 9.4 cm and 12.3 cm respectively, which indicates that the deposit length of soil granular with particle size of 0.7 mm is much shorter than that of 1 mm. However, when the soil is not completely wetted with the surface energy of 0.1 J/m2, the deposit length is 13.2 cm and 13.6 cm respectively, the length of soil granular with 0.7 mm is only 0.4 cm shorter than that of 1 mm. These analyses depict that when the wetting effect of water is taken into account and the surface energy is the same, the larger diameter of soil particles is, the longer runout distance of the soil granular flow is, due to the better integration of the whole structure of small particles under the role of water adhesion. And the small soil grains connected structure during motion process is harder to be destroyed, thus there are fewer grain clusters in the final deposition.
As shown in Figure 9c, when the diameter of grains is 0.7 mm, the wet soil disintegrated into 3 grain clusters, while when the diameter of grains is 1 mm, the soil disintegrated into 4 grain clusters. In other words, wet soil with larger particles requires larger liquid surface energy to keep the soil structure intact in the same state.
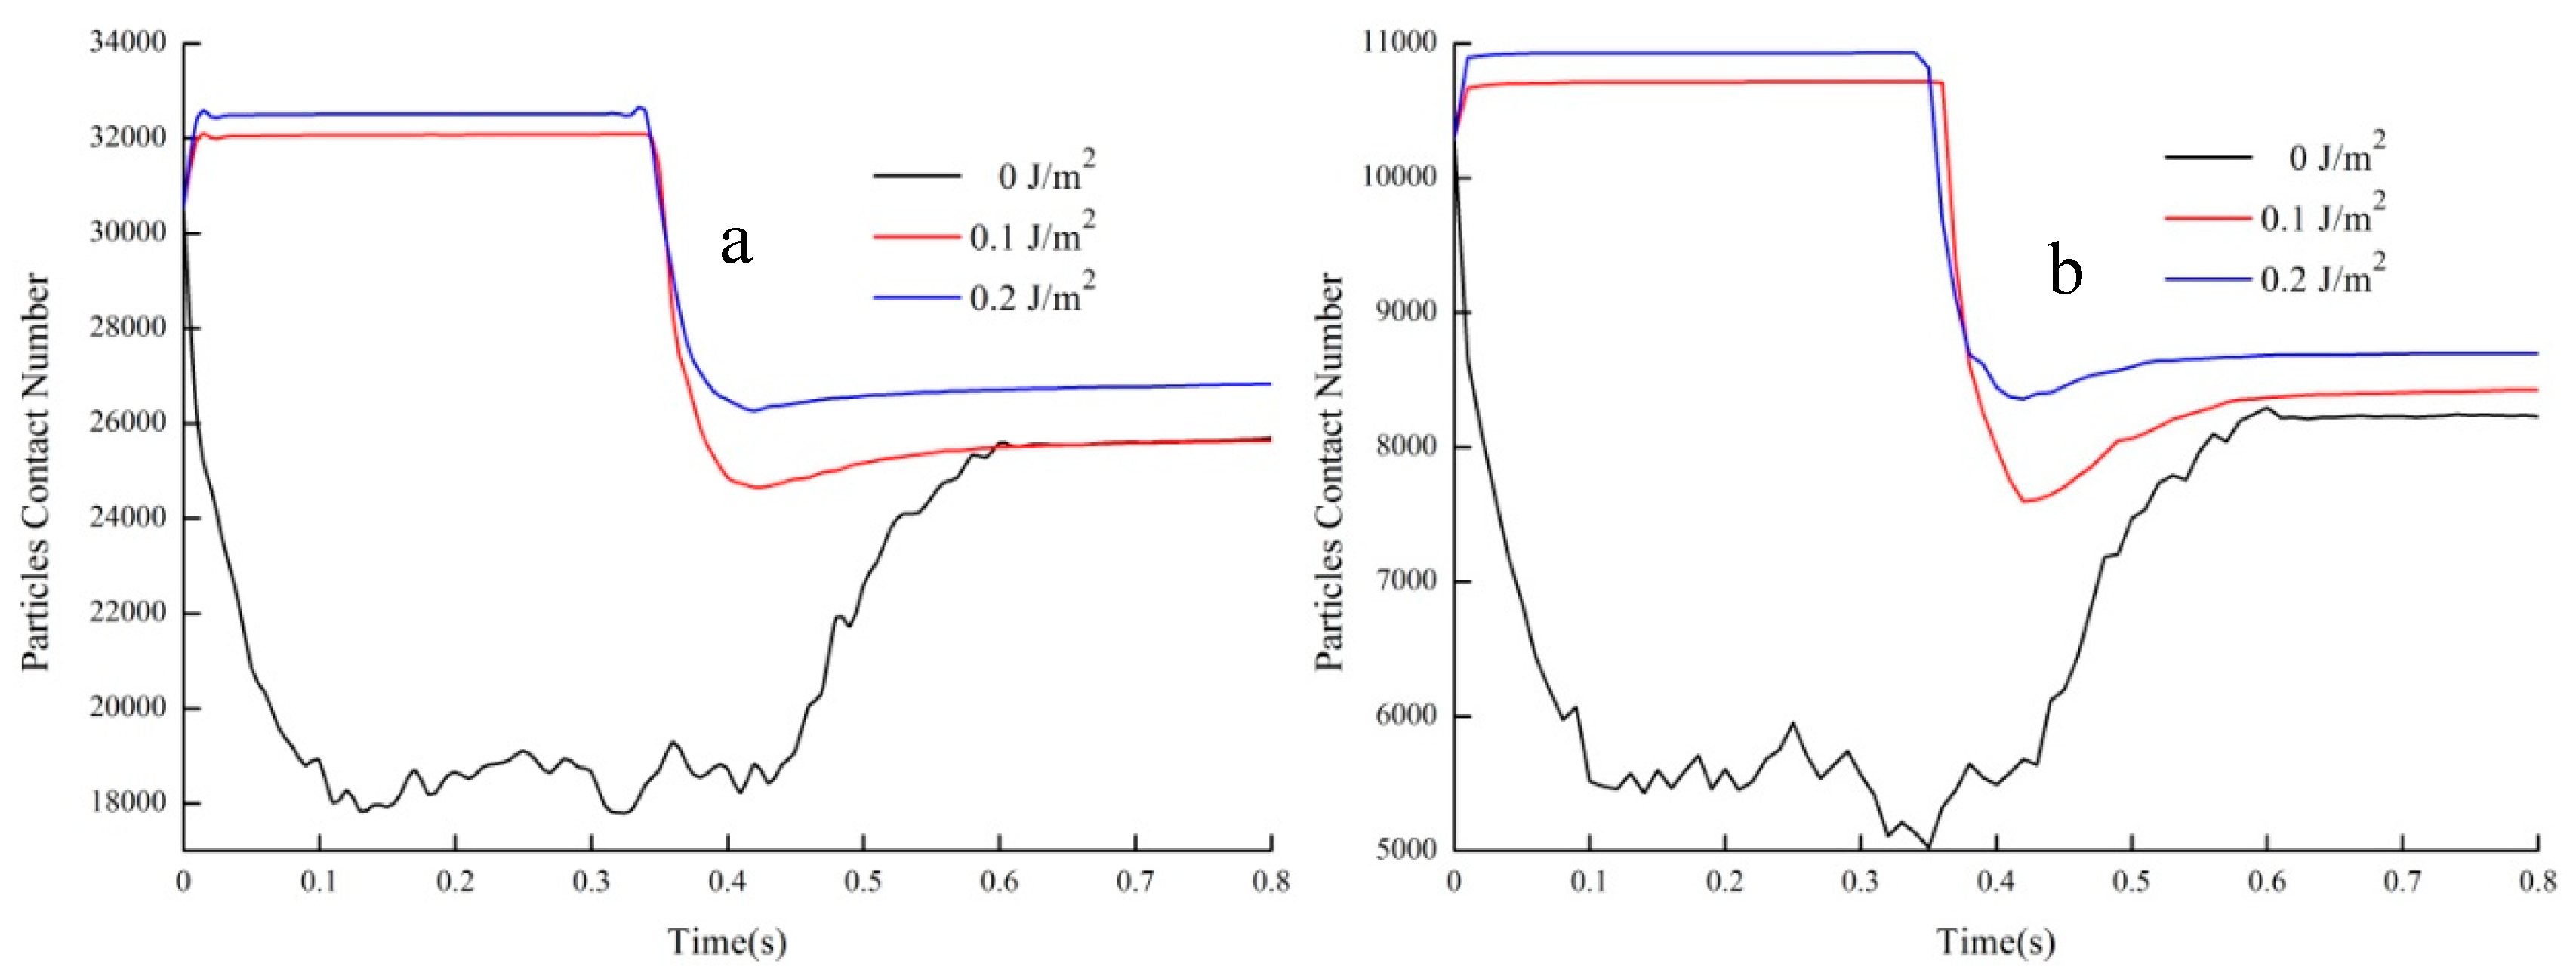
Figure 10 diagrams the change of contact number of particles during the process of soil avalanches with different surface energy when the soil-grain diameters are 0.7 mm and 1 mm. It is obvious to conclude that the contact number keeps stable from the soil avalanche triggered to 0.35 s when the soil is water bearing, because the structure of the original soil remained intact when sliding on the chute. Then the contact number reduced by more than a third in a very short time, then the contact number keeps unchanged until deposit at the horizontal plane.
However, when the soil granular is dry, the changing trend of contact number is very different from that considering surface energy, because the number of contacts declined sharply from the beginning to 0.1 s, then kept at a stable state until sliding to the horizontal plane at about 0.43 s and then the number of contacts began to increase again to 0.6 s, at this time, the number of contacts is basically the same as that at 0.1 J/m2, especially when the soil-grain diameters is 0.7 mm, as shown in Figure 10a.
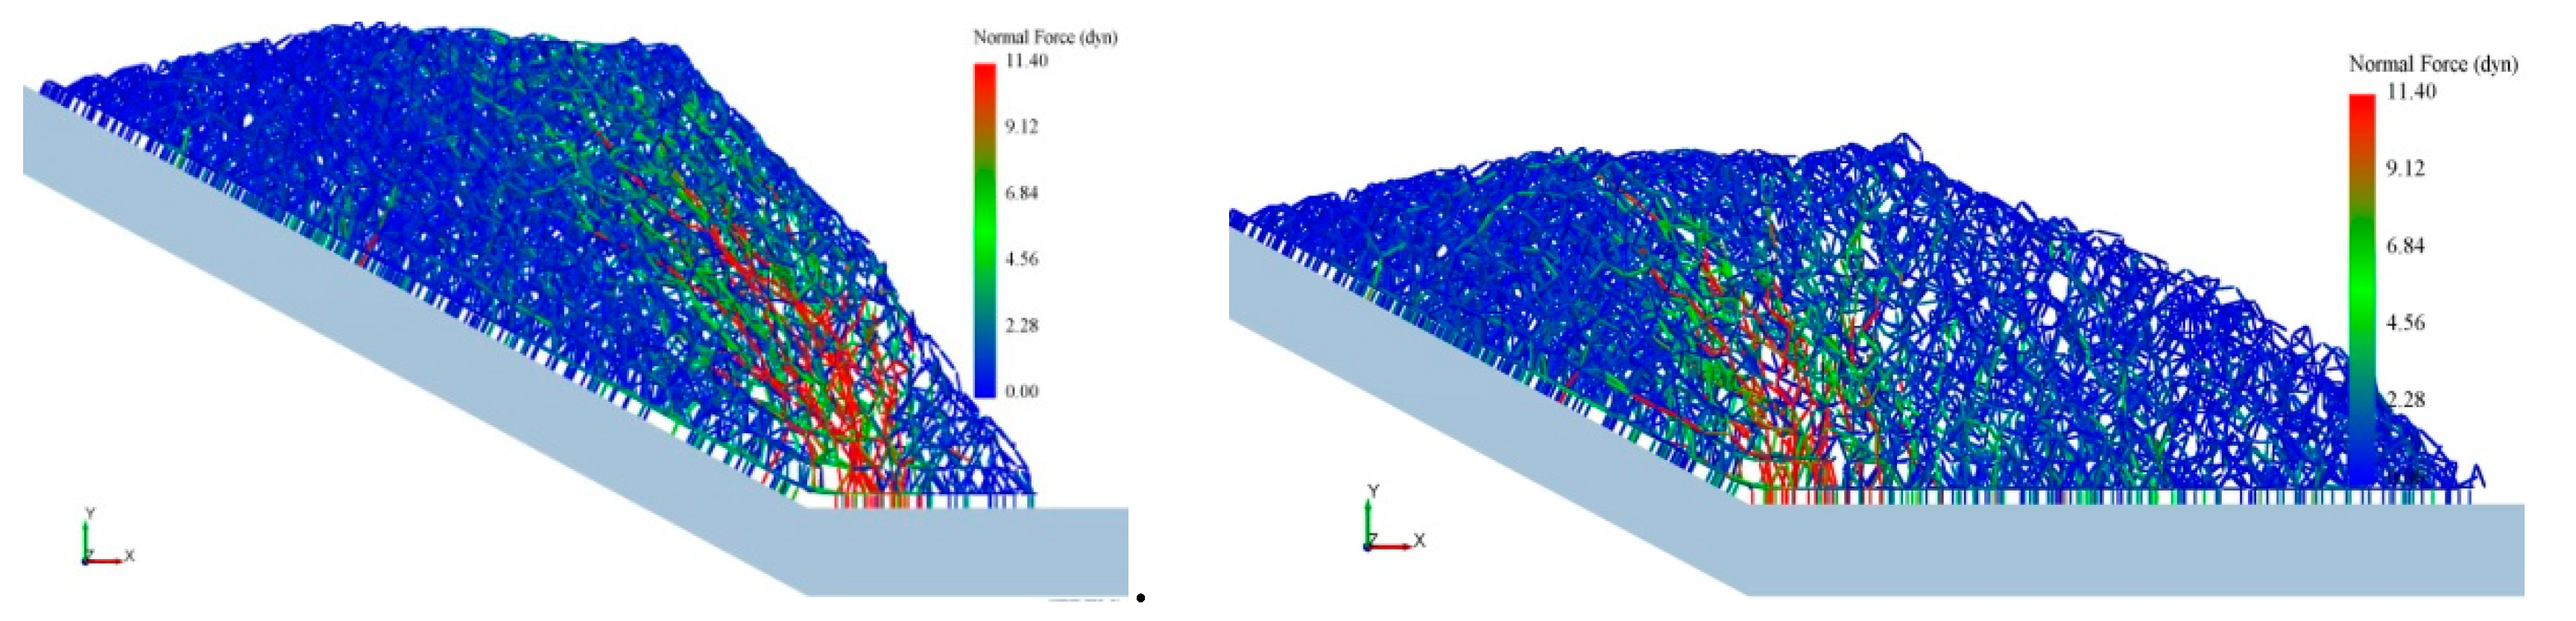
In addition, we also studied the process of disintegration and destruction of wet soil. In order to facilitate the observation of soil structure destruction, we calculated the maximum force that could separate two particles depends on the surface tension of the liquid γs and the wetted angle . Therefore, Equation (8) or (9) could be used for calculation there, taking the case of d = 0.7 mm and γ = 0.1 J/m2 as an example, the force of Fpullout was calculated as follows:
Because the size of the model is very small and the contact force is also very small, in order to facilitate the analysis, we unified the unit of force into dyn, and the results of force Fpullout in four cases are listed at Table 2.
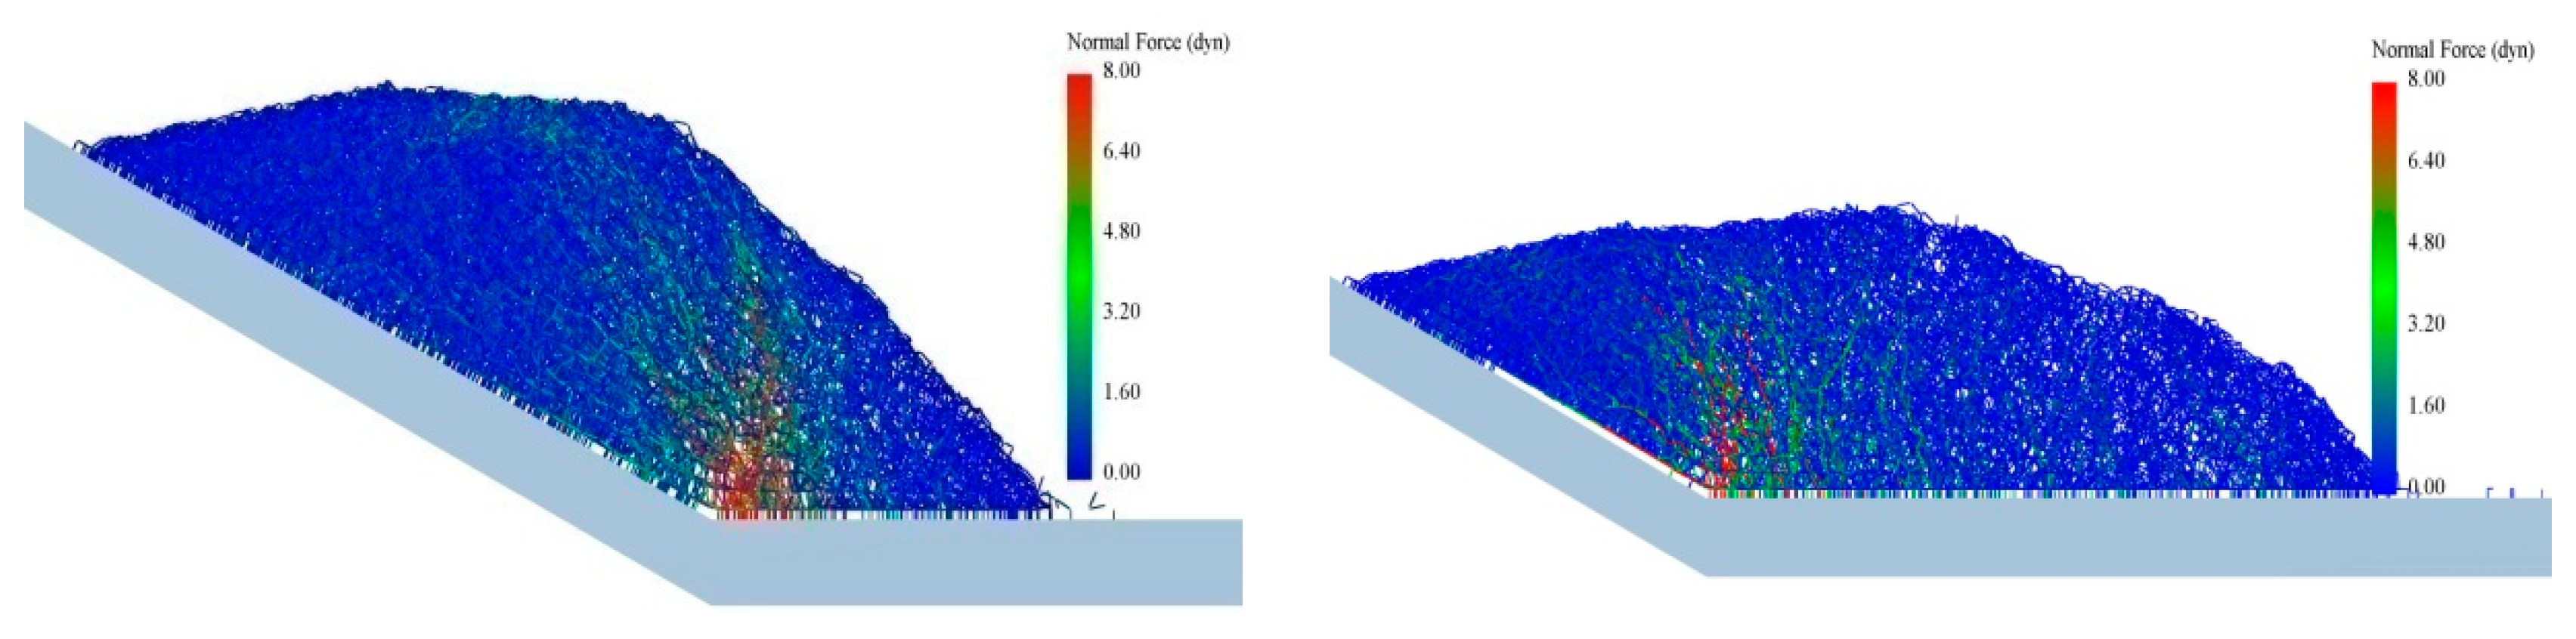
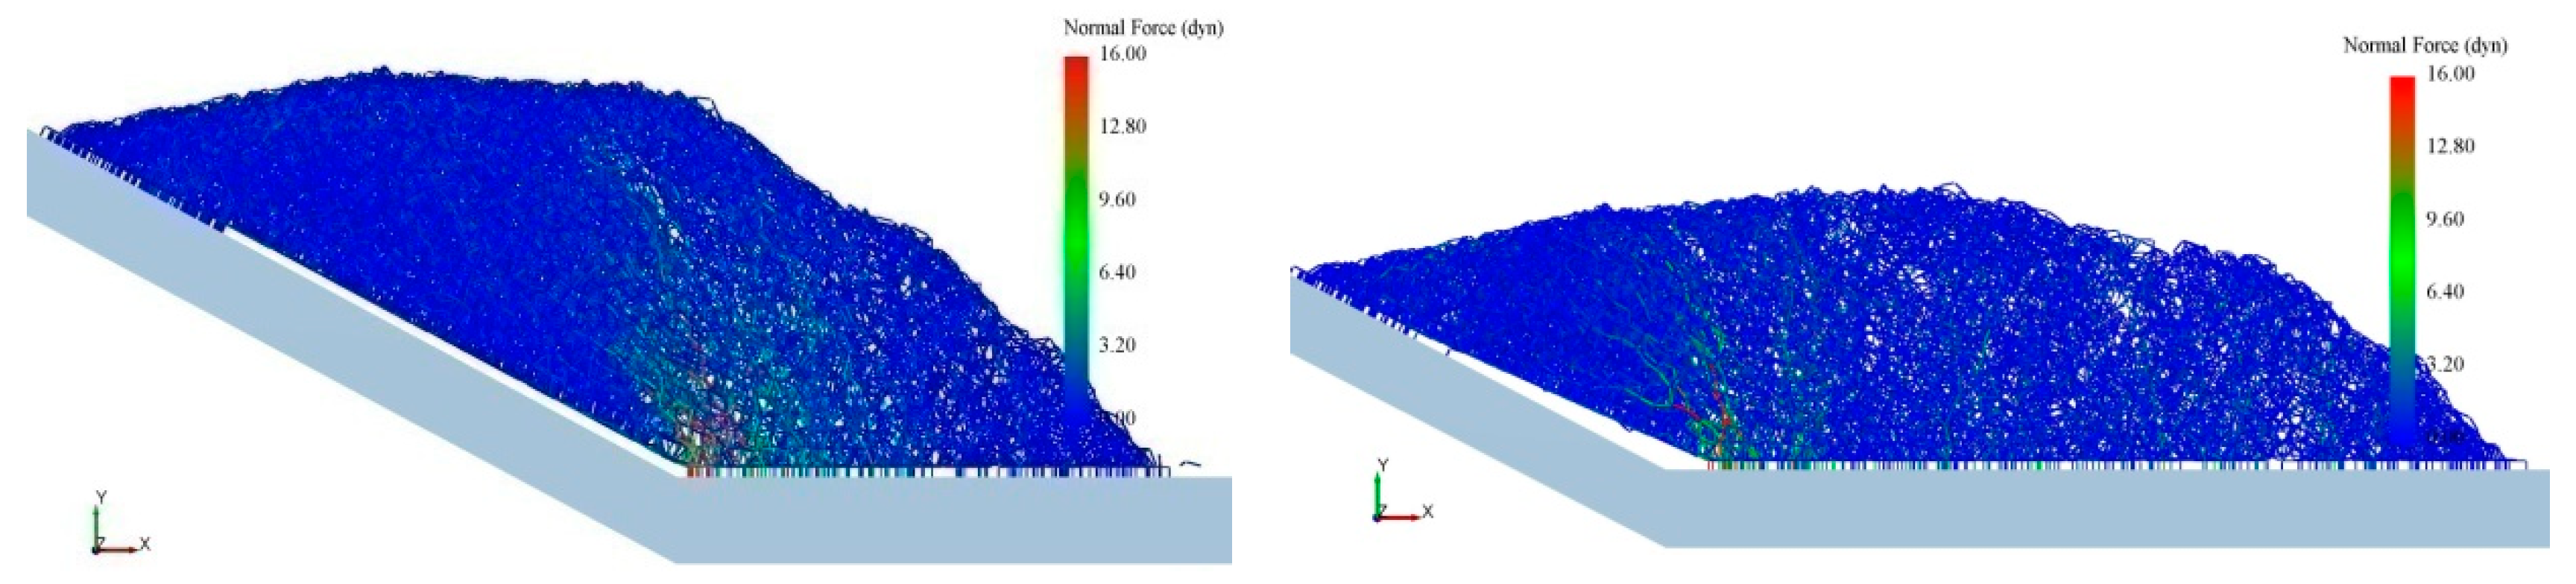
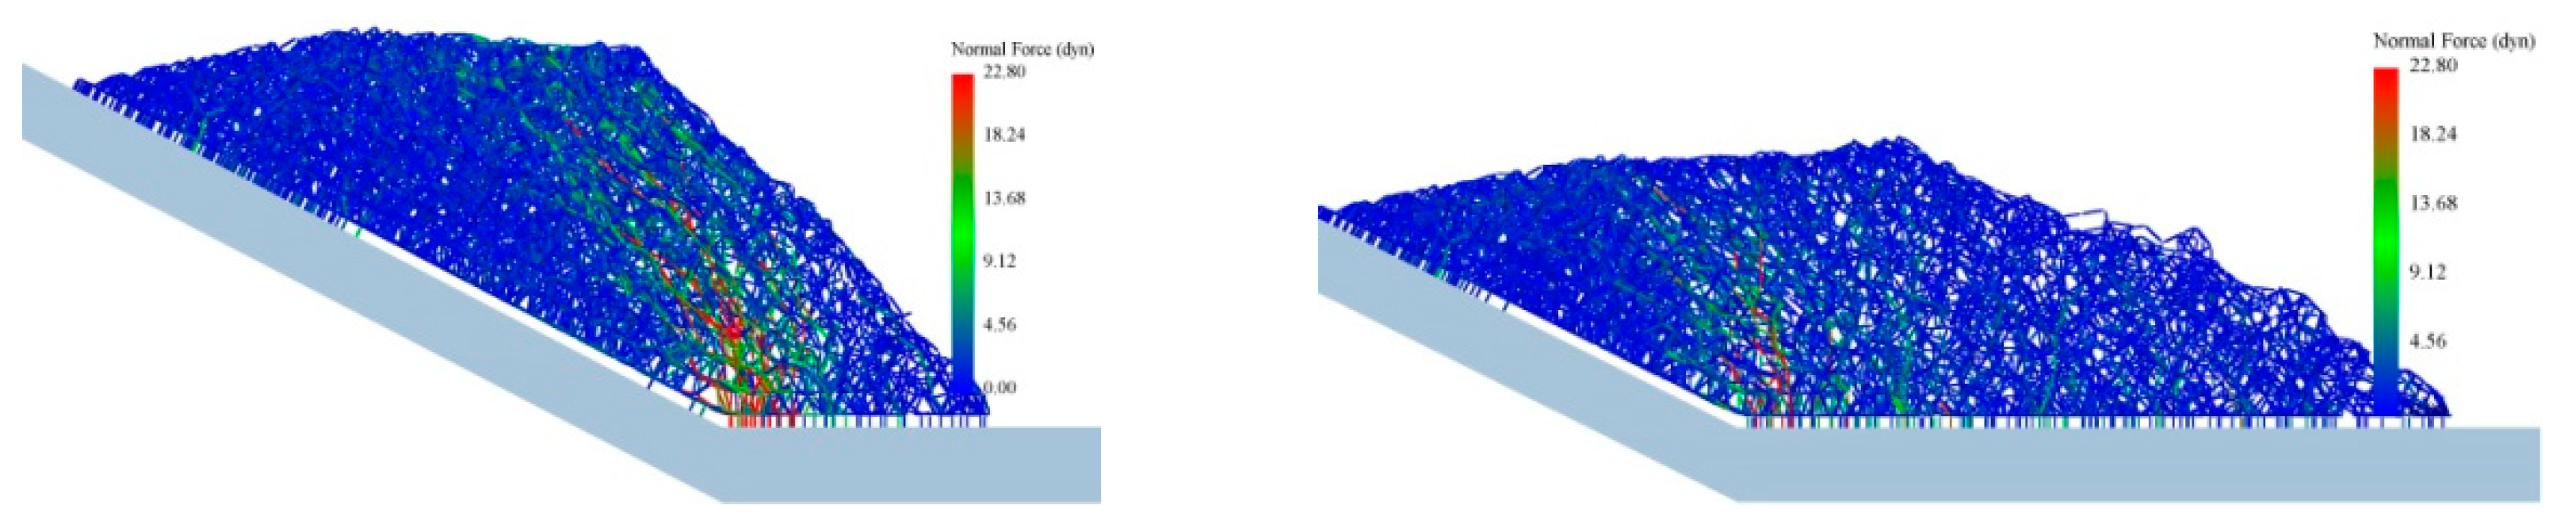
Since the structural damage of wet soil starts mainly from sliding to the foot of the slope, we derived the contact force and the force chain of four cases considering surface energy when sliding to the foot of the slope. As shown in Figure 11, Figure 12, Figure 13 and Figure 14, each figure contains two moments. For the convenience of observing the failure location of soil structure, we set Fpullout in Table 2 to the maximum normal force in the illustrations of corresponding cases. From the comprehensive analysis of Figure 11, Figure 12, Figure 13 and Figure 14, it could be clearly found that the contact structure will be destroyed when wet soil slides to the foot of the slope, extending directly from the slope foot to the interior of the wet soil, and the normal force also gradually decreases, but the damage degree of the four cases is different, and the red color areas in the graphs represent the locations and scopes of the structural damages.
It is obvious to conclude that the most serious damage of wet soil structure is the case of γ = 0.1 J/m2 and d = 1mm, as shown in Figure 13, however, the smallest damage of wet soil structure is the case of γ = 0.2 J/m2 and d = 0.7mm, as shown in Figure 12. Further analysis combined with Figure 9e shows that the wet soil with large particles and small surface energy has the farthest runout distance, because most of the soil structure of wet soil is destroyed, and it is free from the bondage of the rear particles and also has a wider impact ranges. However, the runout distance of wet soil granular flow with small particle and large surface energy when γ = 0.2 J/m2 and d = 0.7 mm is the shortest, because the whole soil structure of small particle is better combined by the adhesion of water, only a small part of the structure is destroyed during the motion process, and only a few large grain clusters are formed, as shown in Figure 9c.
In summary, we can deduce that when the grain size is the same, wet soil with large surface energy can make the soil structure more solid during the kinetic process. Moreover, when the surface energy is the same, with the increase of particle size, the structure of soil grains is not compact enough, and the cohesion between water and soil is extreme poor. Furthermore, under the same external force, soil structure is more vulnerable to damage and more grain clusters will be formed. In a real water-bearing soil landslide, the impact scope of the wet soil avalanche disasters can also be expanded.
3.2. Case 2
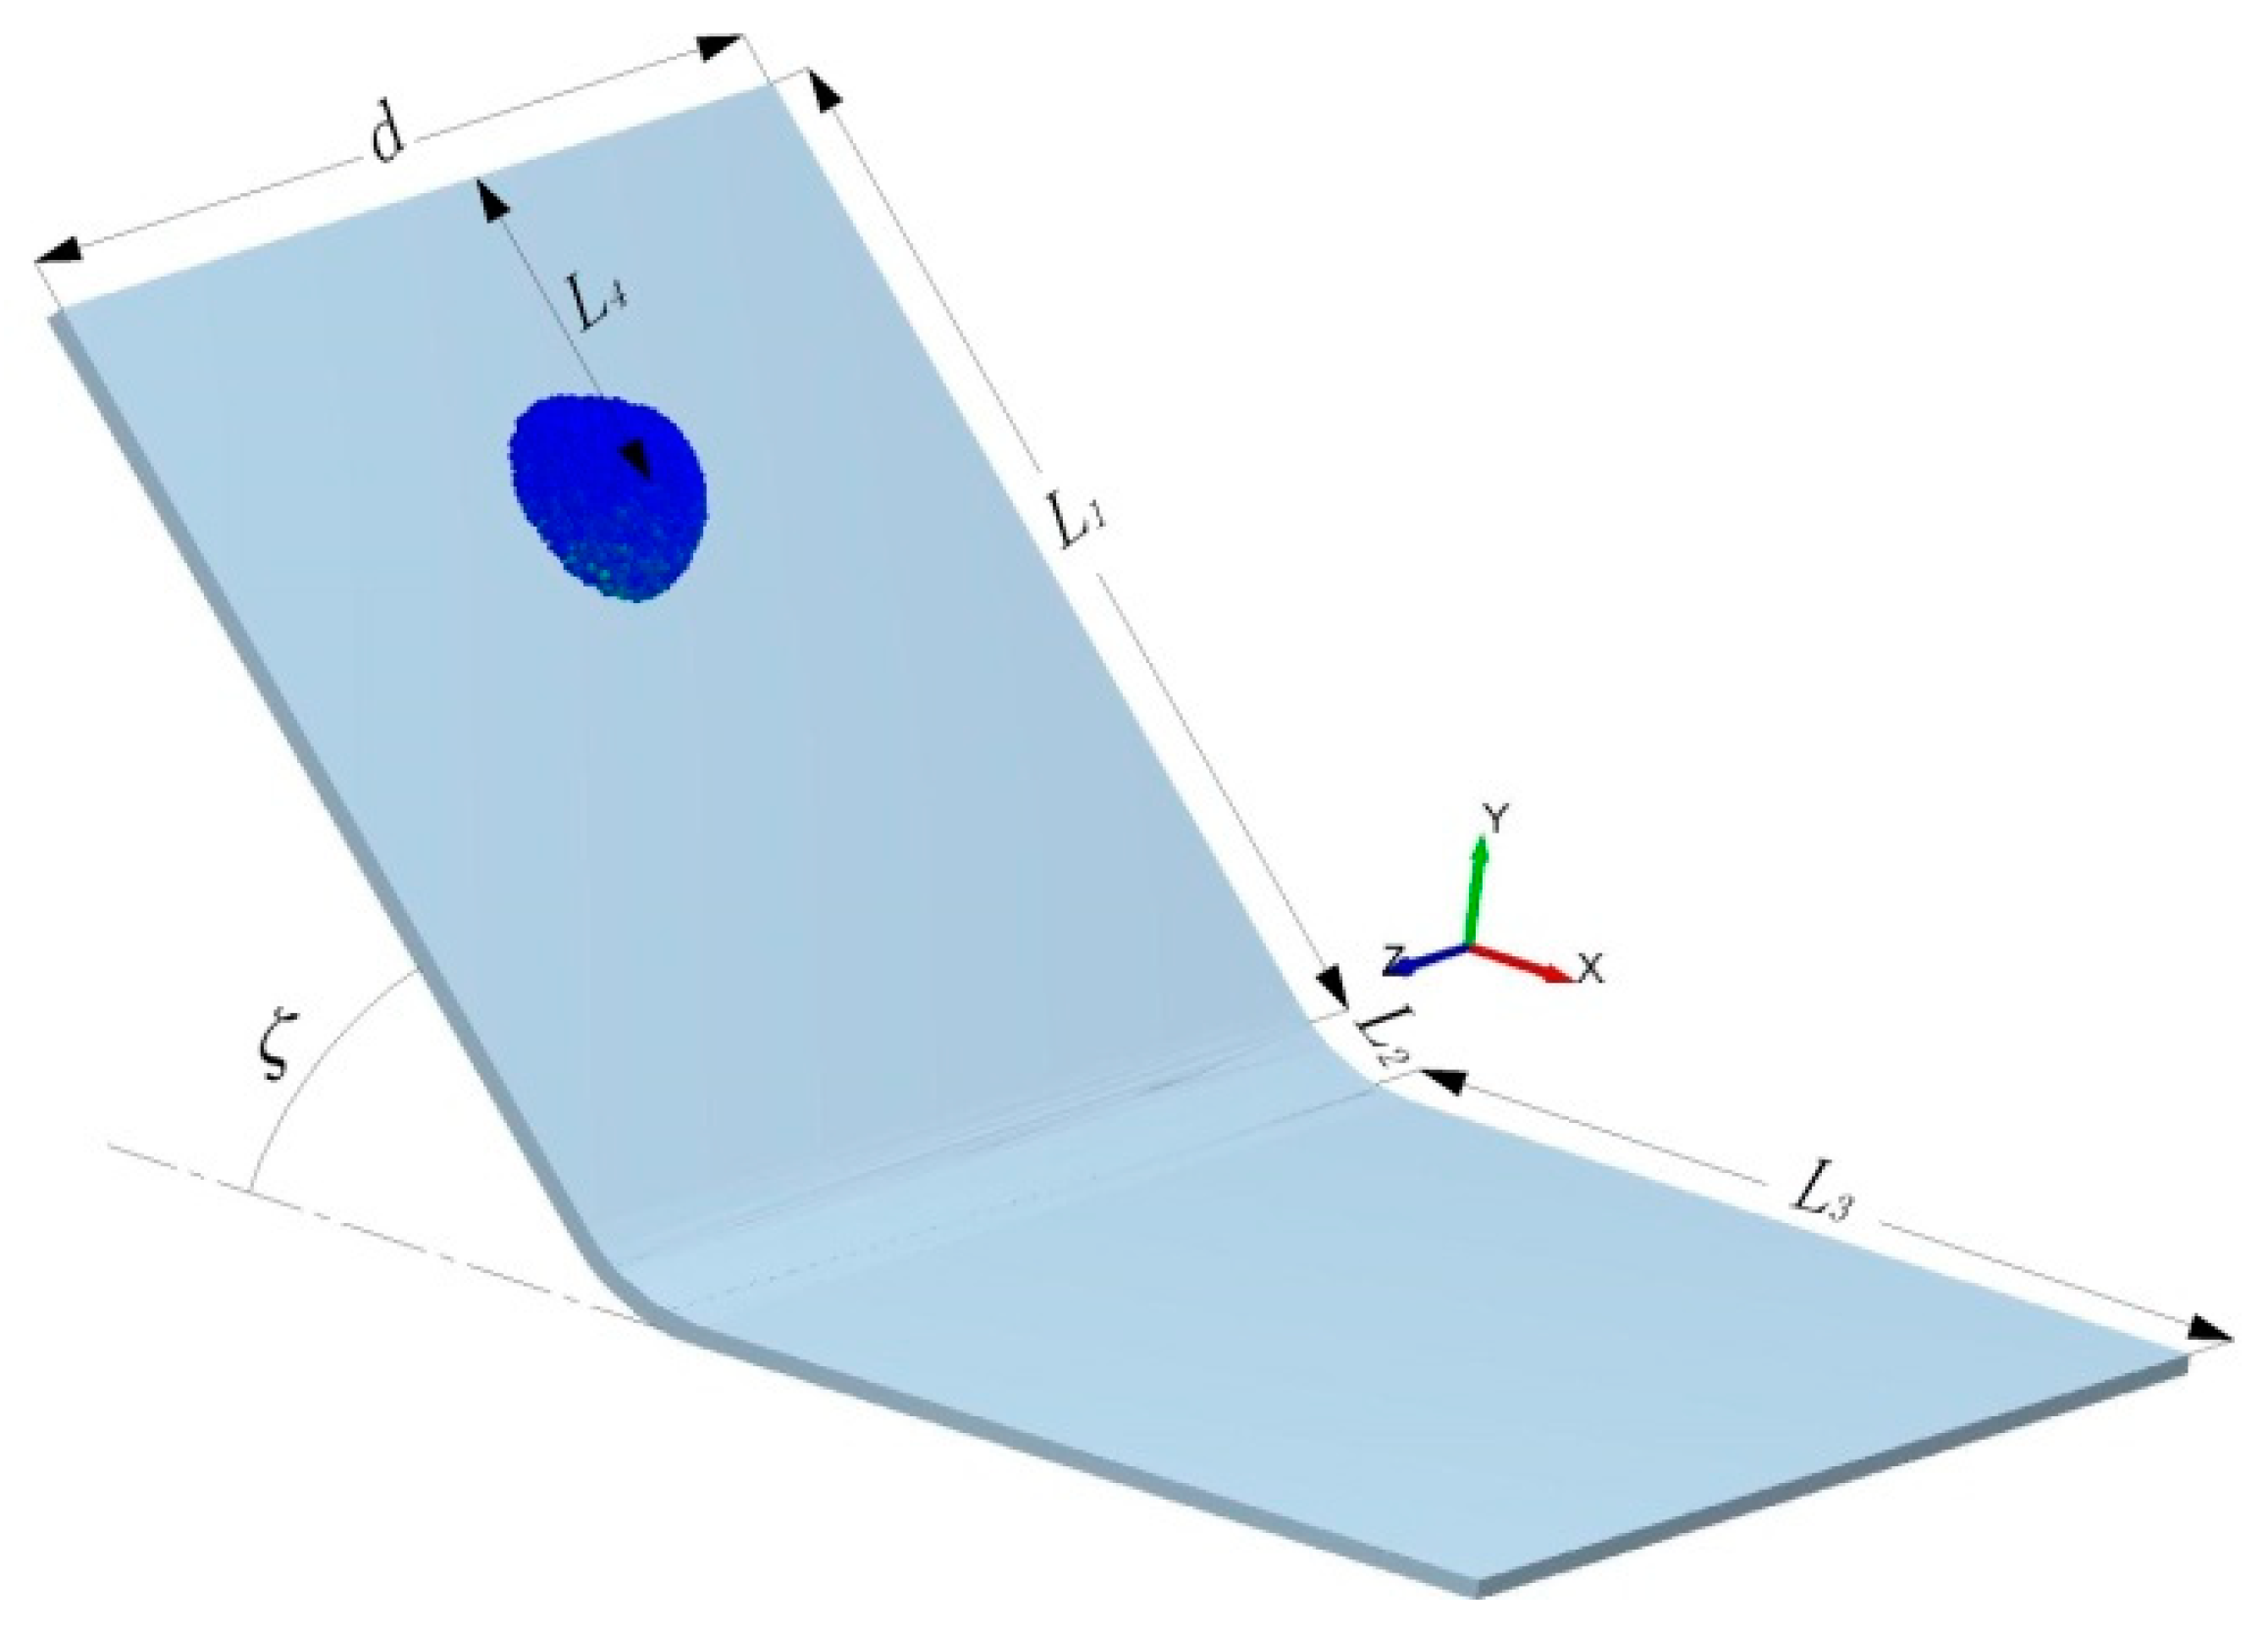
In addition, we studied the kinetic process of wet soil granular flow on other geometry, the geometric model of the chute geometry for the model tests is illustrated in Figure 15. In order to differentiate it from the geometry in Case 1, there are no baffles on both sides of the slope of the geometric model in Case 2. The wet granular flow can be freely extended to both sides during the sliding process, and the slope is also much steeper than Case 1.
The chute is divided into three parts: the upper inclined zone, the circular transition zone and the horizontal runout zone. The inclination angle ζ of the upper inclined zone is 45°. If the inclination angle is zero the chute forms a flat plane with a total length of 383 mm. The chute width d is about 220 mm. Other size information: L1 = 187.2 mm, L2 = 28.8 mm, L3 = 167 mm, L4 = 62.4 mm, the cap radius is 20 mm. The diameter of original source particles is all 1.5 mm, and the model contains 5651 particles. The bulk density is 1729 kg/m3, and the total mass is 28.96 g. The surface energy including 0 J/m2, 0.1 J/m2 and 0.2 J/m2 of the wet soil granular was calculated, which is same as case 1. The static friction coefficient between particles and the inclined plane is 0.45, and the other parameters used in case 2 are the same as Table 1.
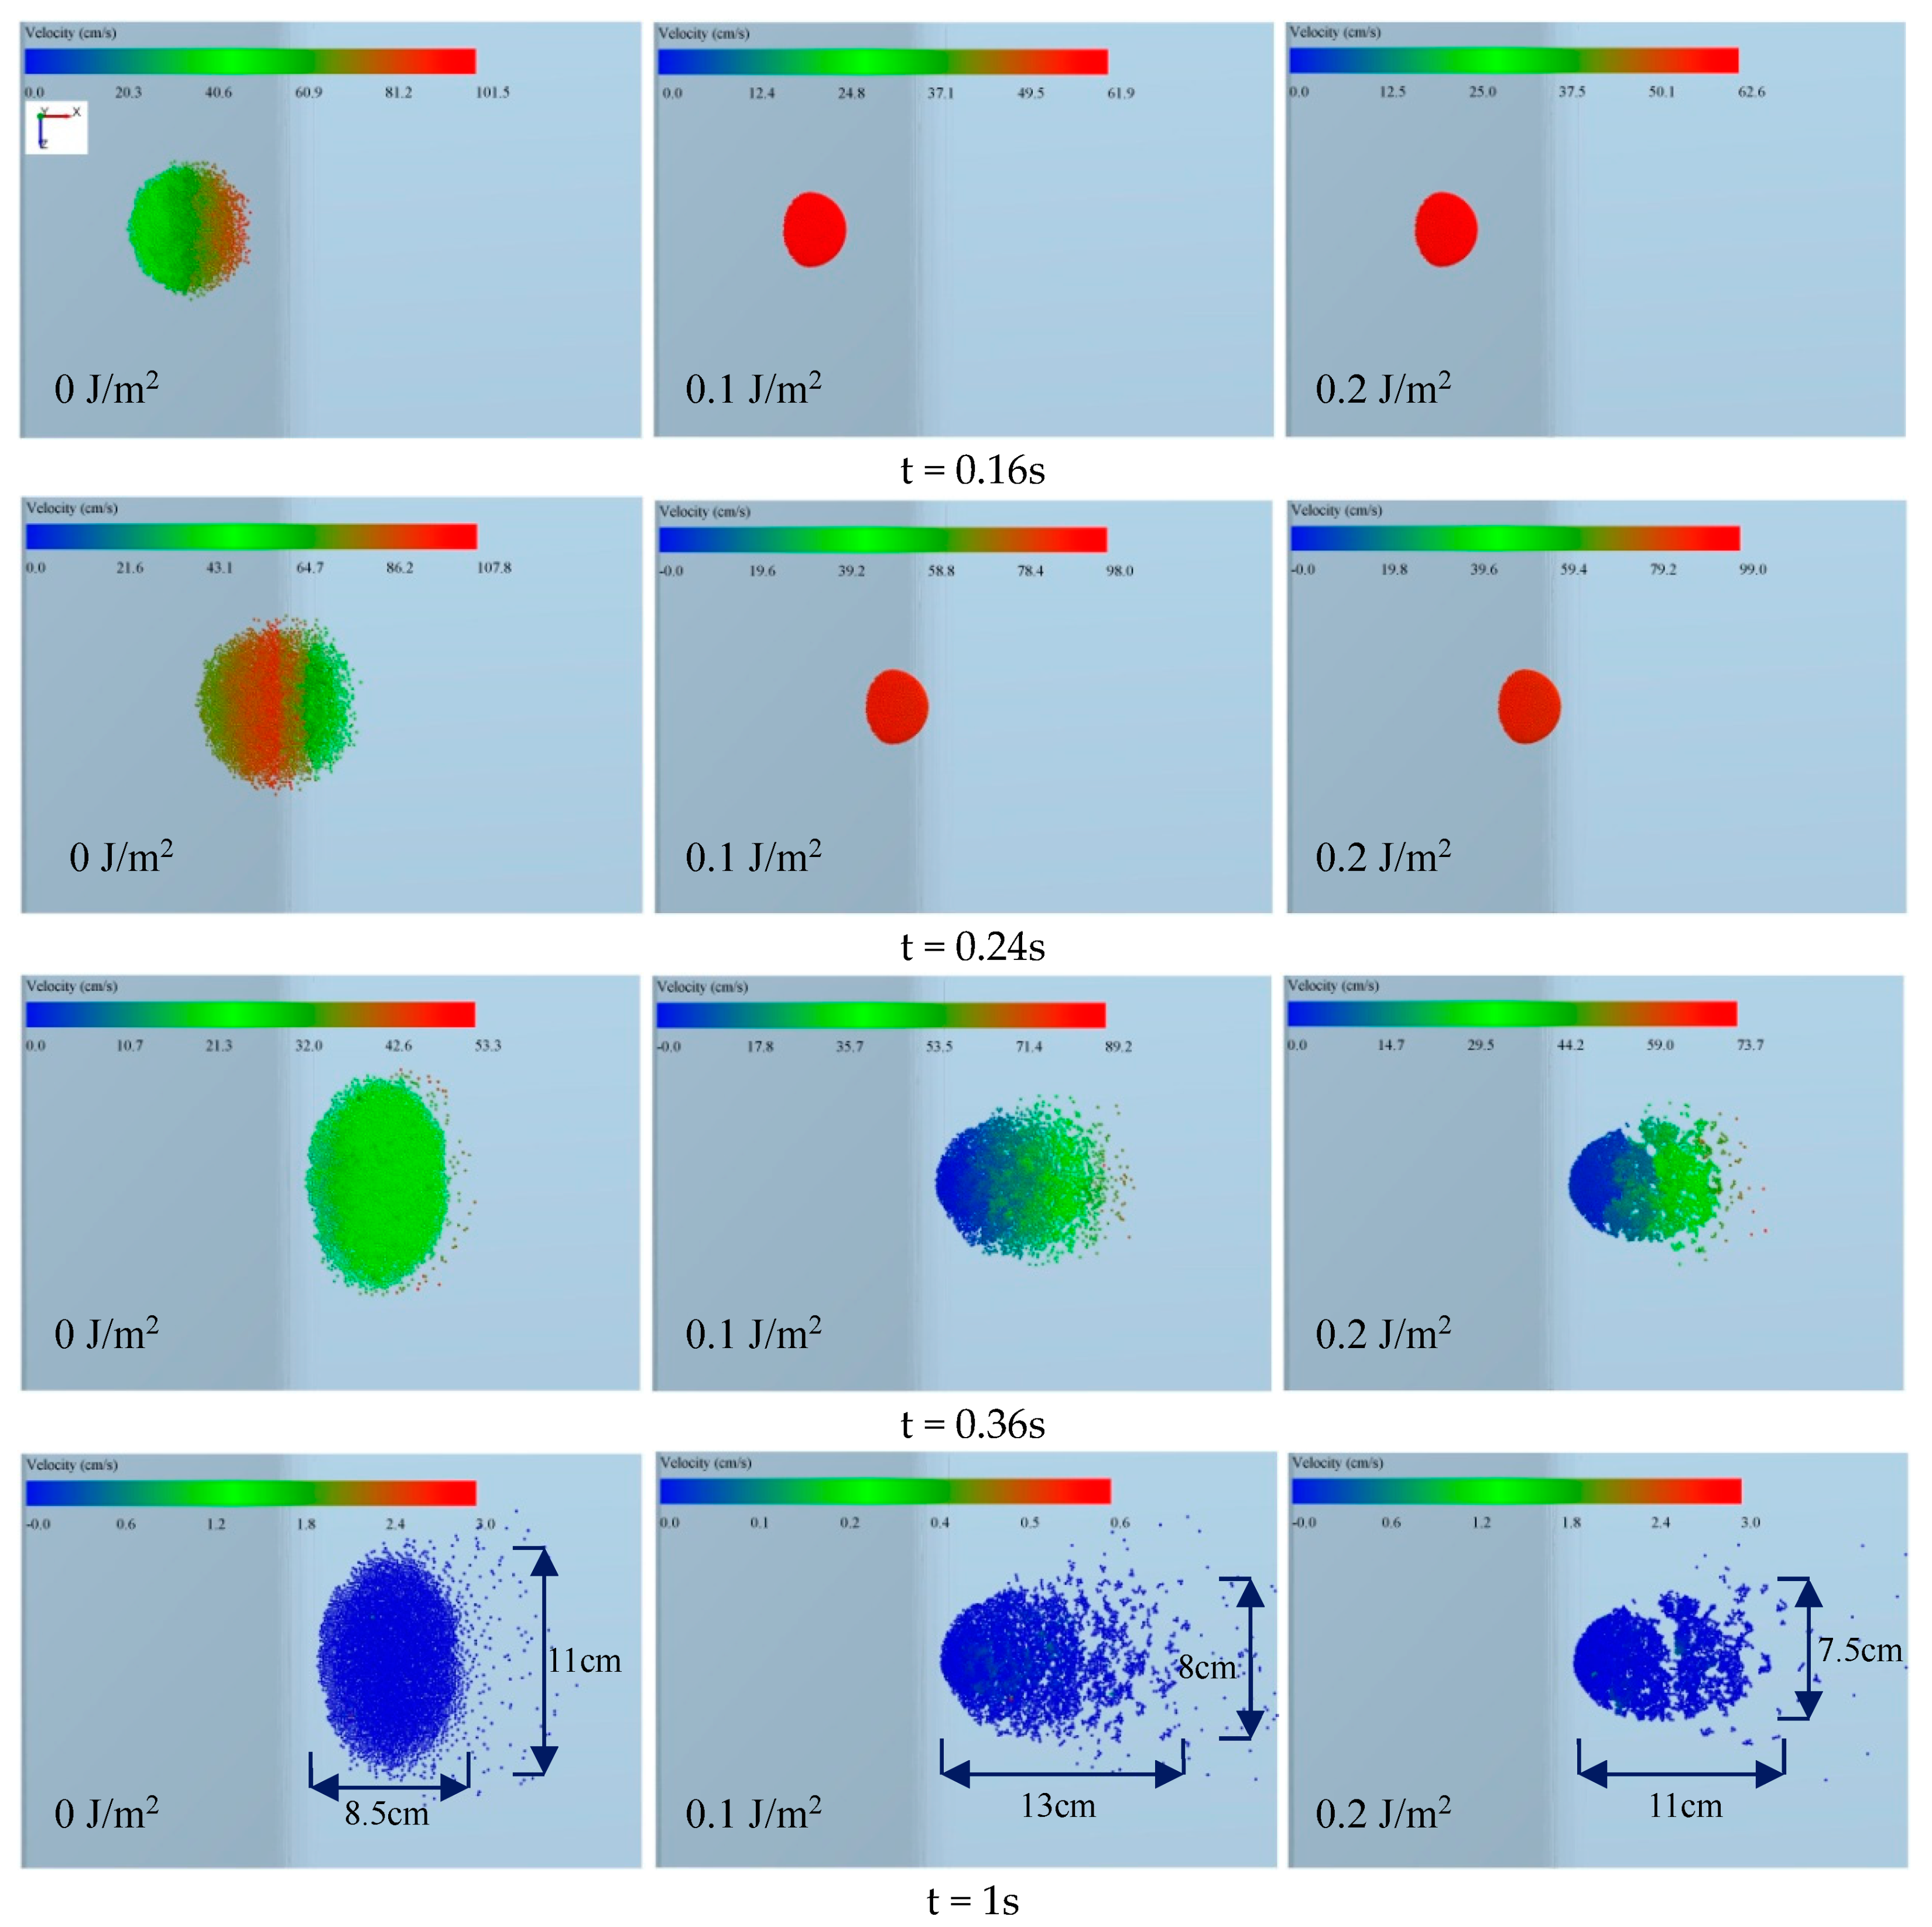
Figure 16 presents the motion process of wet soil particle flow on the 45° slope. From left to right, the calculated results including surface energy of 0 J/m2, 0.1 J/m2 and 0.2 J/m2, respectively, also diagram the velocity distribution and morphological characteristics of wet soil granular flow. According to the average velocity curve in Figure 17a, it can be deduced that the duration of wet soil granular flow with different surface energy from start to stop is basically the same for about 0.5 s.
When the surface energy is 0 J/m2, the particles of wet soil expand to both sides (Z direction) during the sliding process along the slope. The maximum velocity of granular flow exceeds 100 cm/s. In the end, when the grains deposit at the horizontal plane, the shape of the deposition is like an ellipse, with the length of 11 cm in Z direction and 8.5 cm in X direction.
In addition, when the surface energy is 0.1and 0.2 J/m2, the wet soil structure can maintain the hemispherical initial state when sliding on the slope until moves to the plane plate. Due to the action of inertia, the velocity of front particles of the moist soil is far larger than those in the rear, front particles overcome the water adhesion between grains to move forward. Moreover, runout distances of wet granular flow in X direction are 13 and 11 cm, respectively, which is far greater than dry grains of surface energy at 0 J/m2. However, the spreading distance in Z direction of wet soil granular flow on both sides is far smaller than that of dry grains, because the water adhesion between wet soil grains can prevent particles from expending to both sides, and with the increase of surface energy, the lateral extension length in Z direction decreases gradually.
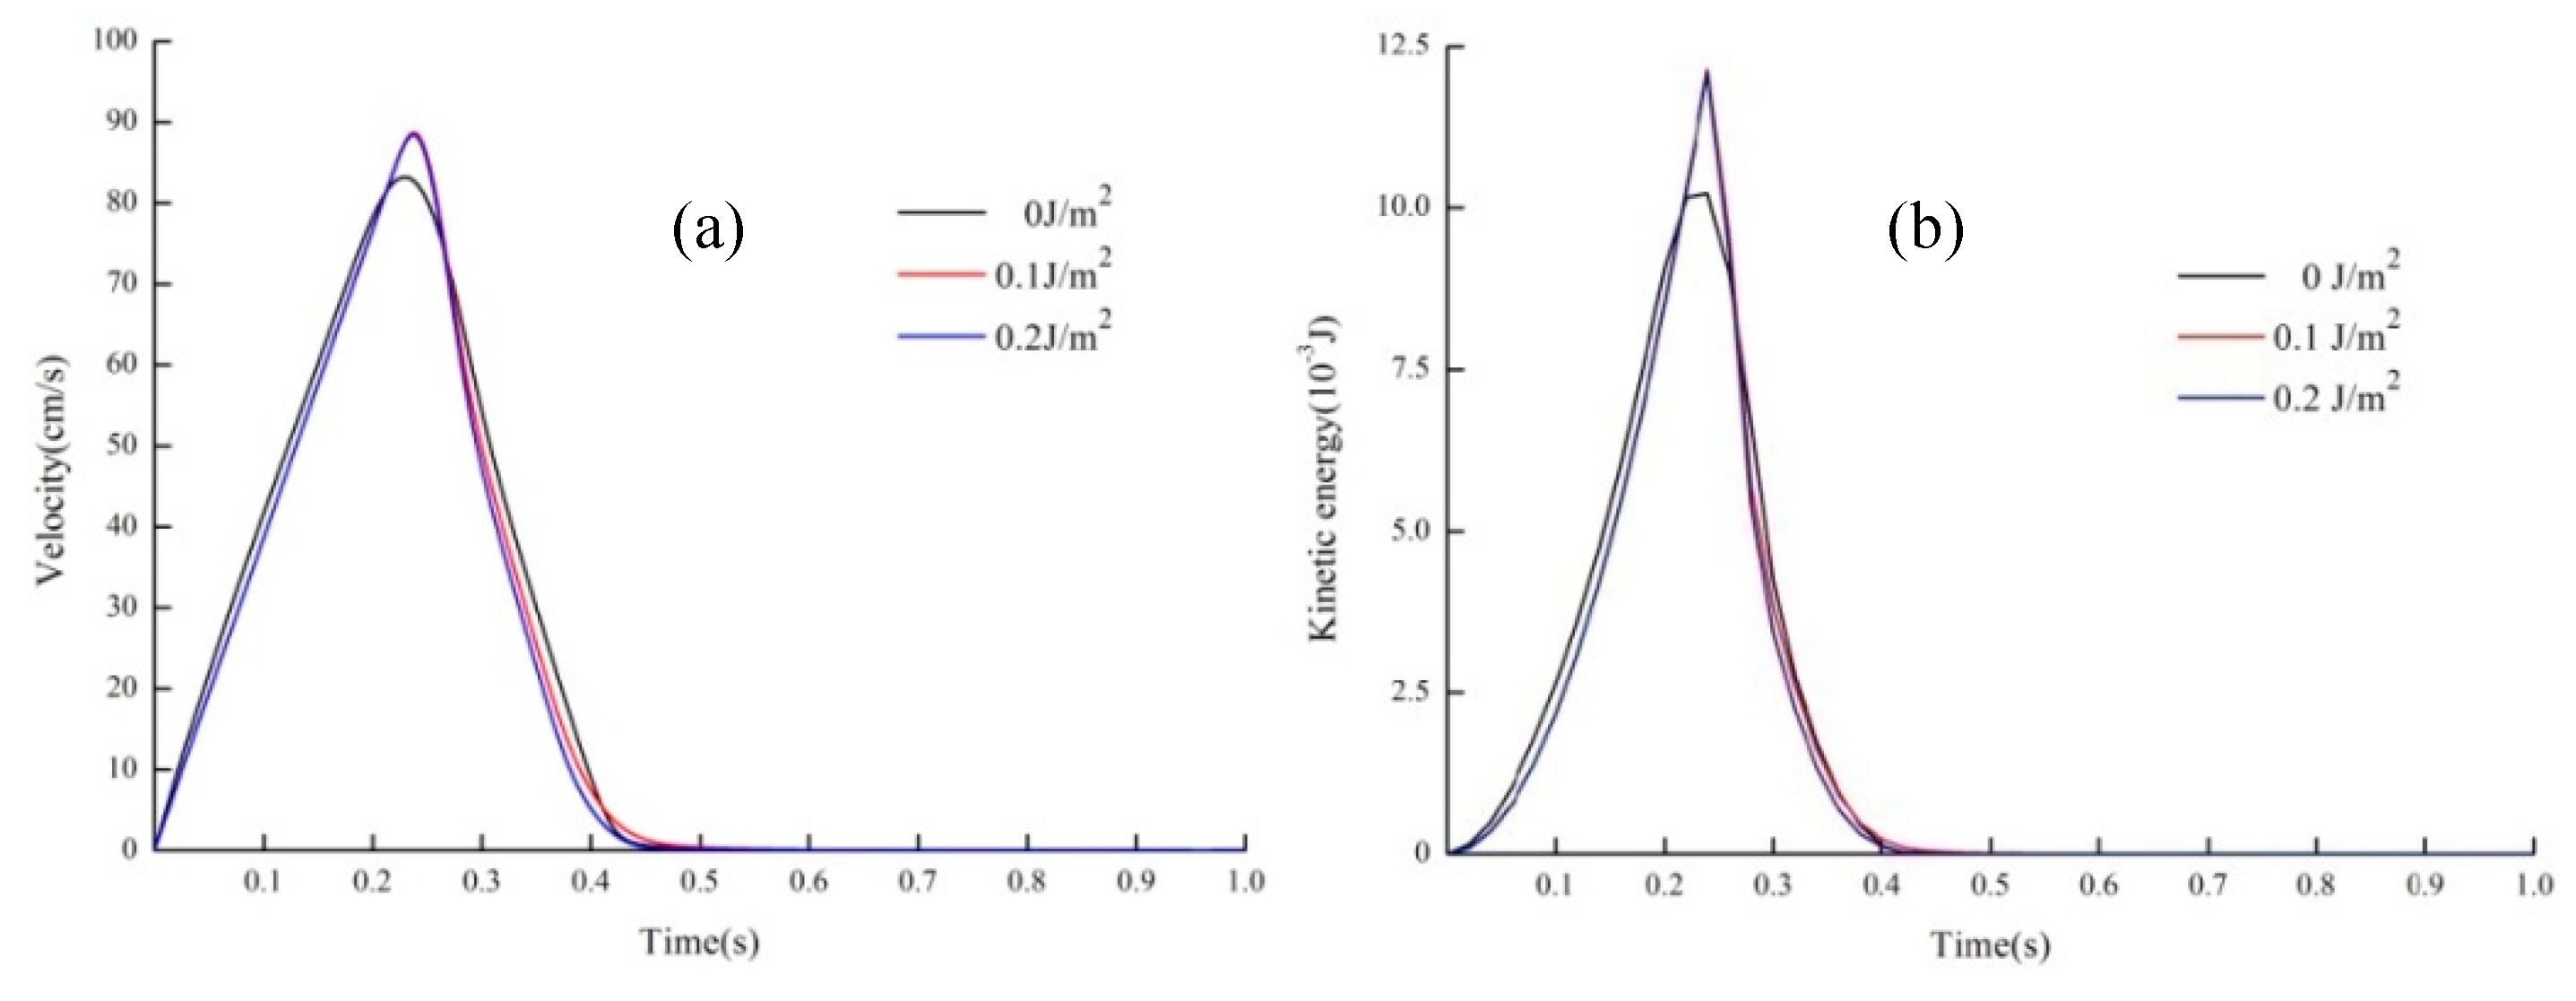
Figure 17a shows the overall sliding velocity with different surface energy, and Figure 17b indicates the total kinetic energy of the wet granular flow at the corresponding time. It is obvious to conclude that the sliding velocity of the whole soil increased first and then decreased. And finally sliding stopped after about t = 0.5 s. When the adhesive effect of water is considered, the kinetic characteristics of wet soil are almost the same. The maximum velocity of soil avalanche exceeds 90 cm/s with the corresponding time is t = 0.24 s. However, when the soil is composed of dry particles, the maximum velocity of the dry soil is 83 cm/s and the corresponding time is t = 0.22 s. Figure 17b also clarifies that the destructive force of wet particle flow is greater than that of dry particle flow when the bulk volume of original source is the same.
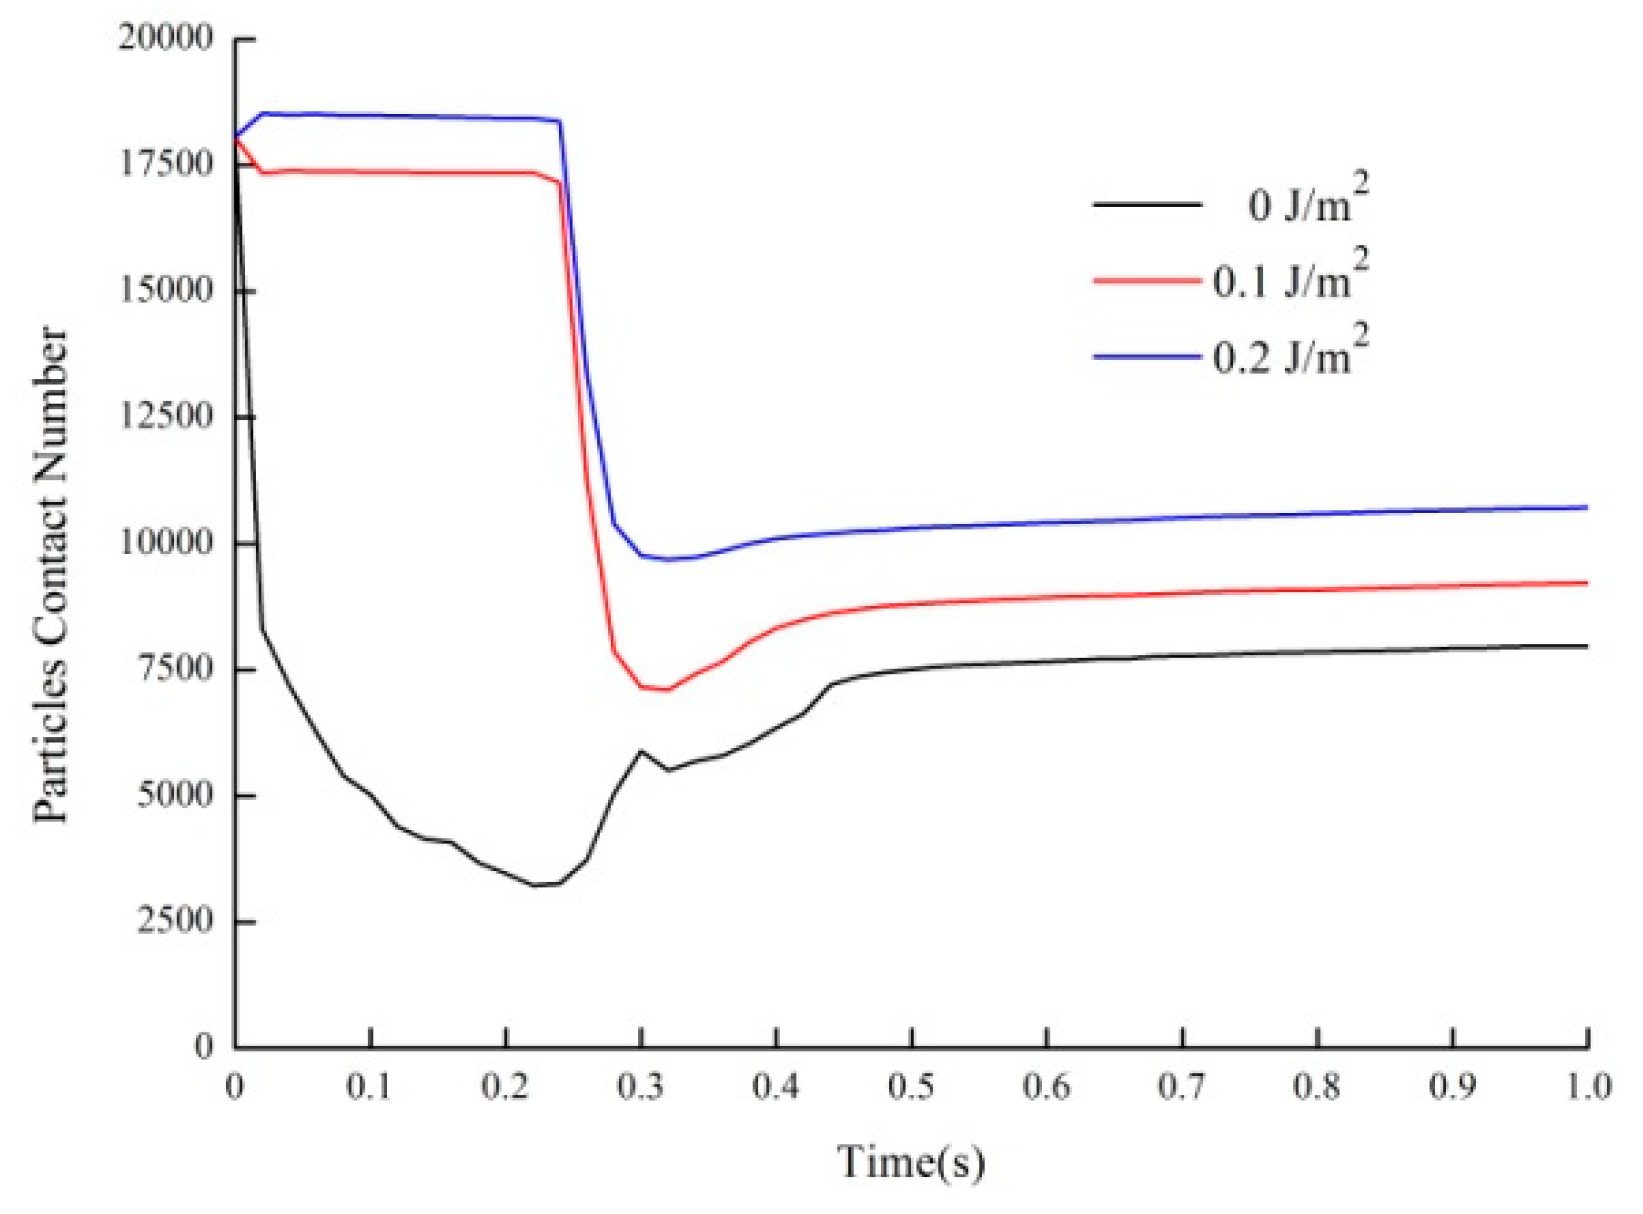
Figure 18 showsthe change of the contact number of particles during the process of wet soil avalanches with different surface energy. The contact number keeps stable from the wet soil avalanche triggered to 0.25 s when the surface energy is 0.1 and 0.2 J/m2, because the structure of the original soil remained intact when sliding on the inclined chute. Then the contact number reduced by more than a half in a very short time, then the contact number remainsunchanged until deposit on the horizontal plane.However, when the soil granular is dry with the surface energy of 0 J/m2, the number of contacts declined sharply from the beginning to 0.25 s and then the number of contacts began to increase again to 0.45 s.
4. Conclusions
In this study, a JKR-cohesion model based on 3D DEM was shown to be suitable for modeling wet soil granular flow and kinetic processes. After the DEM verification of a laboratory experiment, DEM numerical experiments wereused to replace laboratory experiments to some extent, and then we performed discrete element analysis of the impact and deposition of wet soil granular flow down an inclined chute; many numerical experiments in this paper were conducted with particular emphasis on the influences of surface energy and diameters of soil particles. A series of numerical experiments were performed to reveal the kinetic characters of wet soil granular flow with a particular focus on the sliding velocity, runout distance and interactions. A liquid surface energy coefficient kw was proposed to reflect the fluid surface tension, we also deduced the formula for calculating surface energy γ, the maximum surface energy of wet soil composed of uniform particles is 0.2 J/m2, and then the effects of particle size and surface energy on the deposit characteristics of wet soil granular flow are discussed. Also, we conclude that surface energy γ and particle size play very important roles in the kinetic characteristics of wet soil granular flow. The average velocity of dry soil is less affected by the particle size, while the particle size has a greater impact on the average velocity and total kinetic energy of wet soil avalanche.
When the wetting effect of water is taken into account and the surface energy is the same, the larger diameter of soil particles is, the larger the deposit ranges. Wet soil with larger particles requires larger liquid surface energy to maintain the soil structure intact. Furthermore, we also deduce that with the increase of particle size, the soil structure is not compact enough, and the cohesion between water and soil particles is extremely poor, which could lead to the impact scope expanding of disasters. In addition, with baffles on both sides of the inclined chute, the dry soil granular flow has longer runout distance on the horizontal plane; moreover, with the increase of surface energy, the runout distance decreased gradually. However, without baffles on both sides of the geometric model, the runout distance of wet soil granular flow is farther, though expansion to the sides is much more obvious.
This study is preliminary due to the limitation of the granular number. In the future, it is necessary to study larger volume with more particles of real water-bearing soil landslides based on JKR model. Moreover, the soils simulated in this paper are composed of uniform particles, however, most soil slopes are composed of different size particles in practical geotechnical engineering, and thus how to determine their surface energy reasonably needs further study to satisfy the need of numerical simulation.
Author Contributions
C.Z. carried out the design of the numerical experiment scheme and analysis of the methodology, analyzed the results, and participated in the writing. L.J. carried out the numerical simulations, the data treatment and analyses, and participated in the writing. X.L. carried out the analysis of the methodology and participated in the writing. X.X. carried out the numerical simulations and participated in the writing. All four authors reviewed and contributed to the final manuscript.
Funding
The research was funded by the Basic Research Funding Project of Sichuan province (Project No. 20191090633018) and Research and Application Demonstration on Overall Safety Supervision of Irrigation Area Water Conservancy Project(Project No. CSK-2018015).
Acknowledgments
The authors are grateful to Ouyang for his help to improve the paper, and he provided the topographic map.His kind efforts are gratefully acknowledged. We also gratefully acknowledge the anonymous reviewers who offered insightful suggestions that improved the manuscript.
Conflicts of Interest
The authors declare no conflict of interest.
References
- Wang, S.; Shu, A.P.; Rubinato, M.; Wang, M.Y.; Qin, J.P. Numerical simulation of non-homogeneous viscous debris-flows based on the smoothed particle hydrodynamics (SPH) method. Water 2019, 11, 2314. [Google Scholar] [CrossRef]
- Huang, R.Q. Some catastrophic landslides since the twentieth century in the southwest of China. Landslides 2009, 6, 69–81. [Google Scholar]
- Shen, T.; Wang, Y.S.; Huang, Z.Q.; Li, J.; Zhang, X.; Cao, W.Z.; Gu, J. Formation mechanism and movement processes of the Aizigoupaleolandslide, Jinsha River, China. Landslides 2019, 16, 409–424. [Google Scholar] [CrossRef]
- Zhang, Z.; He, S.M.; Liu, W.; Liang, H.; Yan, S.X.; Bai, X.Q.; Chen, Z. Source characteristics and dynamics of the October 2018 Baige landslide revealed by broadband seismograms. Landslides 2019, 16, 777–785. [Google Scholar] [CrossRef]
- Fan, X.M.; Xu, Q.; Alonso-Rodriguez, A.; Subramanian, S.S.; Li, W.L.; Zheng, G.; Dong, X.J.; Huang, R.Q. Successive landsliding and damming of the Jinsha River in eastern Tibet, China: Prime investigation, early warning, and emergency response. Landslides 2019, 16, 1003–1020. [Google Scholar] [CrossRef]
- Ouyang, C.J.; He, S.M.; Tang, C. Numerical analysis of dynamics of debris flow over erodible beds in Wenchuan earthquake-induced area. Eng. Geol. 2015, 194, 62–72. [Google Scholar] [CrossRef]
- Yang, H.Q.; Lan, Y.F.; Lu, L.; Zhou, X.P. A quasi-three-dimensional spring-deformable-block model for runout analysis of rapid landslide motion. Eng. Geol. 2015, 185, 20–32. [Google Scholar] [CrossRef]
- Iverson, R.M.; Ouyang, C.J. Entrainment of bed material by Earth-surface mass flows. Review and reformulation of depth-integrated theory. Rev. Geophys. 2015, 53, 27–58. [Google Scholar] [CrossRef]
- Savage, S.B.; Hutter, K. The motion of a finite mass of granular material down a rough incline. J. Fluid Mech. 1989, 199, 177–215. [Google Scholar] [CrossRef]
- McDougall, S.; Hungr, O.A. model for the analysis of rapid landslide motion across three-dimensional terrain. Can. Geotech. J. 2004, 41, 1084–1097. [Google Scholar] [CrossRef]
- Lu, C.Y.; Tang, C.L.; Chan, Y.C.; Hu, J.C.; Chi, C.C. Forecasting landslide hazard by the 3D discrete element method: A case study of the unstable slope in the Lushan hot spring district, central Taiwan. Eng. Geol. 2014, 183, 14–30. [Google Scholar] [CrossRef]
- Cundall, P.A.; Strack, O.D.L. A discrete numerical model for granular assembles. Geotechnique 1980, 30, 331–336. [Google Scholar] [CrossRef]
- Cundall, P.A. Formulation of a three-dimensional distinct element model-Part I. A scheme to detect and represent contacts in system composed of many polyhedral blocks. Int. J. Rock Mech. Min. Sci. 1988, 25, 107–116. [Google Scholar] [CrossRef]
- Zhou, G.G.D.; Sun, Q.C. Three-dimensional numerical study on flow regimes of dry granular flows by DEM. Powder Technol. 2013, 239, 115–127. [Google Scholar] [CrossRef]
- Lo, C.M.; Lin, M.L.; Tang, C.L.; Hu, J.C. A kinematic model of the Hsiaolin landslide calibrated to the morphology of the landslide deposit. Eng. Geol. 2011, 123, 22–39. [Google Scholar] [CrossRef]
- Mead, S.R.; Cleary, P.W. Validation of DEM prediction for granular avalanches on irregular terrain. J. Geophys. Res. Earth Surf. 2015, 120, 1724–1742. [Google Scholar] [CrossRef]
- Teufelsbauer, H.; Wang, Y.; Chiou, M.C.; Wu, W. Flow–obstacle interaction in rapid granular avalanches: DEM simulation and comparison with experiment. Granul. Matter 2009, 11, 209–220. [Google Scholar] [CrossRef]
- Tomas, J. Adhesion of ultrafine particles—Energy absorption at contact. Chem. Eng. Sci. 2007, 62, 5925–5939. [Google Scholar] [CrossRef]
- DEM-Solutions EDEMTM User Manual; DEM Solutions (USA) Inc.: Edinburgh, Scotland, 2008.
- Iverson, R.M.; Logan, M.; Denlinger, R.P. Granular avalanches across irregular three-dimensional terrain: 2. Experimental tests. J. Geophys. Res. Earth Surf. 2004, 109, F1. [Google Scholar] [CrossRef]
- Banton, J.; Villard, P.; Jongmans, D.; Scavia, C. Two-dimensional discrete element models of debris avalanches: Parameterization and the reproducibility of experimental results. J. Geophys. Res. Earth Surf. 2009, 114, 60–71. [Google Scholar] [CrossRef]
- Lin, Y.Y.; Chang, C.F.; Lee, W.T. Effects of thickness on the largely-deformed JKR (Johnson-Kendall-Roberts) test of soft elastic layers. Int. J. Solids Struct. 2008, 45, 2220–2232. [Google Scholar] [CrossRef]
- Dodaro, G.; Tafarojnoruz, A.; Sciortino, G.; Adduce, C.; Calomino, F.; Gaudio, R. Modified Einstein sediment transport method to simulate the local Scour evolution downstream of a rigid bed. J. Hydraul. Eng. 2016, 142, 1–11. [Google Scholar] [CrossRef]
Figure 1.
Spring damper system.

Figure 2.
Mutual contact model of two soft spheres.

Figure 3.
Simplified representation of contact force of soft sphere model.

Figure 4.
Photographs of particles and devices used in experiment. (a) Presents the photomicrographs of particles of the experiment with a diameter between 0.5–1mm; (b) shows the geometry of a single particle in DEM model; (c) depicts the size of origin sand bulk with a volume of 308 cm3 by DEM; and (d) indicates 2 materials distribution of the experiment, which including Formica lines at the up and down of the flume, yet the middle part of the flume with slope averaging 31.6° was lined with a custom-formed urethane insert that provided an irregular basal topography.


Figure 6.
Inclined chute DEM model of wet soil granular flow of Case 1.

Figure 7.
The total velocity of the wet soil granular flow, the (a) and (b) diagrams represent results of soil-grain diameters of 0.7 mm and 1 mm respectively.
Figure 7.
The total velocity of the wet soil granular flow, the (a) and (b) diagrams represent results of soil-grain diameters of 0.7 mm and 1 mm respectively.

Figure 8.
The total kinetic energy of wet soil granular flow, the (a) and (b) diagrams represent results of soil-grain diameters of 0.7 mm and 1 mm respectively.
Figure 8.
The total kinetic energy of wet soil granular flow, the (a) and (b) diagrams represent results of soil-grain diameters of 0.7 mm and 1 mm respectively.

Figure 9.
The final deposition of wetsoilgranular after the avalanche triggered at t = 0.8 s, (a) d = 0.7 mm, γ = 0 J/m2; (b) d = 0.7 mm, γ = 0.1 J/m2; (c) d = 0.7 mm, γ = 0.2 J/m2; (d) d = 1 mm, γ = 0 J/m2; (e) d = 1 mm, γ = 0.1 J/m2; (f) d = 1 mm, γ = 0.2 J/m2.
Figure 9.
The final deposition of wetsoilgranular after the avalanche triggered at t = 0.8 s, (a) d = 0.7 mm, γ = 0 J/m2; (b) d = 0.7 mm, γ = 0.1 J/m2; (c) d = 0.7 mm, γ = 0.2 J/m2; (d) d = 1 mm, γ = 0 J/m2; (e) d = 1 mm, γ = 0.1 J/m2; (f) d = 1 mm, γ = 0.2 J/m2.

Figure 10.
The total particles contact number of wet soil granular flow, the (a) and (b) diagrams represent results of soil-grain diameters of 0.7 mm and 1 mm respectively.
Figure 10.
The total particles contact number of wet soil granular flow, the (a) and (b) diagrams represent results of soil-grain diameters of 0.7 mm and 1 mm respectively.

Figure 11.
Diagram of normal force of wet soil sliding at the slope foot (γ = 0.1 J/m2, d = 0.7 mm).
Figure 11.
Diagram of normal force of wet soil sliding at the slope foot (γ = 0.1 J/m2, d = 0.7 mm).

Figure 12.
Diagram of normal force of wet soil sliding at the slope foot (γ = 0.2 J/m2, d = 0.7 mm).
Figure 12.
Diagram of normal force of wet soil sliding at the slope foot (γ = 0.2 J/m2, d = 0.7 mm).

Figure 13.
Diagram of normal force of wet soil sliding at the slope foot (γ = 0.1 J/m2, d = 1 mm).

Figure 14.
Diagram of normal force of wet soil sliding at the slope foot (γ = 0.2 J/m2, d = 1 mm).

Figure 15.
Geometric model of the chute geometry of Case 2.

Figure 16.
Diagrams the sliding process of wet soil granular flow.

Figure 17.
Theoverallvelocity and kinetic energy of the wet soil granular flow, (a) Overall sliding velocity; (b) Kinetic energy.
Figure 17.
Theoverallvelocity and kinetic energy of the wet soil granular flow, (a) Overall sliding velocity; (b) Kinetic energy.

Figure 18.
The total particles contact number of wet soil granular flow.


Table 1.
Material parameters used in the numerical experiments.
| Parameters’ Name | Particle-(Particle) | Chute-(Particle) | Side Plate-(Particle) |
|---|---|---|---|
| Particle Density (kg/m3) | 2600 | - | - |
| Poisson’s Ratio | 0.28 | 0.28 | 0.28 |
| Shear Modulus (MPa) | 1000 | 1000 | 1000 |
| Static Friction Coefficient | 0.30 | 0.25 | 0.25 |
| Rolling Friction Coefficient | 0.05 | 0.05 | 0.05 |
| Restitution Coefficient | 0.45 | 0.45 | 0.45 |
Table 2.
The maximum force Fpullout of the wet soil granular flow.
| Parameters | Calculated Values | |||
|---|---|---|---|---|
| d = 0.7 mm | d = 1 mm | |||
| = 60°) | = 0°) | = 60°) | = 0°) | |
| Fpullout | 8 dyn | 16 dyn | 11.4 dyn | 22.8 dyn |
© 2019 by the authors. Licensee MDPI, Basel, Switzerland. This article is an open access article distributed under the terms and conditions of the Creative Commons Attribution (CC BY) license (http://creativecommons.org/licenses/by/4.0/).
Share and Cite
MDPI and ACS Style
Zhao, C.; Jiang, L.; Lu, X.; Xiao, X. Analysis of Wet Soil Granular Flow down Inclined Chutes Using Discrete Element Method. Water 2019, 11, 2399. https://0-doi-org.brum.beds.ac.uk/10.3390/w11112399
AMA Style
Zhao C, Jiang L, Lu X, Xiao X. Analysis of Wet Soil Granular Flow down Inclined Chutes Using Discrete Element Method. Water. 2019; 11(11):2399. https://0-doi-org.brum.beds.ac.uk/10.3390/w11112399
Chicago/Turabian StyleZhao, Chuan, Linlin Jiang, Xin Lu, and Xiang Xiao. 2019. "Analysis of Wet Soil Granular Flow down Inclined Chutes Using Discrete Element Method" Water 11, no. 11: 2399. https://0-doi-org.brum.beds.ac.uk/10.3390/w11112399
Note that from the first issue of 2016, this journal uses article numbers instead of page numbers. See further details here.