1. Introduction
Climate change is a major factor affecting watershed hydrological cycle that causes natural disasters such as flood and drought resulting in large-scale damage of human life and economic loss [
1]. The exacerbation of seasonal rainfall in a changing climate may have profound effects on water resource systems and many attempts have been exercised to quantify drought. The Intergovernmental Panel on Climate Change (IPCC) fifth assessment report [
2] predicted that global average temperature would increase by 4.8 °C in 2100 in the case of business as usual greenhouse gas emissions. Particularly in South Korea, the average temperature is expected to increase up to 6 °C in 2100 compared to the present status. The changes will bring out significant influences on hydrologic behavior and it is necessary to predict and evaluate the effects of seasonal big variation on hydrologic environment and the water resources management [
3,
4,
5].
Drought can be occurred depending on climatic characteristics and the water supply capacities from meteorological to agricultural, hydrological, and socioeconomic droughts [
6]. The impact of climate change and drought are closely interrelated. Climate change is expected to increase the frequency and severity of droughts in some regions [
7,
8,
9]. During the 20th century, South Korea has suffered severe drought with interval of 6 to 7 years. However, since 2000, the drought has been occurred 12 times and consecutively occurred from 2013 to 2018. Although the government has equipped the dam infrastructures to supply agricultural, municipal, and industrial water demands under the national economic development plan since 1965, the recent meteorological drought is threatening the safe water supply. The present dam operation by the frequent drought phenomena is now our challenge to overcome and should be adjusted by preparing the risk management of drought.
There are many future climate change scenarios of Global Circulation Models (GCMs) and Representative Concentration Pathways (RCPs). The Coupled Model Inter-comparison Project 5 (CMIP5) climate models have been used in South Korea because they consider Asian–Australian monsoon climate factor [
10]. Many studies have studied the climate change impact on future dam inflow from watershed [
11,
12,
13,
14,
15]. Studies of dam water supply satisfying water demands under future dam inflow and release conditions are necessary. The future dam water storage failure potential evaluation is necessary to observe how much the dam water supply is vulnerable to future coming droughts.
The impacts of climate change on water resources management has been studied with global, national, and regional scales [
16,
17,
18]. The challenge considering dam water supply condition is to evaluate and quantify the water supply performance considering dam water uncertainties. One of the widely used water supply safety measures was introduced by Hashimoto et al. [
19] with the 3 measures of reliability, resilience, and vulnerability. In the study, each criterion represents different performance of water supply behavior and they complement each other in understanding water supply safety. The 3 measures have been studied for water resources system design. Hurst [
20], Matalas and Fiering [
21], Moy et al. [
22], and Vogel and Bolognese. [
23] studied the parametric rules of measures performance and evaluated the dam water supply safety.
The semi-distributed physically based hydrologic model, Soil and Water Assessment Tool (SWAT) developed by the USDA-ARS (Agricultural Research Service) has been used to evaluate the impact of future climate change on watershed hydrology [
24,
25,
26,
27,
28]. The SWAT has dam release simulation option using target release. The target release approach was applied in some studies to reflect reservoir operation [
29,
30].
This study is to evaluate the water supply safety of multipurpose dam applying future climate change conditions with SWAT. To reflect the future dry climate change, the Standardized Precipitation Index (SPI) and Runs theory were applied to determine dry scenarios from CMIP5 RCP 4.5 and 8.5 scenarios. Before future evaluation, the SWAT was calibrated using the observed dam inflow, release, and dam water storage data. The present target release of the dam was used for future dam release pattern. The future dam water supply safety through the 3 measures were estimated under the future potential drought scenarios.
2. Materials and Methods
2.1. Study Area Description
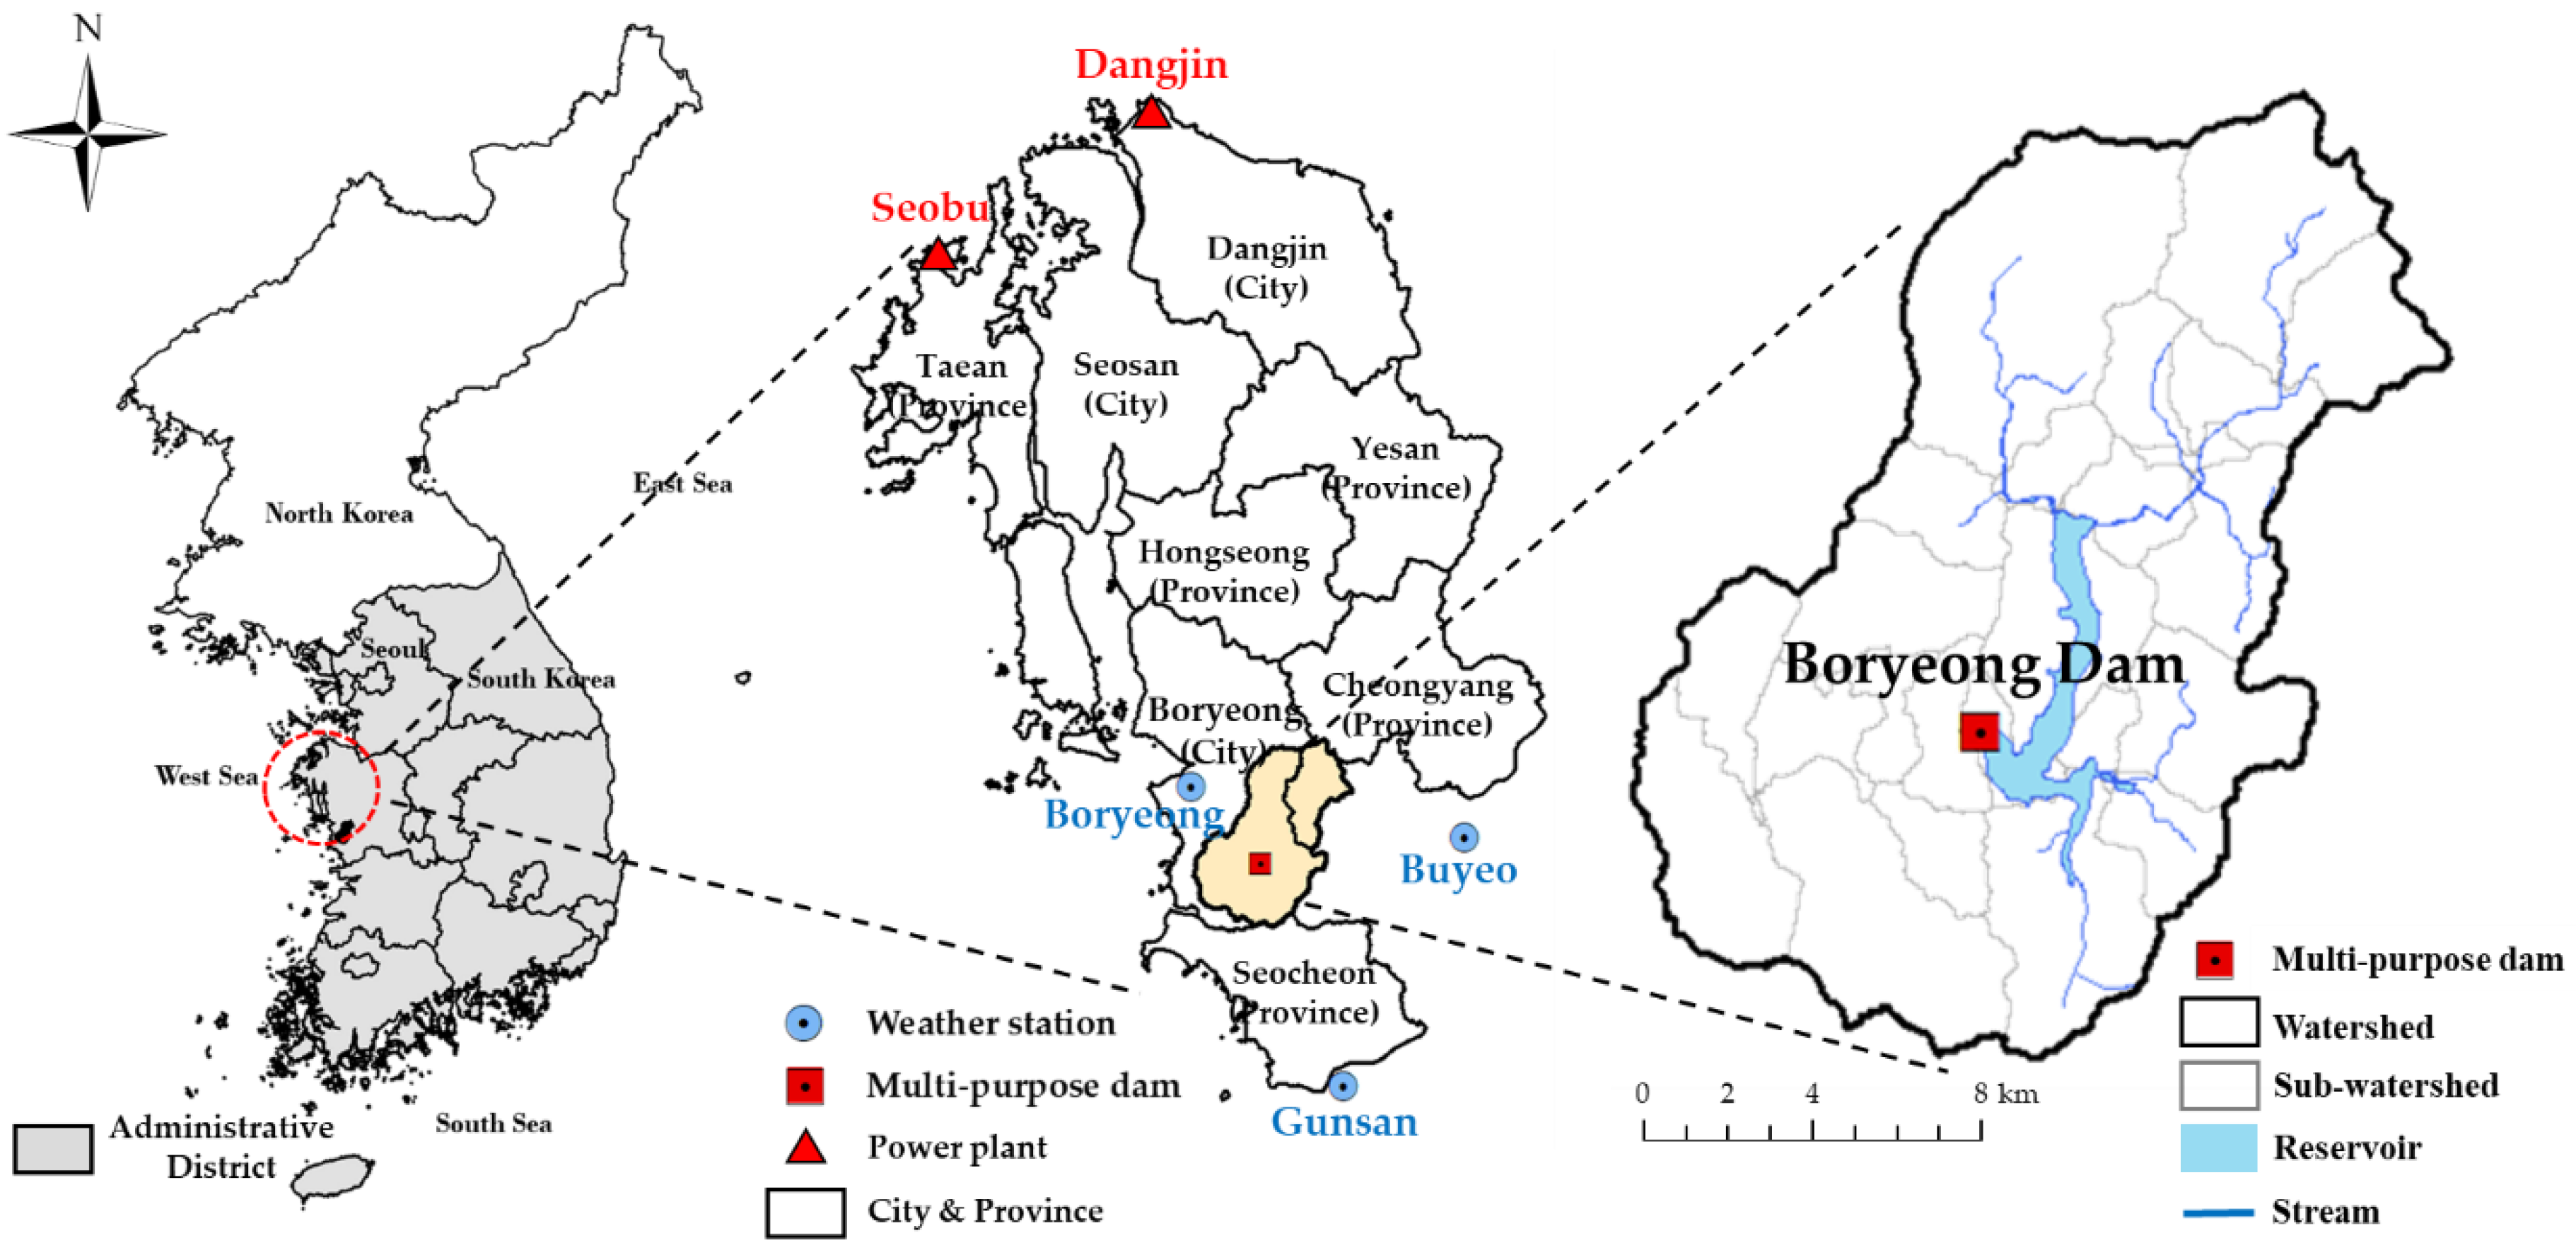
Figure 1 shows the Boryeong Dam located in the mid-west region of South Korea. The dam is 50 m height and has 108.7 × 10
6 m
3 of effective storage capacity with 163.6 km
2 watershed area. The Korea Water Resources Corporation (K-water) supplies municipal and industrial waters to three cities (Boryeong, Seosan, Dangjin), five counties (Seocheon, Cheongyang, Hongseong, Yesan, and Taean) and two electrical power plants (Dangjin and Seobu).
The dam watershed suffered severe meteorological droughts for 3 years (2015–2017) with average precipitation of 783.8 mm/year, approximately 60% of 40-year (1976–2015) average precipitation (1188 mm/year). The dam storage rate was about 47.5% at the beginning of 2015 but fell below 20% in September 2015 due to the lack of summer rain (June to August) and no autumn typhoon. By the continuing rainfall deficit, the dam storage rate reached 7.5%, the lowest value since the dam operation in 1998. This long period of drought caused the first restriction of municipal water supply from multipurpose dam operated by central government in South Korea. The government solved the suffering problem by installing water transfer pipelines from neighbour watershed stream.
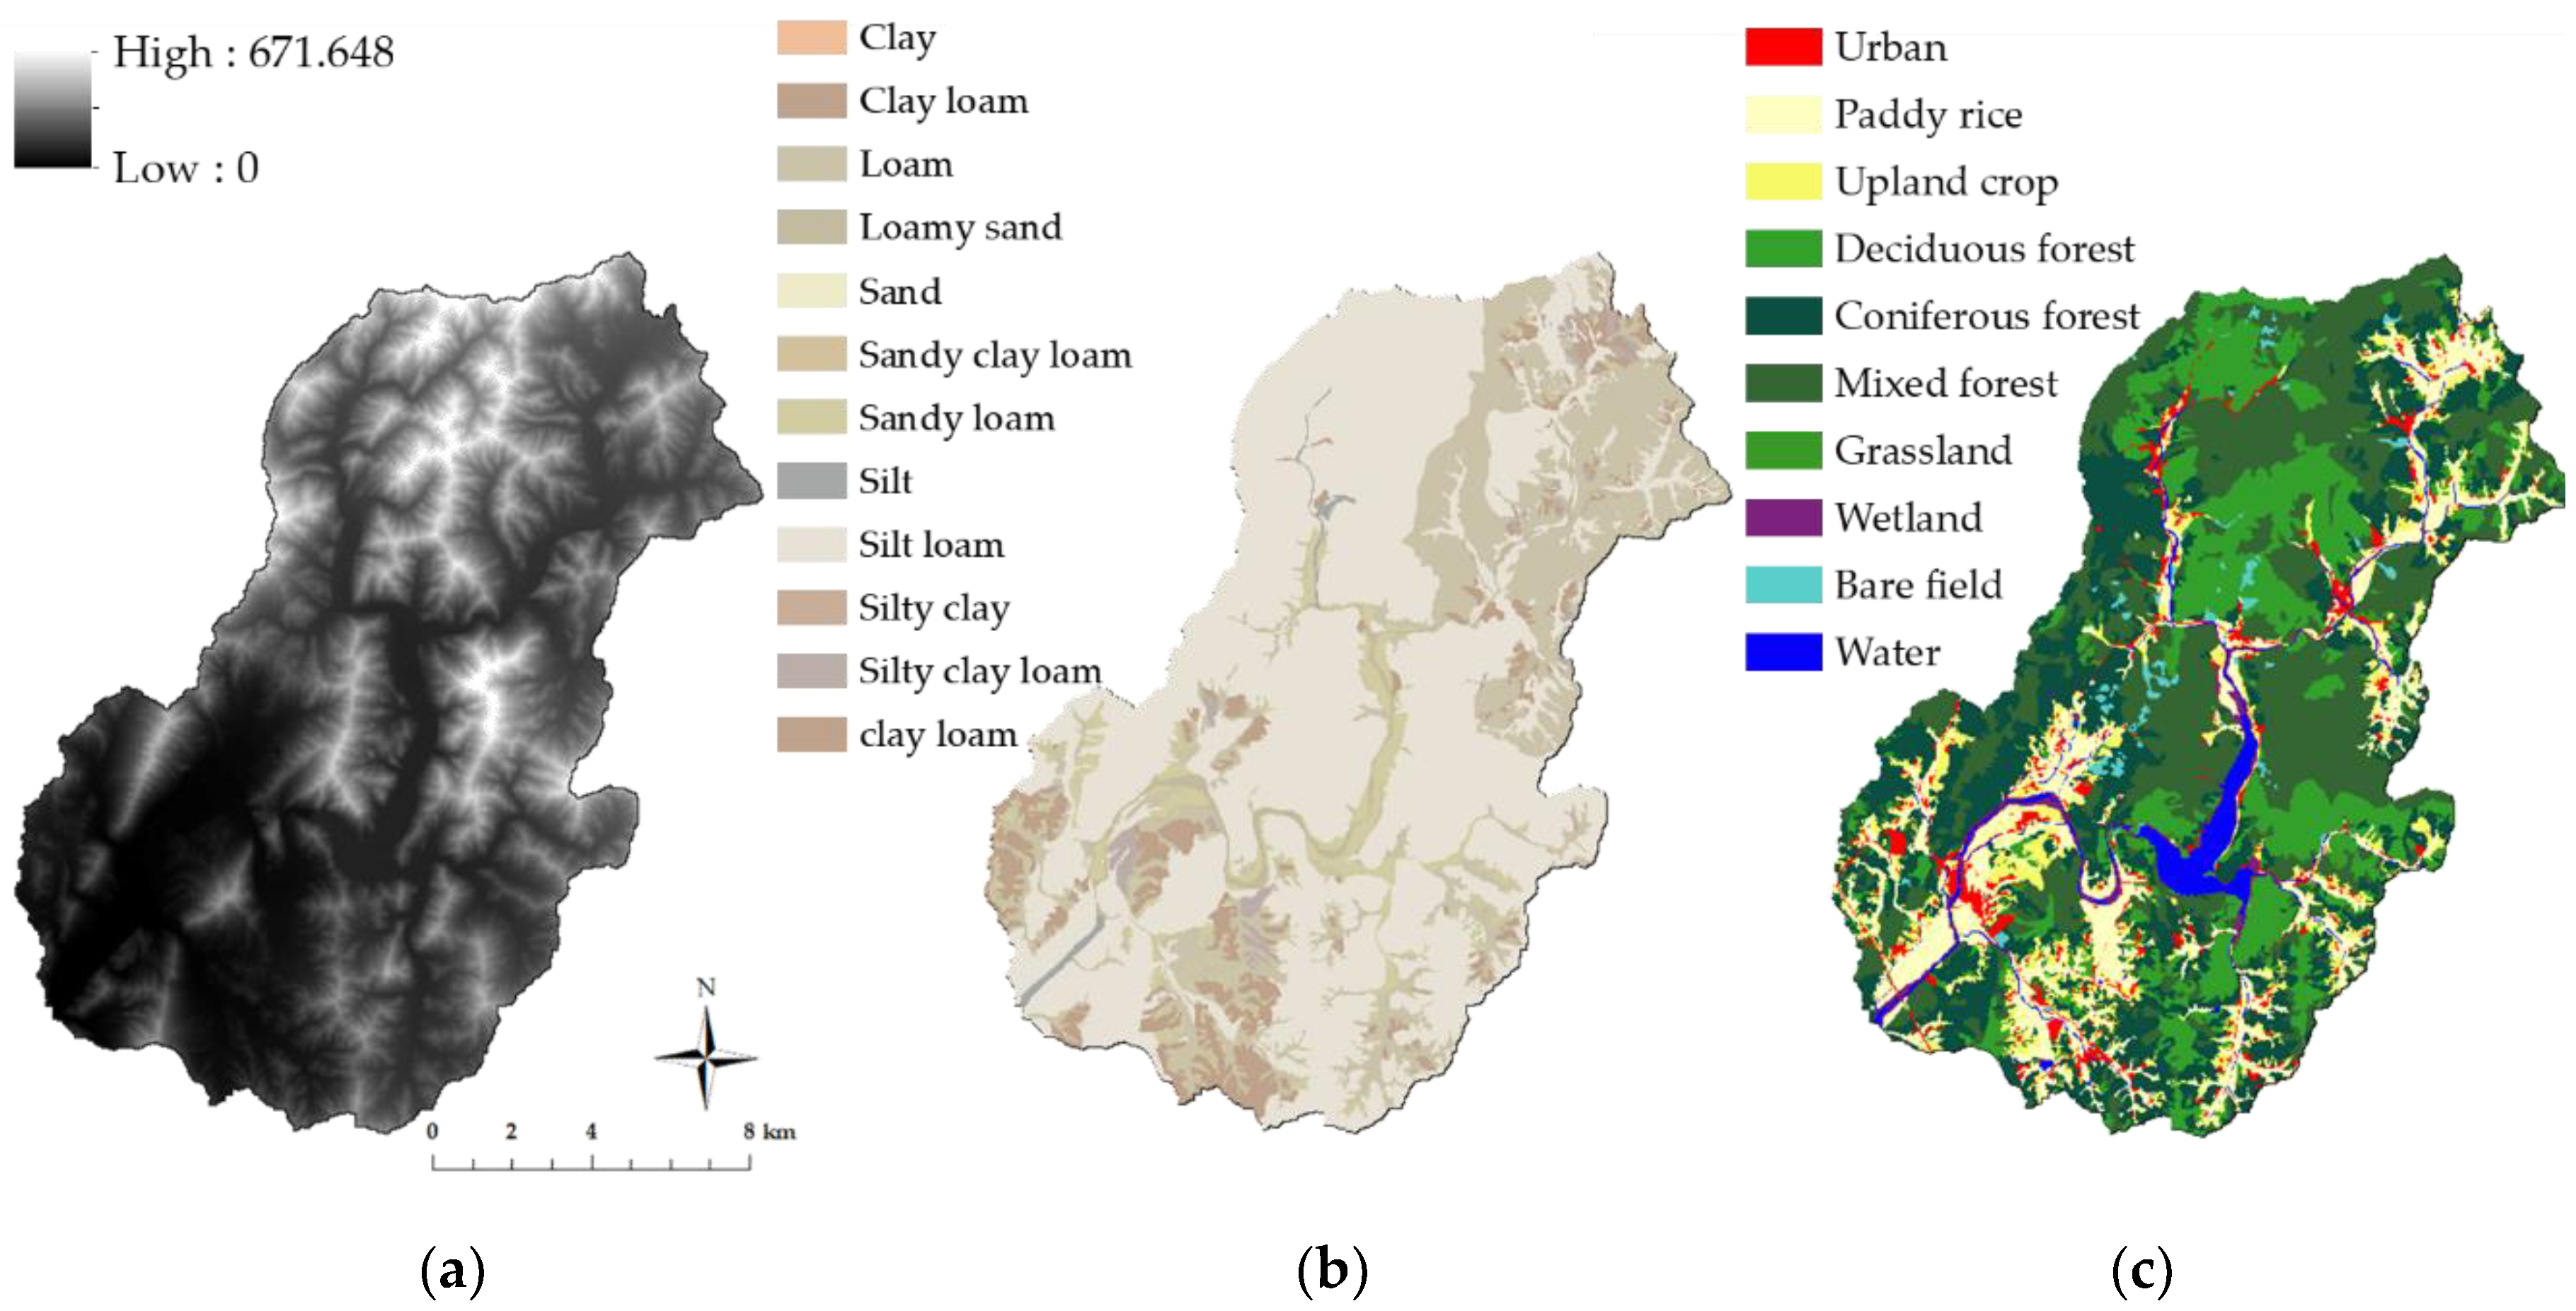
Figure 2 shows the elevation, soil texture, and land use of the dam watershed. Forest covers 71%, and rice paddy and upland crop areas occupies 12%. Silt loam and loam are the dominant soil types with 62% and 22% respectively.
6 years (2002–2007) of daily weather data including precipitation (mm), maximum and minimum temperatures (°C), wind speed (m/s), relative humidity (%), and solar radiation (MJ/m
2) were collected from 3 weather stations: Boryeong, Gunsan, and Buyeo (
Figure 1) for SWAT modelling.
2.2. SWAT Model Description
SWAT is a watershed hydrology and water quality evaluation model developed to quantify the impact of land management practices [
14]. The model operates by dividing the watershed into sub-watersheds with each sub-watershed being connected to stream channels. Sub-watersheds are further divided into Hydrological Response Units (HRUs) which are portions of a sub-watershed that possess unique land use, management, and soil attributes [
31]. The simulation of the hydrological cycle is based on the water balance equation as follows:
where
is the final soil water content (mm water);
is the initial soil water content of day
(mm water);
t is the time (days);
is the amount of precipitation in day
(mm water);
is the amount of surface run-off in day
(mm water);
is the amount of evapotranspiration in day
(mm water);
is the amount of water entering the vadose zone from the soil profile in day
(mm water); and
is the amount of return flow in day
(mm water).
The water balance for dams or floodgates considers inflow, outflow, precipitation, evapotranspiration, and seepage. The equation is expressed as:
where
V is the water storage in the reservoir at the end of each day;
Vstored is the volume of water stored in the reservoir at the beginning of a day;
Vflow in and
Vflow out are the volumes of water entering and flowing out of the reservoir throughout a day, respectively; and
Vpcp,
Vevap, and
Vseep are the volumes of precipitation falling into the reservoir, the water removed by evaporation and the water lost by seepage, respectively.
SWAT has four available dam release (
Vflow out) options: Daily measured outflow, monthly measured outflow, annual average release, and target release. Among these options, the target release approach was adopted. Although the method is simplistic and cannot account for all decisions, it can realistically simulate major outflows. For the target release approach, the reservoir outflow is calculated as follows:
where
is the volume of water flowing out of the water body during the day (m
3 H
2O),
is the volume of water stored in the reservoir (m
3 H
2O),
is the target reservoir volume for a given day (m
3 H
2O) and
is the number of days required for the reservoir to reach the target storage.
2.3. Selecting Future Dry Scenarios
The selection of a GCM is very important when carrying out studies on watershed hydrology and the related water resource facilities. GCM assessment results are sensitive and carry uncertainty into the study, especially for studies of future drought conditions. To overcome the inability to properly validate a given GCM scenario, this study tried to select the appropriate GCMs for predicting future drought likelihood. The Coupled Model Inter-comparison Project (CMIP) Phase 5 proposed 4 representative concentration pathways (RCP) considering economic growth rate, industrialization and restoration technology. In this study, we adopted the RCP 4.5 and 8.5 scenarios and tested 26 GCMs (
Table 1) to select the dry scenarios by applying the SPI and Runs theory.
The SPI developed by McKee et al. [
32] is an indicator of meteorological drought which quantifies the precipitation deficit with multiple time scales from 1 month to 48 months, with categories of near normal (+0.99 ~ −0.99), moderately dry (−1.0 ~ −1.49), severely dry (−1.5 ~ −1.99), and extremely dry (below −2.0). The SPI for drought in South Korea has been studied [
33,
34,
35], and the results show that SPIs at 3 and 6 months (SPI-3 and SPI-6) are suitable for representing the spring agricultural drought from March to May and the hydrologic drought extending over the next three months. These droughts affect reservoir storage and withdrawals from streamflow, as well as the socioeconomic drought via the limited municipal and industrial water supplies [
36]. In this study, SPI-6 was selected to consider the reservoir storage deficit and the resulting limited water supply from the dam.
The Runs theory was proposed to evaluate drought parameters and observe their statistical results in the distribution of water deficits. The parameters are derived below a truncation level, which may be constant or a function of time. In this study, the theory was applied to quantify the degree of water supply failure in future climate scenarios. Three indices (drought severity, duration, and magnitude) were used in the quantification. They represent the different characteristics of water supply failure. The general expression of each index is as follows:
where
M is the magnitude;
S is the severity, which is the sum of
SRSi in the study period;
D is the duration, which is the number of days of one deficit event where the criterion is continuously smaller than the truncation level;
SRSi is the difference between the
truncation level and the
criterioni; the
truncation level is the SPI value at which severe drought begins; and the
criterioni is the SPI value of the
ith day.
Using 26 GCMs, the future dry scenarios were selected using the following three steps. First, the three parameters (magnitude, duration, and severity) of Runs theory corresponding to each scenario were calculated using the SPI at 6 months. Second, the parameters were transformed into cumulative distribution functions in the 0 to 1 range (because their units are not dimensionally consistent). Third, the parameters were summed and ranked assuming that each parameter had equal weight for affecting dryness.
2.4. Measures of Dam Water Supply Safety
Hashimoto et al. [
19] suggested three metrics for evaluating the possible performance of water resource systems: Reliability, resilience, and vulnerability. Reliability describes how likely a system is to fail; resilience refers to how quickly a system recovers from failure; and vulnerability refers to how severe the consequences of failure may be. Furthermore, there are additional methods for evaluating the sustainability of water resources systems.
Reliability is the probability or frequency of success in a system. Time-based and occurrence-based reliability were evaluated in the study. The difference between the two measures is the time-step consideration. Time-based reliability counts the number of days that the system was in a satisfactory state during the study period, and occurrence-based reliability considers the number of years. A general expression for estimating reliability is:
where
RT is reliability,
t = 1 …,
T is a simulated time series, and
Zt is a state variable which equals 1 when the system is in a satisfactory state and 0 when the system is in an unsatisfactory state. The system is in an unsatisfactory state when the dam storage is lower than the pre-determined dam water level, otherwise the system is in a satisfactory state.
Resilience describes how quickly the system can recover from an unsatisfactory state within a given time period. If the failure recovery is slow and prolonged, it implies that re-examination of the dam performance should occur so that the system can recover rapidly after failure. The general equation for resilience is:
where
Rs is resilience,
T is the total duration of the study period, and
Wt is a transition indicator which has a value of 1 when the system is in an unsatisfactory state in the
tth time-step and transitions to a satisfactory state in the
t + 1th timestep. Otherwise,
Wt is 0.
Vulnerability represents how severe the results of failure are. It is expressed as follows:
where
V is vulnerability,
Xt is the dam storage at the
tth time-step,
C is the low water level of the target dam, and
Ji, …,
JN are periods of unsatisfactory states.
3. Results and Discussion
3.1. SWAT Calibration and Validation
SWAT was calibrated (2002–2004) and validated (2005–2007) using the daily observed dam inflow and storage data. The hydrological parameters of the SCS curve number, soil evaporation compensation coefficient, maximum canopy storage, delay time for aquifer recharge, and baseflow recession constant were calibrated for dam inflow, hydraulic conductivity of the reservoir bottom, and lake evaporation coefficient for dam storage.
Table 2 shows the summary of the SWAT calibrated parameters. The important parameters were surface runoff CN2, evapotranspiration ESCO, baseflow GW_DELAY, GWQMN, and ALPHA_BF. Seven reservoir parameters (RES_ESA, RES_EVOL, RES_PSA, RES_PVOL, RES_VOL, RES_K, and EVRSV) were calibrated.
Table 3 shows the statistical summary of SWAT calibration and validation results for dam inflow and storage.
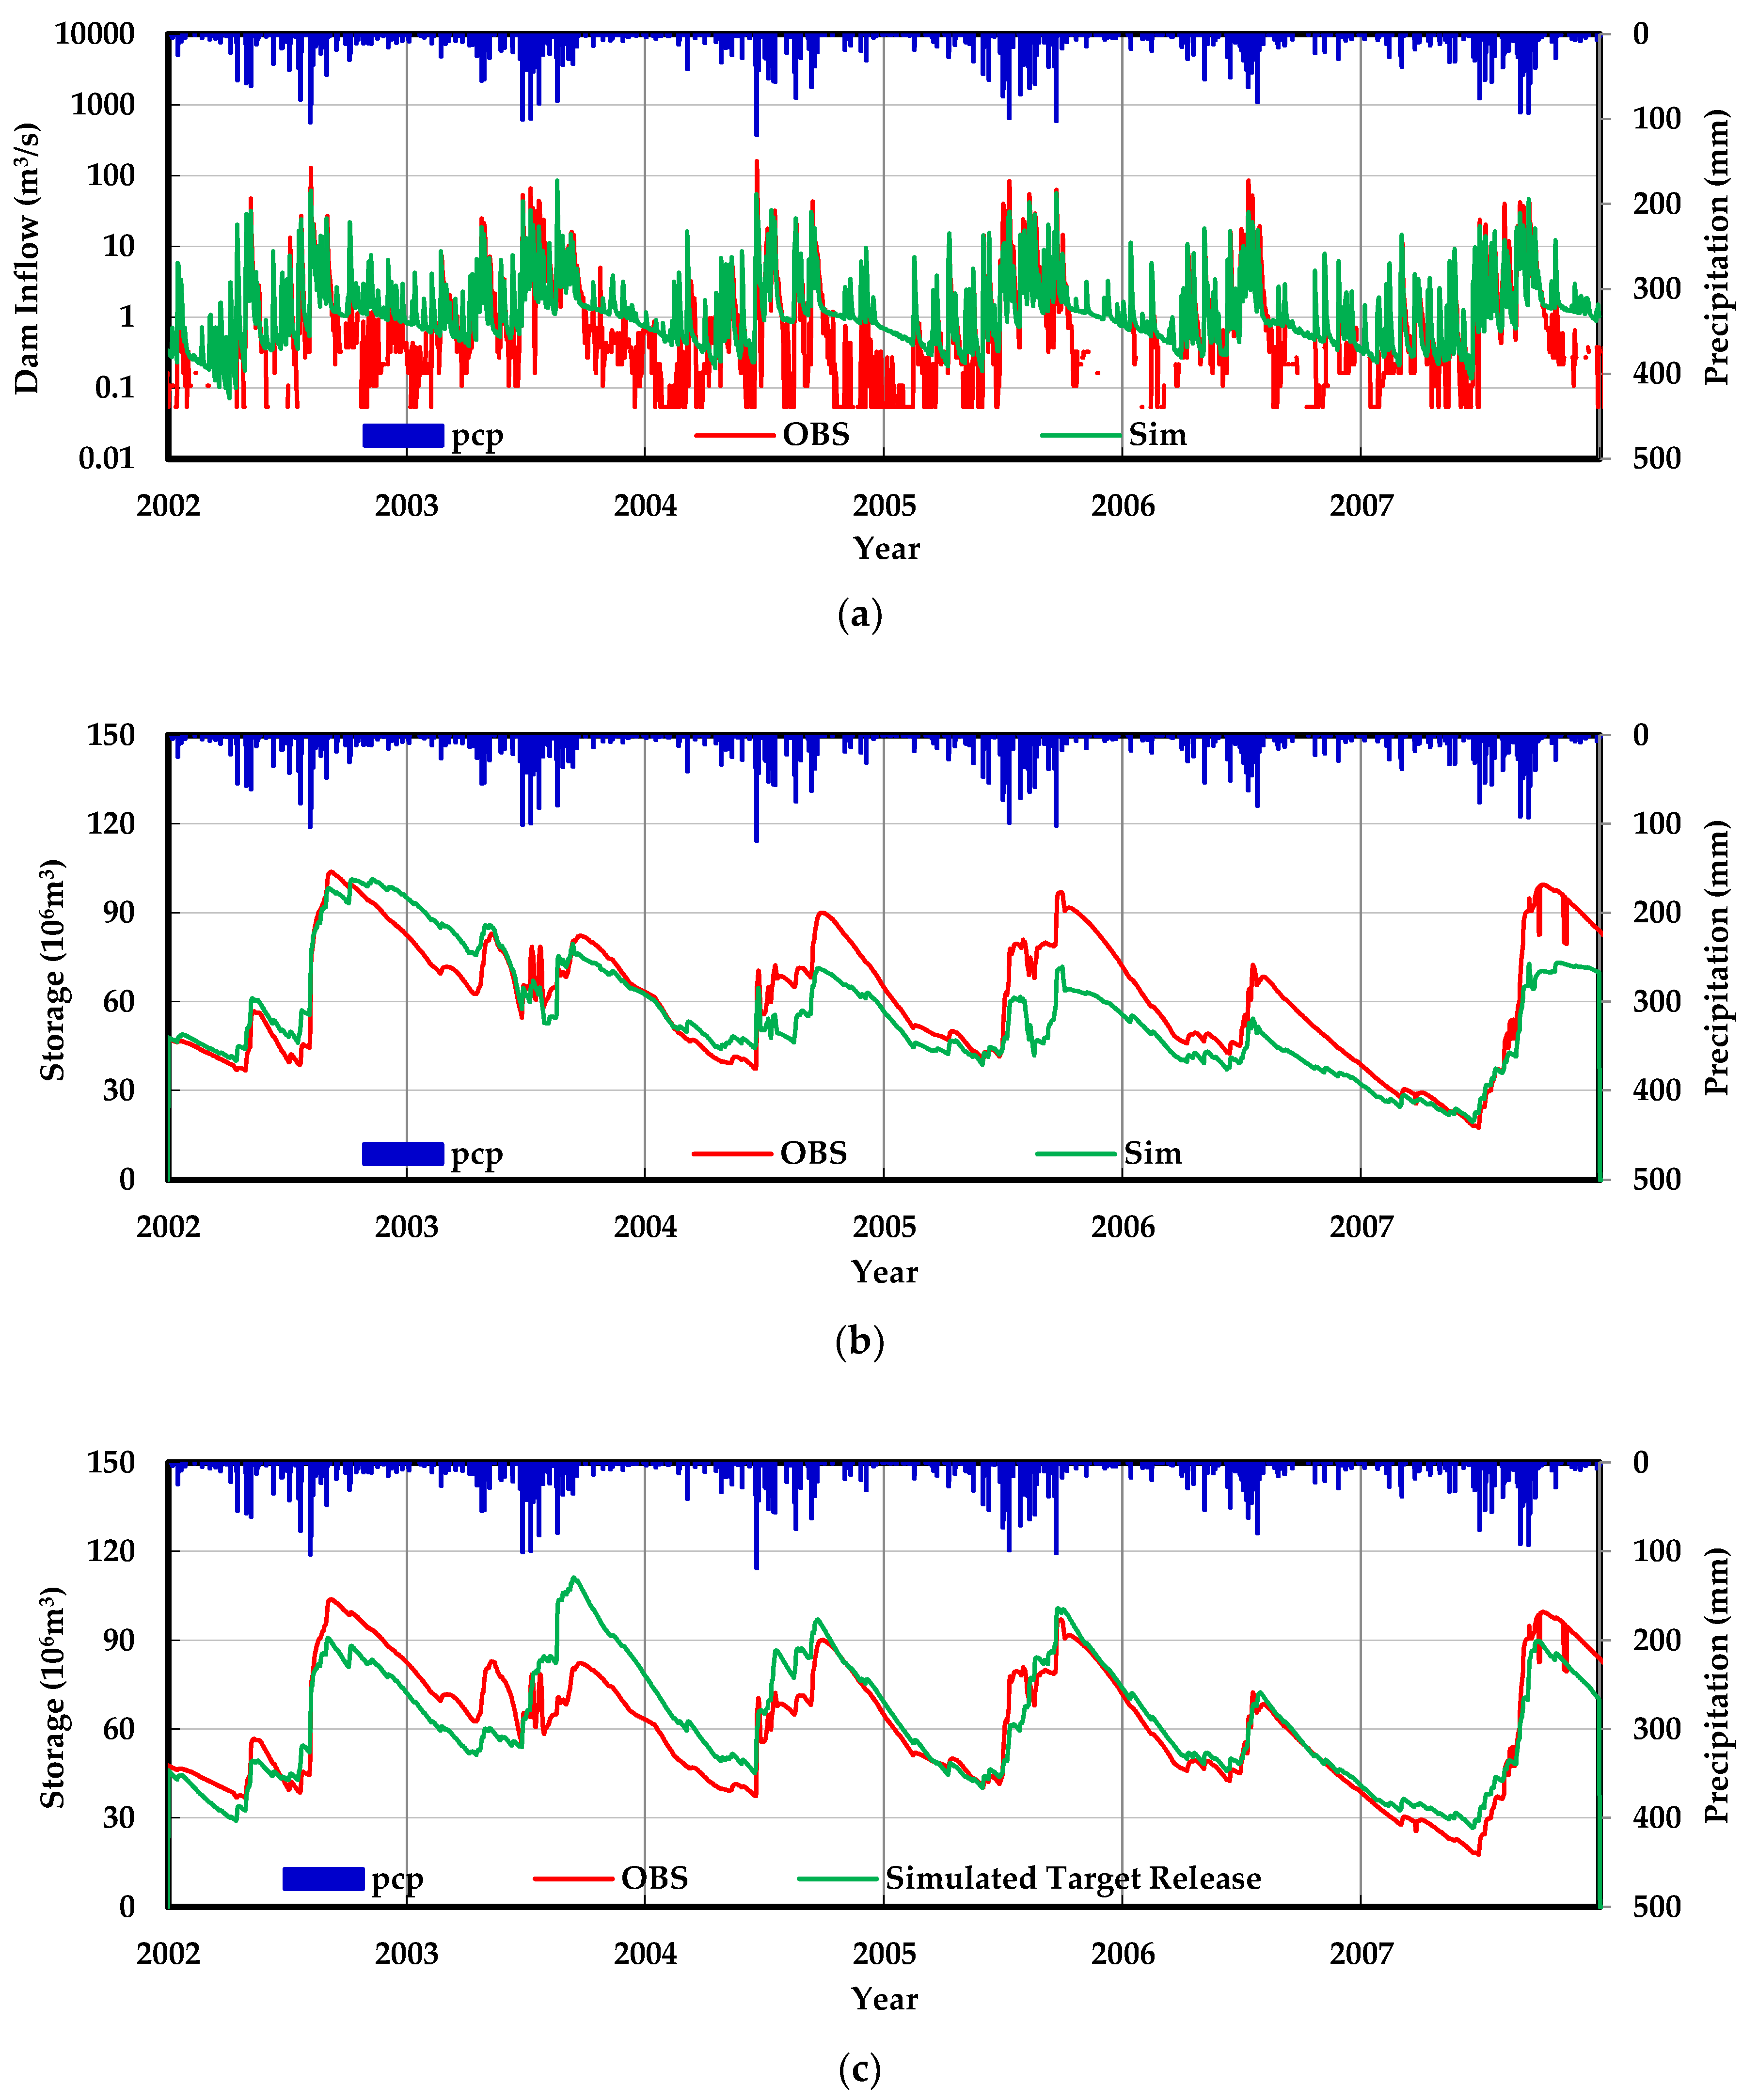
Figure 3 shows the comparison of 3a observed vs. simulated dam inflow and 3b observed vs. simulated dam storage using observed dam release and 3c observed vs. simulated dam storage by applying SWAT monthly target release respectively. The average Root Mean Square Error (RMSE) of 3a–c were 1.80 m
3/s, 0.67 × 10
6 m
3, and 0.46 × 10
6 m
3, the average Nash–Sutcliffe model Efficiency (NSE) were 0.52, 0.96, and 0.98, the PBIAS were −0.04%, −0.09%, and +0.02% respectively. The error of dam inflow influenced the dam storage simulation. The big error of dam storage was caused by the storm inflow and the error continued to the next storm event.
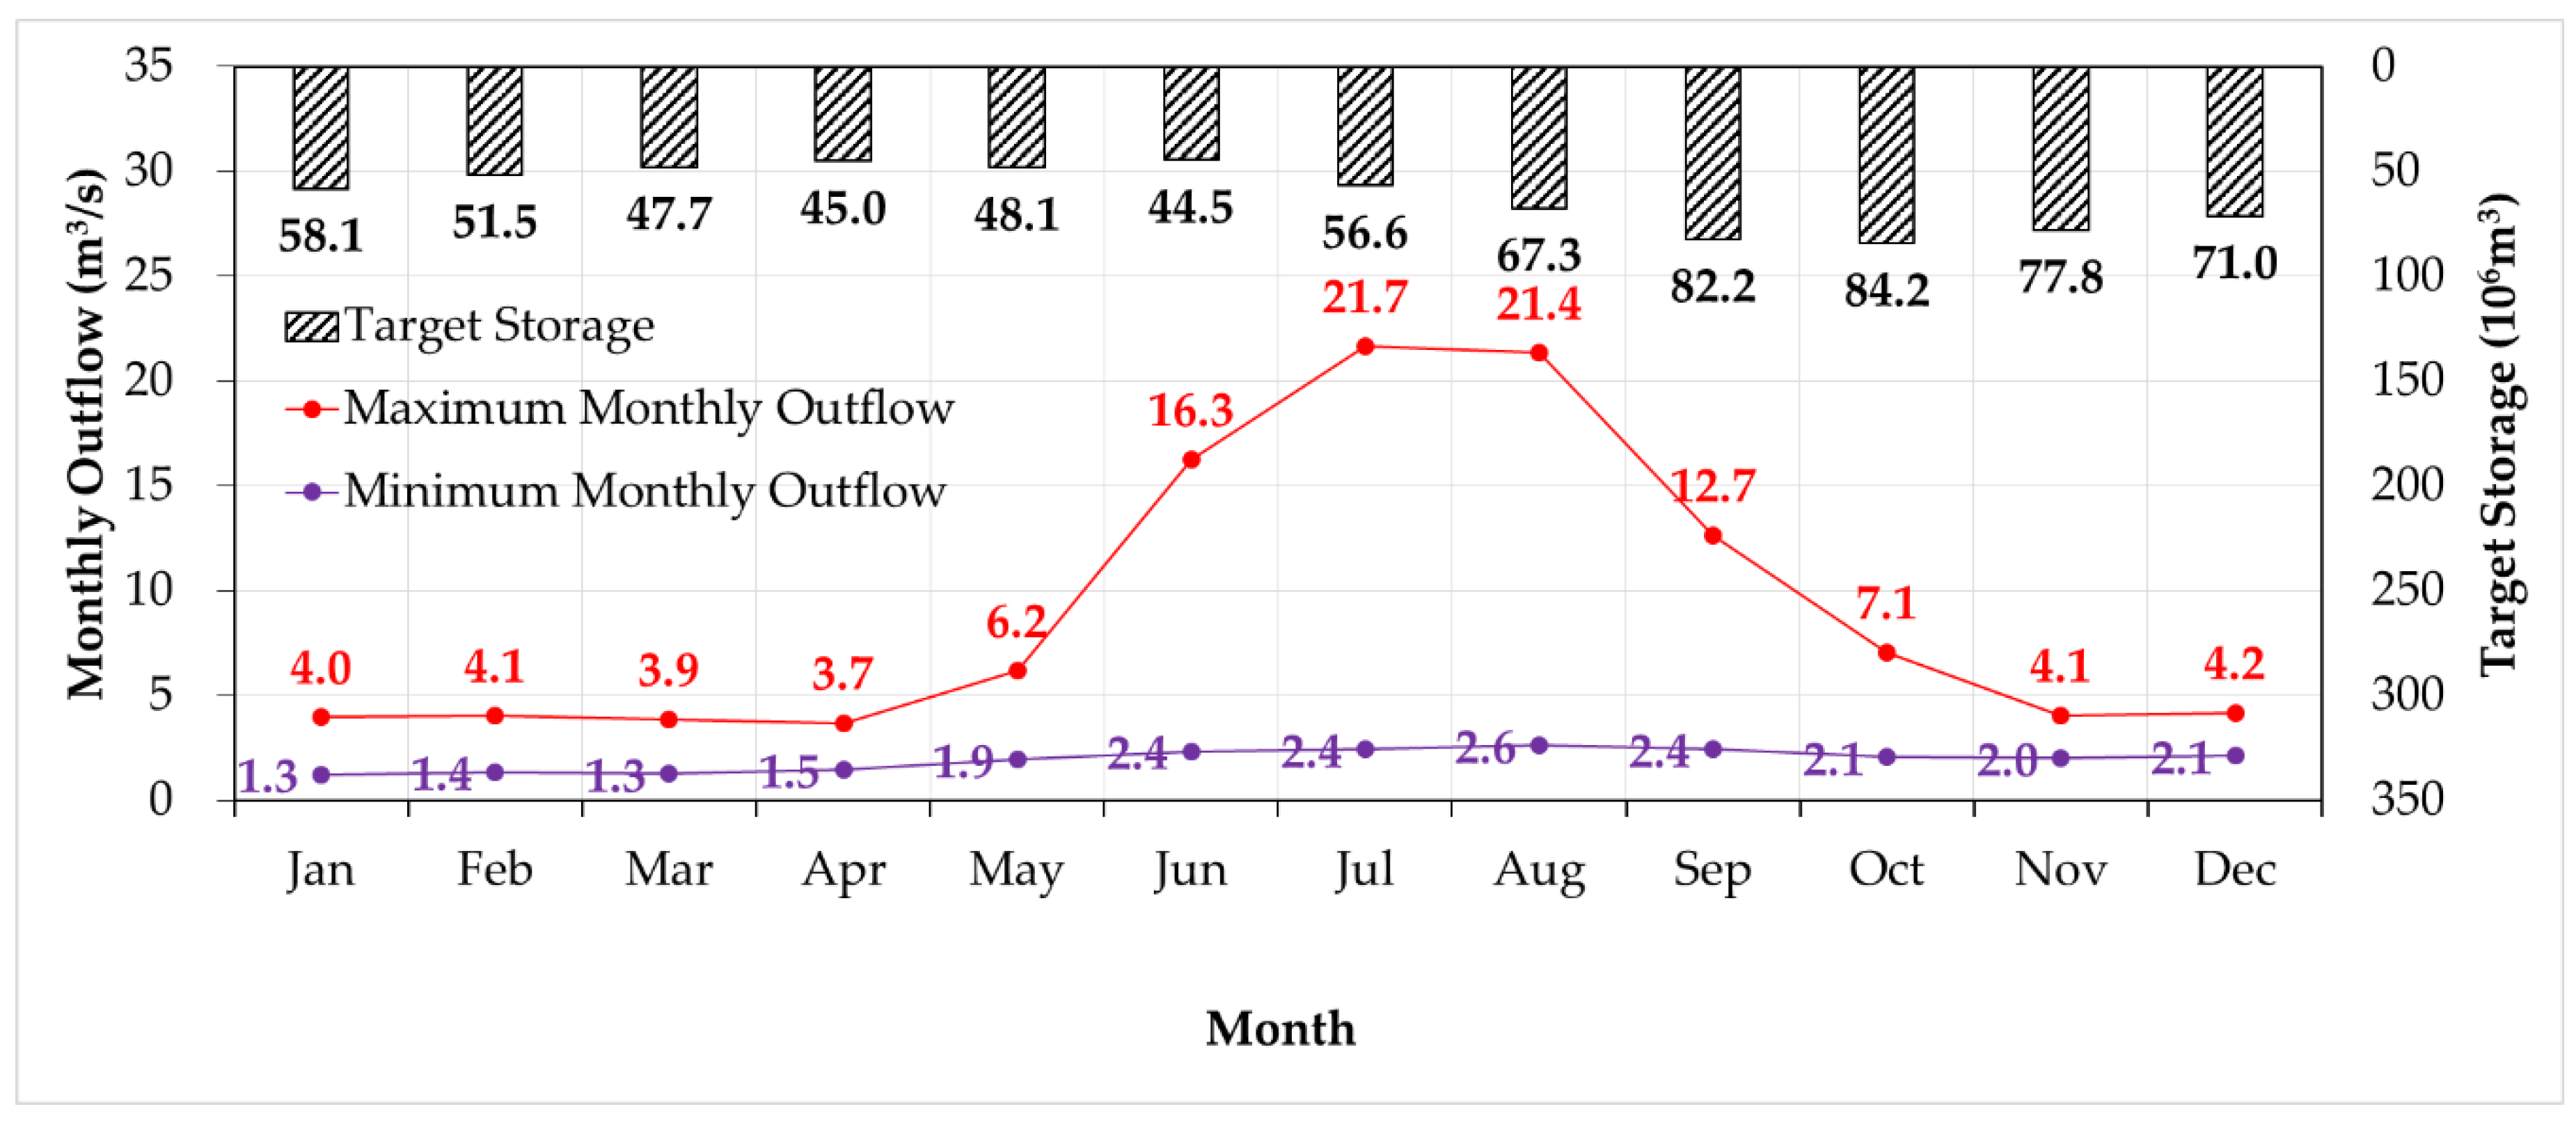
Figure 4 shows the monthly target release and storage now managed by K-water. This was applied for future dam release. The minimum outflow shows the downstream river maintenance flow rate. The maximum outflow includes the municipal and industrial water supply. The maximum outflows from June to September have much bigger values than other months because of flood control during rainy season in South Korea. The 21.7 m
3/s maximum outflow in July considers the prevention of overbank flooding by dam release.
3.2. Selected Future Dry Climate Scenarios
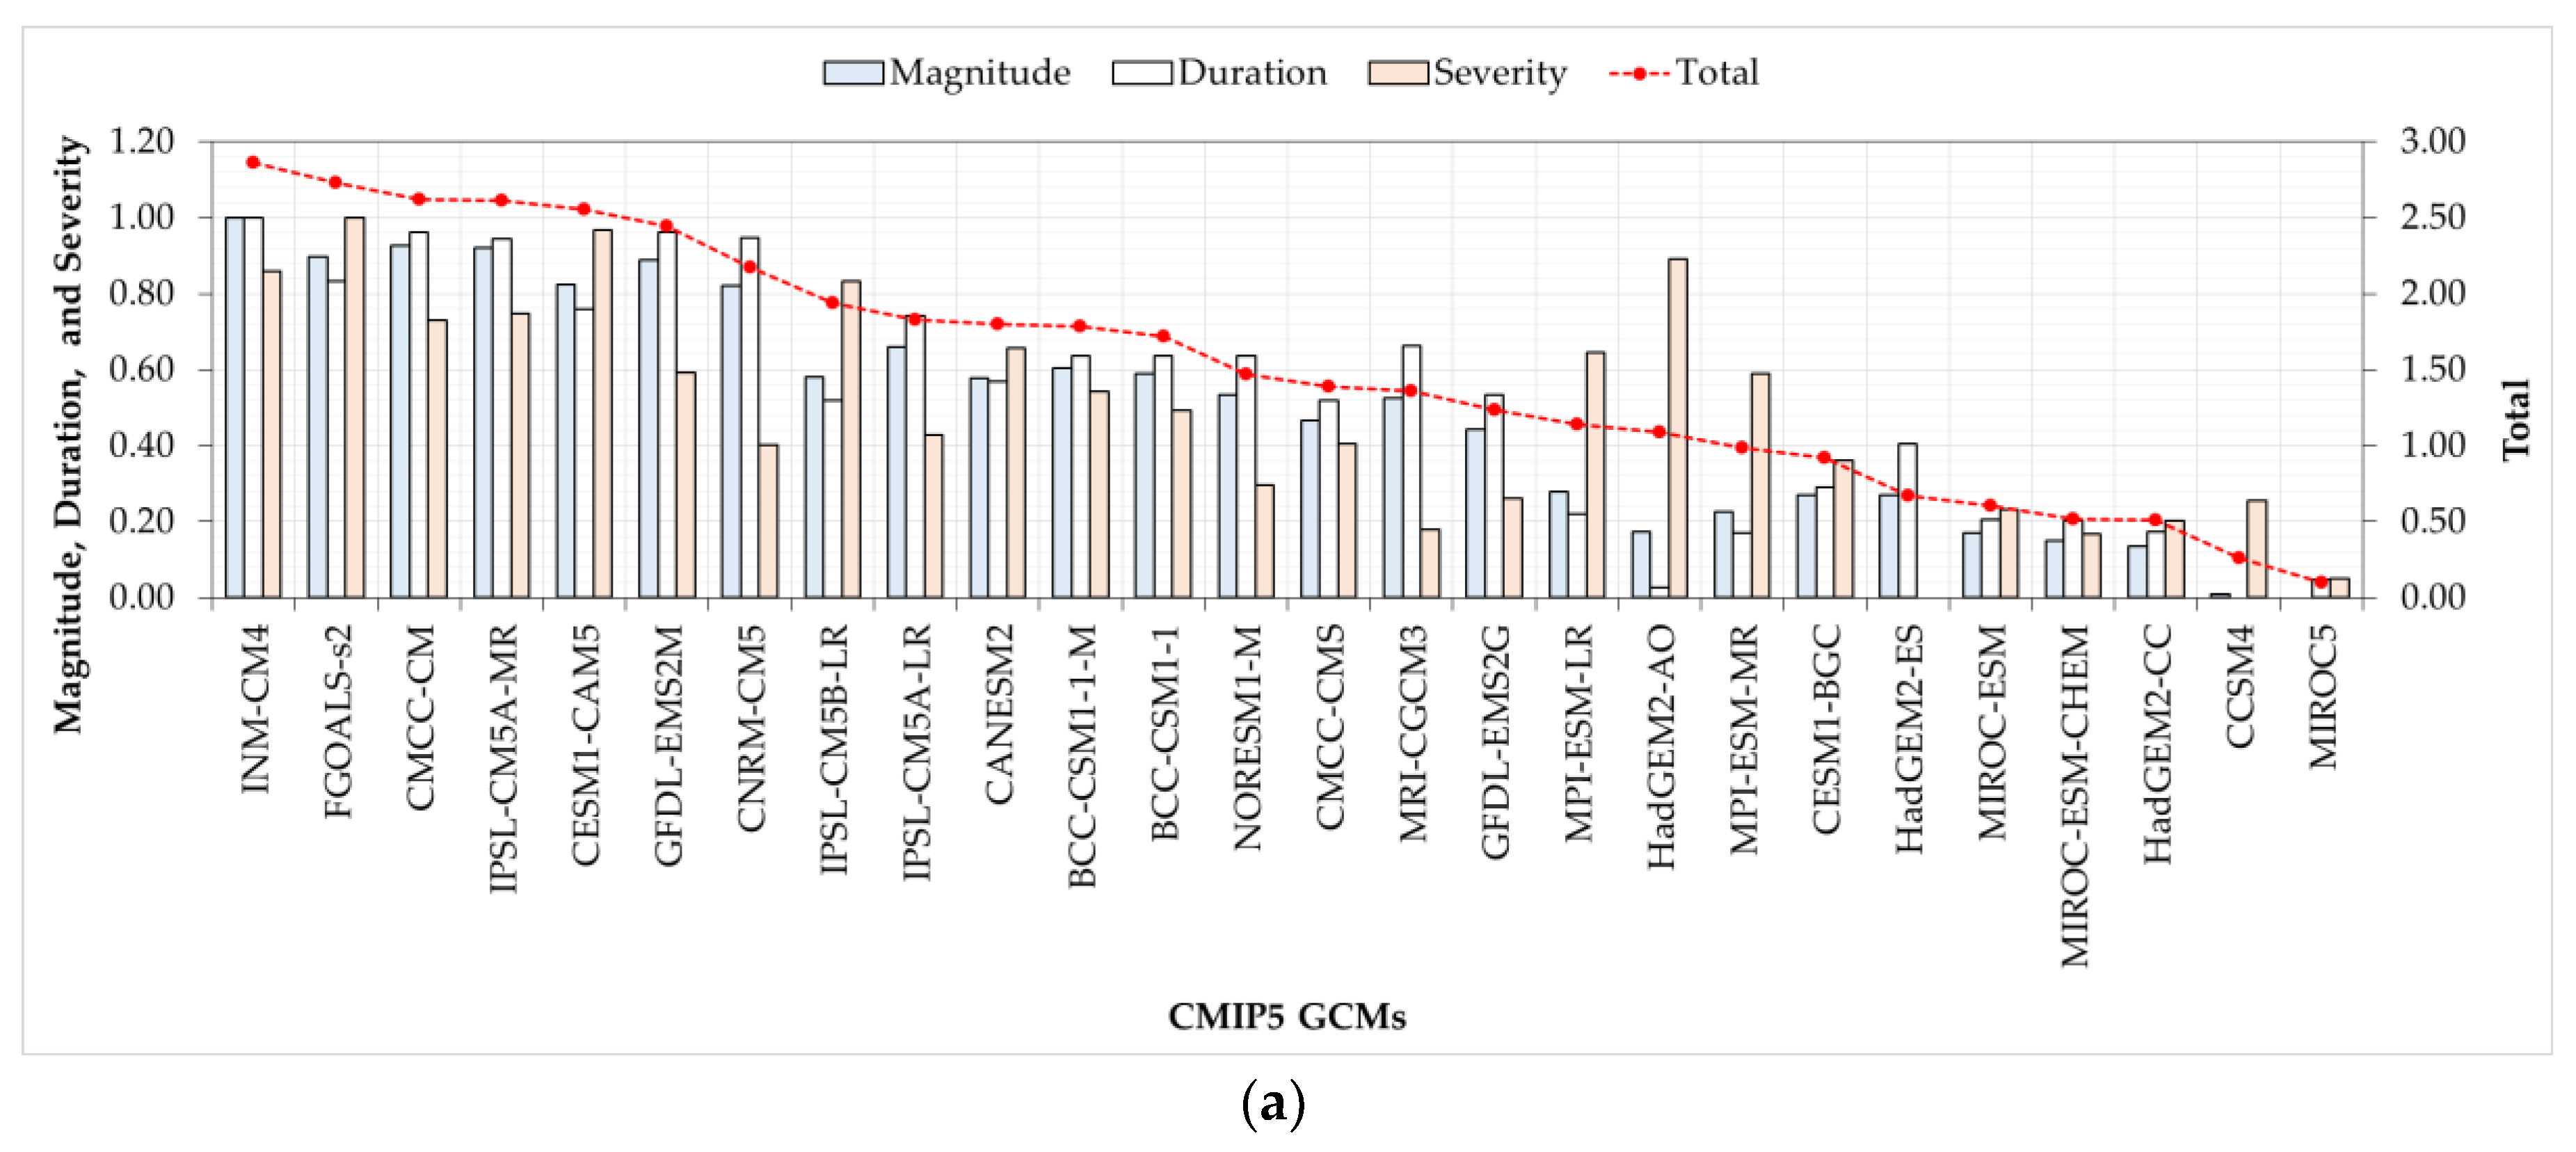
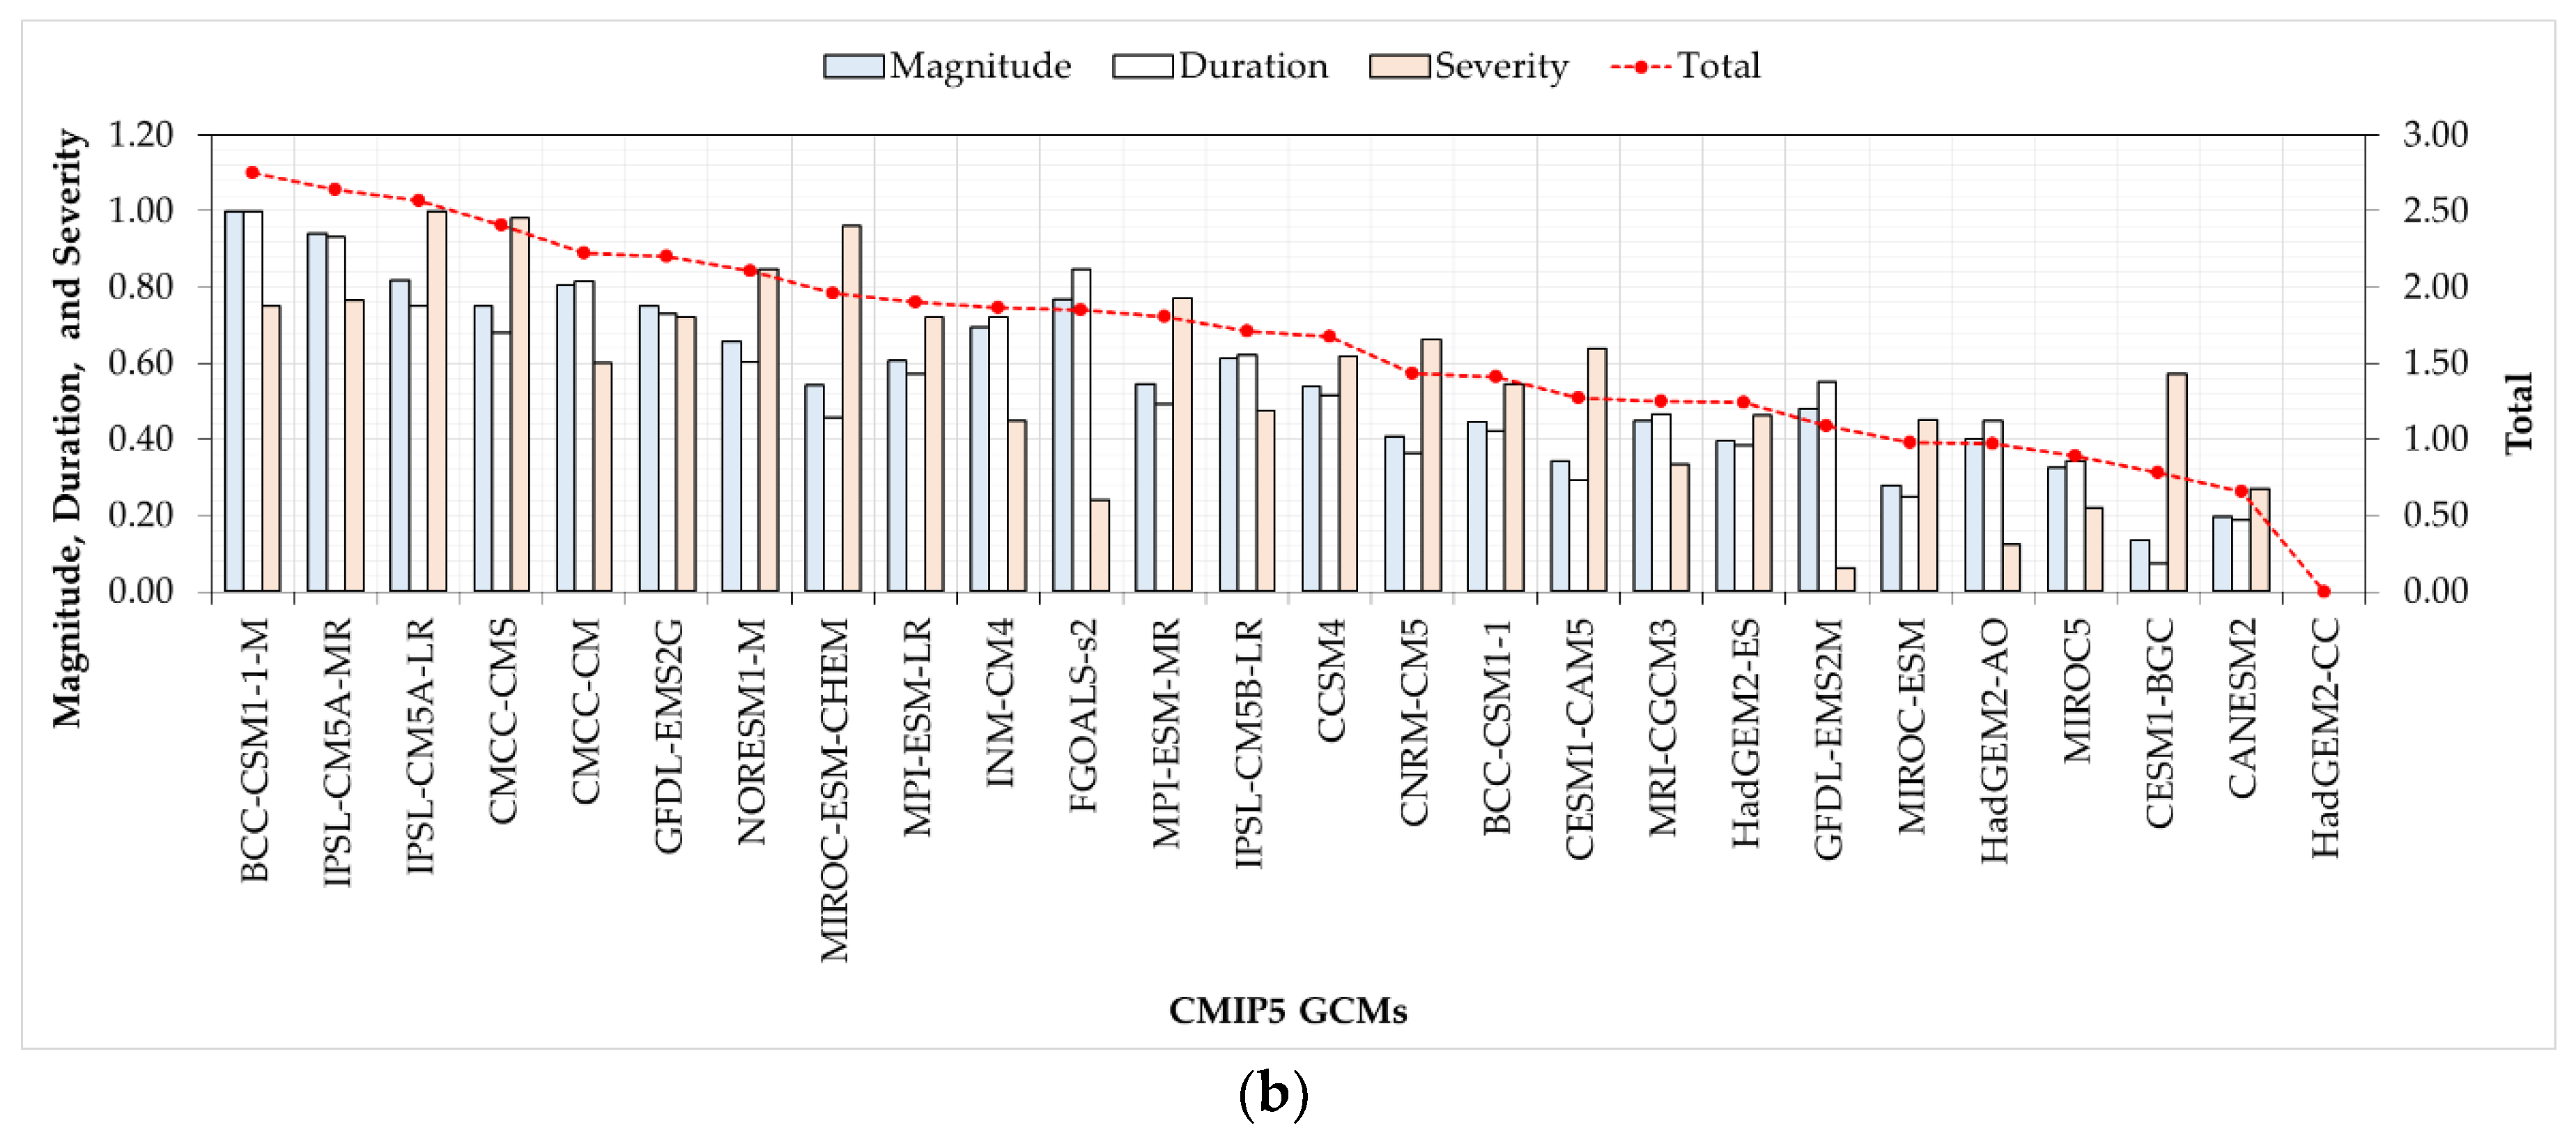
Figure 5 shows the result charts expressing dryness with severity, duration, and magnitude for RCP 4.5 and 8.5 scenarios of 26 CMIP5 GCMs. From left to right direction, the scenarios were ranked from dry to wet. The INM-CM4 and BCC-CSM1-1-M were the driest scenarios in RCP 4.5 and 8.5 scenarios respectively. The three GCMs of CMCC-CM, INM-CM4, and IPSL-CM5A-MR were all included within the top 10 dryness ranking in both RCP 4.5 and 8.5 scenarios. Thus the 6 scenarios for 3 GCMs were selected for the future Boryeong Dam water supply stability evaluation.
Since the Boryeong Dam was designed to endure drought for 20-year return period, the evaluation periods were divided into 20-year interval from historical period (1980–1999), present period (2000–2019), and future periods (2030s: 2020–2039, 2050s: 2040–2059, 2070s: 2060–2079, and 2090s: 2080–2099). SWAT evaluated the simulation performance of dam inflow for the 6 scenarios.
Table 4 shows the statistical summary of dam inflow simulation using each scenario of the historical period. The RMSE are in the range of 2.51 to 3.04 m
3/day and the PBIAS showed the range from −13.26 to +7.27%.
The SPI-6 of present, 2030s, 2050s, 2070s, and 2090s periods for the 6 scenarios was evaluated.
Table 5 shows the average value below −1.5 of SPI-6 and the count days for present and future periods. The INM-CM4 and IPSL-CM5A-MR for both RCP 4.5 and 8.5 scenarios had the overall increase day for SPI-6 below −1.5 from present to future periods. The CMCC-CM scenario had the day increase in 2030s RCP 4.5 and 2070s RCP 8.5 comparing with present days of SPI-6 below −1.5.
3.3. Evaluation of the Boryeong Dam Water Supply Stability for 6 Future Dry Scenarios
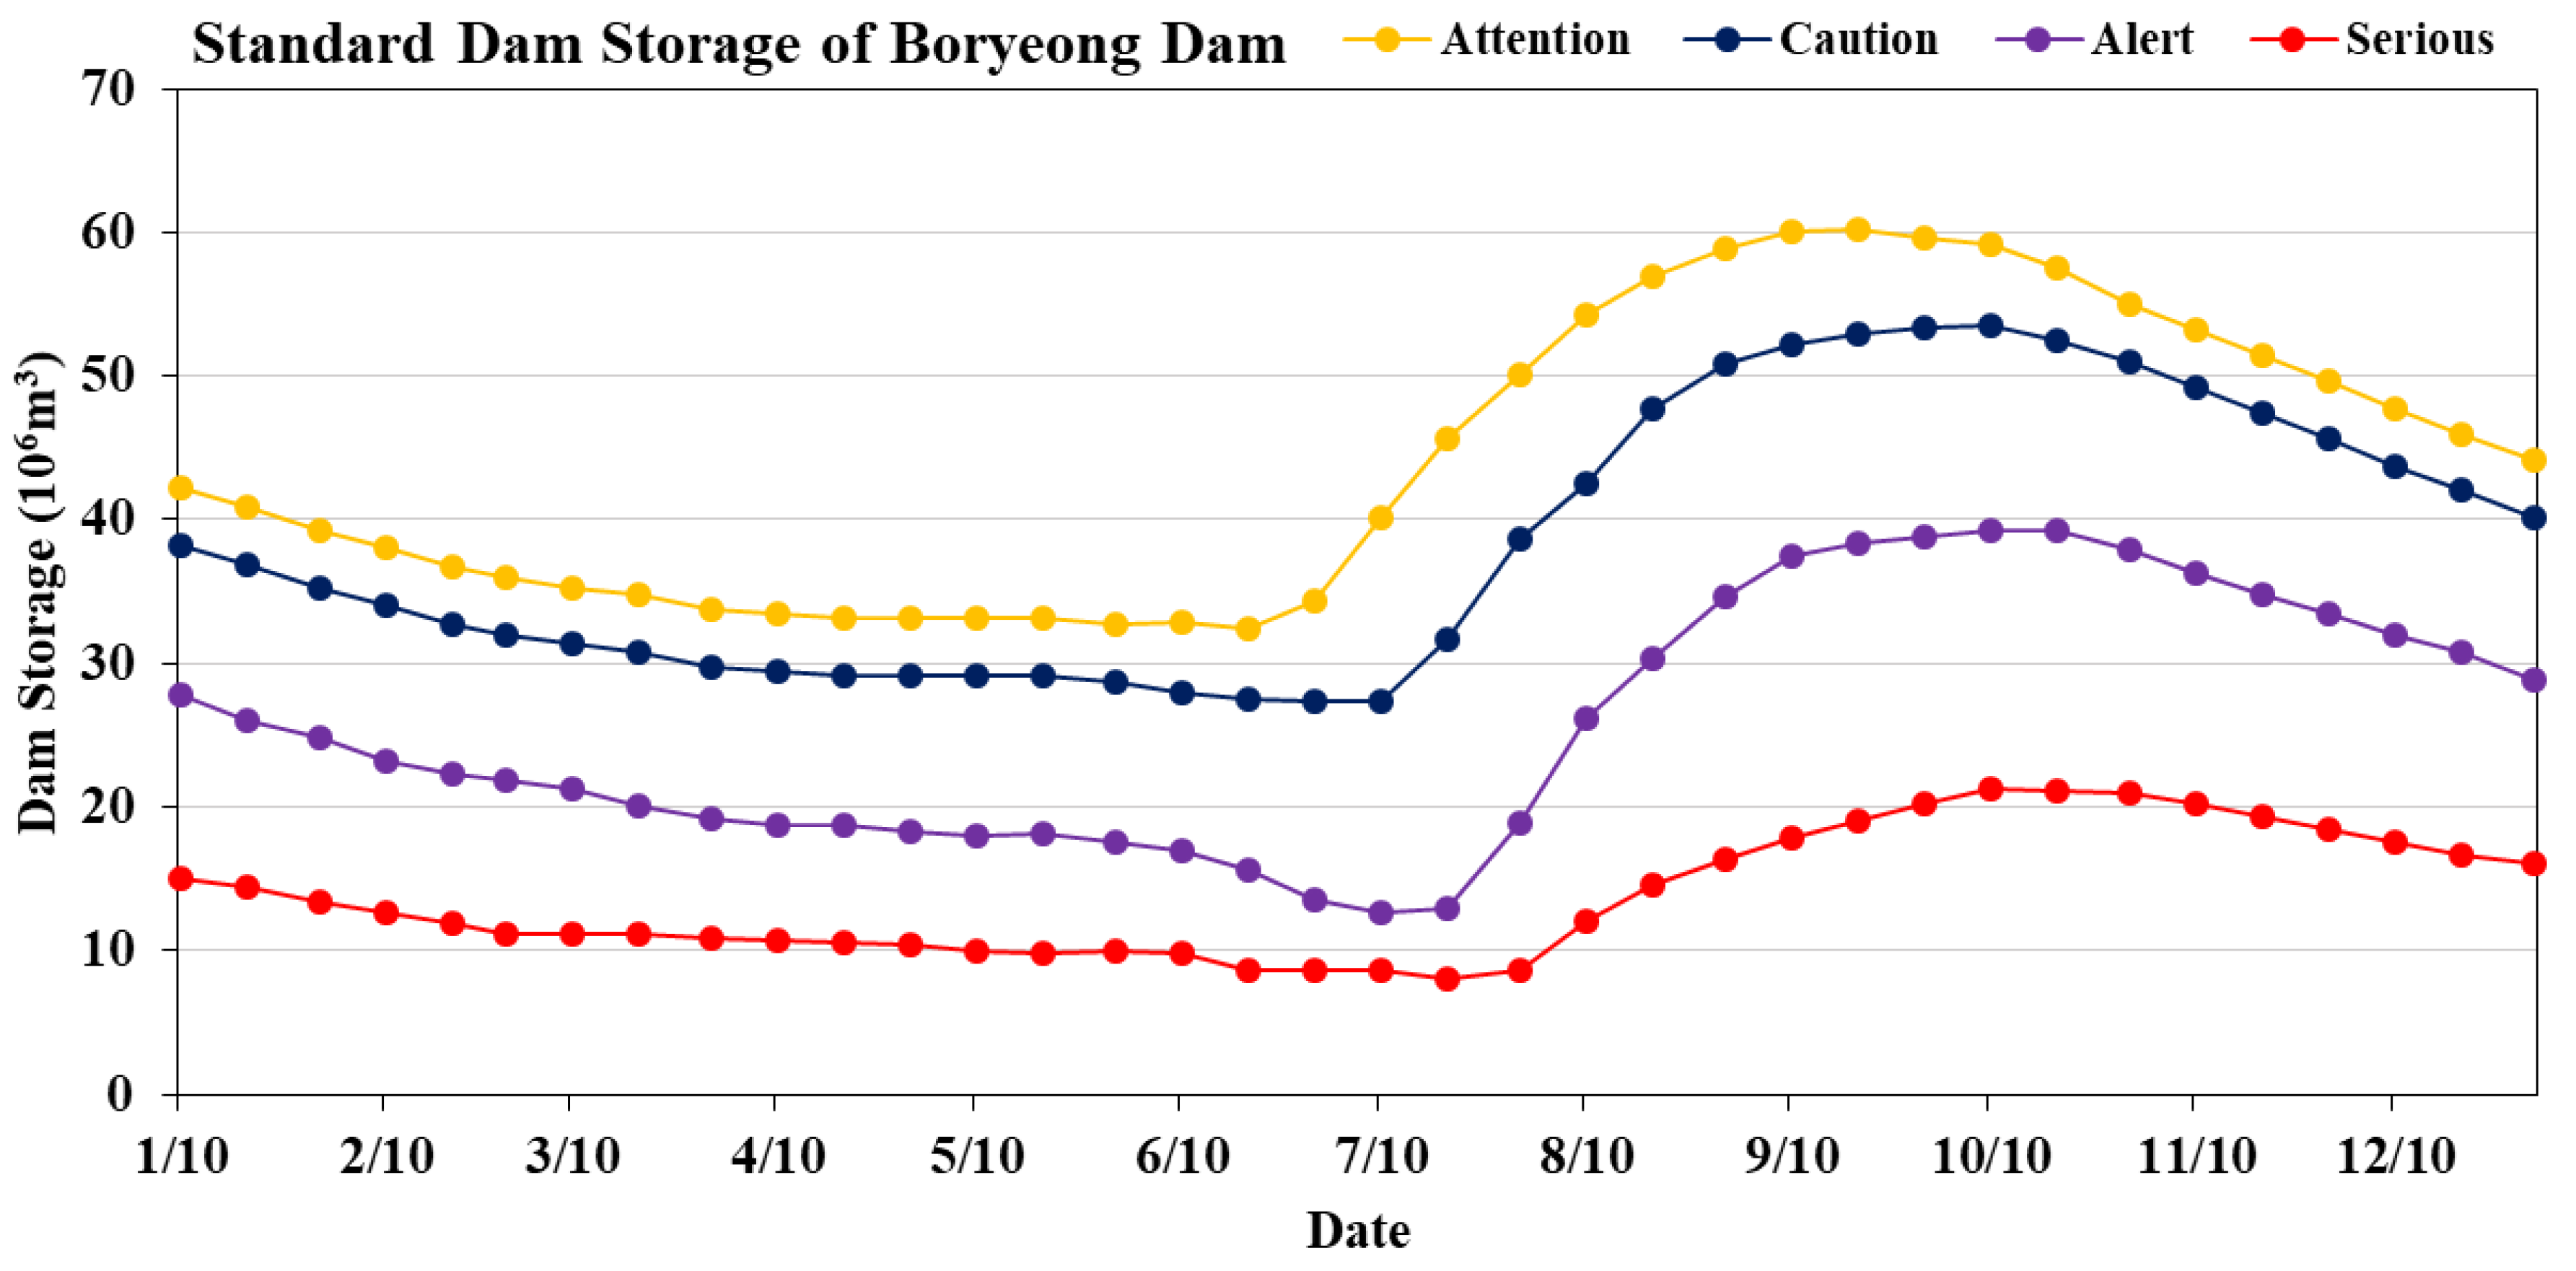
Figure 6 shows the reservoir management standard for the Boryeong Dam with 4 stages of dam storage conditions including attention, caution, alert, and serious.
Table 6 lists the dam water supply plan when reservoir storage is under drought conditions. Based on
Figure 6,
Table 6, and the SWAT simulation results, the reliability (
RT), resilience (
RS), and vulnerability (
V) of the Boryeong Dam was evaluated with respect to the likelihood of entering the serious storage condition stage using 6 future scenarios.
Table 7 shows the results of
RT,
RS, and
V of each period for the 6 future dry scenarios. As mentioned earlier, the Boryeong Dam was built to endure drought for 20-year return period. This means that the
RT of the dam should be maintained higher than 0.95. As seen in
Table 7, the
RT in historical period was above 0.95 for the 6 scenarios. The
RT below 0.95 in the present period showed 2 times in CMCC-CM RCP 4.5 and 8.5 scenarios. The
RT below 0.95 in each period of 2030s, 2050s, 2070s, and 2090s appeared 1, 3, 2, and 2 times respectively. The future
RT had the lowest value of 0.913, 0.887, and 0.803 for 2090s CMCC-CM RCP 8.5, 2030s INM-CM4 RCP 8.5, and 2050s IPSL-CM5A-MR RCP 8.5 scenarios respectively.
As seen in
Table 7, the low
RS below 0.1 appeared 2 and 4 times in historical and present periods respectively. The future
RS showed values below 0.1 for all periods from 2030s to 2090s with the range of 0.015~0.082 in CMCC-CM, 0.006~0.081 in INM-CM4, and 0.003~0.042 in IPSL-CM5A-MR scenarios. Similarly, the
V greater than zero in historical and present periods appeared 2 and 4 times for the same scenarios of
RS below 0.1. The future
V showed values above zero for all periods from 2030s to 2090s with the range of 24.1~591.8 × 10
6 m
3, 18.1~785.5 × 10
6 m
3, and 16.4~3567.6 × 10
6 m
3 respectively. The future
V showed the biggest values of 591.8 and 3567.6 × 10
6 m
3 for 2030s CMCC-CM RCP 4.5 and 2070s IPSL-CM5A-MR RCP 4.5 scenarios respectively while the
RS was the lowest values of 0.015 and 0.003 for the same scenario period.
4. Conclusions
The climate change impacts on water supply safety of Boryeong multipurpose dam was evaluated using future dry scenarios and SWAT. The future dry climate change scenarios were selected using Runs theory with SPI, meteorological drought severity, duration, and magnitude. The 6 future dry scenarios were applied to SWAT using the module of monthly target release from the dam. Using the SWAT results, the reliability (RT), resilience (RS), and vulnerability (V) for the entry of serious storage stage of Boryeong Dam were estimated.
Since the dam was designed to endure drought for 20-year return period, the evaluation periods were divided into 20-year interval from historical period (1980–1999), present period (2000–2019), and future periods (2030s: 2020–2039, 2050s: 2040–2059, 2070s: 2060–2079, and 2090s: 2080–2099).
The RCP 4.5 and 8.5 scenarios of 26 CMIP5 GCMs were tested for dryness with severity, duration, and magnitude. Among them, the 3 GCMs of CMCC-CM, INM-CM4, and IPSL-CM5A-MR were selected because both RCP 4.5 and 8.5 scenarios were all included within top 10 future dryness characteristics. The INM-CM4 and IPSL-CM5A-MR for both RCP 4.5 and 8.5 scenarios showed the days increase for SPI-6 below −1.5 from present to future periods.
The SWAT results showed that the future RT was below 0.95 (threshold value for the 20-year return period drought) 9 times, while the RT in the historical period was above 0.96. All the values of RS in the future were less than 0.082, implying very weak resilience. The relationship between RS and V was observed to be inversely proportional. The V of the 2070s IPSL-CM5A-MR RCP 4.5 scenario showed the largest value of 3567.6 × 106 m3 while the RS was the lowest, at 0.003. Overall, the predicted future dam resilience was lower and vulnerability was higher compared to the historical and present periods.
Under the future dry climate conditions, the Boryeong Dam showed unstable water supply fulfillment in many future periods in terms of reliability, resilience, and vulnerability. It is necessary to prepare the future coming droughts by adjusting present monthly target storage and release, dam reinforcement, and water import from neighbor watershed.
In this study, the present monthly target release was used for future dam storage simulation and to evaluate the future reservoir stability. The future water demands were assumed to be unchanged. Thus, further researches are necessary to consider future predicted water demands and apply reservoir operation model to mimic future dam release such as HEC-ResSim (Hydrologic Engineering Center-Reservoir System Simulation) [
37].
Author Contributions
Data curation, J.L.; Investigation, J.K.; Supervision, S.K.; Writing—review and editing, W.K.
Funding
This subject is supported by the Korean Ministry of the Environment (MOE) as the “Water Management Research Program (79617)”, and this work was supported by the “University Innovation Grant” from the Ministry of Education and the National Research Foundation of Korea.
Acknowledgments
This manuscript was also edited for English language by American Journal Experts (AJE).
Conflicts of Interest
The authors declare no conflicts of interest.
References
- Chen, R.S.; Boulding, E.; Schneider, S.H. Social Science Research and Climate Change; D. Reidel: Dordrecht, The Netherlands, 1983. [Google Scholar]
- Intergovernmental Panel on Climate Change (IPCC). Climate Change 2007: The Physical Science Basis, IPCC Contribution of Working Group I to the Fourth Assessment Report of the Intergovernmental Panel on Climate Change; Cambridge University Press: Cambridge, UK; New York, NY, USA, 2007. [Google Scholar]
- Gleick, P.H. Climate change, hydrology, and water resources. Rev. Geophys. 1989, 27, 329–344. [Google Scholar] [CrossRef]
- Wood, A.W.; Lettenmaier, D.P.; Palmer, R.N. Assessing climate change implications for water resources planning. Clim. Chang. 1997, 37, 203–228. [Google Scholar] [CrossRef]
- Joh, H.-K.; Lee, J.-W.; Park, M.-J.; Shin, H.-J.; Yi, J.-E.; Kim, G.-S.; Srinivasan, R.; Kim, S.-J. Assessing climate change impact on hydrological components of a small forest watershed through SWAT calibration of evapotranspiration and soil moisture. Trans. ASABE 2011, 54, 1773–1781. [Google Scholar] [CrossRef]
- Wilhite, D.A. Drought as a natural hazard: Concepts and definitions. In Drought; Wilhite, D.A., Ed.; Drought Mitigation Center Faculty Publications: London, UK, 2000; pp. 3–18. [Google Scholar]
- Kelley, C.P.; Mohtadi, S.; Cane, M.A.; Seager, R.; Kushnir, Y. Climate change in the fertile crescent and implications of the recent Syrian drought. Proc. Natl. Acad. Sci. USA 2015, 112, 3241. [Google Scholar] [CrossRef] [PubMed]
- Madadgar, S.; Moradkhani, H. Drought analysis under climate change using copula. J. Hydrol. Eng. 2013, 18, 746–759. [Google Scholar] [CrossRef]
- Trenberth, K.E.; Dai, A.; van der Schrier, G.; Jones, P.D.; Barichivich, J.; Briffa, K.R.; Sheffield, J. Global warming and changes in drought. Nat. Clim. Chang. 2013, 4, 17–22. [Google Scholar] [CrossRef]
- Sperber, K.R.; Annamalai, H.; Kang, I.S.; Kitoh, A.; Moise, A.; Turner, A.; Wang, B.; Zhou, T. The Asian summer monsoon: An intercomparison of CMIP5 vs. CMIP3 simulations of the late 20th century. Clim. Dyn. 2013, 41, 2711–2744. [Google Scholar] [CrossRef]
- Andersson, L.; Wilk, J.; Todd, M.C.; Hughes, D.A.; Earle, A.; Kniveton, D.; Layberry, R.; Savenije, H.H.G. Impact of climate change and development scenarios on flow patterns in the Okavango River. J. Hydrol. 2006, 331, 43–57. [Google Scholar] [CrossRef]
- Park, J.Y.; Kim, S.J. Potential impacts of climate change on the reliability of water and hydropower supply from a multipurpose dam in South Korea. JAWRA J. Am. Water Resour. Assoc. 2014, 50, 1273–1288. [Google Scholar] [CrossRef]
- Park, J.-Y.; Yu, Y.-S.; Hwang, S.-J.; Kim, C.; Kim, S.-J. SWAT modeling of best management practices for Chungju dam watershed in South Korea under future climate change scenarios. Paddy Water Environ. 2014, 12, 65–75. [Google Scholar] [CrossRef]
- Park, M.J.; Ha, R.; Kim, N.W.; Lim, K.J.; Kim, S.J. Assessment of future climate and vegetation canopy change impacts on hydrological behavior of Chungju dam watershed using SWAT model. KSCE J. Civ. Eng. 2014, 18, 1185–1196. [Google Scholar] [CrossRef]
- Jeong, H.G.; Kim, S.-J.; Ha, R. Assessment of climate change impact on storage behavior of Chungju and the regulation dams using SWAT model. J. Korea Water Resour. Assoc. 2013, 46, 1235–1247. [Google Scholar] [CrossRef]
- Piao, S.; Ciais, P.; Huang, Y.; Shen, Z.; Peng, S.; Li, J.; Zhou, L.; Liu, H.; Ma, Y.; Ding, Y.; et al. The impacts of climate change on water resources and agriculture in China. Nature 2010, 467, 43–51. [Google Scholar] [CrossRef] [PubMed]
- Schewe, J.; Heinke, J.; Gerten, D.; Haddeland, I.; Arnell, N.W.; Clark, D.B.; Dankers, R.; Eisner, S.; Fekete, B.M.; Colón-González, F.J.; et al. Multimodel assessment of water scarcity under climate change. Proc. Natl. Acad. Sci. USA 2014, 111, 3245. [Google Scholar] [CrossRef] [PubMed]
- Sowers, J.; Vengosh, A.; Weinthal, E. Climate change, water resources, and the politics of adaptation in the Middle East and North Africa. Clim. Chang. 2011, 104, 599–627. [Google Scholar] [CrossRef]
- Hashimoto, T.; Stedinger, J.R.; Loucks, D.P. Reliability, resiliency, and vulnerability criteria for water resource system performance evaluation. Water Resour. Res. 1982, 18, 14–20. [Google Scholar] [CrossRef]
- Hurst, H.E. Long-term storage capacity of reservoirs. Trans. Am. Soc. Civ. Eng. 1951, 116, 770–808. [Google Scholar]
- Matalas, N.C.; Fiering, M.B. Water Resources Systems Planning in Climate, Climate Change, and Water Supply; National Academy of Sciences: Washington, DC, USA, 1977. [Google Scholar]
- Moy, W.-S.; Cohon, J.L.; ReVelle, C.S. A Programming model for analysis of the reliability, resilience, and vulnerability of a water supply reservoir. Water Resour. Res. 1986, 22, 489–498. [Google Scholar] [CrossRef]
- Vogel, R.M.; Bolognese, R.A. Storage-reliability-resilience-yield relations for over-year water supply systems. Water Resour. Res. 1995, 31, 645–654. [Google Scholar] [CrossRef]
- Arnold, J.G.; Williams, J.R.; Maidment, D.R. Continuous-time water and sediment-routing model for large basins. J. Hydraul. Eng. 1995, 121, 171–183. [Google Scholar] [CrossRef]
- Arnold, J.G.; Srinivasan, R.; Muttiah, R.S.; Williams, J.R. Large area hydrologic modeling and assessment part I: Model development1. JAWRA J. Am. Water Resour. Assoc. 1998, 34, 73–89. [Google Scholar] [CrossRef]
- Shi, P.; Chen, C.; Srinivasan, R.; Zhang, X.; Cai, T.; Fang, X.; Qu, S.; Chen, X.; Li, Q. Evaluating the SWAT Model for hydrological modeling in the Xixian watershed and a comparison with the XAJ model. Water Resour. Manag. 2011, 25, 2595–2612. [Google Scholar] [CrossRef]
- Narsimlu, B.; Gosain, A.K.; Chahar, B.R. Assessment of future climate change impacts on water resources of Upper Sind river basin, India using SWAT Model. Water Resour. Manag. 2013, 27, 3647–3662. [Google Scholar] [CrossRef]
- Kim, B.S.; Kim, H.S.; Seoh, B.H.; Kim, N.W. Impact of climate change on water resources in Yongdam Dam Basin, Korea. Stoch. Environ. Res. Risk Assess. 2007, 21, 457. [Google Scholar] [CrossRef]
- Fu, C.; James, A.L.; Yao, H. SWAT-CS: Revision and testing of SWAT for Canadian shield catchments. J. Hydrol. 2014, 511, 719–735. [Google Scholar] [CrossRef]
- Kim, N.W.; Lee, J.E.; Kim, J.T. Assessment of flow regulation effects by dams in the Han River, Korea, on the downstream flow regimes using SWAT. J. Water Resour. Plan. Manag. 2012, 138, 24–35. [Google Scholar] [CrossRef]
- Neitsch, S.L.; Arnold, J.G.; Kiniry, J.R.; Williams, J.R. Soil and Water Assessment Tool: Theoretical Documentation Version 2000. USDA-ARS Grassland; Soil and Water Research Laboratory and Blackland Research Center: Texas, TX, USA, 2001. [Google Scholar]
- McKee, T.B.; Doesken, N.J.; Kleist, J. The Relationship of Drought Frequency and Duration to Time Scales. In Proceedings of the 8th Conference on Applied Climatology, American Meteorological Society, California, CA, USA, 17–22 January 1993; pp. 179–184. [Google Scholar]
- Nam, W.H.; Hayes, M.J.; Svoboda, M.D.; Tadesse, T.; Wilhite, D.A. Drought hazard assessment in the context of climate change for South Korea. Agric. Water Manag. 2015, 160, 106–117. [Google Scholar] [CrossRef]
- Lee, J.H.; Seo, J.W.; Kim, C.J. Analysis on trends, periodicities and frequencies of Korean drought using drought indices. J. Korea Water Resour. Assoc. 2012, 45, 75–89. [Google Scholar] [CrossRef]
- Lee, J.H.; Cho, K.K.; Kim, C.J.; Park, M.J. Analysis on the spatio-temporal distribution of drought using potential drought hazard map. J. Korea Water Resour. Assoc. 2012, 45, 983–995. [Google Scholar] [CrossRef]
- Lee, J.W.; Jang, S.S.; Ahn, S.R.; Park, K.W.; Kim, S.J. Evaluation of the relationship between meteorological, agricultural, and in situ big data droughts. J. Korean Assoc. Geogr. Inf. Stud. 2016, 19, 64–79. [Google Scholar] [CrossRef]
- Klipsch, J.D.; Hurst, M.B. HEC-ResSim Reservoir System Simulation User’s Manual; Version 3.0.; U.S. Army Corps of Engineers, Institute for Water Resources, Hydrologic Engineering Center: Davis, CA, USA, 2007. [Google Scholar]
© 2019 by the authors. Licensee MDPI, Basel, Switzerland. This article is an open access article distributed under the terms and conditions of the Creative Commons Attribution (CC BY) license (http://creativecommons.org/licenses/by/4.0/).


