Experimental Research on the Rotating Stall of a Pump Turbine in Pump Mode

China Institute of Water Resources and Hydropower Research (IWHR), Beijing 100038, China
*
Author to whom correspondence should be addressed.
Water 2019, 11(11), 2426; https://0-doi-org.brum.beds.ac.uk/10.3390/w11112426
Submission received: 18 October 2019
/
Revised: 16 November 2019
/
Accepted: 18 November 2019
/
Published: 19 November 2019
(This article belongs to the Section Hydraulics and Hydrodynamics)
Abstract
:The rotating stall is an unstable flow phenomenon of pump turbines in pump mode, which is of increasing concern to scientists and engineers working on pump turbines. However, at present, various studies are carried out based on CFD (computational fluid dynamics) simulation, while directly measured data and experimental research on flow fields are seldom reported. By utilizing PIV (particle image velocimetry) measuring equipment, the flow field within the guide vane zone of a low specific speed pump turbine in pump mode was measured. By measuring and analyzing the transient flow field, the evolutionary process of the rotating stall within the guide vane passages was determined. We found that for all three tested guide vane openings, regardless of whether the positive slope appeared or not, a pre-stall operating point was found for each opening in the process of decreasing the flow rate. The analysis of the loss within the flow field indicated that the dissipation-induced loss increased greatly after the rotating stall appeared. The pump performance curves at the three guide vane openings showed an inflection at the pre-stall point. When the flow rate is larger than that of the pre-stall point, the head of the pump turbine dramatically increases as the flow rate decreases. However, when the flow rate is smaller than the pre-stall point, such increases noticeably slows down. The research results showed that whether the positive slope on the pump performance curve occurred or not, instability caused by the rotating stall should be of great concern.
1. Introduction
Large-scale pumped storage power (PSP) plants generally undertake more responsibility for load-levelling, frequency regulation and stabilization of the power grid. Therefore, as a key component for energy conversion, pump turbines are demanded to switch rapidly between the pump mode and the turbine mode, to start or stop frequently and to operate in working conditions deviating from the optimal operation point. As a result, increasing numbers of researchers have focused on studies of the instabilities caused by the unstable flows in pump turbines [1]. One of the main unstable flow phenomena of a pump turbine operating in pump mode is the rotating stall.
The rotating stall is increasingly mentioned in research on unsteady characteristics of pump turbines. The rotating stall can be summarized as follows [2,3]: At off-design conditions of turbomachinery, a large area of flow separation appears at rotary or fixed vanes, and separation-induced vortex blocks the blade channels, which leads to a great fluctuation in the flow and pressure. As a result, a stall is generated. A rotating stall happens when the stall occurs successively and propagates in various blade channels at a frequency much lower than the rotational frequency of the impeller. The process of rotating stall was first studied by Emmons [2] in research on axial compressors through theoretical analysis.
In terms of hydraulic machinery, most studies on rotating stall have been carried out in pumps. By combining particle image velocimetry (PIV) and pressure fluctuation measurement, Sinha et al. [4] investigated the rotating stall in the vaned diffusers of a model pump. They drew the conclusion that the non-uniform distribution of flow velocities and pressures at the two sides of the tongue resulted in the occurrence of the rotating stall. Krause et al. [5] conducted PIV measurements in a specially modified model focused on the rotating stall in a centrifugal pump impeller in part-load condition. The measured result showed that under different flow rates, the impeller was separately subjected to stall within a fixed channel and a rotating stall between flow channels. Many other researchers [6,7,8,9,10,11,12,13,14,15] have also investigated the rotating stall in pumps by experimental methods based on reduced-scale models and numerical simulations. They captured the flow structures under rotating stall in the pump impeller and diffuser channel and analyzed the factors (including the flow rate and the blade number) influencing the characteristics of the rotating stall, such as propagation speed and so on.
To date, there are few studies on rotating stall in pump turbines, and a majority of these studies were performed through numerical simulation [3]. By using a k-ω shear stress transport (SST) turbulence model, Ran [16] conducted a numerical simulation on a rotating stall within two hump regions of an intermediate specific speed pump turbine at the guide vane opening of 22°. Erne et al. [17] predicted the stall flow in stay vane passages during the rotating stall phenomenon by conducting the unsteady Reynolds-Averaged Navier-Stokes (URANS) numerical simulation. By employing a large eddy simulation (LES) method, Pacotet al. [3] explored the flow pattern of the rotating stall in a pump turbine at a certain guide vane opening under operating conditions corresponding to 1/25 of the standard model test Reynolds number. Ješe [18] carried out unsteady CFD (computational fluid dynamics) simulation on a pump turbine in hump region conditions in pump mode by applying the URANS equation and k-ε turbulence model. The simulation result revealed the process of great fluctuation of the flow rate in the guide vane channels and corresponding evolutionary process of flow fields. They concluded that the occurrence of the rotating stall causes the reduction of the heads in the hump-shaped region. Sun [19] and Zuo et al. [20] investigated the flow field of pump turbines when rotating stall happened in conditions in the hump-shaped region and analyzed the reason resulting in humps through numerical calculation based on a ν2-f nonlinear turbulence model. Yang et al. [21] employed a modified Partially-Averaged Navier-Stokes (MPANS) model and depicted the propagation of the rotating stall from both Eulerian and Lagrangian evidence at the drooping point of the performance curve (positive slope) of a pump turbine in pump mode. Many other numerical studies have revealed the existence of rotating stall and its impact to the stability of the pump turbine at working conditions within the hump-shaped region of pump-turbines [22,23,24].
Due to certain restrictions on experimental conditions at the high-pressure side of a pump turbine, the flow field measurement experiments of rotating stall around the guide vanes are seldom carried out. By combining a high-speed image display system for bubbles and pressure fluctuation measurement, Yang et al. [25] investigated the rotating stall occurring in model pump turbines. Hasmatuchi [26] explored the rotating stall found in the guide vane zone of a pump turbine in turbine mode by applying bubble injection.
Braun [27] explored the rotating stall occurring under part load conditions of a low specific speed pump turbine model in pump mode by integrating pressure fluctuation measurement and laser Doppler velocity (LDV) measurement techniques. The test result revealed the movement of the stall cells from one guide vane channel to another according to pressure fluctuation measurements; the averaged velocity distributions at the runner exit and the inlet of guide vane channels were obtained. Guggenberger et al. [28] and Ciocan et al. [29] carried out PIV measurement on internal flows around guide vanes of a model pump turbine under conditions in the hump-shaped region of one fixed guide vane opening. The instantaneous flow field was attained when vortex and backflow occurred in the guide vane channel. During the experiment, to realize the illumination conditions required by PIV measurement, the number of stay vanes was reduced.
In general, PIV measurements on the rotating stall were carried out on a simplified model that disturbed the flow similarity, and the evolution and propagation mechanism of the rotating stall have not been clarified completely. The flow field measurement data of the rotating stall is also insufficient. In this study, a periscopic endoscope for laser sheets was applied and specifically designed model components and experimental device for PIV measurement were developed. Compared to the previous studies, all the stay vanes were retained so that the flow passage of the measured pump turbine model met the geometrical similarity requirements of the International Electrotechnical Commission (IEC) standard [30]. Based on these conditions, systematic PIV measurements were performed on the flow fields around guide vanes of a pump turbine model on the high-precision model test platform. Transient flow pattern and evolution process of the rotating stall in the guide vane channels were revealed by direct flow field measurement for the first time. The measurements were carried out on both guide vane openings with and without hump phenomenon. For a better understanding of the impact of the rotating stall on the energy performance of the pump turbine, loss analysis was applied according to the PIV measurement data in the measured area. This study further facilitates the optimization design of pump turbines and operation stabilization of PSP.
2. Pump Turbine Model Investigated and Experimental Setup
2.1. Model Test Platform and Pumpturbine Model
Measurements were performed on the TP3 high-precision model test platform at theHydraulic Machinery Laboratory of the China Institute of Water Resources and Hydropower Research (IWHR) [31]. The measurement accuracy of all test parameters and operation stability all satisfied the requirements of the IEC standard [30]. The comprehensive error of the platform in the model efficiency test was less than ±0.2%.
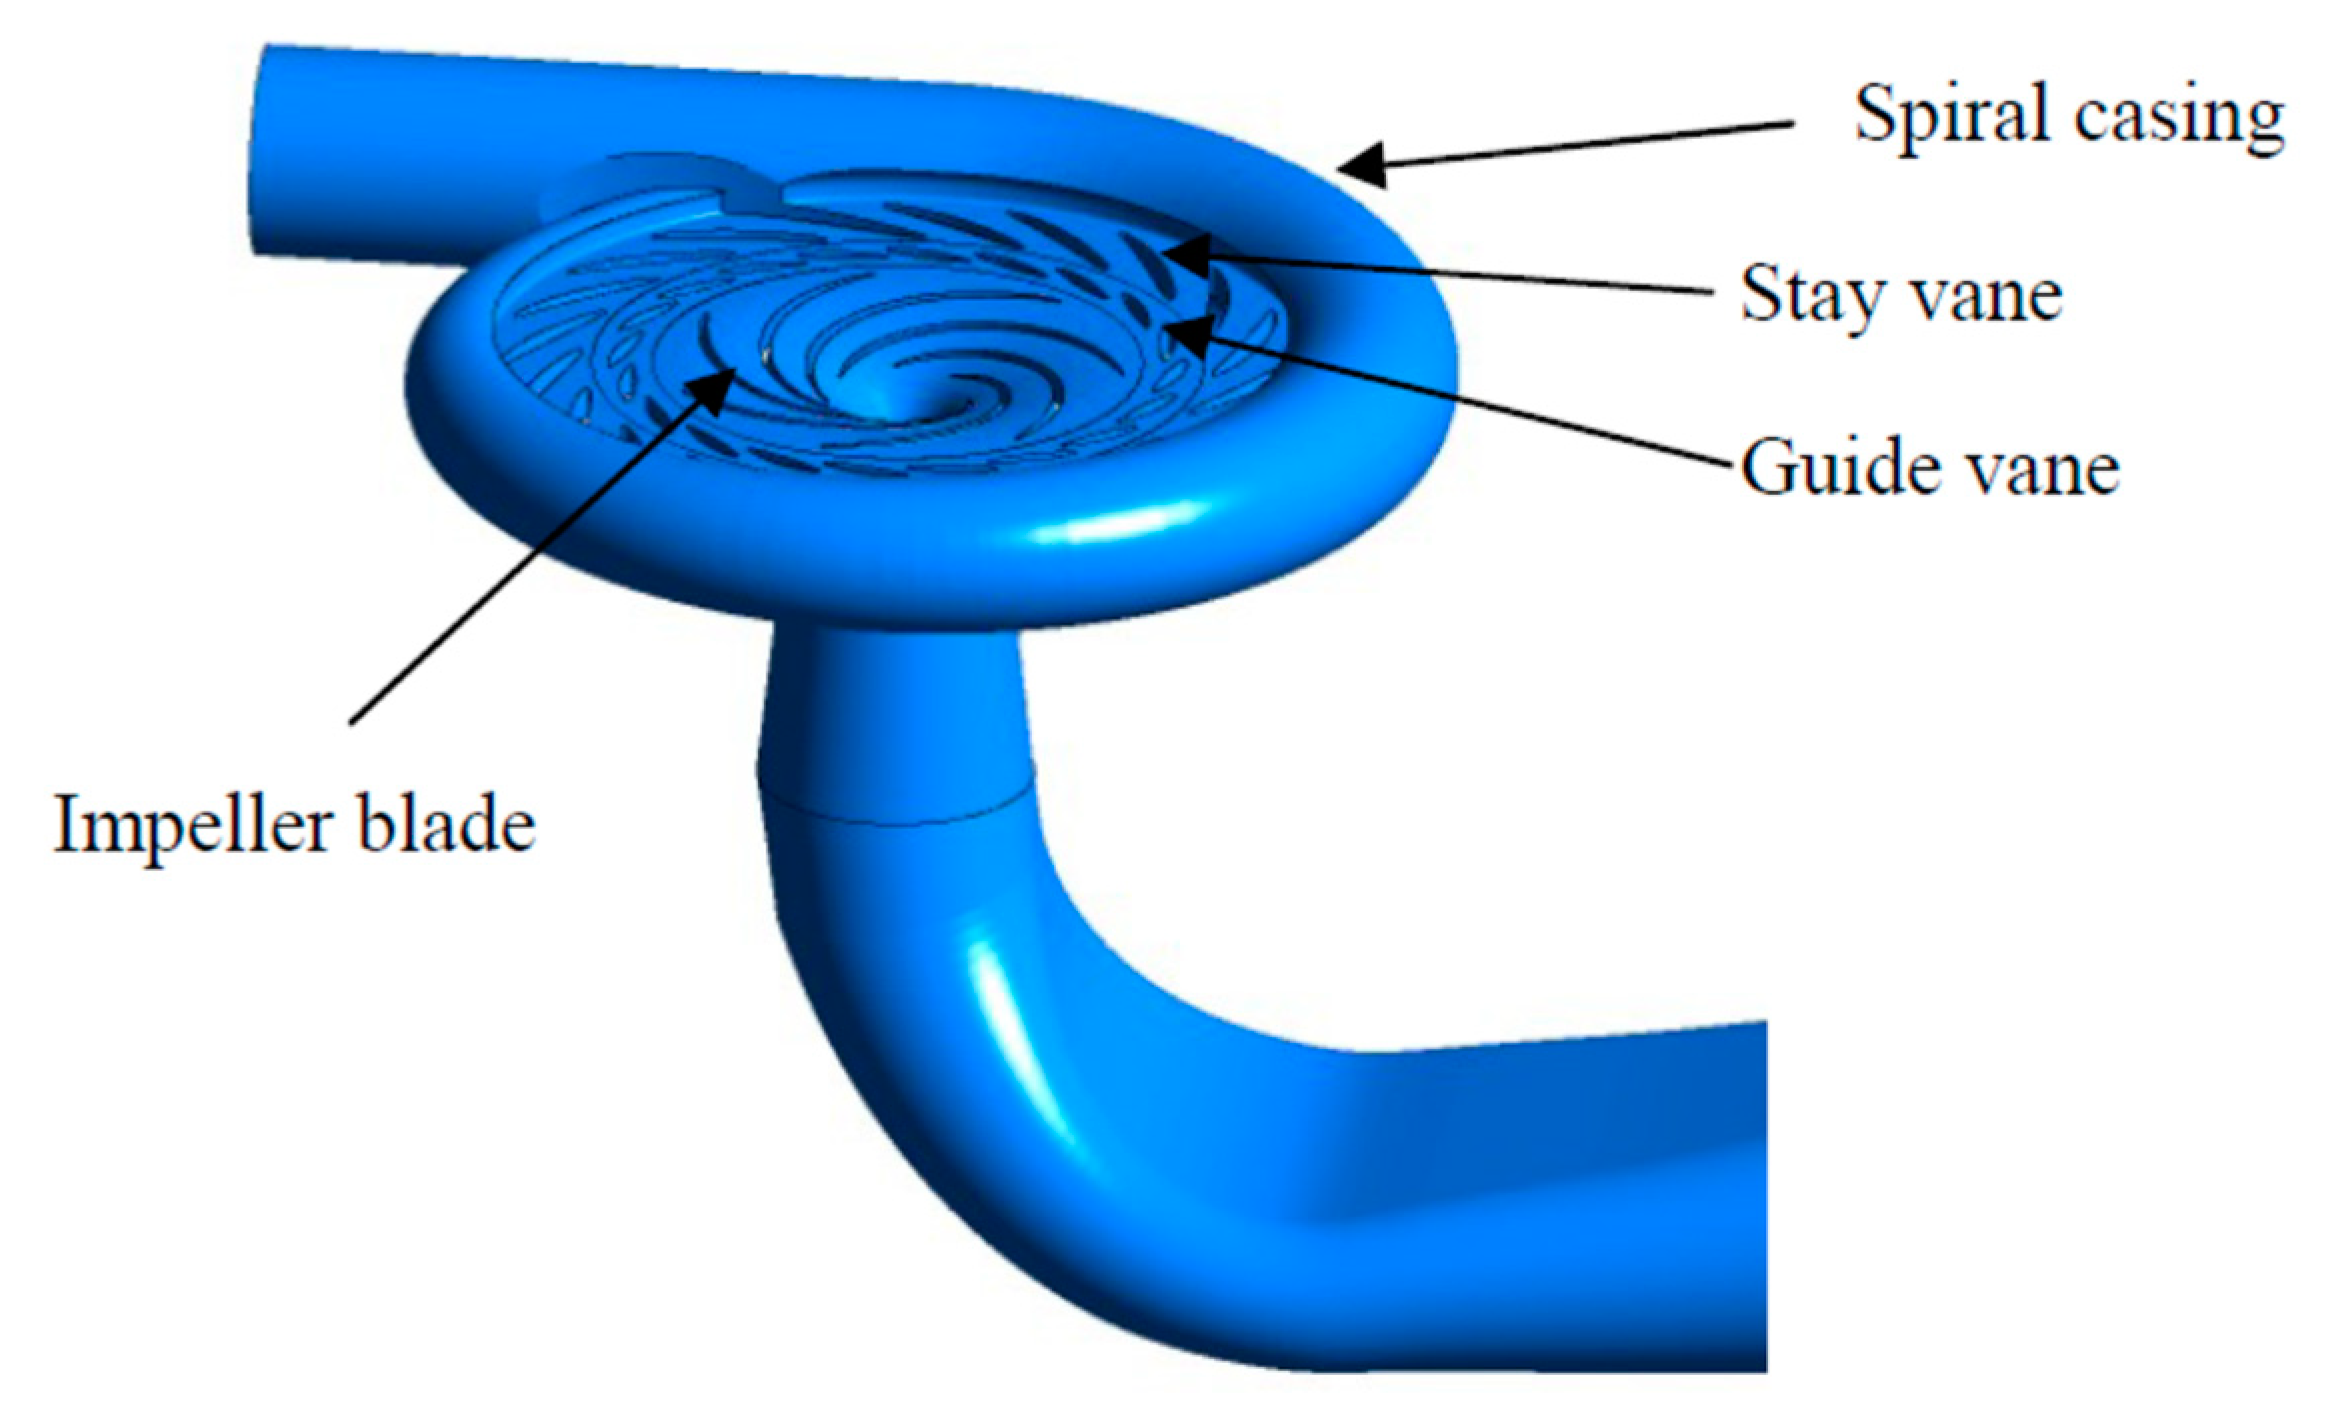
A low specific speed (, where n, Q and H represent the rotating speed, the flow rate and the head, respectively) pump turbine model was investigated in this study, and its geometric parameters are listed in Table 1. Figure 1 is the 3D schematic map of the pump-turbine model (fluid domain). Low specific speed pump turbines were characterized by the long and flat flow passages from the middle part of the impeller to the outlet of the stay vanes. Thus, flow velocity was relatively uniformly distributed along the axial direction for most working conditions, and the velocity in the axial direction was much smaller compared to the velocity in the horizontal plane. Two-dimensional particle image velocimetry (PIV) was applied to measure the flow field in a plane normal to the rotation axis of the rotor (50% channel height, mid-span plane) on the pressure side in the vaneless space and the region around a guide vane.
2.2. PIV System
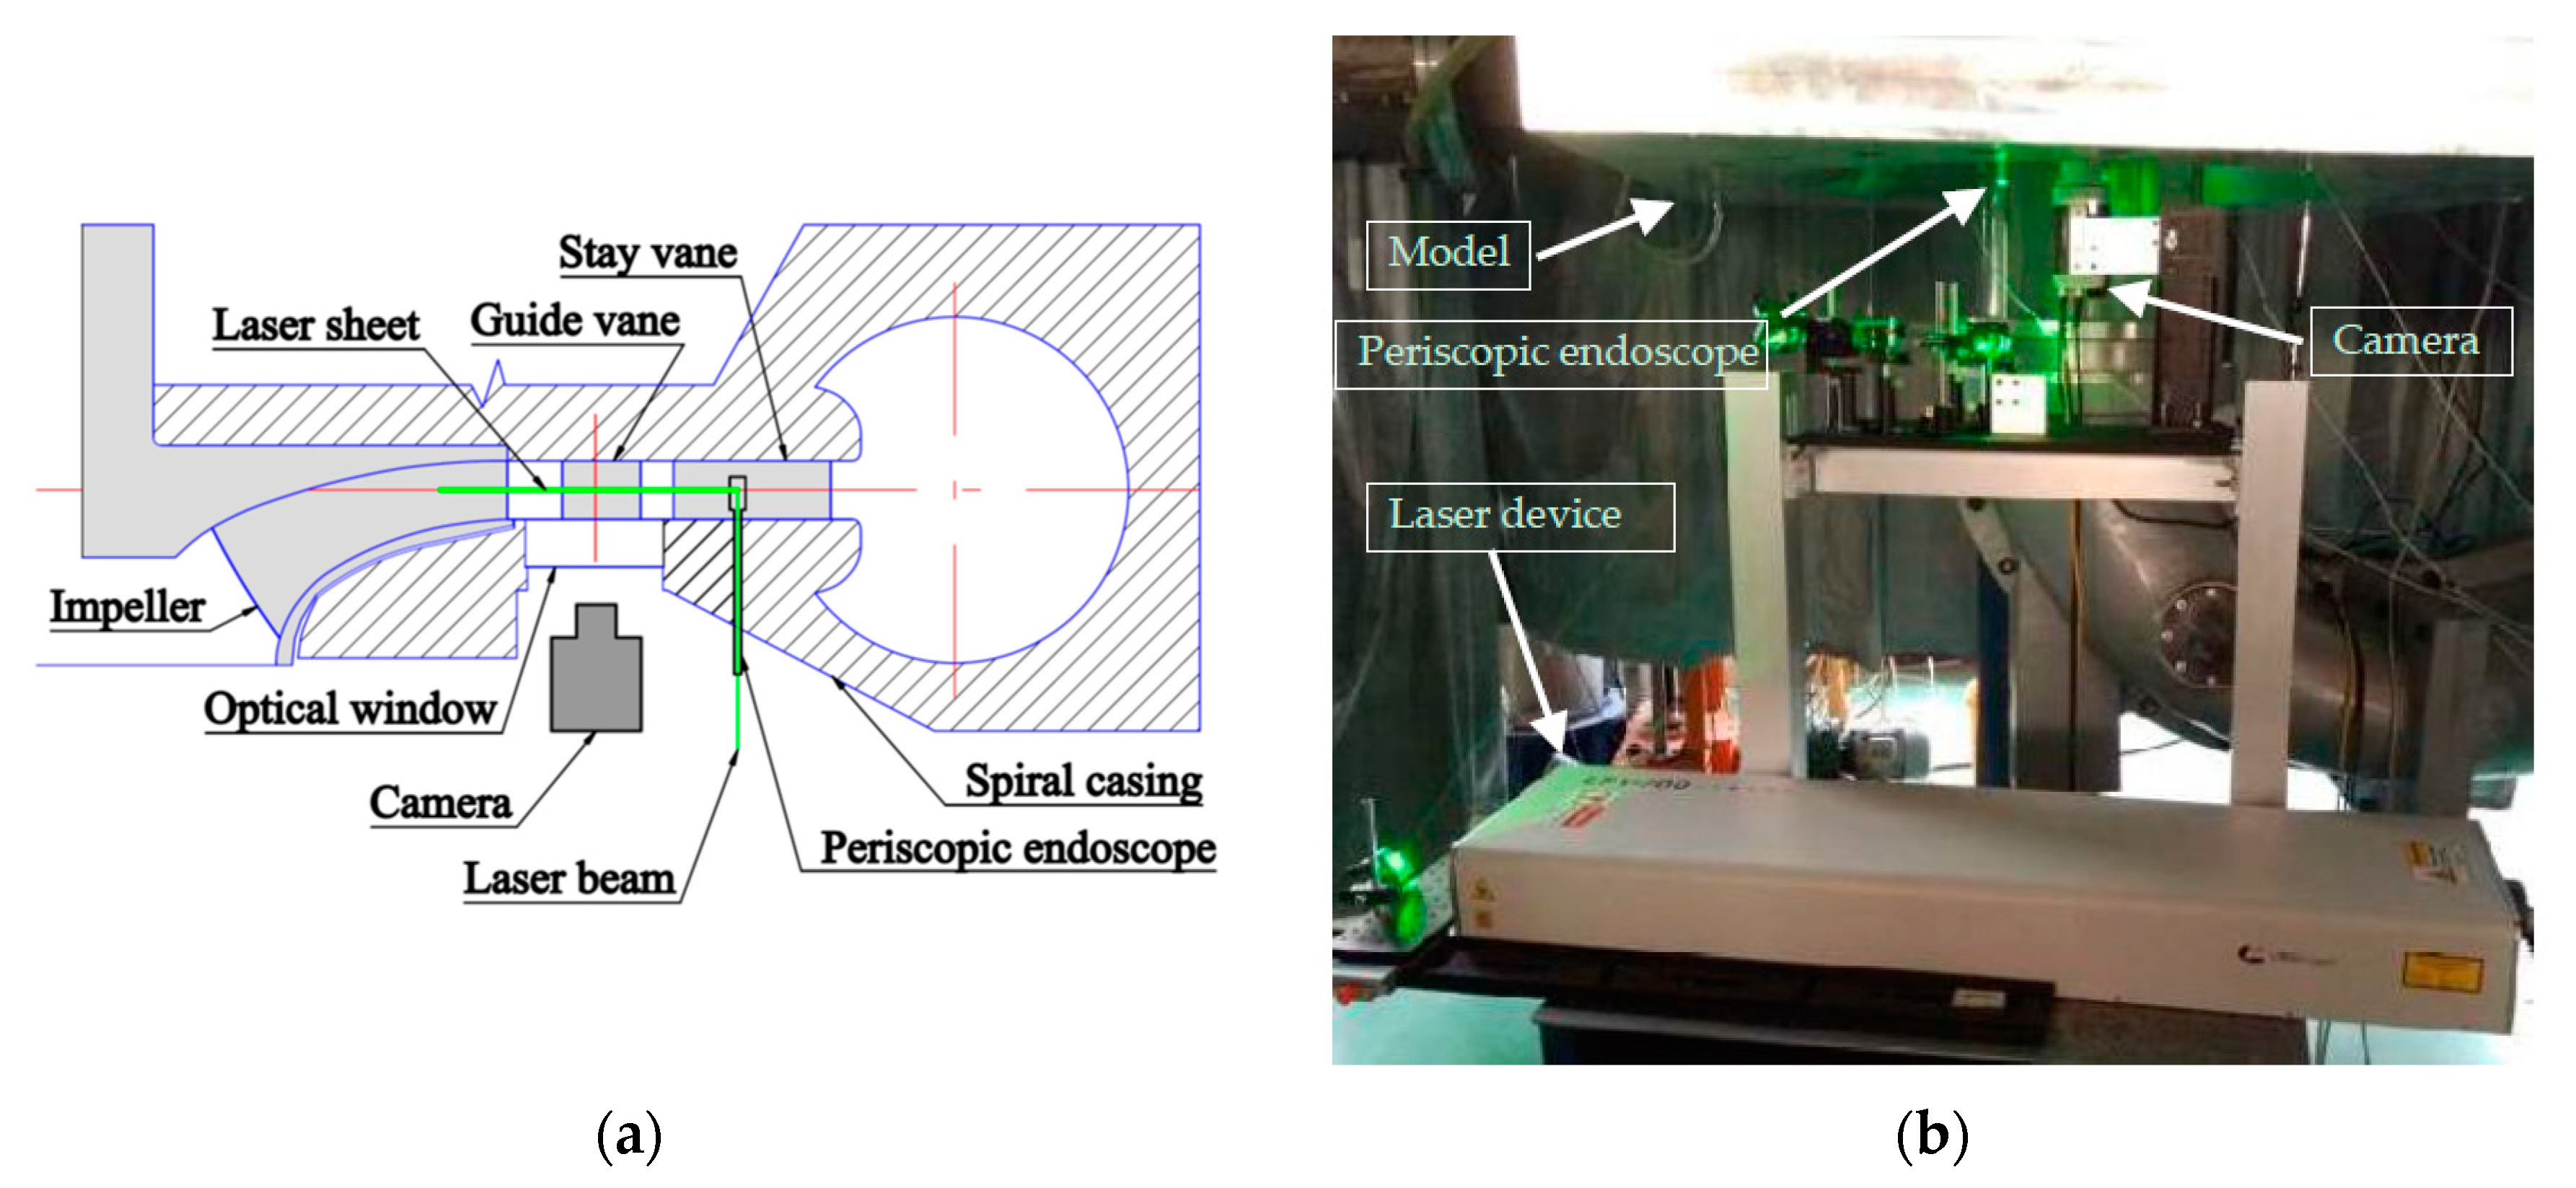
During PIV measurement, a laser sheet with thickness of 1mm was formed when the laser beam was radiated from the bottom of the model unit into the periscopic endoscope located in the stay vane. The laser sheet illuminated the measurement area after passing through the transparent guide vane. Figure 2 shows the experimental setup and the measurement plane. In this way, geometric similarity requirements were fulfilled according to the IEC standard [30]. The laser sheet was formed closer to the measurement area, so a high-quality laser sheet was more easily realized. To decrease the interference of metal surface reflection on PIV measurement, the flow passage components in the vicinity of the measured zone were all blackened.
In the experiment, the basic PIV measurement system and analysis software produced by LaVision were applied. The illuminating system is composed of 2 Nd:YAG laser units, each delivering a short impulse of 532 nm and 100 mJ energy at 100 Hz frequency. A Phantom M410 camera of 2560 × 1600 pixels was installed below the central position of the measured zone, which was perpendicular to the measured plane. The water is seeded by glass hollow spheres with mean diameter of approximately 20 μm and density of 1.1 g/cm3. Two-dimensional velocity measurement of the flow field was carried out during the experiment.
The PIV-system was triggered by an encoder attached at the runner axis according to the runner position. In the measurement process of each working condition, the measurement started when the specific runner blade rotated to the same position, in which the shooting lasted for 5s at a constant frequency of 100 Hz. At these conditions, 500 measured results for the flow field were acquired. The accuracy of the PIV data of this experiment is 2%~4% according to Raffel [32] and the main focus of the present study is on the detection of large-scale structures during the rotating stall.
3. Results and Analysis
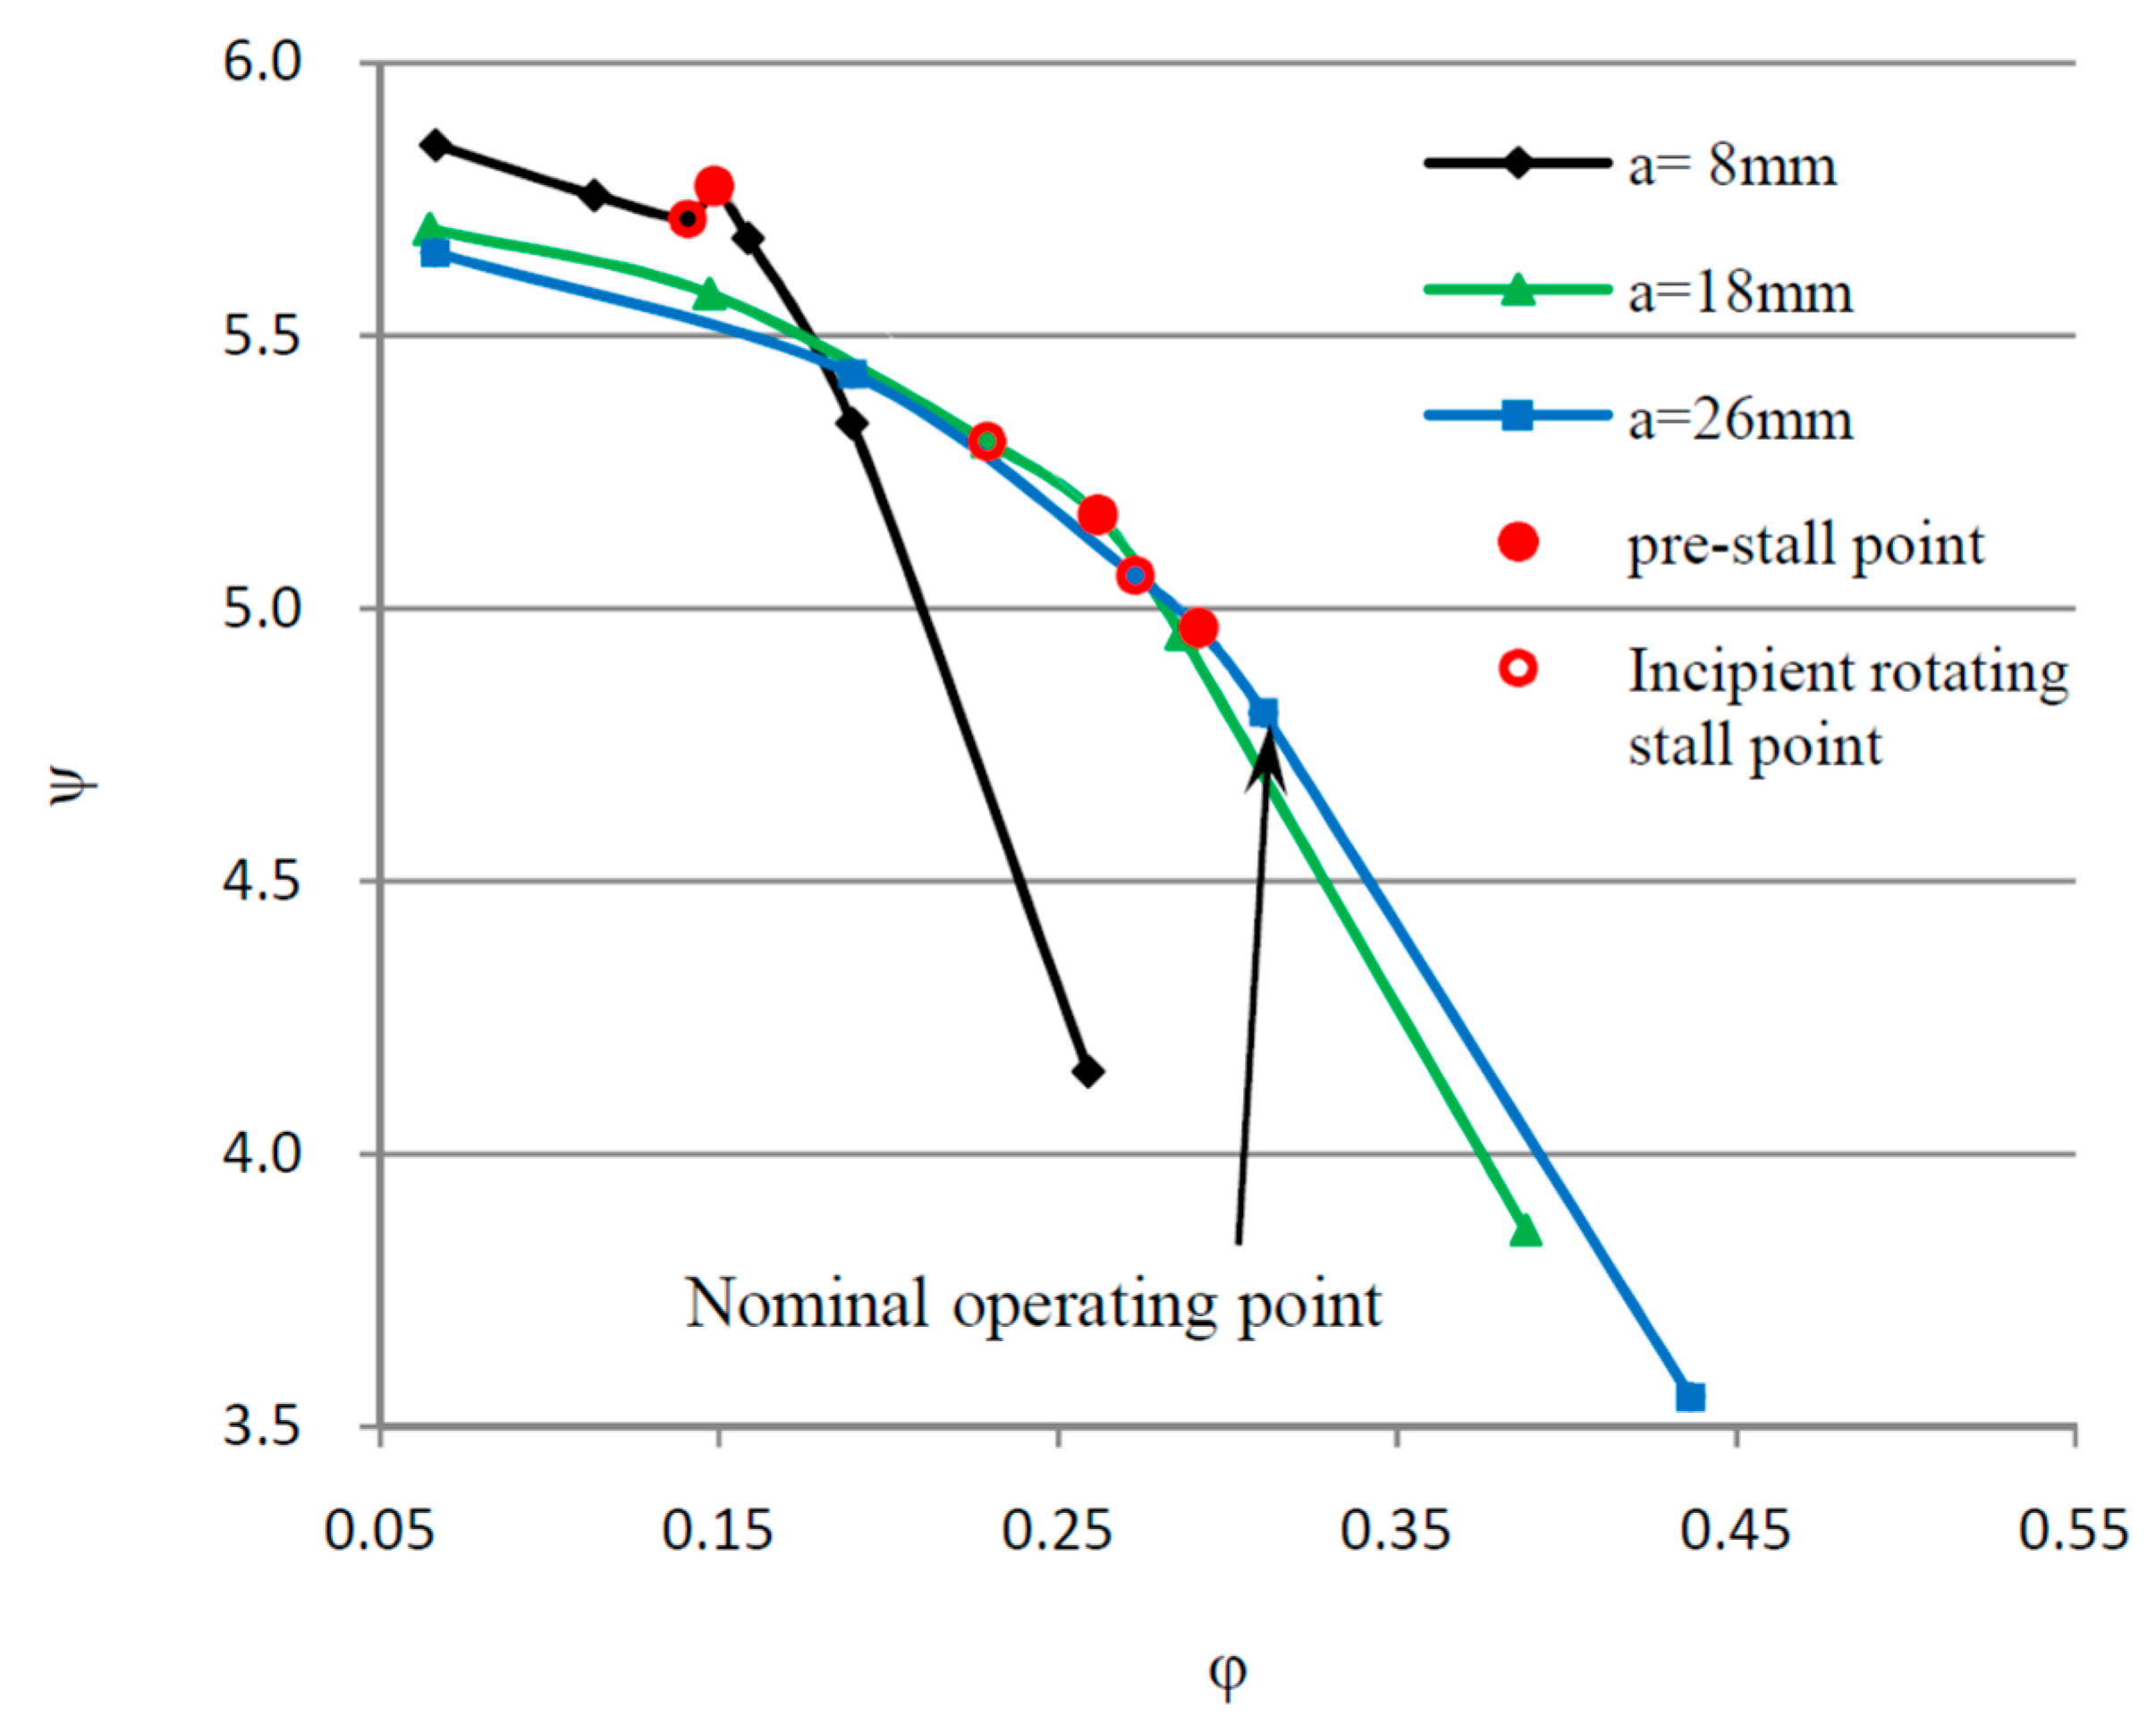
Three openings were selected for the PIV measurements, including the optimal opening (a = 26 mm), the medium opening (a = 18 mm) and the 8 mm opening at which the hump phenomenon occurred. At each opening, 6~7 operating points were measured and consisted of large flow rate conditions, the optimal condition and part-load conditions. The pump performance curves and the specific parameters of measurement working conditions are presented in Figure 3 and Table 2. The flow coefficient φ and head coefficient ψ were calculated according to Equations (1) and (2). The measurements were conducted successively by reducing the flow rate at each opening.
where ω and E, respectively, represent the impeller angular velocity and specific hydraulic energy.
At the 8 mm opening, no stall appeared in the guide vane channel, and the flow is relatively stable when the flow rate is larger than the flow rate of the x4 condition. Reducing the flow rate from the x4 condition, the flow field in the guide vane zone started to fluctuate greatly. Furthermore, it was not possible to run a stable operation between the conditions of x4 and x3. At the x3 condition, the rotating stall appeared in guide vane channels, which always existed in the subsequent working condition with smaller flows. At the 18 mm and 26 mm openings, although humps did not appear, a similar phenomenon was found. Therefore, the working conditions x4, z4 and y4 were separately taken as the pre-stall points of each guide vane opening, and the working conditions x3, z3 and y3 were taken as the incipient rotating stall points of each guide vane opening.
3.1. Analysis of the Flow Fields Subjected to Rotating Stall
To analyze the evolutionary mechanism of the rotating stall in the guide vane channels, the working condition z2 at the medium opening (18 mm) was taken as an example for detailed flow field analysis. To analyze and present the change characteristics of flow at different positions within the measured zone during rotating stall, specific analysis objects were selected. Flowing parameters of the objects were analyzed and compared in detail.
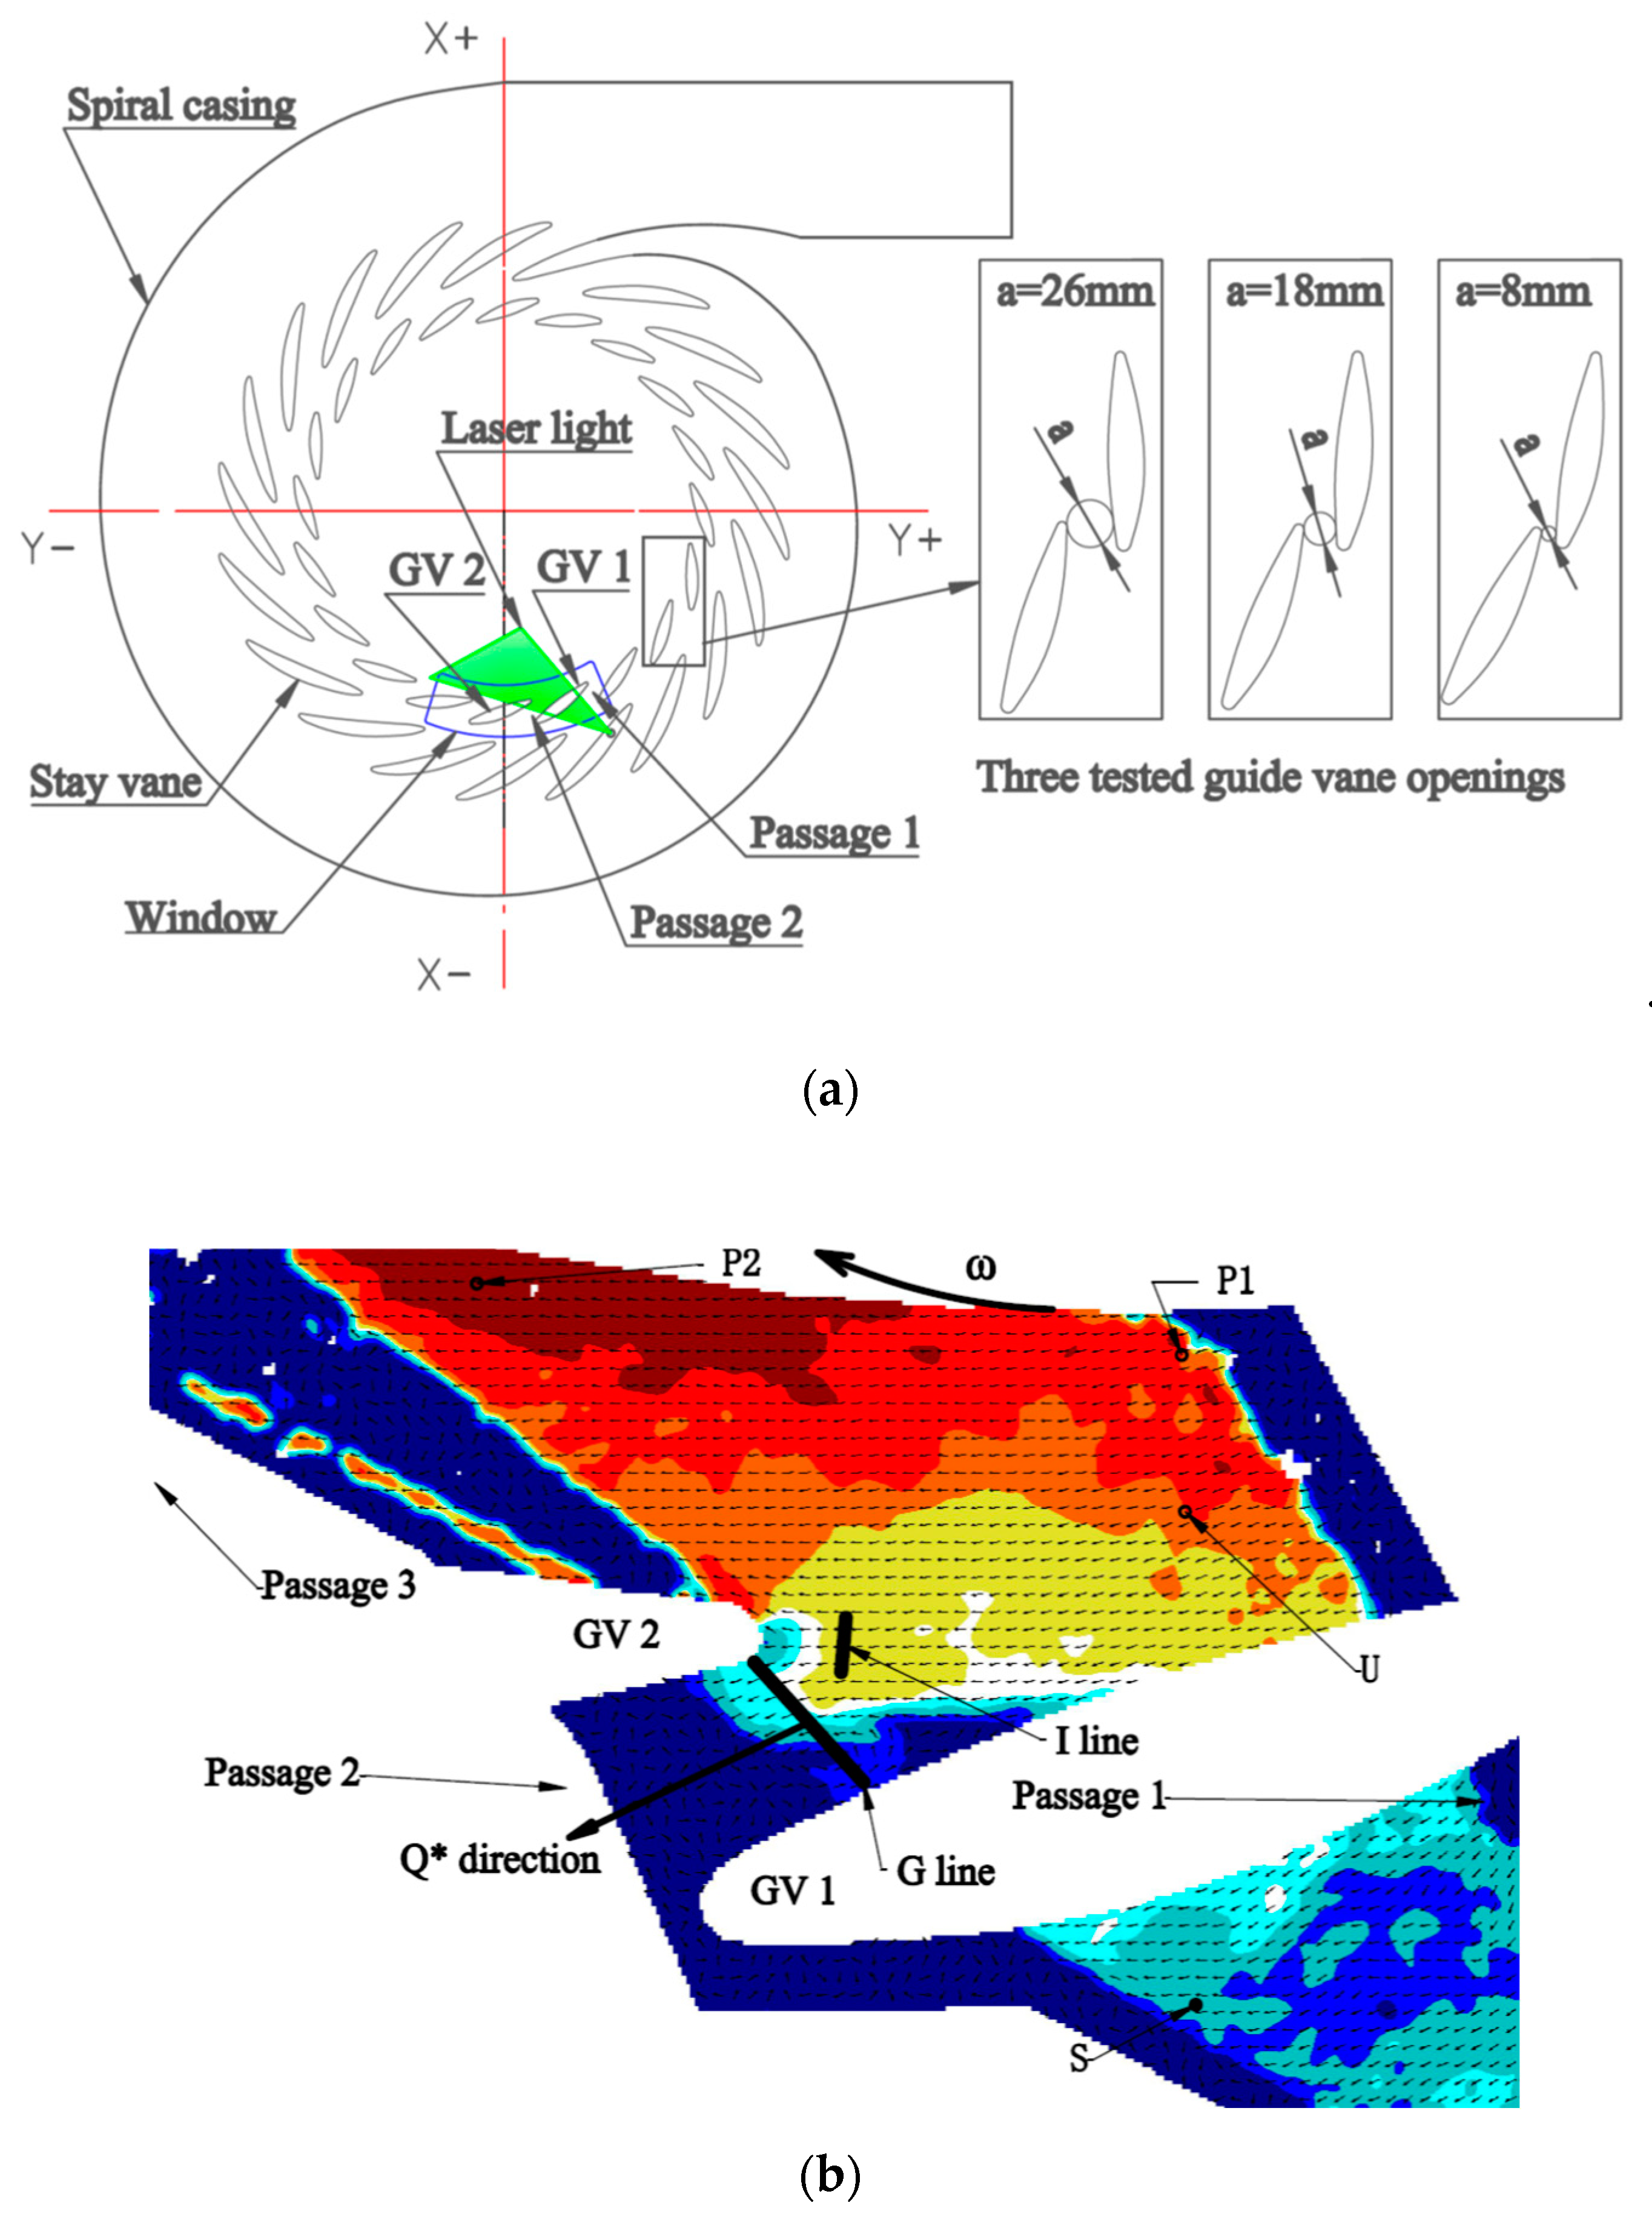
Figure 4a shows the location of the measured window from the bottom view. Figure 4b shows the positions of analysis objects for flow velocity. The guide vanes in the figure were separately marked as GV1 and GV2 along the impeller rotation direction. Corresponding flow channels between these guide vanes were separately named as Passage 1, 2 and 3. Points P1 and P2 close to the impeller exit were located on the same radius r (r = 1.07 D1/2). Point U was situated in the vaneless space upstream of the GV2. The I line is located 11% of the guide vane chord length away from the leading edge of GV2 in the direction across the center of the impeller. The angle of attack (αg) of the approaching flow to GV2 is defined as the difference between the setting angle of GV2 and the averaged flow angle measured on the I line. The black line segment within Passage 2 referred to the G line for measuring the flow rate passing through the channel in the measurement plane. Point S was located in the space between the stay vane and guide vane and was also at the exit of Passage 1.
3.1.1. Flow Fields Analysis in the Evolutionary Process of the Rotating Stall
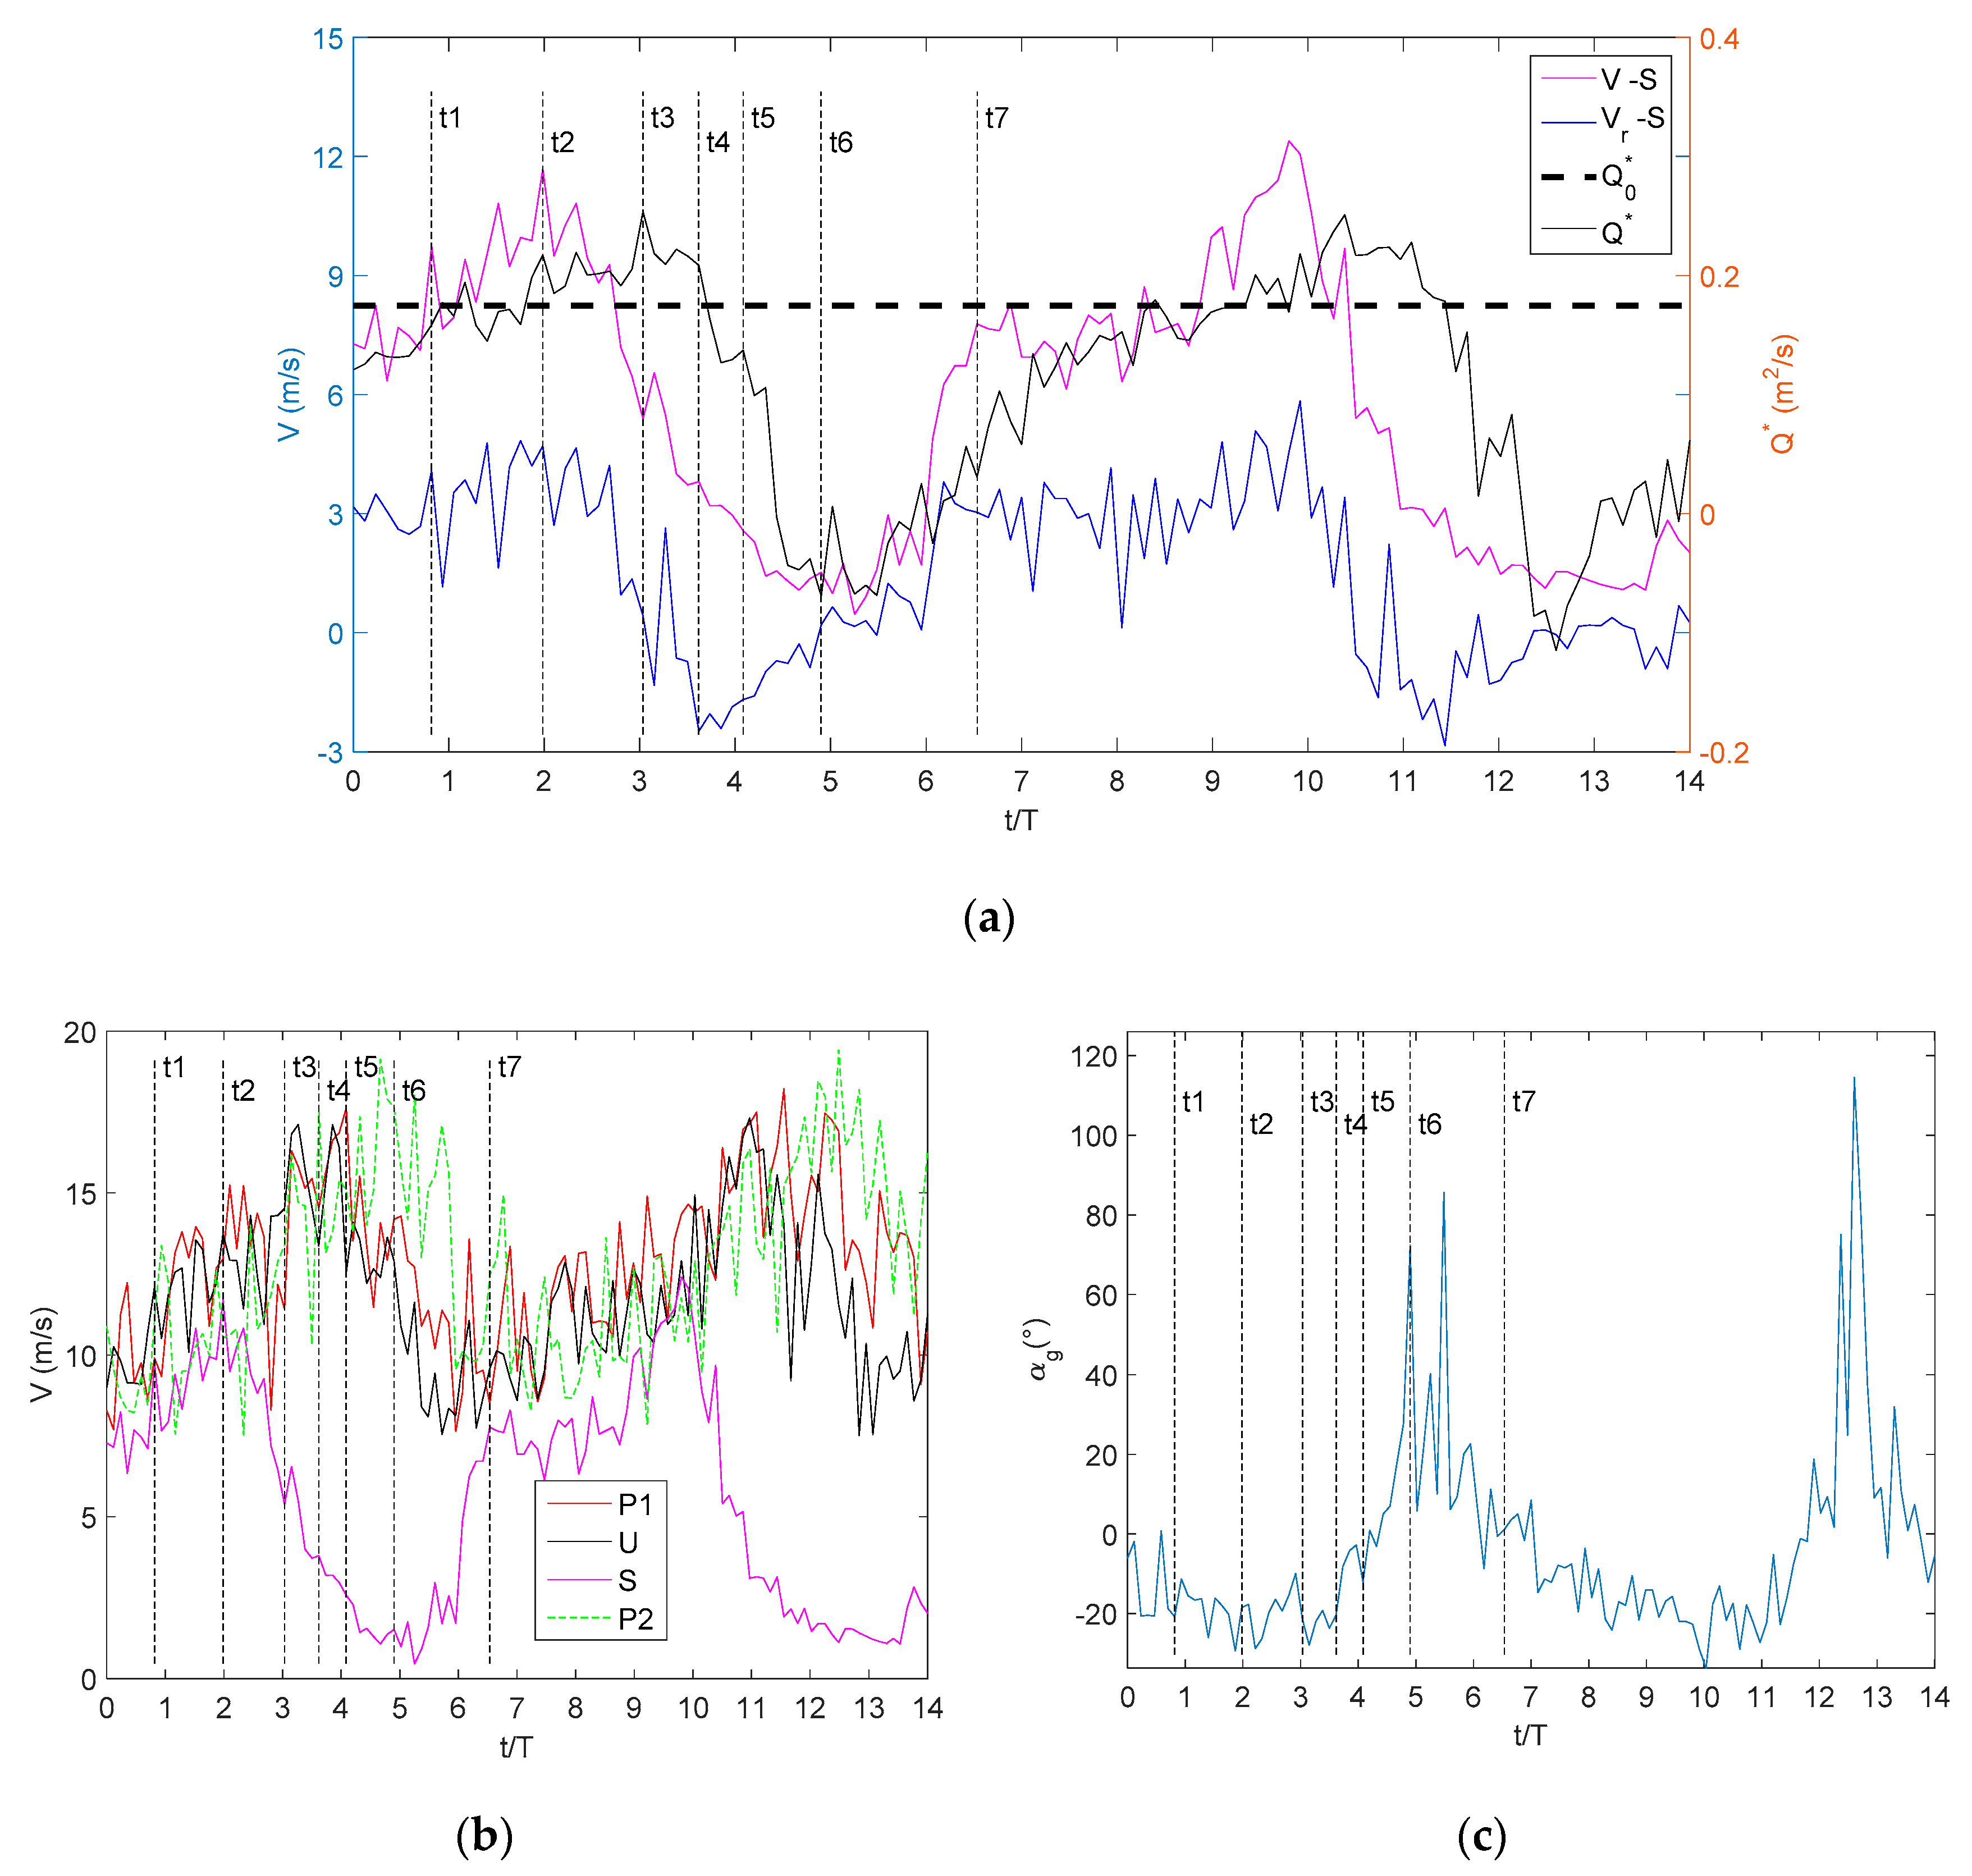
Figure 5 displays the time domains of the measured flow parameters of various analysis objects within a period of rotating stall, and T represents the time period of one impeller revolution. t1~t7 present a series of key moments in the development process of the rotating stall. Figure 5a shows the time history of two-dimensional flow Q* crossing the G line within Passage 2, the flow velocity at the point S and its radial direction component Vr. Figure 5b displays the time history of flow velocities at points P1, P2, U and S. Figure 5c presents the time history of the angle of attack αg of the approaching flow to GV2. Figure 6 displays the flow fields obtained through PIV measurements at typical moments during the rotating stall process presented in Figure 5.
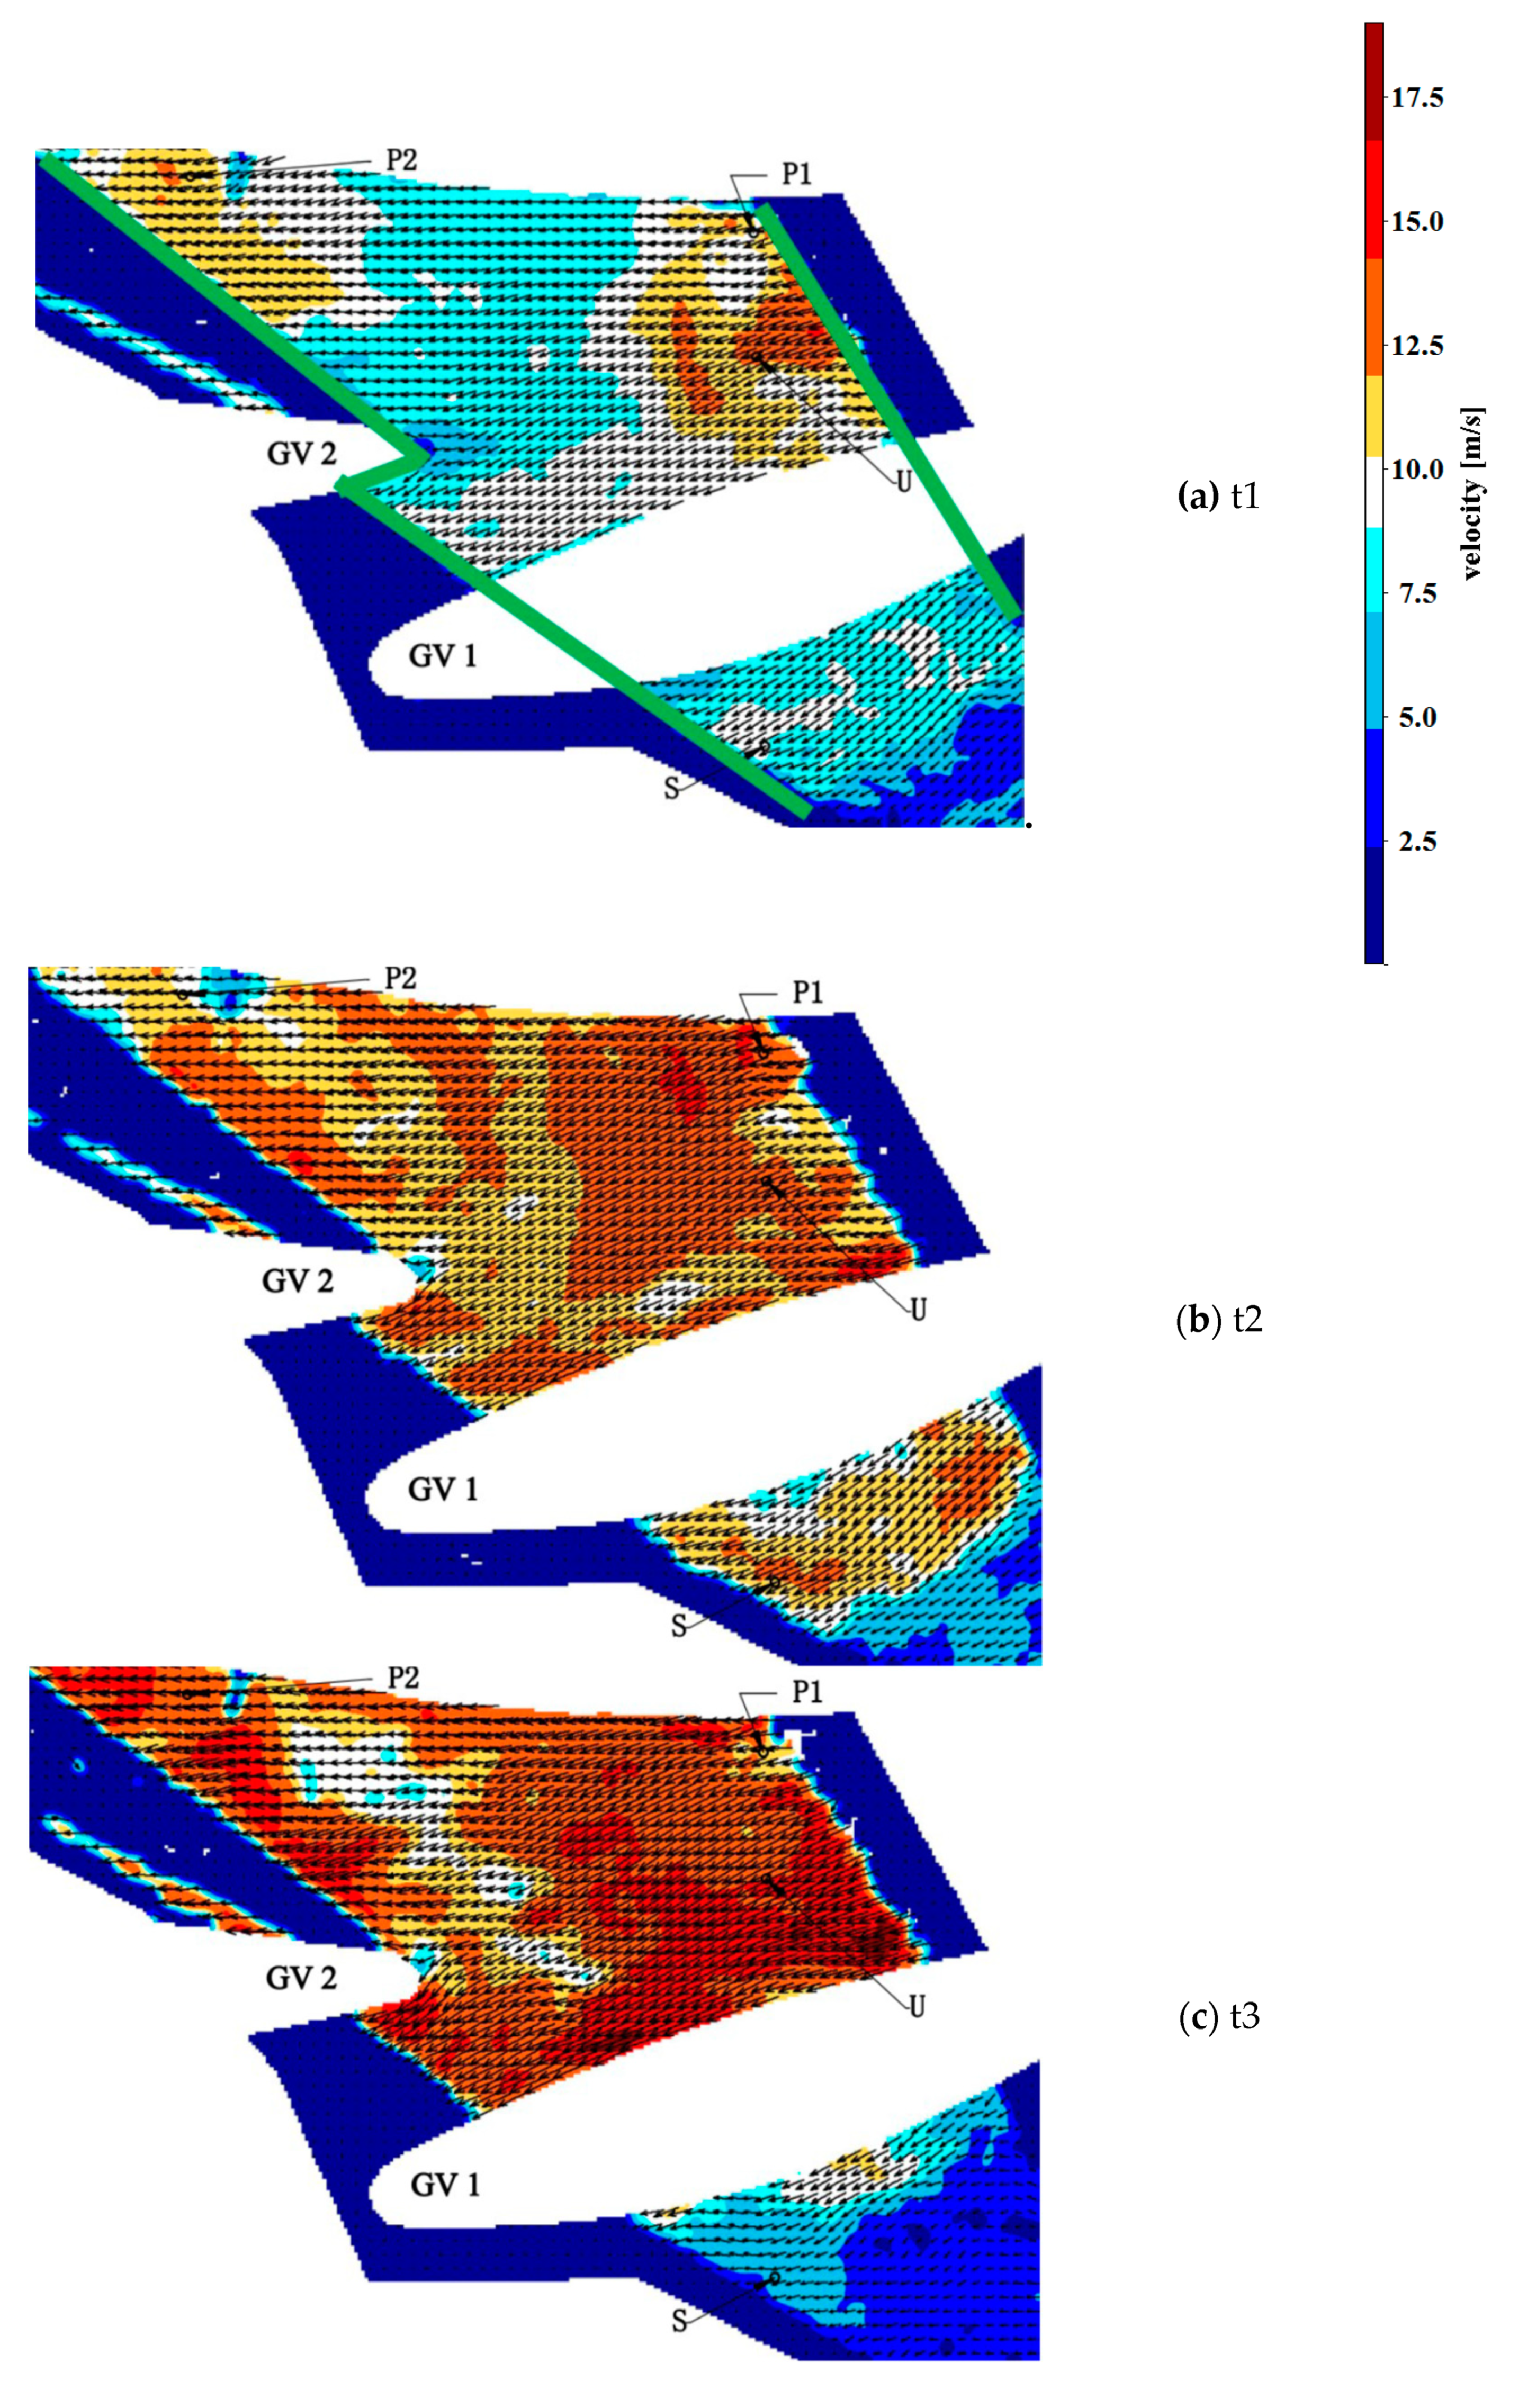
At t1, water smoothly flowed within Passage 2 (Figure 6a), which was in the steady flow stage after a previous period of rotating stall. At t2, the flow velocity (Figure 5a) at point S reached the maximum and decreased rapidly in the t2~t3 time period. This decrease indicated that the flow within Passage 1 reached the maximum at first and then rapidly decreased when Passage 1 started to stall, causing the flow within Passage 2 to increase further and reach the maximum at t3 (Figure 5a).
During the t3~t6 time period, the flow within Passage 2 decreased rapidly, and stall appeared (Figure 5a).
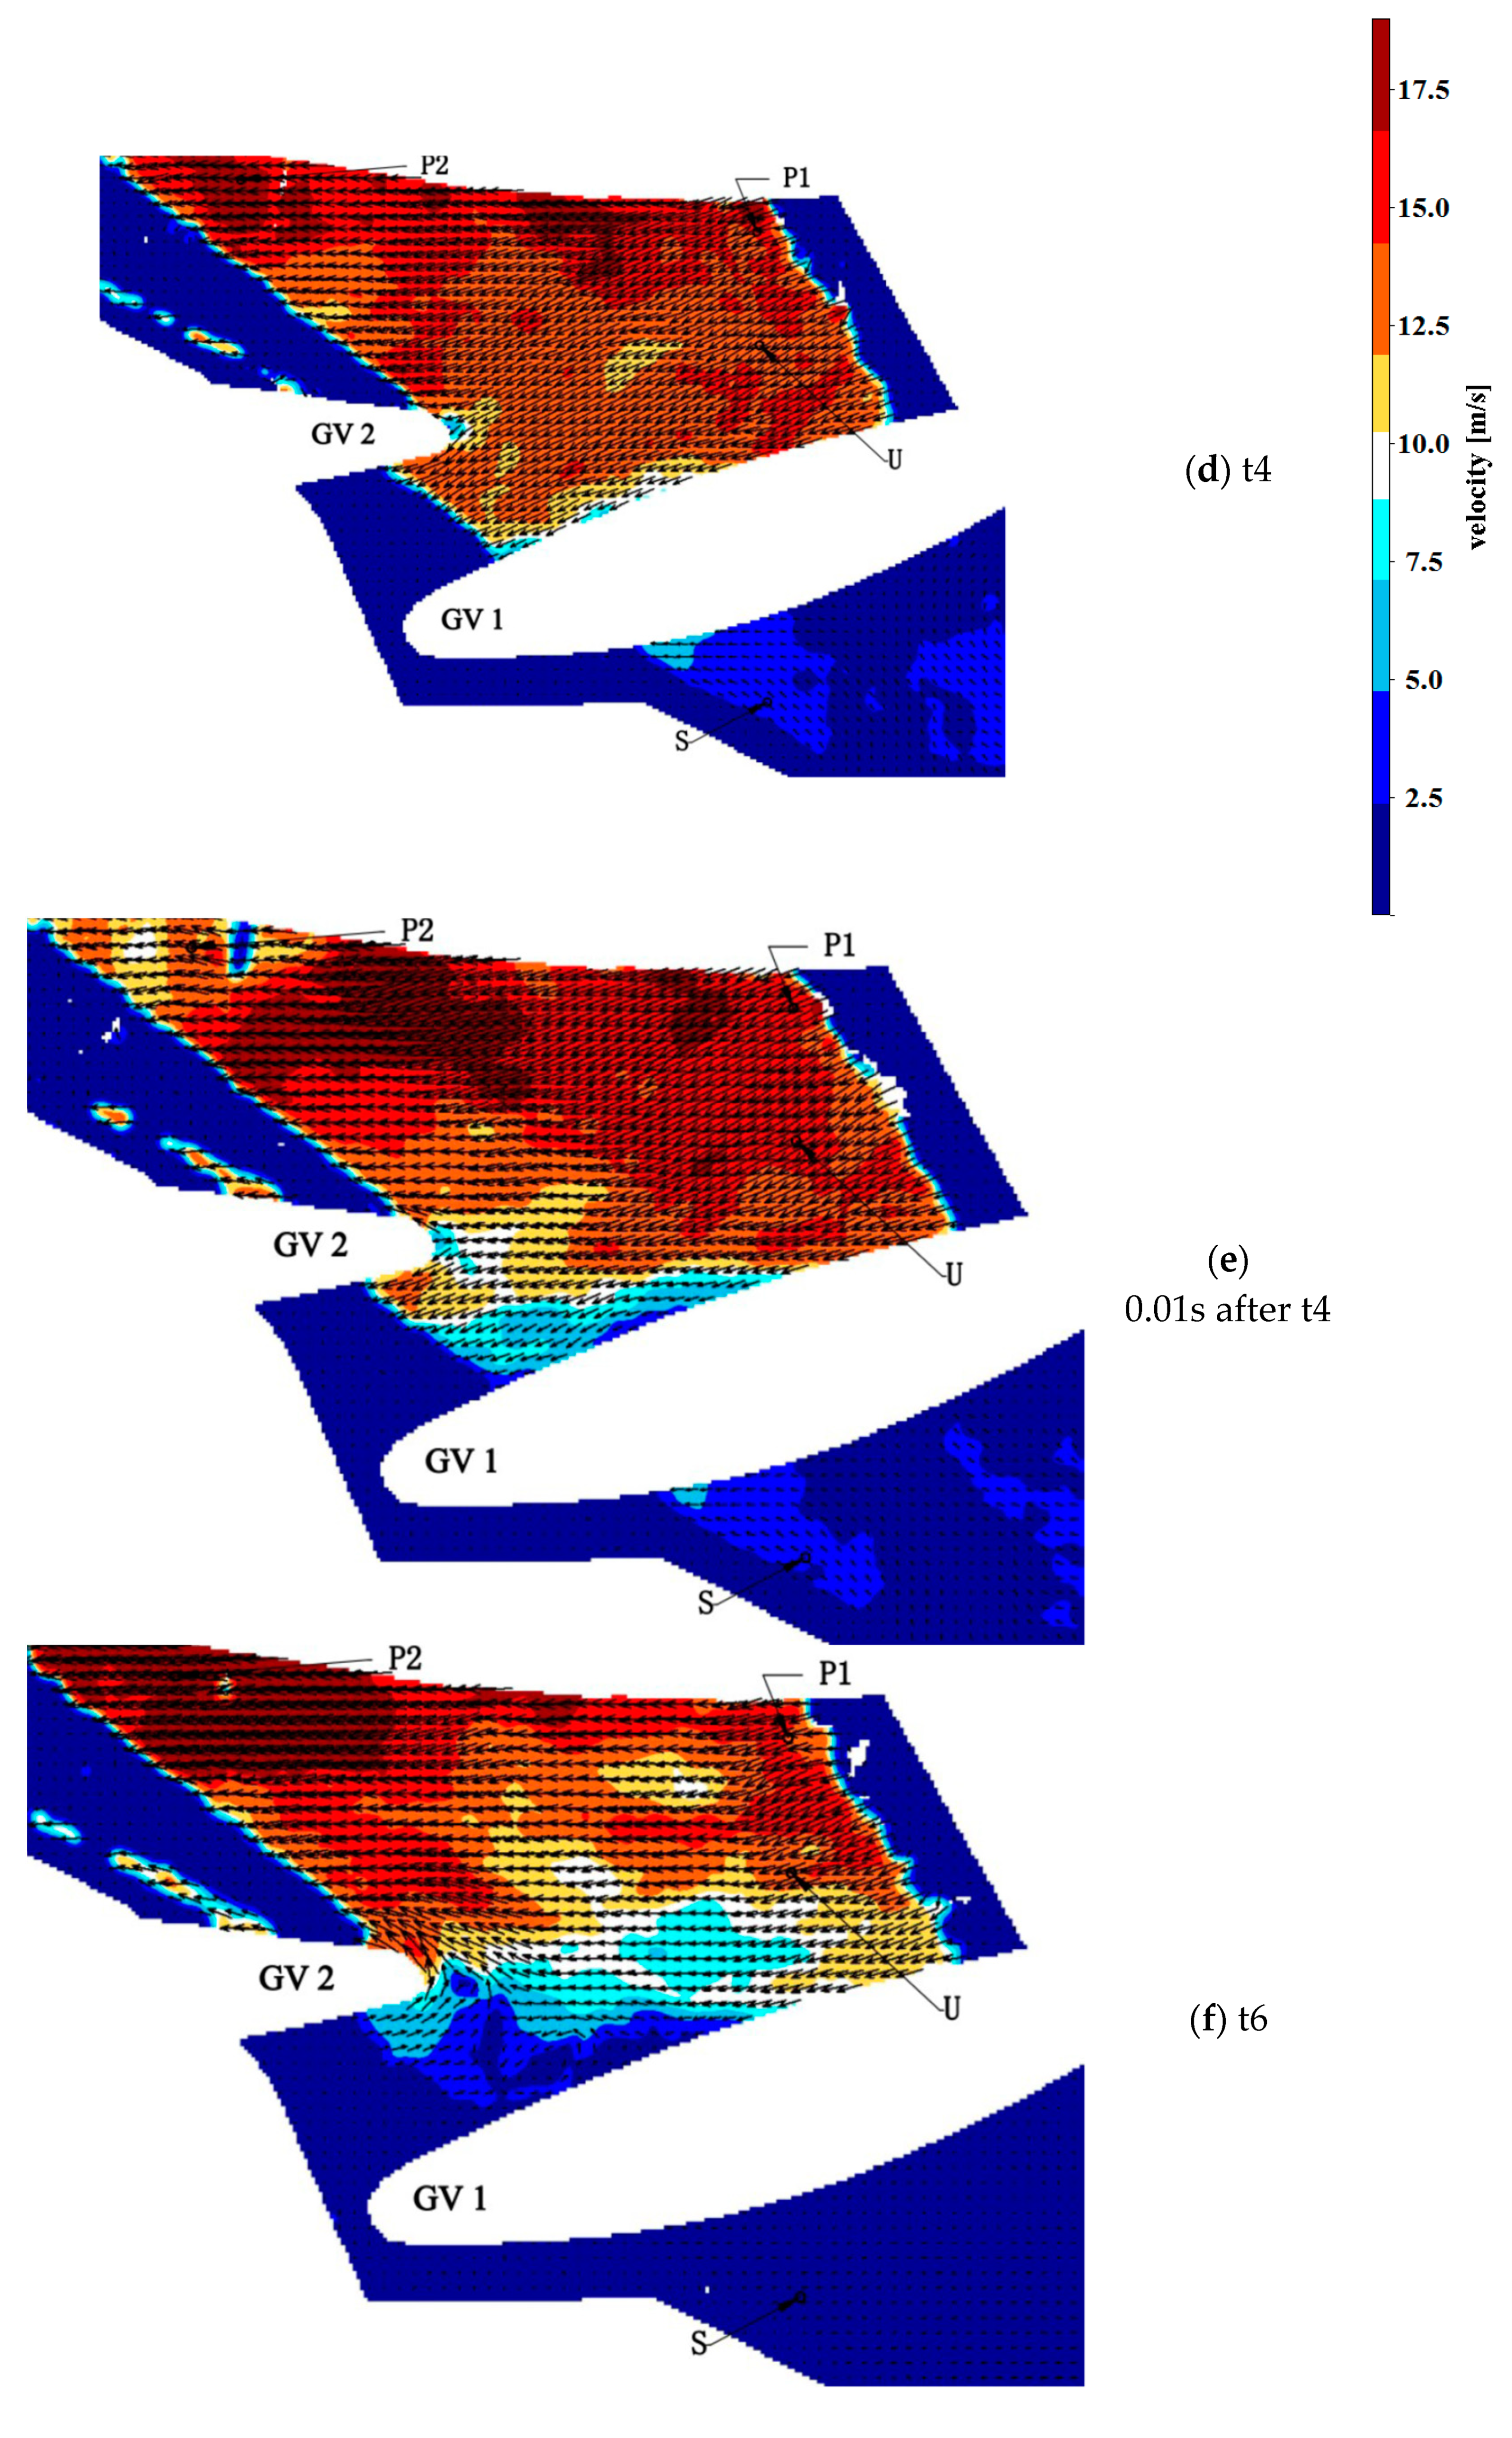
In the first stage (t3~t5), when flows decreased, the reduction of discharge was caused by the great growth of the pressure at the exit of the flow channels. At t4, the radial component of flow velocity at point S reached the inverse maximum (Figure 5a). Figure 6d shows that the water rushed directly to GV1 from the stay vane side under the effect of external high pressure from the spiral casing side; then they separately flowed to Passage 1 and Passage 2. Thus, the static pressure at the exit of Passage 2 increased significantly, which is to be expected according to Bernoulli’s equation. As a result, after 0.01s (Figure 6e), serious flow separation happened on the suction surface of the GV1 within the range of approximately a half-chord length. The flow-separation zone occupied Passage 2, thus leading to the rapid reduction of discharge through it.
In the second stage (t5~t6), the reduction of discharge was caused by the adverse pressure gradient formed due to the great decrease of the static pressure in front of the guide vane channel. In the first stage during which flow decreased, the velocity in front of the inlet of Passage 2 increased gradually and approximated the maximum. After Passage 1 was significantly blocked due to the occurrence of stall, more water flowed to Passage 2 and Passage 3. Therefore, the flow velocities in the vaneless space in front of the GV2 increased remarkably. The flow velocities at points P1 and U successively reached the maxima at a time close to t5. The maximum velocity at the P1 was 1.4 times of the mean value. According to Bernoulli’s equation, the pressure in front of Passage 2 was greatly reduced under this condition. Based on high-pressure water flows at the exit of Passage 2, the adverse pressure gradient within Passage 2 was likely the maximum. Under the effect of a great adverse pressure gradient, the flow in Passage 2 continued to decrease rapidly.
At t6, the flow within Passage 2 decreased to the minimum, and water flowed completely to the vaneless space from the high-pressure side outside the guide vanes. Figure 6f shows that the GV1 was just subjected to flow separation from the half-chord length position, and the flow-separation region covered the entirety of Passage 2. From the exit of Passage 2, water flowed in reverse to the vaneless space and to the next guide vane channel, bypassing the head of the GV2 and causing the velocity in the vaneless space at the left upper part in the figure to increase greatly (Figure 5b, velocity at P2 reached the maximum), which created conditions for the occurrence of stall in the next guide vane channel.
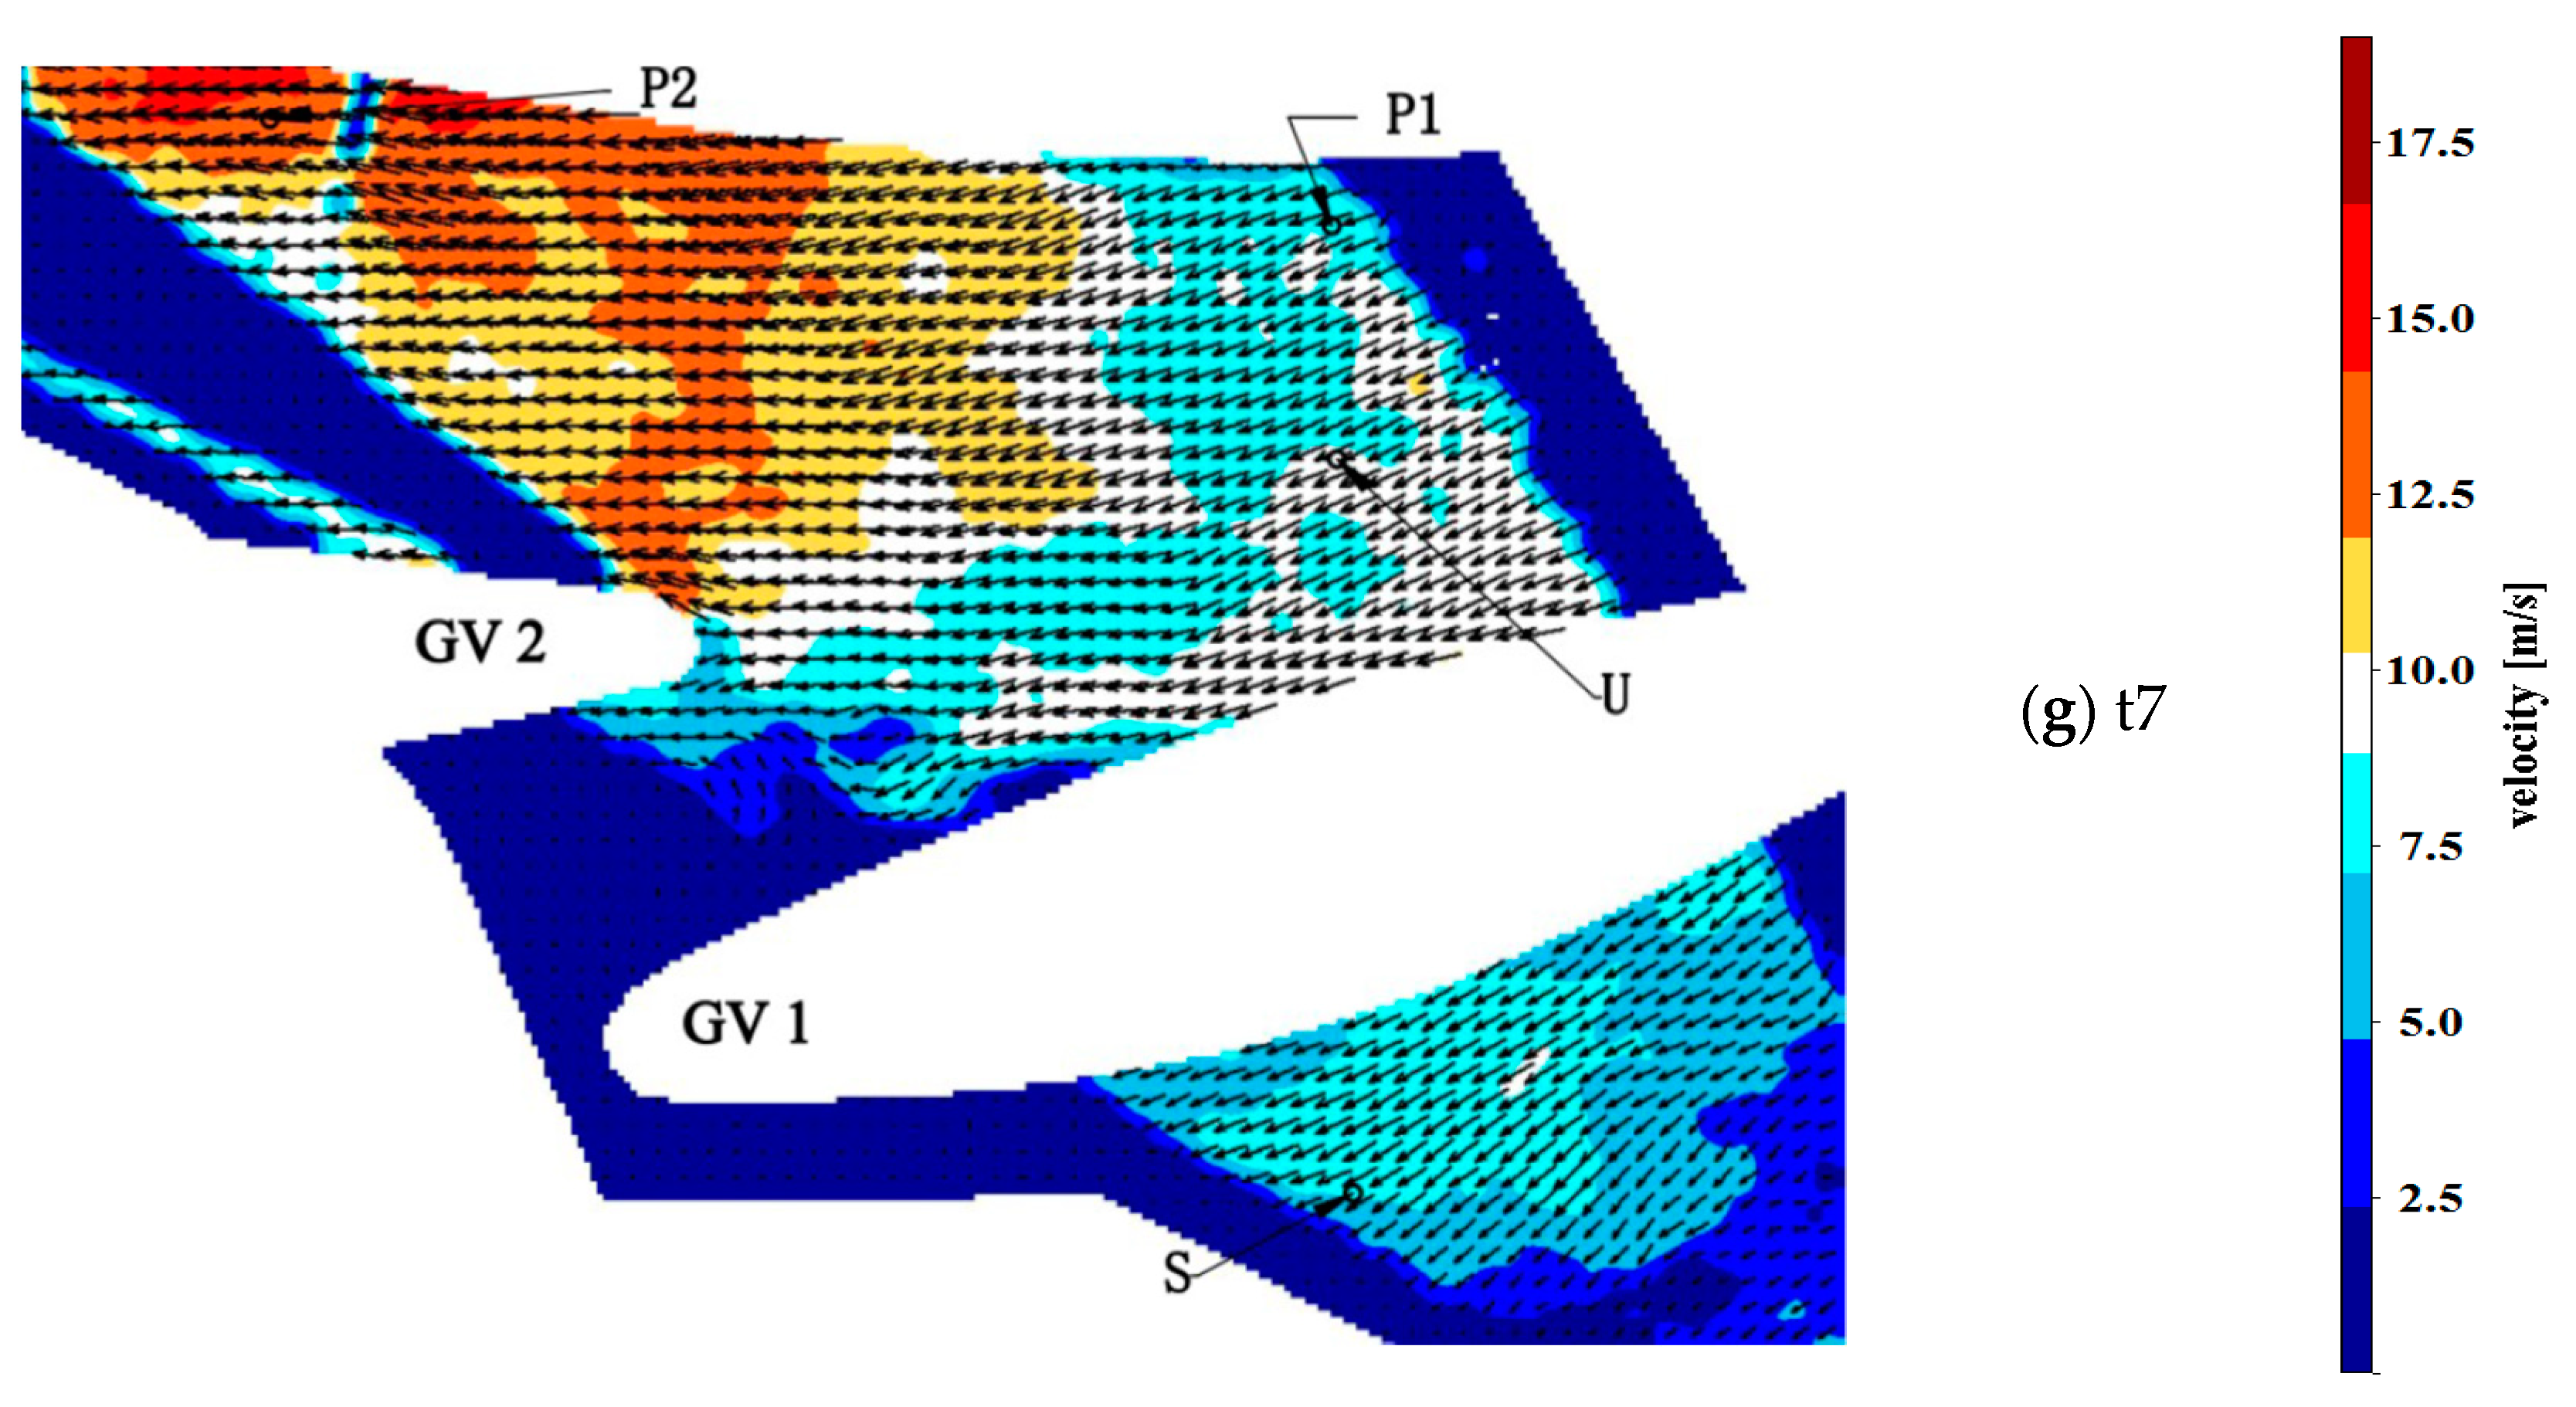
In the next stage, conditions causing the stall were gradually weakened, and the flow in Passage 2 gradually recovered. Figure 5b shows that as Passage 2 was blocked and witnessed backflow, the velocity in the vaneless space in front of the flow channel rapidly decreased while the pressure increased. The recovery of the flow velocity at S showed that the static pressure at the exit of Passage 2 obviously decreased, and the adverse pressure gradient within the flow channel was weakened. After t7 (Figure 6g), the flow within Passage 2 recovered to constantly flow forward. Then, the discharge recovered constantly and steadily until a new period of stall occurred.
As shown in Figure 5c, the angle of attack of the flow in front of GV2 increased with the enlargement of the stall area within the guide vane channel. It took a time of 7.35 impeller revolutions from the point with the maximum flow within Passage 2 to that point in the next period. The discharge reduction process only accounted for 25% of the whole period.
3.1.2. Evolution Mechanism of the Rotating Stall
By comprehensively analyzing the aforementioned condition of the flow fields, the development process of the rotating stall within guide vane channels was divided into four stages:
- In the first stage, the flow in Passage 2 constantly increased to a level larger than the value measured under the pre-stall working condition due to the stall happening in upstream channels.
- In the second stage, the static pressure increased at the exit of Passage 2 and decreased in the vaneless space in front of Passage 2. A great adverse pressure gradient was forming, which will cause the stall in Passage 2.
After the stall appeared in Passage 1, the low-speed high-pressure water from the spiral casing and stay vane sides flowed to the exit of Passage 2, resulting in the growth of the static pressure in the exit area of the flow channel. The flow in Passage 2 started to decrease rapidly at the time 0.01s after the radial component velocity at the point S reaching the maximum in the direction pointing to the guide vane. With the flow reduction in Passage 2, the angle of attack of the approaching flow to GV2 increased gradually. More water flowed to the vaneless space in front of the GV2 due to the blockage and backflow of Passage 1, causing the velocity in the zone to constantly increase and to be significantly higher than the velocity under steady flow regimes. As a result, the pressure in front of Passage 2 was reduced.
- In the third stage, the flow in Passage 2 decreased dramatically, and backflow from the exit to the inlet appeared due to the great adverse pressure gradient formed. As a result, the stall in the Passage 1 propagated to Passage 2, thus forming rotating stall.
- In the fourth stage, stall weakened, and flow gradually recovered.
After stall appeared, the flow velocity within the vaneless space in front of GV2 started to reduce rapidly, and then the flow in Passage 1 gradually recovered. In this case, the inlet pressure of Passage 2 gradually increased while the exit pressure significantly decreased. Therefore, the adverse pressure gradient gradually decreased, and the flow in Passage 2 recovered gradually until the coming of the next period of stall.
The four-stage progression occurred in working conditions appearing rotating stall at all three guide vane openings, with variations in some aspects, such as the propagation speed of rotating stall and the fluctuation amplitude of the discharge between guide vanes. The factors impacting these variations remain to be further analyzed.
3.2. Loss Analysis in Working Conditions with and without Rotating Stall
The unsteady flow patterns during the rotating stall will certainly lead to the growth of dissipation loss. Therefore, the dissipation loss within the measured zone at working conditions with and without the rotating stall was analyzed.
Equation (3) is the differential equation for energy of incompressible fluids.
where e, , T and denote the specific internal energy, heat transfer coefficient, temperature and dissipation function, respectively.
In a Cartesian coordinate system, the dissipation function is expressed as follows.
where denotes the dynamic viscosity (Pa·s) of fluids.
The dissipation function represents heat energy transformed from its mechanical energy per unit volume of fluids in unit time [33].
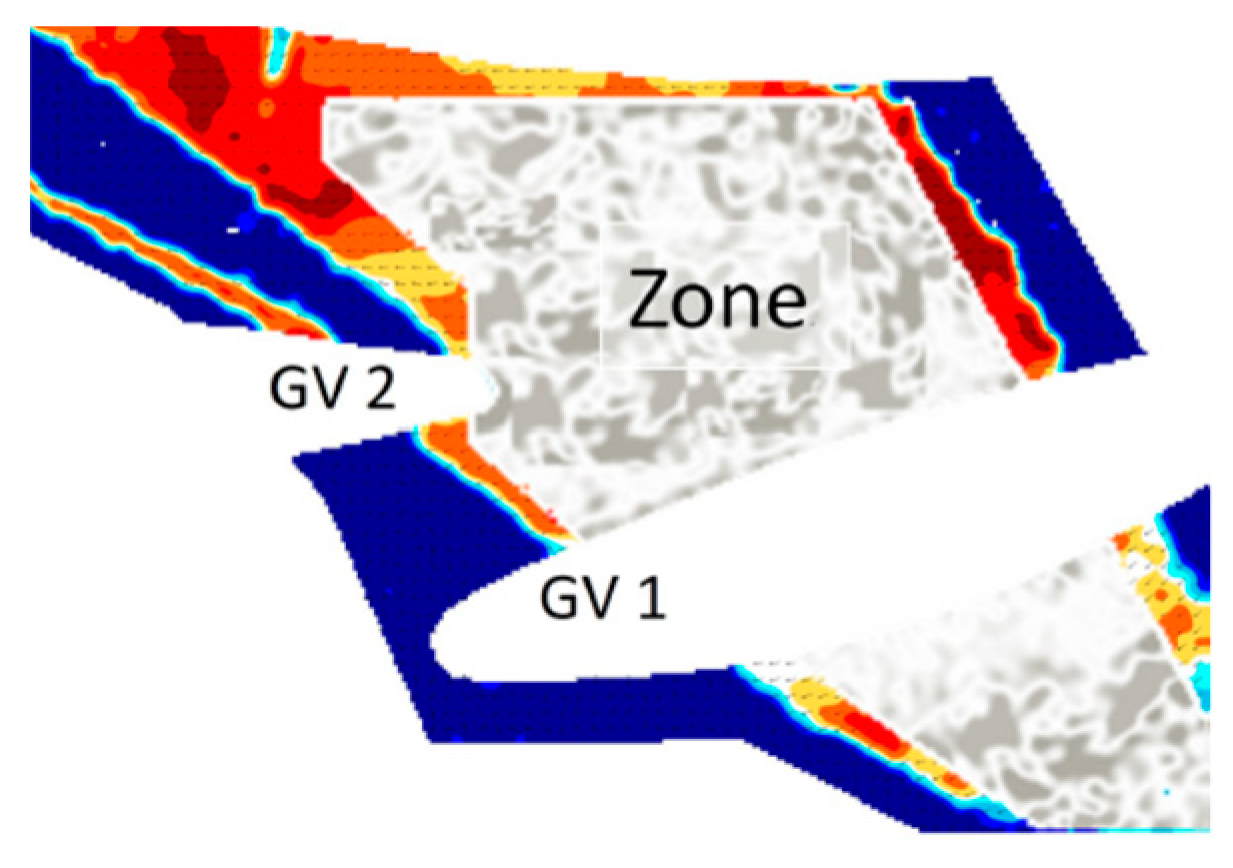
The two-dimensional flow velocity of planes was measured in the test. was defined as the average value of the total dissipation loss corresponding to components of the two-dimensional velocity in grids within the grey zone (Figure 7) according to 500 measured flow fields, as shown in Equation (5).
where n, u and v denote the number of grids in the analysis area, flow velocity in the x- and y-directions, respectively.
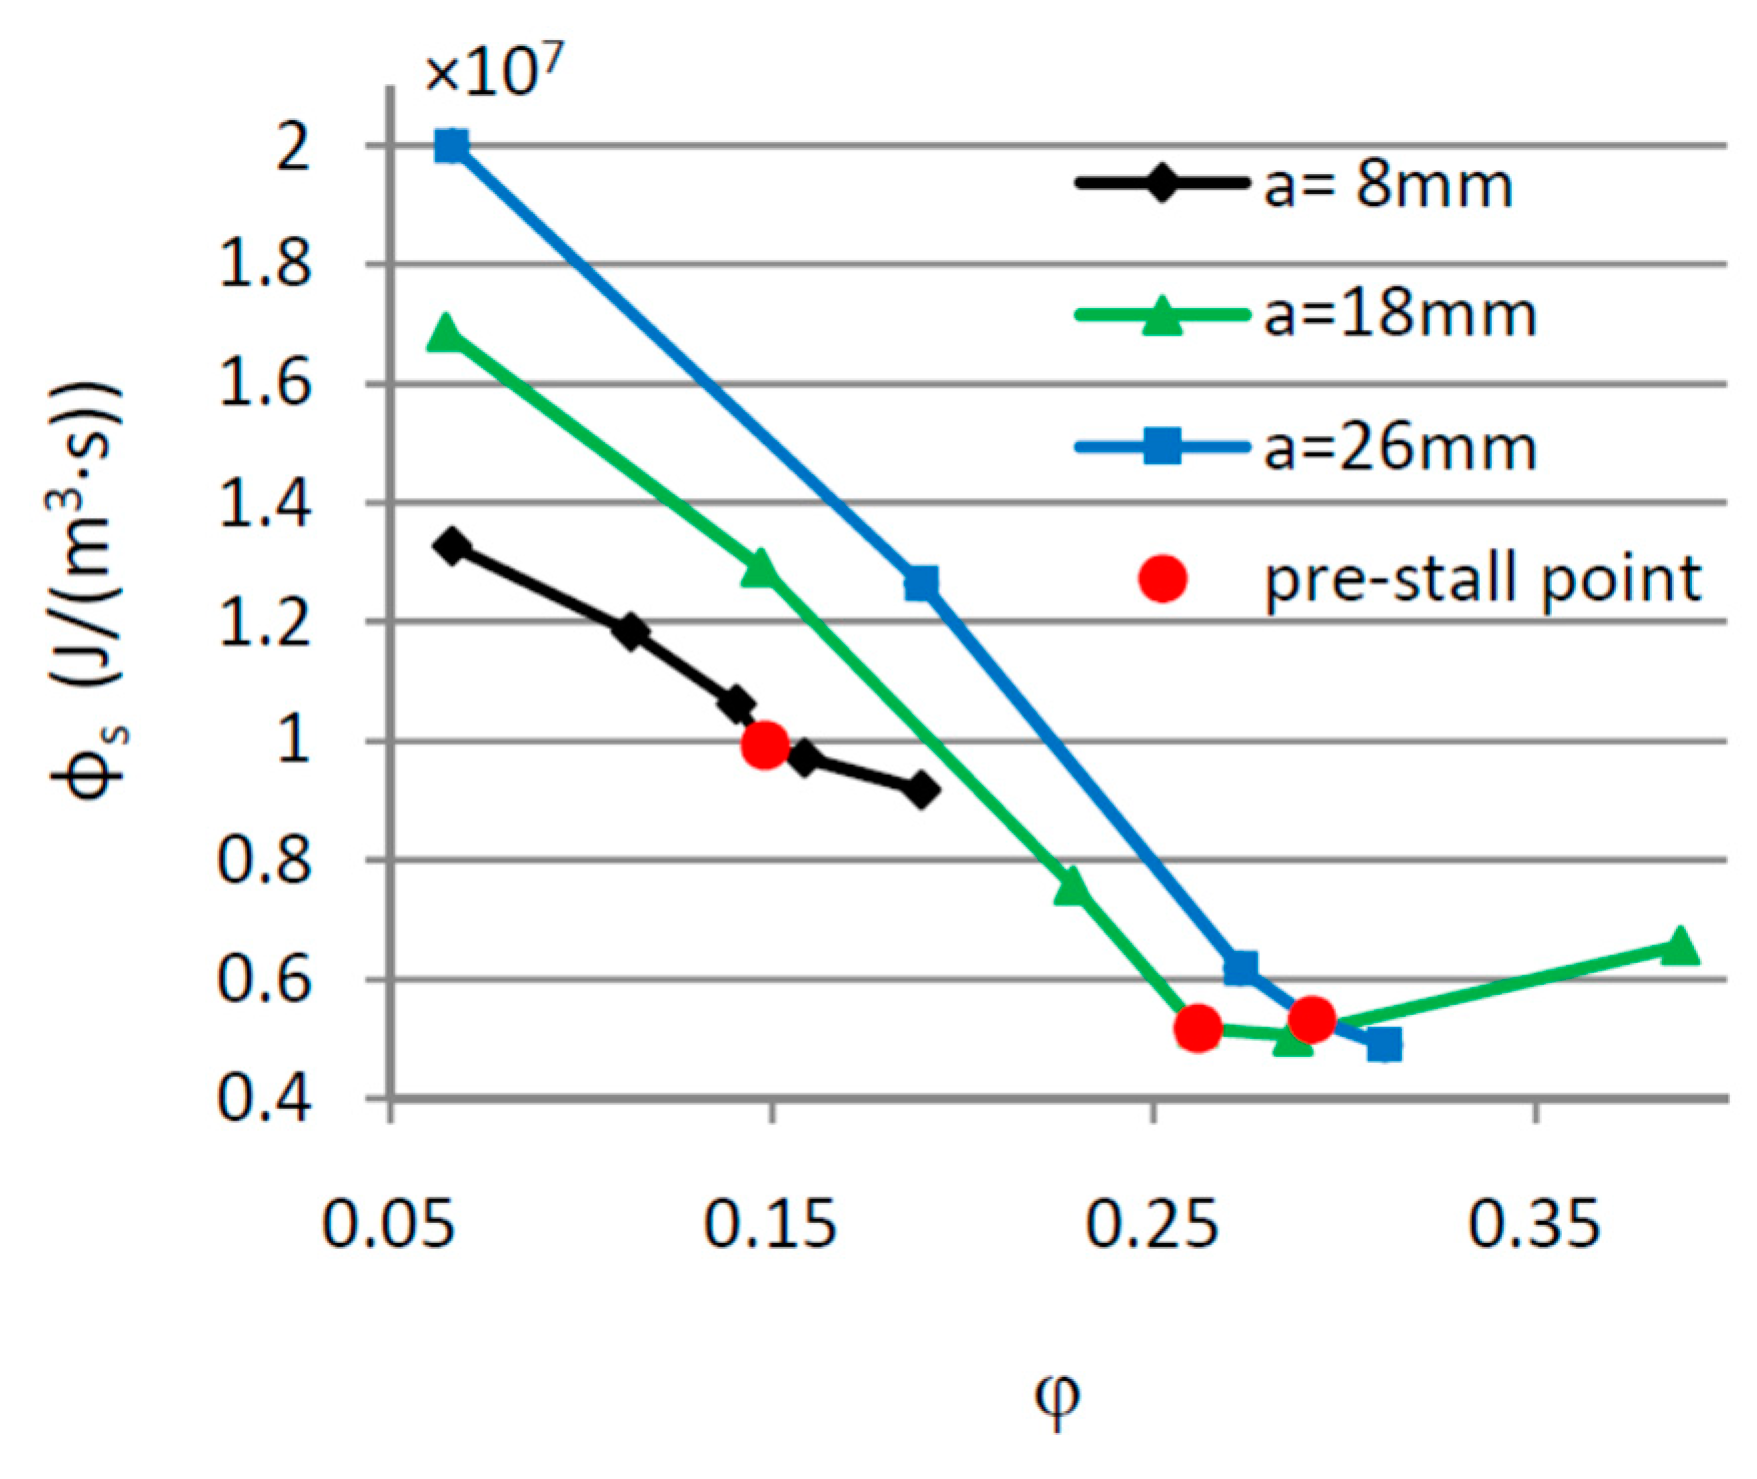
Figure 8 displays the changes of the dissipation in the measured zone under working conditions from large flow rate to deep part load at three guide vane openings. The figure shows that at conditions without the rotating stall, changed slowly when the flow coefficient decreased. At operating points with flow rates smaller than the pre-stall points, increased greatly; correspondingly, the loss curves become steep. However, the flow-head curves shown in Figure 3 exhibited a contrary change trend (in the direction of reducing the flow rate): when the flow rate was larger than that of the pre-stall points, curves at three openings showed a large negative slope, implying that the head increased rapidly while the flow rate decreased. However, the flow–head curves decreased gradually when the flow rate was smaller than that of the pre-stall points. The slopes of the flow-head curves obviously change at the pre-points of all three measured openings. When the flow rate decreases, the growth amplitude of the head of the model pump turbine decreases due to the occurrence of the rotating stall.
4. Conclusions
Specifically designed model components and test equipment were applied to avoid reducing the number of stay vanes for PIV measurement illumination (conventional method) so that the flow similarity in the measurement could be kept. Under three guide vane openings, more systematic PIV measurement on the flow field in the guide vane zone of a pump turbine was carried out on a high-precision model test platform. The entire evolution process of the rotating stall in the guide vane channel was captured by the flow field measurement for the first time. By analyzing the measurement data, the following conclusions were drawn.
(1) Four stages of evolution and development of rotating stall were revealed: The discharge in the guide vane channel is increasing constantly due to the stall occurring in the upstream channels (the first stage). The pressure increased at the exit of the flow channel due to high-pressure water flows from the stay vane side. The velocity increased while the pressure decreased in the vaneless space in front of the flow channel. As a result, a large adverse pressure gradient was formed between the inlet and the exit of the guide vane channels (the second stage). The discharge decreased rapidly, and stall occurred in the channel due to the great adverse pressure gradient (the third stage). The velocity in front of the guide vane channel decreased, and the velocity at the exit of the flow channel gradually grew. The conditions causing the stall weakened, and the flow rate within the guide vane channel gradually recovered (the fourth stage).
During one period of the fluctuation of the flow rate in the guide vane channel during the rotating stall, the process of stall and discharge reduction was rapid and short, and the process of flow rate recovery and growth took a much longer time.
(2) According to the measurements and loss analysis, the pre-stall points were discovered and the impact of the rotating stall on the energy performance of the pump turbine was revealed. The slopes of the and curves changed remarkably at the pre-stall points under all the three measured openings. Reducing the flow rate, the growth amplitude of the head of the pump turbine decreased significantly when the rotating stall occurred.
(3) Rotating stall happened under all of the three measured openings. However, a hump was found only under the opening of 8 mm. Therefore, unlike the statements in previous studies, this study demonstrates that rotating stall is not the sufficient condition for the occurrence of hump phenomenon. The relationship between the hump phenomenon and the rotating stall needs to be comprehensively analyzed further from various aspects, such as the internal flow of the runner.
Generally, it is only of concern when a hump appears, and only a sufficient safety margin for the hump-shaped zone is required in engineering application. According to this study, the rotating stall occurred at guide vane openings of which no hump appeared in the performance curves. The rotating stall causes great fluctuation of the flow field within flow channels and could damage pump turbines, which should be a matter of concern.
Author Contributions
Conceptualization, P.X., Z.L., and L.L.; Methodology, P.X., L.L. and Z.G.; Investigation, P.X., L.L. and X.M.; Writing—Original Draft Preparation, P.X.; Writing—Review & Editing, Z.L., L.L. and Z.X.
Funding
This research was funded by the IWHR Research&Development Support Program (HM0145B432016).
Conflicts of Interest
The authors declare no conflicts of interest.
References
- Cavazzini, G.; Houdeline, J.B.; Pavesi, G.; Teller, O.; Ardizzon, G. Unstable behavior of pump-turbines and its effects on power regulation capacity of pumped-hydro energy storage plants. Renew. Sustain. Energy Rev. 2018, 94, 399–409. [Google Scholar] [CrossRef]
- Emmons, H.W.; Pearson, C.E.; Grant, H.P. Compressor Surge and Stall Propagation. J. Fluids Eng.-T. ASME 1955, 77, 455–469. [Google Scholar]
- Pacot, O.; Kato, C.; Guo, Y.; Yamade, Y.; Avellan, F. Large Eddy Simulation of the Rotating Stall in a Pump-Turbine Operated in Pumping Mode at a Part-Load Condition. J. Fluids Eng.-T. ASME 2016, 138, 1–11. [Google Scholar] [CrossRef]
- Sinha, M.; Pinarbasi, A.; Katz, J. The Flow Structure During Onset and Developed States of Rotating Stall within a Vaned Diffuser of a Centrifugal Pump. J. Fluids Eng.-T. ASME 2001, 123, 490–499. [Google Scholar] [CrossRef]
- Krause, N.; Zahringer, K.; Pap, E. Time-Resolved Particle Imaging Velocimetry for the Investigation of Rotating Stall in a Radial Pump. Exp. Fluids 2005, 39, 192–201. [Google Scholar] [CrossRef]
- Wuibaut, G.; Bois, G.; Dupont, P.; Caignaert, G.; Stanislas, M. PIV measurements in the impeller and the vaneless diffuser of a radial flow pump in design and off design operating conditions. J. Fluids Eng. 2002, 124, 791–797. [Google Scholar] [CrossRef]
- Dazin, A.; Cavazzini, G.; Pavesi, G.; Dupont, P.; Coudert, S.; Ardizzon, G.; Caignaert, G.; Bois, G. High-speed stereoscopic PIV study of rotating instabilities in a radial vaneless diffuser. Exp. Fluids 2011, 51, 83–93. [Google Scholar] [CrossRef]
- Lucius, A.; Brenner, G. Numerical simulation and evaluation of velocity fluctuations during rotating stall of a centrifugal pump. J. Fluids Eng. 2011, 133, 1–8. [Google Scholar] [CrossRef]
- Prunières, R.; Inoue, Y.; Nagahara, T. Investigation of the Flow Field and Performances of a Centrifugal Pump at Part Load. IOP Conf. Ser. Earth Environ. Sci. 2016, 49, 032015. [Google Scholar] [CrossRef]
- Heng, Y.; Dazin, A.; Ouarzazi, M.N.; Si, Q. A Study of Rotating Stall in a Vaneless Diffuser of Radial Flow Pump. J. Hydraul. Res. 2018, 56, 494–504. [Google Scholar] [CrossRef]
- Ren, X.M.; Fan, H.G.; Xie, Z.F.; Liu, B. Stationary stall phenomenon and pressure fluctuation in a centrifugal pump at partial load condition. Heat Mass Transfer 2019, 55, 2277–2288. [Google Scholar] [CrossRef]
- Wang, Y.; Yang, H.; Chen, B.; Gao, P.; Chen, H.; Zhu, Z. Analysis of vortices formed in flow passage of a five-bladed centrifugal water pump by means of PIV method. AIP Adv. 2019, 9, 075011. [Google Scholar] [CrossRef]
- Pedersen, N.; Larsen, P.S.; Jacobsen, C.B. Flow in a centrifugal pump impeller at design and off design condition: Part I: Particle image velocimetry (PIV) and laser Doppler velocimetry (LDV) measurements. J. Fluids Eng. 2003, 125, 61–72. [Google Scholar] [CrossRef]
- Feng, J.; Benra, F.K.; Dohmen, H. Unsteady Flow Visualization at Part-Load Conditions of a Radial Diffuser Pump: By PIV and CFD. J. Visual-Jpn. 2009, 12, 65–72. [Google Scholar] [CrossRef]
- Zhou, P.; Dai, J.; Li, Y.; Chen, T.; Mou, J.G. Unsteady flow structures in centrifugal pump under two types of stall conditions. J. Hydrodyn. 2018, 30, 1038–1044. [Google Scholar] [CrossRef]
- Ran, H.J. Study on Two Kinds of Unstable Characteristic Phenomena in Middle Specific Speed Pump Turbines. Ph.D. Thesis, Tsinghua University, Beijing, China, June 2010. [Google Scholar]
- Erne, S.; Edinger, G.; Bauer, C. Numerical study of the stay vane channel-flow in a reversible pump turbine at off-design conditions. In Conference on Modelling Fluidflow (CMFF’15) the 16th International Conference on Fluid Flow Technologies, Budapest, Hungary, 01–04 September2015; Periodica Polytechnica Mechanical Engineering: Budapest, Hungary, 2017. [Google Scholar]
- Ješe, U.; Fortes-Patella, R. Unsteady numerical analysis of the rotating stall in pump- turbine geometry. IOP Conf. Ser. EarthEnviron. Sci. 2016, 49, 042005. [Google Scholar] [CrossRef]
- Sun, Y.K. Instability Characteristics and Influencing Factors of Positive Slope on Pump Performance Curves of a Low-Specific-Speed Pump-Turbine. Ph.D. Thesis, Tsinghua University, Beijing, China, 2016. [Google Scholar]
- Lu, G.C.; Zuo, Z.G.; Liu, D.M.; Liu, S.H. Energy Balance and Local Unsteady Loss Analysis of Flows in a Low Specific Speed Model Pump-Turbinein the Positive Slope Region on the PumpPerformance Curve. Energies 2019, 12, 1829. [Google Scholar] [CrossRef]
- Yang, D.D.; Luo, X.W.; Liu, D.M.; Huang, R.F.; Zuo, Z.C. Unstable flow characteristics in a pump-turbine simulated by a modified Partially-Averaged Navier-Stokes method. Sci. China Technol. Sci. 2018, 61, 1–11. [Google Scholar] [CrossRef]
- Li, W.; Pan, Z.Y.; Shi, W.D. Numerical investigation of pump-turbines with different blades at pump conditions. J. Adv. Manuf. Syst. 2012, 11, 143–150. [Google Scholar] [CrossRef]
- Xia, L.S.; Cheng, Y.G.; Zhang, X.X.; Yang, J.D. Numerical analysis of rotating stall instabilities of a pump-turbine in pump mode. IOP Conf. Ser. Earth Environ. Sci. 2014, 22, 032020. [Google Scholar] [CrossRef]
- Yang, J.; Pavesi, G.; Liu, X.H.; Xie, T.; Liu, J. Unsteady flow characteristics regarding hump instability in the first stage of a multistage pump-turbine in pump mode. Renew. Energy 2018, 127, 377–385. [Google Scholar] [CrossRef]
- Yang, J.; Pravesi, G.; Yuan, S.; Cavazzini, G.; Ardizzon, G. Experimental Characterization of a Pump-Turbine in Pump Mode at Hump Instability Region. J. Fluids Eng.-T. ASME 2015, 137, 1–11. [Google Scholar] [CrossRef]
- Hasmatuchi, V.; Farhat, M.; Roth, S.; Botero, F.; Avellan, F. Experimental evidence of rotating stall in a pump-turbine at off-design conditions in generating mode. J. Fluids Eng. 2011, 133, 051104. [Google Scholar] [CrossRef]
- Braun, O. Part Load Flow in Radial Centrifugal Pumps. Ph.D. Thesis, École Polytechnique Fédéralede Lausanne, Lausanne, Switzerland, 2009. [Google Scholar]
- Guggenberger, M.; Senn, F.; Jaberg, H.; Gehrer, A.; Sallaberger, M.; Widmer, C. Experimental analysis of the flow pattern of a pump turbine model in pump mode. IOP Conf. Ser. Earth Environ. Sci. 2016, 49, 042001. [Google Scholar] [CrossRef]
- Ciocan, G.D.; Kueny, J.L. Experimental Analysis of Rotor Stator Interaction in a Pump-Turbine. In Proceedings of the XXIII IAHR Symposium on Hydraulic Machinery and Systems, Yokohama, Japan, 17–21 October 2006. [Google Scholar]
- International Electrotechnical Commission. Hydraulic Turbines, Storage Pumps and Pump-Turbines—Model Acceptance Tests; International Electrotechnical Commission: Geneva, Switzerland, 1999. [Google Scholar]
- Zhu, L.; Meng, X.C.; Zhang, J.G.; Chen, Y.; Zhang, H.P.; Wang, W.P.; Lu, L. Pressure fluctuation test and vortex observation in Francis turbines draft tube. IOP Conf. Ser. Earth Environ. Sci. 2019, 240, 022029. [Google Scholar] [CrossRef]
- Raffel, M.; Willert, C.E.; Wereley, S.T.; Kompenhans, J. Image evaluation methods for PIV. In Particle Image Velocimetry: A practical Guide, 2nd ed.; Springer: Berlin, Germany, 2007; pp. 164–175. [Google Scholar]
- Zhou, G.J.; Yan, Z.Y.; Xu, S.X.; Zhang, K.B. Basic equations of fluid motion. In Fluid Mechanics, 2nd ed.; Higher Education Press: Beijing, China, 2000; Volume 1, pp. 131–138. [Google Scholar]
Figure 1.
The 3D schematic map of the pump-turbine model shown as a fluid domain.

Figure 2.
Setup and the measurement plane. (a) Sketch map; (b) Equipment.

Figure 3.
Pump performance curves and the particle image velocimetry (PIV) measurement working conditions.
Figure 3.
Pump performance curves and the particle image velocimetry (PIV) measurement working conditions.

Figure 4.
Measurement area and the positions of analysis objects. (a) The location of the measured window from the bottom view; (b) The positions of analysis objects for flow velocity.
Figure 4.
Measurement area and the positions of analysis objects. (a) The location of the measured window from the bottom view; (b) The positions of analysis objects for flow velocity.

Figure 5.
History of flow parameters within the measured zone when rotating stall appeared at z2 working condition at 18 mm opening. (a) Time history of two-dimensional flow Q* crossing the G line within Passage 2 and flow velocity at point S and its radial direction component; (b) Time history of flow velocities at points P1, P2, U and S; (c) Time history of angle of attack αg of the approaching flow to GV2.

Figure 6.
Distribution of flow velocity at different time steps during the stall process presented in Figure 5: (a) later recovery, (b) highest of velocity at point S, (c) highest of discharge Q*, (d) minimum of Vr at point S, (e) 0.01s after t4, (f) stalled stage, (g) early recovery. In each figure, the flow field from the PIV measurement result is the part between the two green lines shown in (a).


Figure 7.
Schematic diagram of the investigated region (the grey Zone) of the dissipation loss .

Figure 8.
Curves of dissipation in the Zone at measurement conditions.


Table 1.
Geometric parameters of the investigated pump-turbine.
| Parameter | Symbol | Value |
|---|---|---|
| Outer impeller Diameter (mm) | D1 | 549 |
| Inner impeller Diameter (mm) | D2 | 250 |
| Number of impeller blades | Zr | 7 |
| Number of guide vanes | Zg | 20 |
| Relative height of guide vanes | h | 0.07 D1 |
| Number of stay vanes | Zs | 20 |
Table 2.
Parameters of the PIV measurement working conditions.
| a (mm) | Parameter | |||||||
|---|---|---|---|---|---|---|---|---|
| 8 | Condition name | x1 | x2 | x3 | x4 | x5 | x6 | x7 |
| φ | 0.066 | 0.113 | 0.141 | 0.148 | 0.158 | 0.189 | 0.259 | |
| ψ | 5.849 | 5.757 | 5.715 | 5.774 | 5.679 | 5.339 | 4.152 | |
| 18 | Condition name | z1 | z2 | z3 | z4 | z5 | z6 | - |
| φ | 0.065 | 0.147 | 0.229 | 0.262 | 0.287 | 0.388 | - | |
| ψ | 5.696 | 5.577 | 5.306 | 5.172 | 4.953 | 3.861 | - | |
| 26 | Condition name | y1 | y2 | y3 | y4 | y5 | y6 | - |
| φ | 0.066 | 0.189 | 0.273 | 0.291 | 0.310 | 0.436 | - | |
| ψ | 5.652 | 5.430 | 5.060 | 4.966 | 4.809 | 3.555 | - | |
© 2019 by the authors. Licensee MDPI, Basel, Switzerland. This article is an open access article distributed under the terms and conditions of the Creative Commons Attribution (CC BY) license (http://creativecommons.org/licenses/by/4.0/).
Share and Cite
MDPI and ACS Style
Xue, P.; Liu, Z.; Lu, L.; Gao, Z.; Meng, X. Experimental Research on the Rotating Stall of a Pump Turbine in Pump Mode. Water 2019, 11, 2426. https://0-doi-org.brum.beds.ac.uk/10.3390/w11112426
AMA Style
Xue P, Liu Z, Lu L, Gao Z, Meng X. Experimental Research on the Rotating Stall of a Pump Turbine in Pump Mode. Water. 2019; 11(11):2426. https://0-doi-org.brum.beds.ac.uk/10.3390/w11112426
Chicago/Turabian StyleXue, Peng, Zhiping Liu, Li Lu, Zhongxin Gao, and Xiaochao Meng. 2019. "Experimental Research on the Rotating Stall of a Pump Turbine in Pump Mode" Water 11, no. 11: 2426. https://0-doi-org.brum.beds.ac.uk/10.3390/w11112426
Note that from the first issue of 2016, this journal uses article numbers instead of page numbers. See further details here.