Effects of the Three Gorges Project on Runoff and Related Benefits of the Key Regions along Main Branches of the Yangtze River


1
School of Economics, Henan University of Science and Technology, Kaiyuan Ave. 263, Luoyang 471023, Henan, China
2
Institute of Geographic Sciences and Natural Resources Research, the Chinese Academy of Science, Beijing 10010, China
*
Author to whom correspondence should be addressed.
Water 2019, 11(2), 269; https://0-doi-org.brum.beds.ac.uk/10.3390/w11020269
Submission received: 8 January 2019
/
Revised: 30 January 2019
/
Accepted: 31 January 2019
/
Published: 4 February 2019
(This article belongs to the Special Issue Climate Variability and Climate Change Impacts on Land Surface, Hydrological Processes and Water Management)
Abstract
:The Three Gorges Project (TGP) is the largest hydroelectric project in the world. It is crucial to understand the relationship between runoff regime changes and TGP’s full operation after 2009 in the Yangtze River Basin (YRB). This paper defines core, extended and buffer areas of YRB, analyzes the effects of TGP on runoff anomaly (RA), runoff variation (RV) and change of coefficient of variation (CCV) between two periods (2003–2008 and 2009–2016), takes percentage of runoff anomaly (PRA) as the evaluation standard, assures alleviation effect on severe dry and wet years of the research area, and finally summarizes related benefits of flood control from TGP. Our results indicate the inter-annual fluctuation of runoff in the core and extended areas expanded, but reduced in the buffer areas, and the frequencies of severe dry and wet years alleviated in the buffer, core and extended areas. Generally, the extended and core areas become less wet, and the buffer areas become less dry. The RV and CCV are both strengthened in the extended and core areas, but are weakened in the buffer areas, and RV is well positively correlated (R2 = 0.80) to CCV. Furthermore, the main benefits of TGP on flood control are remarkable in the reduction of disaster affected population, the decrease of agricultural disaster-damaged area, and the decline of direct economic loss. However, due to torrentially seasonal and non-seasonal precipitation, the sharp rebounds of three standards for Hubei and Anhui occurred in 2010 and 2016, and the percentage of agricultural damage area of five regions in the core and extended areas did not decline synchronously and performed irregularly. Our results suggest that the five key regions along the main branches of the Yangtze River should establish a flood control system and promote the connectivity of infrastructures at different levels to meet the significant functions of TGP. It is a great challenge for TGP operation to balance the benefits and conflicts among flood control, power generation and water resources supply in the future.
1. Introduction
Water is one of the most significant resources for a country’s social, economic and environmental development, and most nations are facing different degrees of floods and drought threats caused by the imbalance of water distribution in the world [1]. In order to rebalance, redistribute and make full use of potential water resources, many countries made great efforts to construct dams to control floods, generate electricity, improve shipping capacity, and supply water, including Egypt, Japan, U.S., Canada, Australia, China, and so on. By the year 2000, about 45,000 large dams and 800,000 small ones have been built worldwide. Globally, discussions and arguments on large dams have increasingly emerged because of the potential and comprehensive impacts. They basically include enormous environmental changes of habitats inundation and fragmentation, extinction of local species of plants and fishes, ugly landscapes of water level fluctuation zone, sedimentation accumulation and capacity decrease of reseRVoir and regional climate changes, the apparent economic impacts of loss of old industries and enterprises and shortages of new ones, depressed livelihood of involuntary resettlement, high unemployment rates, infertile farmland located far away from economic centers, and the continuous social uncertainties of loss of unique historical and cultural heritage, spiritual sustenance and cultural integration of migration [2,3,4,5,6,7]. Among the changes, coastal erosion, caused by sediments reduction at river outlet, is a serious environmental problem in many nations. For example, the case study of Nestos River (Greece) indicated the sedimentation effect of construction and operation of two reseRVoirs (Thisavros and Platanovrysi) to coastal erosion, the sharp sediments decrease impacted sediments supply to basin outlet of river delta, the neighboring coast and the coastal morphology, which even inversed the erosion/accretion balance in the deltaic as well as the adjacent shorelines, from accretion predominated erosion to erosion predominates accretion, just within five years after the reseRVoirs’ construction [8,9].
China’s geographical and climatic location within monsoon zones determines its large difference in precipitation and potential evapotranspiration among the 31 provinces, municipalities and autonomous regions. The main spatial pattern is that more water exists in its southern parts than in its northern parts, and so ‘too much water to control in Southern China’ is one of the key issues for water resources management. Flooding has resulted in major disasters in both the midstream and downstream parts of YRB. For example, three big recorded floods occurred in YRB in 1934, 1954 and 1998, respectively [10]. The 1998 flood, called the 1998 Great Flood in China, caused significant losses in human lives and properties. Flooding threats became unpredictable under climate change and high intensities of human activities, which have resulted in large changes in hydrological processes, precipitation, runoff and groundwater in YRB.
To solve the flooding issue, China started large-scale dam construction from the 1950s. For instance, Sanmenxia Dam was built in the midstream of the Yellow River in 1954, and was aimed at flood control, irrigation, electric power generation, and shipping improvement; Gezhou Dam built in the downstream of the Yangtze River (YR) in 1971, aiming to provide hydropower generation and shipping improvement; Xiaolangdi Dam built in the downstream of the Yellow River in 1991, intended not only to provide flood and ice control, sedimentation reduction, and electric power generation, but for water supply and irrigation; the Three Gorges Project (TGP) was launched in the midstream of YR in 1994, aiming to provide flood control, shipping improvement, electric power generation, and so on.
Among the dams, TGP is well-known worldwide for its scale, cost, range, migration, ecological and environmental impact, and even for its controversial impacts on sustainability. It achieved primary impoundment in 2003 and the full operation in 2009. Afterwards many ecological and environmental problems emerged. One particular example was more frequent severe droughts that have occurred since its operation [11,12,13,14,15,16], which have impacted on Sichuan Province and Chongqing Municipality. This resulted in serious hydrological, ecological, and socioeconomic consequences in spatial pattern and temporal process [17,18,19], and also initiated controversial debates on TGP.
There were three research issues on the hydrological consequences of TGP. The first is the drought frequency of the Three Gorges ReseRVoir (TGR) and the relationship between TGP and the drought trends of YRB [20]. In the last two decades, YRB displayed significant vacillation between droughts and floods of TGR, indicated by the increasing drought trend in the upper reaches of YRB and TGP, with the drought evolution being inseparable from the background of the whole basin level. The second area has been water regulation and storage capacity between the lakes and YR and the response to TGP [21,22,23,24]. YR discharges into Dongting Lake in Hubei Province, Poyang Lake in Jiangxi Province, but receives inflow from the lakes from January to March. After the full operation of TGP under different dispatching modes, the weakened water from YR resulted in enhancing of the compensation ability of the lakes into YR in the neighboring provinces. The third research area is the impact of TGP’s impoundment on the flood and low stage adjustment in the midstream of YRB [25,26,27]. After the impoundment of TGP, the water storage capacities of provinces have experienced no change because the flood stage did not significantly decrease, although the flow discharge compensation of TGR improved the low flow stage, and the wharf change in the water stages was harmful to the improvement of the channel depth and the water storage of TGP. Meanwhile, the flow of YR decreased after flood season, increased in the dry season, and benefited from the peak shaving and flood control of TGP. Flow also decreased from July to August, and the annual runoff allocation also changed, which benefited flood control and water resources use in the midstream and downstream of YRB.
The rest of this paper is organized as follows: Section 2 reviews the basic conditions of TGP; Section 3 introduces the definition of the research area, data sources and methods; Referring to the hierarchy framework of Environmental Impact Assessment of Impacts on TGP [28], Section 4 presents TGP’s effects on runoff changes between two periods of 2003–2008 and 2009–2016, including runoff anomaly, percentage of runoff anomaly, runoff variation, change of coefficient of variation, and then sums the related benefits of flood control of TGP from disaster affected populations, direct economic loss, agricultural disaster-damaged areas and the percentage of the agricultural disaster-damaged area; Section 5 proposes the discussions; Section 6 draws the main conclusions.
2. Basic Conditions of TGP
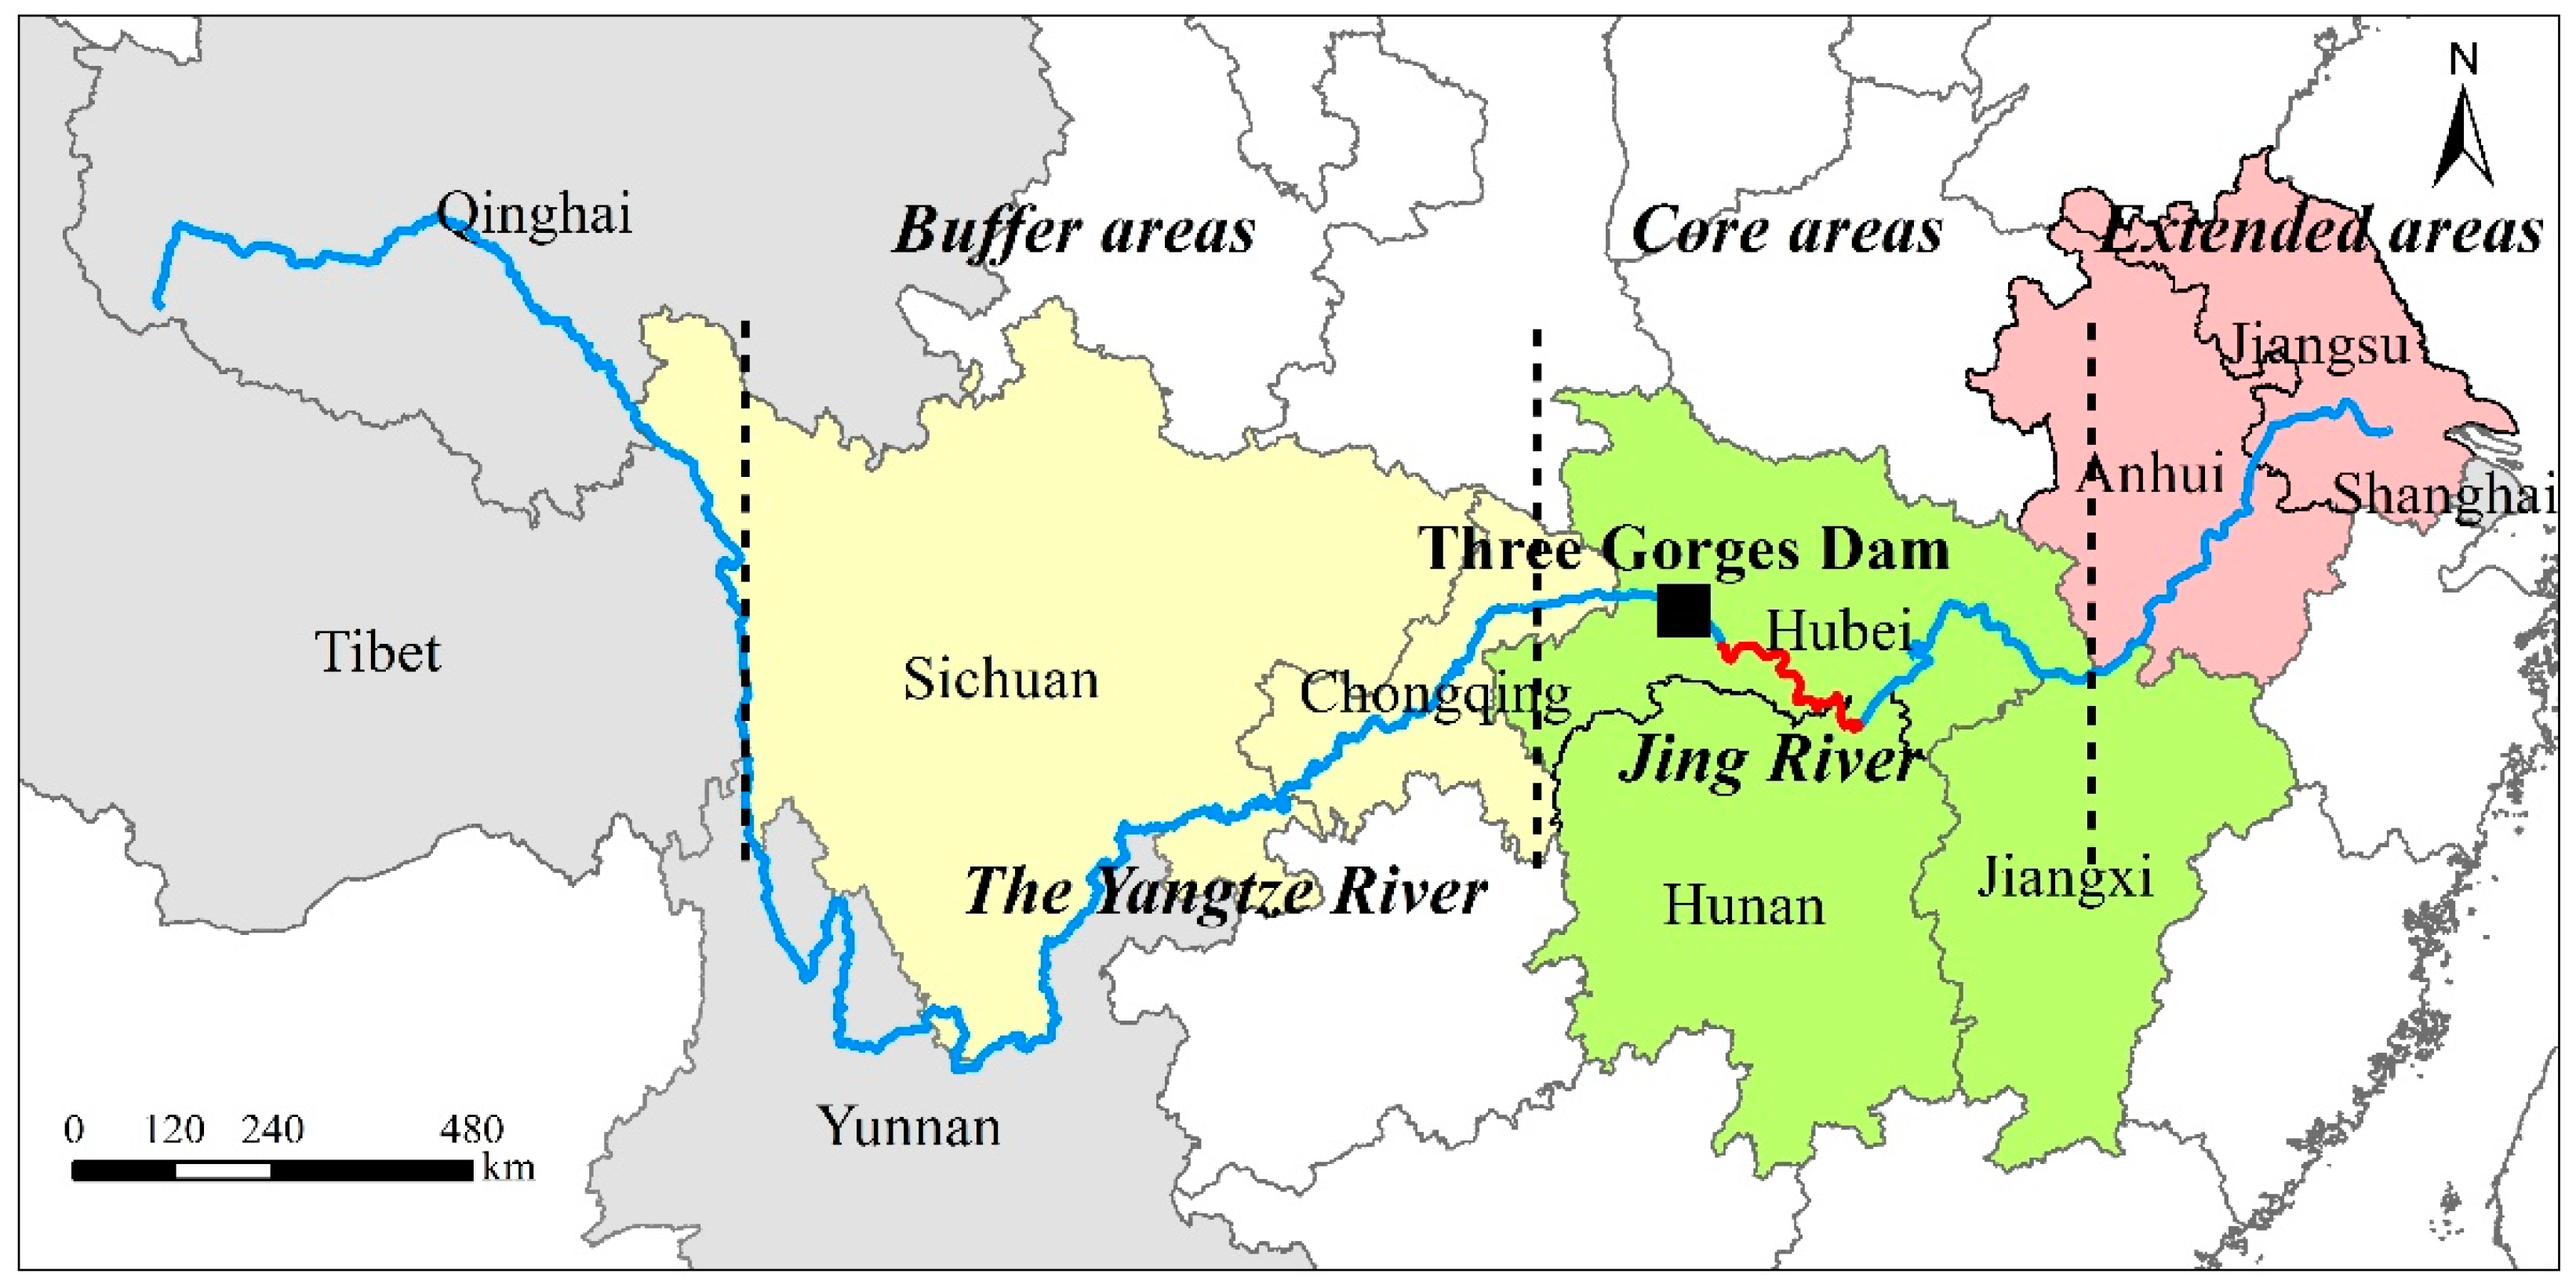
As the largest water generation project in the world, TGP located in the main stream of YR between Chongqing Municipality and Yichang City of Hubei Province (Figure 1), with a general storage capacity of 39.3 × 10⁹ m3 and a controllable storage capacity of 22.1 × 10⁹ m3 water, aimed at controlling effectively floods of the upstream of YR, with a general generation electricity of 84.7 × 10⁹ kWh per year, aimed at alleviating the shortage of electricity in East, Central and South China, an amount equal to that produced by burning 50 million tons of coal, with a water depth improvement from 2.9 m for Chaotian Gate of Chongqing Municipality to 3.5–4.5 m for Yichang City, aimed at improving transport capacity from 3000 tons to 10,000 tons, and the transport capacity of the channels of YR with a length of 660 km, from Shanghai Port to Chongqing Port, was promoted from 1000 tons to 5000 tons.
The formal construction of TGP started on 14th December 1994, in Sandouping Town of Yichang City, Hubei Province. Then, TGP was implemented in three stages, 1993–1997 was the first stage, mainly for the construction preparation and damming up of YR, with the water level up to 90 m; 1998–2003 was the second one, mainly for primary impoundment, operation of first generator unit, and perpetual navigation of ship lock, with the water level up to 135 m; 2004–2009 was the third one, mainly for operation of all generator units and the accomplishment of whole project, with the water level up to 156 m (2006) and 175 m (2009).
3. Research Area, Data Sources and Methods
3.1. Research Area
According to the flow direction of main YRB branches (Qinghai to Shanghai), there are 5 regions in the upstream, which are Qinghai, Tibet, Sichuan, Yunnan and Chongqing, 3 regions in the midstream, which are Hubei, Hunan and Jiangxi, and 3 regions in the downstream, which are Anhui, Jiangsu and Shanghai. Meanwhile, according to China’s traditional geographical regionalization of YR, the branches upward of Yichang City belong to the upstream; the branches between Yichang and Hukou County in Jiangxi Province belong to the midstream; and the branches below Hukou belong to the downstream. The major originally scheduled flood control of TGP mainly focused on the Jing River in Hubei Province (Figure 1), which cultivated two Plains of Jiang-Han and Dongting Lake, an important basis for commodity grain and aquatic products for China. In addition to the effect of extending back tail-waters of the Three Gorges Dam wall with 181 m height to the upstream after the full impoundment of 175 m, especially to Chongqing and Sichuan, the 7 key regions impacted by TGP regarding effects of runoff changes of YRB are defined as follows (Figure 1): the core areas including Hubei, Hunan and Jiangxi, the extended areas including Anhui and Jiangsu, and the buffer areas including Sichuan and Chongqing.
3.2. Data Sources
The information on TGP was obtained from the website of TGP (www.3g.gov.cn). The annual runoff data of the 7 regions and YRB were obtained from Changjiang and Southeast Rivers Water Resources Bulletin (2003–2016), the website of Changjiang Water Resources Commission, Ministry of Water Resources of China (www.cjw.gov.cn). The annual disaster data of the 5 regions were obtained from Bulletin of Flood and Drought Disasters in China (2006–2016), the website of Ministry of Water Resources of China (www.mwr.gov.cn).
3.3. Methods
This study compares and evaluates four runoff indices between two periods (2003–2008 and 2009–2016) for the 7 key regions in YRB, including runoff anomaly (RA), percentage of runoff anomaly (PRA), runoff variation (RV), and change of coefficient of variation (CCV).
The classic model on runoff (R) is calculated by Equation (1):
where R, P, E and ΔW is the annual runoff, precipitation, evaporation, and storage change of groundwater of the typical year of regions, respectively, and here the value of surface water is regarded as runoff [29].
The runoff anomaly (RA) is calculated by Equation (2). Then, to judge the dry or wet state of typical year, the percentage of runoff anomaly (PRA) is defined and categorized according to the standard of Equation (3) [30]:
where Ry and Rn is the runoff of typical year and the mean annual runoff during the period, respectively. The standards and the categories are as follows: the year with PRA < −20% belongs to a dry year; the year with −20% < PRA < −10% belongs to a less dry year; the year with −10% < PRA < 10% belongs to a normal year; the year with 10% < PRA < 20% belongs to a less wet year; the year with 20% < PRA belongs to a wet year.
The runoff variation (RV) is calculated by Equation (4):
where Rn1 and Rn2 is the mean annual runoff of two periods of 2003–2008 and 2009–2016, respectively.
The coefficient of variation (CV) and the change of CV (CCV) are calculated by Equations (5) and (6), respectively:
here σ and µ is the standard deviation and the mean annual runoff during the period, and CVn1 and CVn2 is CV of two periods of 2003–2008 and 2009–2016, respectively.
Three indices are used to present the benefits of TGP on flood control, the disaster-affected population (DAP), the direct economic loss (DEL), the agricultural disaster-affected area (ADAA), the agricultural disaster-damaged area (ADDA), and one index, the percentage of agricultural disaster-damaged area (PADDA), is used to evaluate the flood control effect, which is calculated by Equation (7):
where ADDA and ADAA represent the agricultural area with yield reduction including and over 30% and 10% affected by flood and waterlogging, respectively.
4. Results
After the full operation of TGP with 175 m height impoundment in 2009, an enormous flowing reseRVoir of the river-channel type crossing Chongqing and Hubei was formed with a general area of 1084 km2. Considered the potential influence of water adjustment of TGR between wet and dry season, the runoff changes, including RA, PRA, RV and CCV, are compared between two periods of 2003–2008 and 2009–2016 among the core, extended and buffer areas.
4.1. Impacts of TGP on RA and PRA
4.1.1. Inter-Annual Fluctuation of RA Expanded in the Core and Extended Areas but Reduced in the Buffer Areas
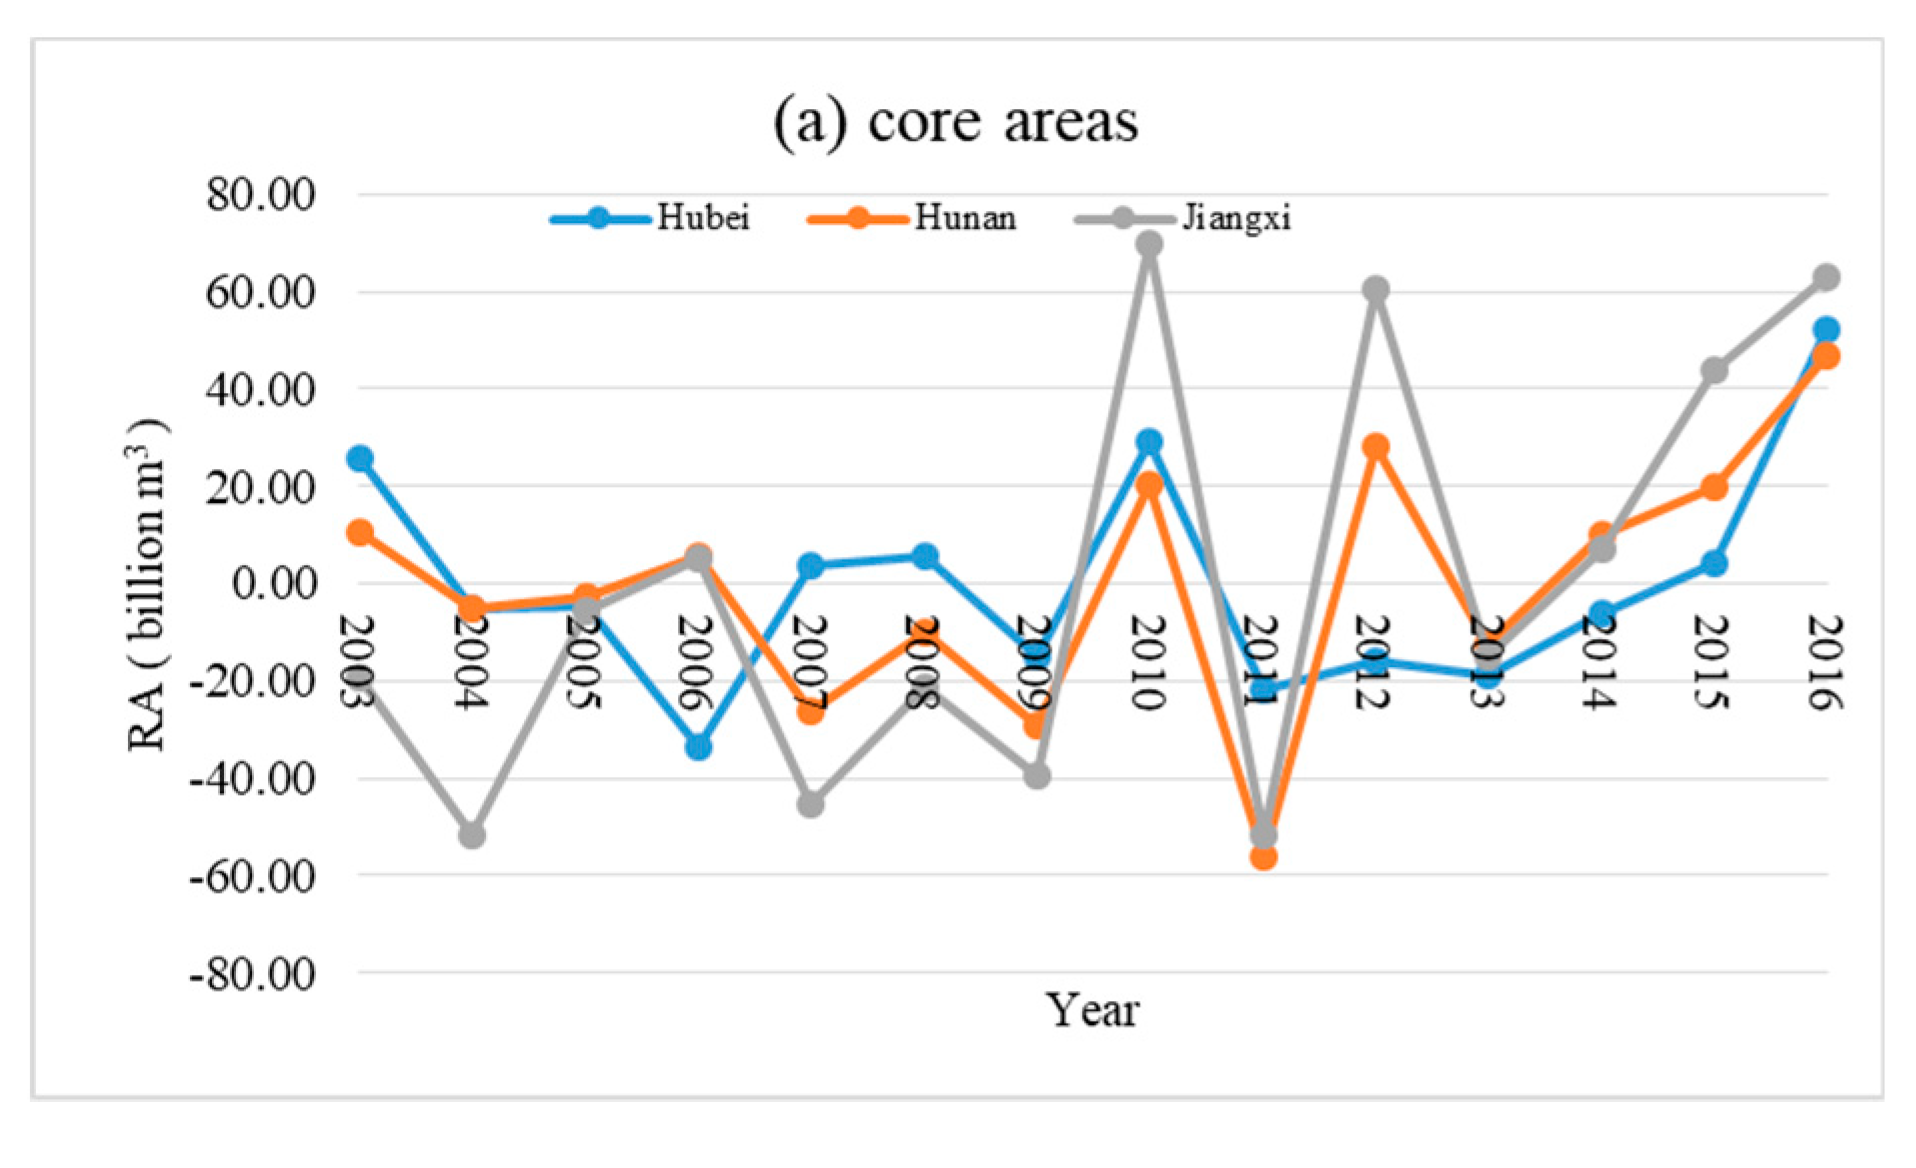
When comparing 2003–2008 to 2009–2016, RA expanded in the core and extended areas but converged in the buffer areas, and the amplification extent was higher in the extended areas than that in the core areas. In the core areas (Figure 2a), RA for Hubei, Hunan and Jiangxi kept a remarkable increase trend, with an amplification of the fluctuation range of 0.25, 1.4 and 1.2 times, respectively. Similarly in extended areas (Figure 2b), RA also amplified, and the increased trend for Jiangsu (2.2 times) was stronger than that for Anhui (1.6 times). In contrast, the buffer areas differed (Figure 2c), Sichuan and Chongqing both converged on 1/3 of the fluctuation range of RA. The results indicate that TGP’s effects were diversified among the core, extended and buffer areas [31]. Generally, the inter-annual fluctuation of RA expanded in the extended and core areas but reduced in the buffer areas, compared to pre-2009.
4.1.2. Alleviation on the Frequencies of Dry and Wet Years in the Buffer, Core and Extended Areas
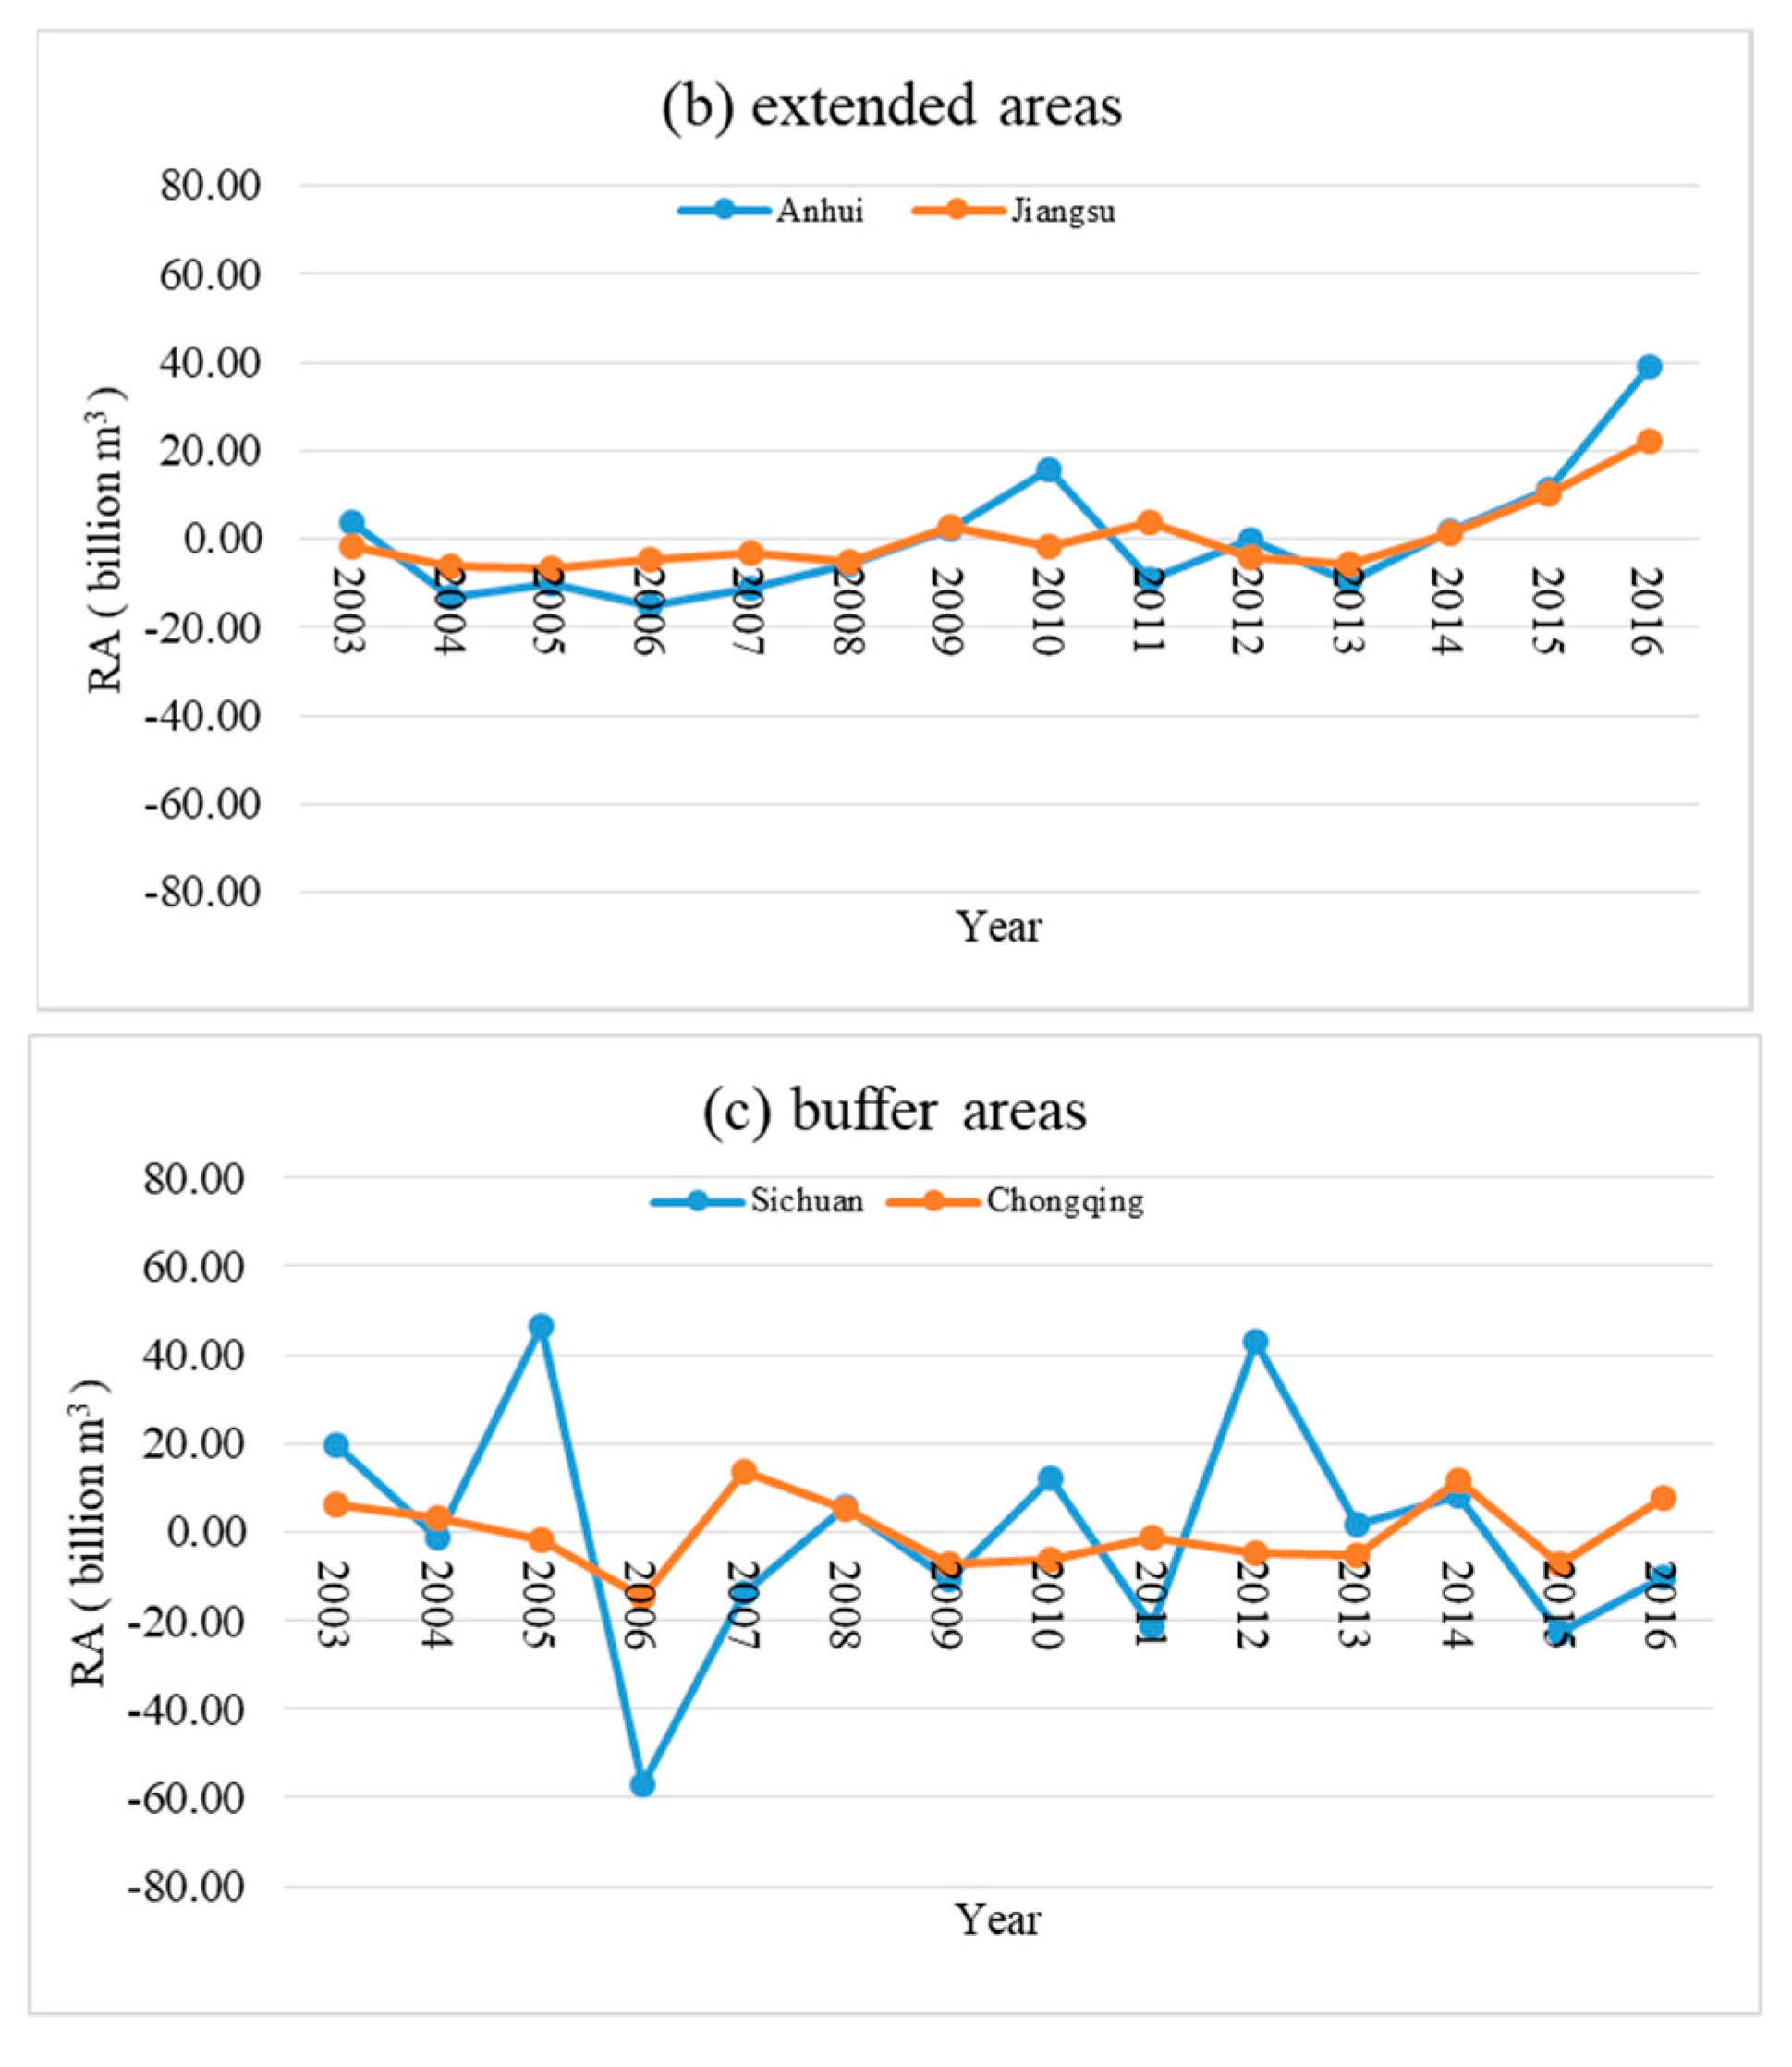
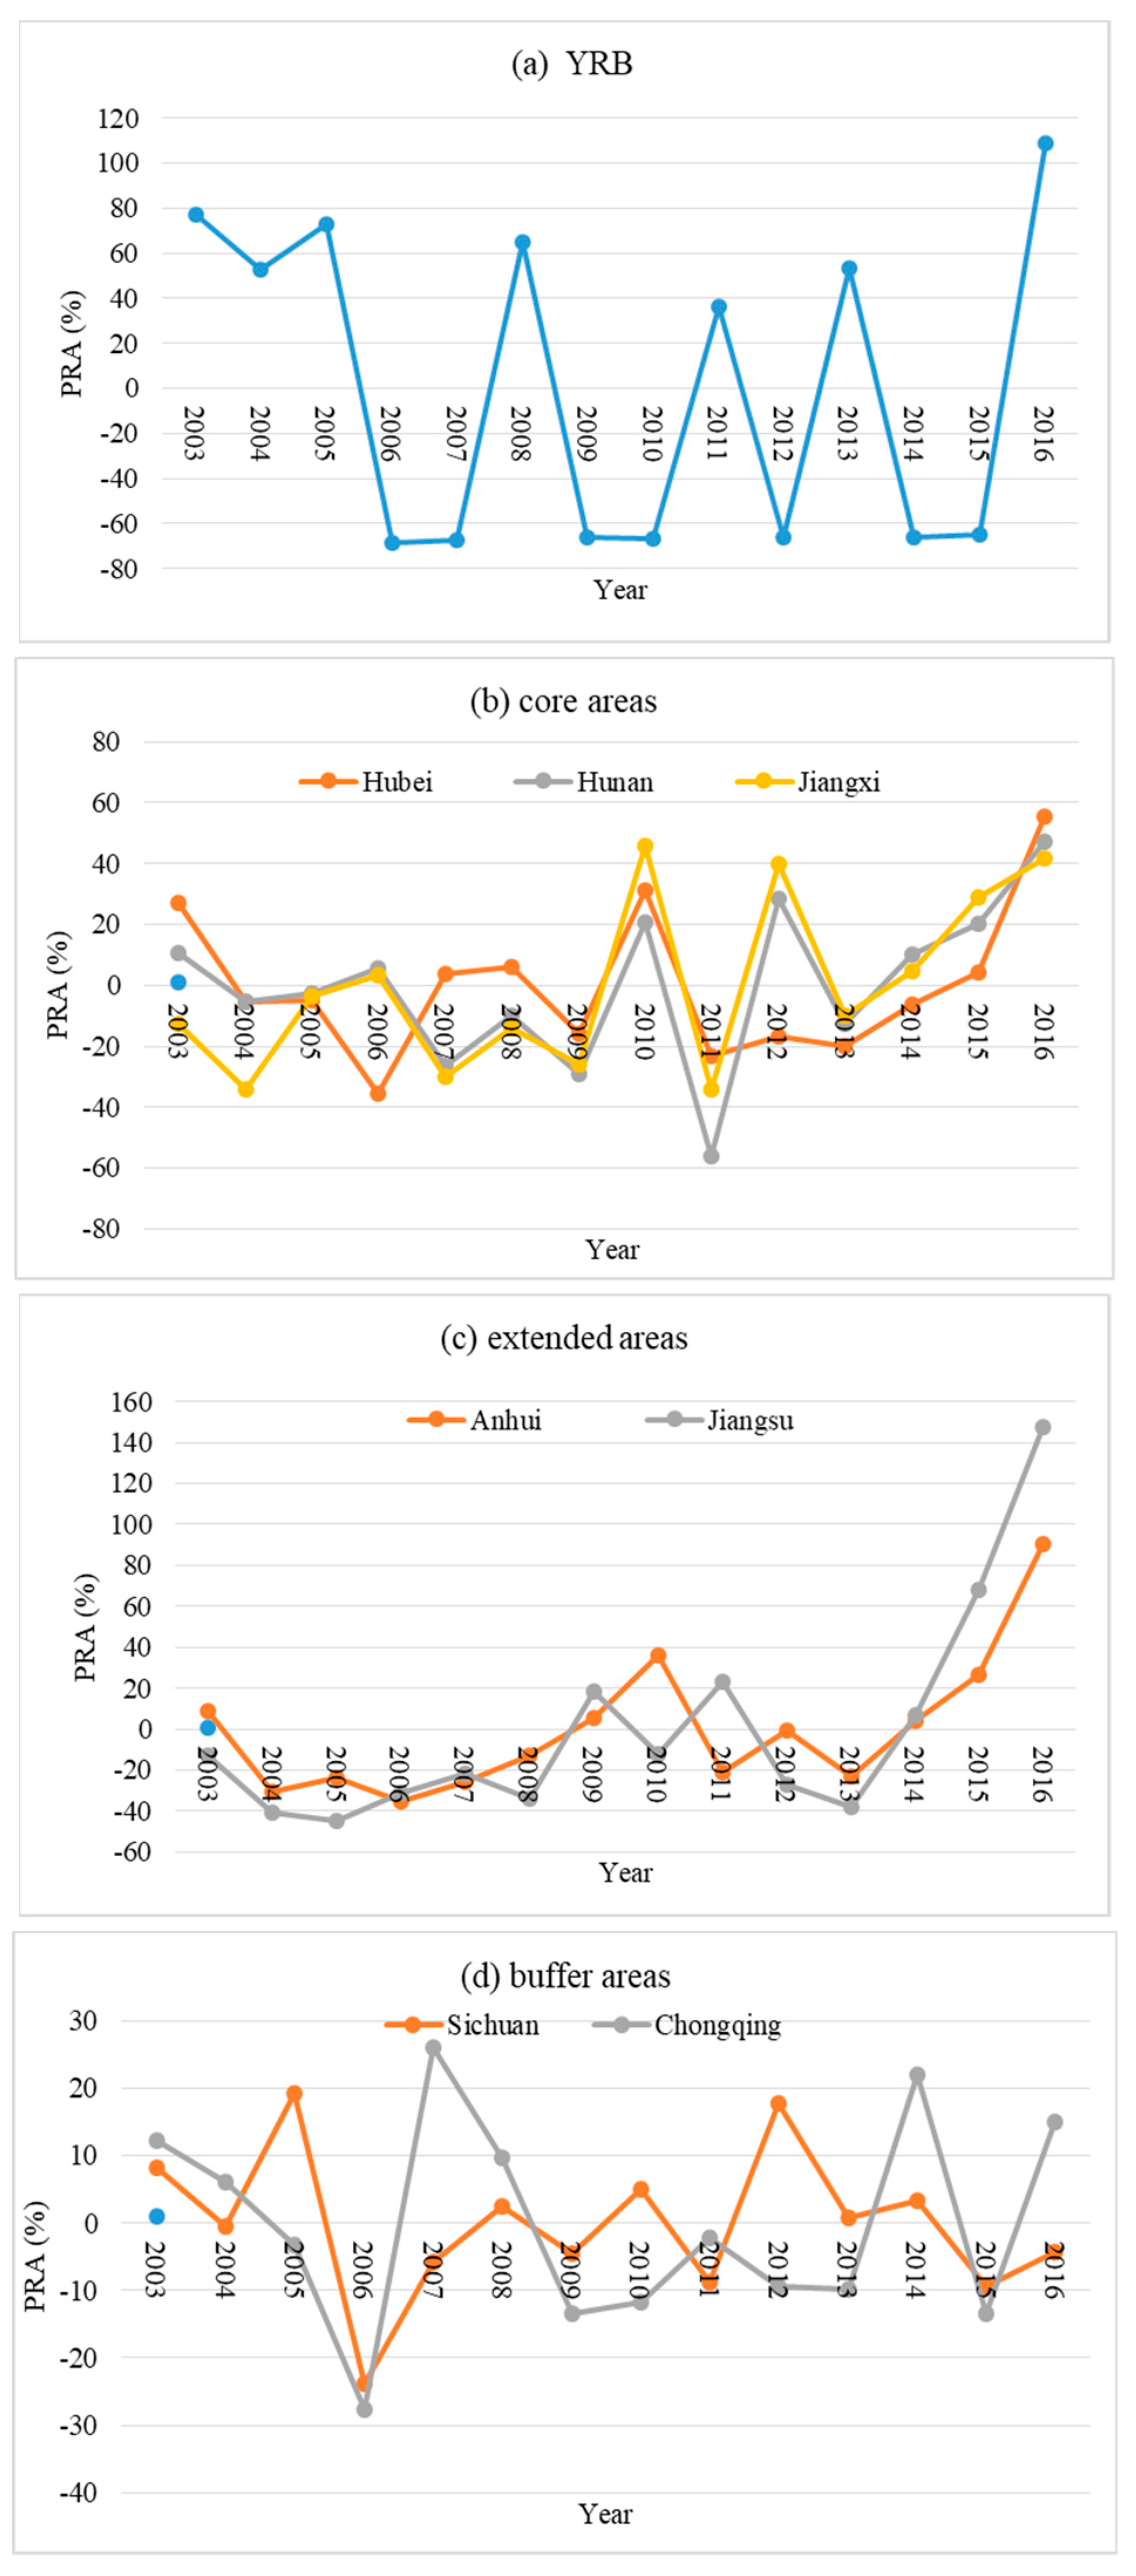
YRB went into a drier phase with sharp fluctuations in 2009–2016 (Figure 3a and Table 1), with 62.5% dry and 37.5% wet years. Under the extreme drought, the alleviation effect of TGP at the whole basin scale was remarkable among the core, extended and buffer areas [32]. First, the core areas (Hubei, Hunan and Jiangxi) showed different patterns in PRA (Figure 3b and Table 1). Hubei became drier from 2003–2008 to 2009–2016. In comparison, Hunan and Jiangxi became wetter in 2009–2016. Second, the extended areas (Anhui and Jiangsu) shifted from dry to wet (Figure 3c and Table 1). For Anhui, dry and less dry years both decreased and correspondingly normal and wet years increased by 58%. Then for Jiangsu, the proportions of dry and less dry years decreased and those of normal, less wet and wet years increased by 62%, respectively. Third, the buffer areas (Sichuan and Chongqing) had a drying tendency, but with the majority of years remaining under the normal condition (Figure 3d and Table 1). Chongqing had a drying tendency, with less dry years increasing by 50%. In summary, Hubei, Sichuan and Chongqing went into a less dry or dry period after the full operation of TGP in 2009. Meanwhile, Hunan, Jiangxi, Anhui and Jiangsu went into a less wet or wet period.
The occurrence of these droughts in YRB was related to drought and flood transformation at a large scale and the characteristics of precipitation evolution, and according to statistical data [33], YRB experienced a wet period around the 1980s, and went into a less wet period after 1999. During the last decade or so, the annual precipitation in YRB decreased by 10–12%. YRB’s drought occurred just at this background of less wet climate. Our results are consistent with the findings that severe droughts occurred inevitably in the southwestern parts and the midstream and downstream of YRB, including the great drought in Sichuan and Chongqing in 2006, the severe drought in the southwestern China from 2009 to 2010, and the serious drought in midstream and downstream of YRB during 2010–2011. They indicate that there is no direct relationship between the drought disasters in YRB and TGP operation, and the drought in the 7 key regions in the past two decades was mainly driven by climate conditions. The TGP operation alleviated drought severity among the core, extended and buffer areas after 2009.
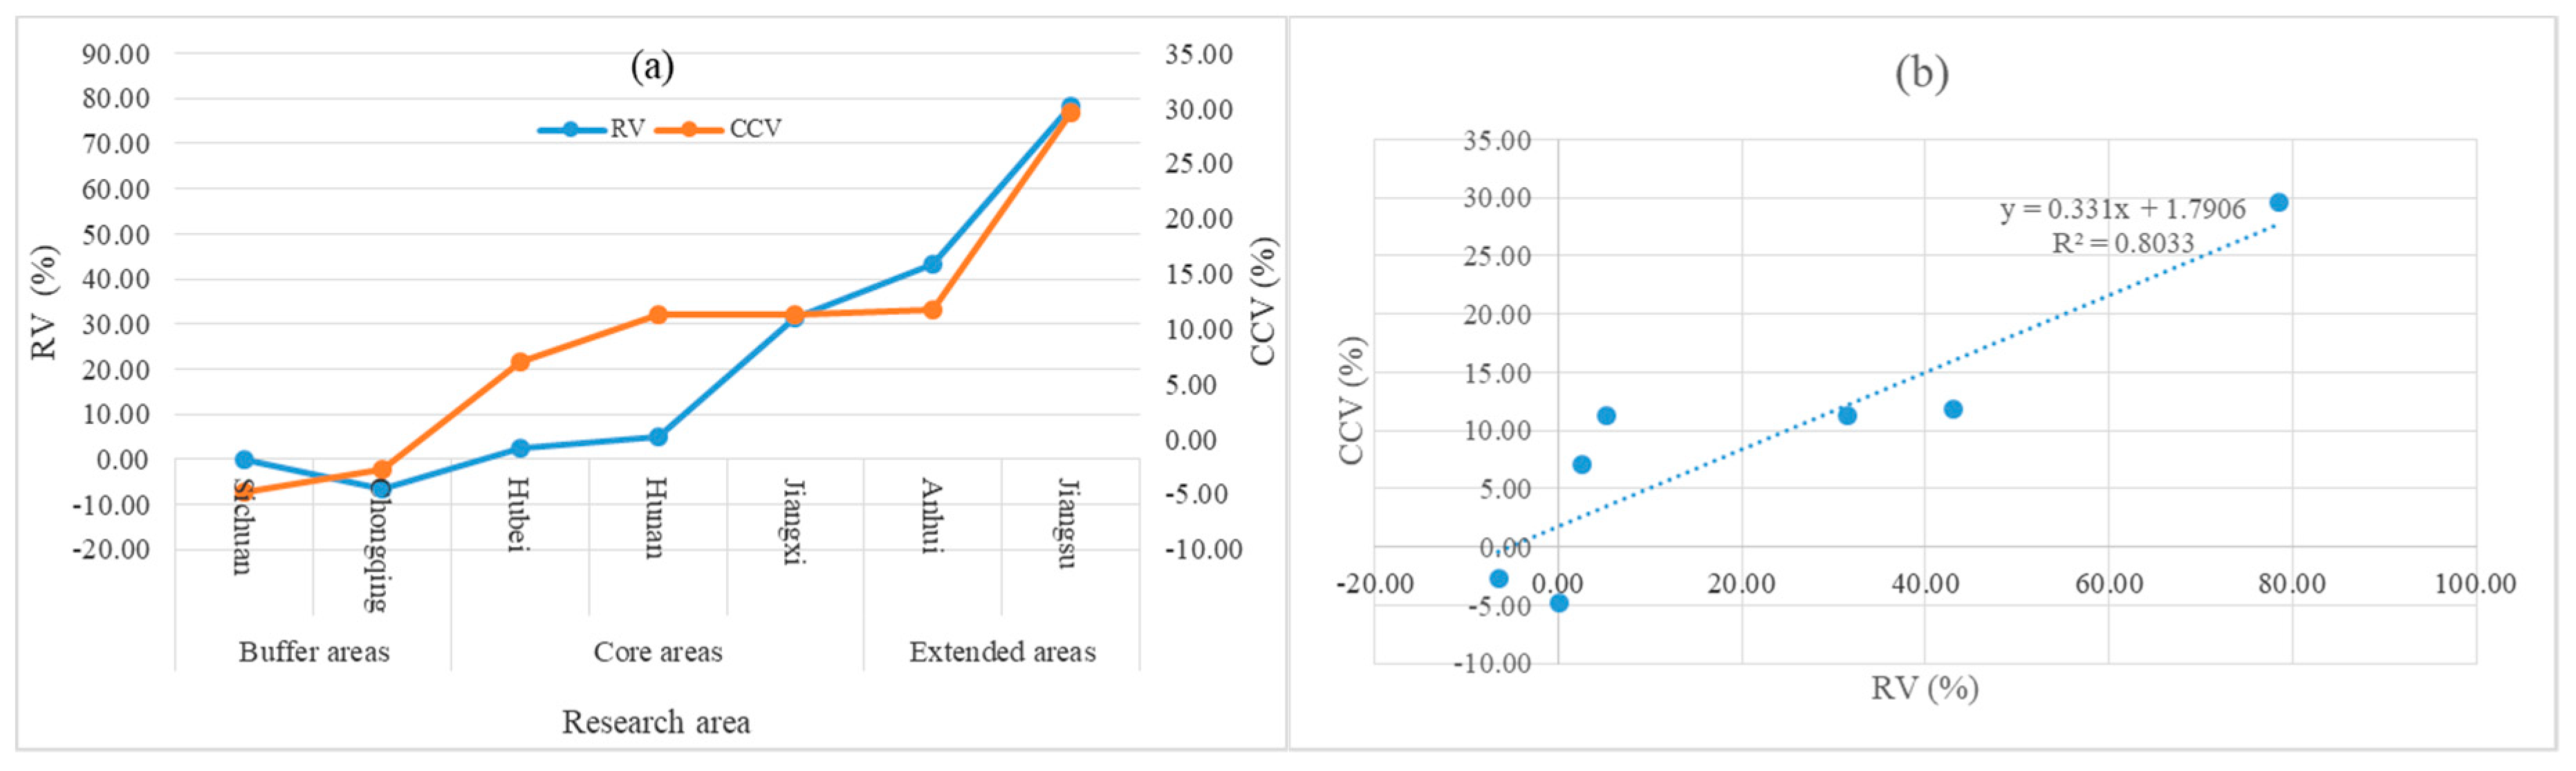
4.2. RV and CCV Both Strengthened in the Extended and Core Areas but Weakened in the Buffer Areas
The RV and CCV both apparently increased from 2003–2008 to 2009–2016 in all three areas (Figure 4a). The RV kept almost stable in Sichuan, decreased in Chongqing, increased slightly in Hubei and Hunan, but increased sharply in Jiangxi, Anhui and Jiangsu, with RV increasing by 31.4%, 43.1% and 78.5%, respectively. The RV mean in the extended areas is almost 4 and 20 times higher than that in the core and buffer areas, respectively. A similar situation occurred for CCV, which increased by 29.6% in Jiangsu, followed by Anhui, Hunan and Jiangxi, with their increased mean of 11~12%, then followed by Hubei with an increase of 7.0%, but instead decreased by −4.8% and −2.7% in Sichuan and Chongqing, respectively. The results indicate that RV and CCV were strengthened in the extended and core areas, but weakened in the buffer areas. Moreover, RV was strongly correlated (R2 = 0.80) to CCV (Figure 4b), indicating that there existed coherence between the effects of TGP on runoff increase and the period fluctuation among the 7 regions.
4.3. Related Benefits of Flood Control of TGP
As mentioned above, the originally scheduled function of flood control of TGP was mainly on the midstream and downstream of YRB, especially the Jing River (Figure 1). The benefits of flood control of TGP started in 2003, and were remarkably exhibited after TGP fully operated with 175m impoundment in 2010. Based on the available disasters data from 2006 to 2016, we analyzed the benefits of flood control in the core and extended areas, including DAP, DEL, ADDA, and PADDA.
4.3.1. Reduction of the Disaster-Affected Population (DAP)
DAP in the core and extended areas decreased sharply in the latter phase, especially after 2010. In the core areas (Figure 5a,b), DAP of the 3 regions remained higher and fluctuated remarkably during 2006–2008. DAP for Hubei declined remarkably from 2010 to 2014, but rebounded to the maximum in 2016; DAP for Hunan declined gradually with fluctuations until 2016, and DAP for Jiangxi declined sharply and became stable until 2016. The mean DAP for Hubei and Hunan decreased by 16% and 34% from 2006–2008 to 2009–2016, respectively. Similarly in the extended areas (Figure 5c), Anhui had a peak in 2007, then kept decreasing from 2010 to 2014, but rebounded during 2015–2016, and Jiangsu went into a steady period during in 2008–2014 after a sharp fall in 2007, then rebounded more than 10 times during 2015–2016, and the corresponding mean for Anhui and Jiangsu decreased by 25% and 67% during 2009–2016, respectively, compared to 2006–2008.
DAP for Hubei had a sharp rebound in 2016, and those of Anhui also emerged during 2015–2016. From the records of Bulletin of Flood and Drought Disasters in China (2015–2016), during the flood season (May–September), the mean precipitation of Hubei in 2016 increased by 19%, compared to the normal year. As a result, three big floods occurred in Yichang and other cities along YR. The mean precipitation of Anhui also increased by 14% and 27% in 2015 and 2016, resulting in three and two floods, respectively, which led to DAP rebounding in Hubei and Anhui.
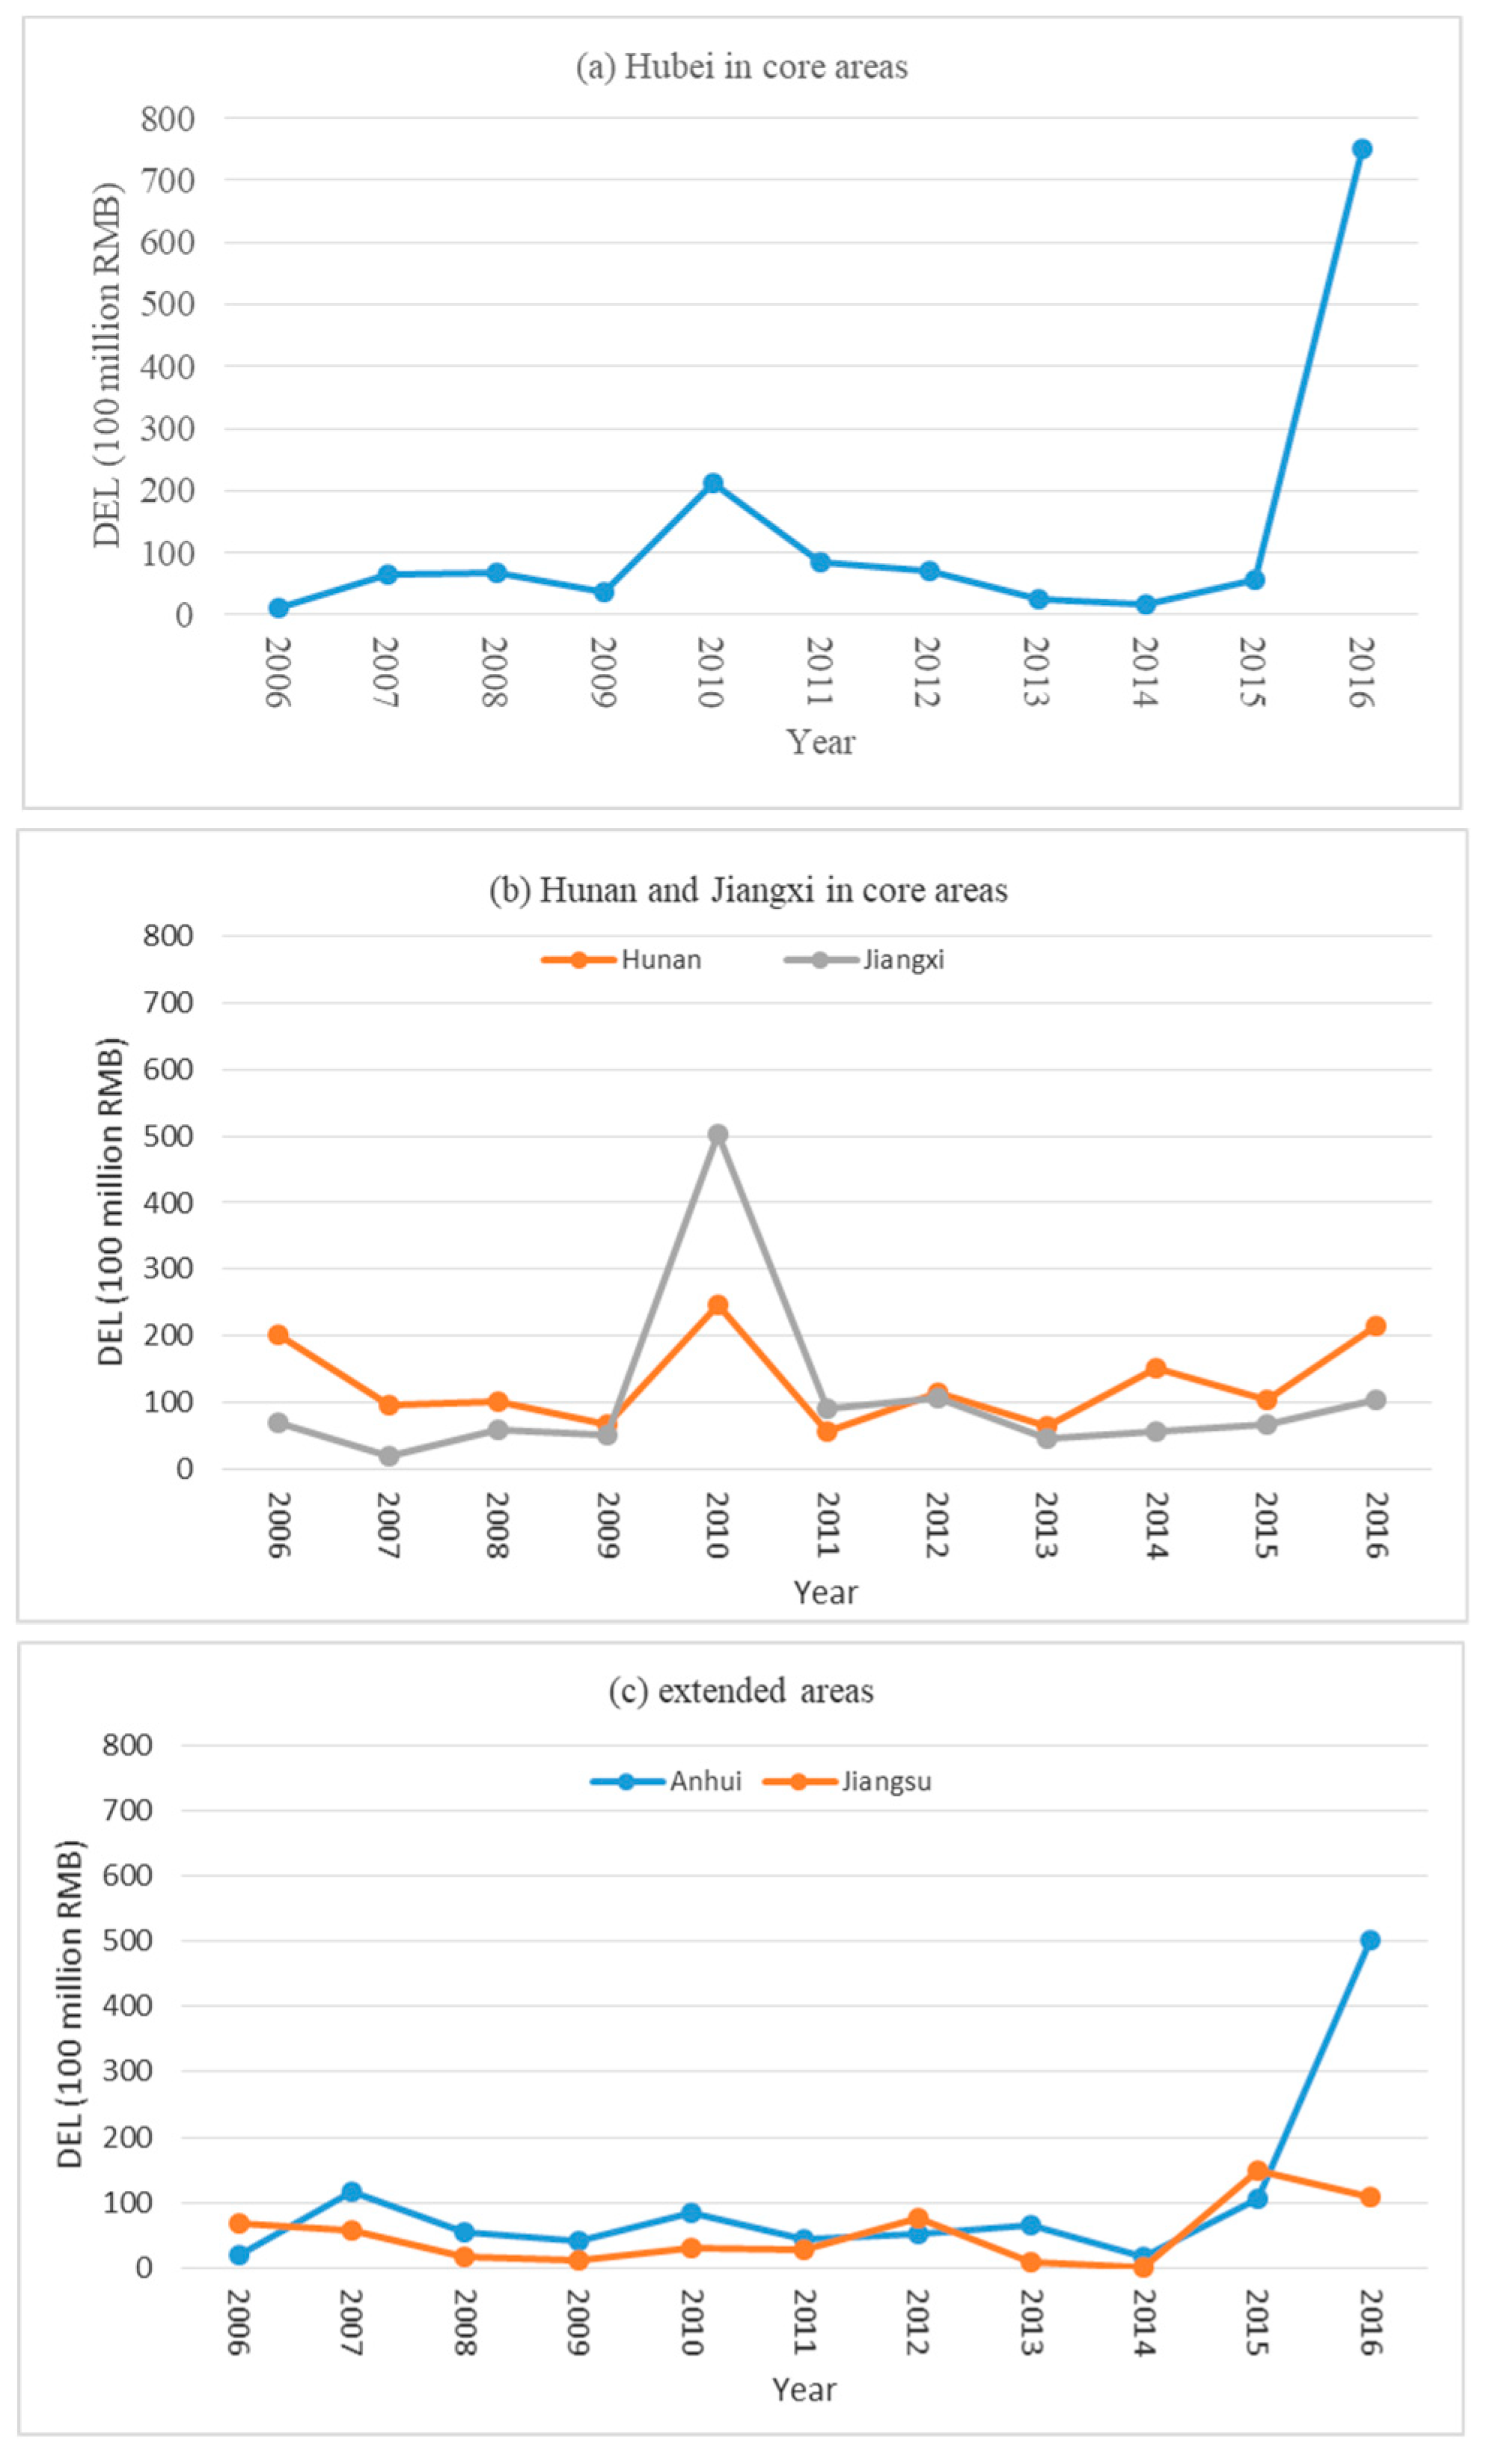
4.3.2. Decline of the Direct Economic Loss (DEL)
In the core areas (Figure 6a,b), except for 2016, the mean DEL remained stable with little fluctuations, after the 2010 rebounds. The 2011–2015 mean DEL for Hubei, Hunan and Jiangxi accounted for 24%, 40% and 14% of the 2010 DEL, respectively. This is mainly caused by the abnormal conditions of 2010 (Bulletin of Flood and Drought Disasters in China, 2010). There were four heavily intensified precipitations that occurred in YRB in 2010, the first occurred in the southern parts of YRB in 13–28 June, the second and third occurred in the upstream of YRB in 15–25 July and 10–26 August, the fourth occurred in the Han River Basin in 10–26 August. These led to four big floods and the higher DEL in in Hubei, Hunan and Jiangxi, and the second and third precipitations even caused the biggest flooding events in the main branches of YRB since 1987, and the highest floods peak to TGR since TGP was constructed. Moreover, except for Anhui in 2016, the extended areas kept stable (Figure 6c), the DEL mean for Anhui and Jiangsu during 2009–2015 accounted for 56% and 29% of the peak in 2015, respectively. The DAP also illustrated the sharp rebound of DEL for Hubei and Anhui in 2016.
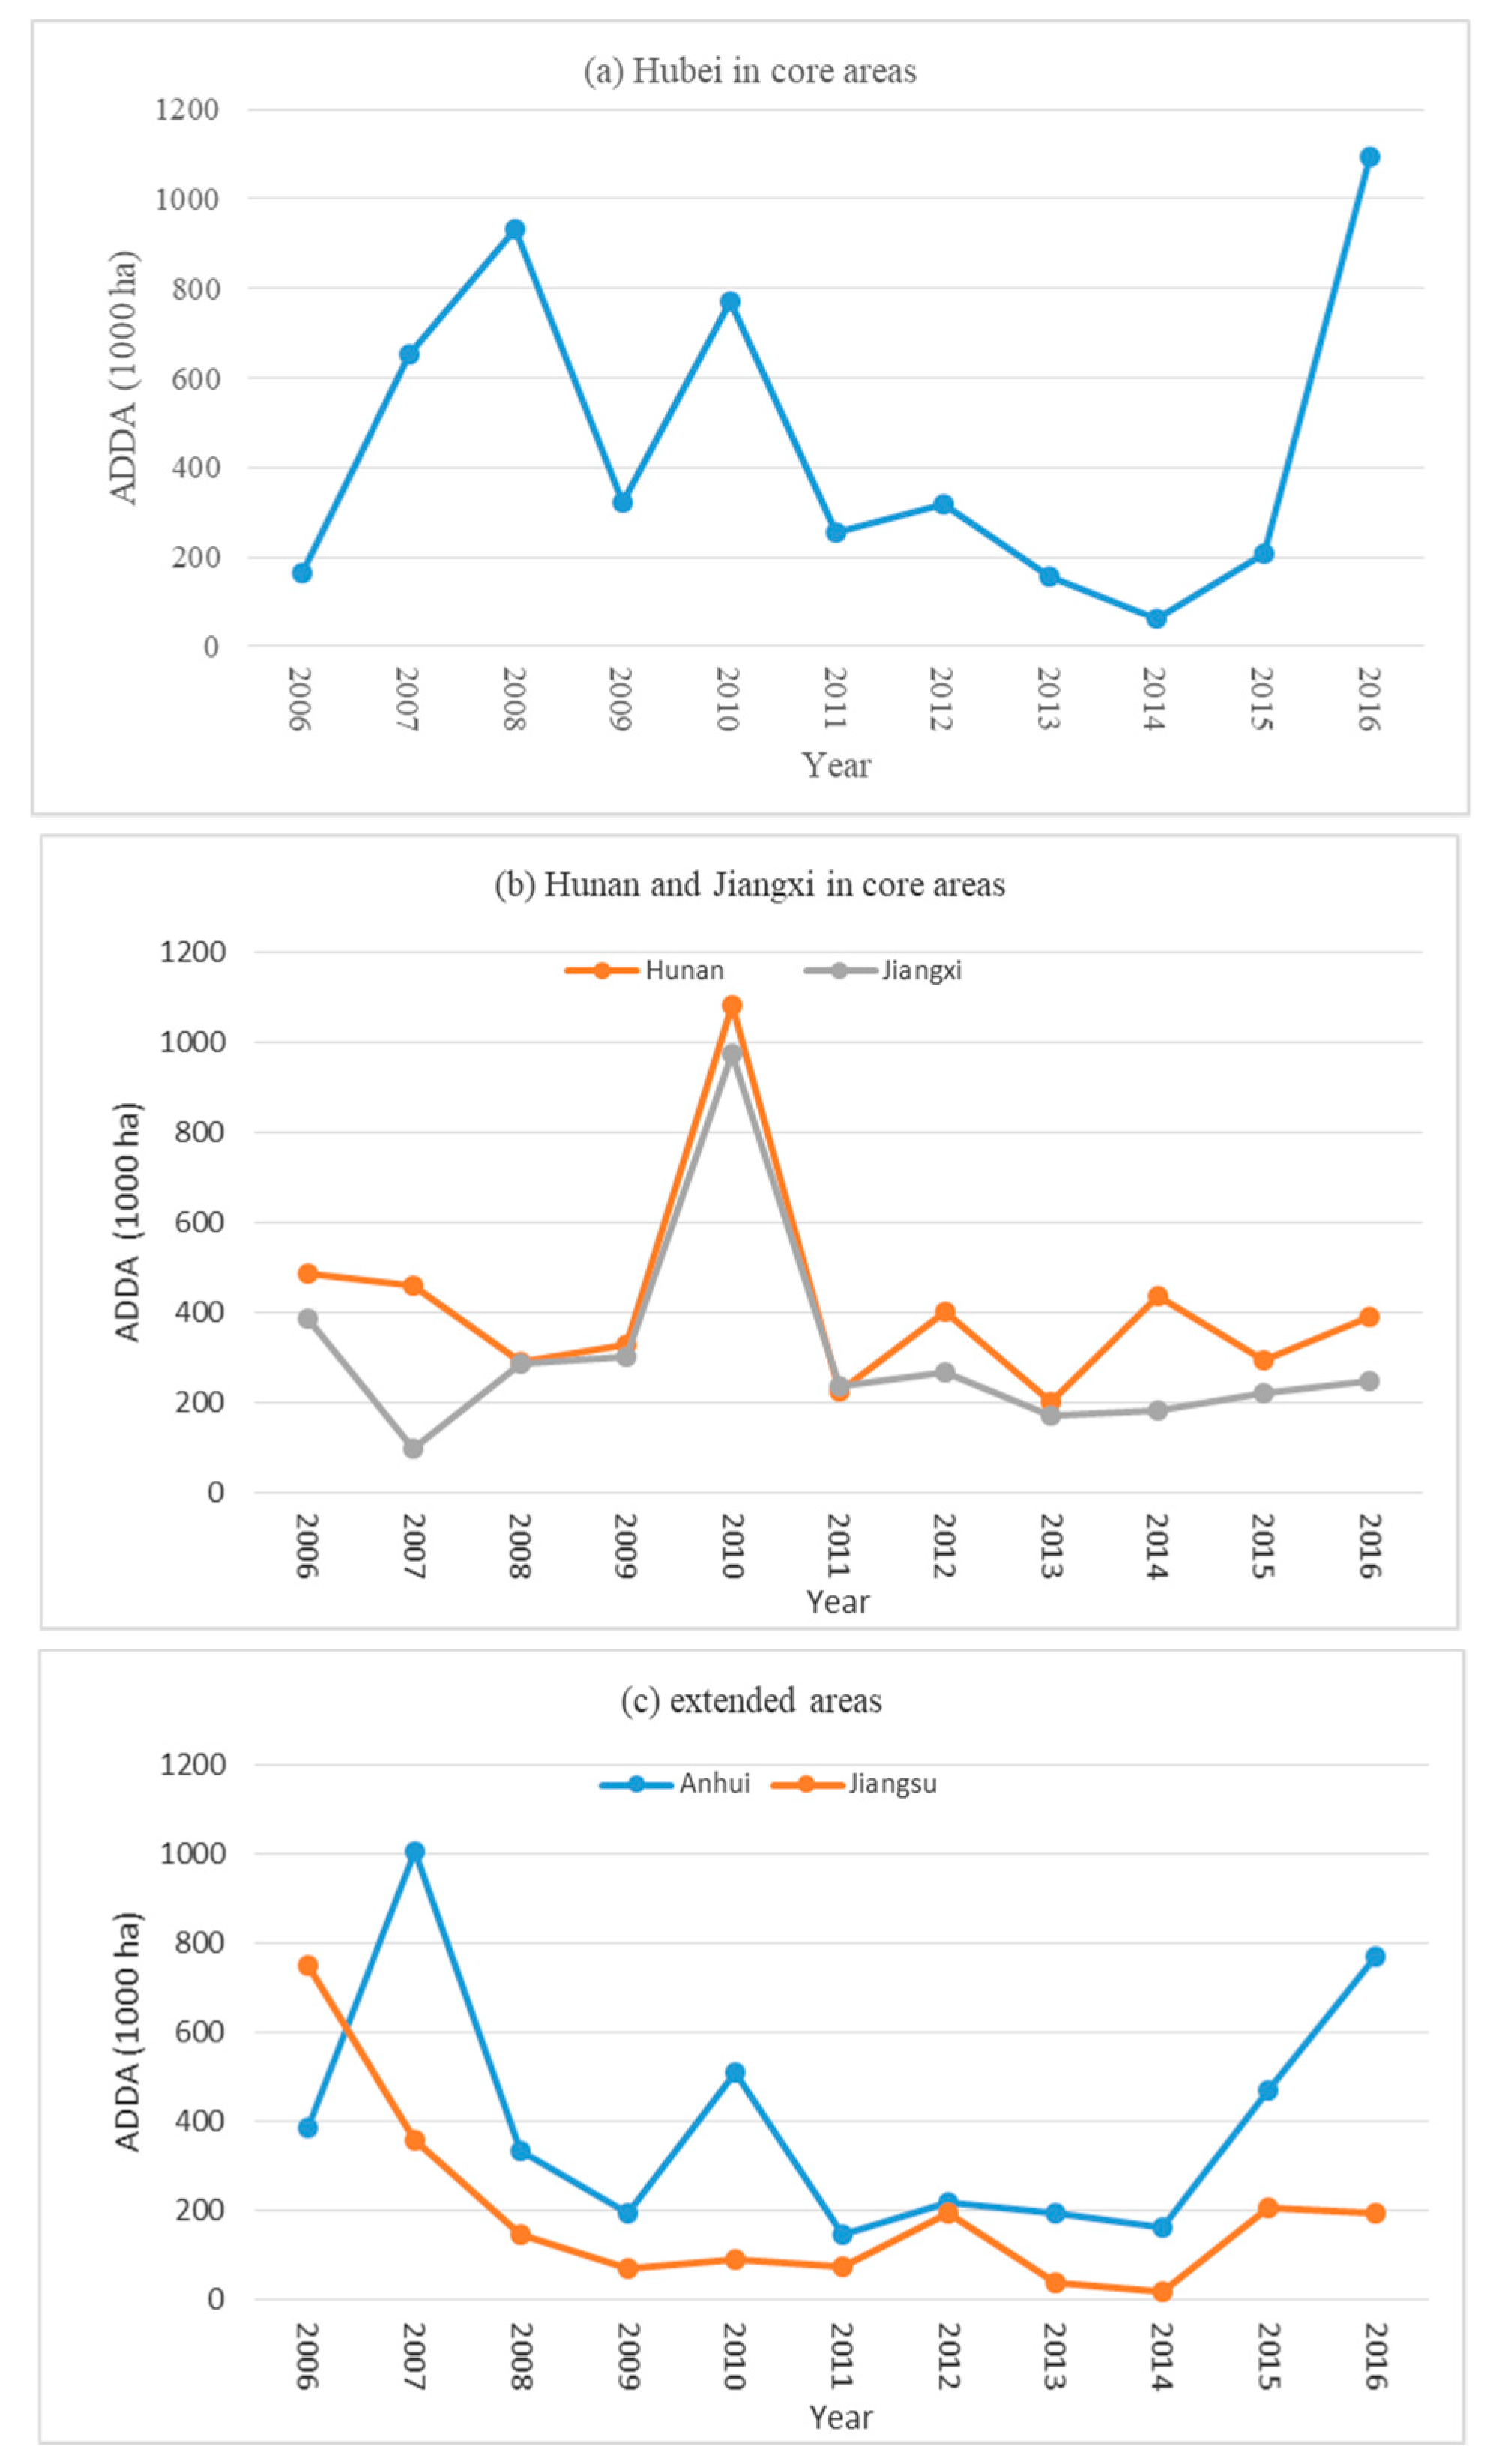
4.3.3. Decrease of the Agricultural Disaster-Damaged Area (ADDA) and Irregularities of the Percentage of Agricultural Disaster-Damaged Area (PADDA)
The ADDA of Hubei, Jiangxi and Hunan fluctuated remarkably in the core areas from 2006 to 2009 (Figure 7a,b). The ADDA for the three regions declined sharply and remained stable from 2011 to 2014 after the high rebound of 2010. The ADDA mean of Hubei decreased by 31% during 2009–2016, compared to 2006–2008; Hunan remained flat; Jiangxi increased by 27%. Nevertheless, in the extended areas (Figure 7c), the ADDA mean of Anhui and Jiangsu both decreased by 42% and 73% in 2009–2016, compared to 2006–2008, respectively. The reason why the ADDA of Hubei (2016) and Anhui (2015 and 2016) rebounded sharply was the same as that for DAP and DEL.
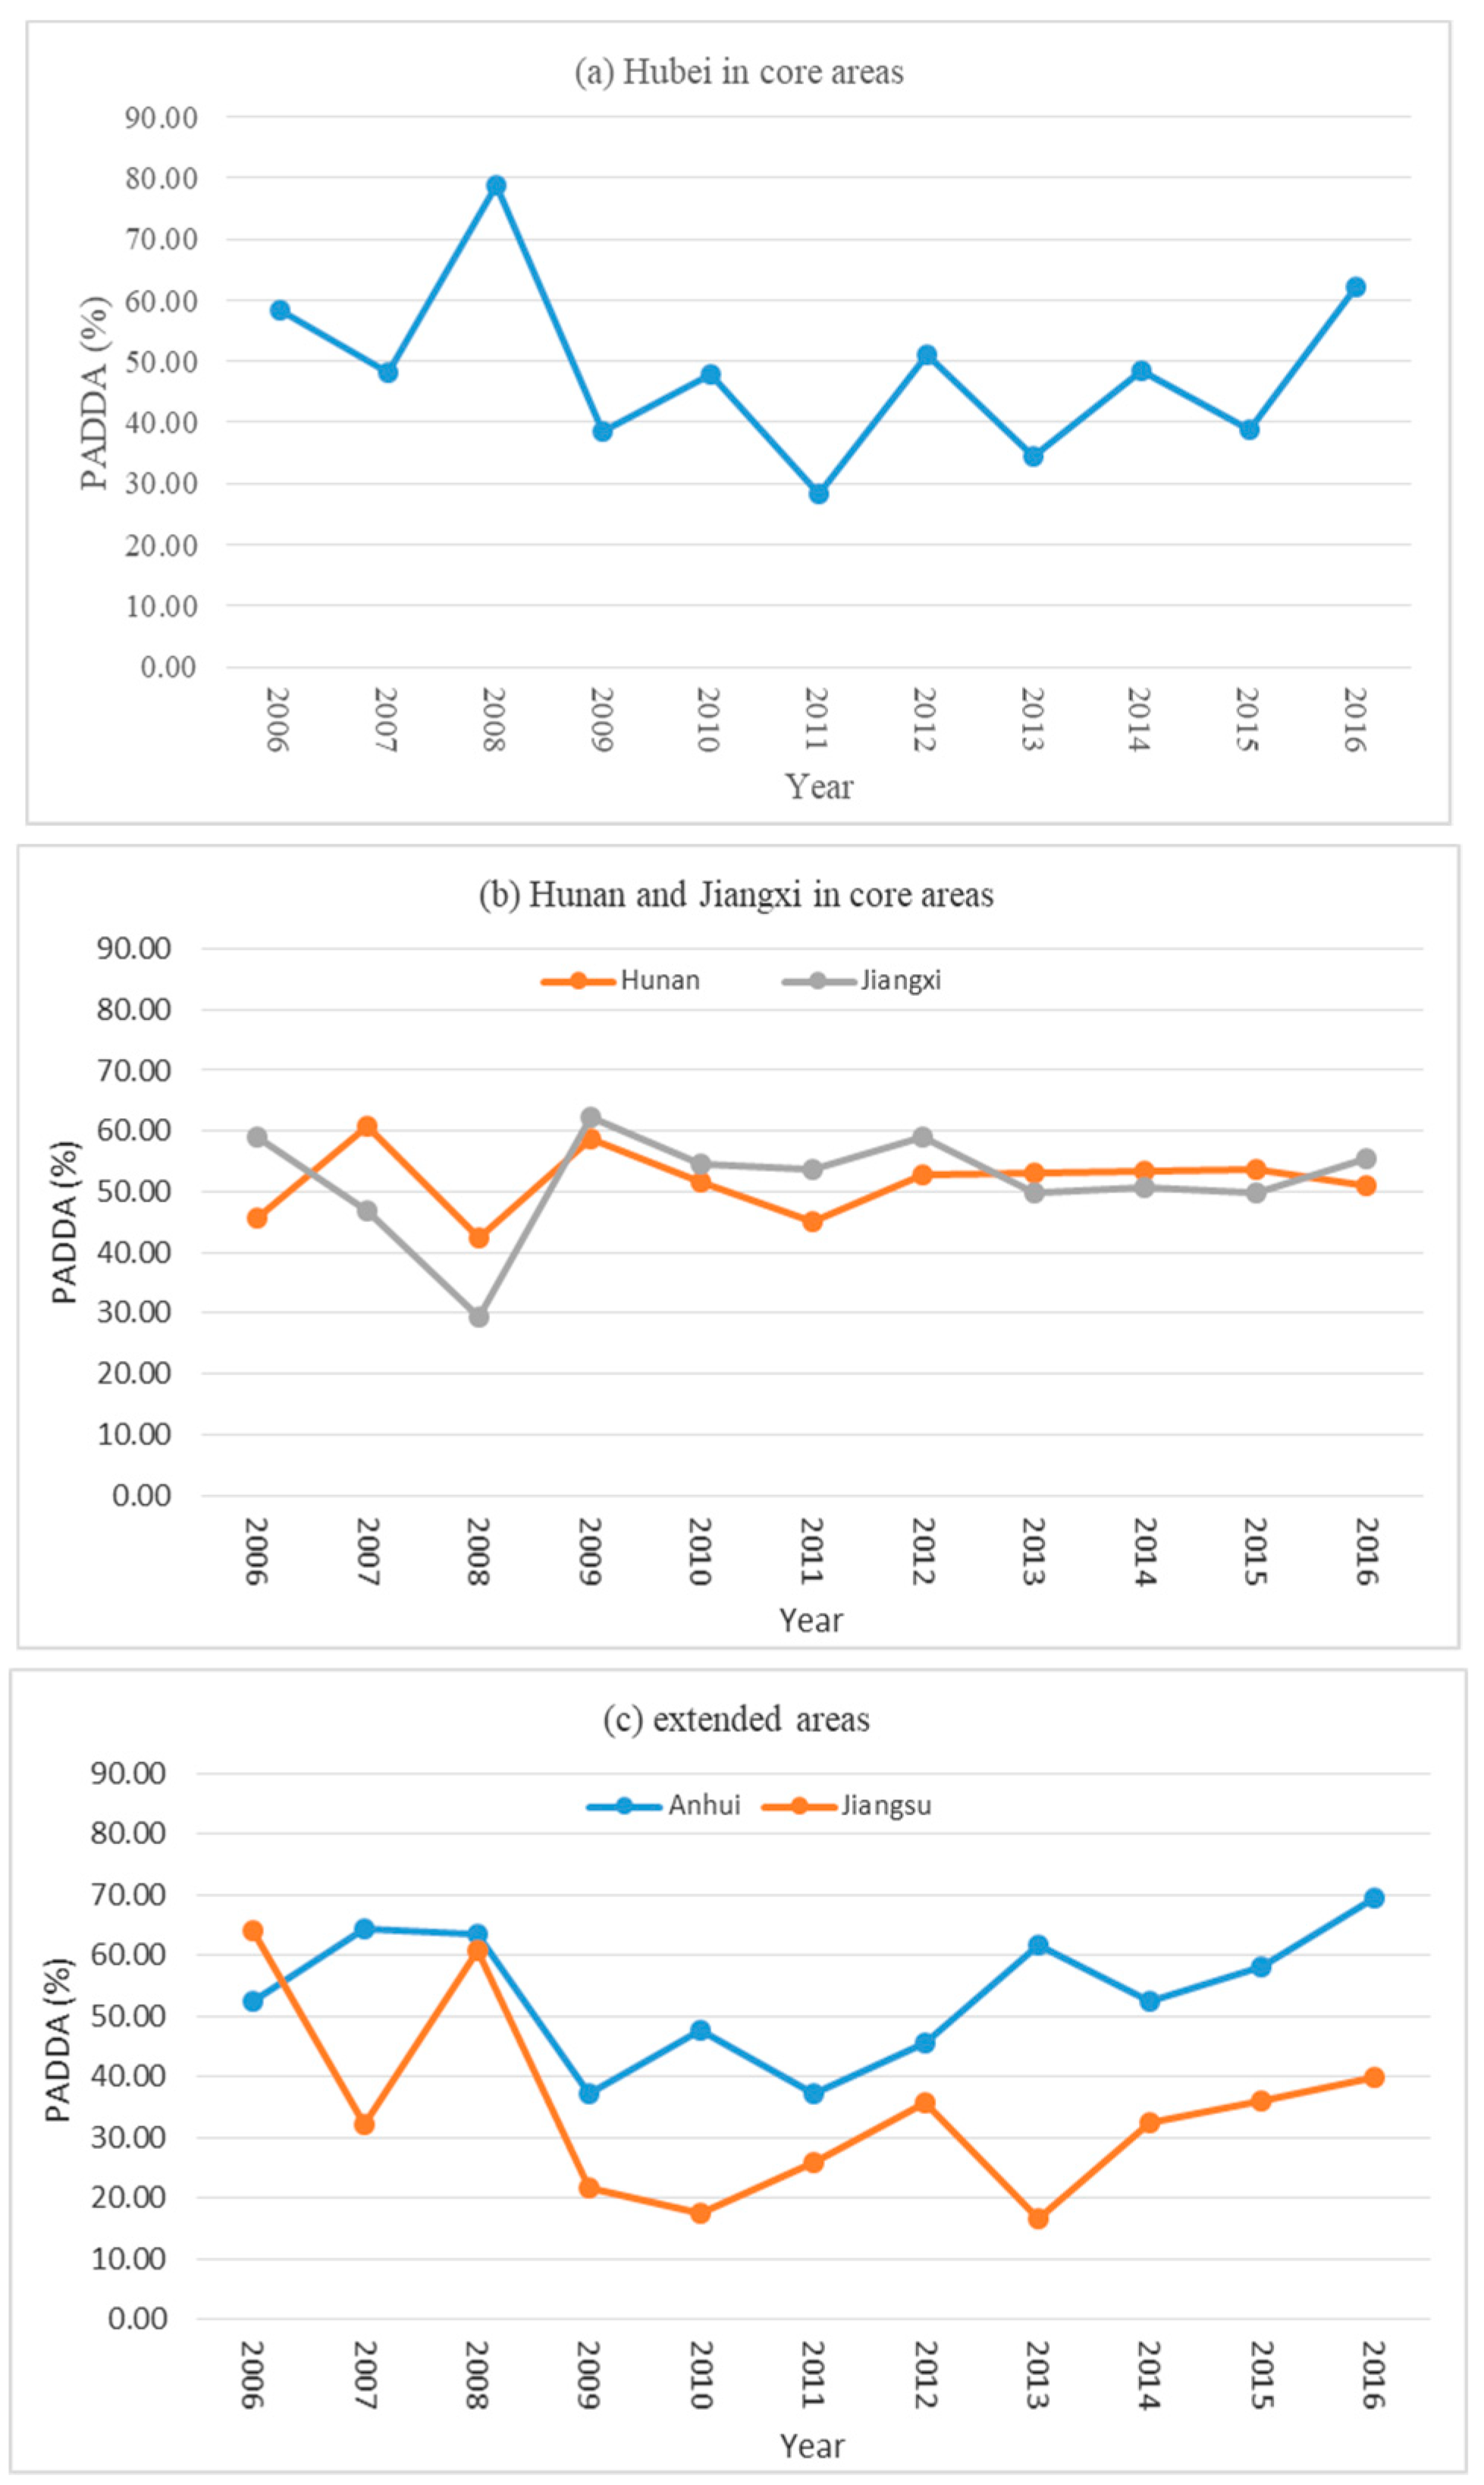
Except for 2015 and 2016, the ADDA in the core areas after 2009 and in the extended areas after 2007 both showed a descending trend, respectively. However, the PADDA did not decline synchronously. In the core areas (Figure 8a,b), the PADDA of Hubei, Hunan and Jiangxi fluctuated sharply during 2006–2008, and during 2009–2016 Hubei went into a fluctuating period with a difference of 33% between the peak (62%, 2016) and the trough (28%, 2011), and Hunan and Jiangxi both went into a smooth period. The extended areas, however, performed differently (Figure 8c), the PADDA of Anhui and Jiangsu both showed an ascending trend from 2009 to 2016 with an increase of 32% and 18%, respectively. In summary, the TGP operation did not work for the middle and lower basin of YRB, since the PADDA among the five regions showed various trends: one (Hubei) fluctuated sharply, two (Hunan and Jiangxi) remained steady, two (Anhui and Jiangsu) increased.
5. Discussions
Based on the definition of research area and the analysis of four runoff indices, and by comparing the period of 2003–2008 with 2009–2016, we find that: (1) TGP operation after 2009 intensified the inter-annual fluctuation of RA in the extended and core areas, but reduced the fluctuation in the buffer areas. Based on the effective flood control of the upstream and water adjustment between the dry and wet seasons, TGP alleviated the frequencies of severe dry and wet years in the buffer, core and extended areas; (2) TGP strengthened RV and CCV in the extended and core areas but weakened them in the buffer areas, the RV was strongly correlated to CCV in the 7 regions, the runoff of the extended and core areas increased, and the corresponding inter-period of CCV was also amplified, especially in Jiangsu, Anhui and Jiangxi; (3) the benefits of TGP’s flood control were mainly reflected by the reduction of DAP, the decline of DEL, and the decrease of ADDA in the core and extended areas.
Our results indicate some preliminary trends regarding TGP’s effects on runoff regime changes. The following three aspects should be further considered and strengthened in the future. The first is the operating years of TGP. From 2009 to 2016, TGP was fully operated for only 7 years, while the comprehensive impacts and benefits need a long period of time to demonstrate. The second is the climate condition of YRB. YRB went into a drier period during 2009–2016, with sharp fluctuations. The capacity of water storage and reallocation of TGP between the dry and wet periods results in either drier or wetter influence in the core and extended areas. The third is the influence of seasonal and non-seasonal precipitation. One main function of TGP is flood controlling for the upstream of YRB. Nevertheless, besides the upstream, local precipitation is another flood source for the core and extended areas. Therefore, DAP, DEL, and ADDA for Hubei and Anhui rebounded sharply in 2010, 2015 and 2016, respectively, and the three indices presented a higher consistence when they faced the severe seasonal and non-seasonal precipitations than they would during a normal year, and big floods caused by regional heavy precipitations become a major disaster for Provincial Governments to solve. To cope with the extreme weather conditions under climate change of YRB, the standard for flood control of water conseRVancy infrastructures and projects in Hubei and Anhui need to improve.
Beyond for the climate change and the disasters of YRB from heavy precipitations, runoff variation and water reallocation, two significant problems highly influence the development of TGP. One is the resettlement displacement and economic development of TGR. The regulations developed by the State Council of China to guide the resettlement were the Regulations on Resettlement for the Construction of TGP on YR in 1993 (henceforth the 1993 regulations), which required rural resettlements were to move up the inundation line and draw back to the feasible farmlands in higher altitude mountainous areas, named exploration-oriented migration (kaifa yimin in Chinese), which meant rural households lived near their old houses and made a living on the reclaimed farmland, and resettled populations in urban areas were to employed in State-owned Enterprises [34]. However, due to the Great 1998 Flood, the impact of intensive land reclamation, deforestation and environmental degradation on TGR [35], the pressure of a resettlements arrangement increase from 1993 to 1998 of 20% beyond the scheduled 1.13 million registered in 1992, and the ceaseless problems in exploration resettlement, the State Council of China announced the adjustment to the 1993 regulations at a working meeting on TGP resettlement in May 1999 (henceforth the 2001 regulations), and resettled 190,000 rural residents (about 15% of the total) to 11 provinces outside TGR, including Shanghai, Jiangsu, Zhejiang, Anhui, Fujian, Jiangxi, Shandong, Hunan, Guangdong, Hubei and Sichuan. Meanwhile, with China’s environmental protection policy being reformed and becoming increasingly strict since the beginning of the 1990s, lots of State-owned Enterprises were closed or restructured [36]. To make matters worse, substandard infrastructure, steep terrain and an unskilled workforce didn’t attract investors, so few new enterprises set up in TGR, which led to the economic growth failing to keep pace with non-TGR regions in Chongqing and Hubei. Therefore the State Council of China initiated the Partner-ship Support Program (PSP) in 1992 and 2014, respectively. Another is sedimentation of TGR. In October 2002, in order to solve the problem of sedimentation from the upstream of YR, the State Council of China approved the Three Gorges Corporation building four hydropower stations along the Jinsha River, Wudongde, Baihetan, Xiluodu and Xiangjia Dam, to share the accumulation and decrease the velocity of sedimentation in TGR.
6. Conclusions
This study conducted a comprehensive analysis on TPG operation impacts by comparing the period of 2009–2016 with 2003–2008. Our results indicated the primary effects of TGP operation after 2009 on runoff changes of the 7 regions in the following three aspects. Firstly, the inter-annual fluctuation of the runoff anomaly in the extended (Anhui and Jiangsu) and core areas (Hubei, Hunan and Jiangxi) expanded and the buffer areas (Sichuan and Chongqing) converged, while the decrease trend was remarkable from the extended, core to buffer areas. With a macro-background of climate change, YRB went into a drier period with sharp fluctuations, while TGP alleviated the frequencies of dry or wet years in the research area. The core (except for Hubei) and extended areas both had a tendency of becoming less wet, however, Hubei and the buffer areas went into a less dry period. Secondly, the runoff variation and the change of CV both strengthened in the extended and core areas but weakened in the buffer areas, and the RV presented a highly positive correlation to CCV. The inter-period increase of runoff was sharp in Jiangsu, Anhui and Hunan, but the corresponding CCV also amplified sharply, which benefited drought alleviation but intensified the flood control risk of the inter-period. Thirdly, the general benefits of flood control of TGP mainly exhibited in the reduction of the DAP, the decline of DEL and the decrease of ADDA in the core and extended areas. Nevertheless, the PADDA of the 5 regions performed in irregularities after 2009, as Hubei went into a sharp fluctuating period, Hunan and Jiangxi both went into a smooth period, Anhui and Jiangsu both showed an ascending trend, respectively, instead of keeping descending trends during 2006–2008.
Moreover, due to big floods caused by heavy precipitations, the sharp rebounds occurred in the DAP, DEL and ADDA for Hubei and Anhui in 2010 and 2016, respectively. So flood control and disaster mitigation capacity within the core and extended areas not only depend on TGP but also rely on the intra system. TGP aims to control the big floods from the upstream of YR, and the intra-system focuses on controlling the seasonal and non-seasonal heavy precipitations. Regional flood control and disaster alleviation is comprehensive and systemic, e.g., agricultural flood control in YRB, one guarantee comes from the regulation and storage of water conseRVancy projects of main branches, tributaries and rivers, while another comes from the storage and reallocation capacity of lakes, reseRVoirs, and ponds connecting with the farmlands.
After experiencing the stages of argument, construction and operation, the Chinese Central Government became cautious towards large dam construction for hydropower exploration [37,38], and the management countermeasures on TGP and YR also became more scientific, including resettlement support [39], sediment sharing in the upstream, securities management, economic supports to TGR, and TGP going into a stage of rehabilitation and improvement. In the future, in order to match and promote the scheduled functions of TGP on flood control, the key regions along the main branches of YR need to build a system and strengthen the connectivity between projects and infrastructure from the county, city, and provincial levels, to the regional level, and even to the national level. Under the drought intensification of YRB in recent years, it is a great challenge for TGP operation to balance the benefits and conflicts among flood control, power generation and water resources distribution in the key regions of the research area.
Author Contributions
Y.Z. conceived this study; Y.G. gathered all the information, data and prepared the first draft of the paper; Y.Z. improved and revised the manuscript.
Acknowledgements
This work was supported by the CAS Pioneer Hundred Talents Program, National Social Science Foundation of China (18BJY068) and National Scholarship Foundation of China (20175087).
Conflicts of Interest
The authors declare no conflicts of interest.
References
- Hadjigeorgalis, E. A place for water markets: Performance and challenges. Rev. Agric. Econ. 2009, 31, 50–67. [Google Scholar] [CrossRef]
- Baghel, R.; Nüsser, M. Discussing large dams in Asia after the world commission on dams: Is a political ecology approach the way forward? Water Altern. 2010, 3, 231–248. [Google Scholar]
- Dudgeon, D. Requiem for a river: Extinctions, climate change and the last of the Yangtze. Aquat. ConseRV. Mar. Freshw. Ecosyst. 2010, 20, 127–131. [Google Scholar] [CrossRef]
- McDonald-Wilmsen, B.; Webber, M. Dams and displacement: Raising the standards and broadening the research agenda. Water Altern. 2010, 3, 142–161. [Google Scholar]
- Abbink, J. Dam controversies: Contested governance and developmental discourse on the Ethiopian Omo River dam. Eur. Assoc. Soc. Anthropol. 2012, 20, 125–144. [Google Scholar] [CrossRef]
- Yüksel, I. Dams and hydropower for sustainable development. Energy Sources Part B 2009, 4, 100–110. [Google Scholar] [CrossRef]
- Beck, M.W.; Claassen, A.H.; Hundt, P.J. Environmental and livelihood impacts of dams: Common lessons across development gradients that challenge sustainability. Int. J. River Basin Manag. 2012, 10, 73–92. [Google Scholar] [CrossRef]
- Andredaki, M.; Georgoulas, A.; Hrissanthou, V.; Kotsovinos, N. Assessment of reseRVoir sedimentation effect on coastal erosion in the case of Nestos River, Greece. Int. J. Sediment Res. 2014, 29, 34–48. [Google Scholar] [CrossRef]
- Samaras, A.G.; Koutitas, C.G. Modelling the impact on coastal morphology of the water management in transboundary river basins: The case of River Nestos. Manag. Environ. Qual. Int. J. 2008, 19, 455–466. [Google Scholar] [CrossRef]
- Ye, Q.; Glantz, M.H. The 1998 Yangtze Floods: The use of short-term forecasts in the context of seasonal to inter-annual water resource management. Mitig. Adapt. Strateg. Glob. Chang. 2005, 10, 159–182. [Google Scholar] [CrossRef]
- Jiao, L. Scientists line up against dam that would alter protected wetlands. Science 2009, 326, 508–509. [Google Scholar] [CrossRef] [PubMed]
- HeRVe, Y.; Claire, H.; Lai, X.; Stéphane, A.; Li, J.; Sylviane, D.; Muriel, B.; Chen, X.; Huang, S.; Burnham, J.; et al. Nine years of water resources monitoring over the middle reaches of the Yangtze River, with ENVISAT, MODIS, Beijing-1 time series, altimetry data and field measurements. Lake Reserve Manag. 2011, 16, 231–247. [Google Scholar] [CrossRef]
- Huang, S.F.; Li, J.G.; Xu, M. Water surface variations monitoring and flood hazard analysis in Dongting Lake are using long-term Terra/MODIS data time series. Nat. Hazards 2012, 62, 93–100. [Google Scholar] [CrossRef]
- Liu, Y.; Wu, G.; Zhao, X. Recent declines of the China’s largest freshwater lake: Trend or regime shift? Environ. Res. Lett. 2013, 8, 014010. [Google Scholar] [CrossRef]
- Wang, J.; Sheng, Y.; Tong, T.S.D. Monitoring decadal lake dynamics across the Yangtze Basin downstream of Three Gorges Dam. Remote Sens. Environ. 2014, 152, 251–269. [Google Scholar] [CrossRef]
- Hu, C.; Fang, C.; Cao, W. Shrinking of Dongting Lake and its weakening connection with the Yangtze River: Analysis of the impact on flooding. Int. J. Sediment Res. 2015, 30, 256–262. [Google Scholar] [CrossRef]
- Yang, G.; Zhu, C.; Jiang, Z. Yangtze ConseRVation and Development Report 2011; Yangtze Press: Wuhan, China, 2011. [Google Scholar]
- Nicol, S.; Roach, J.K.; Griffith, B. Spatial heterogeneity in statistical power to detect changes in lake area in Alaskan National Wildlife Refuges. Landsc. Ecol. 2013, 28, 507–517. [Google Scholar] [CrossRef]
- Roach, J.; Griffith, B. Climate-induced Lake drying causes heterogeneous reductions in waterfowl species richness. Landsc. Ecol. 2015, 30, 1005–1022. [Google Scholar] [CrossRef]
- Ma, D.; Liu, M.; Ju, Y. Evolution characteristics of droughts and floods in Yangtze River and Three Gorges ReseRVoir area in recent 542 Years. Meteorol. Sci. Technol. 2016, 44, 622–630. [Google Scholar]
- Li, J.; Zhou, Y.; Ou, C.; Cheng, W.; Yang, Y.; Zhao, Z. Evolution of water exchange ability between Dongting Lake and Yangtze River and its response to the operation of the Three Gorges ReseRVoir. Acta Geogr. Sin. 2013, 68, 108–119. [Google Scholar]
- Deng, J.; Fan, S.; Pang, C.; Liu, C. Adjustment of regulation and storage capacity of lakes in the middle Yangtze River Basin during impoundment of Three Gorges ReseRVoir. J. Yangtze River Sci. Res. Inst. 2018, 35, 147–152. [Google Scholar]
- Zhang, W.; Gao, Y.; Xu, Q.; Yuan, J. Changes in dominant discharge and their influential factors in the middle and lower reaches of Yangtze River after the Three Gorges Dam impoundment. Adv. Water Sci. 2018, 29, 331–338. [Google Scholar]
- Huang, W.; Wang, W.D. Effects of three gorges dam project on Dongting lake wetlands. Acta Ecol. Sin. 2016, 36, 6345–6352. [Google Scholar]
- Han, J.; Sun, Z.; Yang, Y. Flood and low stage adjustment in the middle Yangtze River after impoundment of the Three Gorges ReseRVoir (TGR). J. Lake Sci. 2017, 29, 1217–1226. [Google Scholar]
- Zhao, W.; Feng, B.; Chen, Y. Influence of impoundment of upstream reseRVoirs on inflow of Three Gorges ReseRVoir from August to October. Yangtze River 2013, 44, 1–4. [Google Scholar]
- Zhang, D.; He, S.; Hu, G.; Hu, G. Preliminary analysis on runoff variation of middle Yangtze River after impoundment of Three Gorges ReseRVoir. Yangtze River 2013, 1, 1–3. [Google Scholar]
- Tullos, D. Assessing the influence of environmental impact assessments on science and policy: An analysis of the Three Gorges Project. J. Environ. Manag. 2009, 90, S208–S223. [Google Scholar] [CrossRef]
- Rui, X. The Principles of Hydrology; Higher Education Press: Beijing, China, 2013. [Google Scholar]
- Hu, X. Analysis of time-space distribution regulation and evolution tendency off runoff of main rivers in Gansu Province. Adv. Earth Sci. 2000, 15, 516–521. [Google Scholar]
- Wang, J.; Sheng, Y.; Gleason, C.J.; Wada, Y. Downstream Yangtze River levels impacted by Three Gorges Dam. Environ. Res. Lett. 2013, 8, 1–9. [Google Scholar] [CrossRef]
- Fan, Y.; Zhang, W.; Han, J.; Yu, M. The typical meandering river evolution adjustment and its driving mechanism in the downstream reach of TGR. Acta Geogr. Sin. 2017, 72, 420–431. [Google Scholar]
- Wang, W.; Zheng, G. (Eds.) Annual Report on Actions to Address Climate Change (2011): Durban Dilemma and China’s Strategic Options; Social Sciences Academic Press: Beijing, China, 2011. [Google Scholar]
- McDonald-Wilmsen, B. Development-induced displacement and resettlement: Negotiating fieldwork complexities at the Three Gorges Dam, China. Asia Pac. J. Anthropol. 2009, 10, 283–300. [Google Scholar] [CrossRef]
- Tan, Y.; Bryan, B.; Hugo, G. Development, land-use change and rural resettlement capacity: A case study of the Three Gorges Project, China. Aust. Geogr. 2005, 36, 201–220. [Google Scholar] [CrossRef]
- Duan, Y.; Steil, S. China Three Gorges project resettlement: Policy, planning and implementation. J. Refugee Stud. 2003, 16, 422–443. [Google Scholar]
- Magee, D.; McDonald, K. Beyond Three Gorges: Nu Rivers hydropower and energy decision politics in China. Asian Geogr. 2006, 25, 39–60. [Google Scholar]
- Xie, L.; Van Der Heijden, H.A. Environmental movements and political opportunities: The case of China. Soc. Mov. Stud. 2010, 9, 51–68. [Google Scholar] [CrossRef]
- Wilmsen, B. After the deluge: A longitudinal study of resettlement at the Three Gorges Dam, China. World Dev. 2016, 84, 41–54. [Google Scholar] [CrossRef]
Figure 1.
Locations of TGP, the Jing River (red), the Yangtze River (blue), and the definition of the research area, the buffer (yellow), core (green) and extended areas (pink).
Figure 1.
Locations of TGP, the Jing River (red), the Yangtze River (blue), and the definition of the research area, the buffer (yellow), core (green) and extended areas (pink).

Figure 2.
Change trends of the runoff anomaly (RA) among the core (a), extended (b) and buffer areas (c).
Figure 2.
Change trends of the runoff anomaly (RA) among the core (a), extended (b) and buffer areas (c).


Figure 3.
Change trends of the percentage of runoff anomaly (PRA) among YRB (a), the core (b), extended (c) and buffer areas (d).
Figure 3.
Change trends of the percentage of runoff anomaly (PRA) among YRB (a), the core (b), extended (c) and buffer areas (d).

Figure 4.
Change trends of RV and CCV (a) and their relationships (b) among the core, extended and buffer areas.
Figure 4.
Change trends of RV and CCV (a) and their relationships (b) among the core, extended and buffer areas.

Figure 5.
Change trends of DAP for Hubei (a), Hunan and Jiangxi (b) in the core and extended areas (c).
Figure 5.
Change trends of DAP for Hubei (a), Hunan and Jiangxi (b) in the core and extended areas (c).

Figure 6.
Change trends of DEL for Hubei (a), Hunan and Jiangxi (b) in the core and extended areas (c).
Figure 6.
Change trends of DEL for Hubei (a), Hunan and Jiangxi (b) in the core and extended areas (c).

Figure 7.
Change trends of ADDA for Hubei (a), Hunan and Jiangxi (b) in the core and extended areas (c).
Figure 7.
Change trends of ADDA for Hubei (a), Hunan and Jiangxi (b) in the core and extended areas (c).

Figure 8.
Change trend of PADDA for Hubei (a), Hunan and Jiangxi (b) in the core and extended areas (c).
Figure 8.
Change trend of PADDA for Hubei (a), Hunan and Jiangxi (b) in the core and extended areas (c).


Table 1.
Frequencies of dry or wet years of YRB and the 7 regions based on PRA.
| Dry Years Proportion (%) | Less Dry Years Proportion (%) | Normal Years Proportion (%) | Less Wet Years Proportion (%) | Wet Years Proportion (%) | ||||||
|---|---|---|---|---|---|---|---|---|---|---|
| 2003–2008 | 2009–2016 | 2003–2008 | 2009–2016 | 2003–2008 | 2009–2016 | 2003–2008 | 2009–2016 | 2003–2008 | 2009–2016 | |
| YRB | 33.33 | 62.50 | 66.67 | 37.50 | ||||||
| Sichuan | 16.67 | 12.50 | 66.67 | 75.00 | 16.67 | 12.50 | ||||
| Chongqing | 16.67 | 50.00 | 33.33 | 25.00 | 33.33 | 12.50 | 16.67 | 12.50 | ||
| Hubei | 16.67 | 25.00 | 25.00 | 66.67 | 25.00 | 16.67 | 25.00 | |||
| Hunan | 16.67 | 25.00 | 16.67 | 12.50 | 50.00 | 16.67 | 12.50 | 50.00 | ||
| Jiangxi | 33.33 | 25.00 | 33.33 | 12.50 | 33.33 | 12.50 | 50.00 | |||
| Anhui | 66.67 | 25.00 | 16.67 | 16.67 | 37.50 | 37.50 | ||||
| Jiangsu | 83.33 | 25.00 | 16.67 | 12.50 | 12.50 | 12.50 | 37.50 | |||
© 2019 by the authors. Licensee MDPI, Basel, Switzerland. This article is an open access article distributed under the terms and conditions of the Creative Commons Attribution (CC BY) license (http://creativecommons.org/licenses/by/4.0/).
Share and Cite
MDPI and ACS Style
Gao, Y.; Zhang, Y. Effects of the Three Gorges Project on Runoff and Related Benefits of the Key Regions along Main Branches of the Yangtze River. Water 2019, 11, 269. https://0-doi-org.brum.beds.ac.uk/10.3390/w11020269
AMA Style
Gao Y, Zhang Y. Effects of the Three Gorges Project on Runoff and Related Benefits of the Key Regions along Main Branches of the Yangtze River. Water. 2019; 11(2):269. https://0-doi-org.brum.beds.ac.uk/10.3390/w11020269
Chicago/Turabian StyleGao, Yanjun, and Yongqiang Zhang. 2019. "Effects of the Three Gorges Project on Runoff and Related Benefits of the Key Regions along Main Branches of the Yangtze River" Water 11, no. 2: 269. https://0-doi-org.brum.beds.ac.uk/10.3390/w11020269
Note that from the first issue of 2016, this journal uses article numbers instead of page numbers. See further details here.