Article

Assessment of the Nonlinear Flow Characteristic of Water Inrush Based on the Brinkman and Forchheimer Seepage Model

1
State Key Laboratory of Eco-hydraulics in Northwest Arid Region, Xi’an University of Technology, Xi’an 710048, China
2
Institute of Geotechnical Engineering, Shaanxi Provincial Key Laboratory of Loess Mechanics and Engineering, Xi’an University of Technology, Xi’an 710048, China
3
State Key Laboratory for Geomechanics and Deep Underground Engineering, China University of Mining and Technology, Xuzhou 221116, China
*
Author to whom correspondence should be addressed.
Submission received: 21 March 2019 / Revised: 15 April 2019 / Accepted: 23 April 2019 / Published: 24 April 2019
(This article belongs to the Section Hydraulics and Hydrodynamics)

Abstract

:
Underground fault water inrush is a hydrogeological disaster that frequently occurs in underground mining and tunnel construction projects. Groundwater may pour from an aquifer when disasters occur, and aquifers are typically associated with fractured rock formations. Water inrush accidents are likely to occur when fractured rock masses are encountered during excavation. In this study, Comsol Multiphysics, cross-platform multiphysics field coupling software, was used to simulate the evolution characteristics of water flow in different flow fields of faults and aquifers when water inrush from underground faults occurs. First, the Darcy and Brinkman flow field nonlinear seepage models were used to model the seepage law of water flow in aquifers and faults. Second, the Forchheimer flow field was used to modify the seepage of fluid in fault-broken rocks in the Brinkman flow field. In general, this phenomenon does not meet the applicable conditions of Darcy’s formula. Therefore, the Darcy and Forchheimer flow models were coupled in this study. Simulation results show that flow behavior in an aquifer varies depending on fault permeability. An aquifer near a fault is likely to be affected by non-Darcy flow. That is, the non-Darcy effect zone will either increase or decrease as fault permeability increases or decreases. The fault rupture zone that connects the aquifer and upper roadway of the fault leads to fault water inrush due to the considerably improved permeability of the fractured rock mass.

1. Introduction

Water inrush is a hydrogeological disaster that frequently occurs in underground mining and tunnel construction projects. Groundwater inflows from aquifers due to mining disturbances, which are typically associated with fractured rock formations (e.g., structural faults and collapse columns), may cause problems in the safe operation of underground engineering [1,2]. Water inrush caused by mining is one of the most serious hydrological disasters that have resulted in high casualties and serious economic losses in China. A fault zone acts as a water inrush channel that connects an aquifer to a roadway. When fault water velocity is extremely high, the relationship between velocity and the hydraulic gradient deviates from the linear Darcy model, and thus, belongs to the non-Darcy effect [3,4]. Therefore, studying the flow mechanism of groundwater outburst based on Darcy’s law may provide inaccurate results. A reasonable description of the non-Darcy flow behavior of groundwater outburst is not only important in determining fluid mechanism but also in predicting groundwater influx and preventing water inrush.
In China, particularly north China and south China, several coal mines are being threatened by varying levels of underground fault water inrush. The shallow resources of mining areas under large-scale mining in north China’s coalfield have depleted rapidly; consequently, many mining projects have gradually turned to deep mining. As mining depth increases, hydrogeological conditions become increasingly complex, thereby leading to the growing threat of fault water inrush damage. For example, in 1980, a sandstone water inrush accident occurred in Gezhuang Mine in Beijing. The monthly water inrush was 600–1244 m3/h, and 33 coal mine units imported from Germany were buried; this accident not only affected other coal mining faces but also the operation of coal mines [5]. Frequent water inrush accidents have caused considerable losses to the social economy. Based on incomplete statistics, economic losses due to underground water inrush at the bottom of the coal seams in Shanxi coal mines have amounted to 10 billion yuan, along with thousands of casualties [6]. In recent years, water inrush accidents in coal mines have been controlled. However, coal seam mining in high-pressure water remains a global technical and engineering problem due to the geological and mining conditions in various regions.
Serious water inrush accidents occur constantly in China’s mines, which draws the attention of people to this serious problem. Chinese scholars have done a lot of research on water inrush from faults [7,8,9,10]. The geological environment conditions of coal seams are qualitatively analyzed based on geological hazards, such as surface subsidence caused by strata movement. Then, the height of a water-conducting fracture zone is preliminarily predicted using an empirical or comparative method. Finally, the appropriate excavation height of a coal seam excavation face and the possibility that water inrush will occur are predicted via qualitative description [11,12]. Besides, Chinese researchers combine field observation data and experimental research of various factors, such as coal seam mining thickness and rock type strength, to summarize coal mining types under different thicknesses of coal mining conditions and accumulated experiences that can guide actual production [13,14]. The difference between water-conducting effect and water-nonconducting effect of fracture zone has been proposed by using special observation holes to study the height of a water-bearing fault zone and to observe the change in water level and water loss in the hole. Simultaneously, experimental research, particularly similar material simulation technology, has also developed rapidly [15].
Research progress in different countries is diverse due to varying geological conditions, and for the complicated conditions of the coal mine, studies on the deformation and failure of coal seam overburden and water inrush are based on long-term practical experiences and theoretical applications [16,17,18]. Aalianvari discussed the influences of the geological structure of a fractured rock mass and the anisotropy of hydraulic conductivity on tunnel sections, and also classified water inrush risks in Zagros tunnel in Iran on the basis of groundwater flow [19]. Taherian discussed the negative effects of poisonous gas and water on different parts of a tunnel boring machine, concrete corrosion, and the productivity of tunnel personnel [20]. Schrader and Winde comprehensively investigated the prevention and control of water inrush in the Far West Rand Gold Field of South Africa by using field data from the Witwatersrand Basin [21]. Odintsev and Miletenko summarized the phenomenon of mine water inrush caused by rock fractures; they also analyzed the influences of in situ and mining stresses on water inrush disasters by establishing a rock fracturing model [22]. Polak studied the causes of mine water inrush due to rainfall and flood; he analyzed the mechanisms of backfill saturation resulting from uncontrolled water inrush and the hazards posed by this phenomenon to underground active infrastructure [23].
Water inrush from a coal floor is actually a mechanical balance system that combines the confined water, surrounding rock, and water guiding channel of the coal floor. In underground mining engineering, the energy of confined water is released instantaneously due to various mining disturbances; moreover, it moves to the mining face at a high speed in the form of fluid [24,25]. In accordance with the interaction mechanism between water and rock, water inrush from an underground fault includes two stages, namely, confined water storage and water inrush below the coal seam. Confined water storage is a function under long geological conditions, whereas water inrush is a process of instantaneous energy release. However, not all faults are water-bearing or water-conducting. The water bursting of a fault will be affected by whether the surface water supply is sufficient, groundwater pressure is sufficient, and the permeability of the strata on both sides of the fault meets certain water-resistant conditions [26,27].
Therefore, a water inrush accident during tunnel excavation is a dynamic process in which groundwater is poured into a tunnel by an aquifer through a water-conducting fault due to the combined actions of rock disturbance and the pressure release of confined water caused by artificial mining. Throughout the process, water passes through the aquifer and reaches the roadway through the fault. The flow pattern of water changes from that of the aquifer to turbulent flow. The purpose of this paper is to establish a suitable seepage model to simulate the flow process of groundwater from aquifer to fault. Based on such change, a multifield coupled flow analysis model is established to analyze various changes caused by varying physical quantities that affect the degree of change in water flow. Based on this model, the validity of Brinkman and Forchheimer seepage model in analyzing flow in faults is analyzed in this paper.

2. Influence of Brinkman Seepage on the Evolution Law of Fault Water Inrush

2.1. Underground Rock Seepage Mechanism

The water inrush process can be approximately divided into the non-Darcy field from a Darcy aquifer and the turbulent field in a working face. The path of water inrush generally flows into the working face along faults. The necessary condition for water inrush along faults is that the water barrier zone of the floor should be damaged. Consequently, this zone cannot block water and damage extends upward along the path, thereby forming water inrush cracks on the roof. The formation of a water inrush channel is a process of multichannel concurrent fracture, and ultimately, instability. Water inrush is a frequent hydrogeological hazard in underground mining engineering and tunnel construction. Water may flow from aquifers, which are typically associated with fractured rock formations (e.g., faults and collapse columns), and may cause problems in the safe operation of underground engineering.
Many fault water inrush incidents indicate that the fault zone has been used as a water inrush channel to connect an aquifer to a roadway. The velocity of fault flow is extremely high, and the relationship between velocity and the hydraulic gradient deviates from linear Darcy’s law. In the Feicheng Coal Mine of China, approximately 72.6% of water erosion cases are directly related to faults. Furthermore, the maximum flow of five scours is more than 1000 m3/h [7]. Studying underground water inrush based on Darcy’s law will result in errors because of the non-Darcy effect.
Researchers have been concerned with the mechanical properties of fault activation with regard to underground water inrush through mine faults. To conduct a numerical study on the behavior of aquifer groundwater intrusion, the current researchers use a modified coefficient of variation or assumption of permeability as follows:
  • Groundwater flowing into a fault from an aquifer is a continuum.
  • Groundwater is incompressible and unaffected by temperature, and the physical parameters of groundwater are constant.

2.2. Analysis of the Flow Field Characteristics of Fault Water Inrush

2.2.1. Aquifer Darcy Laminar Flow

In the waterproof zone of an aquifer, water with abundant reserves moves into the pores and fissures of a rock. In general, the velocity of fluid flow is relatively low. The laminar flow is expressed as [28]:
v d = k d μ p d .
The seepage continuity equation can be expressed as [28]:
ρ φ d t + ρ ( k d μ p d ) = Q d ,
where k d is the aquifer permeability (m2), ρ is the density (kg·m−3), μ is the dynamic viscosity coefficient (Pa·s), p d is the pressure gradient (Pa·m−1), v d is the Darcy velocity (m·s−1), Q d is the sink source term (kg·m−3·s−1), and t is the time variable (s).

2.2.2. Fault Brinkman Field

The Brinkman equation describes the rapid flow in a dynamic porous medium driven by fluid velocity, pressure, and gravity. This equation appears as a mix of Darcy’s law and the Navier–Stokes equations. It extends Darcy’s law to describe the loss of momentum caused by the viscous shear term. Therefore, this model is effectively applied to the flow of a porous medium controlled by Darcy’s law toward the fast-flowing transition zone of a pipeline.
The Brinkman equation is expressed as [29]:
{ ρ v f t μ ( v f + ( v f ) Τ ) ( μ k f v f + p F ) = 0 v f = 0 ,
where μ is the dynamic viscosity coefficient (Pa·s), ρ is the density (kg·m−3), p is the water pressure (Pa), v f is the velocity (m·s−1), k f is the permeability (m2), and F is the force term (Pa·m−1).

2.2.3. Permeability Ratio between Fault and Aquifer

The relative water resistance of a fault remains when the fault’s initial permeability is less than 0.01, thereby preventing groundwater from penetrating through the permeate passage formed by the fault. One reason for the increased fault permeability in groundwater burst is rock failure caused by excavation, i.e., mining-induced fault activation. Another reason is that sediment particles and unsupported gravel are slowly washed out of the gap by the water in the aquifer. To facilitate the intuitive study of the flow behavior of inrush current as fault permeability increases, the definition of the permeability ratio is given as:
ξ = k f k d ,
where k f is the fault permeability (m2) and k d is the aquifer permeability (m2).

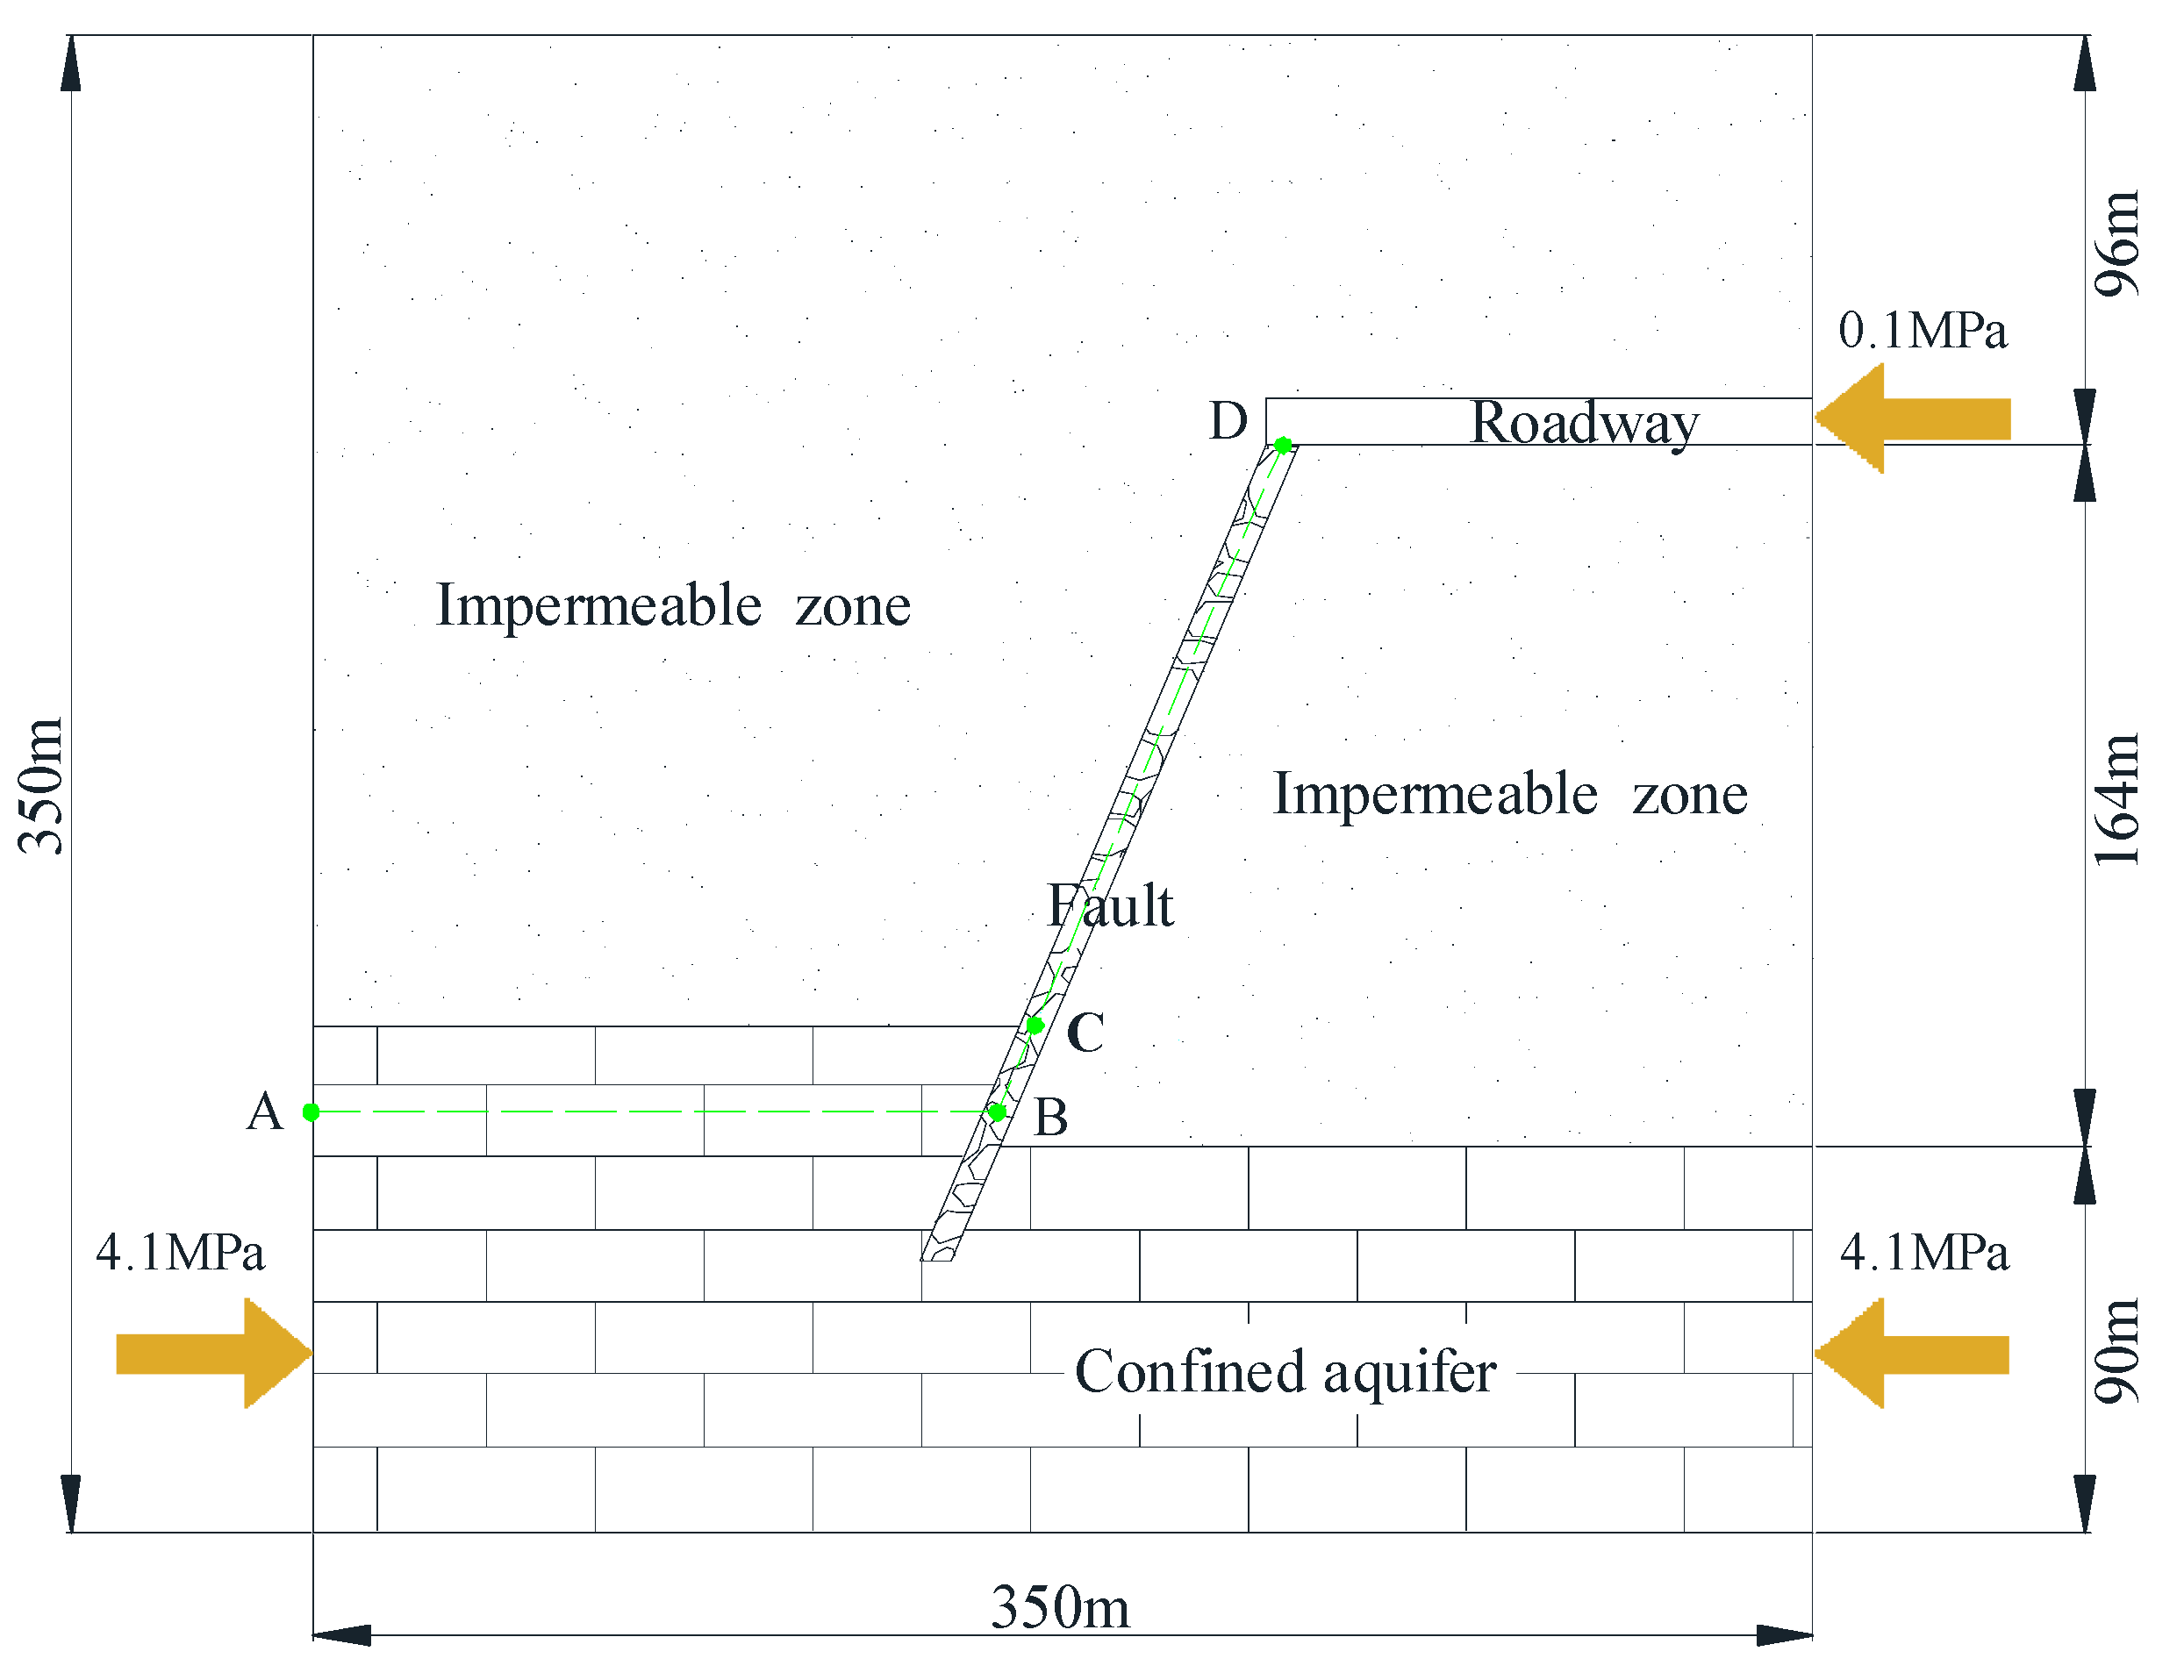
2.3. Model Establishment

The Zhangcun Mine is located in Zhangzhou, Henan Province, China. The aquifer below the coal floor is an Ordovician limestone aquifer, which can be recharged by rainfall. The roadway is located in diorite with poor permeability. The roadway is connected to a fault during the excavation process. Water flows from the aquifer through the fault to the roadway, thereby causing an intrusion accident. The water inrush mechanism related to faults in groundwater flow remains unclear. We used this coal mine as an example to evaluate the unknown process of groundwater while focusing on the impact of non-Darcy flow, as shown in Figure 1. The model is 350 m long and 350 m wide. The fault is located in the middle of the model. The upper and lower parts of the fault are diorite, and water permeability is poor. The lower part of the model is an aquifer. The roadway is located at the upper right part of the model. The height and length of the artificial excavation roadway are 10 m and 130 m, respectively. A pressure of 0.1 MPa was applied at the exit to simulate atmospheric pressure. A hydrostatic pressure of 4.1 MPa was applied to both sides of the aquifer to simulate the hydrostatic pressure of the aquifer.
To monitor the evolution characteristics of water flow pressure and flow velocity in aquifers and faults, we selected section A-B-C-D as the monitoring line. The cross-section coordinates of the model are as follows: A (0, 100.7), B (160.5, 100.7), C (168.8, 119.7), and D (226.7, 254.2). In the model, we controlled various variables and constants required in the software by setting the water density, dynamic viscosity coefficient, permeability, initial pressure, and length of the model. The specific values of the parameters in the simulation were obtained from Zhangcun Mine, as listed in Table 1. The calculation model was divided into 7672 grid cells. The aquifer division is larger, whereas the entrance and exit of the fault are smaller. The middle of the fault is thinner than the aquifer, and the roadway is divided. The rock mass on both sides of the fault is dense and sparse. The simulation results indicate that the overall partition of the model was relatively complete and that accuracy was high.

2.4. Transitional Boundary Conditions of Each Flow Field

In accordance with relevant engineering practice, the seepage boundary condition of the model was set as follows: the boundary of both sides of the aquifer is a fixed confined boundary, i.e., P0 = 4.1 MPa. The right exit of the roadway is the atmospheric pressure boundary, i.e., the outlet pressure is 0.1 MPa. The parameters of different flow fields are listed in Table 2.
The flow rate and pressure of the fluid continuously change from the aquifer, through the fault, and finally into the roadway. Therefore, by using the continuity assumption, the conditions of the boundary at the transition should be applied to two adjacent subdomains.
On the adjacent boundary between the aquifer and the fault, the speed and pressure continuity are given as
v d = v f ,   p d = p f
The subscript d represents the Darcy flow field, whereas the subscript f represents the Brinkman flow field.

2.5. Analysis of Numerical Result

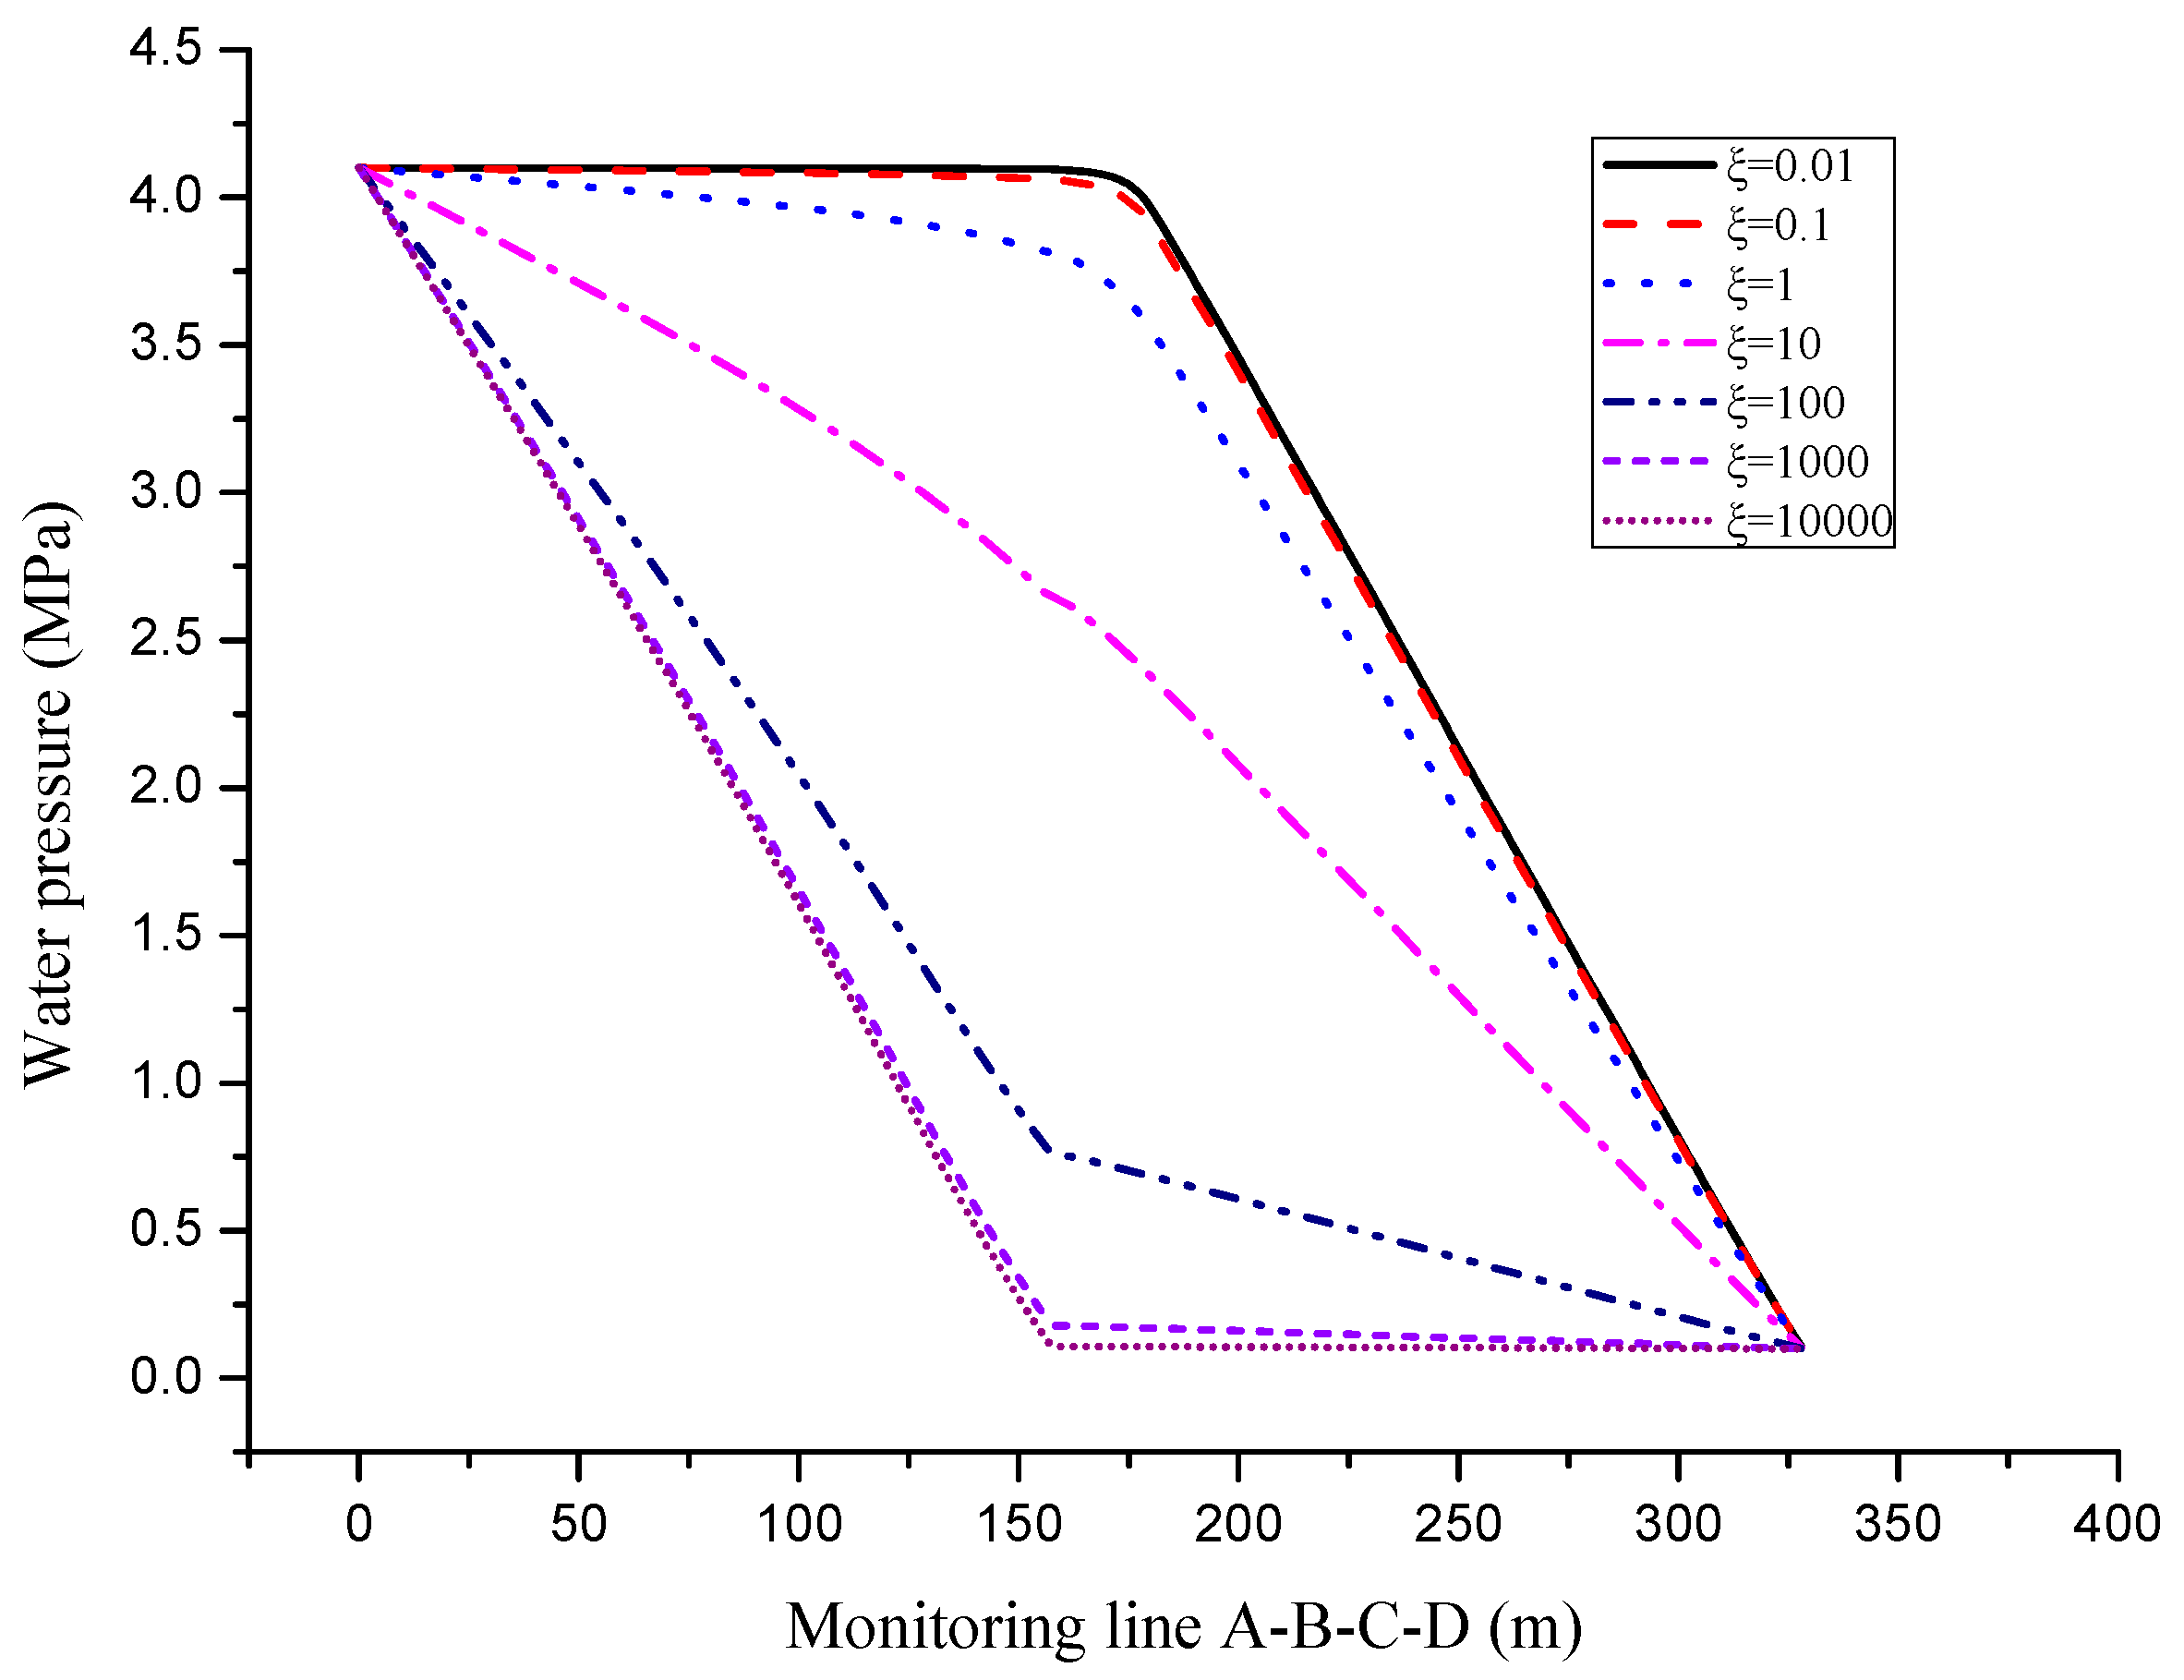
2.5.1. Analysis of Water Flow Pressure

Pressure distribution in the aquifer depends on fault permeability. Figure 2 shows the pressure distribution of aquifers and faults under different permeability ratios in the Darcy and Brinkman flow model. When fault permeability was considerably lower than aquifer permeability, i.e., ξ < 0.1 , the pressure of the aquifer near the fault remained at a high level. Meanwhile, water pressure at the entrance of the fault decreased as fault permeability increased. With low-permeability faults, the maximum pressure drop occurred in faults. By contrast, when the permeability of faults was high, the maximum pressure drop occurred in aquifers, which resulted from the dynamic adjustment of pressure balance at the macro level. Therefore, the flow behavior of fault groundwater outburst should not be separated from a global perspective. Groundwater outburst is a continuous process. The energy accumulated by high-pressure water in an aquifer is transformed into the momentum of water. The velocity of water flow increases with fault permeability. Hence, the degree of energy release increases with seepage.
Figure 3 shows the interface variation on the monitoring section (A-B-C-D) at different scale factors in the Darcy and Brinkman flow model. Water flow pressure decreased continuously from the aquifer to the fault. It gradually decreased from 4.1 MPa to 0.1 MPa. When the permeability ratio was ξ < 1 , a considerable decrease in water pressure occurred initially at the fault. At the fault segment, pressure began to rapidly decrease to 0.1 MPa. When the permeability ratio was ξ > 1 , a considerable decrease in water pressure occurred initially in the aquifer. When the permeability ratio was ξ = 100, the pressure curve began to increase gradually. When the permeability ratio was ξ = 100, the pressure curve decreased gradually. When the permeability ratio was ξ = 1000, water pressure was nearly 0.1 MPa in the entire fault area. At this moment, flow velocity was relatively high and the flow of water no longer conformed to Darcy’s law.
The graph shows that the distribution of flow pressure in aquifers is related to the permeability of faults. When fault permeability was considerably lower than aquifer permeability, i.e., ξ < 0.1 , the hydrostatic pressure distribution of the aquifer was uniform due to the relatively low permeability of the fault. The maximum water pressure of faults was approximately 3.9 MPa. Moreover, the infiltration and diffusion of groundwater into faults were relatively slow. When fault permeability was greater than aquifer permeability, i.e., ξ > 10 , the relative water performance of the fault decreased dramatically. At this moment, water flow in the fault increased. Then, the inner part of the fault could be damaged by water flow to form piping channels. Aquifer pressure dropped rapidly close to atmospheric pressure. Finally, faults became water inrush channels.

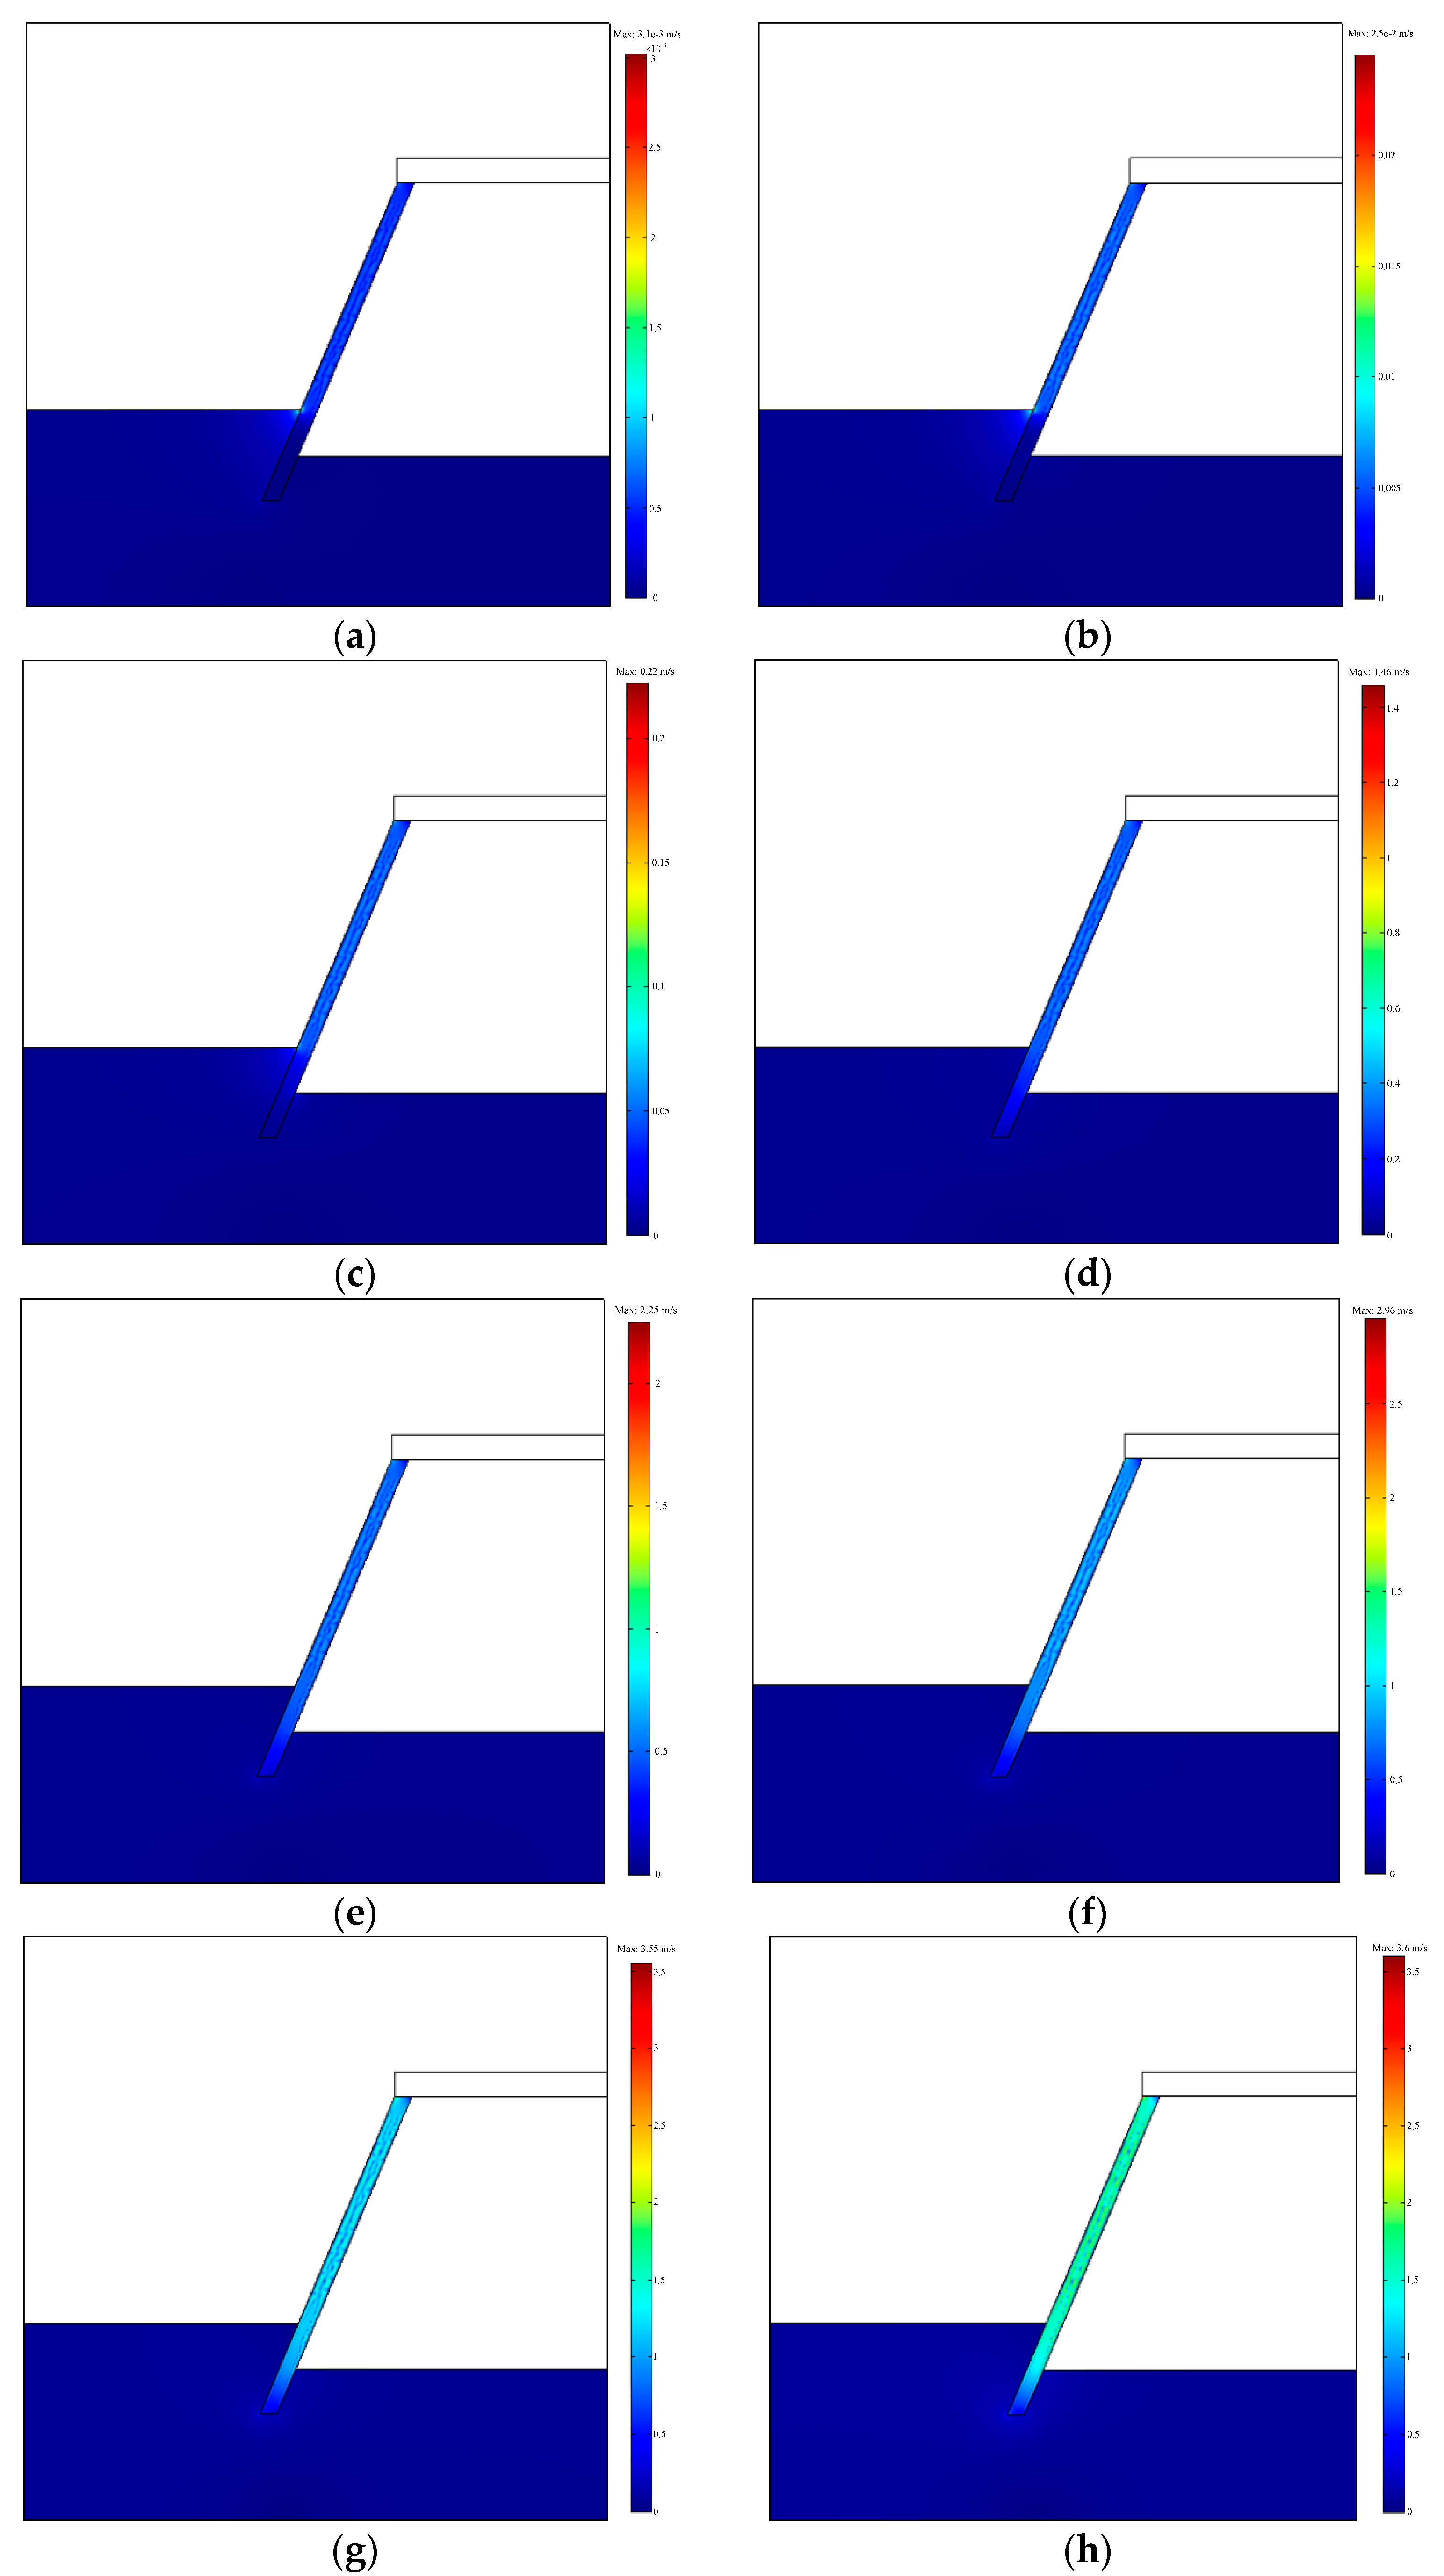
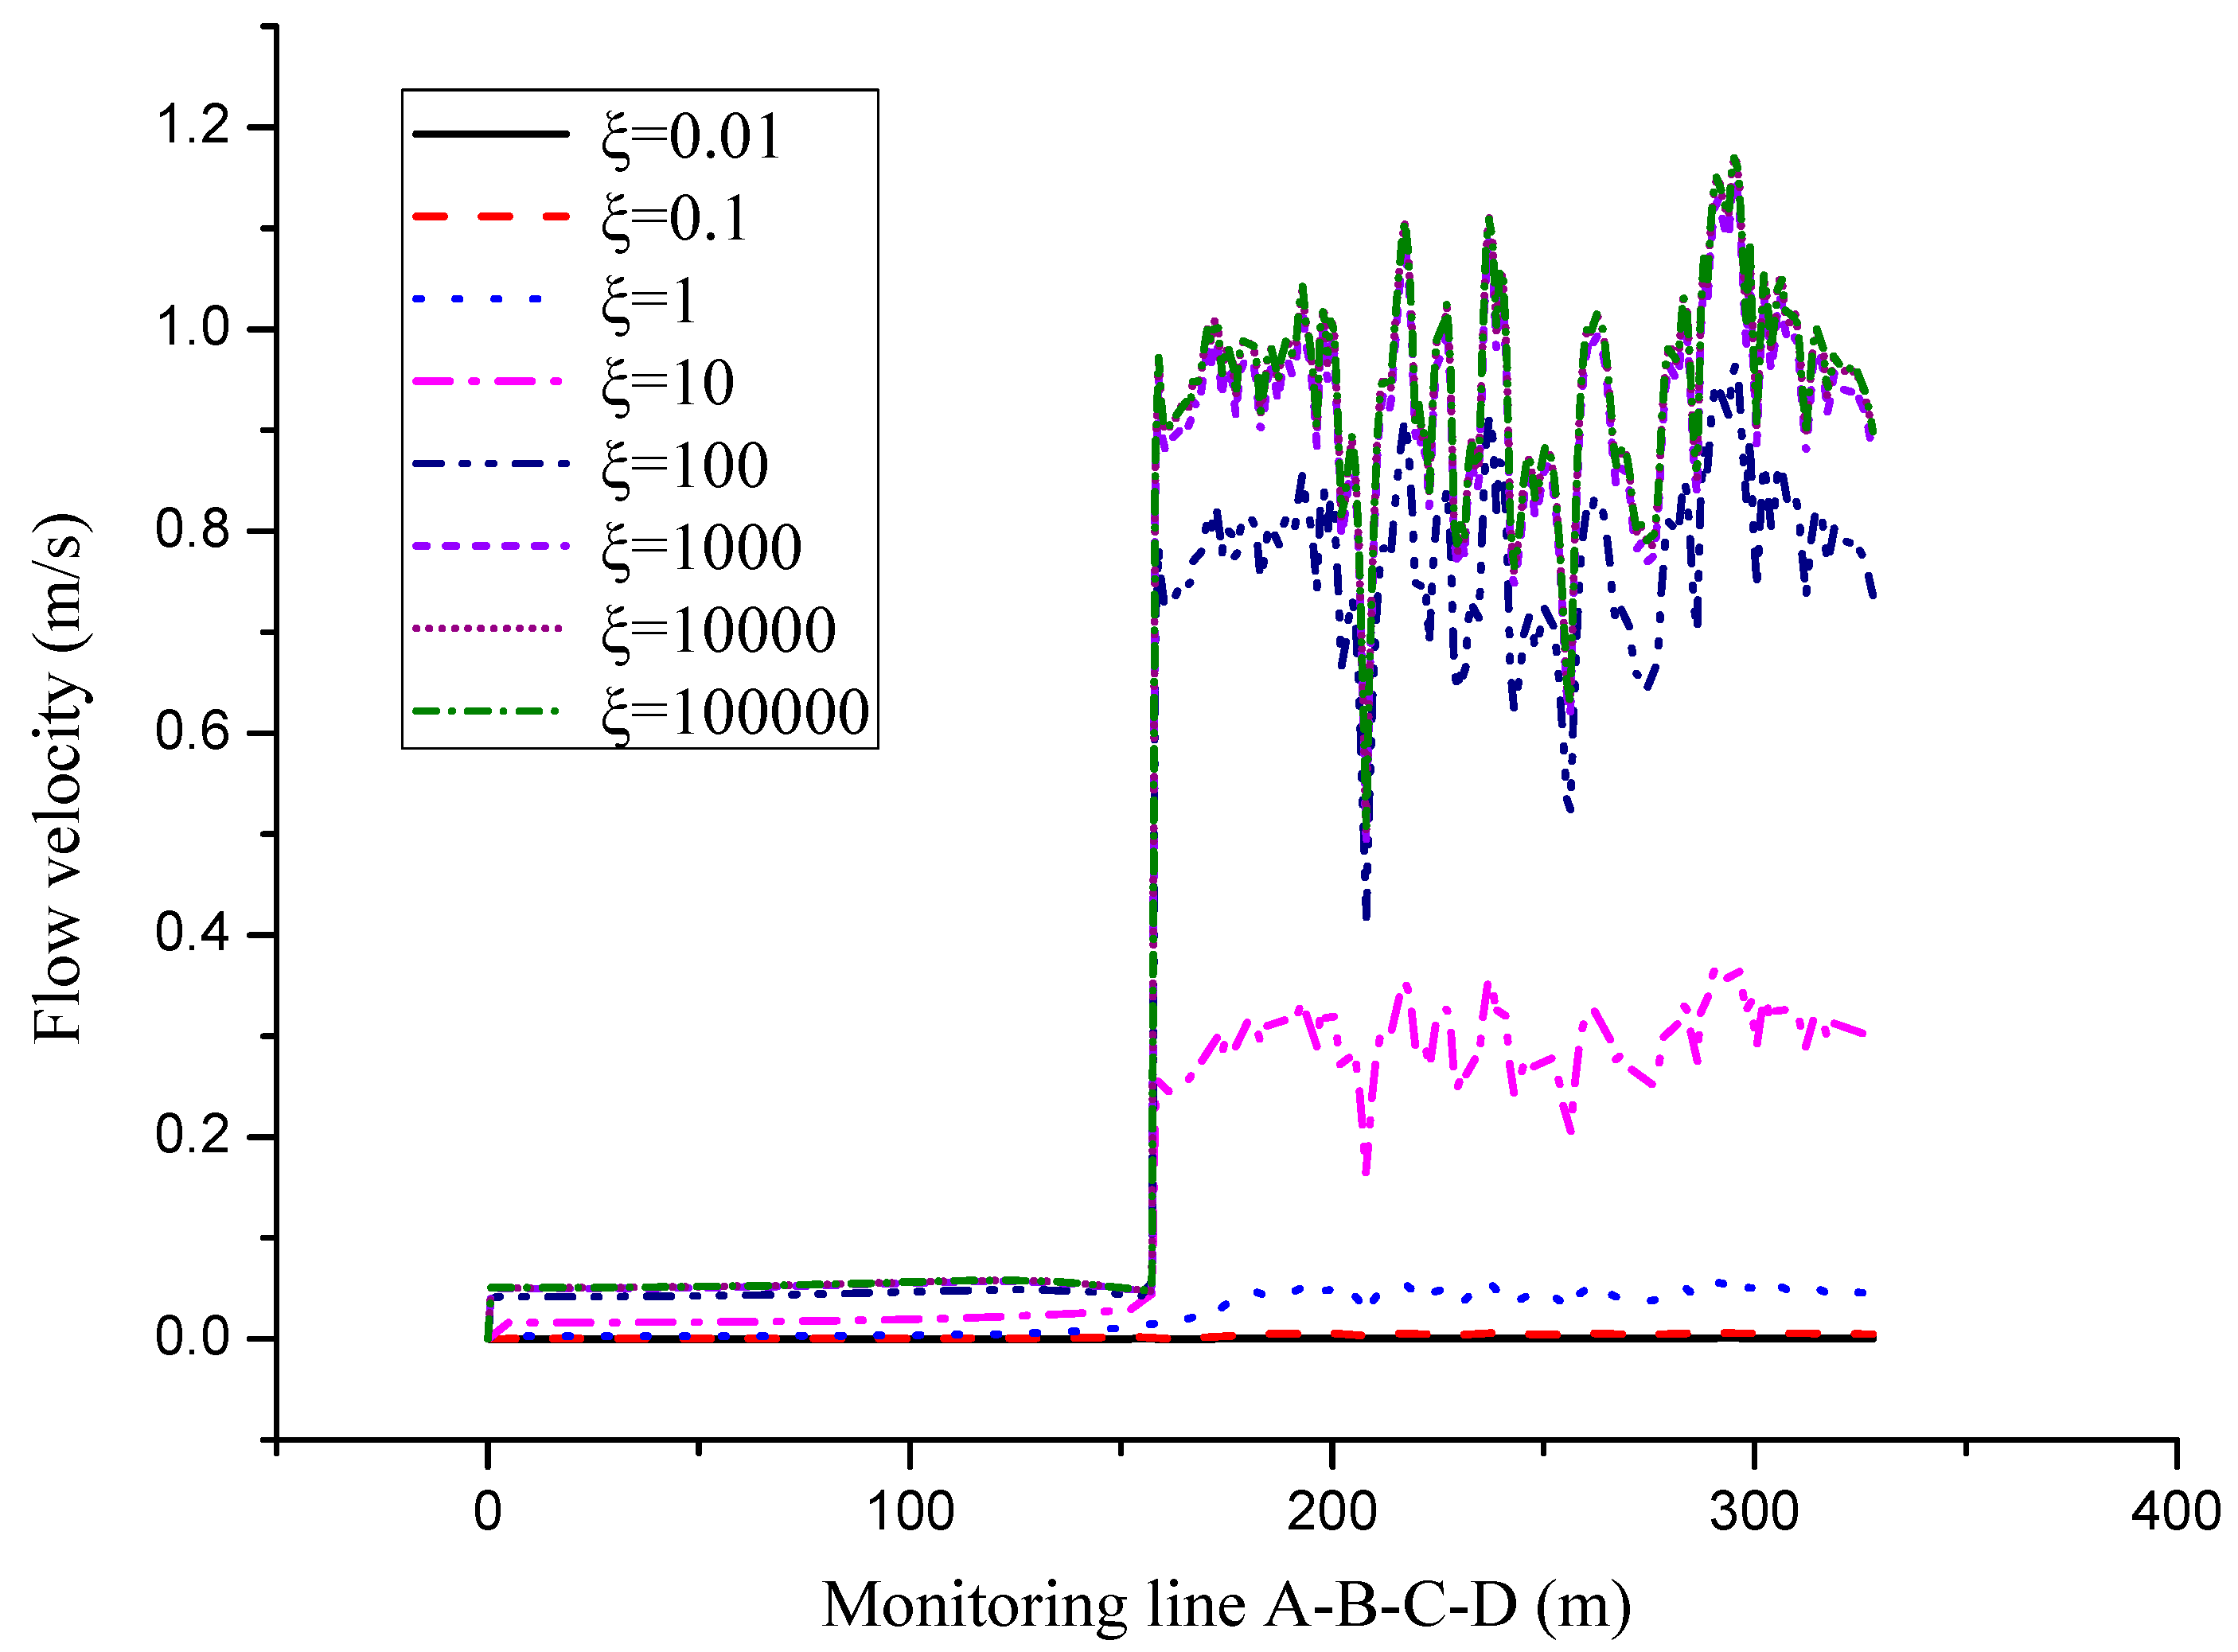
2.5.2. Analysis of the Characteristics of Fault Water Flow Velocity

Flow velocity in the aquifer became substantially stable by changing the permeability ratio between the aquifer and the fault. In addition, flow velocity gradually increased at the near fault of the aquifer as permeability changed. However, a change in permeability could considerably increase the flow rate in faults. Figure 4 shows the flow velocity map of the monitored section at different permeability ratios. The flow rate changed when the permeability ratio was 0.1. The change became more evident when the permeability ratio was 100. When the permeability ratio was changed, velocity in the aquifer increased gradually. However, the trend was not clear, and velocity in the fault exhibited the opposite behavior. When the permeability ratio was 10, flow velocity in the fault began to change moderately. After the permeability ratio reached 1000, the through-water inrush channel gradually formed in the fault and flow velocity began to change considerably. Fault water inrush was the most serious at this moment. The high permeability of the fault increased water flow velocity and aggravates the occurrence of water inrush accidents. During the simulation, flow velocity from the aquifer close to the fault changed suddenly because the velocity of the aquifer was relatively small. Moreover, a non-smooth connection area existed directly between the aquifer and the fault. Consequently, a relatively large change in velocity occurred at the opening of the fault.
The velocity nephogram was analyzed, and the results prove that small continuous velocity changes gradually occurred near the fault when the permeability of the aquifer was relatively large. Moreover, when the permeability ratio was greater than 1, velocity began to exhibit a relatively large sudden change. At this moment, various media in the fault began to gradually disappear, and piping channels inside the fault began to form. Fluid started to flow into the channels in large amounts and continuously poured out to the working face at a stable hydrostatic pressure.
Figure 5 shows the velocity variation of cross section A-B-C-D at different permeability ratios. When the permeability ratio was below 0.1, the fluid in the aquifer gradually permeated upward through faults at a certain hydrostatic pressure. When the permeability ratio was below 1, the change in velocity was relatively stable. That is, many media existed in the fault. When the permeability ratio is 10, the flow in the fault is turbulent and velocity changes rapidly. At this moment, the fault changed from water resistance to hydraulic conductivity. When the permeability ratio was above 100, fault permeability increased rapidly. Therefore, when faults are activated by underground excavation, they will activate rapidly and permeability will increase immediately. During this period, sediments and other media in the faults will protrude quickly through the working face along with the fluid passing through the faults, thereby resulting in huge losses to the project.

3. Effect of Forchheimer Seepage on the Evolution Law of Fault Water Inrush

3.1. Analysis of the Flow Field Characteristics of Fault Water Inrush

Analysis of the Non-Darcy Forchheimer Flow Formula in Faults

The non-Darcy flow of a Newtonian fluid results from the non-negligible loss of inertia as the flow rate continues to increase. This phenomenon was produced by the interaction of clay with water. To explain the inertia loss of a Newtonian fluid, Forchheimer included a quadratic term in the revision of the Darcy equation, obtaining the so-called Forchheimer equation [1,28].
The flow behavior of groundwater can be typically described using Darcy’s law. However, when the flow rate is relatively large, evident errors will be produced using Darcy’s law. By contrast, the Forchheimer equation can fit the flow change well when the flow rate is large.
p f + ( μ k f + ρ β v f ) v f = 0 .
The continuity equation can be expressed as:
ρ φ f t + ρ v f = Q f .
The groundwater flow equation can be expressed as:
Q = w 0 l 0 v f d l ,
where k f is the fault permeability (m2), ρ is the density (kg·m−3), μ is the dynamic viscosity coefficient, v f is the velocity (m·s−1), t is the time variable (s), β is the Forchheimer coefficient (m1), l is the total length of the unit section (m) and w is the width of the unit section (m).

3.2. Analysis of the Calculation Results

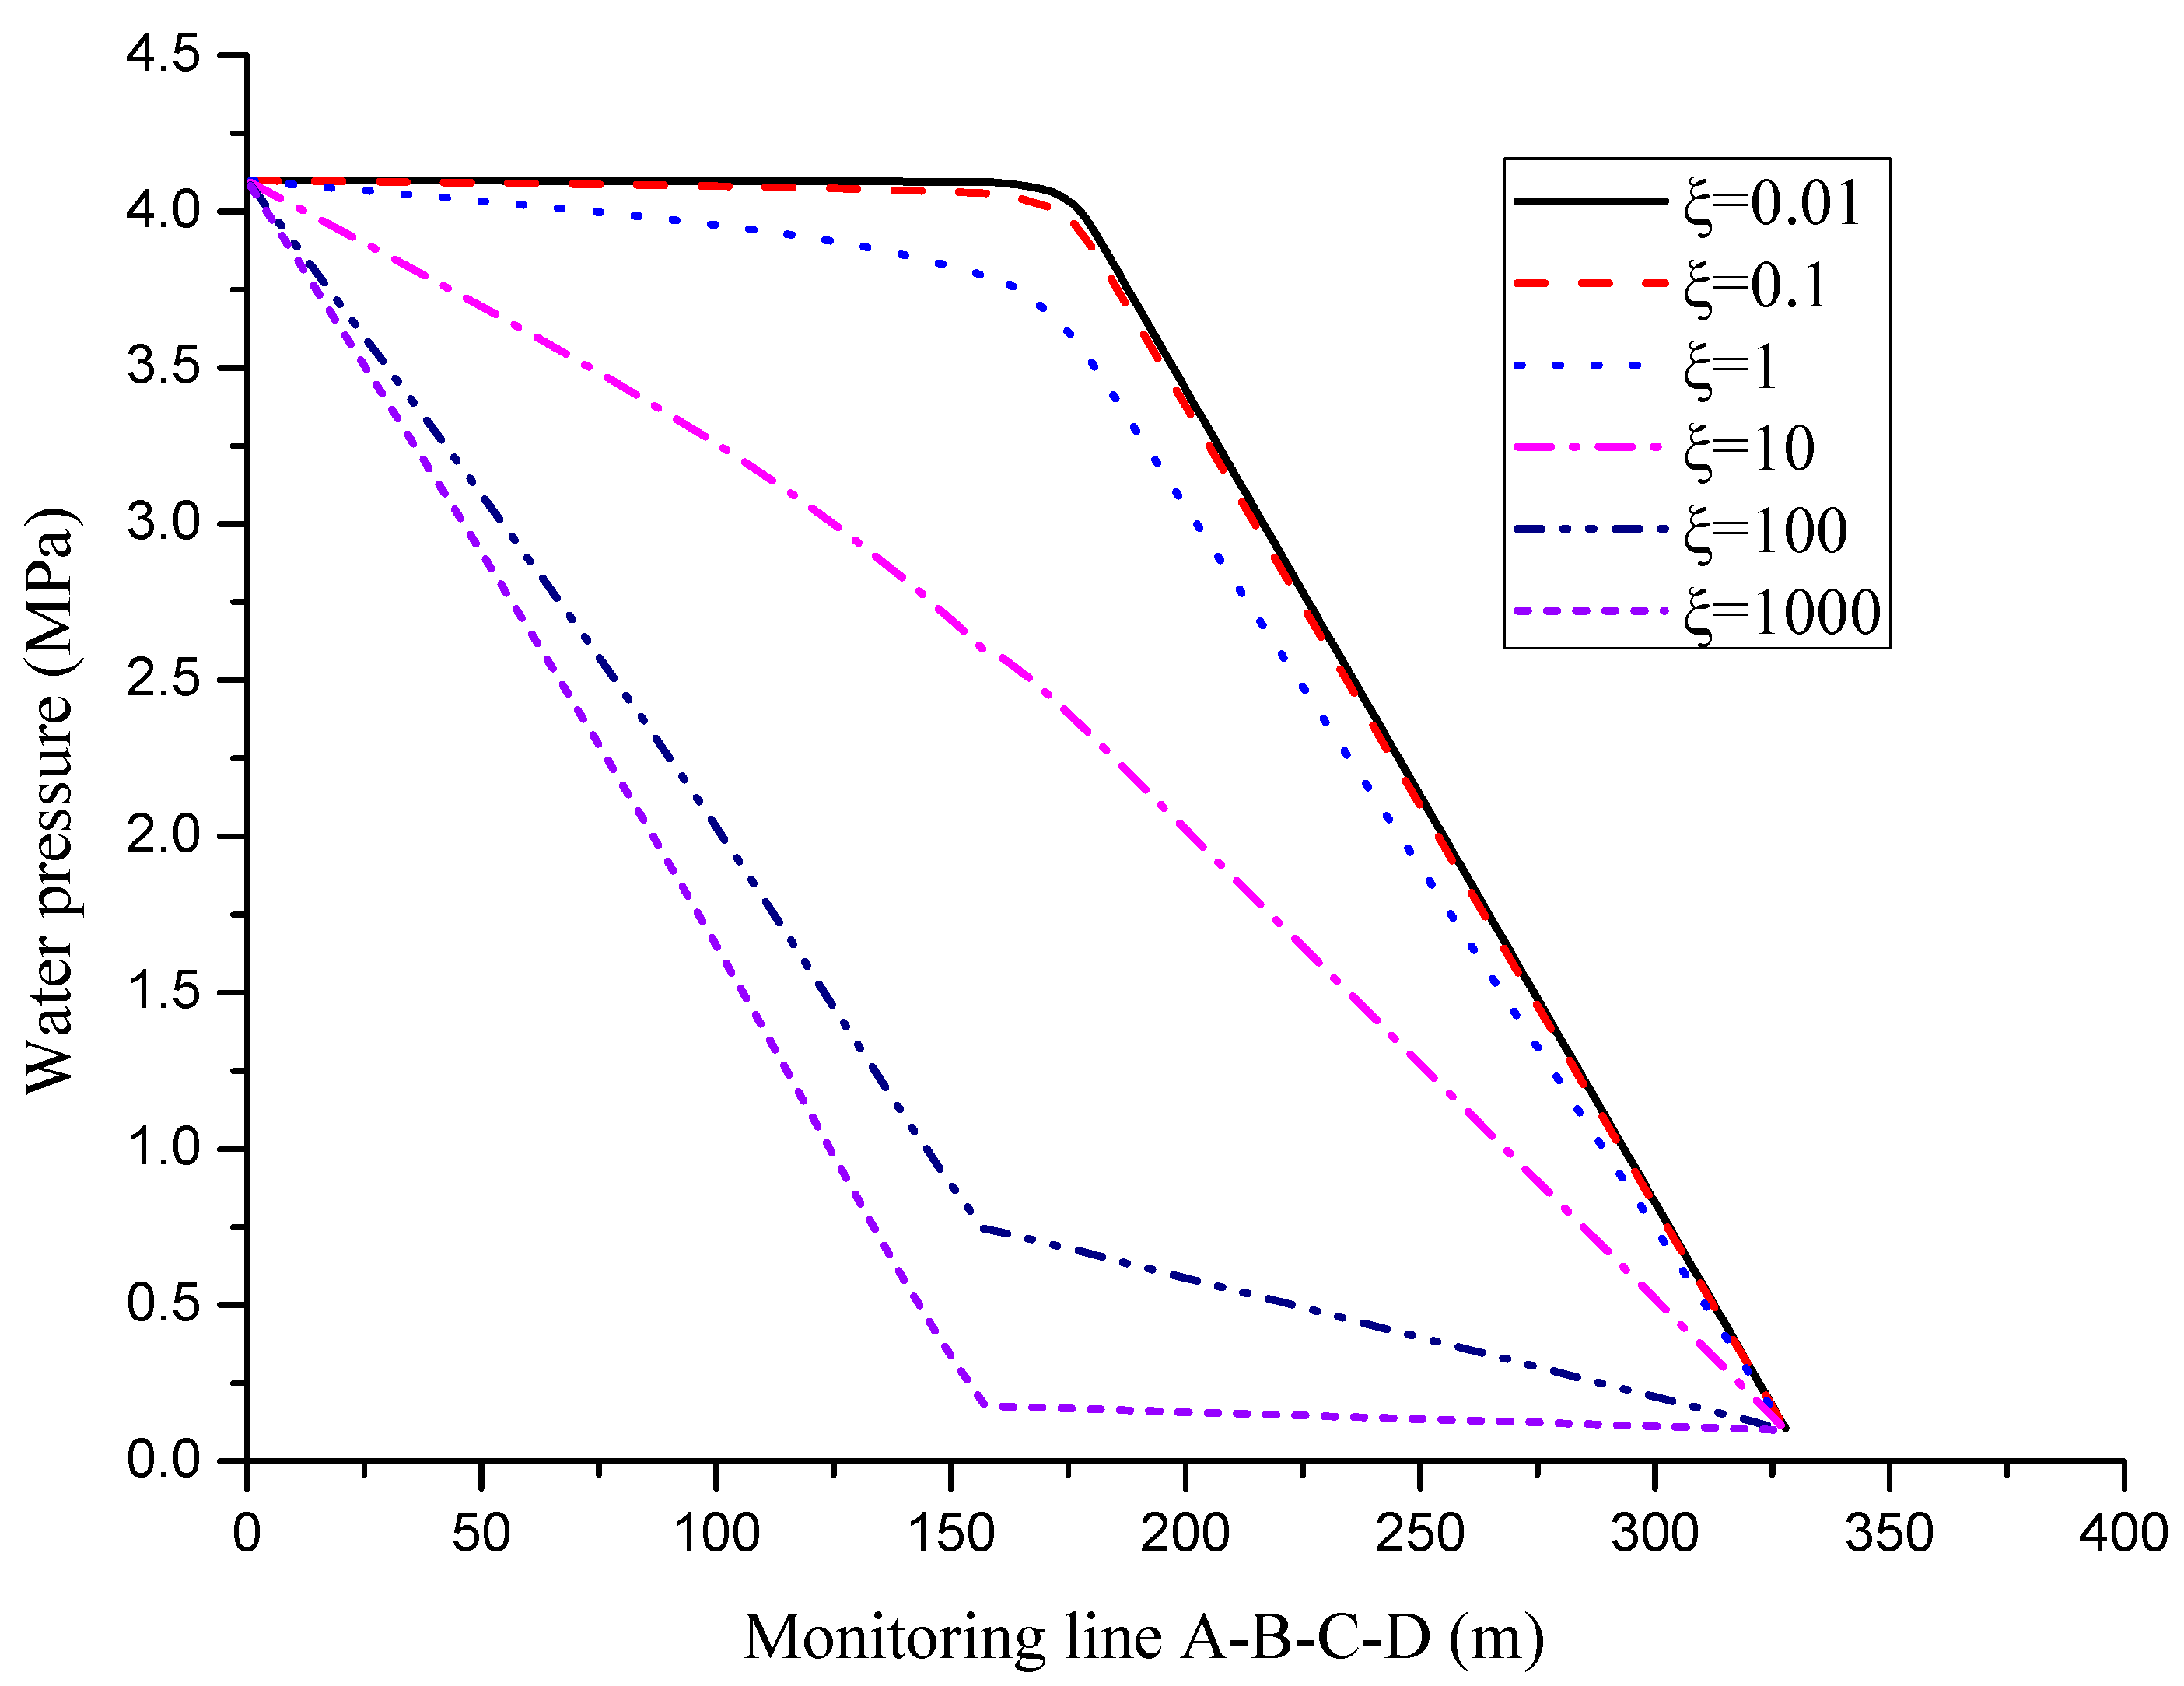
3.2.1. Analysis of Water Flow Pressure

The aquifer Darcy laminar flow and fault Forchheimer flow were adopted to analyze the water inrush characteristics. Figure 6 shows the change of water pressure in the Darcy and Forchheimer flow model. The non-Darcy effect region in the aquifer depended on fault permeability. When pressure on the outer boundary was constant, the higher was the fault permeability, the larger was the non-Darcy effect region in the aquifer. When fault permeability was considerably lower than aquifer permeability, i.e., ξ < 0.1 , the non-Darcy effect was extremely negligible in the aquifer. Flow behavior in the aquifer could be described using the linear Darcy equation. As fault permeability increased, the area affected by the non-Darcy effect gradually expanded. Finally, when ξ = 1000, nearly the entire aquifer area was affected by the non-Darcy effect. In addition, the non-Darcy effect near the fault was considerably more severe than the non-Darcy effect farther from the fault. Therefore, for engineering purposes, Darcy’s law and the Forchheimer mechanism could be used to describe the flow behavior of aquifers when fault permeability is lower than aquifer permeability.
Figure 7 shows the change in water flow pressure on monitoring line A-B-C-D of the Darcy and Forchheimer flow model. The water pressure decreased gradually along the monitoring line both in aquifer and fault. When the permeability ratio was ξ < 1 , flow pressure changed slightly in the aquifer. However, it rapidly dropped to 0.1 MPa in the fault. When the permeability ratio was ξ > 1 , flow pressure gradually decreased in the aquifer. When the permeability ratio was ξ =10, the pressure curve was approximately linear. Moreover, the pressure reduction rates in the aquifer and fault were almost equal. When the permeability ratio was ξ = 1000, flow velocity was relatively high. The flow pressure of the aquifer decreased considerably, whereas the pressure of the fault decreased slightly.

3.2.2. Influence of the Forchheimer Coefficient on Fault Water Inrush

In the case of non-Darcy seepage, the pressure gradient was lost due to the viscous and inertial forces of the fluid. The fluid was a high-speed nonlinear seepage in the collapse column. Hence, it was no longer a simple array laminar flow. Combined with Forchheimer coefficient β , the Forchheimer number is expressed as:
δ = ρ k f v f β μ .
The non-Darcy effect coefficient is expressed as:
λ = ρ β v f 2 μ k f v f + ρ β v f 2 = 1 ( ρ β k f v f / μ ) 1 + 1 = δ 1 + δ .
Figure 8, Figure 9 and Figure 10 reflect Non-Darcy effect characteristics and different flow mechanisms in aquifer and fault. When ξ < 0.1 , the non-Darcy effect was less than 10%. At this moment, inertial resistance played a major role and viscous resistance caused pressure to drop. Therefore, the flow tended to be Darcy, and the non-Darcy effect was not evidenced. When fault permeability was higher than aquifer permeability, i.e., ξ = 10 , the non-Darcy effect was approximately 50%. That is, inertial resistance and viscous resistance were equally important for pressure drop. The ignorance of both was unacceptable and could lead to serious errors. When fault permeability increased to 450 times the aquifer permeability, the non-Darcy effect increased to approximately 90%. Thus, viscous resistance exerted a weak effect on the overall pressure drop and could be neglected. Inertial resistance dominated, and the fluid exhibited high-speed flow. Therefore, groundwater flow velocity transitioned from Darcy flow to non-Darcy flow. Moreover, the value of fault permeability affected the flow behavior of the fluid. The Forchheimer equation could be used to describe the transition to non-Darcy flow during fault water inrush.

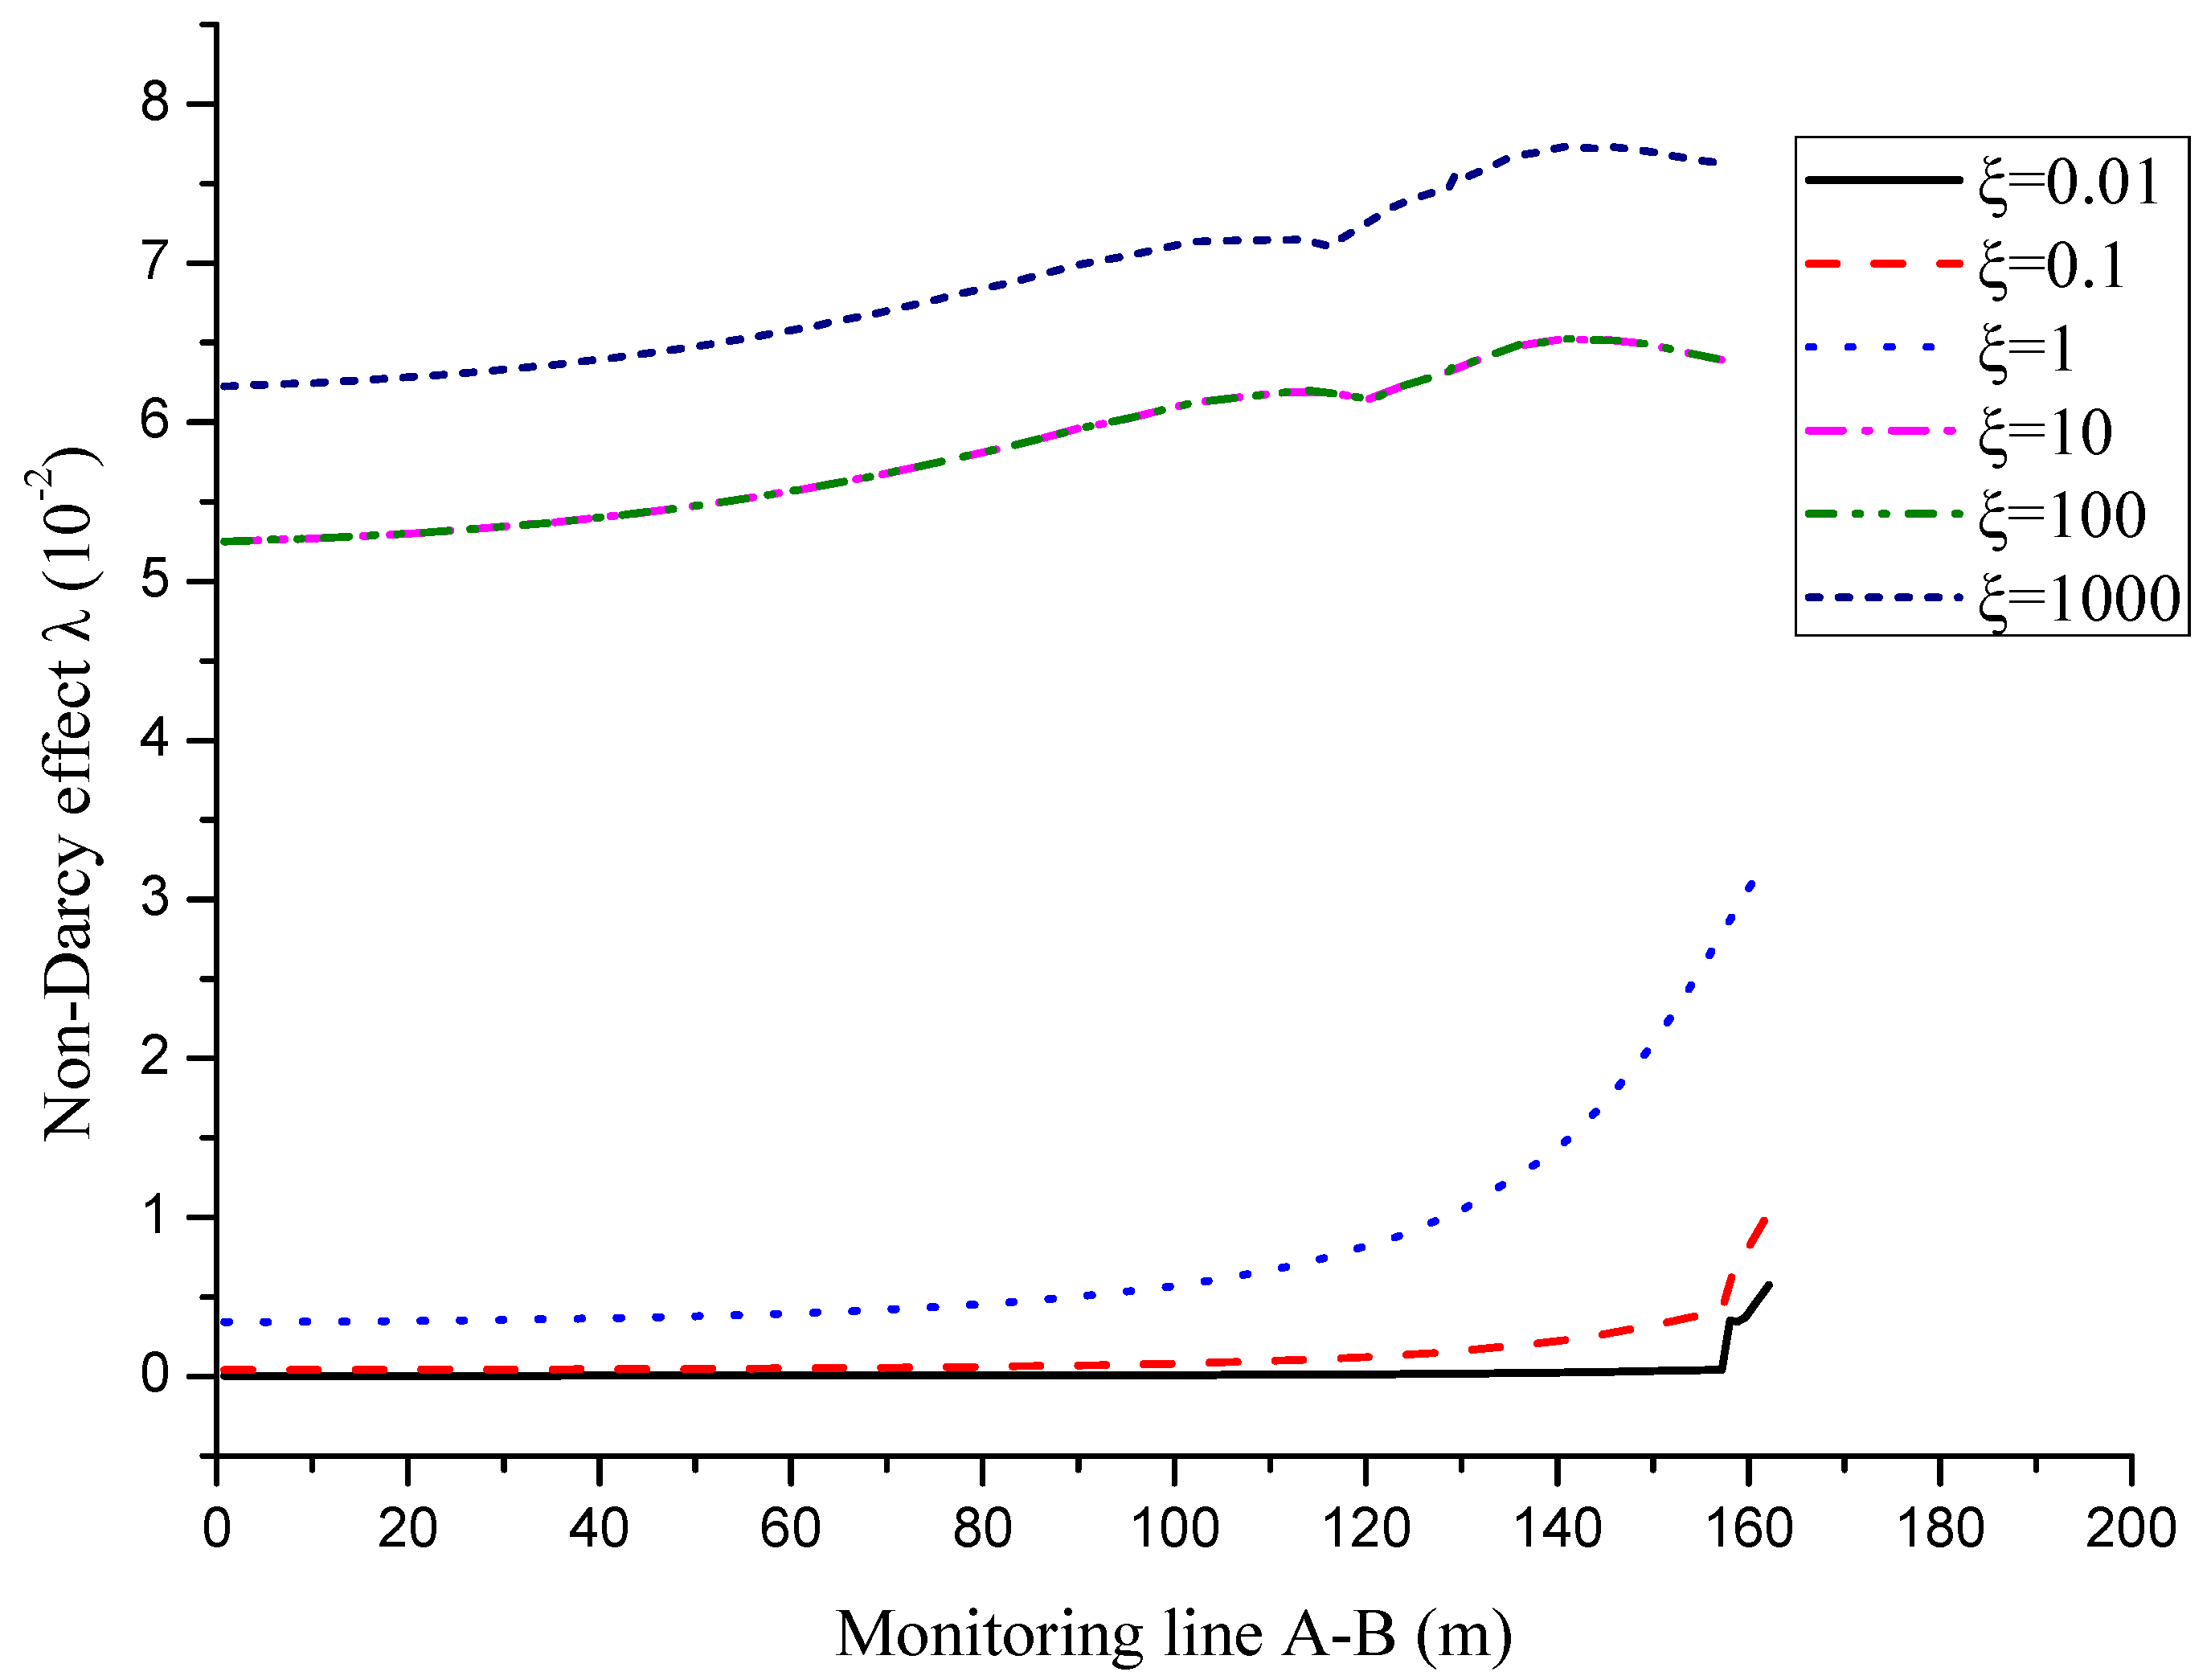
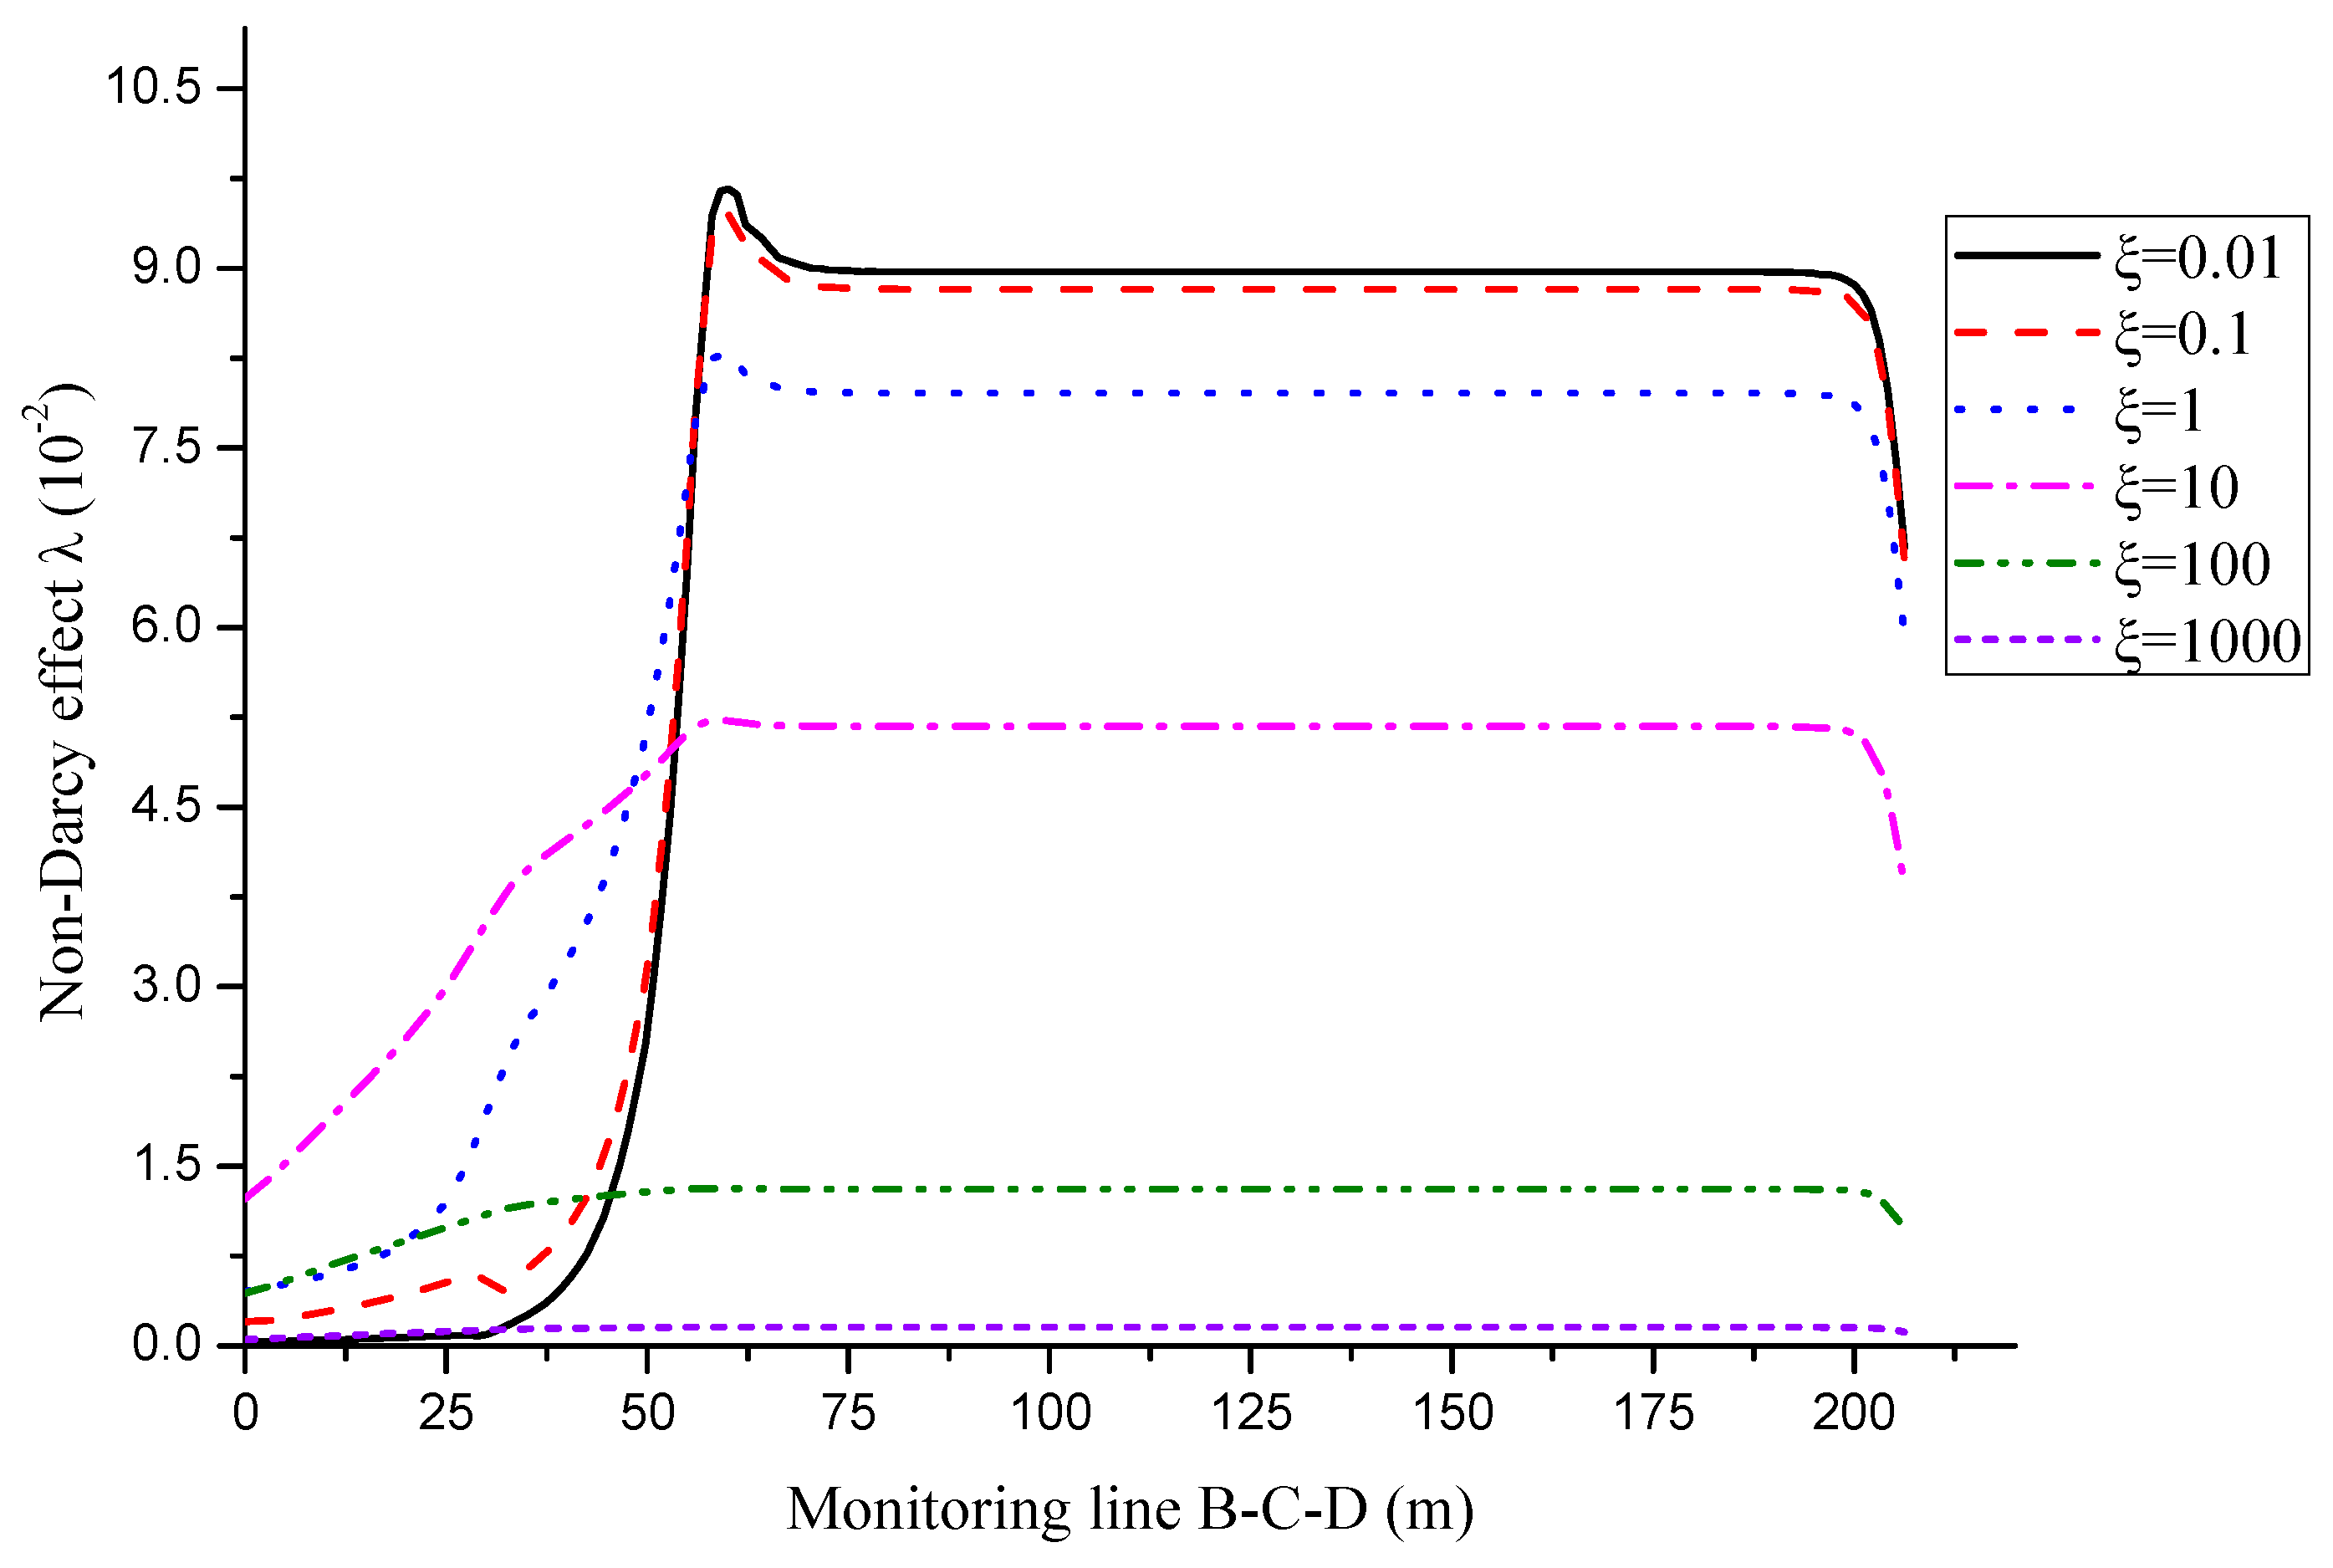
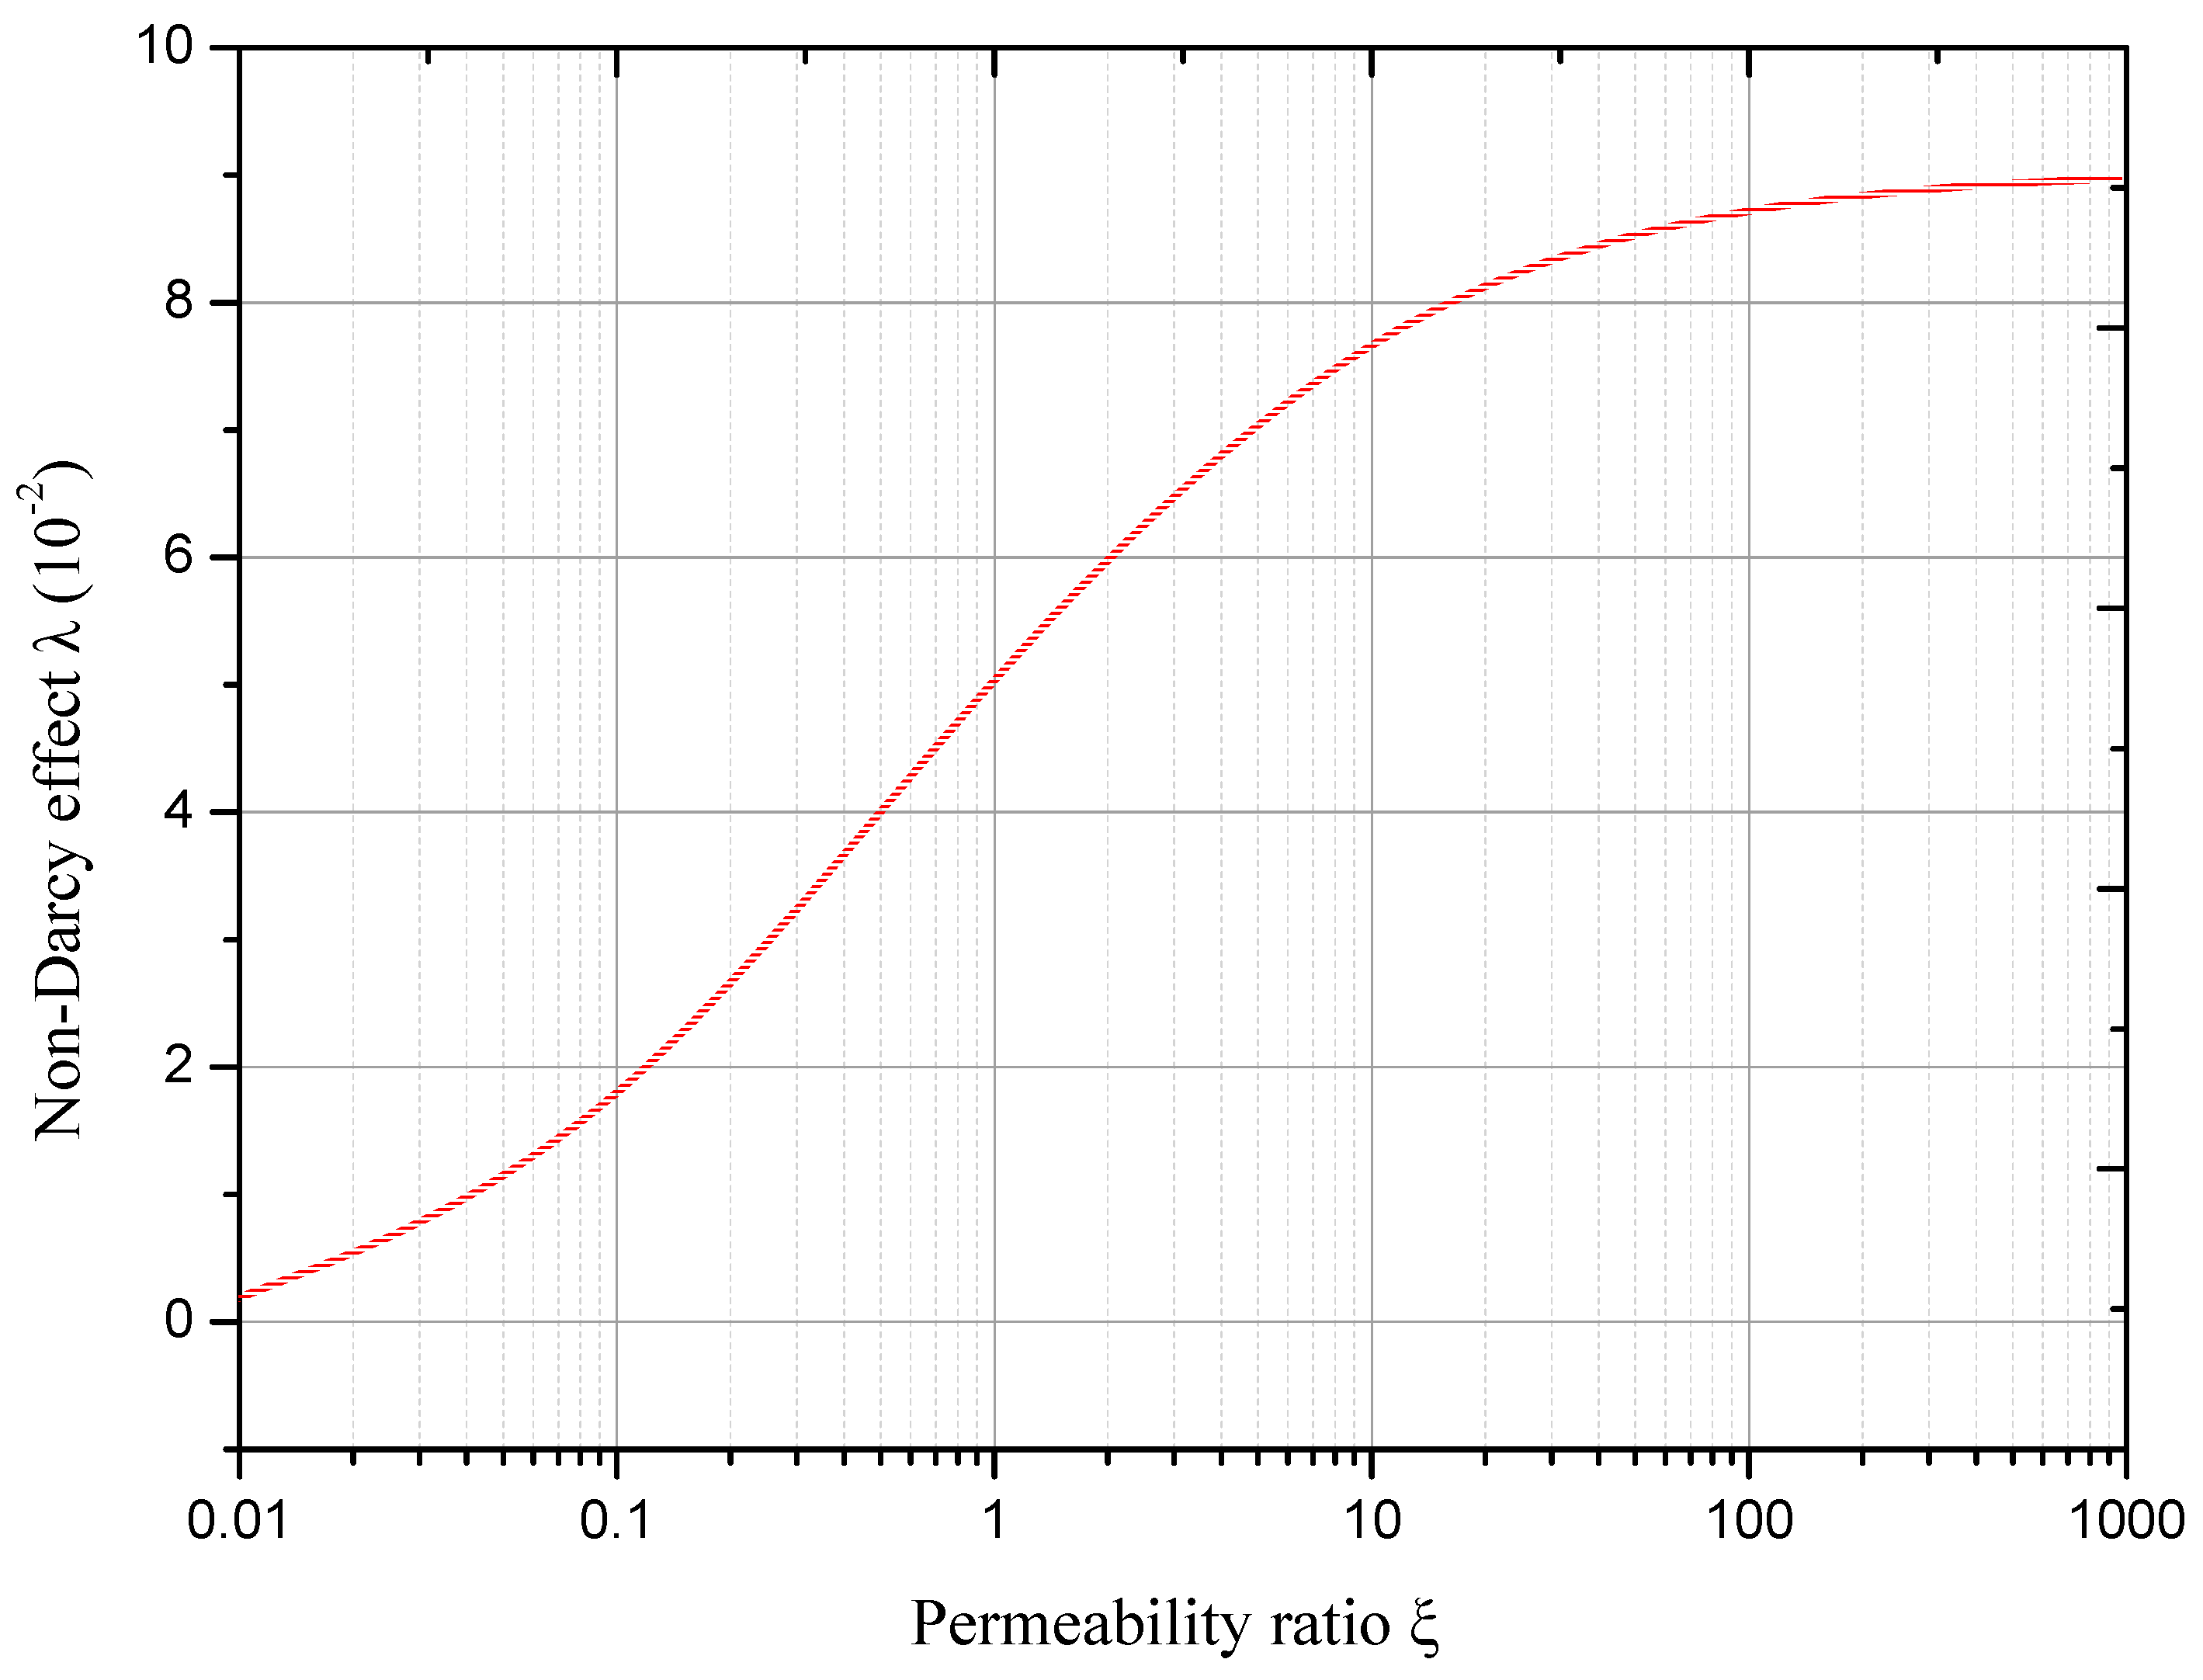
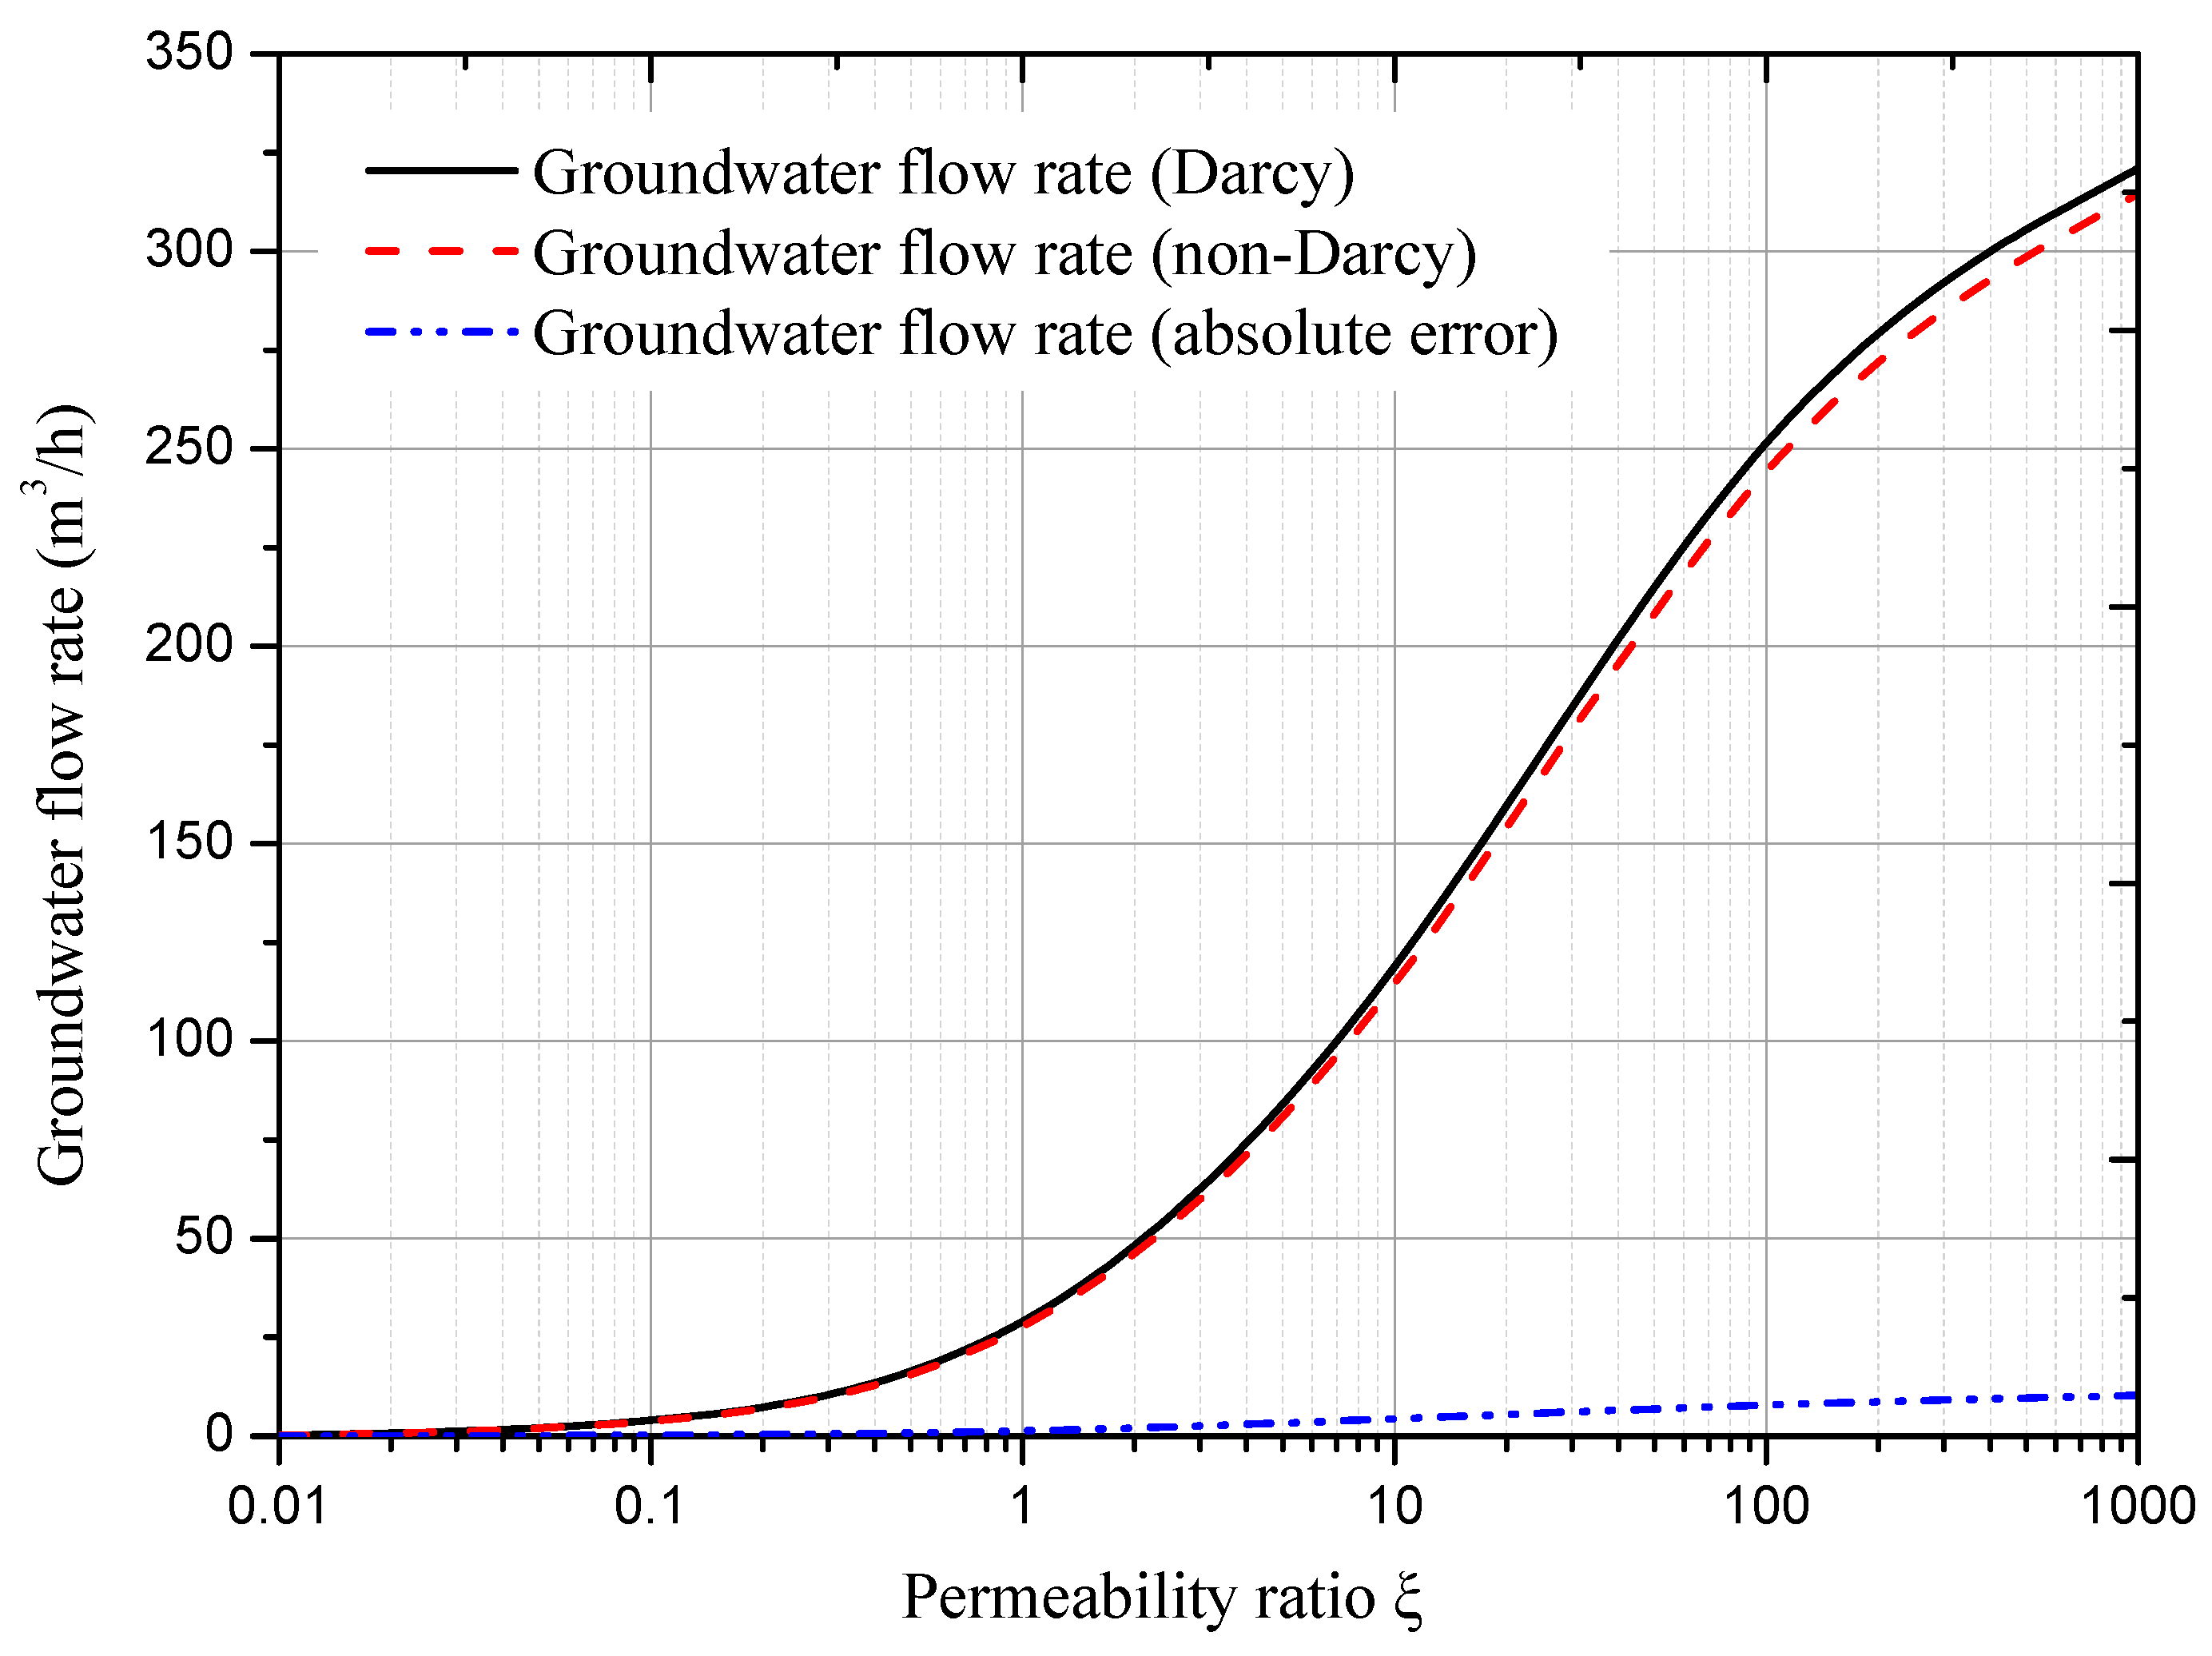
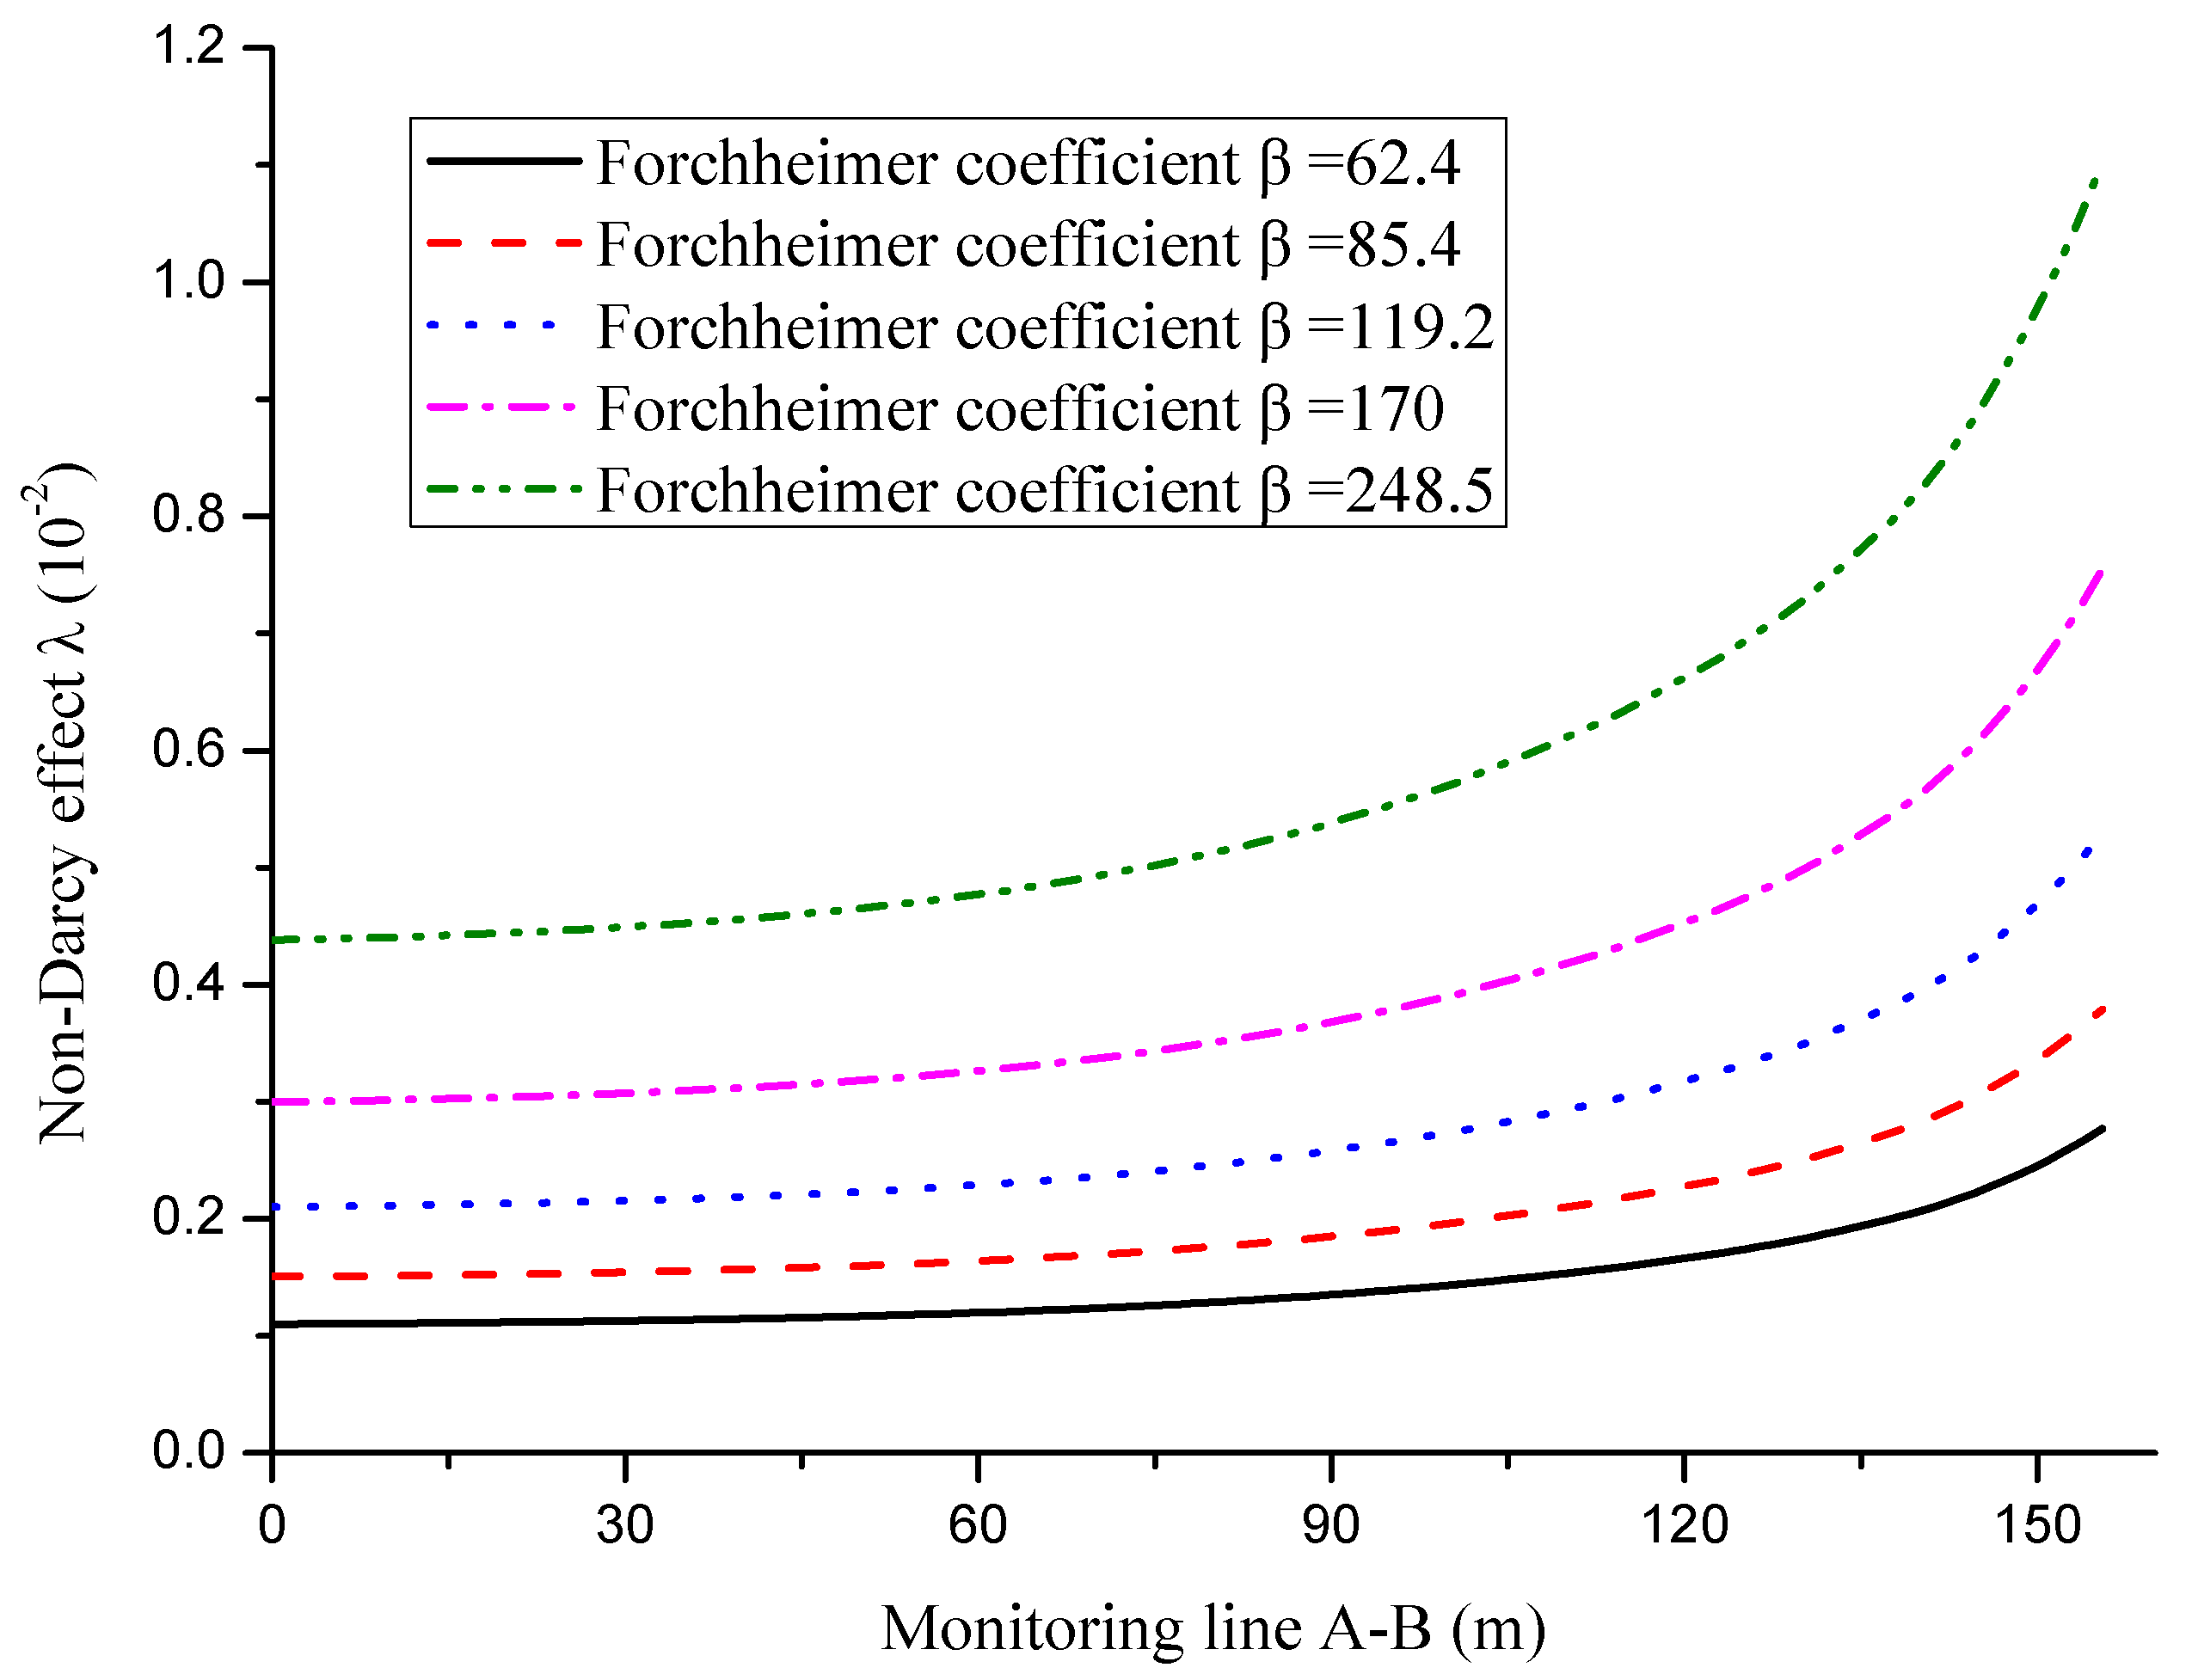
3.2.3. Influence of the Non-Darcy Effect on Groundwater Flow

Groundwater discharge is one of the most important indexes for safety evaluation in underground construction. Under the same boundary conditions, aquifer permeability, and fault permeability, we simulated two different cases by considering the non-Darcy effect. Figure 11 presents the case where the non-Darcy effect was considered and the error between non-Darcy effect and Darcy effect. The data show that the difference between the fault and the aquifer was relatively small when the seepage ratio was small. By contrast, when the seepage ratio was increased to 1, the relative error was comparatively high. If the relative error exceeded 100%, then the predicted data may have larger errors. Thus, Darcy’s law was unsuitable. Simultaneously, the influence of the Forchheimer coefficient on groundwater flow was relatively small in the Darcy and non-Darcy cases at low flow velocity. Nonetheless, a gap existed between the Forchheimer coefficient and the two cases at high flow velocity. Hence, when flow velocity in the fault exceeds a certain limit, the Forchheimer coefficient can be used to represent the flow behavior of fluid in non-Darcy high-speed flow.

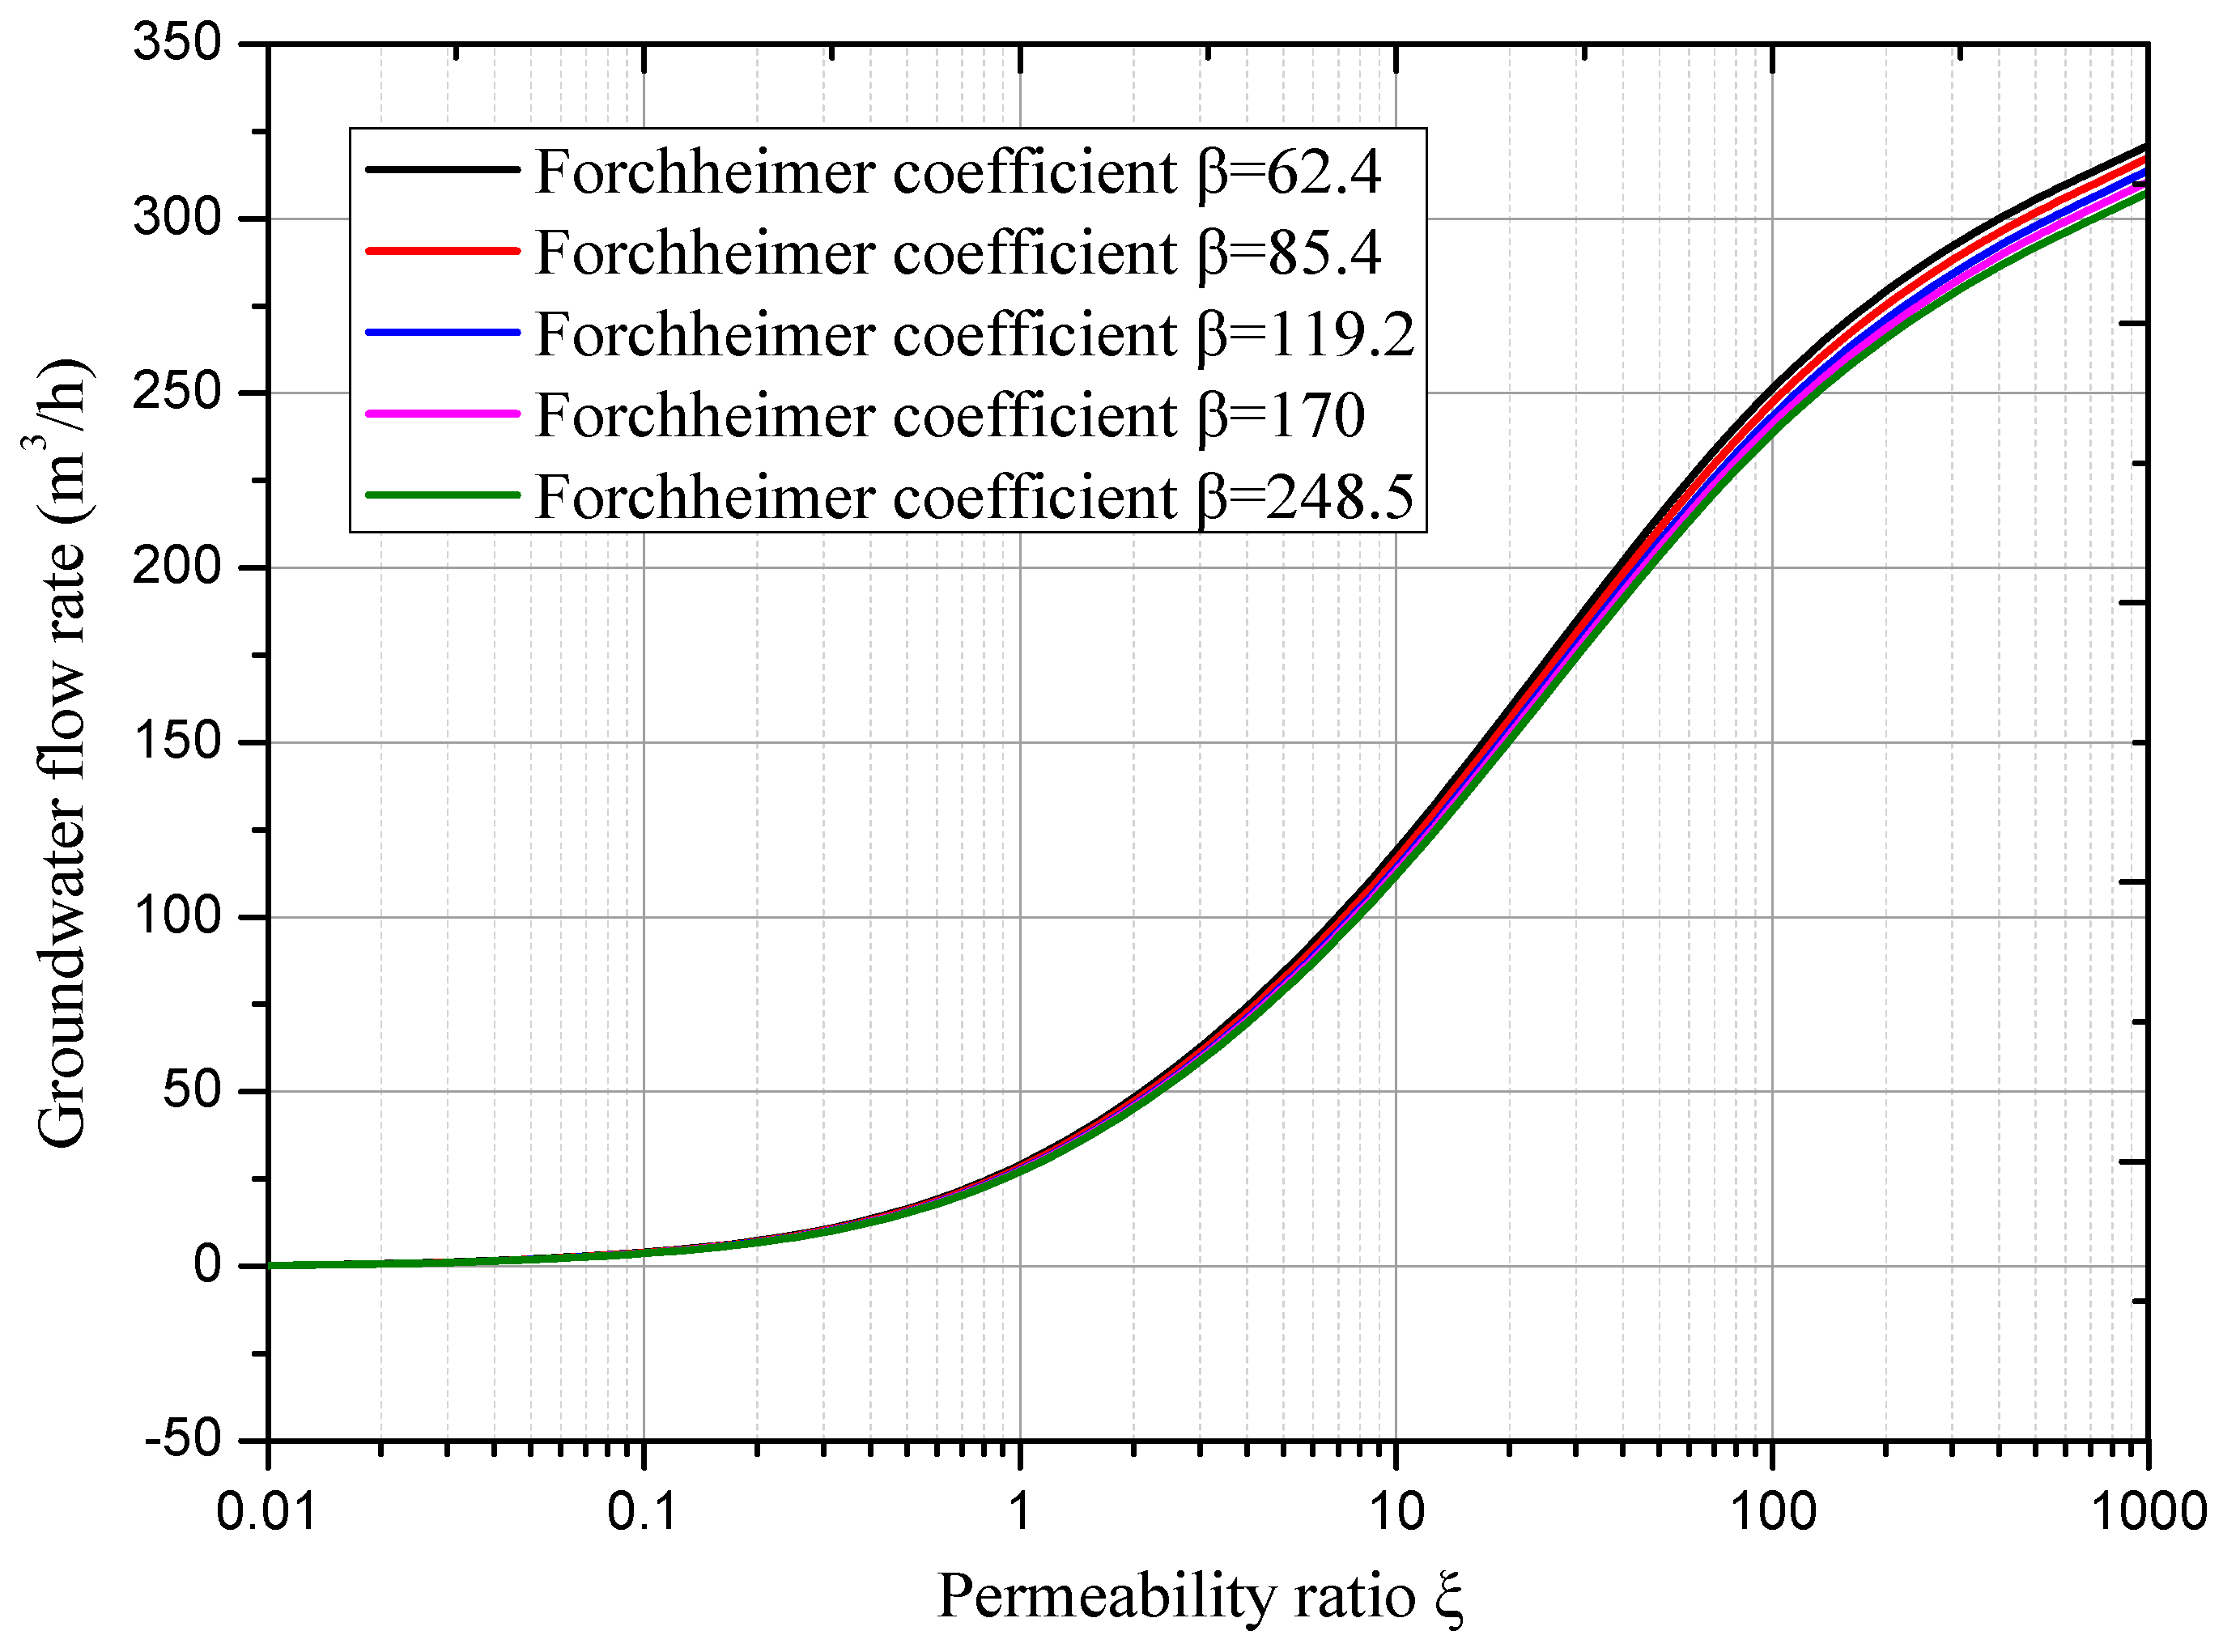
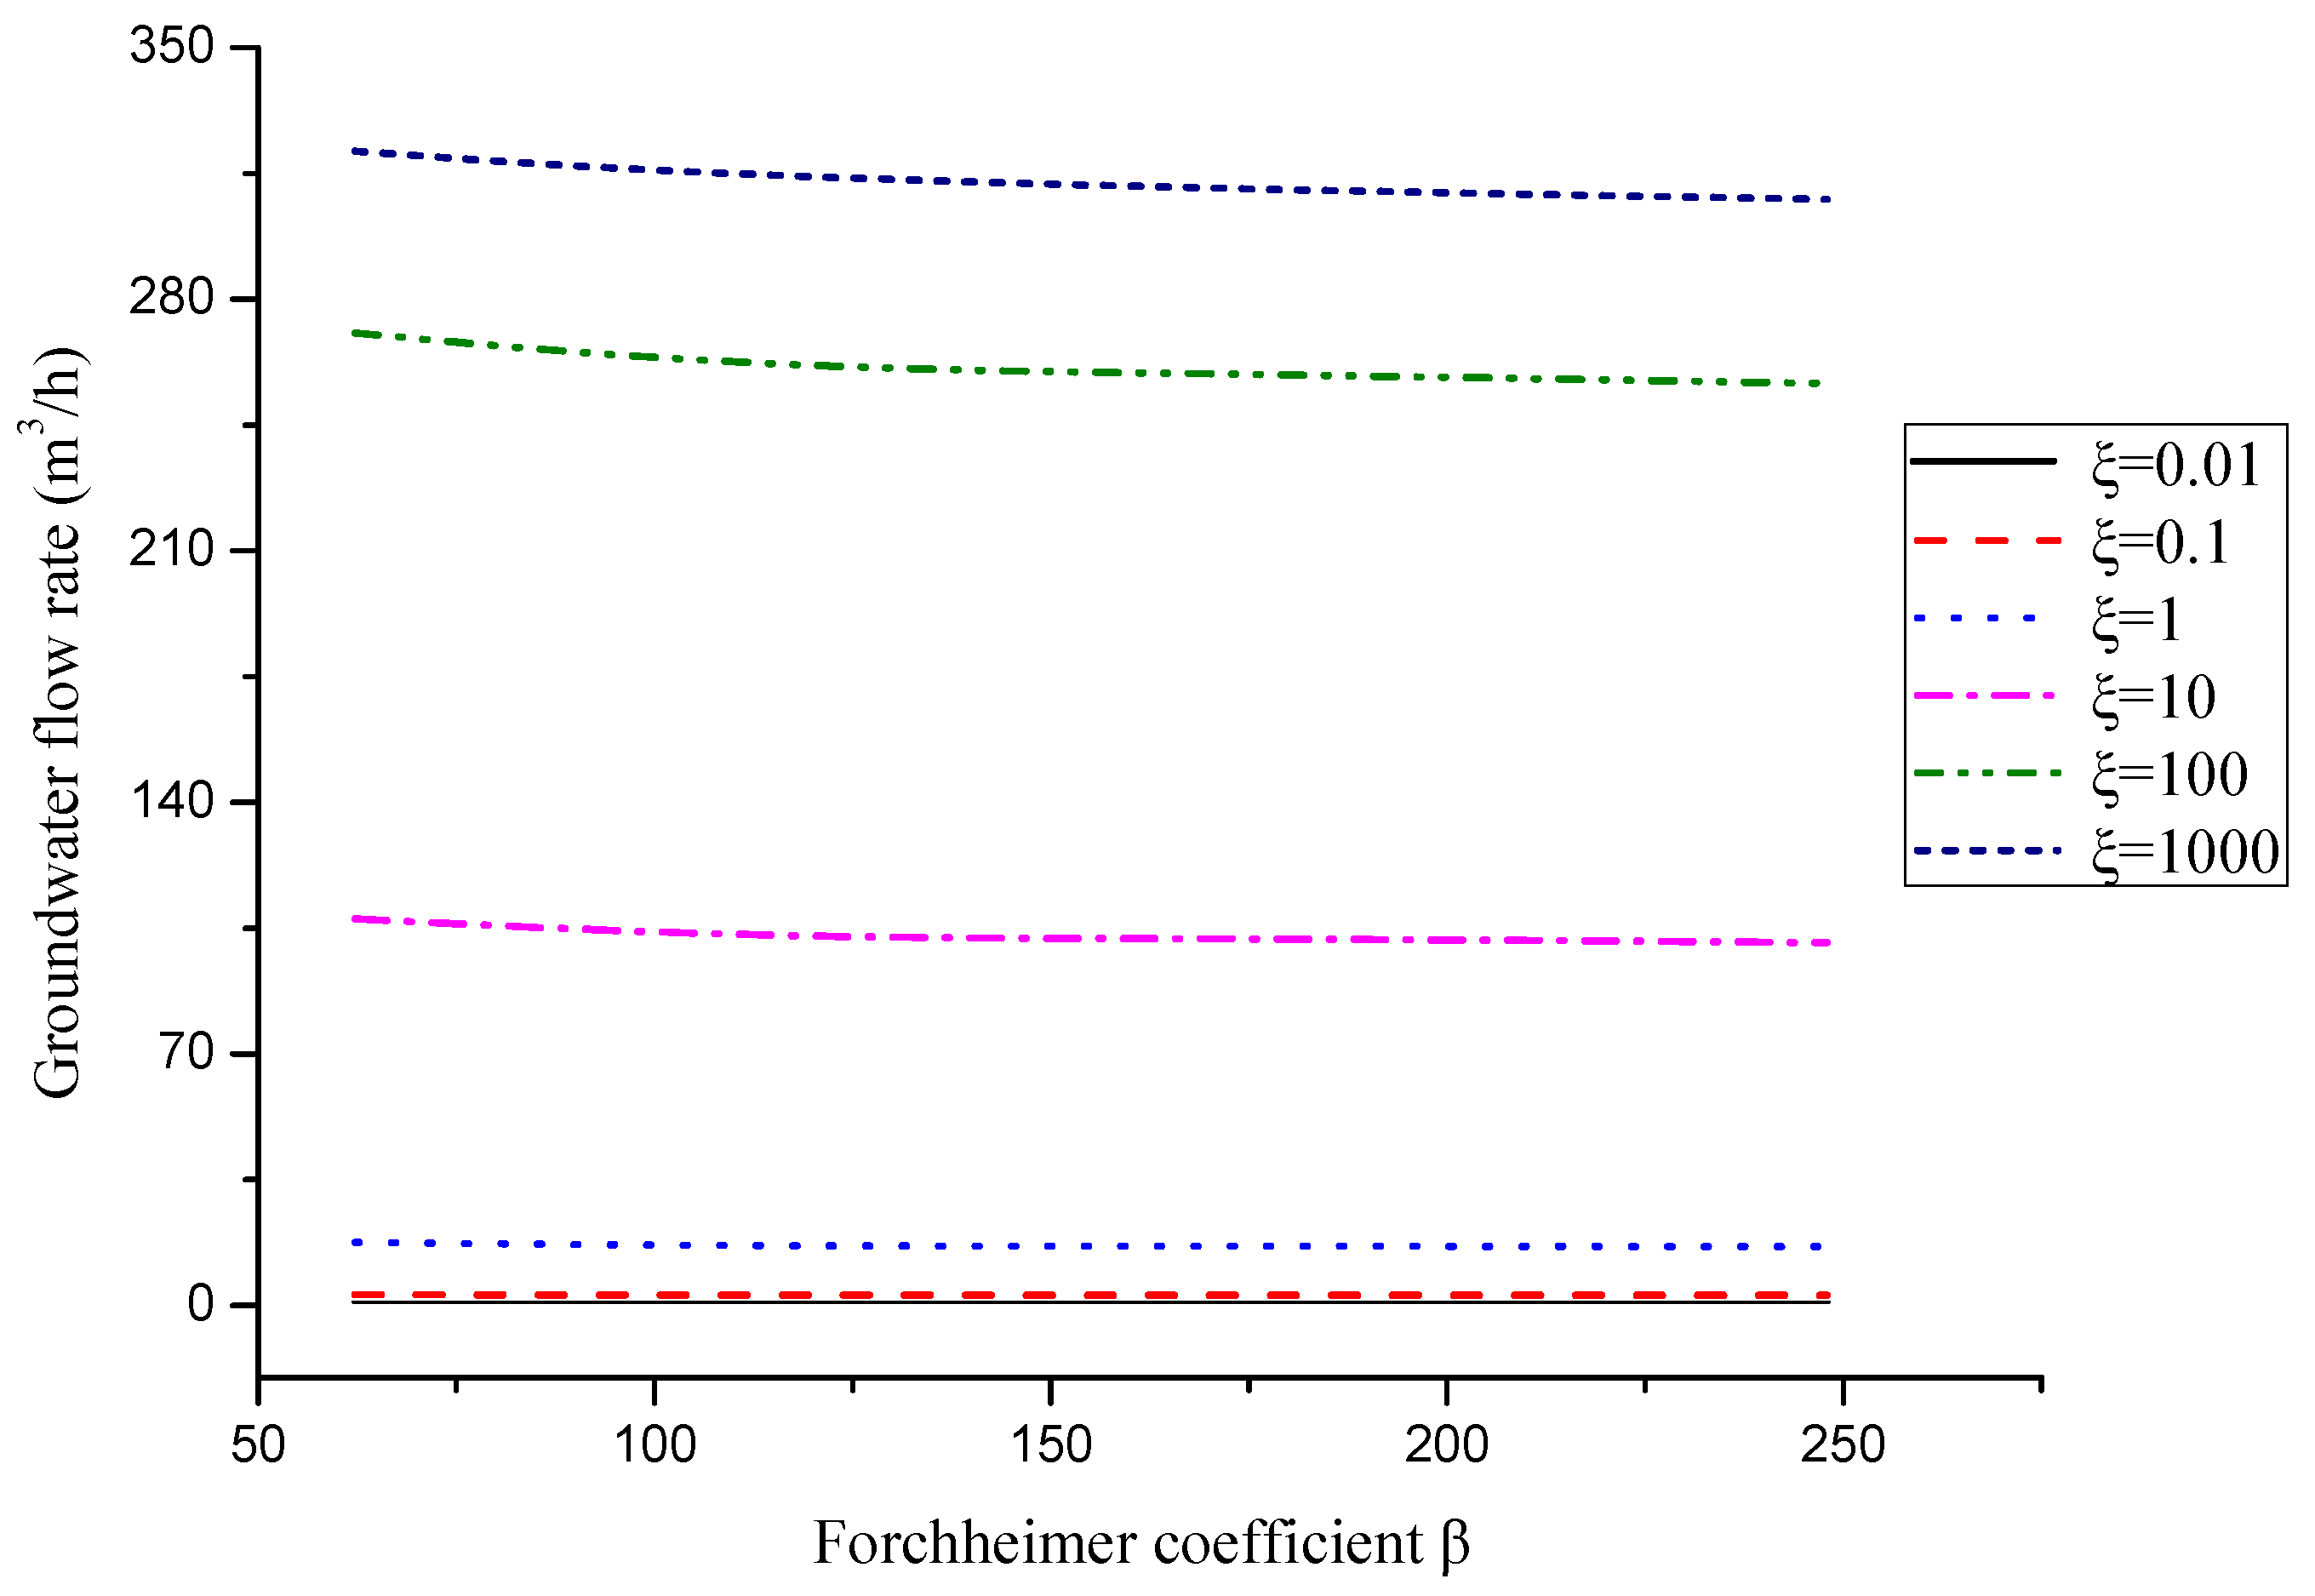
3.2.4. Influence of the Forchheimer Coefficient on Groundwater Flow

Figure 12 and Figure 13 show the changes in groundwater flow at different Forchheimer coefficients and permeability ratios. When changing, the curves obtained by different Forchheimer coefficients were basically the same. Moreover, the groundwater flow rate at different permeability coefficients increased gradually when the Forchheimer coefficient was changed. When ξ < 10 , the change in the Forchheimer coefficient exerted minimal effect on groundwater inflow. In addition, groundwater inflow was insensitive to the Forchheimer coefficient of the aquifer. When ξ > 10 , the overall change in the Forchheimer coefficient was basically the same due to the low pressure of the aquifer. In low-velocity non-Darcy flow, groundwater flow increased with permeability; in contrast with that of the Forchheimer coefficient, this change was not evidenced. However, the assumption that the Forchheimer coefficient has no effect on the description of the non-Darcy flow behavior is inaccurate. After increasing the pressure of the aquifer, the Forchheimer coefficient played a decisive role in groundwater flow.
As shown in Figure 14, the non-Darcy effect changed with the change of Forchheimer coefficient. Moreover, the non-Darcy effect on the left side of the cross section gradually increased. The non-Darcy effect zone in the aquifer expanded as the Forchheimer coefficient of the aquifer increased. Therefore, the non-Darcy effect region in the aquifer was sensitive to the Forchheimer coefficient of the aquifer. In addition, Darcy’s law did not apply to the flow mechanism that describes the outburst of groundwater through faults. After gradually moving away from the fault, the non-Darcy effect on the cross section increased, thereby indicating that the non-Darcy effect initially occurred at the far end of the aquifer. As permeability increased, the non-Darcy effect also increased, and the amplitude gradually improved.

4. Conclusions

In this study, various conditions of fault water inrush were simulated via COMSOL Multiphysics using the Forchheimer equation to describe the nonlinear flow behavior of groundwater through faults. The major conclusions derived are as follows:
(1)
During groundwater seepage, groundwater flow does not always satisfy the linear Darcy equation. A high-speed flowing fluid will form a non-Darcy effect zone near the fault due to the gradual change in the hydrostatic pressure of the aquifer and the porosity of the fault. As fault permeability increases, the non-Darcy flow region will gradually expand from the fault.
(2)
In fault water inrush induced by excavation, the flow resistance of groundwater in the fault is finally dominated by viscous resistance. Groundwater flow in faults changes constantly. Therefore, water inrush from underground faults is a dynamic process, and the state of faults constantly changes with their attributes.
(3)
The Forchheimer equation can quantitatively describe flow behavior in faults and analyze various changes in water inrush from faults under various working conditions by changing permeability. It can be used to determine transition from Darcy flow to high-speed non-Darcy flow.
(4)
For engineering purposes, the Forchheimer equation has a reasonable physical meaning and can be used to conveniently describe groundwater flow, particularly non-Darcy flow. Therefore, the Forchheimer equation is recommended to predict the inflow of groundwater inrush. Predicting this inflow is critical for the safety of a project. In the case of low velocity, the non-Darcy effect was not evidenced in the entire region; however, it was in several high-velocity areas.
(5)
When water flows in the aquifer, it can be regarded as a Darcy seepage process because of its small velocity. When water flows through faults, the porosity and permeability of faults are very high, and the velocity of flow is very high. At this time, it can no longer be regarded as a Darcy flow process. The Forchheimer’s model and Brinkman’s model can be adopted to simulate this non-Darcy process in this stage. From the simulation results (the distribution characteristics of flow pressure and water velocity), the difference between Forchheimer’s model and Brinkman’s model results are not obvious. Both models can be used to simulate the flow characteristics in the process of water inrush. Further research should be conducted to verify the validity of the two models in the analysis of water inrush accidents through experiments.

Author Contributions

Y.X. conceived the model; H.Y. and F.D. performed the numerical simulation; Y.L. and J.L. wrote the paper; and L.Z. and Z.M. revised the paper.

Funding

This study was sponsored by the National Natural Science Foundation of China (51679199), the China Postdoctoral Science Foundation (2018M633549), the Special Funds for Public Industry Research Projects of the Ministry of Water Resources (201501034-04) and the Key Laboratory for Science and Technology Coordination & Innovation Projects of Shaanxi Province (2014SZS15-Z01).

Acknowledgments

The authors would like to appreciate the anonymous reviewers for their constructive comments and suggestions.

Conflicts of Interest

The authors declare no conflict of interest.

References

  1. Hou, X.; Shi, W.; Yang, T. A non-linear flow model for the flow behavior of water inrush induced by the karst collapse column. RSC Adv. 2018, 8, 1656–1665. [Google Scholar] [CrossRef] [Green Version]
  2. Xue, Y.; Dang, F.; Liu, F.; Li, R.; Ranjith, P.G.; Wang, S.; Cao, Z.; Yang, Y. An elastoplastic model for gas flow characteristics around drainage borehole considering post-peak failure and elastic compaction. Environ. Earth Sci. 2018, 77, 669. [Google Scholar] [CrossRef]
  3. Wu, Q.; Zhao, D.; Wang, Y.; Shen, J.; Mu, W.; Liu, H. Method for assessing coal-floor water-inrush risk based on the variable-weight model and unascertained measure theory. Hydrogeol. J. 2017, 25, 2089–2103. [Google Scholar] [CrossRef]
  4. Wang, Y.; Geng, F.; Yang, S.; Jing, H.; Meng, B. Numerical simulation of particle migration from crushed sandstones during groundwater inrush. J. Hazard. Mater. 2019, 362, 327–335. [Google Scholar] [CrossRef] [PubMed]
  5. Cheng, S.; Li, S.C.; Li, L.P.; Shi, S.S.; Zhou, Z.Q.; Wang, J. Study on energy band characteristic of microseismic signals in water inrush channel. J. Geophys. Eng. 2018, 15, 1826–1834. [Google Scholar] [CrossRef] [Green Version]
  6. Guo, X.; Chai, J.R.; Qin, Y.; Xu, Z.G.; Fan, Y.N.; Zhang, X.W. Mechanism and Treatment Technology of Three Water Inrush Events in the Jiaoxi River Tunnel in Shaanxi, China. J. Perform. Constr. Facil. 2018, 33, 04018098. [Google Scholar] [CrossRef]
  7. Zhang, Z.Q. Comprehensive prevention and control technology of karst water hazards in Feicheng mining area. In Safety and Efficiency Coal Mine Geological Guarantee Technology and Its Application; China Coal Society: Beijing, China, 2007; pp. 195–198. Available online: http://cpfd.cnki.com.cn/Article/CPFDTOTAL-ZGMT200708001035.htm (accessed on 1 August 2007).
  8. Wang, J.; Liu, X.; Xiang, J.; Jiang, Y.; Feng, B. Laboratory model tests on water inrush in foundation pit bottom. Environ. Earth Sci. 2016, 75, 1072. [Google Scholar] [CrossRef]
  9. Li, L.; Tu, W.; Shi, S.; Chen, J.; Zhang, Y. Mechanism of water inrush in tunnel construction in karst area. Geomat. Nat. Hazards Risk 2016, 7, 35–46. [Google Scholar] [CrossRef]
  10. Meng, Z.; Li, G.; Xie, X. A geological assessment method of floor water inrush risk and its application. Eng. Geol. 2012, 143, 51–60. [Google Scholar] [CrossRef]
  11. Xue, Y.; Teng, T.; Zhu, L.; He, M.; Ren, J.; Dong, X.; Liu, F. Evaluation of the non-Darcy effect of water inrush from karst collapse columns by means of a nonlinear flow model. Water 2018, 10, 1234. [Google Scholar] [CrossRef]
  12. Yang, Z.H.; Zhang, R.; Xu, J.S.; Yang, X.L. Energy analysis of rock plug thickness in karst tunnels based on non-associated flow rule and nonlinear failure criterion. J. Cent. South Univ. 2017, 24, 2940–2950. [Google Scholar] [CrossRef]
  13. Nie, L.C.; Zhang, X.X.; Liu, B.; Liu, Z.Y.; Wang, C.W.; Guo, Q.; Liu, H.D.; Wang, H.T. A study on resistivity imaging in tunnel ahead prospecting based on GPU joint inversion. Chin. J. Geophys.-Chin. Ed. 2017, 60, 4916–4927. [Google Scholar]
  14. Li, S.C.; Lin, P.; Xu, Z.H.; Li, L.P.; He, S.J.; Zhao, S.L.; Huang, X. Innovative method for the integral sliding stability analysis of filling media in karst caves and its applications in engineering. Int. J. Geomech. 2017, 17, 04017109. [Google Scholar] [CrossRef]
  15. Xue, Y.; Dang, F.; Cao, Z.; Du, F.; Ren, J.; Chang, X.; Gao, F. Deformation, Permeability and Acoustic Emission Characteristics of Coal Masses under Mining-Induced Stress Paths. Energies 2018, 11, 2233. [Google Scholar] [CrossRef]
  16. Eang, K.E.; Igarashi, T.; Kondo, M.; Nakatani, T.; Tabelin, C.B.; Fujinaga, R. Groundwater monitoring of an open-pit limestone quarry: Water-rock interaction and mixing estimation within the rock layers by geochemical and statistical analyses. Int. J. Min. Sci. Technol. 2018, 28, 849–857. [Google Scholar] [CrossRef]
  17. Eang, K.E.; Igarashi, T.; Fujinaga, R.; Kondo, M.; Tabelin, C.B. Groundwater monitoring of an open-pit limestone quarry: Groundwater characteristics, evolution and their connections to rock slopes. Environ. Monit. Assess. 2018, 190, 193. [Google Scholar] [CrossRef] [PubMed]
  18. Eang, K.E.; Hashim, S.F.S.; Mohd Hashim, M.H.; Mohd Yusof, M.T. Case study of alluvial gold mining at pulai mining in gua musang, kelantan, malaysia. Adv. Mater. Res. 2013, 858, 236–242. [Google Scholar]
  19. Aalianvari, A. Combination of engineering geological data and numerical modeling results to classify the tunnel route based on the groundwater seepage. Geomech. Eng. 2017, 13, 671–683. [Google Scholar]
  20. Taherian, A.R. Experiences of TBM operation in gas bearing water condition—A case study in Iran. Tunn. Undergr. Space Technol. 2015, 47, 1–9. [Google Scholar] [CrossRef]
  21. Schrader, A.; Winde, F. Unearthing a hidden treasure: 60 years of karst research in the Far West Rand, South Africa. S. Afr. J. Sci. 2015, 111, 35–41. [Google Scholar] [CrossRef]
  22. Odintsev, V.N.; Miletenko, N.A. Water inrush in mines as a consequence of spontaneous hydrofracture. J. Min. Sci. 2015, 51, 423–434. [Google Scholar] [CrossRef]
  23. Polak, K.; Rozkowski, K.; Czaja, P. Causes and effects of uncontrolled water inrush into a decommissioned mine shaft. Mine Water Environ. 2016, 35, 128–135. [Google Scholar] [CrossRef]
  24. Genis, M.; Akcin, H.; Aydan, O.; Bacak, G. Investigation of possible causes of sinkhole incident at the Zonguldak Coal Basin, Turkey. Geomech. Eng. 2018, 16, 177–185. [Google Scholar]
  25. Hu, J.; Liu, Y.; Li, Y.; Yao, K. Artificial Ground Freezing In Tunnelling through Aquifer Soil Layers: A Case Study in Nanjing Metro Line 2. KSCE J. Civ. Eng. 2018, 22, 4136–4142. [Google Scholar] [CrossRef]
  26. Wu, Y.Q.; Wang, K.; Zhang, L.Z.; Peng, S.H. Sand-layer collapse treatment: An engineering example from Qingdao Metro subway tunnel. J. Clean. Prod. 2018, 197, 19–24. [Google Scholar] [CrossRef]
  27. Zhu, Y.W.S.; Zhang, T. Permeability of the Coal Seam Floor Rock Mass in a Deep Mine Based on In-situ Water Injection Tests. Mine Water Environ. 2018, 37, 724–733. [Google Scholar] [CrossRef]
  28. Shi, W.; Yang, T.; Liu, H.; Yang, B. Numerical modeling of non-Darcy flow behavior of groundwater outburst through fault using the Forchheimer equation. J. Hydrol. Eng. 2018, 23. [Google Scholar] [CrossRef]
  29. Yang, T.; Chen, S.; Zhu, W.; Meng, Z.; Gao, Y. Water inrush mechanism in mines and nonlinear flow model for fractured rocks. Chin. J. Rock Mech. Eng. 2008, 27, 1411–1416. [Google Scholar]
Figure 1. Model of underground fault water inrush.
Water 11 00855 g001
Figure 2. Pressure distributions of aquifers and faults at different permeability ratios: (a) ξ = 0.01; (b) ξ = 0.1; (c) ξ = 1; (d) ξ = 10; (e) ξ = 100; (f) ξ = 1000; (g) ξ = 10,000; and (h) ξ = 100,000.
Water 11 00855 g002
Figure 3. Pressure variation of the monitoring line at different permeability ratios.
Water 11 00855 g003
Figure 4. Velocity distributions of aquifers and faults at different permeability ratios: (a) ξ = 0.01; (b) ξ = 0.1; (c) ξ = 1; (d) ξ = 10; (e) ξ = 100; (f) ξ = 1000; (g) ξ = 10,000; and (h) ξ = 100,000.
Water 11 00855 g004
Figure 5. Velocity distribution of monitoring line at different permeability ratios.
Water 11 00855 g005
Figure 6. Water pressure distribution of the model at different permeability ratios: (a) ξ = 0.01; (b) ξ = 0.1; (c) ξ = 1; (d) ξ = 10; (e) ξ = 100; and (f) ξ = 1000.
Water 11 00855 g006
Figure 7. Water pressure change of monitoring line at different permeability ratios.
Water 11 00855 g007
Figure 8. Non-Darcy effect characteristic of monitoring line A-B at different permeability ratios.
Water 11 00855 g008
Figure 9. Non-Darcy effect characteristic of monitoring line B-C-D at different permeability ratios.
Water 11 00855 g009
Figure 10. Non-Darcy effect changes at different conditions at Point C.
Water 11 00855 g010
Figure 11. Groundwater flow with the Darcy effect and the non-Darcy effect.
Water 11 00855 g011
Figure 12. Groundwater flow changes at different permeability ratios.
Water 11 00855 g012
Figure 13. Groundwater flow changes at different Forchheimer coefficients.
Water 11 00855 g013
Figure 14. Change in the non-Darcy effect at different Forchheimer coefficients.
Water 11 00855 g014
Table 1. Physical parameters used in the model.
ParameterExpression
Water density ρ 1000 kg/m3
Dynamic viscosity coefficient μ 0.001 Pa·s
Permeability k s 2.1 × 10⁻¹¹ m2
Model length b 350 m
Initial pressure P 0 4.1× 10⁶ Pa
Table 2. Settings of subdomain parameters.
Flow FieldAquiferFault
Water density ρ (kg/m3)10001000
Dynamic viscosity coefficient μ (Pa·s)0.0010.001
Porosity φ 0.140.348

