Extended-Range Runoff Forecasting Using a One-Way Coupled Climate–Hydrological Model: Case Studies of the Yiluo and Beijiang Rivers in China

Abstract
:1. Introduction
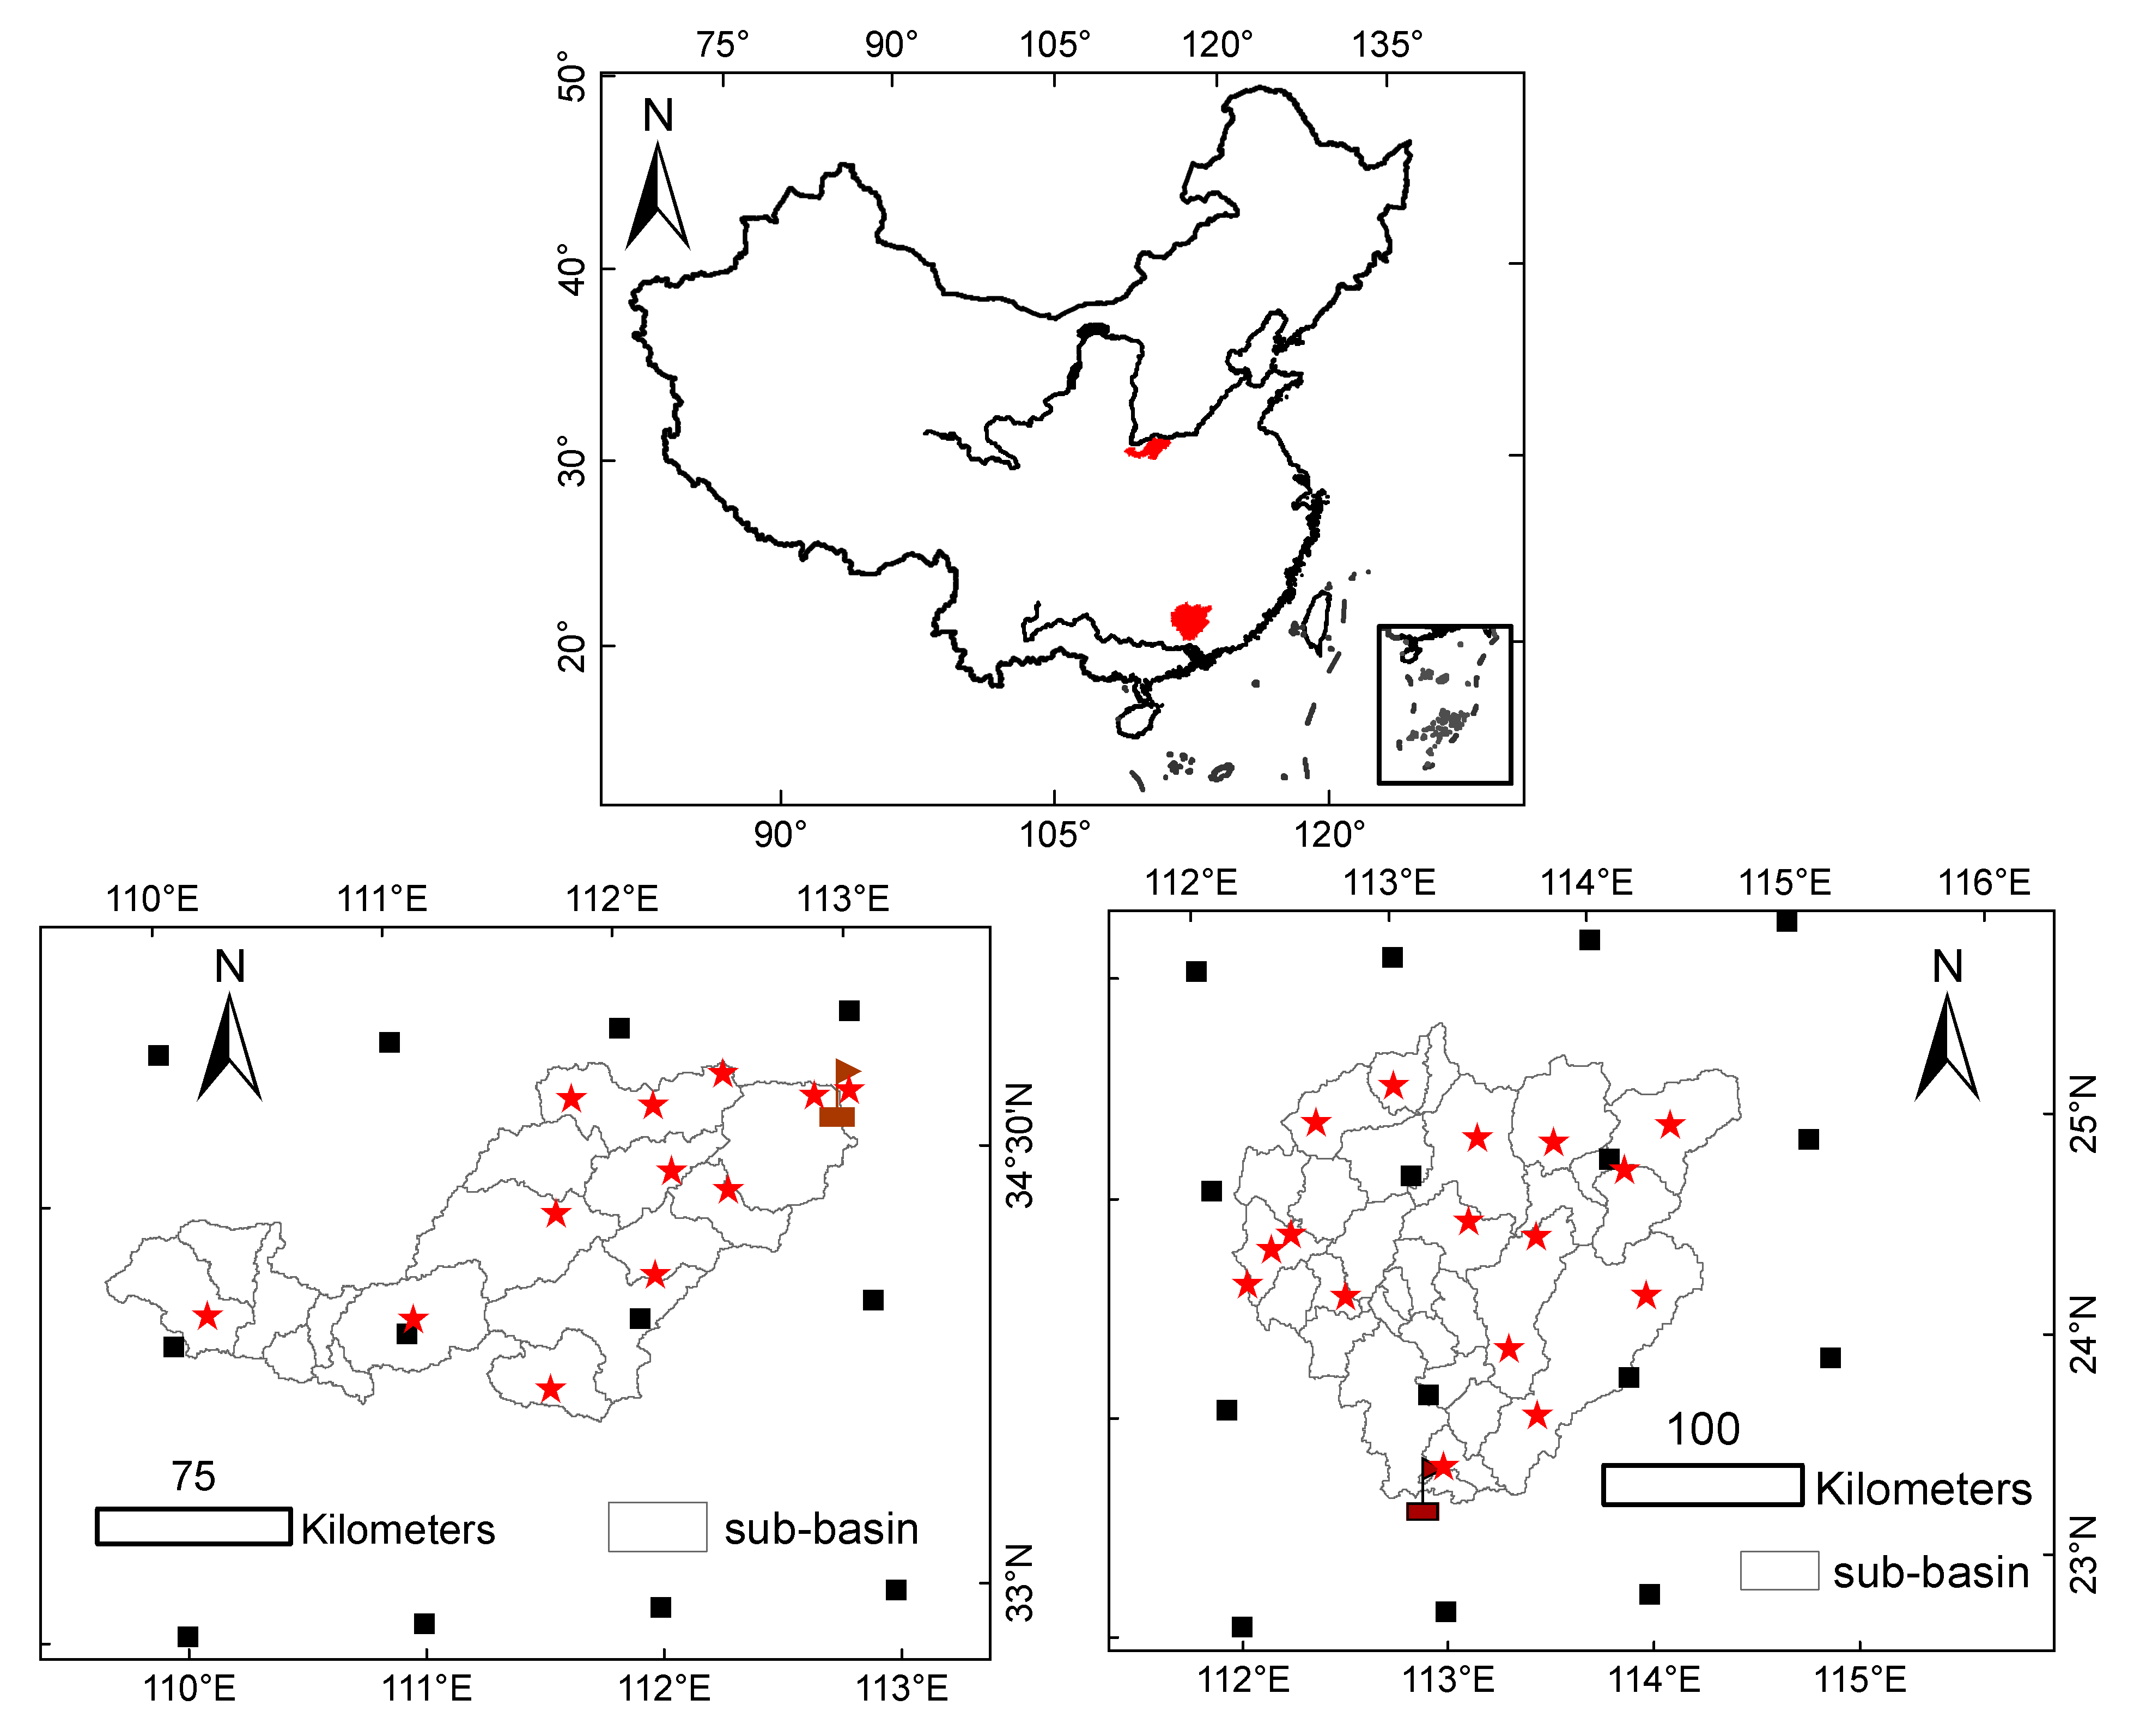
2. Study Area
3. Data and Method
3.1. Available Datasets
3.2. Methods
3.2.1. Hydrological Model
3.2.2. Climate Model
3.2.3. Runoff Forecasting
3.2.4. Runoff Reforecast Verification
4. Results
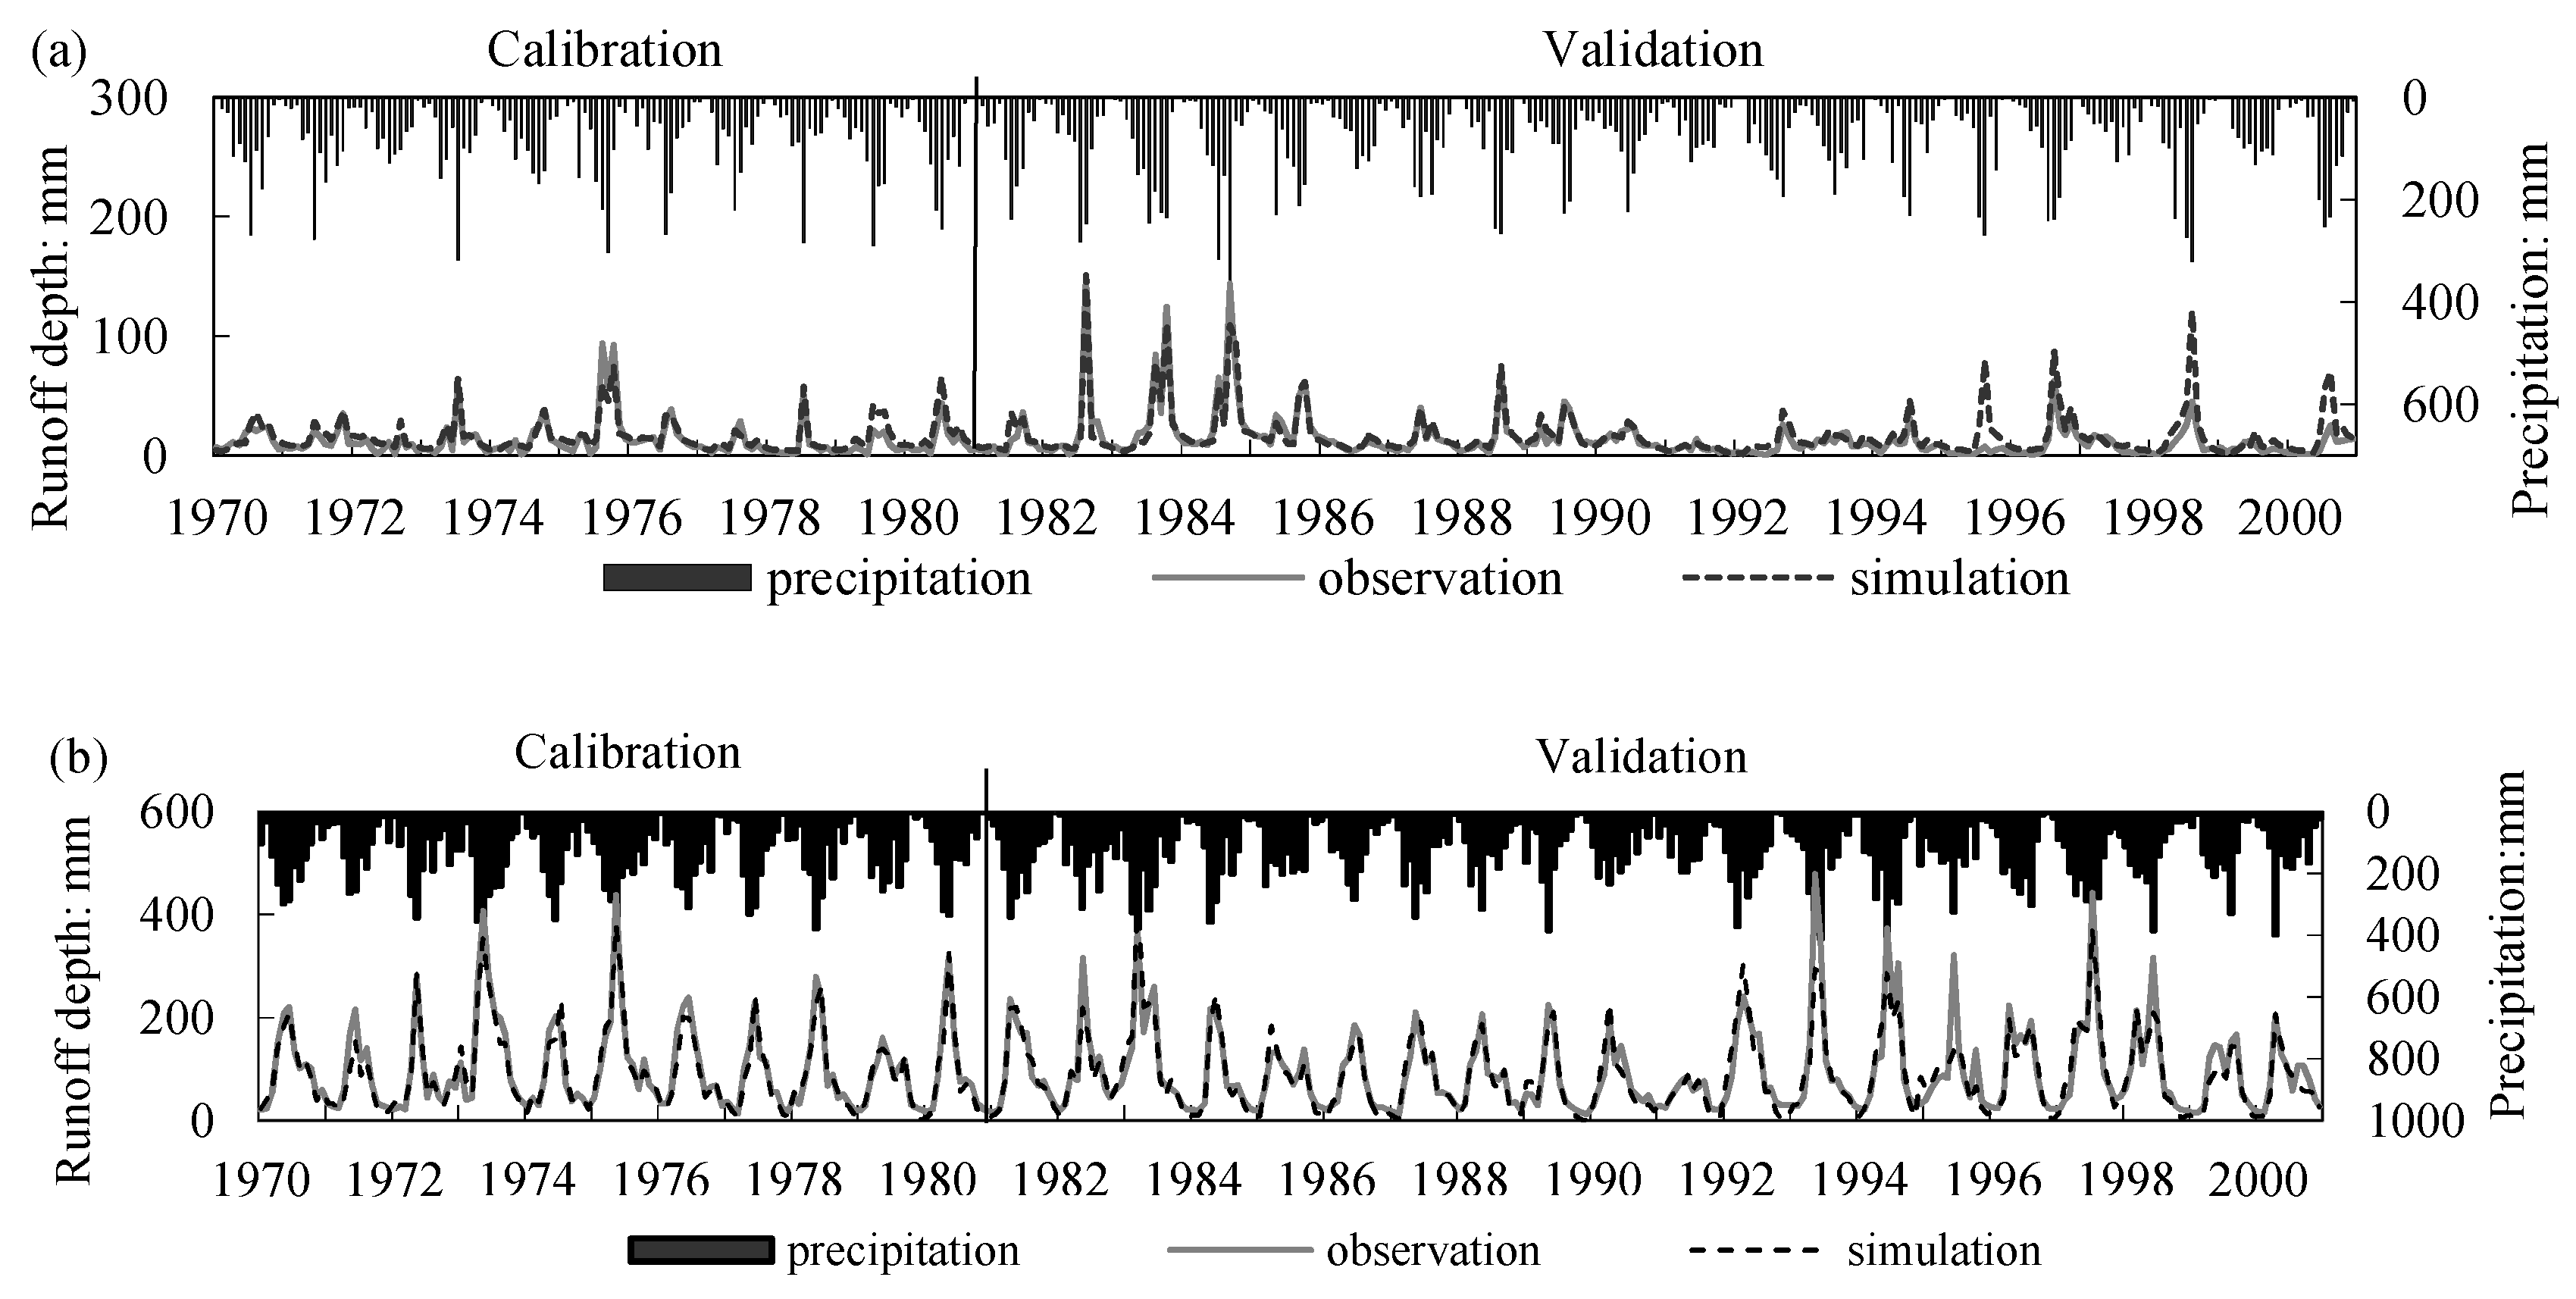
4.1. Calibration and Validation of the HBV-D Model
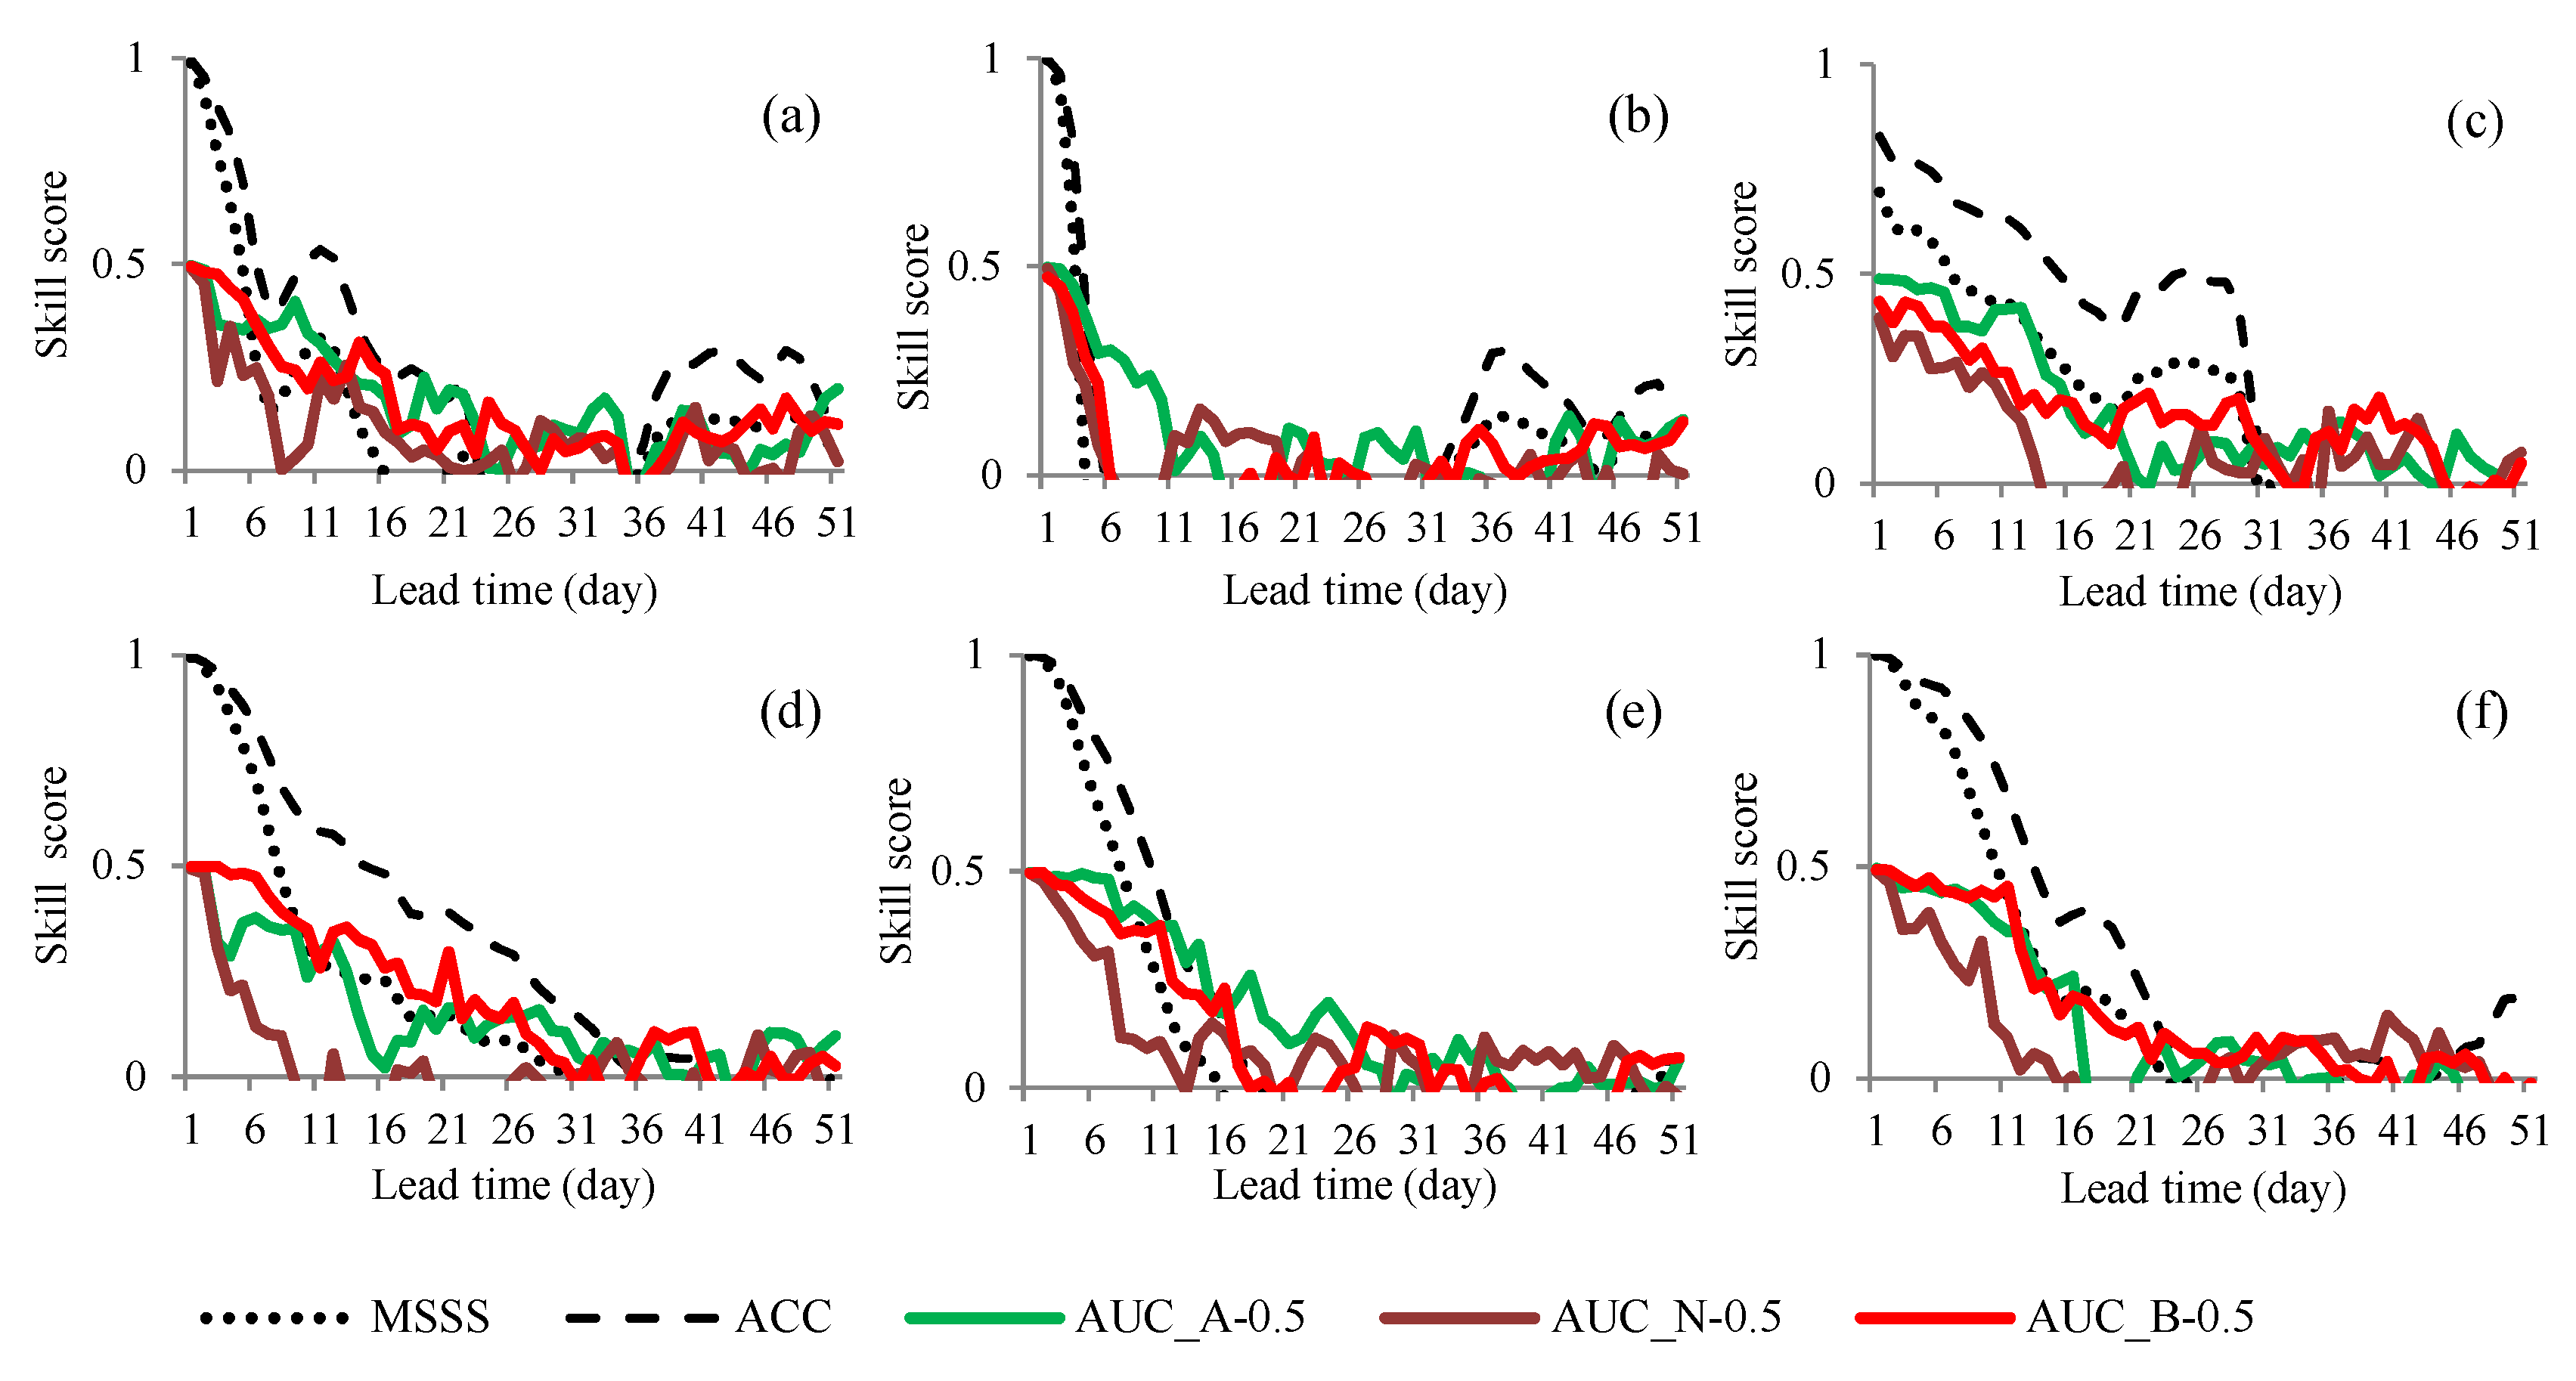
4.2. Runoff Forecast Skill
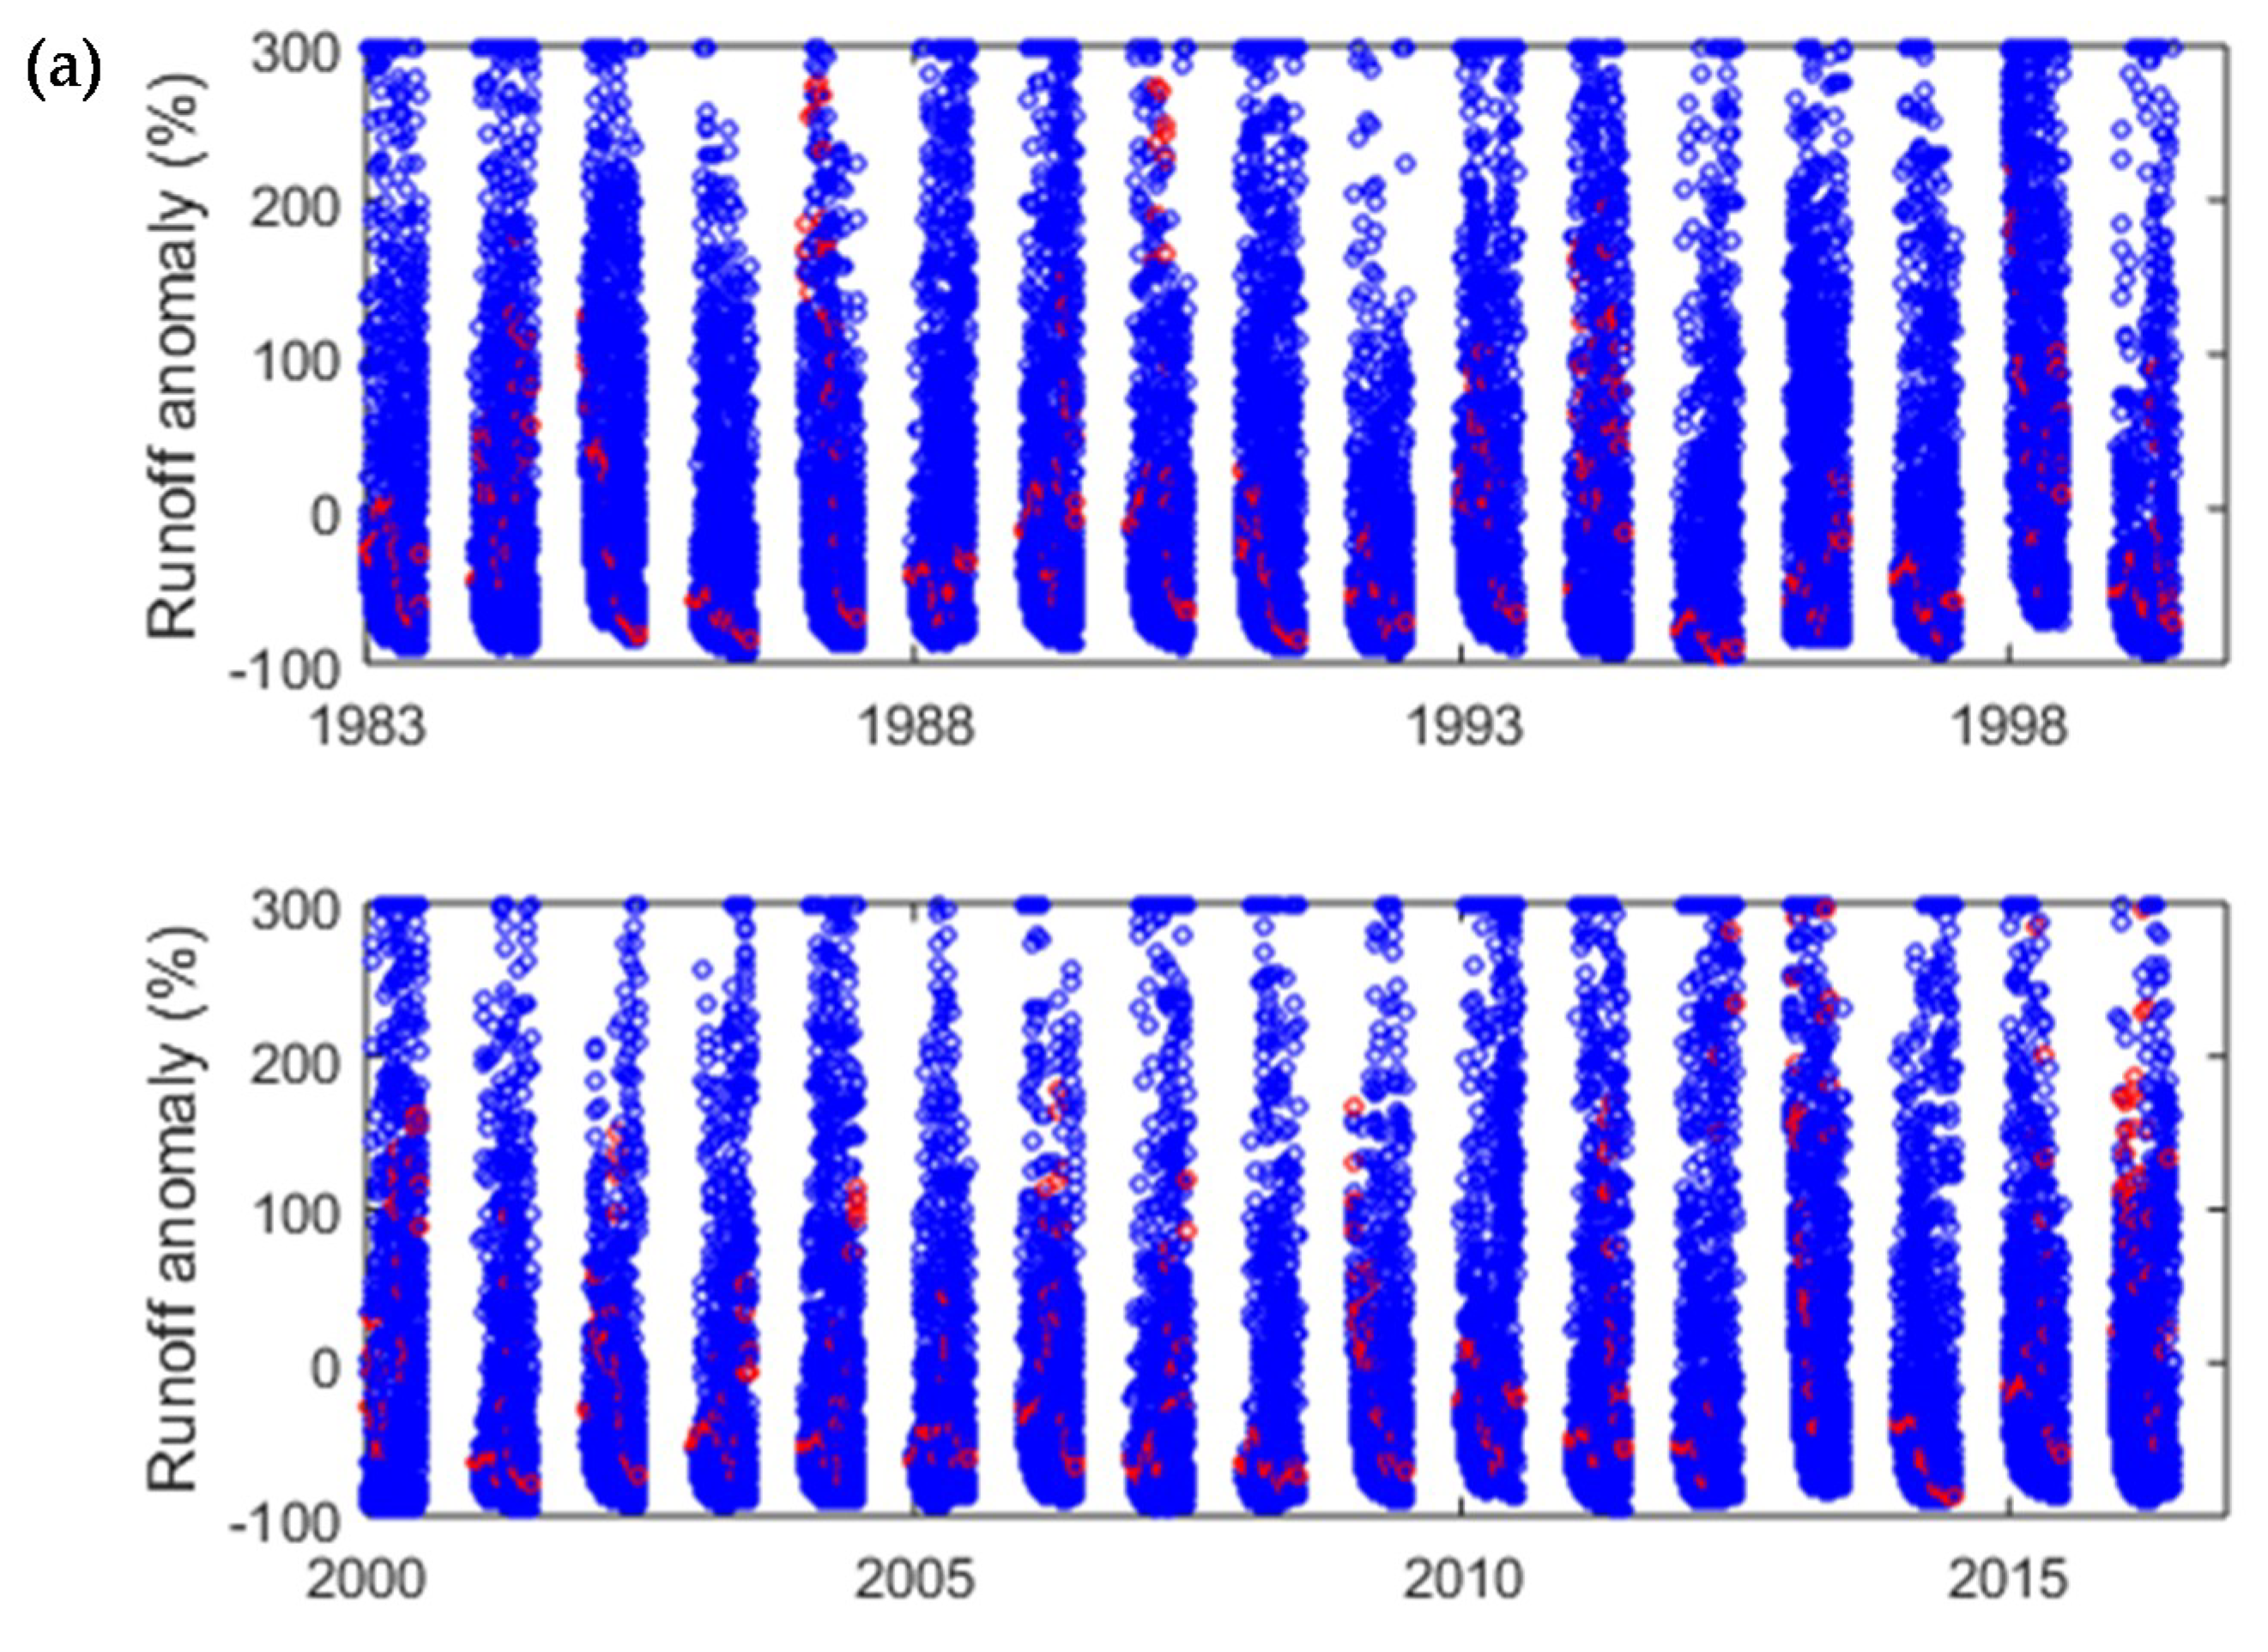
4.3. Reproducing Ability of Ensemble Runoff Forecast
5. Discussion
6. Conclusions
Author Contributions
Funding
Conflicts of Interest
References
- Fan, Y.R.; Huang, G.H.; Li, Y.P.; Wang, X.Q. Probabilistic prediction for monthly streamflow through coupling stepwise cluster analysis and quantile regression methods. Water Resour. Manag. 2016, 30, 5313–5331. [Google Scholar] [CrossRef]
- Hopson, T.M.; Webster, P.J. A 1–10-day ensemble forecasting scheme for the major river basins of bangladesh: Forecasting severe floods of 2003–07. J. Hydrometeorol. 2010, 11, 618–641. [Google Scholar] [CrossRef]
- Yuan, X. An experimental seasonal hydrological forecasting system over the Yellow River basin—Part 2: The added value from climate forecast model. Hydrol. Earth Syst. Sci. 2016, 20, 2453–2466. [Google Scholar] [CrossRef]
- Crochemore, L.; Ramos, M.H.; Pappenberger, F. Bias correcting precipitation forecast to improve the skill of seasonal streamflow forecast. Hydrol. Earth Syst. Sci. 2016, 20, 3601–3618. [Google Scholar] [CrossRef]
- Addor, N.; Jaun, S.; Fundel, F.; Zappa, M. An operational hydrological ensemble prediction system for the city of Zurich (Switzerland): Skill, case studies and scenarios. Hydrol. Earth Syst. Sci. 2011, 15, 2327–2347. [Google Scholar] [CrossRef]
- Shortridge, J.E.; Guikema, S.D.; Zaitchik, B.F. Machine learning methods for empirical streamflow simulation: A comparison of model accuracy, interpretability, and uncertainty in seasonal watersheds. Hydrol. Earth Syst. Sci. 2016, 7, 2611. [Google Scholar] [CrossRef]
- Tan, Q.F.; Lei, X.H.; Wang, X.; Wang, H.; Wen, X.; Ji, Y.; Kang, A.Q. An adaptive middle and long-term runoff forecast model using EEME-ANN hybrid approach. J. Hydrol. 2018, 567, 767–780. [Google Scholar] [CrossRef]
- Yang, L.; Tian, F.; Sun, Y.; Yuan, X.; Hu, H. Attribution of hydrologic forecast uncertainty within scalable forecast windows. Hydrol. Earth Syst. Sci. 2014, 18, 775786. [Google Scholar] [CrossRef]
- Yuan, X.; Wood, E.F.; Ma, Z. A review on climate-model based seasonal hydrologic forecasting: Physical understanding and system development. Wiley Interdiscip. Rev. Water 2015, 2, 523–536. [Google Scholar] [CrossRef]
- Wood, A.W.; Mauer, E.P.; Kumar, A.; Lettenmaier, D.P. Long-range experimental hydrologic forecasting for the eastern United States. J. Geophys. Res. 2002, 107, 449. [Google Scholar] [CrossRef]
- Yuan, X. An experimental seasonal hydrological forecasting system over the Yellow River basin—Part 1: Understanding the role of initial hydrological conditions. Hydrol. Earth Syst. Sci. 2016, 20, 2437–2451. [Google Scholar] [CrossRef]
- Pappenberger, F.; Beven, K.J.; Hunter, N.M.; Bates, P.B.; Gouweleeuw, B.T.; Thielen, J.; de Roo, A.P.J. Cascading model uncertainty from medium range weather forecasts (10 days) through a rainfall-runoff model to flood inundation predictions within the European Flood Forecast in System (EFFS). Hydrol. Earth Syst. Sci. 2005, 9, 381–393. [Google Scholar] [CrossRef]
- Cloke, H.L.; Pappenberger, F. Ensemble flood forecasting: Review. J. Hydrol. 2009, 375, 613–626. [Google Scholar] [CrossRef]
- Yuan, X.; Wood, E.F.; Roundy, J.K.; Pan, M. CFSv2-based seasonal hydroclimatic forecast over the conterminous United States. J. Clim. 2013, 26, 4828–4847. [Google Scholar] [CrossRef]
- Stensrud, D.J.; Brooks, H.E.; Du, J.; Tracton, M.S.; Rogers, E. Using ensembles for short-range forecasting. Mon. Weather Rev. 1999, 127, 433–446. [Google Scholar] [CrossRef]
- Brown, J.D.; Heuvelink, G. Assessing uncertainty propagation through physically based models of soil water flow and solute transport. In Encyclopedia of Hydrological Sciences; Anderson, M., Ed.; John Wiley and Sons: Hoboken, NJ, USA, 2005; pp. 1181–1195. [Google Scholar]
- Olsson, J.; Lindström, G. Evaluation and calibration of operational hydrological ensemble forecasts in Sweden. J. Hydrol. 2008, 350, 14–24. [Google Scholar] [CrossRef]
- Brown, J.D.; Seo, D.J. A noparametric postprocessor for bias correction of hydrometeorological and hydrologic ensemble forecasts. J. Hydrometeorol. 2010, 11, 642–665. [Google Scholar] [CrossRef]
- Najafi, M.R.; Moradkhani, H.; Piechota, T.C. Ensemble streamflow prediction: Climate signal weighting methods vs. climate forecast system reanalysis. J. Hydrol. 2012, 442, 105–116. [Google Scholar] [CrossRef]
- Iacobellis, V.; Fiorentino, M.; Gioia, A.; Manfreda, S. Best fit and selection of theoretical flood frequency distributions based on different runoff generation mechanisms. Water 2010, 2, 239–256. [Google Scholar] [CrossRef]
- Najafi, M.R.; Moradkhani, H.; Jung, I.W. Assessing the uncertainties of hydrologic model selection in climate change impact studies. Hydrol. Process. 2011, 25, 2814–2826. [Google Scholar] [CrossRef]
- Liu, L.; Xu, H.; Wang, Y.; Jiang, T. Impacts of 1.5 and 2 °C global warming on water availability and extreme hydrological events in Yiluo and Beijiang River catchments in China. Clim. Chang. 2017, 145, 145–158. [Google Scholar] [CrossRef]
- He, R.M.; Wang, G.Q.; Zhang, J.Y. Impacts of environmental change on runoff in the Yiluohe River basin of the middle Yellow River. Res. Soil Water Conserv. 2007, 2, 297–301. (In Chinese) [Google Scholar]
- Wang, W.T.; Qian, L.X. Spatial distribution and seasonal variation of evapotranspiration in Yiluo River basin on MODIS data. Resour. Sci. 2012, 34, 1582–1590. (In Chinese) [Google Scholar]
- Guo, W.N.; Zhao, W.J. Variation characteristics of runoff in the Yiluo River. Water Resour. S. N. Water Diversion 2015, 21, 61–62. (In Chinese) [Google Scholar]
- Cheng, Z.L. Analysis on characteristic of floods and floods combining in the upstream of the Bejiang River. Guangong Water Resour. Hydropower 2006, 19, 46–49. (In Chinese) [Google Scholar]
- Fu, J.Y.; Jiang, D.; Huang, Y.H. Population Grid_China. Acta Geogr. Sinica 2014, 69, 41–44. (In Chinese) [Google Scholar]
- Gao, C.Y.; Zhao, Q.H.; Liu, Q. Fractal characteristic of soil particle size under different vegetation types in riparian zone of the main stream of Beijiang River. Res. Soil Water Conserv. 2016, 23, 37–42. [Google Scholar]
- He, L.; Chen, W.Y. An analysis of water regime in Beijiang’s lower reaches. J. Foshan Univ. 2003, 21, 67–69. (In Chinese) [Google Scholar]
- Huang, G.R.; Wu, C.H.; Liu, Z.Y.; Chen, Z.J.; Hu, J.W.; Yin, Z.J. Precipitation of extreme floods of the Feilaixia reservoir in the Beijiang River basin under climate change. Adv. Water Sci. 2015, 26, 10–19. (In Chinese) [Google Scholar]
- Shang, Y.L.; Wang, D.H.; Li, L. Development and updation of national dataset at a scale of 1:250,000. Sci. Surv. Mapp. 2004, 29, 92–95. (In Chinese) [Google Scholar]
- Zha, Z.X.; Wu, M.H.; Ren, X.Y. Dataset of national land-use at a scale of 1:500,000. Land Resour. Informatiz. 2001, 2, 17–21. (In Chinese) [Google Scholar]
- FAO; IIASA; ISRIC; ISS-CAS; JRC. Harmonized World Soil Database; Version 1.0; FAO: Rome, Italy; IIASA: Laxenburg, Austria, 2008. [Google Scholar]
- Krysanova, V.; Bronstert, A.; Müller-Wohlferl, D.I. Modelling river discharge for large drainage basins: From lumped to distributed approach. Hydrol. Sci. J. 1999, 44, 313–333. [Google Scholar] [CrossRef]
- Fan, J.; Jiang, Y.A.; Chen, Y.; Chen, P.X.; Bai, S.Q.; Yu, X.J. The critical rainfall calculation in Kaidu River based on HBV hydrological model. Desert Oasis Meteorol. 2014, 8, 31–35. (In Chinese) [Google Scholar]
- Su, B.; Huang, J.; Zeng, X.; Gao, C.; Jiang, T. Impacts of climate change on streamflow in upper Yangtze River basin. Clim. Chang. 2017, 141, 533–546. [Google Scholar] [CrossRef]
- Liu, L.; Jiang, T.; Xu, H.; Wang, Y. Potential threats from variations of hydrological parameters to the Yellow River and Pearl River Basins in China over the next 30 years. Water 2018, 10, 883. [Google Scholar] [CrossRef]
- Moriasi, D.N.; Arnold, J.G.; van Liew, M.W.; Bingner, R.L.; Harmel, R.D.; Veith, T.L. Model evaluation guidelines for systematic quantification of accuracy in watershed simulations. Trans. ASABE 2007, 50, 885–900. [Google Scholar] [CrossRef]
- He, H.G.; Li, Q.P.; Wu, T.W.; Tang, H.Y.; Hu, Z.Y. Chinese temperature and precipitation evaluation of monthly dynamic extended range forecast operational system DERF2.0 in China. J. Atmos. Sci. 2014, 38, 950–964. (In Chinese) [Google Scholar]
- Weedon, G.P.; Gomes, S.; Viterbo, P.; Österle, H.; Adam, J.C.; Bellouin, N.; Boucher, Q.; Best, M. The WATCH Forcing Data 1958–2001: A Meteorological Forcing Dataset for Land Surface- and Hydrological-Models. WATCH Technical Report No. 22. 2010, pp. 1–41. Available online: www.eu-watch.org (accessed on 1 February 2017).
- Liu, L.L.; Ren, G.Y. Percentile statistical downscaling method and its application in the correction of GCMs daily precipitation in China. Plateau Meteorol. 2012, 31, 715–722. (In Chinese) [Google Scholar]
- WMO. Standardised Verification System (SVS) for Long-Range Forecasts (LRF): New Attachment II-8 to the Manual on the GDPFS (WMO-No. 485); WMO: Geneva, Switzerland, 2006; Volume I. Available online: http://www.bom.gov.au/wmo/lrfvs/users.shtml (accessed on 4 February 2017).
- Lavers, D.; Luo, L.; Wood, E.F. A multiple model assessment of seasonal climate forecast skill for applications. Geophys. Res. Lett. 2009, 3, L23711. [Google Scholar] [CrossRef]
- Yuan, X.; Wood, E.F.; Luo, L.; Pan, M. A first look at Climate Forecast System version 2(CFSV2) for hydrological seasonal prediction. Geophys. Res. Lett. 2011, 38, L13402. [Google Scholar] [CrossRef]
- Wu, J.; Zhao, C.B.; Ren, H.L. Report to Temperature, Precipitation, and Circulation Evaluation of Monthly Dynamic Extended Range Forecast Operational System DERF.0 over the World; Laboratory for Climate Studies, China Meteorological Administration: Beijing, China, 2014. (In Chinese) [Google Scholar]
- Luo, L.; Wood, E.F. Use of Bayesian merging techniques in a multimodel seasonal hydrologic ensemble prediction system for the eastern United States. J. Hydrometeorol. 2008, 9, 866–884. [Google Scholar] [CrossRef]
- Yuan, X.; Wood, E.F. Downscaling precipitation or bias-correcting streamflow? Some implications for coupled general circulation model (CGCM)-based ensemble seasonal hydrologic forecast. Water Resour. Res. 2012, 48, W12519. [Google Scholar] [CrossRef]
- Liu, L.L.; Du, L.M.; Liao, Y.M.; Li, Y.; Liang, X.Y.; Tang, J.Y.; Zhao, Y.H. Probability prediction of monthly precipitation in summer over Huaihe River in China on spatial-temporal statistical downscaling. Meteorol. Mon. 2018, 44, 1490–1496. (In Chinese) [Google Scholar]


| Date of DERF2.0 Initial Conditions/Forecasted Period | Lead Time | ||
|---|---|---|---|
| Period1 | Period2 | Period3 | |
| May 26/Jun 1 to Jul 21 | Jun 25/Jul 1 to Aug 20 | Jul 26/Aug 1 to Sep 20 | 7–57 days |
| May 27/Jun 1 to Jul 21 | Jun 26/Jul 1 to Aug 20 | Jul 27/Aug 1 to Sep 20 | 6–56 days |
| May 28/Jun 1 to Jul 21 | Jun 27/Jul 1 to Aug 20 | Jul 28/Aug 1 to Sep 20 | 5–55 days |
| May 29/Jun 1 to Jul 21 | Jun 28/Jul 1 to Aug 20 | Jul 29/Aug 1 to Sep 20 | 4–54 days |
| May 30/Jun 1 to Jul 21 | Jun 29/Jul 1 to Aug 20 | Jul 30/Aug 1 to Sep 20 | 3–53 days |
| May 31/Jun 1 to Jul 21 | Jun 30/Jul 1 to Aug 20 | Jul 31/Aug 1 to Sep 20 | 2–52 days |
| Hydrological Station (Calibration/Validation Periods) | Series | NSE | R2 | PBIAS (%) |
|---|---|---|---|---|
| Heishiguan (1970–1980/1981–2000) | Daily | 0.64/0.56 | 0.81/0.76 | 18.0/17.6 |
| Monthly | 0.77/0.71 | 0.90/0.88 | ||
| Shijiao (1970–1980/1981–2000) | Daily | 0.74/0.81 | 0.87/0.90 | −5.9/−0.9 |
| Monthly | 0.94/0.93 | 0.97/0.97 |
| River | Index | Jun 1 to Jul 21 | Jul 1 to Aug 20 | Aug 1 to Sep 20 |
|---|---|---|---|---|
| Period1 | Period2 | Period3 | ||
| Yiluo River | MSSS | 0.13/15/33 | 0.0/3/22 | 0.19/30/30 |
| ACC | 0.26/23/39 | 0.07/5/27 | 0.25/31/31 | |
| AUC_A | 0.82/34/47 | 0.58/14/25 | 0.67/21/47 | |
| AUC_N | 0.66/21/43 | 0.53/5/24 | 0.57/12/40 | |
| AUC_B | 0.78/27/48 | 0.53/5/26 | 0.67/17/35 | |
| Beijiang River | MSSS | 0.16/30/30 | 0.07/15/18 | 0.12/23/23 |
| ACC | 0.30/41/41 | 0.14/18/22 | 0.28/24/38 | |
| AUC_A | 0.65/39/48 | 0.90/28/44 | 0.61/15/36 | |
| AUC_N | 0.52/8/26 | 0.65/12/40 | 0.56/14/33 | |
| AUC_B | 0.67/30/42 | 0.84/18/35 | 0.65/37/42 |
© 2019 by the authors. Licensee MDPI, Basel, Switzerland. This article is an open access article distributed under the terms and conditions of the Creative Commons Attribution (CC BY) license (http://creativecommons.org/licenses/by/4.0/).
Share and Cite
Liu, L.; Xiao, C.; Du, L.; Zhang, P.; Wang, G. Extended-Range Runoff Forecasting Using a One-Way Coupled Climate–Hydrological Model: Case Studies of the Yiluo and Beijiang Rivers in China. Water 2019, 11, 1150. https://0-doi-org.brum.beds.ac.uk/10.3390/w11061150
Liu L, Xiao C, Du L, Zhang P, Wang G. Extended-Range Runoff Forecasting Using a One-Way Coupled Climate–Hydrological Model: Case Studies of the Yiluo and Beijiang Rivers in China. Water. 2019; 11(6):1150. https://0-doi-org.brum.beds.ac.uk/10.3390/w11061150
Chicago/Turabian StyleLiu, Lüliu, Chan Xiao, Liangmin Du, Peiqun Zhang, and Guofu Wang. 2019. "Extended-Range Runoff Forecasting Using a One-Way Coupled Climate–Hydrological Model: Case Studies of the Yiluo and Beijiang Rivers in China" Water 11, no. 6: 1150. https://0-doi-org.brum.beds.ac.uk/10.3390/w11061150