Coupling Relationship between Urban Expansion and Lake Change—A Case Study of Wuhan


School of Urban Design, Wuhan University, Wuhan 430072, China
*
Author to whom correspondence should be addressed.
Water 2019, 11(6), 1215; https://0-doi-org.brum.beds.ac.uk/10.3390/w11061215
Submission received: 13 May 2019
/
Revised: 3 June 2019
/
Accepted: 4 June 2019
/
Published: 11 June 2019
(This article belongs to the Section Urban Water Management)
Abstract
:With the development of urbanisation, the contradiction between urban expansion and lake protection becomes increasingly evident. Particularly, lake reclamation of urban construction causes serious damage to the water system and further affects the ecological environment of urban areas. On the basis of the interpretation and analysis of long time-series remote sensing images, this study evaluated the spatial pattern and dynamic changes of urban built-up areas and lakes in Wuhan from 1987–2018 and analysed the role of urban policies in this process. A coupling coordination degree model was used to analyse the correlation between them. Results show that with the continuous advancement of urban construction and renewal of urban policies, the coupling degree between urban expansion and lake change in Wuhan has been on the rise in the past 30 years. Moreover, the antagonistic relationship between urban construction and lake protection has gradually eased from severe imbalance to slightly balanced, and the negative impact of urban development on lake change has gradually decreased. The findings underscore the need for Wuhan to adhere to policies that promote lake protection. Lake supervision should be strengthened, and ecological restoration should be actively promoted. Furthermore, sustainable urban development policies should be maintained to improve the quality of urban development.
1. Introduction
More than half the world’s population now lives in cities, and the population of urban area is growing rapidly. Millions of people move from rural areas to cities every year [1,2], which makes urban construction land increasingly scarce. From 2000–2010, the global built-up area has increased from 0.60 to 0.87 million km2 [3]. Therefore, cities are expanding at an alarming rate. Since the beginning of the 21st century, with the process of industrialisation and urbanisation, the phenomenon of urban expansion in China has become increasingly prominent [4,5,6]. The expansion of city proper has brought the demand for housing, commerce, industry and other infrastructure, which is often met by changing the pattern of land use and reclaiming natural land, such as arable land, forest, water body and vacant land [7,8,9]. This process has resulted in increased pollution and serious damage to the ecological environment [10,11]. The environmental problems caused by these changes also have adverse effects on urban health. In the past 20 years, the Chinese government has started to pay attention to the contradiction between cities and the natural environment. Thus, urban guiding policies, such as urban Double Repair, Sponge City Construction and Inventory Planning Development [12,13], have been proposed to achieve the harmony between man and nature in urban development and sustainable development.
As an important component of urban wetlands, urban lakes make a great contribution to the sound development of urban natural ecosystem [14]. The rapid expansion of cities leads to lake reclamation, which results in the shrinking and gradual breaking of lakes. This phenomenon presents the severe problem between urban expansion and lake protection. However, in-depth research on the relationship between urban lake protection and urban expansion is relatively scarce. Yang et al. [15] used the Normalized Difference Water Index (NDWI) to extract the lake area information of the main urban area of Wuhan from 1975–2013 and analysed the spatiotemporal characteristics of lake area changes with lake shrinkage index in Wuhan; however, the reasons for lake evolution were not thoroughly analysed in their study. Deng et al. [16] discussed the spatiotemporal changes of lake water scope in Wuhan urban agglomeration using Landsat remote sensing images from 1987–2015; however, they only focused on the comparative analysis of urban lake extraction methods and the horizontal comparison of lake area changes among cities in Wuhan urban agglomeration. Thus, a research gap still exists on the relationship between urban expansion and lake change. Furthermore, Zhu [17] discussed the evolution trend of lakeside land use in Wuhan on the basis of GIS; however, this study lacked an in-depth discussion on the interconnection between the evolution trend and lakeside land use.
Coupling is a phenomenon in which two or more indicators interact with each other in various ways. This technology originated from the field of physics and has been widely applied in the field of climate change [18,19]. In recent years, coupling has also been introduced into the analysis of the correlation between urbanisation and ecological environment and has become a relatively commonly used method [5]. Xing [20] used a coupling model to study and evaluate the coordination level between Wuhan’s economy-resource-environment system. Liu [7] analyzed and tested the spatiotemporal characteristics of the coordination between urbanisation and ecological environment in 30 provinces in China using a coupling coordination degree model. However, few studies have focused on the coupling relationship between urban expansion and lake change. As a city with a large number of lakes, Wuhan is under a rapid development of city expansion. In the past 20 years, the urban area of Wuhan has expanded from 153.35 km2 in 1987 to 1484.59 km2 in 2018. In this process, the lake area has also been greatly affected. On the basis of physical coupling model, the present work uses a coupling coordination degree model to discuss the urban expansion and lake change in Wuhan [21,22]. This study aims to achieve three main goals. Firstly, the data of Wuhan from 1987–2018 are used to reveal the trend of urban expansion and lake change. Secondly, the coupling relationship between urban expansion and lake change is analysed. Thirdly, the internal relationship between the spatiotemporal characteristics of urban expansion and lake change and urban policies is deeply analysed.
2. Materials and Methods
2.1. Study Area
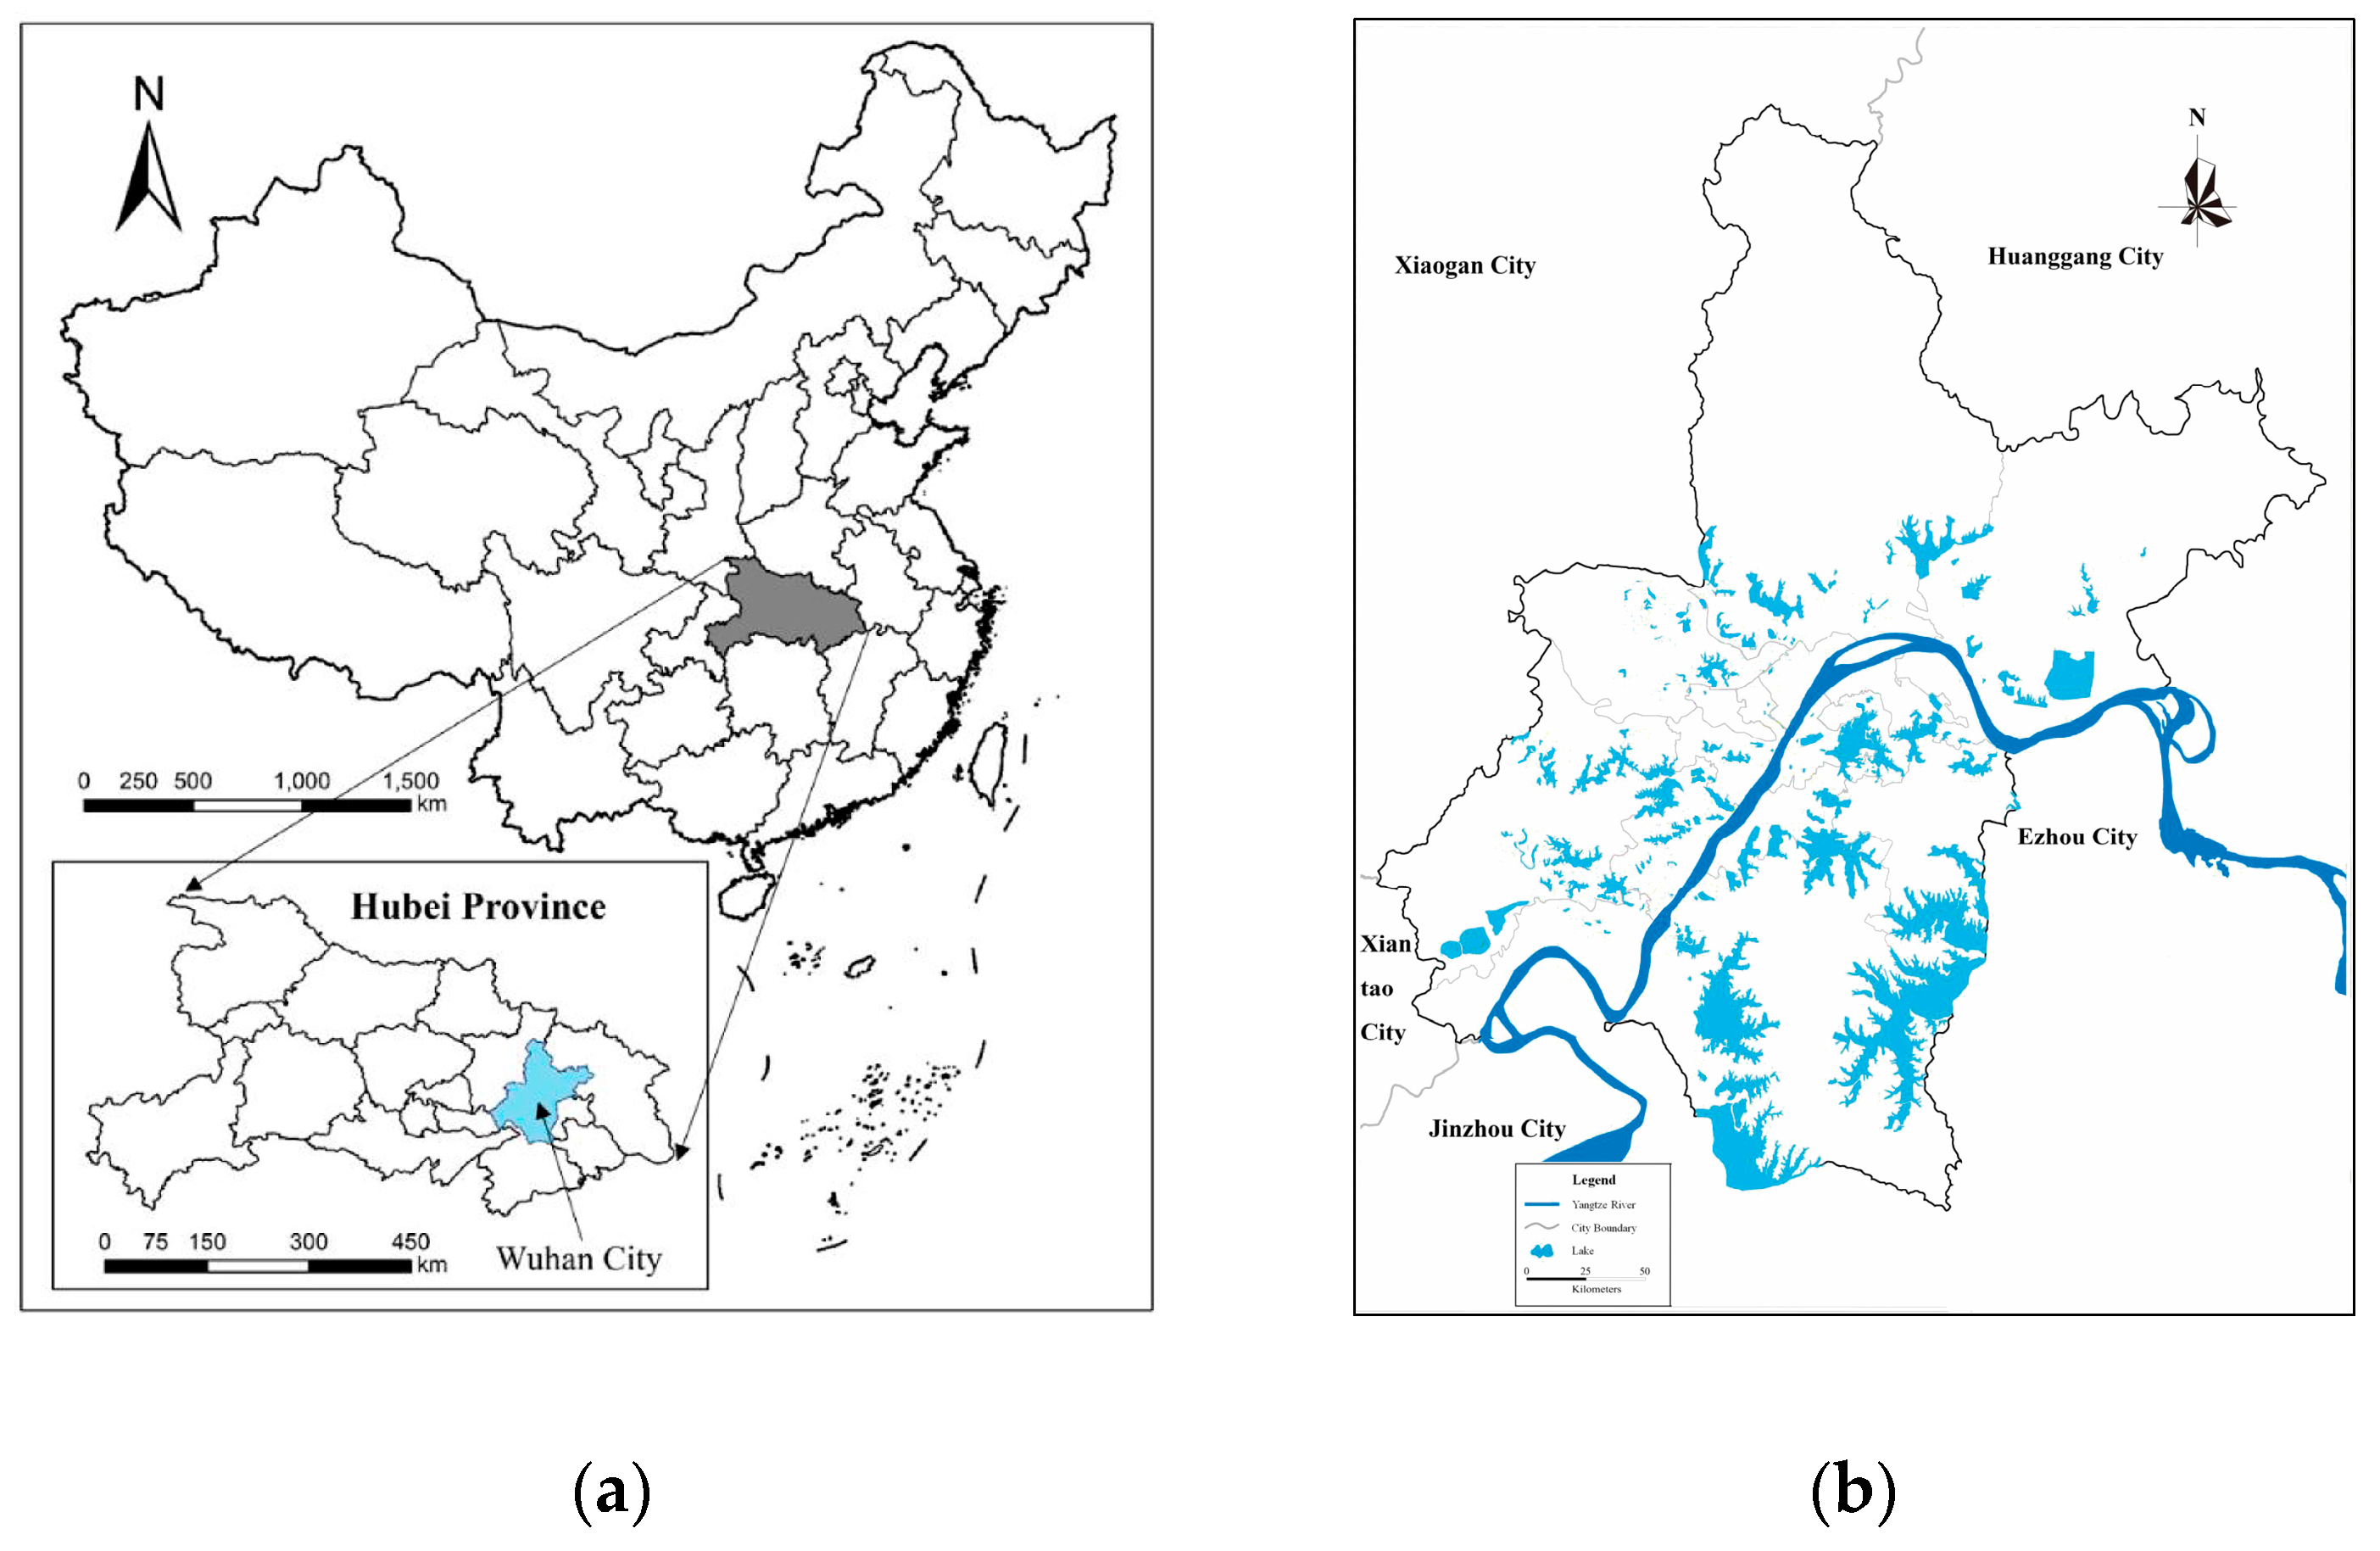
Wuhan city is located in East longitude 113°41′–115°05′ and North latitude 22°29′–31°58′, in the East of Jianghan Plain and in the middle reach of Yangtze River. It is the capital city of Hubei Province (Figure 1a), with a total land area of 8494.41 km2 [23].
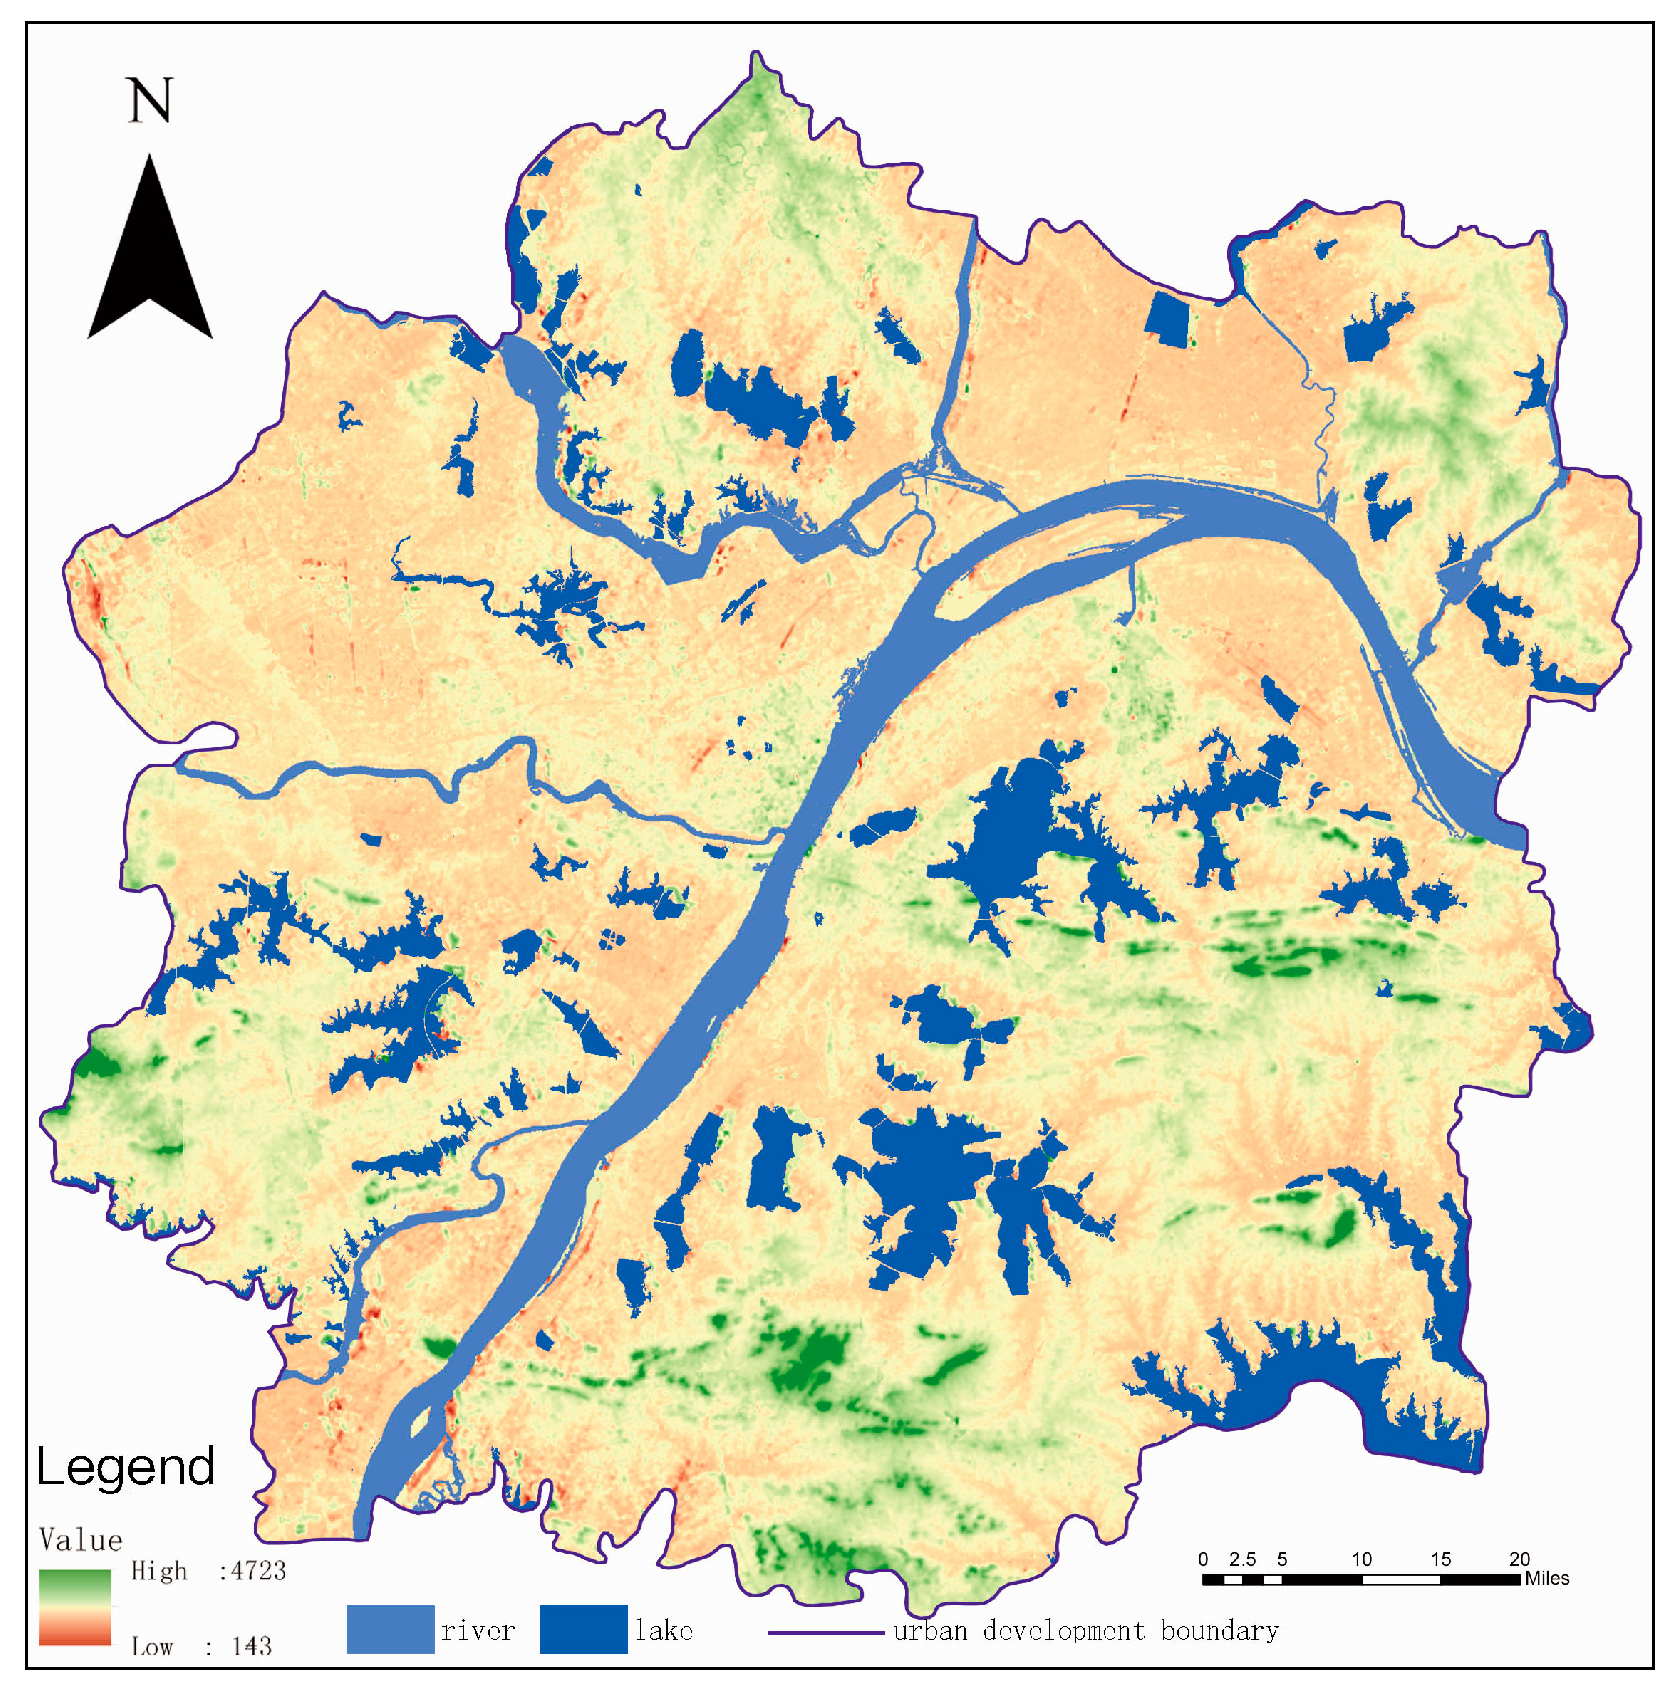
The world’s third longest river, the Yangtze River, and its largest tributary, the Han River, traverse the center of the city, dividing the central district of Wuhan into three parts. The city is crisscrossed by rivers, lakes and harbors, and the water area accounts for a quarter of the total area of the city. Thus, Wuhan is known as the ‘city of hundreds of lakes’ [24].
According to the Wuhan Urban Lake Protection Regulations issued by Wuhan Water Resources Bureau, Wuhan has 166 lakes, 40 of which are located in the central city, among which Tangxun Lake (47.6 km2) is currently the largest urban lake in China [25]. Many large lakes are located on either side of two major rivers, forming a network of lakes (Figure 1b). The lakes in Wuhan can be divided into Dongsha, Tangxun, North, Ink-Longyang-South (North) Taizi and East-West lake systems and other lake groups. The lakes located in the central city are generally small, whereas those in the suburb areas are large [25].
The urban development area designated by the Wuhan municipal government is the main functional domain and the key expansion area of urban space, which comprises the main and new urban area. In the past 40 years, Wuhan’s urban construction activities have been basically performed within this scope. An in-depth study on the change pattern of this region can reveal the correlation between urban expansion and lake change, and the research area of the present work is determined within this range (Figure 2). Table 1 shows the main lakes involved in this study.
2.2. Data Preparation and Preconditioning
2.2.1. Data Collection
Urban land is generally defined as all nonvegitative areas dominated by manmade surfaces (e.g., roads and buildings), including residential, commercial, industrial and transportation lands [27]. On the basis of the definition and most research practices [28,29,30], urban land is similar to an impermeable surface or a built environment. In this study, impervious surface area, lake area and lake fragmentation were used to measure the extent of urban expansion and lake change. In view of factors, such as acquisition time, coverage, cloud cover and resolution ratio, images of eight periods from 1987–2018 were selected as a data set to study urban expansion and changes of major lakes in Wuhan urban area. The remote sensing images used in this study were all gained from a Landsat satellite, and the data used were collected from the geographic information database of the Chinese Academy of Sciences and the United States Geological Survey website. The main image data are shown in Table 2.
Landsat TM and OLI data were preprocessed (e.g., image fusion, re-projection, mosaic, histogram equalization) using ERDAS Imagine version 9.2. Albers Conical Equal Area was used as the re-projection coordinate system and all the images were resampled to the resolution of 15 × 15 m, resulting in a minimum mapping unit or minimum patch of urban land area of 225 m2. The images in 1978, 1992, 1996, 2001, 2005, 2009 and 2013 were geo-encoded and matched to the image in 2018 with the error of less than half-pixel.
2.2.2. Lake Data Extraction
On the basis of factors, such as the type and quality of remote sensing images, the time span of lake area monitoring, the workload of lake area extraction and the extraction accuracy of lake area, remote sensing extraction of Wuhan lakes with long time series was mainly performed by combining MNDWI and artificial visual interpretation. The main process is as follows. Lake shape data were extracted using a water index method, and the extracted lake results were then checked and modified by manual visual interpretation to improve the accuracy of lake extraction.
The MNDWI was improved by Xu [31] on the basis of the NDWI, as shown in Equation (1). The reflectivity of water in the middle infrared band is low, while the reflectivity of buildings and soil in the middle infrared band is relatively large. The contrast between water and buildings and soil can be significantly increased by using the middle infrared band to replace the near infrared band, thereby highlighting water information.
where MIR denotes the middle infrared band, and Green represents the green light wave band. The improved NDWI method significantly enhances the contrast between water body and buildings, reduces the influence of buildings on water body extraction effect to a considerable extent, improves the accuracy of water body extraction, and thus fits better for the extraction of urban water body.
2.2.3. Data Extraction of Urban Built-up Area
An imperious area mainly consists of buildings, asphalt pavement, parking lot and other construction land [32]; it is one of the main land cover types in a city [33,34,35]. The minimum noise fraction (MNF) transform method is a tool used to determine the number of bands within the image data, separate the noise in the data and reduce the computational requirements. It can effectively eliminate the noise and reduce the dimension of an image.
The basic extraction process of urban built-up areas is as follows. Firstly, the MNF method was adopted to reorganise the information. The components with abundant information content were selected and purified using the pure pixel index (PPI). Secondly, the sample was reorganised using N-D divergence method. Finally, the optimal selected end members, including high-reflectance features, low-reflectance terrain, soil and vegetation, were used to decompose mixed pixels.
Linear spectral mixture model is the most commonly used and operable method in spectral mixture analysis. The reflectance of a pixel at a given band is defined as the linear combination of the reflectance of the fundamental components of a pixel and the proportional weight coefficient of the pixel area. The linear spectral mixing model is expressed as follows [36]:
where Db is the reflectance of band b, N is the number of pixel end member, aij is the greyscale value of the ith terminal element at the jth wave point; mi is the proportion of the ith end member in the pixel and eb is the error term in band b. The model meets two constraints simultaneously.
The analysis of the relationship between impervious surface and the four components shows that the high- and low-reflectance surface element contributes the most to the impervious surface, whereas the impervious coverage of soil and vegetation end members is extremely small [37]. Thus, impervious layer coverage can be considered the sum of high- and low-reflectance ground object coverage. Therefore, the calculation model of urban impervious layer coverage is as follows:
where R(imp,b) is the reflectance of the impervious layer in band b; R(low,b) and R(high,b) stand for the low and high reflectance of band b, respectively; fhigh and flow represent the proportion of high- and low-reflectance end elements; fhighflow > 0 and fhigh + flow = 1; and eb is the residual error of the model. The MNDWI was used to perform mask calculation on the water body before calculating the coverage of impervious surface to avoid confusing the water body with low-reflectance ground objects, which can affect the accuracy of extraction.
2.3. Data Processing Methods
2.3.1. Calculation of Lake Change Index
The lake area change first reflects the change of the total amount of the lake. By analysing the change of the total area of the lake, the overall changing pattern and spatial evolution trend of the lake change can be revealed accurately. The lake variation amplitude can be calculated as follows:
where L1 is the total range of changes in the lake during the study period. If L1 > 0, then the lake area has increased; otherwise, the lake area has decreased. L2 is the annual variation range of the lake during the study period. Ua and Ub represent the area of lakes at the beginning and end of the study respectively (km2). T is the number of years studied.
Quantitative analysis was performed using the lake change intensity index to describe in detail the variance of different lakes in different periods. Thus, an index that measures the variance of lake areas was acquired, the equation of which is shown as follows:
where C is the area intensity index of the lake evolution, ∆Aba is the areal changes within the period from a to b, and Aa is the total area of the lakes during the year a (km2).
A lake change index model was constructed to measure the lake changes systematically. The model consists of two primary indicators and five secondary indicators (Table 3). The two primary indicators are the lake area change index and the lake fragmentation index. The index of lake area change was divided into mean area (MA) and main shoreline length (MSL), which were used to reflect the average level of lake area and shoreline length in each year, respectively. The calculation method is as follows:
where A is the total area of lakes (km2), L is the total shoreline length (km) and N is the number of lakes.
The indicators of lake fragmentation were divided into boundary density index (BDI), area weighted mean shape index (AWMSI) and area standard deviation index (ASDI). Lake BDI is an important index for the analysis of the shape of the lake and reveal the degree of land division, which is also a direct reflection of the degree of lake fragmentation. The higher the BDI is, the higher the degree of lake fragmentation will be. The calculation method is as follows:
where E is the total length of the boundary of the lakes (km), and A is the total area of the lakes (km2).
The more irregular and complex the lake shape is, the more likely the lake will be broken. However, as the plot area increases, the influence caused by the irregular shape will be relatively weakened. On the basis of the correlation, the AWMSI is taken as one of the indicators to measure the degree of lake fragmentation, which can be calculated as follows:
where n is the number of lakes, Pi is the circumference of the lake, ai is the area of the lake (km2) and A is the total area of the lake (km2).
The standard deviation can directly reflect the dispersion degree of the entire data set. Moreover, it can better reflect the relationship between large and small lakes compared with the fragmentation index. Therefore, the ASDI is applied to simulate the fragmentation index for the calculation of lake fragmentation, which can be expressed as follows:
where N is the number of lakes, ai is the lake area (km2) and μ is the arithmetic average of the lake areas.
2.3.2. Calculation of Urban Expansion Rate
The annual urban expansion rate (AER) of each city during the eight neighboring periods from 1978–2018 was calculated using the method of Seto et al. [38], which converts urban expansion into a standard metric that removes the size effect of urban land to facilitate the comparison across various periods.
where Ustart is the urban area at the initial time (km2), Uend the urban area at the end time (km2), and d the time span of the period in years.
2.3.3. Data Standardisation Process
Given that the selected indicators have differences in dimension and quantity, the data must be standardised prior to analysis. All indicators could be divided into positive and negative categories, in which the greater the positive indicator is, the more favorable the conditions for the development of the system will be. On the contrary, the greater the negative indicator is, the more unfavorable the conditions for the development of the system will be. The sets of indicators were partitioned, and the indicators were then converted into dimensionless values, as shown as follows:
Positive indicators:
Negative indicators:
where i denotes the year; j represents the index; rij is the standardised value; xij is the original value; and max{xj} and min{xj} are the maximum and minimum values of index j, respectively. After being treated with the equation, all index values are within the range of [0, 1].
2.3.4. Establishment of the Lake Evaluation Model
The entropy method, which is a technique widely used in various fields, was adopted to determine the weight of each indicator in the lake change system [39]. The principle of this technique is to calculate the weight of each index according to the change of information entropy and index. The steps for calculating the weight of each indicator are as follows.
Ratio of index j in year i:
Entropy:
where the entropy value ej represents the total contribution of all the evaluation objects to the jth indicator:
Entropy redundancy:
where the diversity coefficient fj indicates the inconsistency degree of each evaluation object’s contribution under the jth indicator.
Weight:
where wj means the objective weight of the jth indicator.
Evaluation:
where Yij is the evaluation of the jth indicator in year i; rij is index j in year i.
Lake evaluation indicators in year i:
The weight of each index in the lake evaluation index system was calculated (Table 3):
2.3.5. Coupling Analysis
The concept of coupling is derived from the field of physics [40]. Coupling describes the phenomenon in which two or more systems interact with each other through interactive mechanisms [41]. Therefore, coupling can be used to determine the intrinsic relationship between urban expansion and lake change. The equation of coupling is
where Cn is the coupling degree among multiple systems; mi (i = 1, 2, …, m), mj (j = 1, 2, …, n) represent the comprehensive development score of each system.
However, a disadvantage of this model is that once the value of one subsystem is 0, the coupling degree will be 0 regardless of the value of other subsystems, which obviously does not accord to reality. To overcome this problem, a new model was used on the basis of the statistical coefficient of variation. The revised coupling model is as follows:
where C is the coupling degree between urban expansion and lake change, f(u) is the urban expansion system and g(e) is the lake change system. The coupling coordination degree model of urban expansion and lake change could be further established, shown as follows:
where D is the coupling degree between urban expansion and lake change; T represents the influence degree of urban expansion and lake change; and α and β represent the contributions of urban expansion and lake change to the integrated system, respectively. The value of coefficients α and β is 0.5.
The degree of coupling between urban expansion and lake change can be divided into four primary development stages, which can each be further divided into three tertiary sub-classes. From this division, we developed twelve different tertiary development stages to describe the coupling relation between f(u) and g(e). Table 4 describes the resulting comprehensive index of the development stages of coupling, and the twelve divisions.
3. Results
3.1. Results of Lake Changes
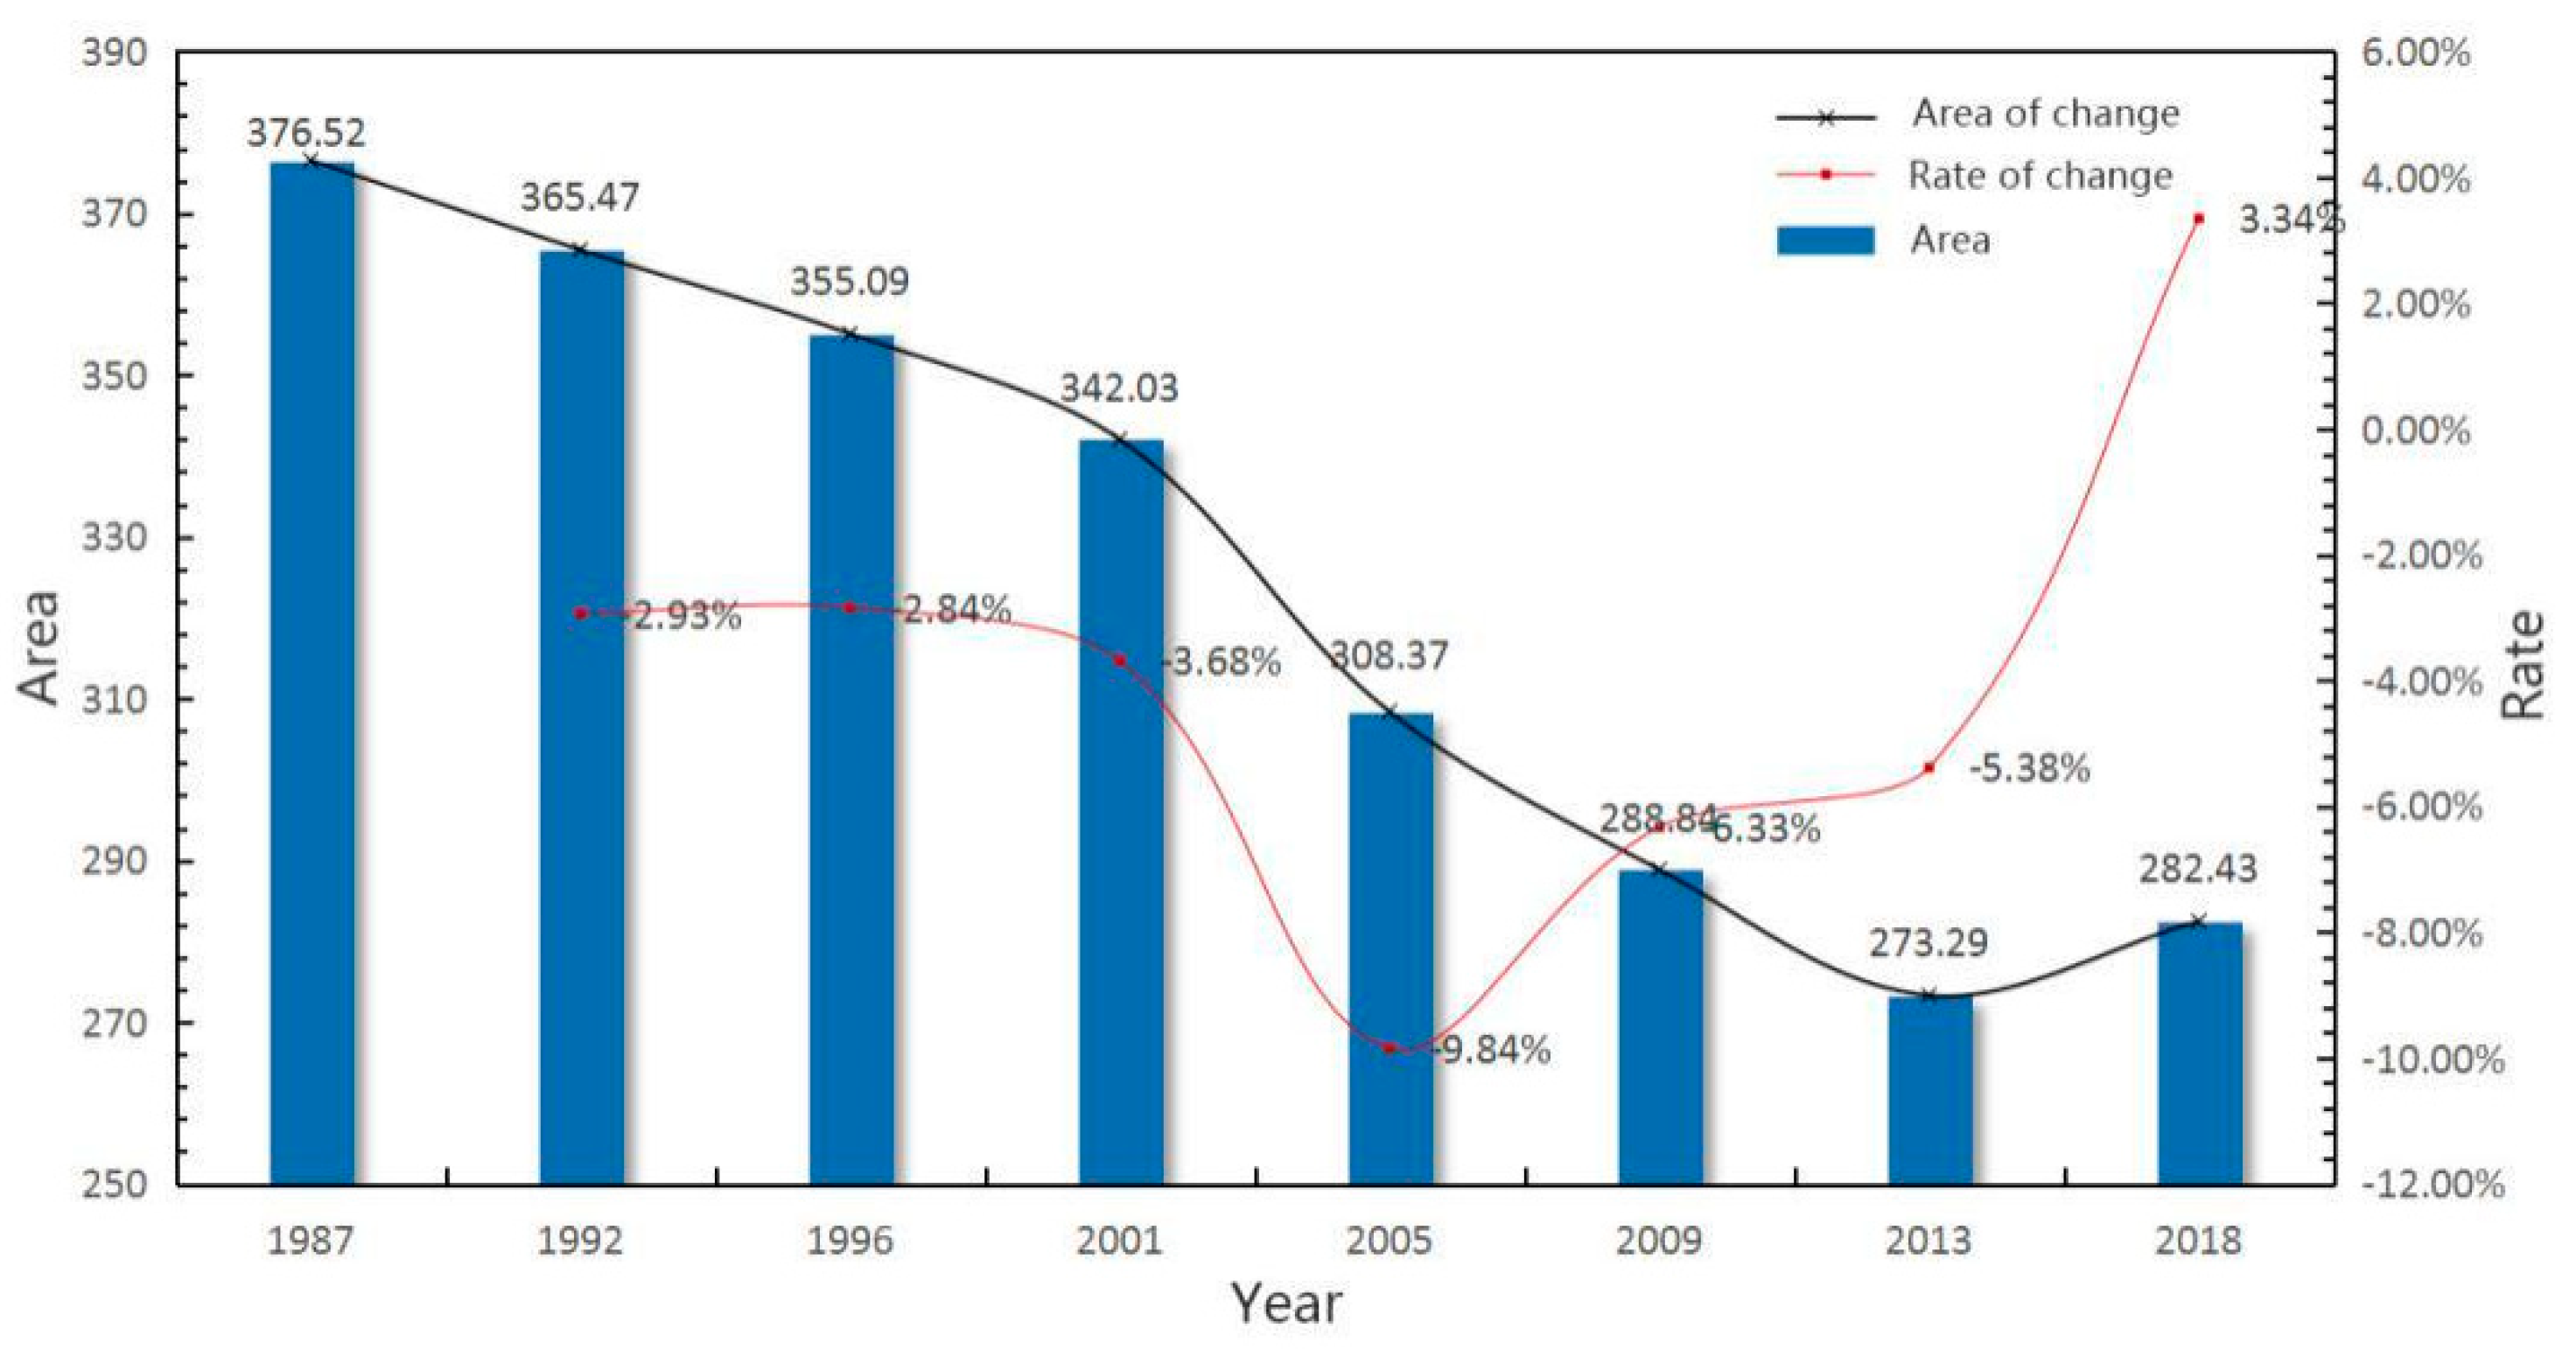
After the lake extraction operation steps in Section 2.2.2, the lake shape data in the study area were obtained through optimisation of vectorisation and manual visual interpretation. Subsequently, the spatial and statistical analysis function of GIS was used to calculate the lake area, degree of fragmentation and other indicators. The results are shown in Figure 3 and Figure 4. On the basis of the analysis of the obtained data, the changes of Wuhan lakes in the past 30 years can be divided into four stages as follows.
(1) From 1987–2001, the lake area decreased at a constant rate.
In 1987, the total area of the lakes in Wuhan urban development area was 376.52 km2; however, in 1992, 1997 and 2001, it decreased by 11.05, 10.38 and 13.06 ha to 365.47, 355.09 and 342.03 km2, respectively, showing a downward trend. Since the 1970s, a large area of the lakes has been reclaimed as land in Wuhan, thereby resulting in a significant reduction in the lake area. Small lakes within the urban built-up areas gradually disappeared, and the lake areas are mainly transformed into land for agricultural and fishery production. Moreover, the degree of lake fragmentation decreased during the process.
(2) From 2001–2005, the lake area decreased rapidly.
The lake area of Wuhan was 342.03 km2 in 2001 and decreased by 33.66 km2 in 2005. In comparison with the decreasing rate of the past 15 years, the decrease rate of this period grew rapidly. In the 1980s, China set off a nationwide real estate development boom, and Wuhan was no exception. However, the lake encroachment caused by real estate development greatly reduced the area of the lakes, some large lakes were filled and/or divided into several small lakes, and lake fragmentation slowly increased.
(3) From 2005–2013, the lake area decreased rapidly.
The lake area of Wuhan was 308.37 km2 in 2005 and decreased by 19.53 km2 in 2009 and 15.55 km2 in 2013. However, the rate of decline in the lake area slowed down. This change gradually occured due to the implementation of Wuhan Lake Regulation [26] in 2002. The phenomenon of lake reclamation is contained to a certain extent, and the lake fragmentation decreased again.
(4) From 2013–2018 the lake area slightly increased.
The lake area of Wuhan was 273.29 km2 in 2013 and increased by 9.14 km2 in 2018. During this period, the Wuhan municipal government and citizens paid more attention to the lake protection, and the measures of lake management and restoration were gradually perfected. The occupied lake was partially restored, and a large number of artificial lakes appeared, with which the lake area increased and the lake fragmentation slightly increased.
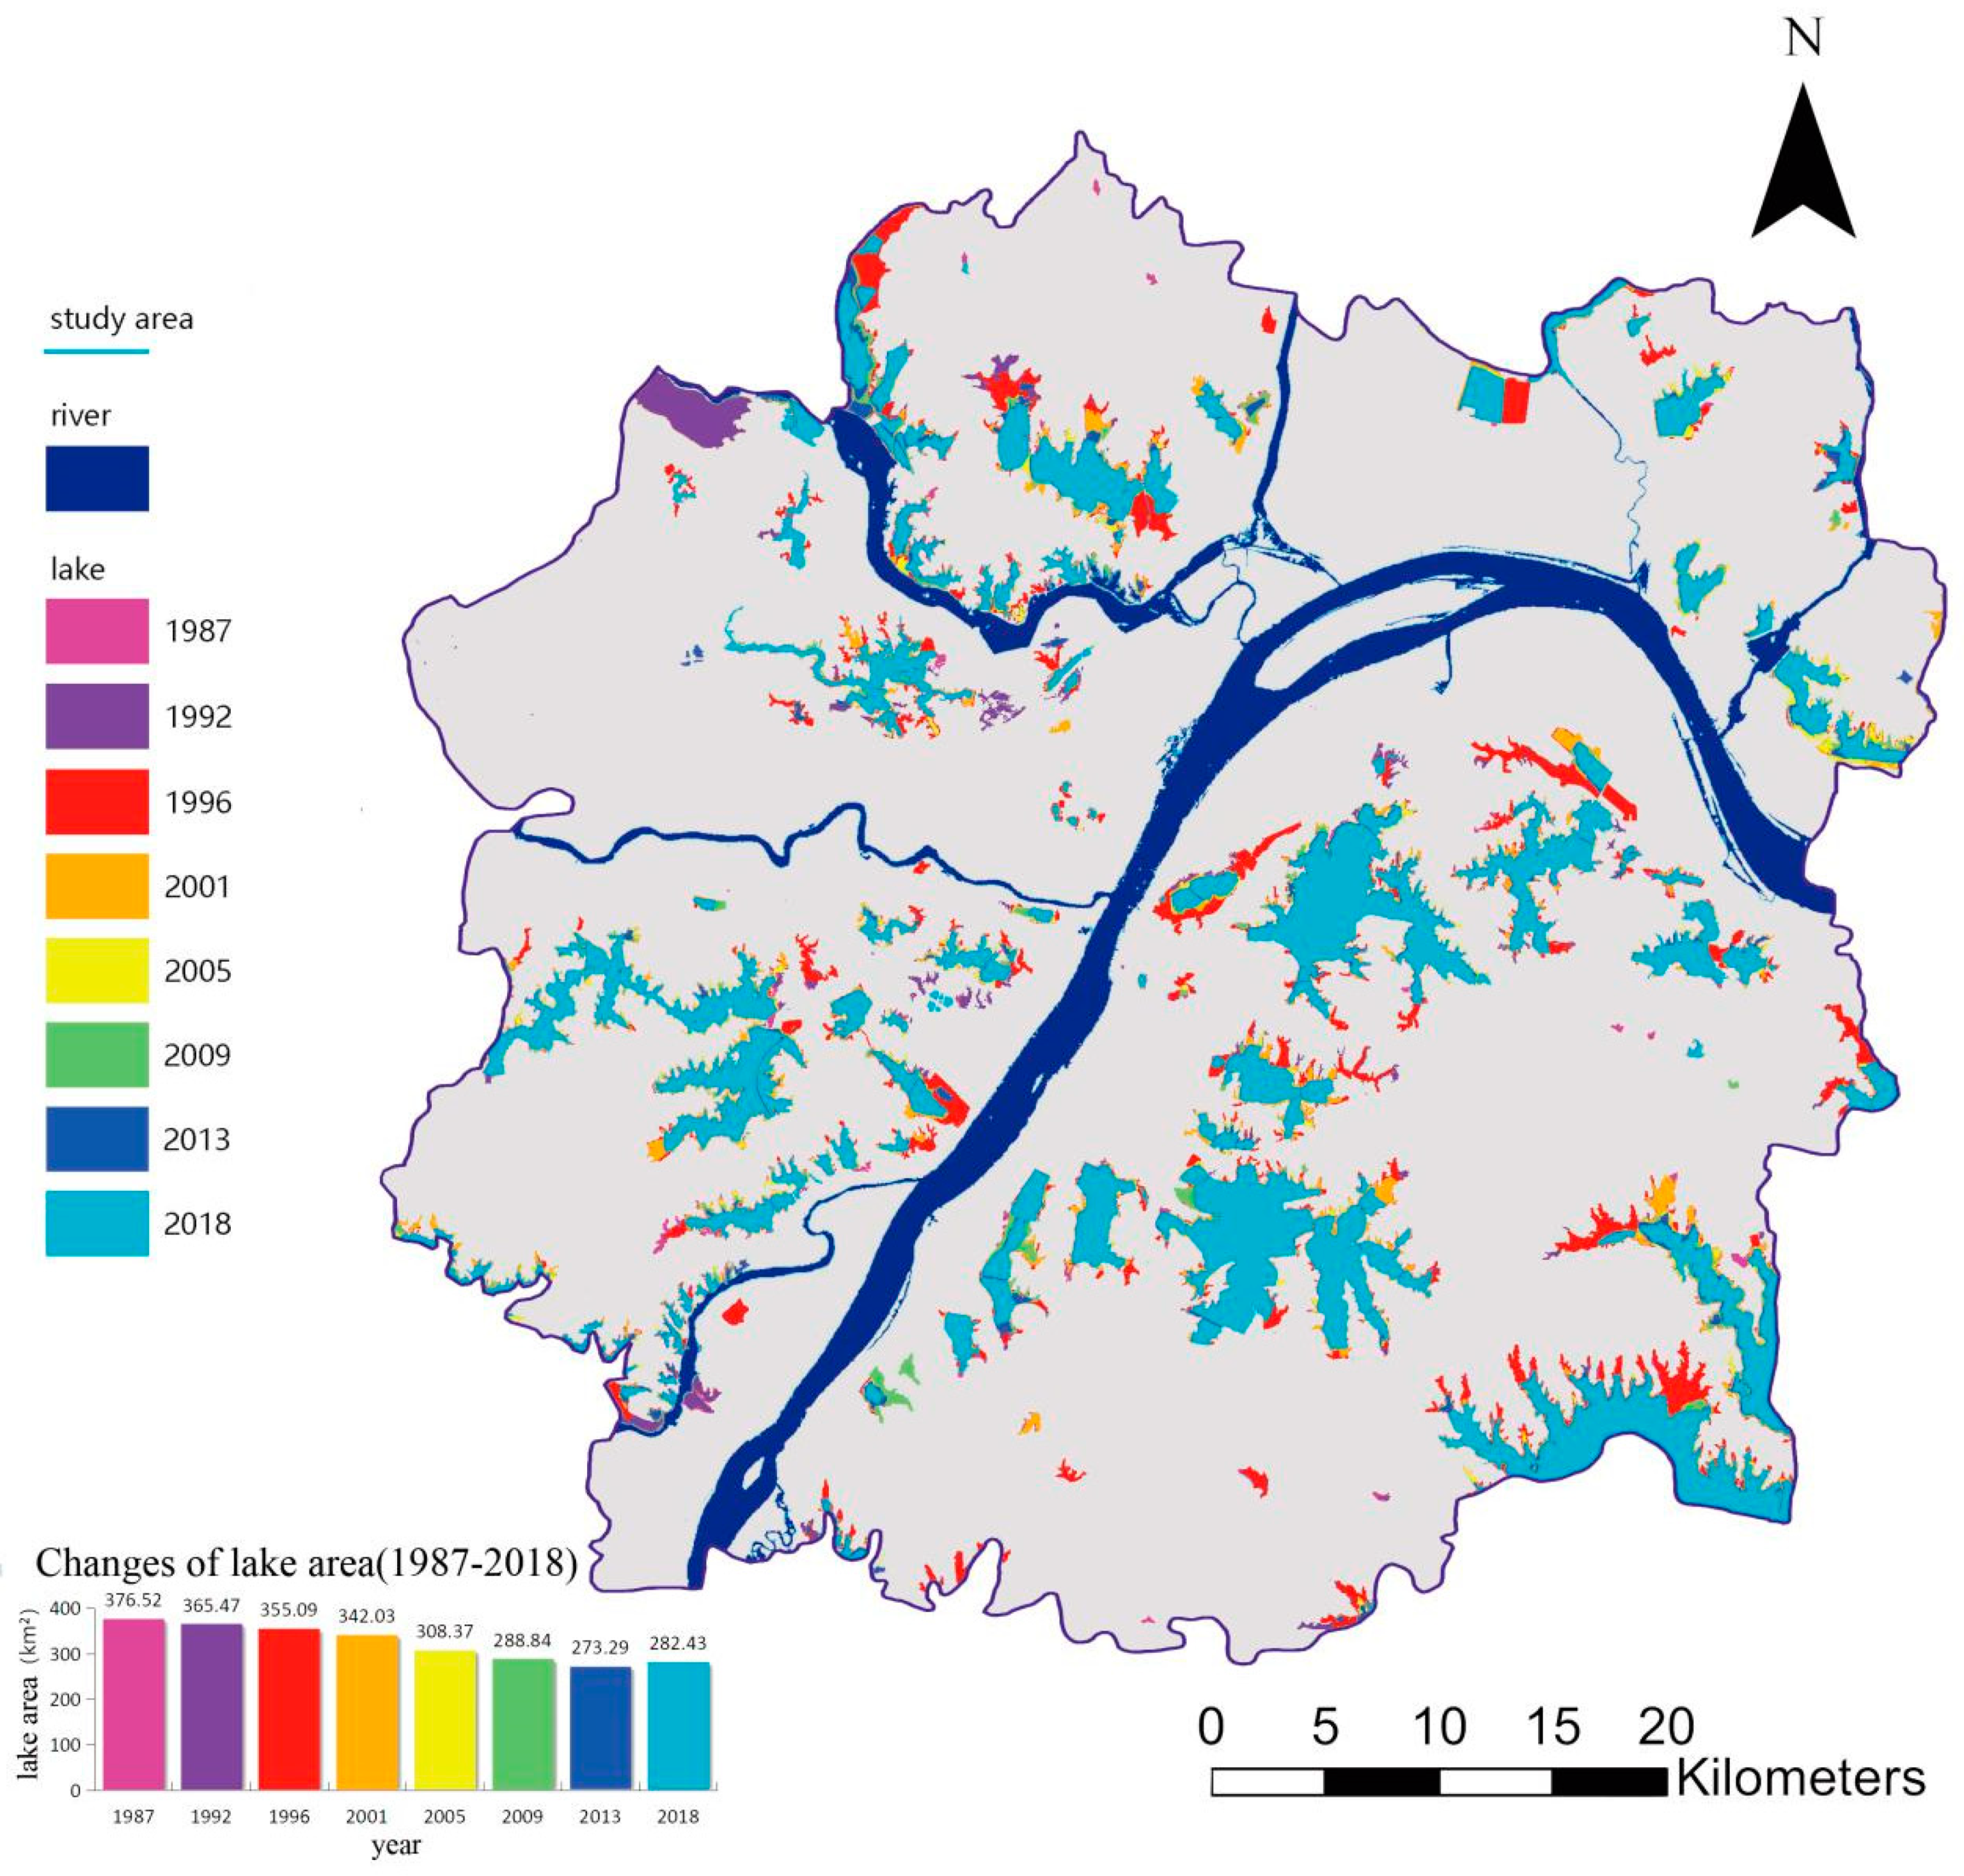
After the collation and superposition of lake graphic data from 1987–2018 in Wuhan urban development area, the lake evolution map from 1987–2018 in the Wuhan urban development area was created, as shown in Figure 4. From the figure, the overall tendency of the lake change was that it gradually reduced from the outside to the inside, and natural lake branch was significant, especially between 2001 and 2005.
3.2. Results of Urban Boundary Changes in Wuhan
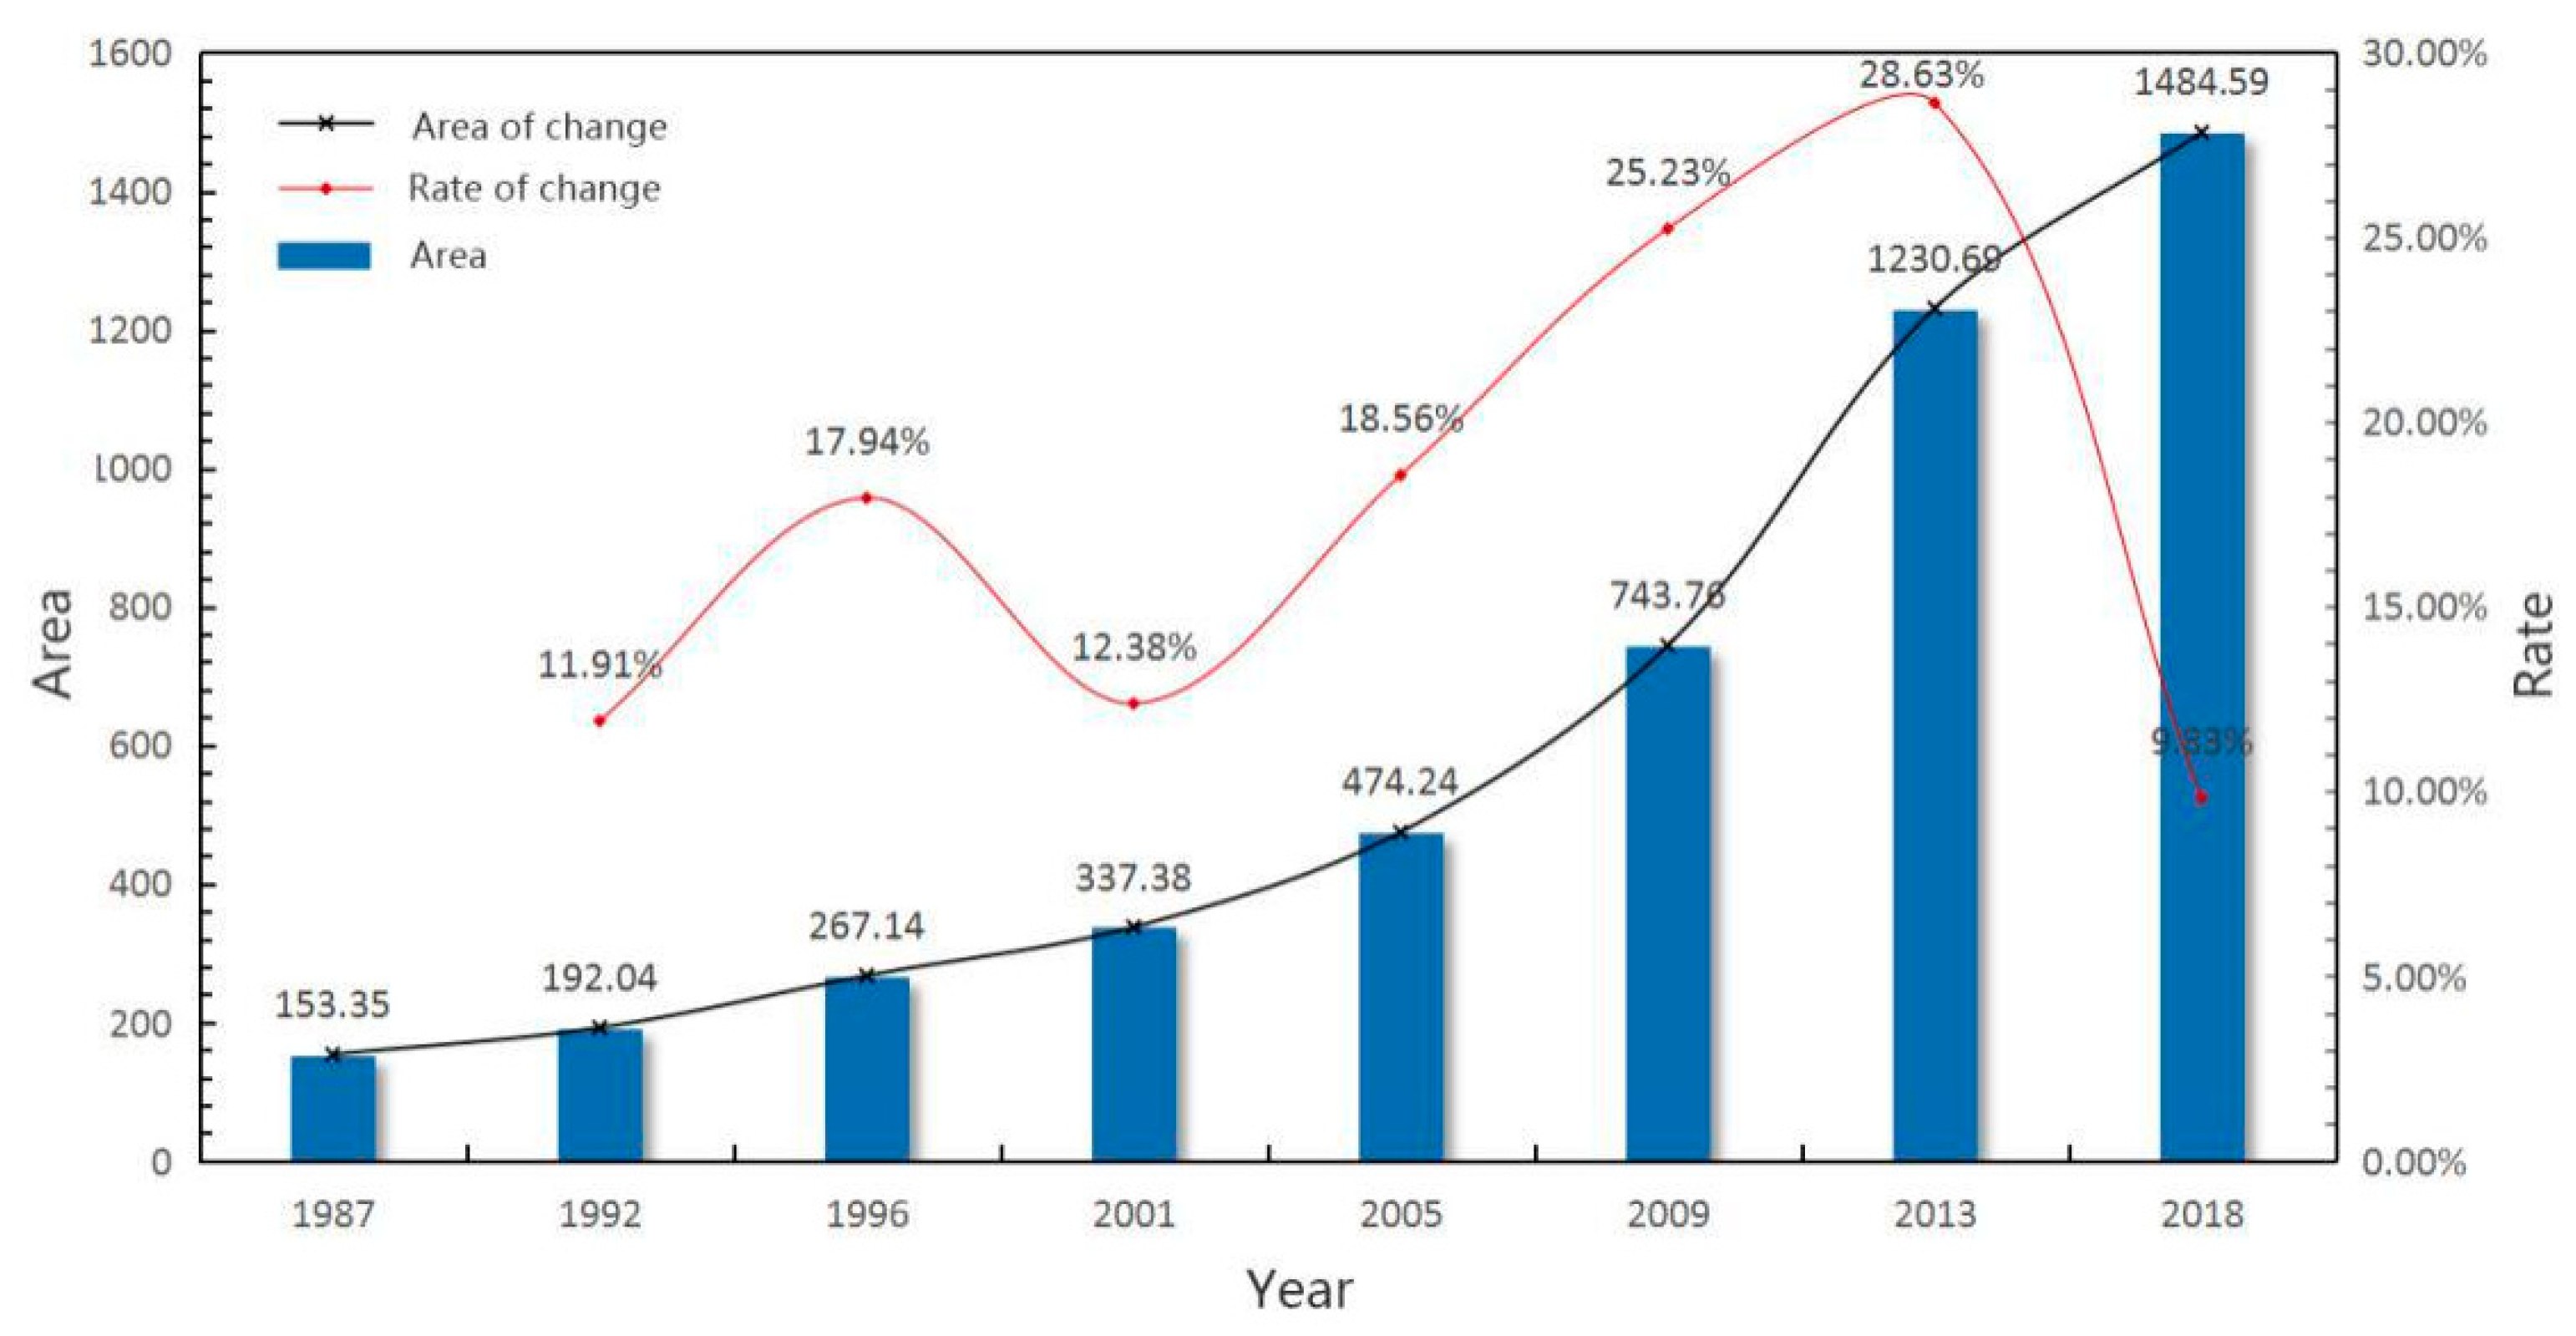
The method described in Section 2.2.3 was adopted to extract the urban built-up areas of Wuhan urban development area in each period, and the results are shown in Figure 5. On the basis of the data in the analysis chart, the built-up areas of Wuhan increased from 153.35 km2 in 1987 to 1484.59 km2 in 2018, indicating a significant urban expansion. The Wuhan built-up areas increased, decreased and then increased again, which is the same as the logistic growth model and can be divided into three stages as follows.
(1) From 1987–2001, the period of fluctuation and slow growth.
In 1987, the built-up area of Wuhan was only 153.35 km2, which increased by 38.69 km2 to 192.04 km2 in 1992. From 1992–1997, it increased by 75.1 km2 to 267.14 km2, and from 1997–2001, it increased by 70.24 km2 to 337.38 km2. The growth rate from 1992–1997 was twice as high as that from 1987–1992, with significant difference. Meanwhile, the growth rate from 1997–2001 was relatively low compared with the previous five years. In the direction of expansion, the newly added urban area was adjacent to the original urban area; the core area of the main urban area expanded significantly; and the newly expanded urban area appeared in the northeast, showing a leap growth. Although the difference was significant from 1992–2001, the expansion speed and direction were consistent, and the suburbs did not change significantly.
(2) From 2001–2009, the period of rapid growth during which the rate of growth gradually increased.
The built-up area of Wuhan city was 474.24 km2 in 2005 and reached 743.76 km2 in 2009. In comparison with the built-up area in 2001, the area increased by 136.86 km2 and 269.52 km2 before and after the period, respectively, with a rapid growth rate. The growth rate kept increasing during the 10 years. In the direction of expansion, it kept on expanding outward from the core areas, without obvious growth in the suburbs. Therefore, from 2000–2010, Wuhan was in the process of rapid expansion with an increasing growth rate.
(3) From 2009–2018, the period of rapid growth in which the rate of growth gradually decreases.
The built-up area of Wuhan was 1230.69 km2 in 2013 and reached 1484.59 km2 in 2018. In comparison with the built-up area in 2009, the area increased by 486.93 km2 and 253.90 km2. The built-up area still maintained a rapid growth rate; however, the growth rate kept decreasing, and the growth direction expanded outward from the core area of the main urban area. Therefore, Wuhan was in the process of rapid expansion with a declining growth rate from 2009–2018.
On the basis of the lake evolution data, the evolution diagram of the combination of the two systems in the urban development area of Wuhan during the eight periods from 1987–2018 was drawn, as shown in Figure 6:
From 1987–1992, Wuhan experienced a leap growth and generally expanded to the Northeast direction, whereas the main urban area expanded to the West and East. From 1992–1996, the Northeast urban area merged with the main urban area and expanded around the area at the same time. Meanwhile, urban built-up areas began to appear in the Southwest. From 1996–2001, the built-up area in the Southwest developed further, and the main urban area expanded further. From 2001–2005, the main urban area merged with the southwest urban area, and the urban area expanded around it, especially in the Southeast corner. From 2005–2009, the urban area of Wuhan underwent a substantial expansion, among which the expansion scope of Northeast, Southwest and West was significant. From 2009–2013, the urban area still expanded from the central urban area. From 2013–2018, it still expanded around the main urban area.
3.3. Case Analysis of Tangxun Lake
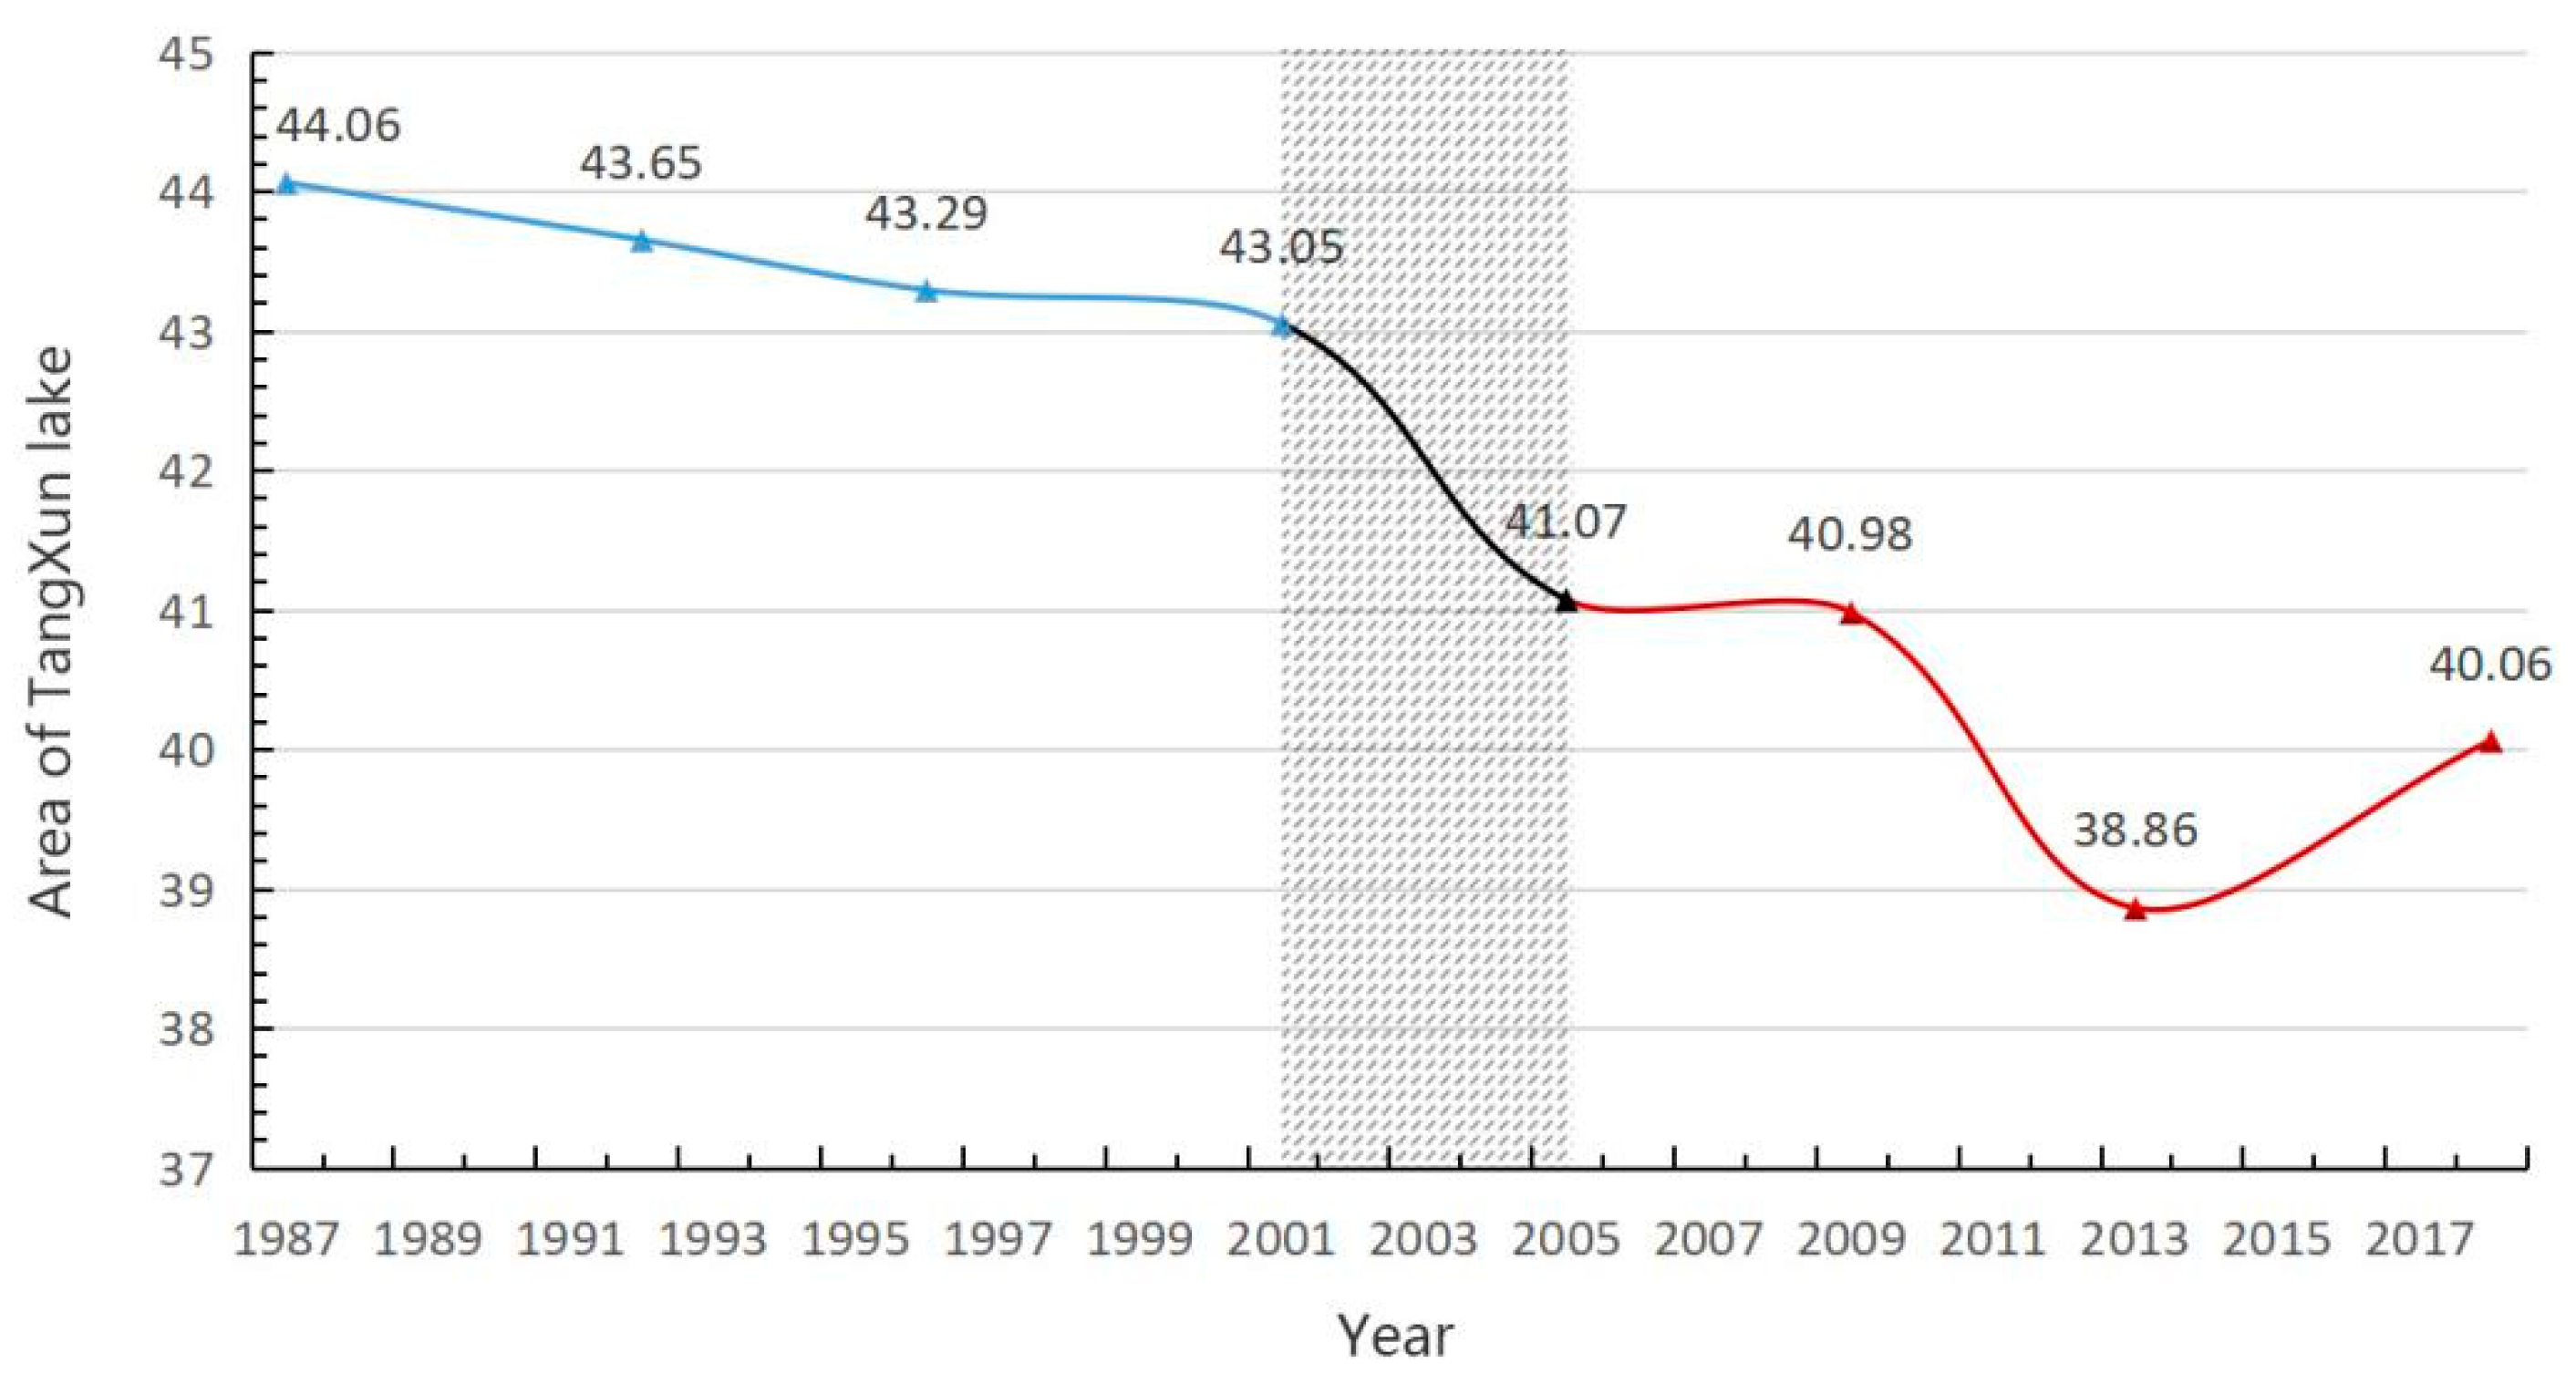
The expansion of Wuhan’s urban built-up areas has a huge impact on lake area changes. Particularly, when the boundary of the urban built-up areas expands and passes through the lake area, the lake area of that district will show a significant decline. Taking the change of area of Tangxun Lake as an example (Figure 7), the change of this lake is divided into three stages as follows.
(1) From 1987–2001, the water body part of the built-up areas changed slowly at the stage when the lakes were not entire engulfed in built-up areas. From 1987–2001, the area of Tangxun Lake was 44.06, 43.65, 43.29, and 43.05 km2, which decreased by 0.41, 0.36, and 0.24 km2 compared with the previous period. As a result of land reclamation activities, the lake areas decreased slowly and transformed into agricultural and fishery land.
(2) From 2001–2005, the built-up areas gradually engulfed the lake water body, and the water areas changed dramatically. From 2001–2005, the built-up areas expanded slowly, and the boundary line moved slowly across the district of Tangxun Lake. During this period, the area of Tangxun Lake decreased by 1.98 km2 from 43.05 km2 to 41.07 km2, which was more than the total area of the lake reduced in the previous 15 years. During this period, given the high-intensity urban development, a large number of water body of Tangxun Lake was lost, which had a dramatic impact on the lake areas.
(3) From 2005–2018, the Tangxun Lake was entirely engulfed, and the water body area thus changed significantly. The lake area still decreased at a rapid rate from 2005–2013 due to insufficient attention paid to the implementation of Wuhan Lake Regulations in 2002 at the initial stage of its promulgation. Thereafter, in 2013–2018, the lake area increased by 1.2 km2 from 38.86 km2 to 40.06 km2 due to the gradual improvement of various measures for lake protection.
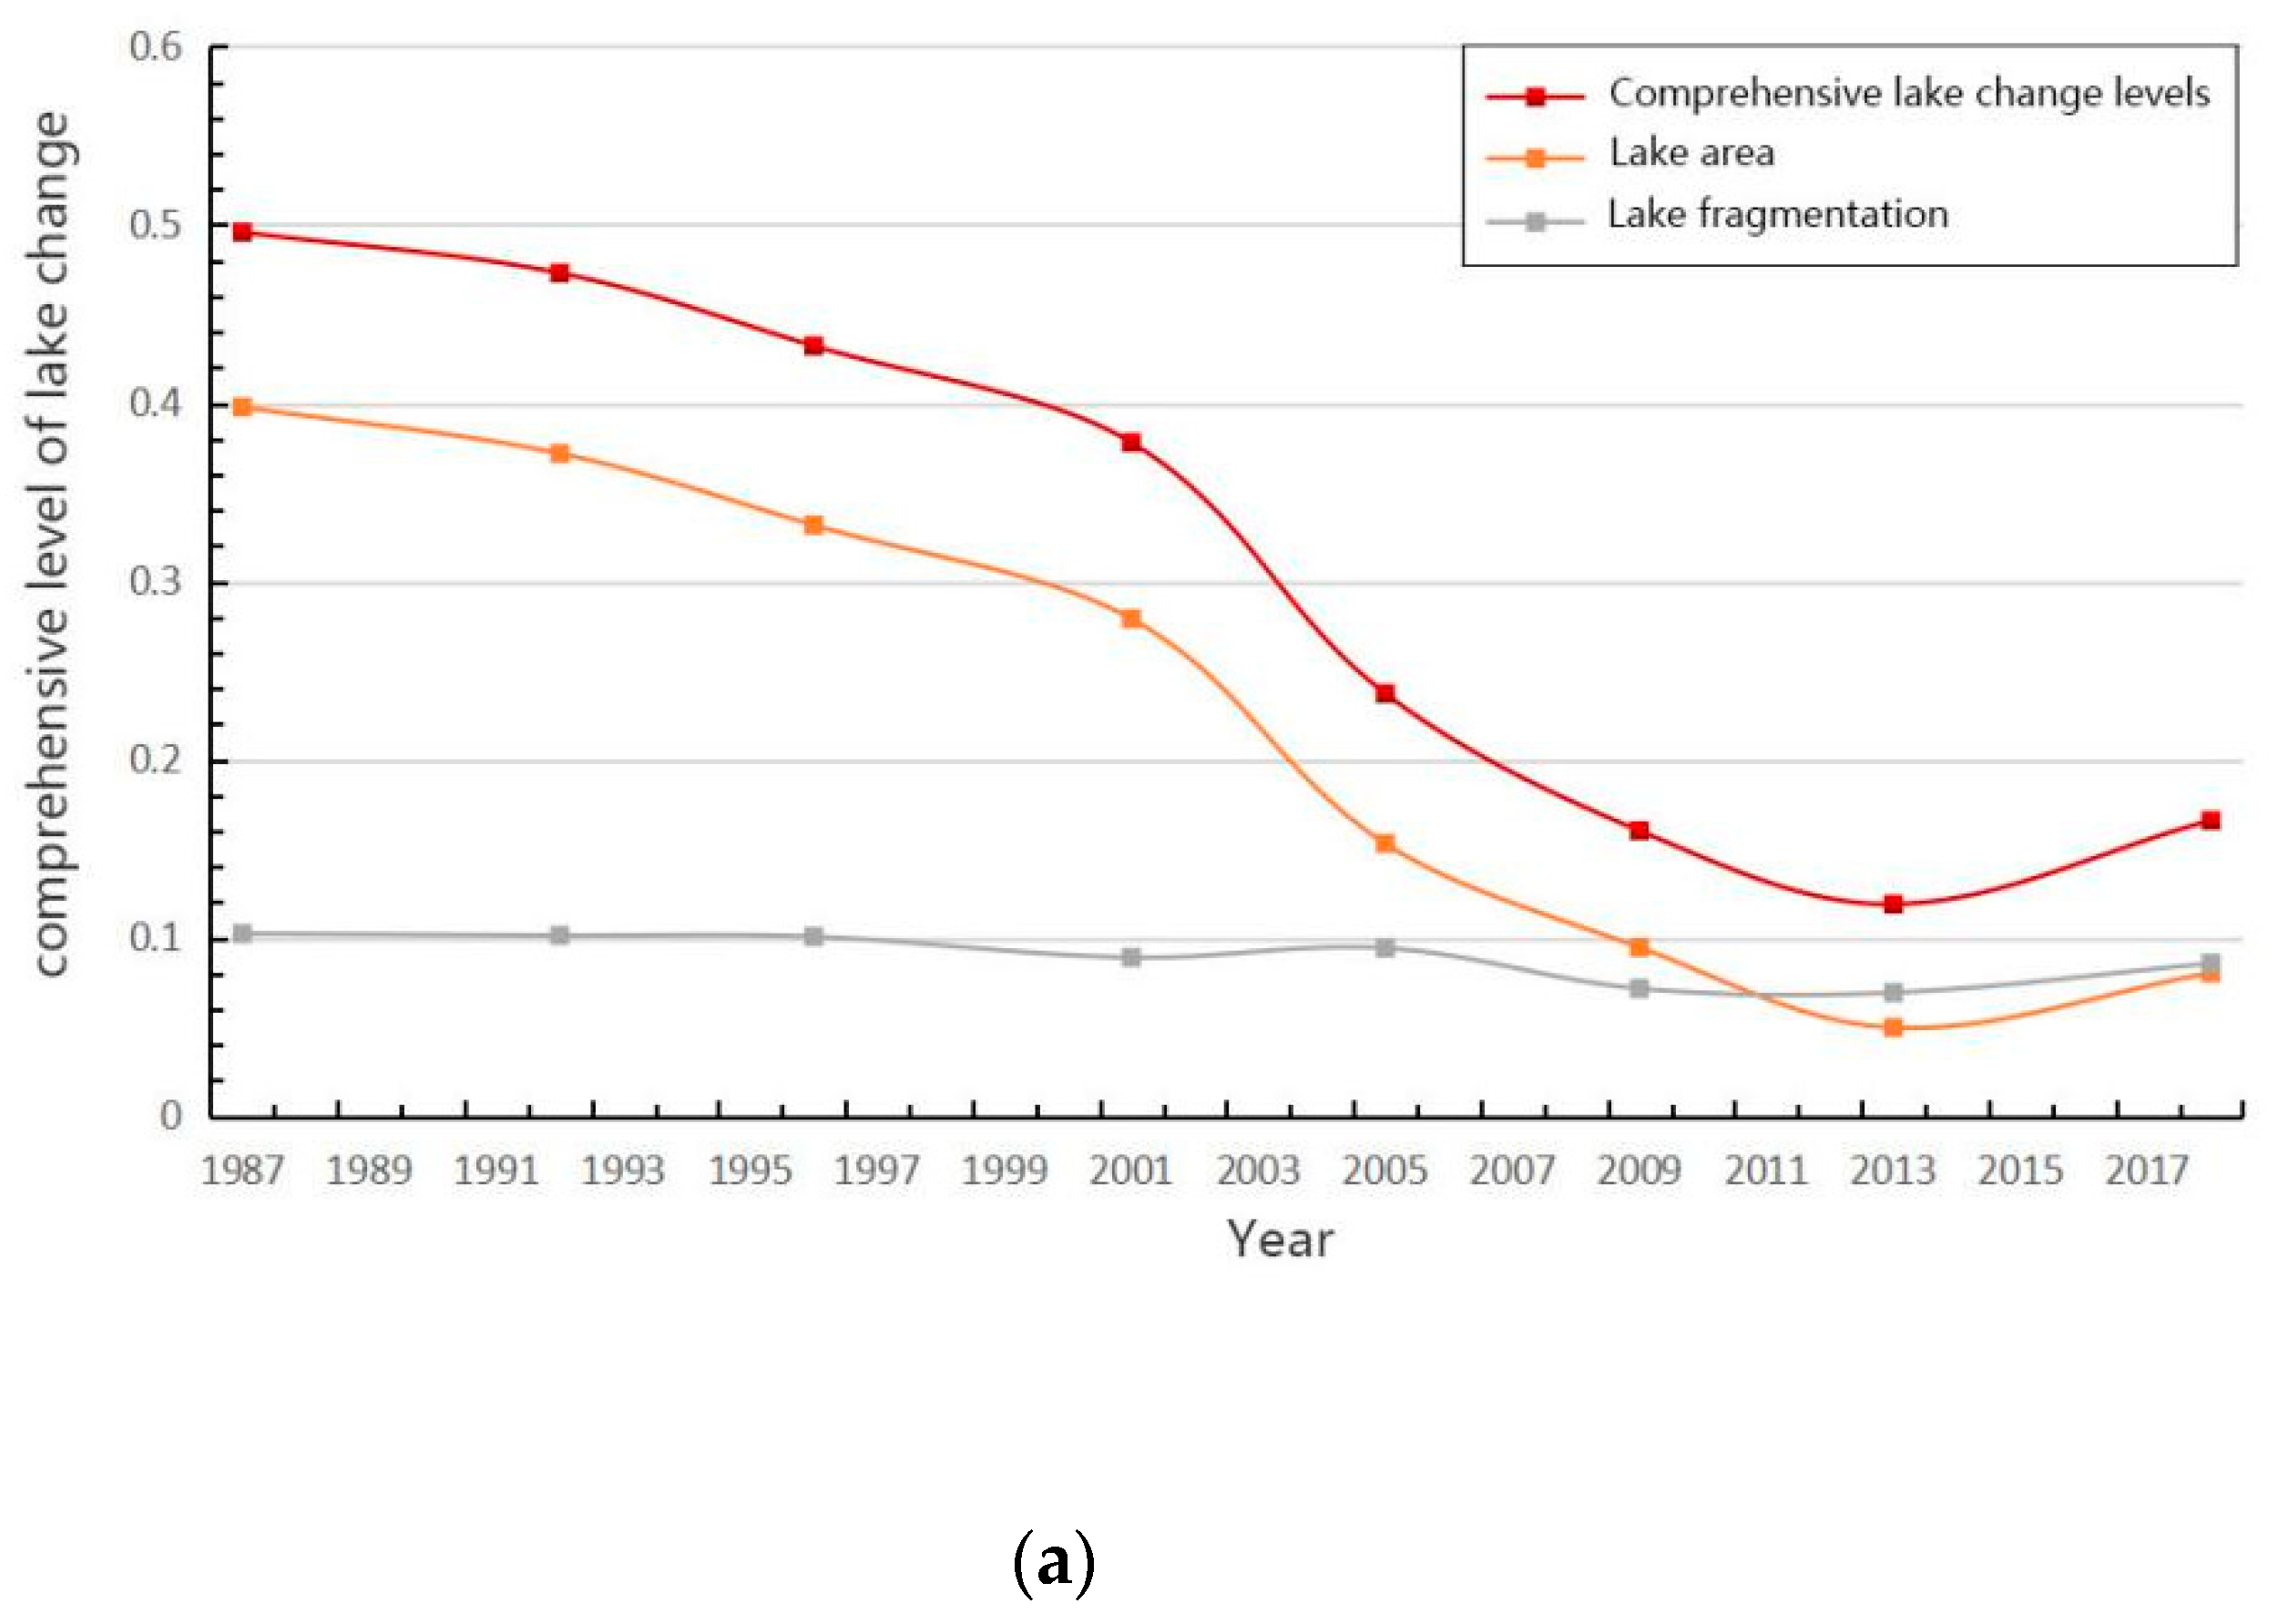
3.4. Results of Coupling Relationship
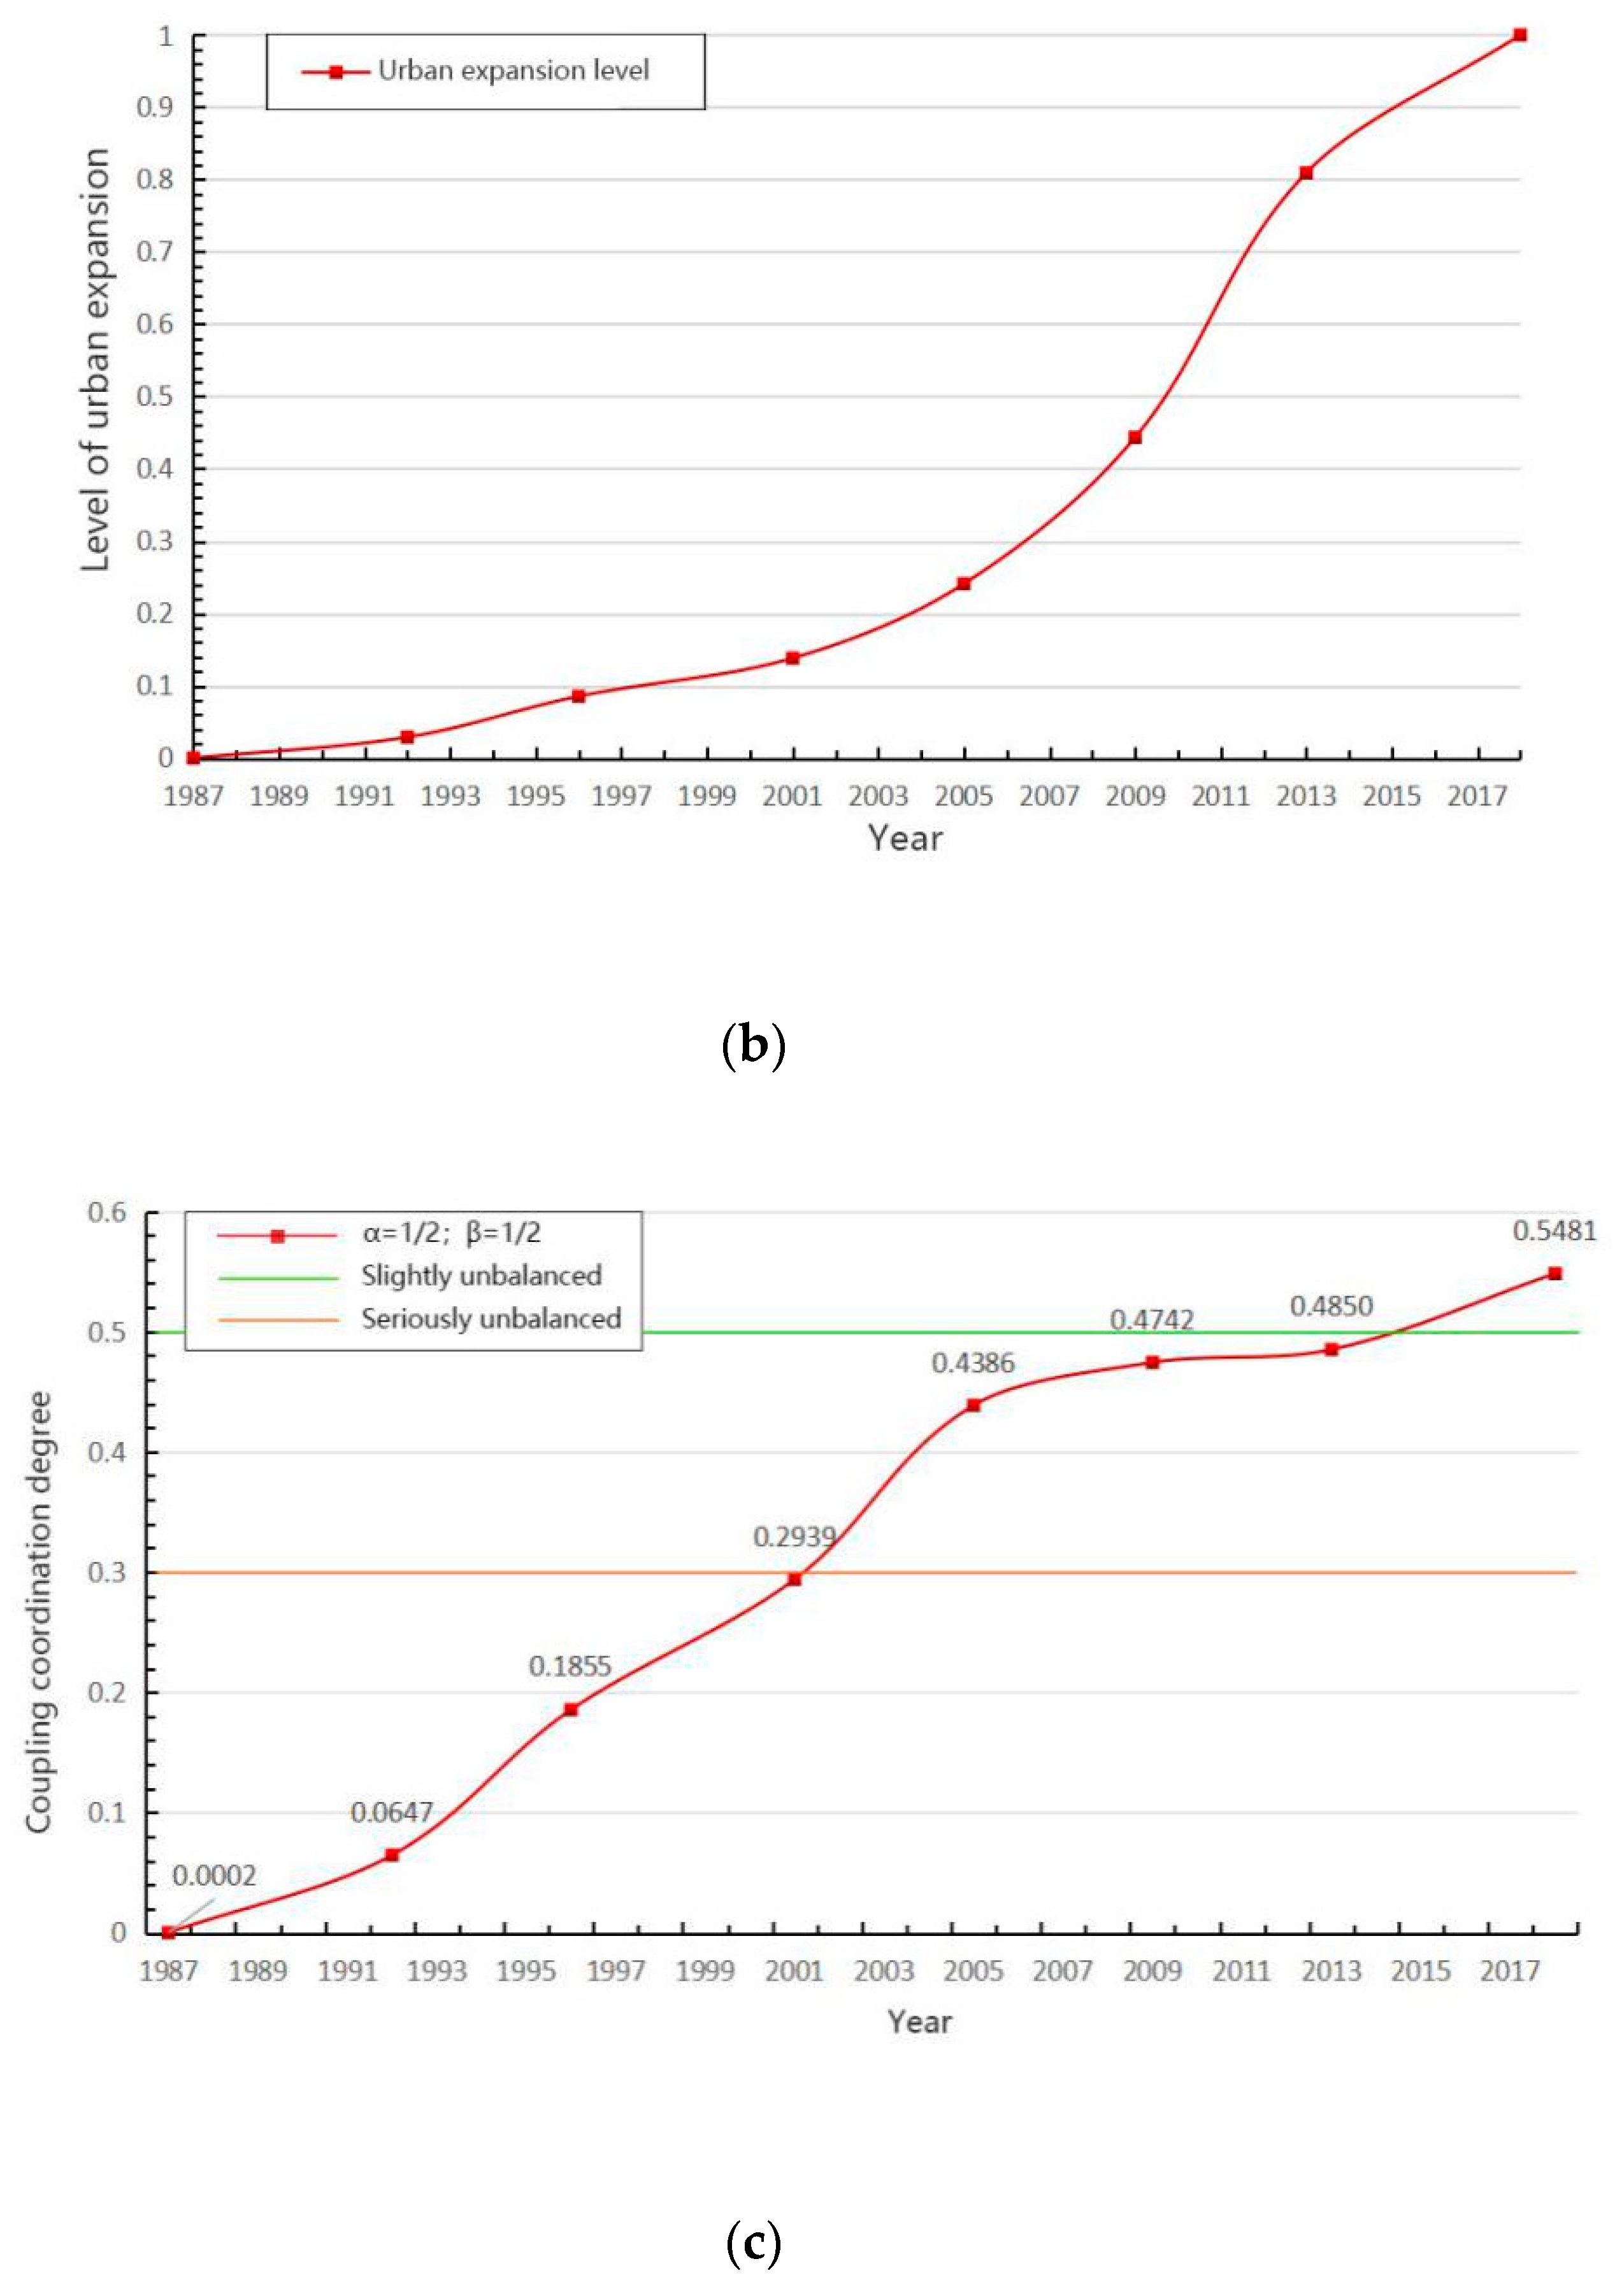
Using the methods described in Section 2.3.3 and Section 2.3.4, the comprehensive levels of lake change and urban expansion from 1987–2018 were evaluated, the results were shown in Figure 8a,b, respectively.
Then the method described in Section 2.3.5 was adopted to calculate the coupling degree between built-up area and lake evolution of Wuhan development area, and the results are shown in Figure 8c.
The coupling degree between built-up area and lake evolution of Wuhan development area from 1987–2018 in a fixed year was calculated using the preceding formula, as shown in Figure 8. From 1987–2018, the coupling degrees between urban built-up areas and lake environment were nearly below 0.3 before 2003 and were between 0.3 and 0.7 after 2002. Table 4 shows that the relationship between urban built-up areas and lakes gradually developed from nearly irrelevant to harmonious coexistence. The coupling degree generally showed an upward trend; however, the increasing rate of the coupling degree kept changing. The coupling degree was almost stable from 2005–2013 and rose again after 2013.
In different stages of development, the relationship between Wuhan built-up areas and lake areas shows different patterns. From 1987–1997, the coupling degree kept increasing; however, the growth trend gradually slowed down; the initial stage of mutual influence between the two gradually turned into an antagonistic relationship. From 1997–2005, the coupling between the two increased; however, the upward trend gradually slowed down. From 2005–2013, the coupling degree between the two maintained a relatively slow growth. In 2013–2018, the coupling degree began to grow again at a rapid rate. Therefore, the coupling relationship between Wuhan urban built-up areas and the lake areas can be divided into four stages as follows.
(1) From 1987–2001, in the stage of increasing coupling degree, the coordination between the Wuhan urban built-up areas and the lake areas was low, and the lakes that urban built-up areas could affect were relatively few. From 1987–2001, the built-up areas grew slowly, whereas the lake areas decreased rapidly. The coupling degree was nearly between 0 and 0.3, which showed a serious unbalanced development relationship.
(2) From 2001–2005, the coupling degree increased continuously, and the relationship between the Wuhan urban built-up areas and the lake areas changed from seriously to slightly unbalanced development stage. After 2001, the coupling degree increased from less than 0.3 to more than 0.3, and it was still rising at a relatively stable rate. The coupling degree between the two gradually turned into an antagonistic relationship, and the expansion of built-up areas had a negative impact on the lake at this stage. At this stage, the growth rate of the built-up areas increased rapidly, and the lake areas gradually decreased.
(3) From 2005–2013, the coupling degree increased slowly, and the relationship between the Wuhan urban built-up areas and the lake areas was slightly unbalanced. After 2005, the lake areas gradually reduced to the extreme, and the urban built-up areas continued to expand rapidly. At this stage, the expansion of urban built-up areas still posed negative effects on the lake environment, presenting an antagonistic relationship. At this stage, the built-up areas were already large, and the growth rate was still high; however, the growth trend gradually slowed down. Meanwhile, the lake areas declined due to events, such as real estate development.
(4) From 2013–2018, the coupling degree kept on increasing, and the relationship between the Wuhan urban built-up areas and the lake areas gradually reached a slightly balanced stage. After 2013, the coupling degree of the two started to grow at a relatively rapid growth rate again; however, the coupling degree gradually rose above 0.5, and the relationship between the two was relatively eased. The coordination degree between the lake areas and the built-up areas showed a rising trend on this stage. Thus, negative effect of urban development on lake change was lifted.
3.5. Result Analysis
3.5.1. Lakes
During the development period of nearly 50 years, the number and area of lakes in Wuhan have been decreasing continuously. During this period, the lake changes of Wuhan have underwent four stages, but basically followed the evolution pattern of large lakes breaking into small lakes and small lakes disappearing (the same as the changes in the degree of fragmentation). The interrelationship between the spatial-temporal characteristics of lake change and urban lake policies was analysed and shown in Figure 9.
In the 1970s, protection awareness of the public was insufficient, and effective regulatory policies from the government were lacking; thus, systematic management measures for the land acquired from land reclamation by filling the lakes were unavailable, and most of the newly increased land was at the free disposal of the citizens who reclaimed the land. As a result, the total area of lakes in Wuhan decreased by nearly 300 km2 or nearly 30%, which is reflected in the fragmentation of large lakes and the increase in the number of small lakes. Yun [42] showed that the natural factors responsible for the shrinking of Wuhan lakes, such as sediment erosion and deposition in the basins, increase the deposition rate of Jianghan lake group rapidly. However, after the 1980s, as the government gradually realised the importance of management and control of lake areas, the policy of returning farmland to lakes was promoted and implemented, and the lake area reduction in Wuhan’s development area gradually slowed down. After the 1990s, Wuhan joined the real estate development boom, and the lake area was further reduced. During this period, the flood disaster in 1996 recovered the total area of the lakes. Under the combined influence of the two, the lake shrinking rate in Wuhan decreased compared with the previous period. Since the beginning of the 21st century, the municipal government first promulgated the Measures for the Protection of Natural Mountains and Lakes in Wuhan [43] in 1999. Then, the Wuhan Lake Protection Regulations [26] were formulated in 2001 and implemented in 2002. However, these regulations did not play a good role in restraining the lake areas from the reduction in the initial stage of implementation due to the insufficient protection awareness of the public and the ineffective implementation of various policies; moreover, the lake areas in Wuhan were further reduced due to the real estate development at that time. Therefore, after 2005, the Wuhan municipal government promulgated and implemented the Detailed Rules of Wuhan Lake Protection Regulations [26]. This regulation has played a significant role in easing the reduction of Wuhan lake areas. Thereafter, the government began to pay more attention to the lakes and introduced more protection policies. Then, in the 2000s, Wuhan introduced many strong regulations. In 2011, Wuhan Water Resources Protection Regulation [44] was promulgated and implemented. The amendment of the Decision of the Standing Committee of the Wuhan Municipal People’s Congress on Amending or Abolishing Partial Local Regulations (Wuhan Flood Control Regulations) [45] was passed in 2010 and has been implemented since 2015. In 2016, the Opinions on the Full Implementation of River Chief System [46] was issued and implemented. In 2018, the idea of the Co-management of Four Types of Water [47] was proposed and issued to build a region-wide ecological water network. Although lake reclamation still existed in areas that were not clearly defined in the Wuhan lake ordinance, the situation of Wuhan lakes has gradually improved with the management as the public has gradually realised the importance of lake protection for the quality of life and consciously responded to the measures of lake protection. With the gradual strengthening of management measures in the 21st century, the lake area reduction rate gradually slowed down, and the lake area tended to be stable.
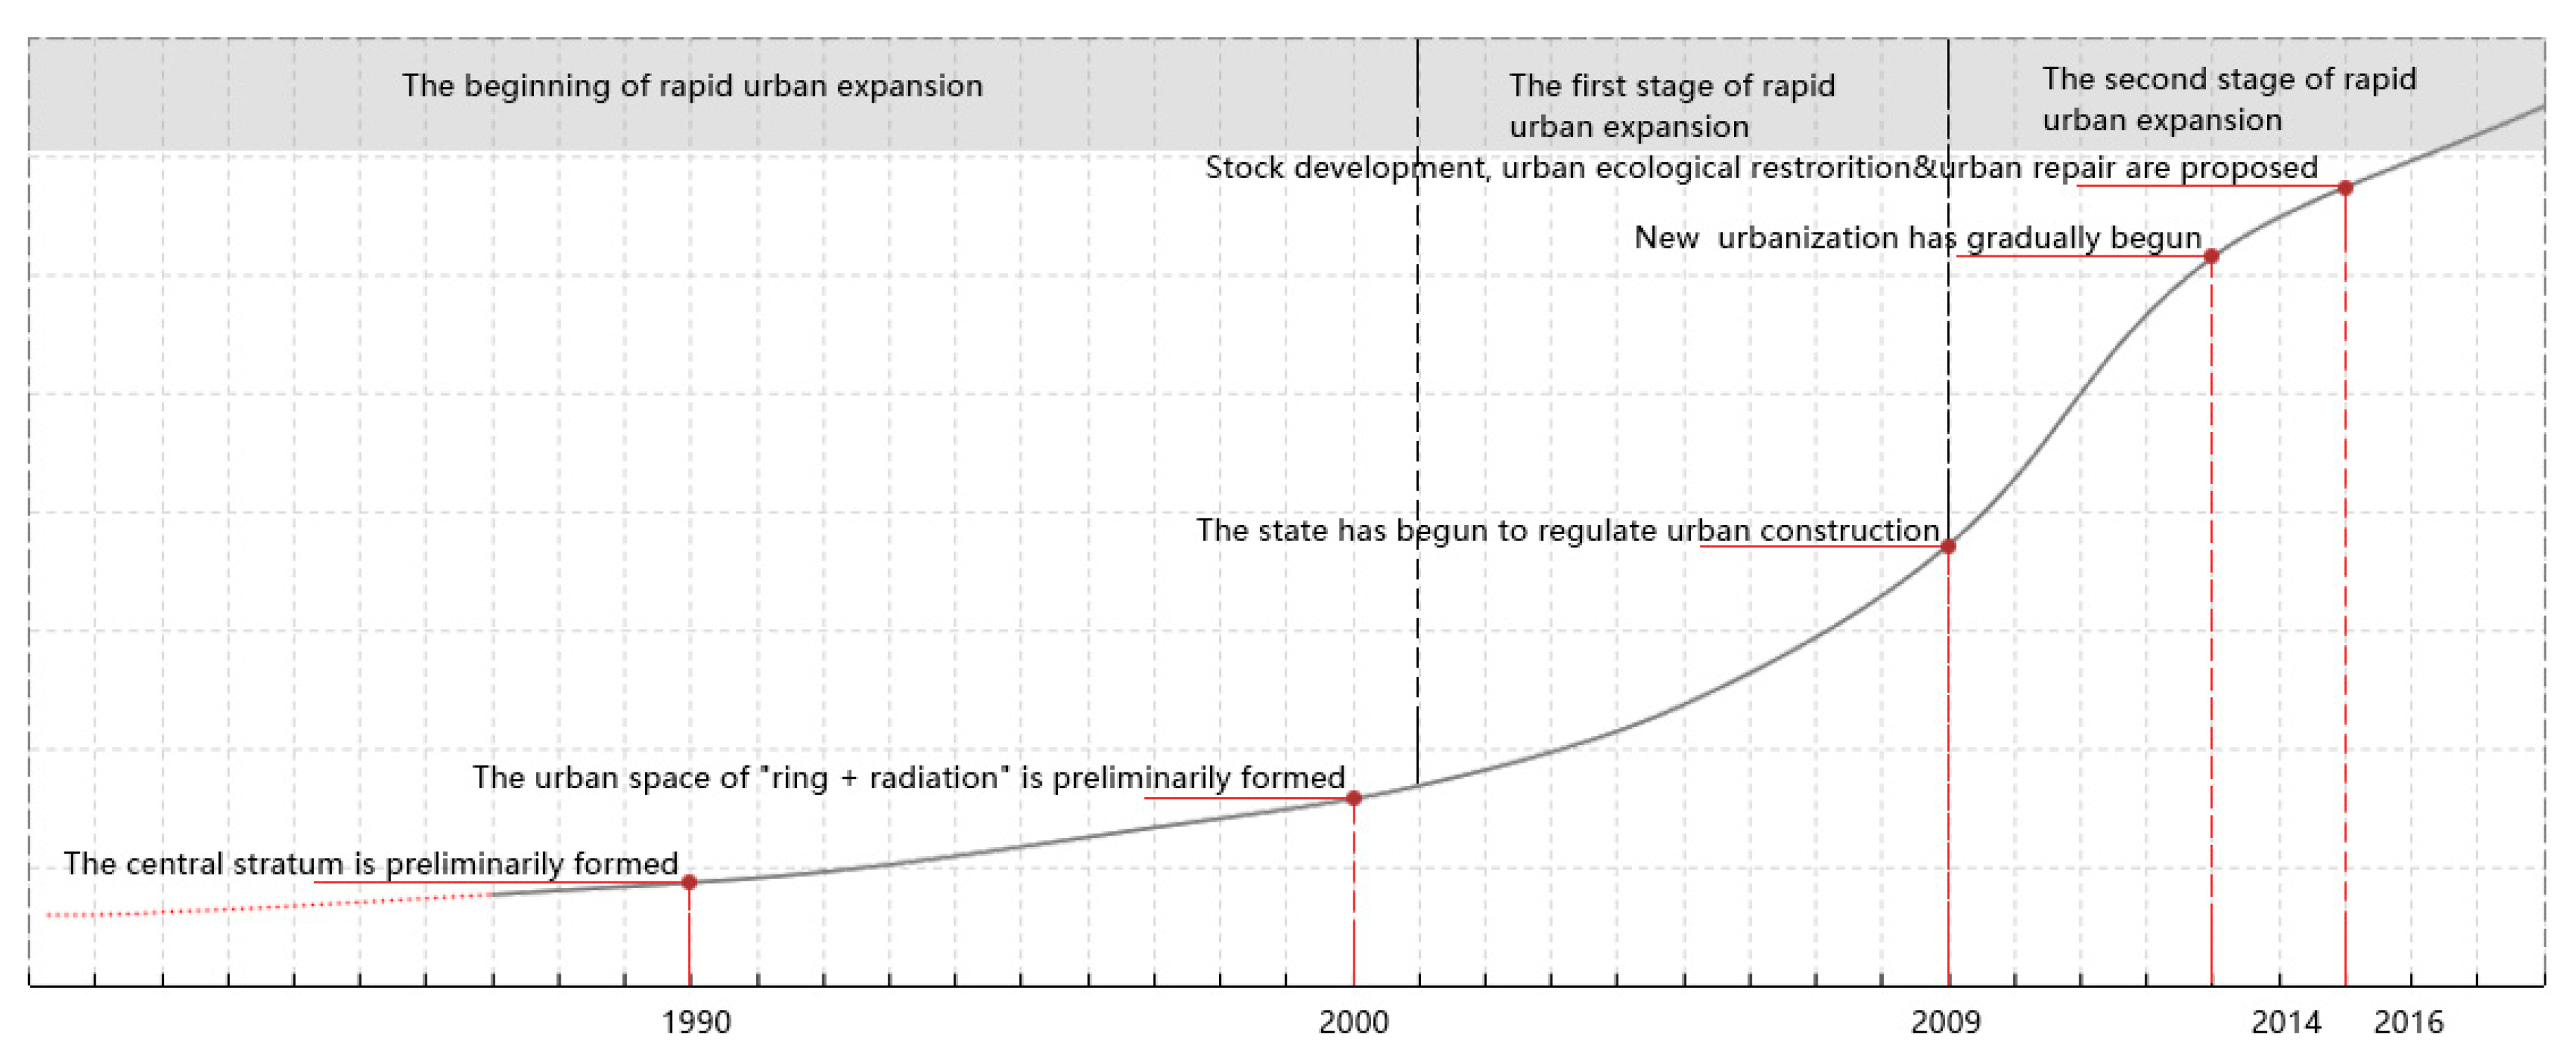
3.5.2. Built-Up Areas
Wuhan built-up areas also experienced different improvement periods in the development process of modern times, which were significantly influenced by urban policies (Figure 10). From 1979–1990, the city expanded rapidly. At this time, the ancient city wall of Wuchang was completely dismantled; industrial projects gave birth to a large number of units and industrial living areas; and the Wuchang-Zhongbei and Hankou-Wushang business circles were formed during this period. By 2000, the modern service industry gathered and developed in the central area of Wuhan; Guanggu and Zhuankou economic and technological development zones were taking shape; and the city has been expanded from the central urban area to the new urban area. Since the beginning of the new century, urban expansion of Wuhan has been accelerating, the central city was fully urbanised, the “ring + radiation” urban space structure was formed and the rail transit system supported the rapid development of the city. After 2000, Wuhan City vigorously promoted the development of urban and rural integration. With the rapid advancement of urbanisation and the increasingly rapid development of cities, a large amount of arable land has been converted into urban construction land, and the wave of real estate development has gradually begun. Around 2009, the government began to regulate the real estate industry, and the urban expansion rate began to drop gradually. Around 2014, Wuhan began a new type of urbanization, its urban pattern was basically formed and the rate of urban expansion slowed down further. With the gradual introduction of various urban policies, such as stock planning, urban renewal and Ecological Restoration, Urban Repair, urban development will gradually become more sustainable in the future.
3.5.3. Coupling Degree
On the basis of the preceding analysis, the coupling degree between Wuhan City and its lakes will continue to increase in the later development process, and the lake area will gradually improve in the later urban construction process, which also fits in the prediction result of the “Environmental Kuznets curve (EKC)”. The EKC is a nonlinear relationship which can be used to describe the urbanisation-environment system. It assumes that there is a relationship between urbanisation and environment in which the environmental quality level first declines with the development of urbanisation and then rises with the improvement of urbanisation level.
4. Conclusions
From 1987–mid-2018, the built-up areas of Wuhan showed a trend of continuous growth. The growth rate was low at the beginning, accelerated continuously and then gradually decreased after the urban development reached a certain scale. The area of Wuhan lakes showed the same trend as fragmentation, that is, the performance showed a rapid decline in 1987–1997; was relatively stable in 1997–2005 but fell sharply in 2005–2013; and has been increasing since 2013. The coupling analysis of urban expansion and lake change indicates that the coupling degree between built-up areas and lake areas has a trend of gradual increase. Before 2001, the coupling coefficient was less than 0.3, and the relationship between them only showed the antagonistic relationship of mutual restriction. Then, the coupling degree gradually increased and reached a weak equilibrium after 2013.
This process can be corresponded to the change of urban policies. At the beginning, economic construction was vigorously developed and stimulated urban expansion, whereas environmental protection in the development process was neglected. Lake filling activities were unsupervised, and people’s awareness of protection was insufficient. Then, as the negative effects brought by urban expansion were gradually revealed, people’s pursuit of living environment quality was significantly improved, and the idea of improving urban quality and curb chaotic urban sprawl became the mainstream. Policies to protect lakes and repair the ecological environment were also implemented one after another.
The results of this study emphasise the necessity of the lake protection policies in Wuhan. Lake supervision must be strengthened, and ecological restoration should be actively promoted. Moreover, sustainable urban development policies should be maintained to improve the quality of urban development and consider urban development and environmental protection.
However, given that the water area of lakes is largely affected by the factor of season and some of the years studied lack high-quality remote sensing images, the time nodes selected in this study have a large span, and the change trend reflected in this study is not sufficiently detailed. In addition, in the process of image interpretation, manual visual interpretation is used to modify the results, which introduces the possibility of subjectivity. Therefore, this study can still be improved in future works.
Author Contributions
Conceptualization, J.W. and J.L.; Methodology, J.L.; Software, L.T.; Validation, J.W., J.L. and L.T.; Formal Analysis, L.T.; Investigation, J.L.; Resources, J.L.; Data Curation, J.L.; Writing-Original Draft Preparation, J.L. and L.T.; Writing-Review & Editing, J.W.; Visualization, L.T.; Supervision, J.W.; Project Administration, J.W.; Funding Acquisition, J.W.
Funding
This research was funded by National Natural Science Foundation of China (NSFC) Youth Program, grant number 51808409 and the Fundamental Research Funds for the Central Universities (Interdisciplinary Project), grant number 2042019kf0211.
Conflicts of Interest
The authors declare no conflict of interest.
References
- Siegel, F.R. Population assessments: 2013–2050–2100: Growth, stability, contraction. In Countering 21st Century Social-Environmental Threats to Growing Global Populations; Springer: Cham, Switzerland, 2015; pp. 1–8. [Google Scholar]
- Zheng, B.; Myint, S.W.; Fan, C. Spatial configuration of anthropogenic land cover impacts on urban warming. Landsc. Urban Plan. 2014, 130, 104–111. [Google Scholar] [CrossRef]
- Dou, Y.; Liu, Z.; He, C. Urban land extraction using VIIRS nighttime light data: An evaluation of three popular methods. Remote Sens. 2017, 9, 175. [Google Scholar] [CrossRef]
- He, J.; Wang, S.; Liu, Y. Examining the relationship between urbanization and the eco-environment using a coupling analysis: Case study of Shanghai, China. Ecol. Indic. 2017, 77, 185–193. [Google Scholar] [CrossRef]
- Wang, S.J.; Ma, H.; Zhao, Y.B. Exploring the relationship between urbanization and the eco-environment—A case study of Beijing–Tianjin–Hebei region. Ecol. Indic. 2014, 45, 171–183. [Google Scholar] [CrossRef]
- Zhao, Y.; Wang, S.; Zhou, C. Understanding the relation between urbanization and the eco-environment in China Yangtze River Delta using an improved EKC model and coupling analysis. Sci. Total Environ. 2016, 571, 862–875. [Google Scholar] [CrossRef] [PubMed]
- Chai, J.; Wang, Z.; Zhang, H. Integrated evaluation of coupling coordination for land use change and ecological security: A case study in Wuhan city of Hubei province, China. Int. J. Environ. Res. Public Health 2017, 14, 1435. [Google Scholar] [CrossRef] [PubMed]
- López, E.; Bocco, G.; Mendoza, M. Predicting land-cover and land-use change in the urban fringe: A case in Morelia city, Mexico. Landsc. Urban Plan. 2001, 55, 271–285. [Google Scholar] [CrossRef]
- Xiao-Peng, S.; Hansen, M.C.; Stehman, S.V. Global land change from 1982 to 2016. Nature 2018, 560, 639. [Google Scholar]
- Jiyuan, L.; Jia, N.; Wenhui, K. Spatio-temporal patterns and characteristics of land-use change in China during 2010-2015. J. Geogr. Sci. 2018, 28, 547–562. [Google Scholar]
- Li, G.; Sun, S.; Fang, C. The varying driving forces of urban expansion in China: Insights from a spatial-temporal analysis. Landsc. Urban Plan 2018, 174, 63–77. [Google Scholar] [CrossRef]
- Wang, J.; Lin, Y.; Glendinning, A. Land-use changes and land policies evolution in China’s urbanization processes. Land Use Policy 2018, 75, 375–387. [Google Scholar] [CrossRef]
- Liu, Y.; Huang, X.; Yang, H. Environmental effects of land-use/cover change caused by urbanization and policies in Southwest China Karst area—A case study of Guiyang. Habitat Int. 2014, 44, 339–348. [Google Scholar] [CrossRef]
- Xie, C.; Huang, X.; Wang, L. Spatiotemporal change patterns of urban lakes in China’s major cities between 1990 and 2015. Int. J. Digit. Earth 2018, 11, 1085–1102. [Google Scholar] [CrossRef]
- Ke, Y.; Gong-Hao, D.; Rui-Qing, N. Analysis of lake changes in Wuhan based on multi-source remote sensing data. J. Yangtze River Sci. Res. Inst. 2016, 33, 139–142, 146. [Google Scholar]
- Yue, D.; Weiguo, J.; Zhenghong, T. Spatio-temporal change of lake water extent in Wuhan urban agglomeration based on landsat images from 1987 to 2015. Remote Sens. 2017, 9, 270. [Google Scholar]
- Jianfeng, Z.; Qiuwen, Z.; Zhong, T. Impact analysis of lakefront land use changes on lake area in Wuhan, China. Water 2015, 7, 4869–4886. [Google Scholar]
- Li, Y.; Li, Y.; Zhou, Y. Investigation of a coupling model of coordination between urbanization and the environment. J. Environ. Manag. 2012, 98, 127–133. [Google Scholar] [CrossRef] [PubMed]
- Chuanglin, F.; Jing, W. A Theoretical analysis of interactive coercing effects between urbanization and eco-environment. Chin. Geogr. Sci. 2013, 23, 147–162. [Google Scholar]
- Xing, L.; Xue, M.; Hu, M. Dynamic simulation and assessment of the coupling coordination degree of the economy–resource–environment system: Case of Wuhan City in China. J. Environ. Manag. 2019, 230, 474–487. [Google Scholar] [CrossRef]
- Nana, L.; Chuanzhe, L.; Yufei, X. Examining the coordination between urbanization and eco-environment using coupling and spatial analyses: A case study in China. Ecol. Indic. 2018, 93, 1163–1175. [Google Scholar]
- Yu, S.; Yin, C.; Huixia, H. An empirical analysis of the coupling coordination among decomposed effects of urban infrastructure environment benefit: Case study of four Chinese autonomous municipalities. Math. Probl. Eng. 2016, 2016, 1–11. [Google Scholar]
- Zhou, K.; Liu, Y.; Tan, R. Urban dynamics, landscape ecological security, and policy implications: A case study from the Wuhan area of central China. Cities 2014, 41, 141–153. [Google Scholar] [CrossRef]
- Yan, L.; Kun, Z.; Jingyun, F. Land use change in urban lake watershed—A case study at Donghu Lake, Wuhan. Resour. Environ. Yangtze Basin 2004, 13, 229–233. [Google Scholar]
- Gonghao, D.; Ruiqing, N. Lake area analysis using exponential smoothing model and long time-series landsat images in Wuhan, China. Sustainability 2018, 10, 149. [Google Scholar]
- Zhong, H. Study on the Model of Public Participation in Lakes Protection in Wuhan City, China—An Example of “Love Our 100 Lakes” Volunteer Action. Adv. Environ. Prot. 2018, 8, 1–12. (In Chinese) [Google Scholar]
- Zhao, S.; Zhou, D.; Zhu, C. Rates and patterns of urban expansion in China’s 32 major cities over the past three decades. Landsc. Ecol. 2015, 30, 1541–1559. [Google Scholar] [CrossRef]
- Kuang, W.H.; Chen, L.J.; Liu, J.Y. Remote sensing-based artificial surface cover classification in Asia and spatial pattern analysis. Sci. China Earth Sci. 2016, 59, 1720–1737. [Google Scholar] [CrossRef]
- Kuang, W.H.; Liu, J.Y.; Zhang, Z.X. Spatiotemporal dynamics of impervious surface areas across China during the early 21st century. Chin. Sci. Bull. 2013, 58, 1691–1701. [Google Scholar] [CrossRef]
- Liu, Z.; Wang, Y.; Li, Z. Impervious surface impact on water quality in the process of rapid urbanization in Shenzhen, China. Environ. Earth Sci. 2013, 68, 2365–2373. [Google Scholar] [CrossRef]
- Yun, D.; Yihang, Z.; Feng, L. Water Bodies’ mapping from sentinel-2 imagery with modified normalized difference water index at 10-m spatial resolution produced by sharpening the SWIR band. Remote Sens. 2016, 8, 354. [Google Scholar]
- Peng, J.; Hu, Y.; Liu, Y. A new approach for urban-rural fringe identification: Integrating impervious surface area and spatial continuous wavelet transform. Landsc. Urban Plan. 2018, 175, 72–79. [Google Scholar] [CrossRef]
- Zhang, L.; Weng, Q. Annual dynamics of impervious surface in the Pearl River Delta, China, from 1988 to 2013, using time series landsat imagery. ISPRS J. Photogramm. Remote Sens. 2016, 113, 86–96. [Google Scholar] [CrossRef]
- Sun, G.; Chen, X.; Jia, X. Combinational build-up index (CBI) for effective impervious surface mapping in urban areas. IEEE J. Sel. Top. Appl. Earth Obs. Remote Sens. 2017, 9, 2081–2092. [Google Scholar] [CrossRef]
- Genyun, S.; Xiaolin, C.; Jinchang, R. Stratified spectral mixture analysis of medium resolution imagery for impervious surface mapping. Int. J. Appl. Earth Obs. Geoinformation 2017, 60, 38–48. [Google Scholar] [Green Version]
- Zanotta, D.C.; Haertel, V.; Shimabukuro, Y.E. Linear spectral mixing model for identifying potential missing endmembers in spectral mixture analysis. IEEE Trans. Geosci. Remote Sens. 2014, 52, 3005–3012. [Google Scholar] [CrossRef]
- Jian, P.; Yanxu, L.; Hong, S. Using impervious surfaces to detect urban expansion in Beijing of China in 2000s. Chin Geogr. Sci. 2016, 26, 229–243. [Google Scholar] [CrossRef] [Green Version]
- Seto, K.C.; Fragkias, M.; Güneralp, B. A meta-analysis of global urban land expansion. PLoS ONE 2011, 6, e23777. [Google Scholar] [CrossRef] [PubMed]
- Jing, G.; Fu-You, G.; Cai, C. The spatio-temporal evolution characteristics of urbanization spatial differentiation in northeast China. Sci. Geogr. Sin. 2015, 35, 565–574. [Google Scholar]
- Liu, X.; Liang, X.; Li, X. A future land use simulation model (FLUS) for simulating multiple land use scenarios by coupling human and natural effects. Landsc. Urban Plan. 2017, 168, 94–116. [Google Scholar] [CrossRef]
- Zhang, L.; Peng, J.; Liu, Y. Coupling ecosystem services supply and human ecological demand to identify landscape ecological security pattern: A case study in Beijing–Tianjin–Hebei region, China. Urban Ecosyst. 2016, 20, 1–14. [Google Scholar] [CrossRef]
- Yi, Y.; Fei, X.; Yun, D. Construction of lake bathymetry from MODIS satellite data and GIS from 2003 to 2011. Chin. J. Oceanol. Limnol. 2014, 32, 720–731. [Google Scholar]
- Huang, W. Retrospect and Consideration on Mountain Protection of Natural Lakes in Wuhan City, Urban Age, Collaborative Planning-2013 Annual Conference of Urban Planning in China, Qingdao, Shandong, China, 16 November 2013; Qingdao Publishing House: Qingdao, China, 2013. (In Chinese) [Google Scholar]
- Chen, L.; Wang, M.; Deng, R. Discussion on assignment of legal liability in local water resources protection legislation. Yangtze River. 2018, 49, 11–14. (In Chinese) [Google Scholar]
- Fu, X. Flood Control Situation and Urban Flood Control Construction in Wuhan. Urban Road Bridge Flood Control 2000, 1, 30–35. (In Chinese) [Google Scholar]
- Tang, X.; Zhao, W.; Tang, W.; Yu, Z.; Li, H. Studies on integration of river basin management with river chief system. China Water Resour. 2018, 10, 12–14. (In Chinese) [Google Scholar]
- Zhang, F. Promoting the Co-governance of the four rivers to build a waterfront ecological green city. Yangtze River Forum. 2017, 2, 11–20. (In Chinese) [Google Scholar]
Figure 1.
(a) Location overview of Wuhan City; (b) relatively dispersed lake distribution that is mainly concentrated in the central and southern parts of Wuhan. Many small lakes form around the main rivers, and the urban area enjoys abundant water resources.
Figure 1.
(a) Location overview of Wuhan City; (b) relatively dispersed lake distribution that is mainly concentrated in the central and southern parts of Wuhan. Many small lakes form around the main rivers, and the urban area enjoys abundant water resources.

Figure 2.
Scope of Wuhan urban development area.

Figure 3.
The total area of lakes in Wuhan’s urban development area (1987–2018). The comparison of the statistical data of lake area every four years indicates that the overall lake area initially decreased year by year and then slightly increased. The total area changed from 376.52 km2 in 1987 to 282.43 km2 in 2018, decreasing by 94.09 km2 in 30 years.

Figure 4.
Lake evolution map of Wuhan urban development area in 1987–2018.

Figure 5.
Statistics of urban built-up areas in Wuhan urban development area (1987–2018). The comparison of the statistical data of built-up areas every four years indicates that the built-up area increased year by year. The total area increased from 153.35 km2 in 1987 to 1484.59 km2 in 2018, increasing by 1331.24 km2 in 30 years.

Figure 6.
Urban expansion and lake changes in Wuhan urban development area from 1987–2018. (a) 1987–1992; (b) 1992–1996; (c) 1996–2001;(d) 2001–2005; (e) 2005–2009; (f) 2009–2013; (g) 2013–2018.
Figure 6.
Urban expansion and lake changes in Wuhan urban development area from 1987–2018. (a) 1987–1992; (b) 1992–1996; (c) 1996–2001;(d) 2001–2005; (e) 2005–2009; (f) 2009–2013; (g) 2013–2018.
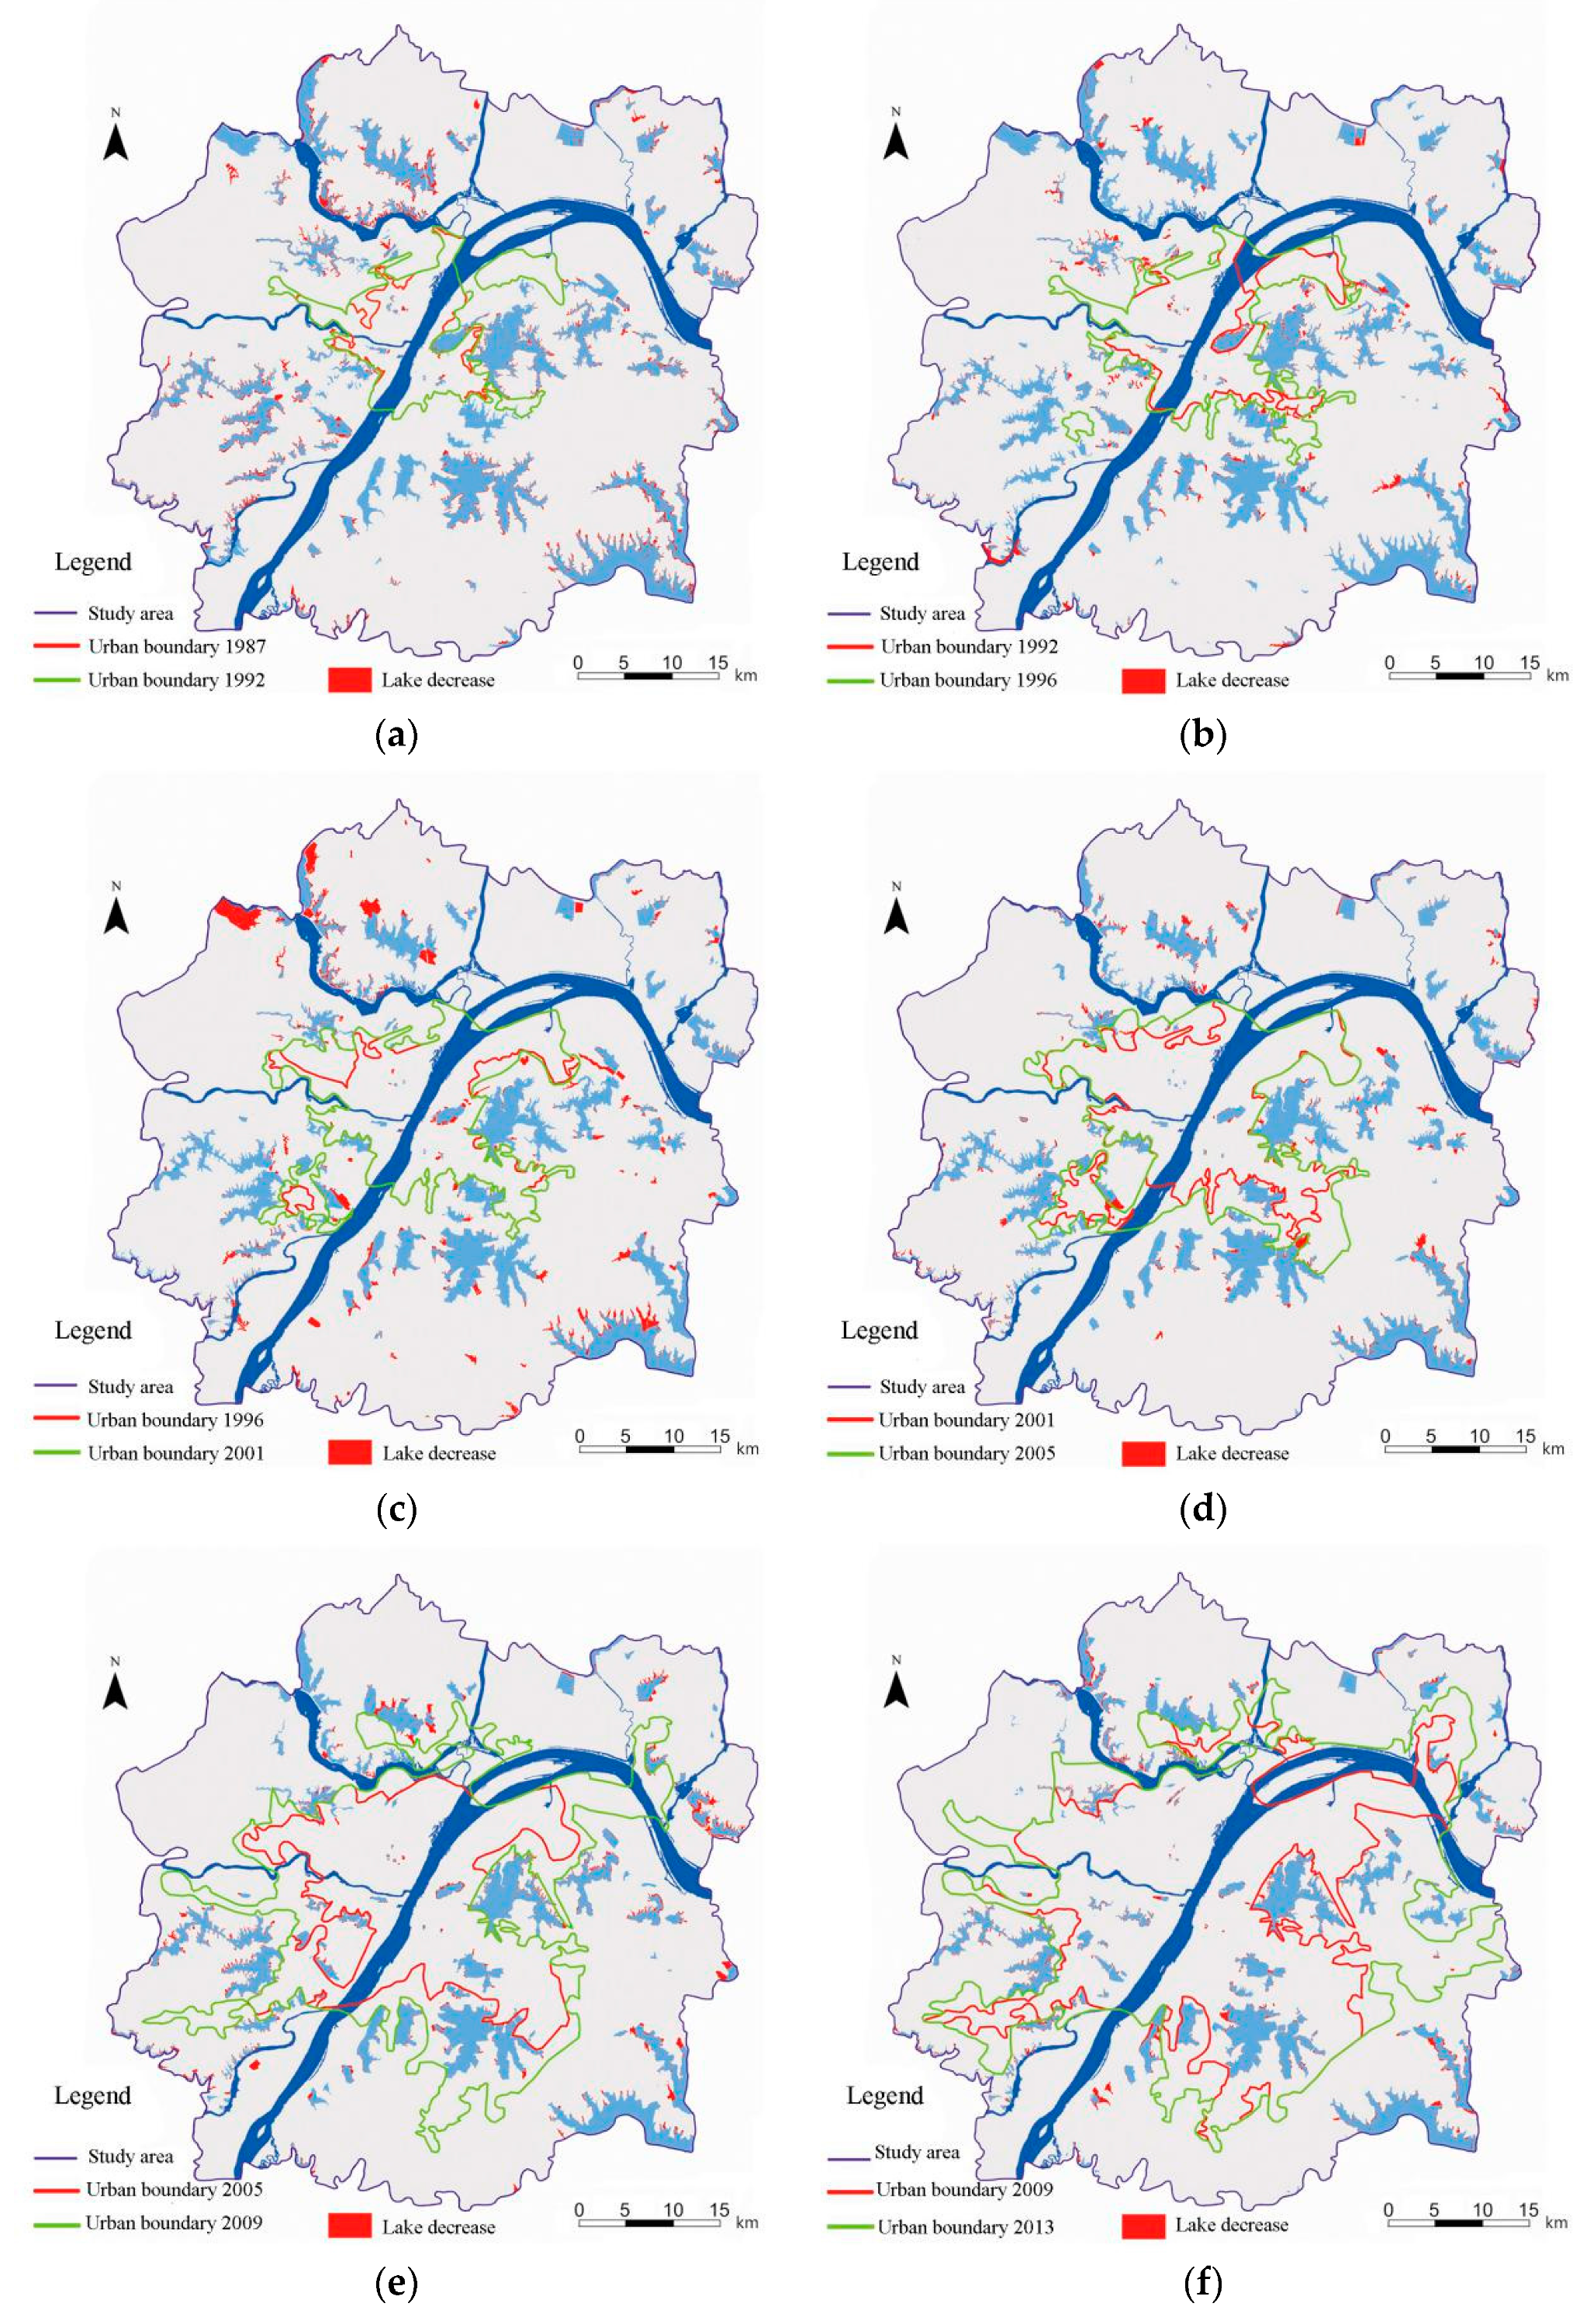
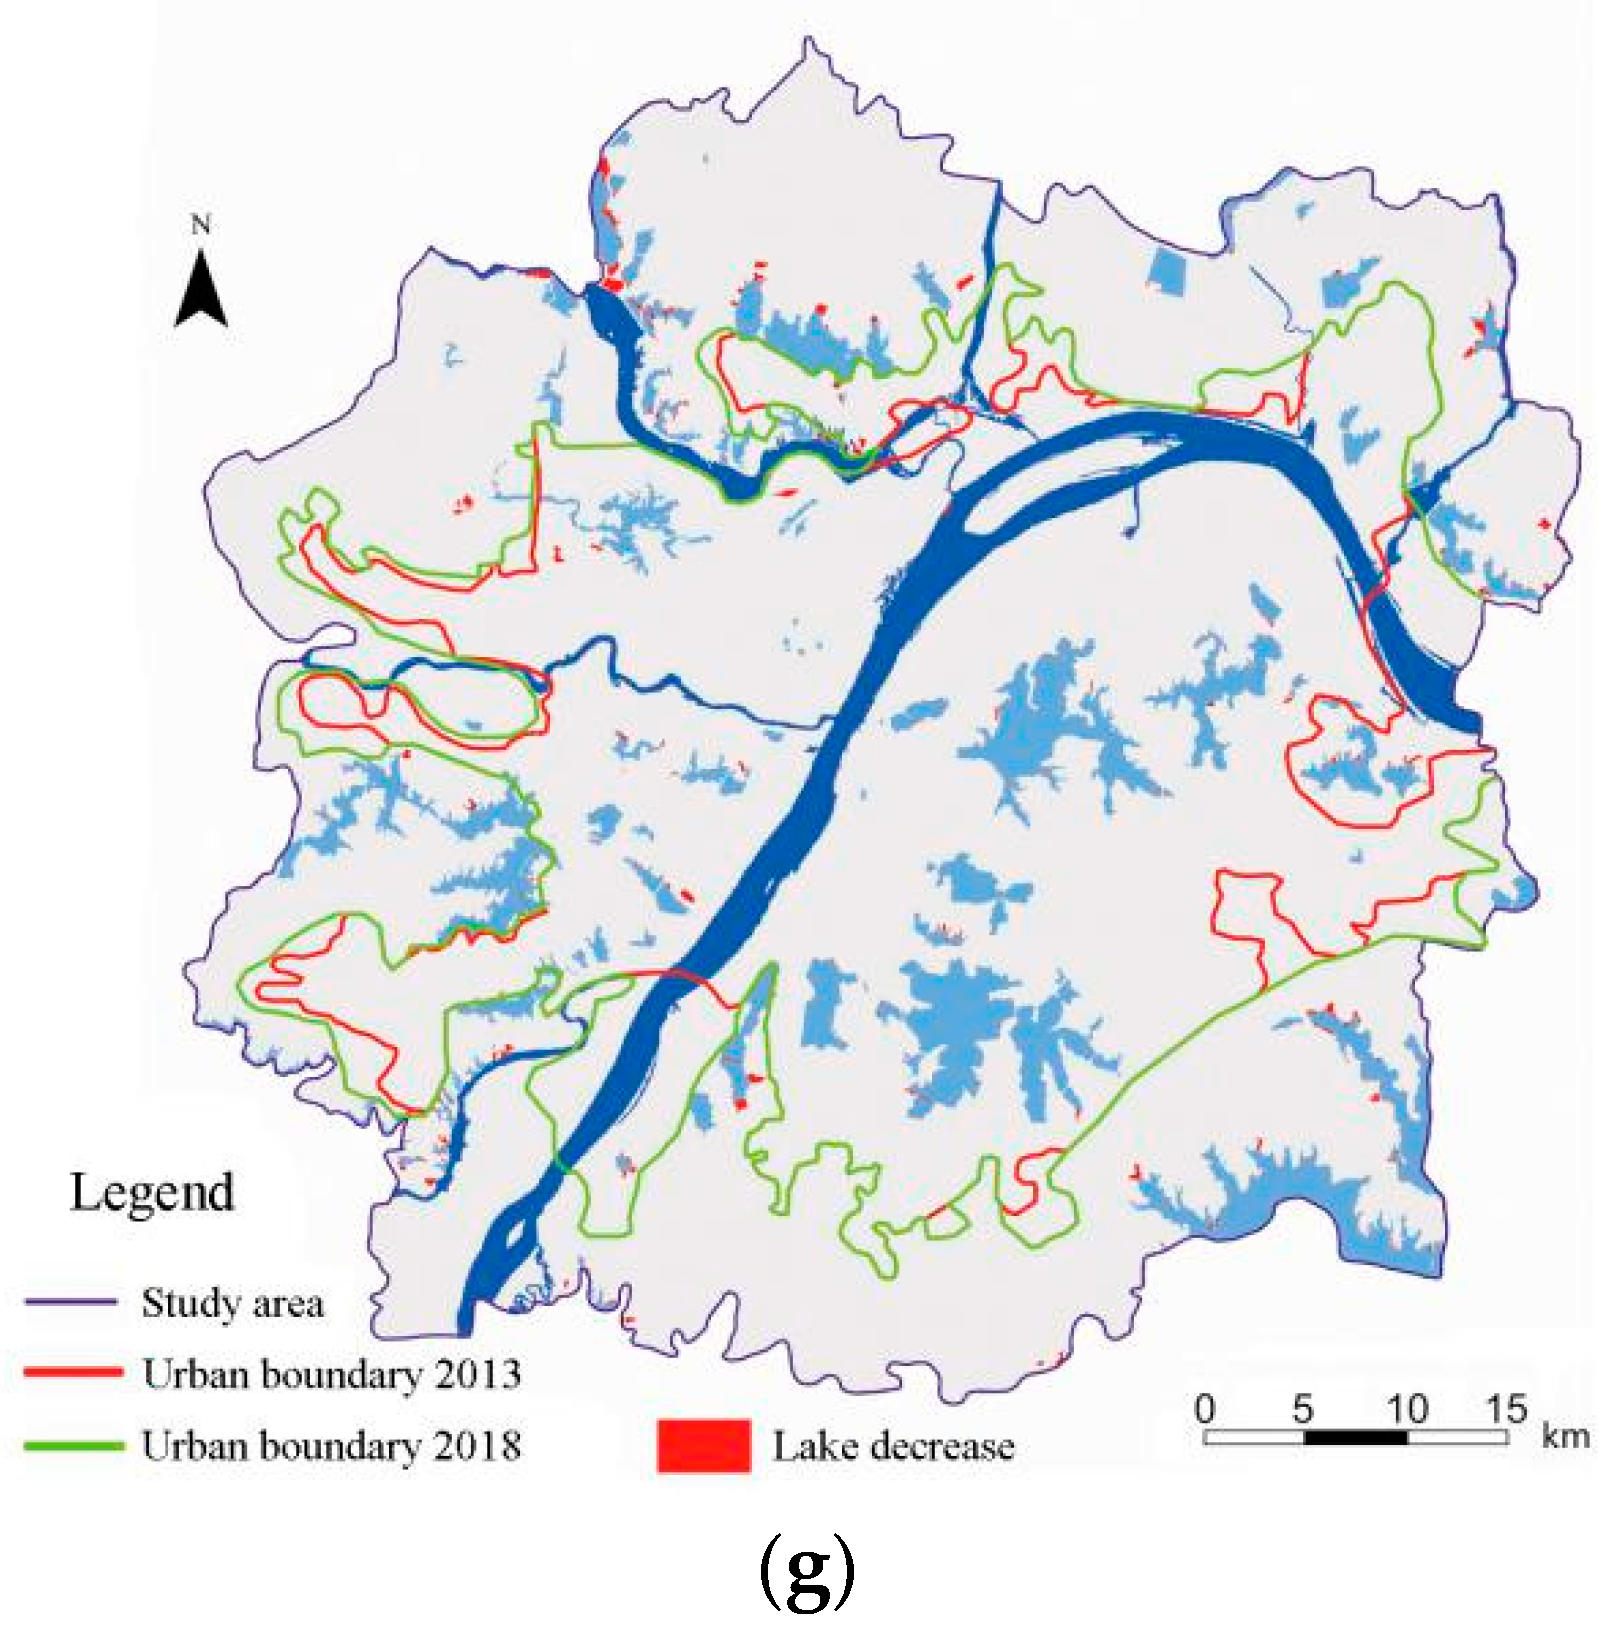
Figure 7.
Changes in the water area of Tangxun Lake (1987–2018). In the figure, blue, black and red respectively represent three stages of lake area change of Tangxun Lake.
Figure 7.
Changes in the water area of Tangxun Lake (1987–2018). In the figure, blue, black and red respectively represent three stages of lake area change of Tangxun Lake.

Figure 8.
(a) Trends in the comprehensive levels of the lake change system; (b) the trend in the level of the urban expansion system; (c) the coupling degree of urban built-up area and lake evolution in Wuhan urban development area (1987–2018).
Figure 8.
(a) Trends in the comprehensive levels of the lake change system; (b) the trend in the level of the urban expansion system; (c) the coupling degree of urban built-up area and lake evolution in Wuhan urban development area (1987–2018).


Figure 9.
Changes in lake policy from 1987–2018.
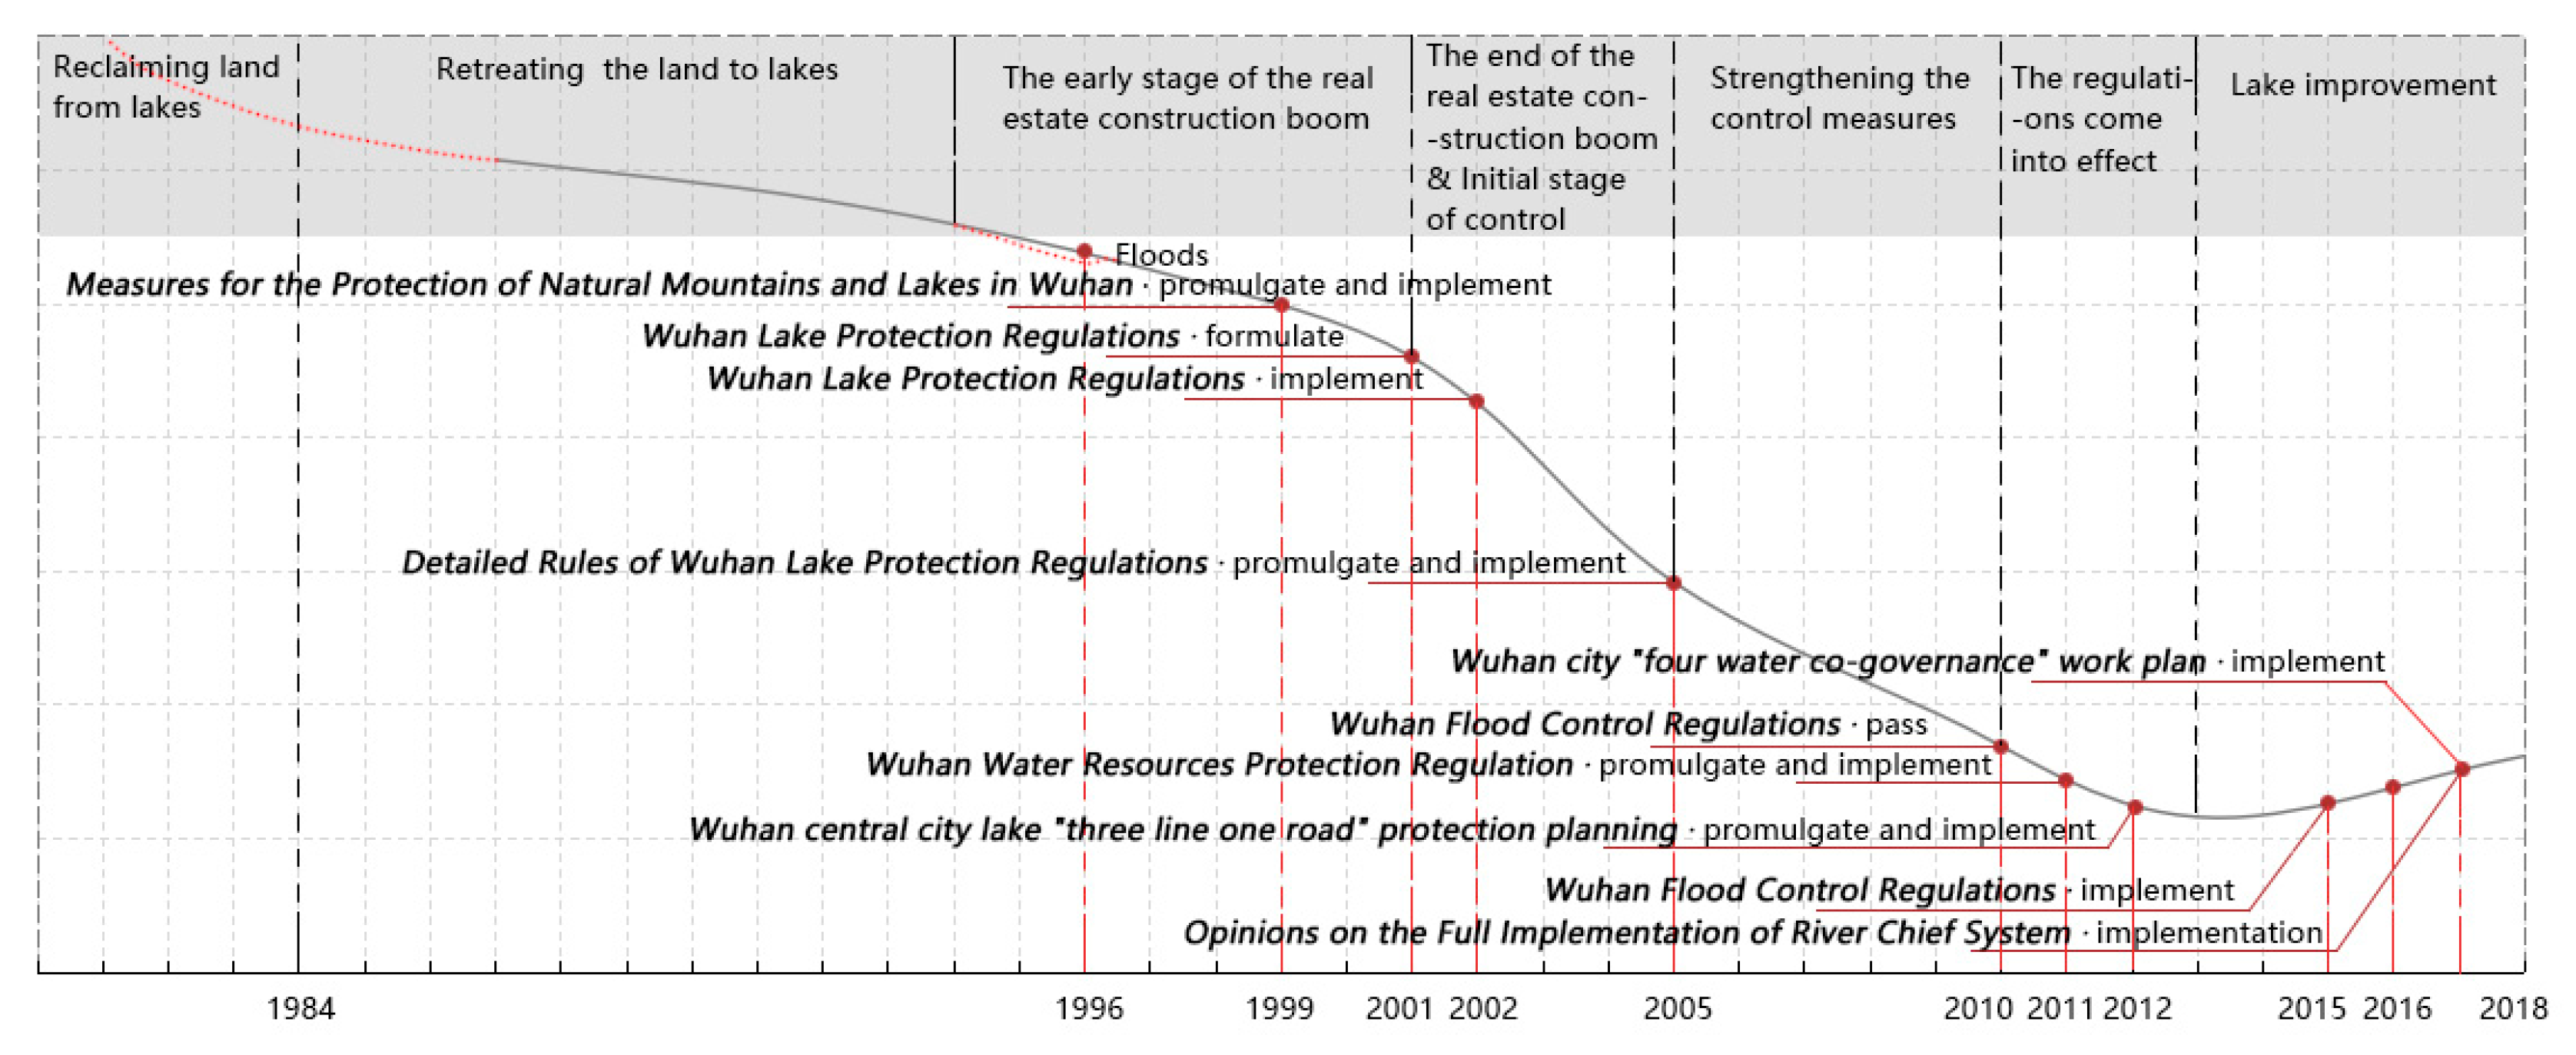
Figure 10.
Changes in urban policy from 1987–2018.


Table 1.
Main lakes in the study area (key protected lakes within the scope defined by Wuhan Lake Protection Regulations [26]).
Table 1.
Main lakes in the study area (key protected lakes within the scope defined by Wuhan Lake Protection Regulations [26]).
| Administrative Region | Lakes |
|---|---|
| Wuchang District | Sand, Ziyang, Shai, Fruit, Simei and East Lakes |
| Hanyang District | Moon, Lotus, Ink and Longyang Lakes |
| Qingshan District | North Lake |
| Hongshan District | Qingling, Huangjia, South, Ye, Yezhi, Yangchun, Tangxun, Bamboo, Qingtan, Yanxi and Yandong Lakes |
| Caidian District | West, Small Zha, Guanlian, Houguan, Zhiyin, Southern Taizi, Sanjiao, Lanni, Tang, Wanjia and North Taizi Lakes |
| Jiangxia District | Niushan and An Lake |
| Jiangan District | Wanzi and Tazi Lakes |
| Jianghan District | Machine Pond and North and Lingjiao Lake |
| Qiaokou District | Zhangbi Lake |
| Huangpi District | Hou, Tongjia, Majia, Maijia, Shizi, Renkai, Xinjiao, Panlong, Chang and Zhangdou Lake |
| Xinzhou District | Wu, Zhujia, Taoshu, Taojia and Chaibo Lakes |
Table 2.
The image data set.
| Satellite | Sensor | Resolution(m) | Data Identification | Date | Cloudage(%) |
|---|---|---|---|---|---|
| Landsat5 | TM | 30 m | LT51230391987253BJC00 | 10 September 1987 | 4.7% |
| LT51230391992027BKT00 | 27 January 1992 | None | |||
| LT51230391996278CLT00 | 2 September 1996 | None | |||
| LT51230392001067BJC00 | 16 September 2001 | 6.7% | |||
| LT51230392005110BJC00 | 11 September 2005 | None | |||
| LT51230392009249BJC00 | 6 September 2009 | None | |||
| Landsat8 | OLI | 30/15 M | LC81230392013260LGN01 | 17 September 2013 | None |
| LC81230392018098LGN0 | 8 April 2018 | 8.9% |
Table 3.
System of lake changes index.
| Primary | Weight(%) | Secondary Indicators | Weight(%) |
|---|---|---|---|
| Lake change index | 61.25% | The average area of a lake(km2) | 44.59% |
| Average shoreline length(km) | 16.66% | ||
| Lake fragmentation index | 38.75% | Boundary density of lakes | 15.26% |
| Area-weighted shape index | 17.68% | ||
| Area standard deviation index | 5.81% |
Table 4.
Coordination degree of coupling between urban expansion and lake change.
| Primary Division of Development Stages | Secondary Division of Development Stages | Tertiary Division of Development Stages | ||
|---|---|---|---|---|
| Balanced development (acceptable interval) | 0.7 < D ≤ 1.0 | Superior balanced development | g(Y) − f(X) > 0.1 | Superiorly balanced development with lagging urban sprawl |
| f(X) − g(Y) > 0.1 | Superiorly balanced development with a lagging lacustrine environment | |||
| 0 ≤ |f(X) − g(Y)|≤ 0.1 | Superiorly balanced development of urban sprawl and lacustrine environment | |||
| Transitional development (acceptable interval) | 0.5 < D ≤ 0.7 | Barely balanced development | g(Y) − f(X) > 0.1 | Barely balanced development with lagging urban sprawl |
| f(X) − g(Y) > 0.1 | Barely balanced development with a lagging lacustrine environment | |||
| 0 ≤ |f(X) − g(Y)| ≤ 0.1 | Barely balanced development of urban sprawl and lacustrine environment | |||
| Unbalanced development (acceptable interval) | 0.3 < D ≤ 0.5 | Slightly unbalanced development | g(Y) − f(X) > 0.1 | Slightly unbalanced development with hindered urban sprawl |
| f(X) − g(Y) > 0.1 | Slightly unbalanced development with a hindered lacustrine environment | |||
| 0 ≤ |f(X) − g(Y)| ≤ 0.1 | Slightly unbalanced development of urban sprawl and lacustrine environment | |||
| 0 < D ≤ 0.3 | Seriously unbalanced development | g(Y) − f(X) > 0.1 | Seriously unbalanced development with hindered urban sprawl | |
| f(X) − g(Y) > 0.1 | Seriously unbalanced development with a hindered lacustrine environment | |||
| 0 ≤ |f(X) − g(Y)| ≤ 0.1 | Seriously unbalanced development of urban sprawl and lacustrine environment |
© 2019 by the authors. Licensee MDPI, Basel, Switzerland. This article is an open access article distributed under the terms and conditions of the Creative Commons Attribution (CC BY) license (http://creativecommons.org/licenses/by/4.0/).
Share and Cite
MDPI and ACS Style
Wu, J.; Luo, J.; Tang, L. Coupling Relationship between Urban Expansion and Lake Change—A Case Study of Wuhan. Water 2019, 11, 1215. https://0-doi-org.brum.beds.ac.uk/10.3390/w11061215
AMA Style
Wu J, Luo J, Tang L. Coupling Relationship between Urban Expansion and Lake Change—A Case Study of Wuhan. Water. 2019; 11(6):1215. https://0-doi-org.brum.beds.ac.uk/10.3390/w11061215
Chicago/Turabian StyleWu, Jing, Jiameng Luo, and Lin Tang. 2019. "Coupling Relationship between Urban Expansion and Lake Change—A Case Study of Wuhan" Water 11, no. 6: 1215. https://0-doi-org.brum.beds.ac.uk/10.3390/w11061215
Note that from the first issue of 2016, this journal uses article numbers instead of page numbers. See further details here.