Zooplankton Size as a Factor Determining the Food Selectivity of Roach (Rutilus Rutilus) in Water Basin Outlets


1
Department of Hydrobiology and General Zoology, University of Szczecin, ul. Felczaka 3c, 71-412 Szczecin, Poland
2
Centre of Molecular Biology and Biotechnology, University of Szczecin, ul. Wąska 13, 70-415 Szczecin, Poland
*
Author to whom correspondence should be addressed.
Water 2019, 11(6), 1281; https://0-doi-org.brum.beds.ac.uk/10.3390/w11061281
Submission received: 21 May 2019
/
Revised: 18 June 2019
/
Accepted: 19 June 2019
/
Published: 19 June 2019
(This article belongs to the Special Issue Zooplankton Diversity and Pelagic Food Webs: Investigating Present and Past with Different Techniques)
Abstract
:Fish occurring in the outlets of water basins reduce the abundance of zooplankton. The study was performed at the outlet sections of the lake and waste stabilization pond of a sewage treatment plant. The aim of the study was to determine which zooplankton is chosen more often by the roach (Rutilus rutilus), those drifting from the waste stabilization pond or from the lake. The zooplankton from the pond was dominated by Daphnia pulex while zooplankton from the lake was dominated by small planktonic rotifers. We observed that the larger the plankter-victim’s size, the faster the reduction of its number. The fish were more likely to feed on zooplankton drifting from the waste stabilization pond than from the lake. It was influenced by D. pulex individuals, attractive for fish due to their largest body size among the analyzed zooplankton. The significance of riverine zooplankton in the downstream food web may render this data even more important.
1. Introduction
Fish make the most significant contribution to reduction of zooplankton communities [1,2,3,4,5]. This is especially visible in lake outlets where drifting zooplankton constitutes a rich food base for fish [6,7]. Even though the phenomenon of cyprinids feeding on zooplankton in outlets of stagnant basins is very common, it remains poorly investigated and documented [6,7]. Flow-through lakes and reservoirs provide a rich source of zooplankton for river ecosystems because organisms are washed out of the upper sections of lakes into river outlets. There is scarce literature regarding the efficacy and food selectivity of fish feeding in outlets of stagnant water basins. Certain authors speculate that fish are the main factor reducing zooplankton biomass in outlets [6,7,8], while others prove the point by showing zooplankton in fish stomach contents [9]. However, there is a lack of studies showing the stomach content of fish in regard to the zooplankton food-base in a river and the size of zooplankton victims.
This can be verified by checking how fish in the outlets of water basins reduce the abundance of zooplankton ranging in size. However, in the natural environment, it is difficult to find lake outlets with a high amount of large plankters such as Daphnia magna or D. pulex because they are immediately eaten by fish in the lake or at the beginning of a lake outlet, and therefore cannot reach the lower sections of a river outflow from the lake [6,7]. Therefore, it was crucial to find reservoirs without fish that allow large plankters to drift downstream in the outlet where their abundance is reduced by fish. One such reservoir is the retention pond of sewage treatment plants, in which biological purification of treated sewage takes place. This pond may abound with large planktonic crustaceans such as D. pulex, which reproduce freely if they do not encounter their greatest stressor, that is, fish [10]. Such conditions were observed in a sewage treatment plant in a small town. An abundant amount of zooplankton was found in the pond and its outlet, where D. pulex was identified as the quantitative dominant. Compared to other plankters, this species reaches a large size and therefore is probably more susceptible to fish predation. The greatest reductions were observed in the largest plankters, adult cladocerans, and adult copepods [5,9]. Zooplankton that drift from the waste stabilization pond find their way to the Drawa river, and mix with zooplankton drifting from Adamowo lake. A high quantity of zooplankton attracts a great cyprinid biomass to the outlet of Drawa, including the roach (Rutilus rutilus), which feeds on this zooplankton type. This is a good field of research to determine which zooplankton is chosen more often by the fish, either the one drifting from the waste stabilization pond or the one from the lake, the factors that characterize the fish (e.g., their size and age), and the factors that characterize the zooplankton (e.g., body size and abundance) and influence the fish’s choice. Answering the above questions was the aim of the study. The significance of riverine zooplankton in the downstream food web may render this data even more important.
2. Methods
2.1. Study Area
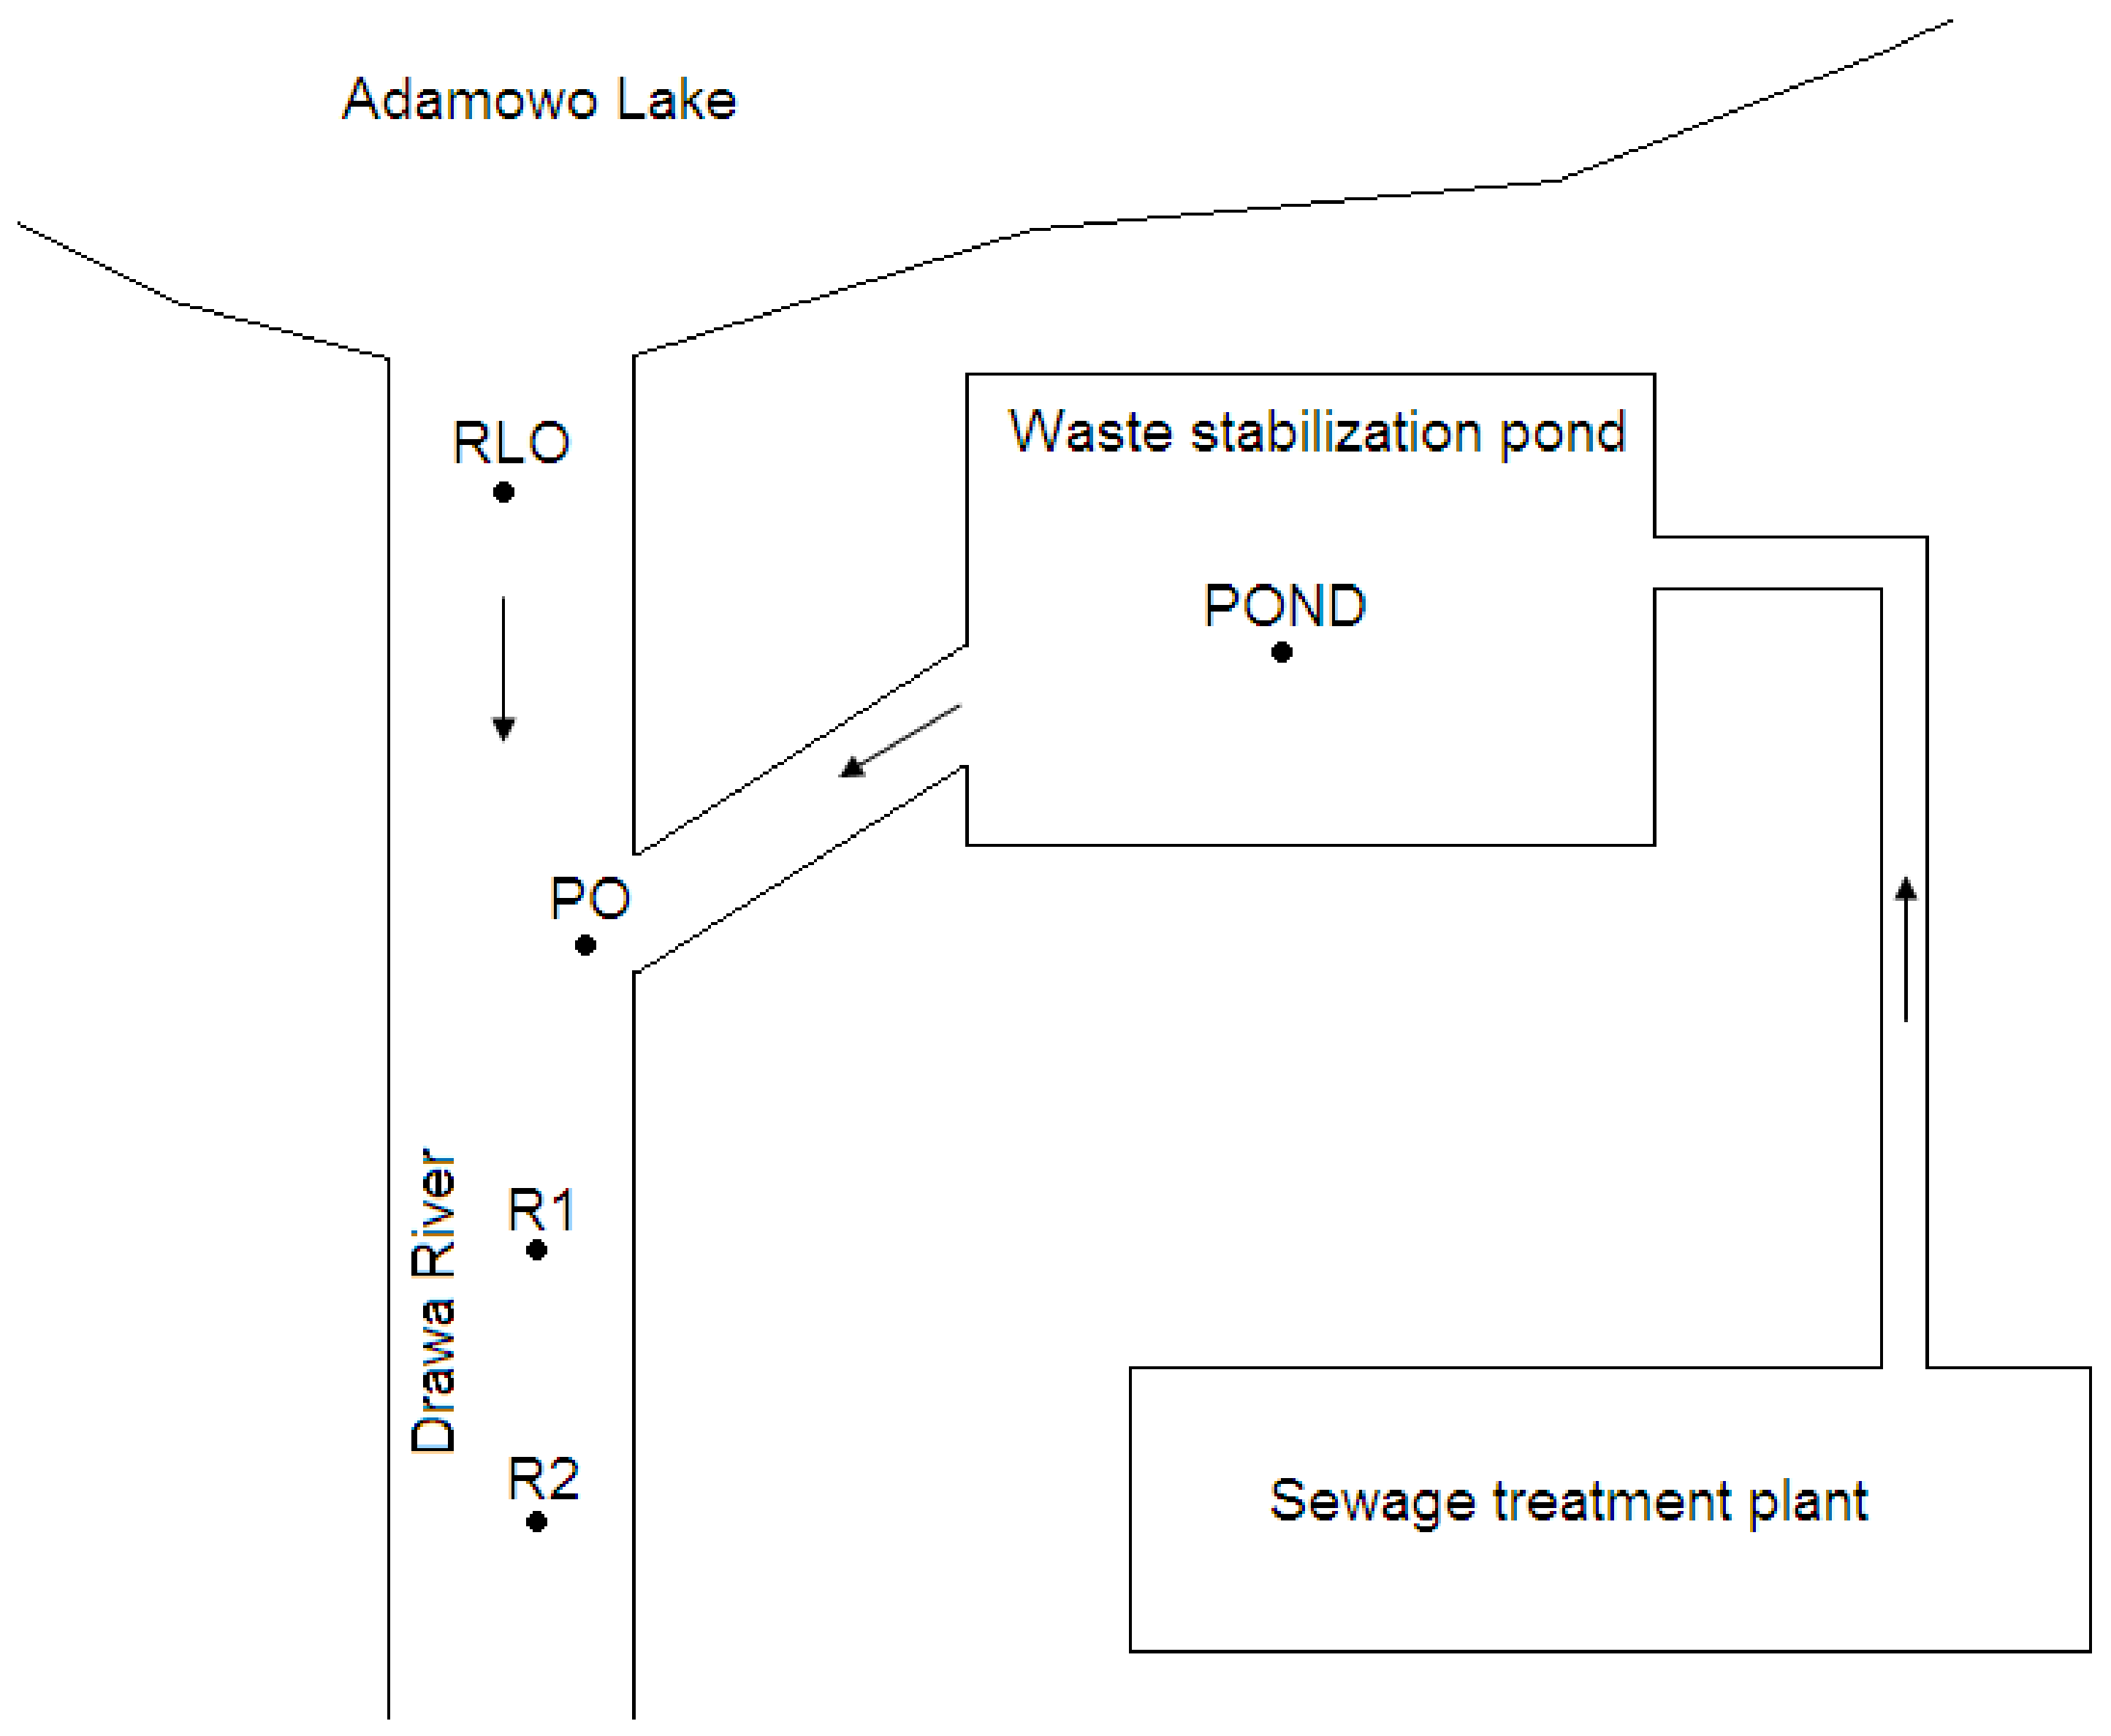
The study was performed at the outlet sections of the waste stabilization pond in the town of Drawno and at the outlet of Adamowo lake (GPS: 53.2089568; 15.7502837; NW Poland) (Figure 1). The samples were collected at 5 sites: the Adamowo lake outlet into the Drawa river (RLO), the waste stabilization pond (POND), the outlet from the waste stabilization pond (PO), a site in the Drawa river 20 m below the pond outlet (R1), and a site in the Drawa river 40 m below the pond outlet (R2). There were 2 control samples from 2 sites, i.e., RLO and POND, as a source of dispersed zooplankton, with river current in other sites, i.e., PO, R1, and R2. The biological treatment of sewage, previously purified by physical and chemical methods and with the use of activated sludge, is carried out in the retention pond of the sewage treatment plant (POND). The pond is densely covered with submerged vegetation such as Ceratophyllum demersum. Great feeding conditions and no fish presence in the pond create the optimal conditions for the development of D. pulex [1,2,3,4,5,11,12]. Phytoplankton communities and chlorophyll a concentration were not determined during the study, although these findings could have been useful for determining feeding conditions for D. pulex. Chlorophyll a measurements, taken the following year during 4 water discharges, indicated that in the summer chlorophyll a concentration was 38–84 µg L−1. Consistent with other study results, the analysis of our findings indicated that the pond provided great feeding conditions for D. pulex. Several authors have indicated that there is a high positive correlation between chlorophyll a concentration and the density of Daphnia species [13,14].
The other sites (in river) were dominated by pelagic rotifers; such a pattern is common in lotic waters due to several reasons. Rotifers are smaller in size and thus may be avoided by fish [9]. Also, their sedimentation is reduced due to their smaller specific weight, and consequently the rotifers may drift long distances, carried by the river current [9,15]. Additionally, the short development cycle allows rotifers to reproduce successfully under favorable conditions even in running waters [16]. However, in the case of this study, the definite quantitative prevalence of rotifers is determined by the presence of a highly eutrophicated lake that provides favorable conditions for the development of zooplankton.
2.2. Sampling Methods
The zooplankton samples were collected for 4 days when the biologically purified water was being discharged from the retention pond by the sewage treatment plant. The sewage treatment plant discharged water for 30 min daily. Zooplankton samples were collected at the above-mentioned sites 10 min before the water discharge was around midday.
At each site, 50 L of water was collected from the river current. The samples were collected using a Van Dorn 5-L water sampler (KC Denmark) at five depths: 20%, 40%, 60%, 80%, and at the surface. At each depth level, 10 L of water was collected to obtain 50 L of water. The water was filtered through a plankton net with a mesh of 30 mm. The samples were then concentrated to 150 mL and fixed in a 4–5% formalin solution. Five sub-samples (2 mL) from the stirred total sample were pipetted into a glass Sedgewick Rafter Counting Chamber. The samples were identified using a Nikon Eclipse 50i microscope. Similarly to methods applied in our research on the relationship between the reduction rate in drifting zooplankton abundance and the type of fish present in the pond, in the course of this study we divided zooplankton into 8 groups, according to the body size and environmental preferences [7]: (i) benthic rotifers (Bdelloidea, Colurellidae, Mytilina sp., Euchlanis sp., Lecane sp., Cephalodella sp.), (ii) planktonic rotifers (Pompholyx sp., Filinidae, Trichocercidae, Brachionidae, Polyarthra sp., Synchaeta sp.), (iii) Asplanchna sp., (iv) small cladocerans (Bosminidae, Chydoridae), (v) large cladocerans (Dapnidae and Diaphanosoma sp. except D. pulex), (vi) adult D. pulex, (vii) cyclopid nauplii, and (viii) copepods (adult copepods and copepodites). Because of their large size and their dominance in the pond and pond outlet, adult individuals of D. pulex were not included in the large cladoceran group, but instead were categorized as a separate group. Planktonic rotifers, benthic rotifers, and cyclopoid nauplii were considered the smallest plankters. Asplanchna sp., bosminids, and chydorids were considered medium-sized plankters, whereas Dapnidae (except for D. pulex), Diaphanosoma sp., and copepods were considered large plankters. The largest plankters observed were D. pulex individuals [17,18,19].
In the attempt to verify food selectivity of fish, 30 roach were caught from the pond outlet site (PO) on the same day when the zooplankton samples were collected. The fish were caught 5 min before the end of the water discharge from the waste stabilization pond by 3 anglers of the Polish Angling Association. The anglers cast fishing rods into the pond outlet, straight into the area where the fish gathered. The fish took the bait immediately. The number of fish needed for the study was caught in a range of 1 min 15 s to 2 min 45 s. None of the fish were discarded. The fish sampling was random, and the fish caught differed in size, mass, and age. We also intended to determine zooplankton selectivity by fish varying in size and age. Scales were used to estimate fish age. The fish were measured and weighed. Total length and mass values were used to calculate the fish condition factor. The means of biomasses and the total body length of fish are shown in Table 1.
The anglers caught 3 fish species—the roach (Rutilus rutilus), the white bream (Abramis bjoerkna), and the bleak (Alburnus alburnus). However, since roach constituted most of the catches (96%) the study focused only on this species. Given the above, we could objectively determine fish foraging efficiency. Once caught, the fish were stunned and killed. Afterwards, fish digestive tracts were preserved in 4% concentration of formaldehyde and taken to the laboratory where their contents were identified.
Given the site locations, no special field sampling permits were needed to conduct our study. We confirm that the land owner (the Polish Angling Association) gave us the permission to conduct the study at the examined sites. All fish were caught in the presence of the fish lake owner. Therefore, no specific permissions were needed for these locations and activities, and no approval of the Institutional Animal Care and Use Committee (IACUC) or an equivalent animal ethics committee was required. The field studies did not involve endangered or protected species. All sampling procedures and experimental manipulations required for our study have been reviewed and specifically approved under the field permit.
2.3. Statistical Analyses
To check for significant differences in abundance between the zooplankton groups found at the sites, the Kruskal–Wallis test was used (p < 0.05). The same test was used to check for significant differences in zooplankton amount between all zooplankton groups found in fish stomachs (p < 0.05). To determine significant differences between sites in terms of abundance and zooplankton number in fish stomachs, we performed post-hoc multiple comparisons of mean ranks for all groups (p < 0.05). The correlations between fish age and amount of zooplankton in fish stomachs were checked using Spearman’s rank correlation (p < 0.05). The aforementioned test was used to calculate the correlations between zooplankton abundance at sites and the zooplankton amount in fish stomachs (p < 0.05).
We checked the model with the Poisson distribution for overdispersion and found that it did not fit the data (p < 0.05). Then we used a generalized linear mixed model with negative binomial error distribution and log link function. The measurement values were added as a random effect. Zooplankton group abundance in the pond (POND) and the lake outlet (RLO) were included as covariates. We hypothesized that species abundance in the pond should increase the abundance at the sampling sites in the river (PO, R1 and R2). For modelling we used the “Mass” package [20] in the R package [21] for the analyses.
3. Results
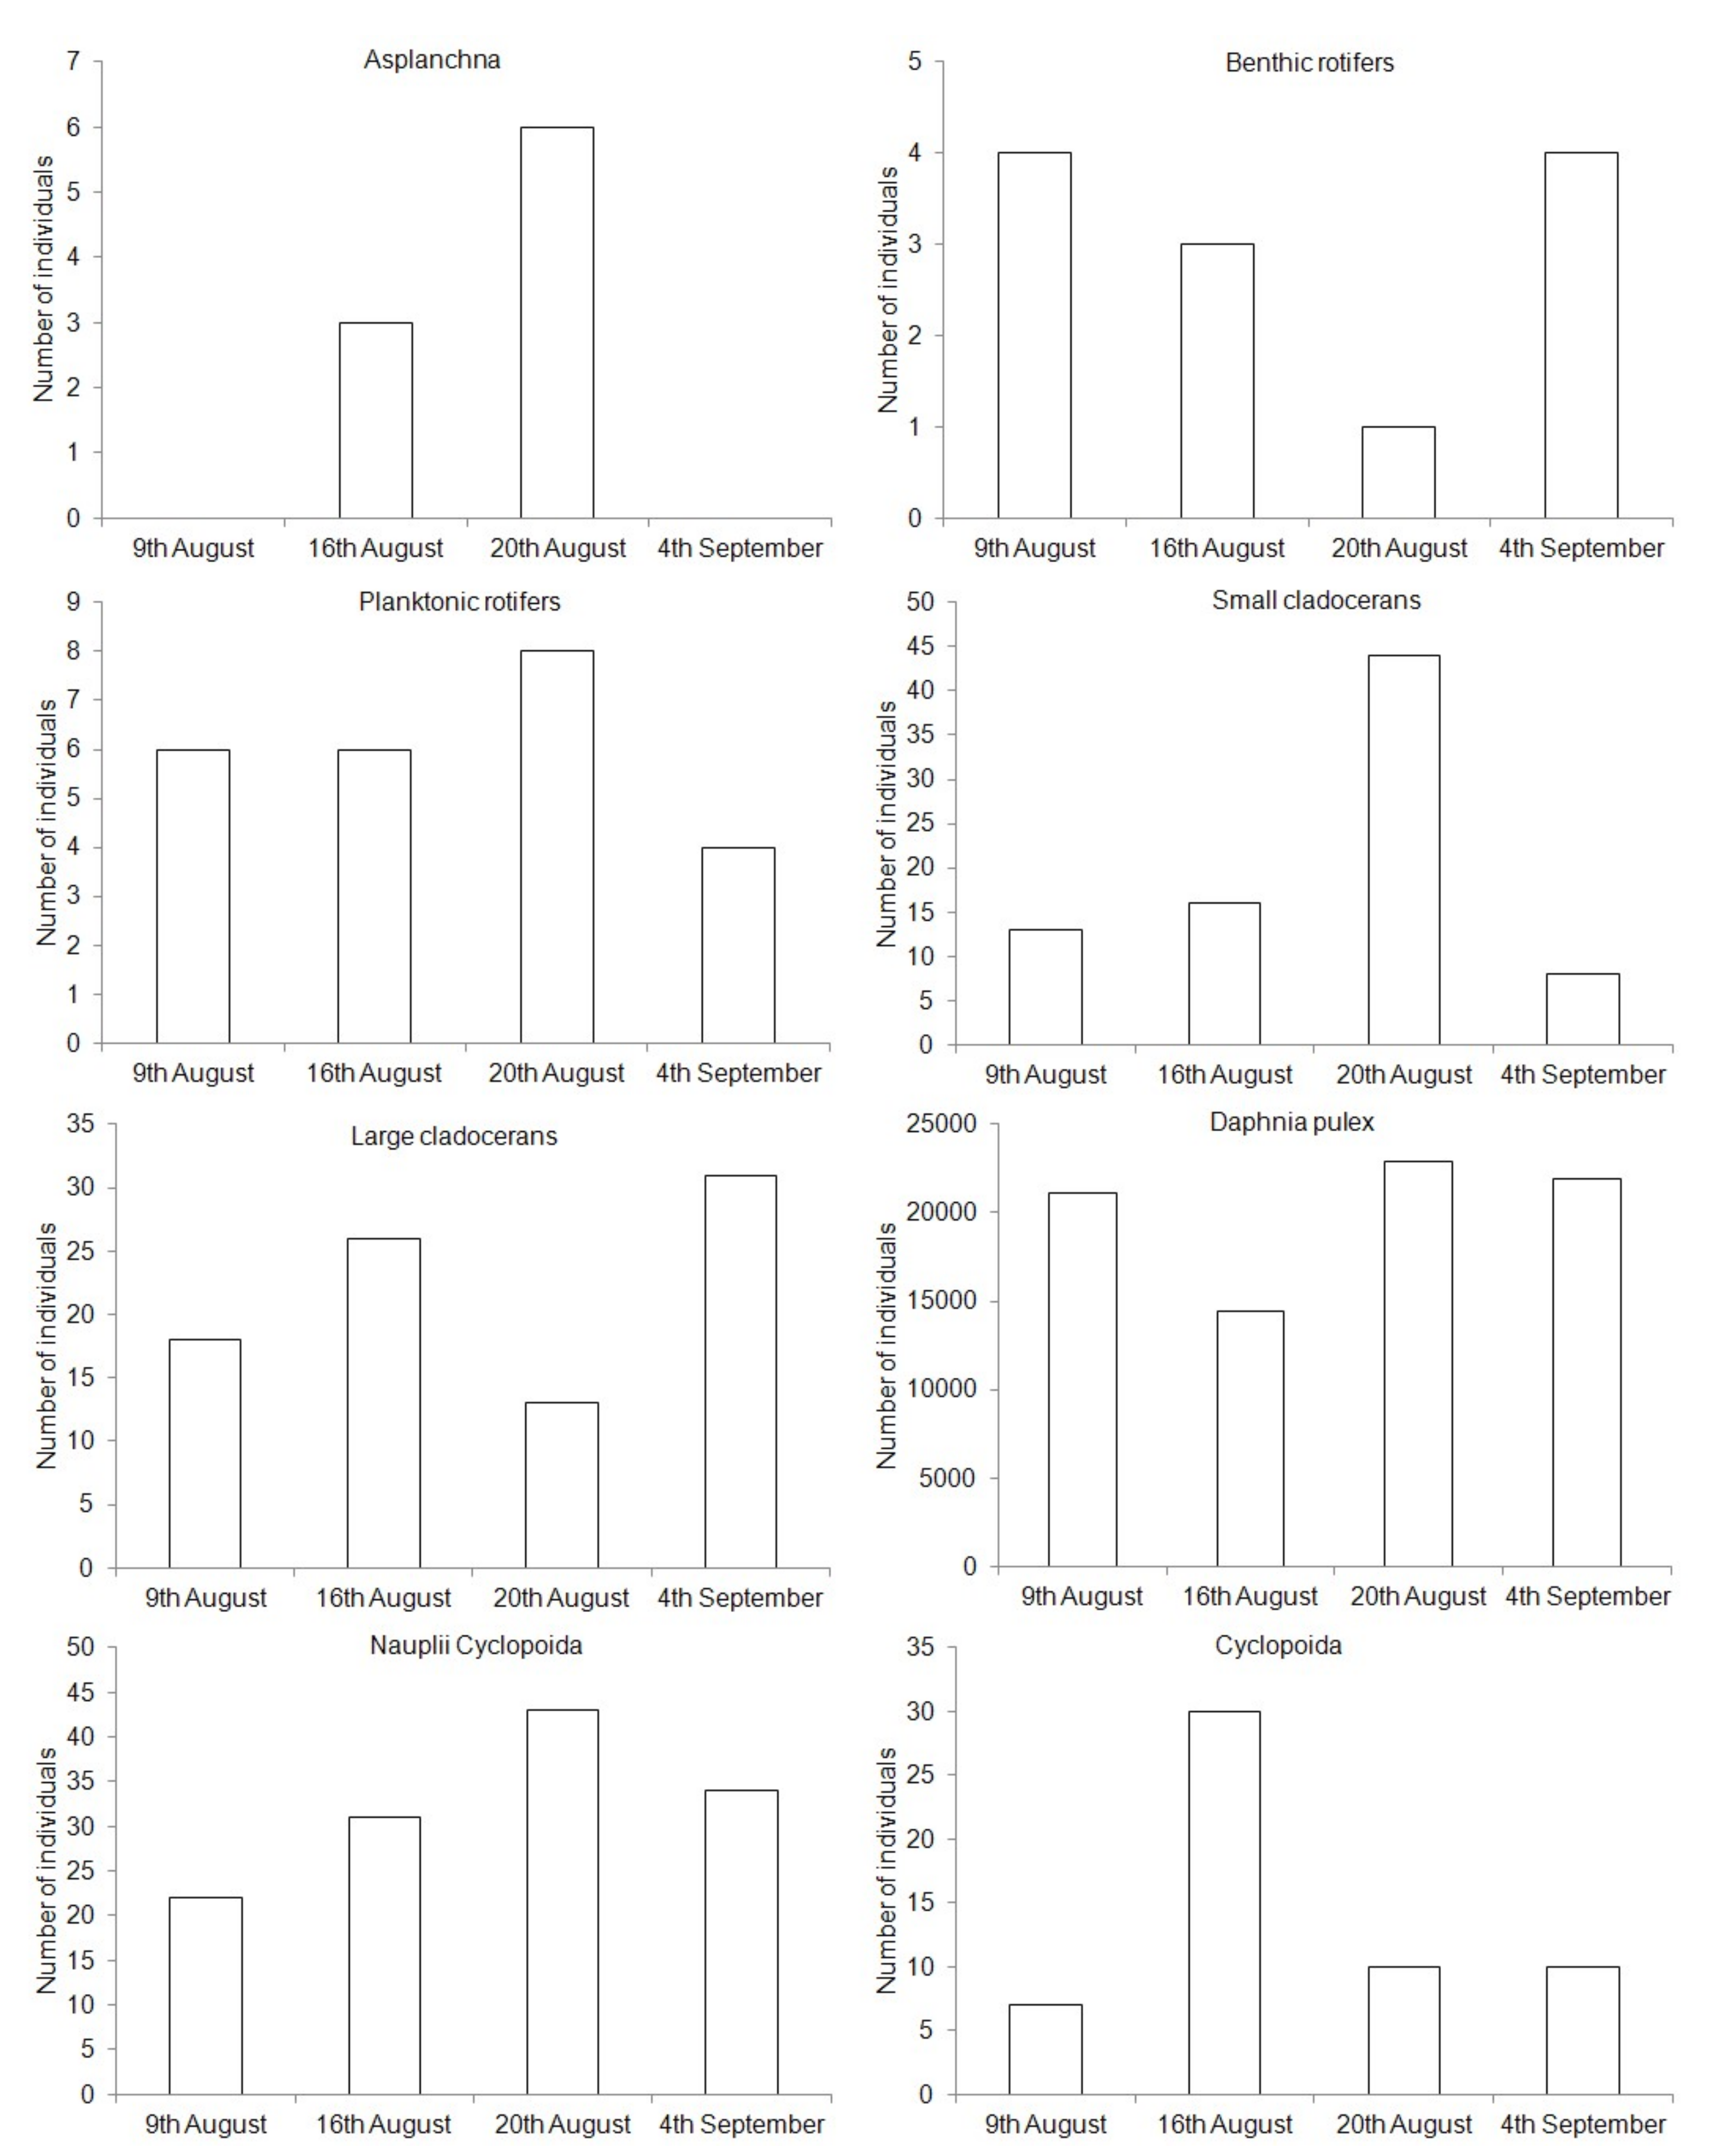
We observed each zooplankton group at all sites except for the PO (Figure 2). The greatest zooplankton density was observed on 20 August. On every day of the data collection, D. pulex were predominant in the pond and in the pond outlet (Figure 2). Other sampling sites were dominated by planktonic Rotifera. A significant reduction of this species below the lake outlet indicates that the fish can consume almost the total amount of D. pulex drifting from the pond (Figure 2, Table 2).
The greatest and most significant reduction in the abundance of drifting zooplankton groups between the PO and the R2 was reported for D. pulex (p < 0.05) (Table 2). Such great reductions were not reported for other zooplankton groups drifting from the lake (p > 0.05) or found between the RLO and the R2 sites, which is a section longer than between the PO and the R2. Even though no significant differences were reported, we noted that the larger the plankter size, the greater the differences in zooplankton abundance between subsequent sites (Figure 2, Table 2).
The model with the Poisson distribution showed that the abundance of zooplankton in the RLO did not affect its abundance at other sites (p > 0.05) (Table 3). We found that abundance in the pond affected the abundance in other sites (p < 0.05) (Table 3). We found that sites R1 and R2 differed significantly from the PO site in terms of D. pulex abundance reduction (p < 0.05) (Table 3).
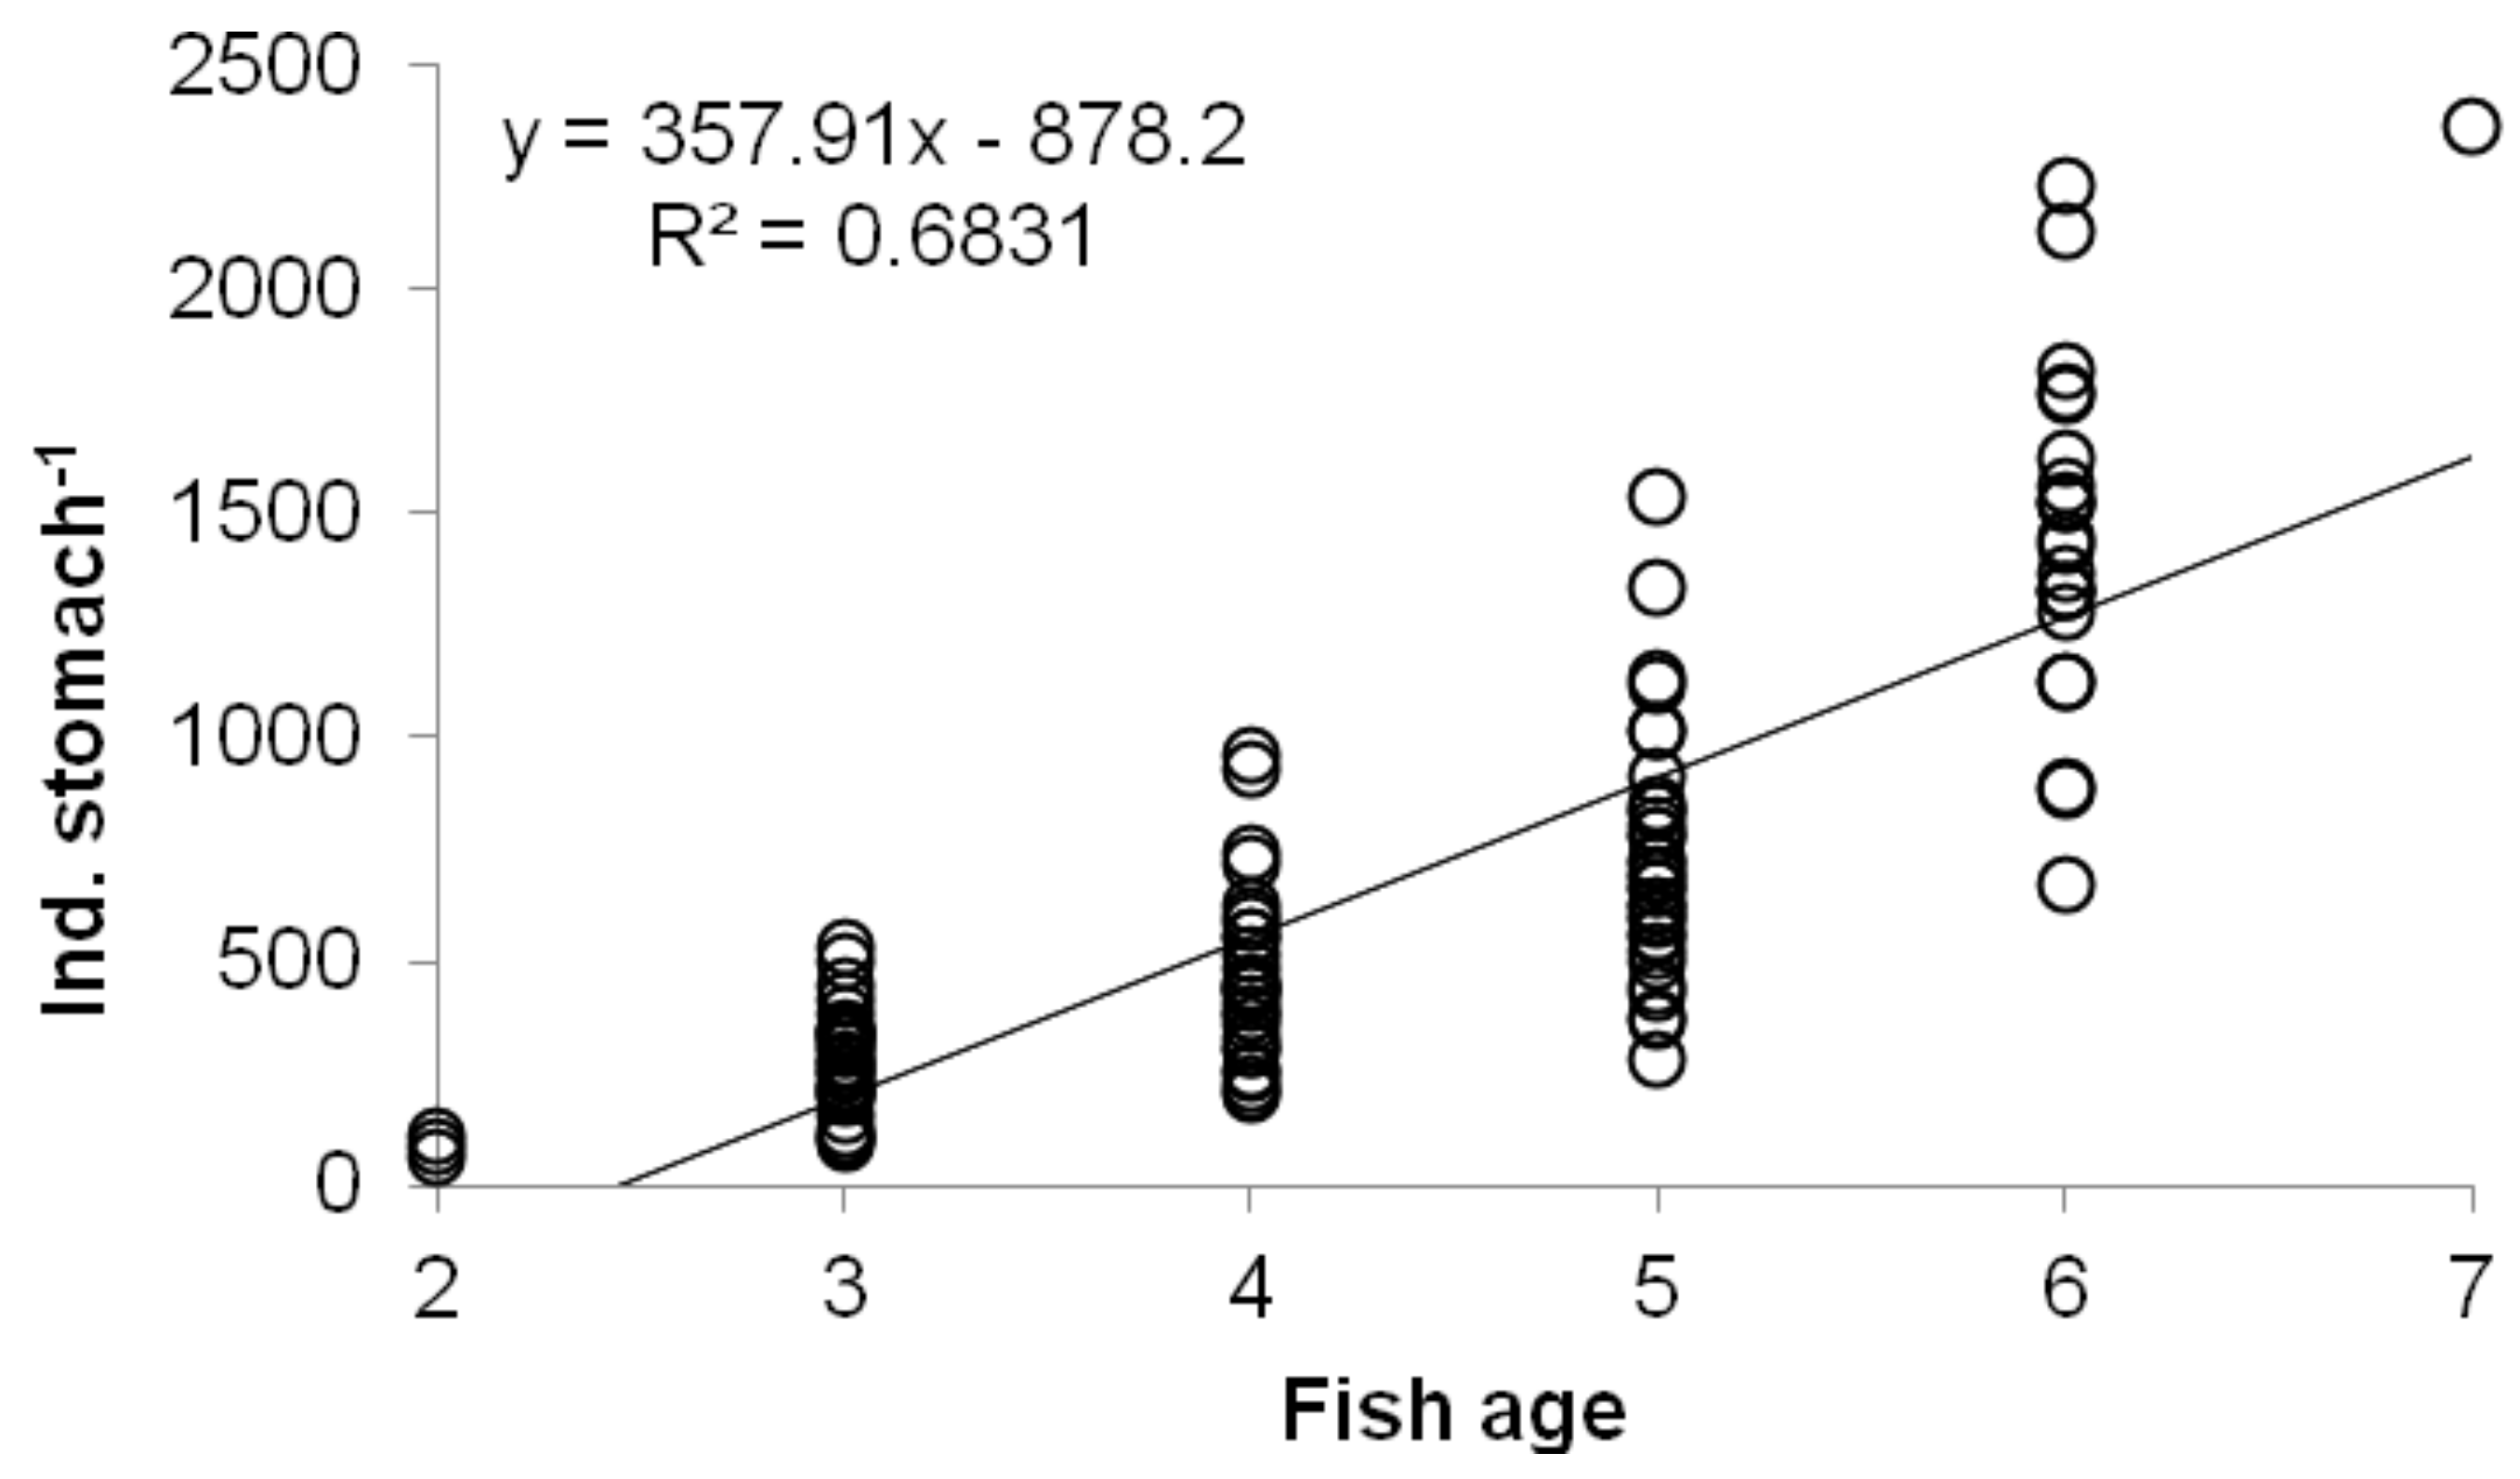
Examination of roach stomach contents showed that their diet consists mainly of D. pulex (Figure 3) because it had the highest percentage contribution of the total plankters across all individuals (Table 4). Even though D. pulex dominated in the stomachs of fish of all ages, we observed that older fish consumed considerably more D. pulex (p < 0.05) than younger fish (Table 4).
A significant correlation between the fish age and the number of zooplankton group individuals in fish stomachs was observed only for D. pulex (p < 0.05) (Figure 4). Correlations between fish age and number of zooplankton individuals from other groups found in fish stomachs were insignificant (p > 0.05).
We did not observe any relationship between the increase in abundance of zooplankton groups in the RLO or in the PO, and a significant increase in the number of individuals of these groups in fish stomachs (p > 0.05) (Table 5). The aforementioned correlation was significant only in the case of large cladocerans in the RLO.
4. Discussion
The present study shows that the reduction in abundance of several large plankters in a short river section may vary from a few percent to almost 100%. Naturally, the larger the zooplankton individuals, the greater the reduction of their abundance [6,7,22]. It would seem that the body size of plankters was a key factor that affected the amount of reduction in species abundance [5,7,9,19,23]. Fish substantially reduced large invertebrate prey, i.e., D. pulex. This species dominates in fish stomachs, and therefore proves that D. pulex abundance has been reduced by fish. Several papers have indicated that fish have a significant impact on the reduction of drifting zooplankton abundance in rivers [6,7,9]. Our study showed that fish are a crucial factor that reduces the abundance of drifting zooplankton in rivers, and their reduction efficiency increases with zooplankton size primarily because preying fish prefer large-bodied zooplankton.
Fish of all ages presented with high condition values due to the consumption of large amounts of D. pulex, which constituted an easily accessible food source. Low standard deviation scores for the fish condition factor indicate small differences in this parameter. This means that all the fish had equal and unlimited access to D. pulex as a food base.
Examination of fish stomach contents showed that older fish consumed less small planktonic organisms and more large-bodied ones, so these findings were not surprising [24]. However, given the results of the present study, it is difficult to prove the same for organisms other than D. pulex, because this species dominated in the stomach content of all fish of all ages. For this reason, when analyzing the plankter abundance reduction it is worth focusing on that specific species.
It is worth considering the correlations between fish age and number of zooplankton group individuals in fish stomachs, which was significant only in the case of D. pulex. Perhaps the correlation would have also been significant in the case of relatively large plankters such as large cladocerans or copepods. However, the fish had a large density of large D. pulex individuals to choose from, and clearly selected for this species. Hence, a conclusion can be drawn that fish made clear food selectivity decisions amongst the biggest plankters, which confirms the assumptions and results of other authors [5,7,9,25]. Even though other large planktonic crustaceans were available, the fish preferred D. pulex. We observed a significant reduction in Copepoda only in the further river sections, which means that fish consume other larger plankters once D. pulex is no longer available.
The results of the present work also show that the higher the abundance of zooplankton groups in a lake outlet or in a pond outlet, the higher the number of these groups observed in fish stomachs. However, there are no significant correlations between these variables to unambiguously support this statement. Perhaps, had the D. pulex been unavailable, the fish would have consumed other zooplankton groups and consequently such a correlation would have been significant. Nonetheless, the fish avoided feeding on small plankters because they provide little energetic gain [9]. The results of our present study also confirmed this hypothesis.
The abundance increase of D. pulex in a pond outlet does not affect the number of individuals in fish stomachs. This means that each day the abundance of D. pulex in the PO was sufficient for the fish biomass who almost entirely reduced the abundance of D. pulex in the river each day. Gliwicz [1] documented a case of continuous zooplankton consumption by fish in Cahora Bassa, Africa, and found that a great amount of easily accessible large zooplankton biomass was consumed by fish even though their stomachs were full. According to Gliwicz [1], it was a natural reaction for fish who had easy and short access to energetic gain. Therefore, despite having a full stomach, fish consume as much food as possible. Presumably, fish in the pond outlet consumed all the available large zooplankton biomass. It also confirms the foraging efficiency of fish examined in our experiment. The results of D. pulex abundance for the examined sites show that fish can consume almost the total amount of this species. This means that the pond outlet has a small effect on the movement of significant D. pulex biomass into the river, and thus on the entry of organic nutrients into it. Another factor is the incorporation of nutrients, eaten by zooplankton, into the fish tissues, and which eventually take part in the circulation of biogenic compounds [24].
The presented work shows the importance in limiting the abundance of drifting zooplankton in rivers by fish and the role of the plankter body size. The larger the plankter-victim’s size, the faster the reduction of its number. In future research, it would be worth focusing on the issue of the efficiency and feeding potential of one fish to determine what size of fish biomass can eat the entire biomass of zooplankton carried away from the pond. This is an important problem, because the analysis of the results of this work does not indicate whether the zooplankton was continuously eaten by the same fish, or if the already fed fish were replaced by hungry fish. Finally, it can be concluded that the fish were more likely to feed on zooplankton drifting from the waste stabilization pond than from the lake. This was influenced by D. pulex individuals, attractive for fish due to them having the largest body size among the analyzed zooplankton, irrespective of the D. pulex percentage in the total abundance of zooplankton. Moreover, zooplankton are a valuable source of nutrients [26].
Author Contributions
Conceptualization, R.C.; methodology, R.C. and T.K.; software, R.C. and T.K.; validation, R.C. and T.K.; formal analysis, R.C. and T.K.; investigation, R.C. and T.K.; resources, R.C. and T.K.; data curation, R.C. and T.K.; writing—original draft preparation, R.C.; writing—review and editing, R.C. and T.K.; visualization, R.C. and T.K.
Funding
This research received no external funding.
Conflicts of Interest
The authors declare no conflict of interest.
References
- Gliwicz, Z.M. A lunar cycle in zooplankton. Ecology 1986, 67, 883–897. [Google Scholar] [CrossRef]
- Christoffersen, K.; Riemann, B.; Klysner, A.; Søndergaard, M. Potential role of fish predation and natural populations of zooplankton in structuring a plankton community in eutrophic lake water. Limnol. Oceanogr. 1993, 38, 561–573. [Google Scholar] [CrossRef]
- Wissel, B.; Boeing, W.J.; Ramcharan, C.W. Effects of water color on predation regimes and zooplankton assemblages in freshwater lakes. Limnol. Oceanogr. 1998, 48, 1965–1976. [Google Scholar] [CrossRef]
- Hoffman, J.C.; Smith, M.E.; Lehman, J.T. Perch or plankton: Top-down control of Daphnia by yellow perch (Perca flavescens) or Bythotrephes cederstroemi in an inland lake? Freshw. Biol. 2001, 46, 759–775. [Google Scholar] [CrossRef]
- Jack, J.D.; Thorp, J.H. Impacts of fish predation on an Ohio River zooplankton community. J. Plankton Res. 2002, 24, 119–127. [Google Scholar] [CrossRef] [Green Version]
- Czerniawski, R.; Domagała, J. Reduction of zooplankton communities in small lake outlets in relation to abiotic and biotic factors. Oceanol. Hydrobiol. Stud. 2013, 42, 123–131. [Google Scholar] [CrossRef]
- Czerniawski, R.; Sługocki, Ł.; Kowalska-Góralska, M. Diurnal changes of zooplankton community reduction rate at lake outlets and related environmental factors. PLoS ONE 2016, 11, e0158837. [Google Scholar] [CrossRef]
- Walks, D.J.; Cyr, H. Movement of plankton through lake-stream systems. Freshw. Biol. 2004, 49, 745–759. [Google Scholar] [CrossRef]
- Chang, K.H.; Doi, H.; Imai, H.; Gunji, F.; Nakano, S.I. Longitudinal changes in zooplankton distribution below a reservoir outfall with reference to river planktivory. Limnology 2008, 9, 125–133. [Google Scholar] [CrossRef]
- Mehner, T. Influence of spring warming on the predation rate of underyearling fish on daphnia—A deterministic simulation approach. Freshw. Biol. 2000, 45, 253–263. [Google Scholar] [CrossRef]
- Kuczyńska-Kippen, N.M.; Nagengast, B. The influence of the spatial structure of hydromacrophytes and differentiating habitat on the structure of rotifer and cladoceran communities. Hydrobiologia 2006, 559, 203–212. [Google Scholar] [CrossRef]
- Estlander, S.; Nurminen, L.; Olin, M.; Vinni, M.; Horppila, J. Seasonal fluctuations in macrophyte cover and water transparency of four brown-water lakes: Implications for crustacean zooplankton in littoral and pelagic habitats. Hydrobiologia 2009, 620, 109–120. [Google Scholar] [CrossRef]
- Kamarainen, A.M.; Rowland, F.E.; Biggs, R.; Carpenter, S.R. Zooplankton and the total phosphorus-chlorophyll a relationship: Hierarchical bayesian analysis of measurement error. Can. J. Fish. Aquat. Sci. 2008, 65, 2644–2655. [Google Scholar] [CrossRef]
- Gołdyn, R.; Kowalczewska-Madura, K. Interactions between phytoplankton and zooplankton in the hypertrophic swarzędzkie Lake in western Poland. J. Plankton Res. 2008, 30, 33–42. [Google Scholar]
- Pourriot, R.; Rougier, C.; Miquelis, A. Origin and development of river zooplankton: Example of the Marne. Hydrobiologia 1997, 345, 143–148. [Google Scholar] [CrossRef]
- Ejsmont-Karabin, J.; Kruk, M. Effects of contrasting land use on free-swimming rotifer communities of streams in Masurian Lake District, Poland. Hydrobiologia 1998, 387/388, 241–249. [Google Scholar] [CrossRef]
- Radwan, S. Wrotki (Rotifera); Wydawnictwo Uniwersytetu Łódzkiego: Łódź, Polska, 2004; pp. 1–447. [Google Scholar]
- Rybak, J.I.; Błędzki, L.A. Planktonic Crustaceans of Freshwaters; Wydawnictwo Uniwersytetu Warszawskiego: Warszawa, Poland, 2010; pp. 1–366. [Google Scholar]
- Czerniawski, R.; Domagała, J. Small dams profoundly alter the spatial and temporal composition of zooplankton communities in running waters. Int. Rev. Hydrobiol. 2014, 99, 300–311. [Google Scholar] [CrossRef]
- Venables, W.N.; Ripley, B.D. Modem Applied Statistics with S. Fourth Edition; Springer: New York, USA, 2002; pp. 1–487. [Google Scholar]
- R Core Team. A Language and Environment for Statistical Computing—R Foundation for Statistical Computing; Vienna, Austria. 2018. Available online: https://www.R-project.org (accessed on 20 December 2018).
- Czerniawski, R.; Domagała, J. Zooplankton communities of two lake outlets in relation to abiotic factors. Open Life Sci. 2010, 5, 240–255. [Google Scholar] [CrossRef]
- Czerniawski, R.; Domagała, J. Similarities in zooplankton community between river drawa and its two tributaries (Polish part of River Odra). Hydrobiologia 2010, 638, 137–149. [Google Scholar] [CrossRef]
- Bone, Q.; Moore, R. Biology of Fishes; Taylor and Francis: New York, NY, USA, 2008; pp. 1–497. [Google Scholar]
- Akopian, M.; Garnier, J.; Pourriot, R. A large reservoir as a source of zooplankton for the river: Structure of the populations and influence of fish predation. J. Plankton Res. 1999, 21, 285–297. [Google Scholar] [CrossRef]
- Meeren, T.; Olsen, E.R.; Hamre, K.; Fyhn, J.H. Biochemical composition of copepods for evaluation of feed production of juvenile marine fish. Aquaculture 2008, 274, 375–379. [Google Scholar] [CrossRef]
Figure 1.
Scheme of the study area. RLO—river outflow from the lake; POND—waste stabilization pond of sewage treatment plant; PO—pond outflow; R1—site in the river, 20 m below the pond outflow; R2—site in the river, 40 m below the pond outflow.
Figure 1.
Scheme of the study area. RLO—river outflow from the lake; POND—waste stabilization pond of sewage treatment plant; PO—pond outflow; R1—site in the river, 20 m below the pond outflow; R2—site in the river, 40 m below the pond outflow.

Figure 2.
Abundance of zooplankton at examined sites.

Figure 3.
Total number of zooplankton individuals in stomachs of total fish.

Figure 4.
Significant Spearman correlations between fish age and abundance of D. pulex in fish stomach (R = 0.86, p < 0.0001).
Figure 4.
Significant Spearman correlations between fish age and abundance of D. pulex in fish stomach (R = 0.86, p < 0.0001).


Table 1.
Mean values ± SD of total length, mass and condition factor of fish.
| Date | Fish Age | Length (cm) | Mass (g) | Condition Factor |
|---|---|---|---|---|
| 9th August | 6+ (n = 2) | 13.70 ± 0.57 | 35.05 ± 5.16 | 1.36 ± 0.03 |
| 5+ (n = 10) | 10.88 ±1.05 | 17.25 ± 4.92 | 1.31 ± 0.08 | |
| 4+ (n = 7) | 10.31 ± 0.39 | 13.80 ± 1.91 | 1.25 ± 0.11 | |
| 3+ (n = 11) | 8.69 ± 0.34 | 8.09 ± 1.58 | 1.22 ± 0.13 | |
| 16th August | 6+ (n = 4) | 12.58 ± 0.62 | 23.90 ± 3.63 | 1.20 ± 0.10 |
| 5+ (n = 6) | 10.57 ± 1.05 | 14.78 ± 3.55 | 1.24 ± 0.10 | |
| 4+ (n = 13) | 9.14 ± 0.82 | 9.30 ± 2.99 | 1.17 ± 0.11 | |
| 3+ (n = 5) | 7.42 ± 0.22 | 4.72 ± 0.69 | 1.15 ± 0.08 | |
| 2+ (n = 2) | 6.20 ± 0.14 | 2.55 ± 0.07 | 1.07 ± 0.10 | |
| 20th August | 7+ (n = 1) | 14.30 | 39.40 | 1.35 |
| 6+ (n = 7) | 12.37 ± 0.76 | 24.63 ± 3.93 | 1.29 ± 0.09 | |
| 5+ (n = 7) | 11.03 ± 0.73 | 17.30 ± 3.96 | 1.27 ± 0.07 | |
| 4+ (n = 5) | 9.40 ± 0.72 | 10.74 ± 2.44 | 1.28 ± 0.05 | |
| 3+ (n = 9) | 7.42 ± 0.36 | 5.19 ± 0.77 | 1.26 ± 0.07 | |
| 2+ (n = 1) | 5.60 | 2.20 | 1.25 | |
| 4th September | 6+ (n = 9) | 12.16 ± 0.30 | 23.14 ± 1.90 | 1.29 ± 0.04 |
| 5+ (n = 9) | 11.38 ± 0.31 | 18.88 ± 1.71 | 1.28 ± 0.05 | |
| 4+ (n = 3) | 8.47 ± 0.46 | 7.50 ± 1.68 | 1.22 ± 0.09 | |
| 3+ (n = 9) | 7.49 ± 0.33 | 5.31 ± 0.94 | 1.25 ± 0.10 |
Table 2.
Mean ± SD of the zooplankton groups abundance at examined sites (n = 4). Different letters in rows show significant differences between sites (post-hoc multiple comparisons of mean ranks for all groups p < 0.05).
Table 2.
Mean ± SD of the zooplankton groups abundance at examined sites (n = 4). Different letters in rows show significant differences between sites (post-hoc multiple comparisons of mean ranks for all groups p < 0.05).
| Zooplankton Group | RLO | POND | PO | R1 | R2 |
|---|---|---|---|---|---|
| Asplanchna | 17.4 ± 18.2 a | 4.7 ± 8.9 ab | 2.5 ± 5.0 b | 12.4 ± 11.2 ab | 9.6 ± 9.6 ab |
| Benthic rotifers | 18.9 ± 11.6 a | 4.3 ± 6.8 a | 2.4 ± 1.1 a | 23.3 ± 22.0 a | 24.5 ± 17.9 a |
| Planktonic rotifers | 351.5 ± 216.7 a | 37.7 ± 30.3 ab | 24.9 ± 21.2 b | 313.6 ± 178.8 ab | 325.4 ± 202.5 ab |
| Small cladocerans | 38.6 ± 16.8 ab | 54.2 ± 51.8 ab | 39.7 ± 45.4 ab | 46.8 ± 32.8 ab | 28.3 ± 15.8 ab |
| Large cladocerans | 6.0 ± 3.9 ab | 0.6 ± 0.7 ab | - | 2.9 ± 2.1 ab | 1.0 ± 0.5 ab |
| Daphnia pulex | - | 122.9 ± 62.5 a | 84.4 ± 57.5 a | 9.1 ± 9.6 b | 0.8 ± 1.0 b |
| Nauplii Cyclopoida | 57.5 ± 59.3 a | 7.7 ± 6.5 ab | 4.5 ± 3.1 b | 61.4 ± 73.8 ab | 50.5 ± 65.3 ab |
| Cyclopoida | 21.2 ± 10.2 a | 6.9 ± 2.9 b | 3.9 ± 2.4 b | 20.6 ± 9.3 a | 8.5 ± 4.6 ab |
Table 3.
Estimates of fitted model with species abundance as dependent variable. Significant results are marked with bold.
Table 3.
Estimates of fitted model with species abundance as dependent variable. Significant results are marked with bold.
| Fixed Effects | Estimate | Std. Error | z Value | p |
|---|---|---|---|---|
| (Intercept) | 0.803 | 0.426 | 1.883 | 0.060 |
| R1 vs PO | 1.492 | 0.492 | 3.035 | 0.002 |
| R2 vs PO | 1.248 | 0.500 | 2.496 | 0.013 |
| Benthic rotifers | −0.311 | 0.602 | −0.516 | 0.606 |
| Cyclopoida | 0.336 | 0.538 | 0.625 | 0.532 |
| Daphnia pulex | 1.825 | 0.581 | 3.142 | 0.002 |
| Large cladocerans | −21.717 | 42.375 | −0.512 | 0.608 |
| Nauplii Cyclopoida | 0.251 | 0.538 | 0.466 | 0.641 |
| Planktonic rotifers | 1.167 | 0.594 | 1.965 | 0.049 |
| Small cladocerans | 1.678 | 0.502 | 3.344 | 0.001 |
| RLO | 0.001 | 0.001 | 1.209 | 0.227 |
| POND | 0.013 | 0.003 | 4.384 | <0.001 |
| R1 vs PO: Benthic rotifers | 0.951 | 0.714 | 1.333 | 0.182 |
| R2 vs PO: Benthic rotifers | 1.273 | 0.719 | 1.769 | 0.077 |
| R1 vs PO: Cyclopoida | 0.240 | 0.663 | 0.362 | 0.717 |
| R2 vs PO: Cyclopoida | −0.400 | 0.682 | −0.586 | 0.558 |
| R1 vs PO: Daphnia pulex | −3.903 | 0.635 | −6.149 | <0.001 |
| R2 vs PO: Daphnia pulex | −6.017 | 0.850 | −7.075 | <0.001 |
| R1 vs PO: Large cladocerans | 20.295 | 42.376 | 0.479 | 0.632 |
| R2 vs PO: Large cladocerans | 18.908 | 42.377 | 0.446 | 0.655 |
| R1 vs PO: Nauplii Cyclopoida | 1.137 | 0.656 | 1.733 | 0.083 |
| R2 vs PO: Nauplii Cyclopoida | 1.148 | 0.663 | 1.730 | 0.084 |
| R1 vs PO: Planktonic rotifers | 1.282 | 0.614 | 2.087 | 0.037 |
| R2 vs PO: Planktonic rotifers | 1.527 | 0.621 | 2.458 | 0.014 |
| R1 vs PO: Small cladocerans | −0.993 | 0.614 | −1.619 | 0.106 |
| R2 vs PO: Small cladocerans | −1.173 | 0.624 | −1.879 | 0.060 |
Table 4.
Mean values ± SD of percentage contribution of zooplankton abundance in fish stomachs. Different letters in rows show significant differences between fish-age samples (post-hoc multiple comparisons of mean ranks for all groups p < 0.05).
Table 4.
Mean values ± SD of percentage contribution of zooplankton abundance in fish stomachs. Different letters in rows show significant differences between fish-age samples (post-hoc multiple comparisons of mean ranks for all groups p < 0.05).
| Fish age | 2+ | 3+ | 4+ | 5+ | 6+ | 7+ | |
| n | 3 | 34 | 28 | 32 | 22 | 1 | |
| Zooplankton group | Asplanchna | - | 0.03 ± 0.10 a | 0.02 ± 0.09 a | 0.01 ± 0.04 a | 0.01 ± 0.03 a | - |
| Benthic rotifers | 0.88 ± 1.52 a | 0.10 ± 0.31 a | 0.02 ± 0.06 a | - | - | - | |
| Pelagic rotifers | 1.02 ± 0.91 a | 0.23 ± 0.47 a | 0.03 ± 0.10 a | 0.02 ± 0.08 a | - | - | |
| Small cladocerans | 2.50 ± 0.22 a | 0.40 ± 0.83 ab | 0.16 ± 0.35 ab | 0.05 ± 0.12 b | 0.04 ± 0.07 b | 0.25 ab | |
| Large cladocerans | 0.88 ± 1.52 a | 0.26 ± 0.47 a | 0.15 ± 0.23 a | 0.10 ± 0.16 a | 0.09 ± 0.12 a | 0.08 a | |
| Daphnia pulex | 90.96 ± 7.01 a | 98.11 ± 2.13 a | 99.16 ± 1.13 ab | 99.65 ± 0.32 ab | 99.74 ± 0.27 b | 99.58 ab | |
| Nauplii | 3.32 ± 3.29 a | 0.39 ± 0.62 ab | 0.18 ± 0.40 ab | 0.02 ± 0.07 b | 0.01 ± 0.03 b | - | |
| Cyclopoida | 0.44 ± 0.76 a | 0.47 ± 0.80 a | 0.27 ± 0.52 a | 0.15 ± 0.20 a | 0.12 ± 0.20 a | - | |
Table 5.
Spearman correlations between zooplankton group abundance in RLO and PO sites versus number of zooplankton in fish stomachs (p < 0.05). Ab.—abundance in water, Stom.—number in stomach. Significant results are marked in bold.
Table 5.
Spearman correlations between zooplankton group abundance in RLO and PO sites versus number of zooplankton in fish stomachs (p < 0.05). Ab.—abundance in water, Stom.—number in stomach. Significant results are marked in bold.
| Site RLO | n | r | p |
|---|---|---|---|
| Ab. Asplanchna vs. Stom. Asplanchna | 4 | 0.74 | 0.262 |
| Ab. Benthic rotifers vs. Stom. Benthic rotifers | 4 | −0.74 | 0.262 |
| Ab. Planktonic rotifers vs. Stom. Pelagic rotifers | 4 | 0.32 | 0.683 |
| Ab. Small cladocerans vs. Stom. Small cladocerans | 4 | 0.80 | 0.200 |
| Ab. Large cladocerans vs. Stom. Large cladocerans | 4 | 0.99 | 0.001 |
| Ab. Daphnia pulex vs. Stom. Daphnia pulex | 1 | - | - |
| Ab. Nauplii Cyclopoida vs. Stom. Nauplii | 4 | 0.63 | 0.367 |
| Ab. Cyclopoida vs. Stom. Cyclopoida | 4 | 0.80 | 0.200 |
| Site PO | |||
| Ab. Asplanchna vs. Stom. Asplanchna | 1 | - | - |
| Ab. Benthic rotifers vs. Stom. Benthic rotifers | 4 | 0.94 | 0.051 |
| Ab. Planktonic rotifers vs. Stom. Pelagic rotifers | 4 | 0.32 | 0.684 |
| Ab. Small cladocerans vs. Stom. Small cladocerans | 4 | 0.80 | 0.200 |
| Ab. Large cladocerans vs. Stom. Large cladocerans | 0 | - | - |
| Ab. Daphnia pulex vs. Stom. Daphnia pulex | 4 | 0.80 | 0.200 |
| Ab. Nauplii Cyclopoida vs. Stom. Nauplii | 4 | 0.83 | 0.167 |
| Ab. Cyclopoida vs. Stom. Cyclopoida | 4 | 0.60 | 0.400 |
© 2019 by the authors. Licensee MDPI, Basel, Switzerland. This article is an open access article distributed under the terms and conditions of the Creative Commons Attribution (CC BY) license (http://creativecommons.org/licenses/by/4.0/).
Share and Cite
MDPI and ACS Style
Czerniawski, R.; Krepski, T. Zooplankton Size as a Factor Determining the Food Selectivity of Roach (Rutilus Rutilus) in Water Basin Outlets. Water 2019, 11, 1281. https://0-doi-org.brum.beds.ac.uk/10.3390/w11061281
AMA Style
Czerniawski R, Krepski T. Zooplankton Size as a Factor Determining the Food Selectivity of Roach (Rutilus Rutilus) in Water Basin Outlets. Water. 2019; 11(6):1281. https://0-doi-org.brum.beds.ac.uk/10.3390/w11061281
Chicago/Turabian StyleCzerniawski, Robert, and Tomasz Krepski. 2019. "Zooplankton Size as a Factor Determining the Food Selectivity of Roach (Rutilus Rutilus) in Water Basin Outlets" Water 11, no. 6: 1281. https://0-doi-org.brum.beds.ac.uk/10.3390/w11061281
Note that from the first issue of 2016, this journal uses article numbers instead of page numbers. See further details here.