Human-Induced Alterations to Land Use and Climate and Their Responses for Hydrology and Water Management in the Mekong River Basin


Department of Biological Systems Engineering, Virginia Polytechnic Institute and State University, Blacksburg, VA 24061, USA
*
Author to whom correspondence should be addressed.
Water 2019, 11(6), 1307; https://0-doi-org.brum.beds.ac.uk/10.3390/w11061307
Submission received: 26 April 2019
/
Revised: 7 June 2019
/
Accepted: 19 June 2019
/
Published: 25 June 2019
(This article belongs to the Special Issue Climate Variability and Climate Change Impacts on Land Surface, Hydrological Processes and Water Management)
Abstract
:The Mekong River Basin (MRB) is one of the significant river basins in the world. For political and economic reasons, it has remained mostly in its natural condition. However, with population increases and rapid industrial growth in the Mekong region, the river has recently become a hotbed of hydropower development projects. This study evaluated these changing hydrological conditions, primarily driven by climate as well as land use and land cover change between 1992 and 2015 and into the future. A 3% increase in croplands and a 1–2% decrease in grasslands, shrublands, and forests was evident in the basin. Similarly, an increase in temperature of 1–6 °C and in precipitation of 15% was projected for 2015–2099. These natural and climate-induced changes were incorporated into two hydrological models to evaluate impacts on water budget components, particularly streamflow. Wet season flows increased by up to 10%; no significant change in dry season flows under natural conditions was evident. Anomaly in streamflows due to climate change was present in the Chiang Saen and Luang Prabang, and the remaining flow stations showed up to a 5% increase. A coefficient of variation <1 suggested no major difference in flows between the pre- and post-development of hydropower projects. The results suggested an increasing trend in streamflow without the effect of dams, while the inclusion of a few major dams resulted in decreased river streamflow of 6% to 15% possibly due to irrigation diversions and climate change. However, these estimates fall within the range of uncertainties in natural climate variability and hydrological parameter estimations. This study offers insights into the relationship between biophysical and anthropogenic factors and highlights that management of the Mekong River is critical to optimally manage increased wet season flows and decreased dry season flows and handle irrigation diversions to meet the demand for food and energy production.

1. Introduction
The Mekong is one of the most important rivers in Asia. Its significance is evident from its geographical location, topographic variability, biodiversity, and large population of inhabitants in the basin. A cascade of dams, population increase, and climate change have also complicated hydrology and water resources management in the Mekong River Basin (MRB). The nexus of food–energy–water is highly pronounced as the basin relies on rice production and fisheries to feed the population. The conversion of lands from forests to agriculture, subsequent expansion and intensification of irrigation, and hydropower development projects have changed the characteristics of the MRB, in which the river previously flowed unhindered for most of its length [1,2]. The Tibetan Plateau in China—where the river originates at about 4000 m—and the downstream regions are going through natural and human-induced climatic changes and experiencing a general increase in precipitation and temperature in the 21st century, and this can affect the basin’s hydrology. Low flow days are expected to decrease and flooding potential may also increase, and hence policies to mitigate the impacts are urgently needed [3,4].
Considerable implications of dam constructions, climate change, irrigation, and land use change to downstream ecosystems have resulted in numerous studies to predict floods, droughts, and sediment yield over the past two decades [5,6,7]. The next few paragraphs will cover some of these studies and identify the knowledge gaps that still exist. Specifically, the understanding of unintended consequences of dams require a comprehensive investigation of reservoir management [8]. Construction and initial filling of the upstream dams reduced the annual streamflow in wet seasons and increased the streamflow in dry seasons, resulting in a unique seasonal variation in the streamflow [9], and the dams had significant impacts on the low pulse duration. Besides, study authors [10,11] reported that construction of dams in the basin is expected to decrease total sediment transportation by 40%–80% over the whole basin, which would impact the river’s morphology, aquatic biodiversity, ecosystem services, and agriculture.
By employing simulation models, many studies have projected the basin conditions, but the uncertainties in climate model projections are greater than those of the hydrological models; therefore, comparisons of different climate models and hydrological model outputs at a relatively high resolution are necessary to characterize these uncertainties [12,13]. Study authors [14,15] evaluated the climate change impacts on the hydrological characteristics of the Harvey River catchment in western Australia and the Richmond River catchment in eastern Australia using a rainfall-runoff model (HBV model) and climate model outputs from the Coupled Model Intercomparison Project 5 (CMIP5). The results suggested that there were decreases and increases in the mean annual flows due to the precipitation and temperature variabilities in the future. In another study [16], authors compared two different models (conceptual-HBV and distributed-BTOPMC) in several catchments in Australia and assessed the impacts of climate change on streamflow. Both models simulated a decrease in wet and dry season streamflow across the catchments. An evaluation of the water resource development scenarios over different future time periods’ horizons by Piman et al. [17] reported reductions in the average wet season flows by 4%–14% and flow reversal to the Tonle Sap Lake by up to 16%. It predicted an increase in flooded areas by 5%–8% and in salinity intrusion areas in the Viet Nam Delta by up to 17% in the future. It was also reported that the small and nonlinear response of annual river discharge to progressive change in global mean temperature, the change in monthly river discharge varying from −16% to +55%—showed the greatest decrease in July–August and increase in May–June for natural flow only. The impacts of climate change for six catchments around the world, including the Mekong Basin, using a global hydrological model (GHM) and catchment-scale hydrological models (CHM) was performed by [18], and this study reported that substantial differences in the projected change of mean annual runoff between GHM and CHM were dependent on climate model outputs and did not evaluate the regulated flow impacted by the reservoirs. Finally, a semi-distributed hydrological model (SLURP) with the pattern-scaled GCM scenarios was used by [19] to assess the impact of climate change on the freshwater resources associated with GCM structure and climate change sensitivity in the Mekong River Basin.
The effect of land use land cover change (LULCC) impact on the water balance studied by Homdee et al. [20] using the soil and water assessment tool (SWAT) in the Chi River basin, Thailand, reported that land use changes impacted annual and seasonal water yield and evapotranspiration (ET). In addition, the conversion of forested area and agricultural lands affected the flow regimes in the basin. Replacing sugarcane with rice paddies resulted in clearly reduced water flows and increased ET by almost 5.0% during the dry season. Also, the increased conversion of rice paddies to farmland showed a significant effect on seasonal flows. Also, the results of this change showed a decrease in ET by 12.0% and an increase in water yield by 5.1% during the dry season. However, the implications of this study for the entire Mekong basin is not well understood. Another study [21] evaluated, the Mae Chaem River—which was subjected to land use change—by developing three plausible future forest-to-crop expansion scenarios and a scenario of crop-to-forest reversal based on the land cover transition from 1989 to 2000. In this study, the resulting hydrologic responses of the basin were simulated using the distributed hydrology soil vegetation model (DHSVM). The authors also reported that the expansion of highland crop fields affected annual and wet-season water yields compared with a similar expansion in the lowland–midland zone and that the downstream sections of the river were sensitive to irrigation diversion.
The effect of irrigation water abstraction on the streamflow, energy state, and fluxes was evaluated using a model simulation to predict changes in the Bowen Ratio, surface temperature, and water resources within the Mekong River Basin based on the variable infiltration capacity (VIC) macroscale hydrological model [22]. Their results revealed a significant decrease in the Bowen Ratio and surface temperature due to irrigation water withdrawal. The irrigation water withdrawals from runoff, river channels, and dams decreased the total monthly runoff by 32%. Study authors [1] identified the relative roles of precipitation and soil moisture in runoff variability in the Mekong River Basin and reported that simulated soil moisture plays an important role in determining the timing and amount of generated runoff.
However, while these studies reported the changing biophysical conditions of the basin, flow regimes, hydroclimatic extremes, and ecosystems, long-term simulation of the basin hydrology highlighting the role of land use and climate change as well as the effect of dams on the downstream flows have been limited. To our knowledge there is no study that compared SWAT and VIC simulations as well as with and without-reservoir effects. Given their differences in model structure and strengths in simulating global river basins, how they characterize the basin responses under changing conditions of land use and climate change needs a periodic reanalysis. Finally, two different hydrology models are implemented to understand how the major reservoirs play a role in modifying the peak flow in the wet season and low flows in the dry season. While management inputs are needed to precisely quantify the impoundment effects, sensitivity analysis of regulated and natural flows has the potential to know the role of human-induced changes to the flow regimes. Due to the range of predictions and uncertainties, it is imperative to evaluate the changing conditions in the basin in the multi-model framework in order to generate an updated assessment for policy decisions. Therefore, our objective is to evaluate two macroscale hydrological models in capturing basin responses and investigate the historical streamflow changes by explicitly considering the effect of dams and future projections of streamflow and other water budget components. We use both SWAT and VIC to evaluate the hydroclimatological behavior by including six major dams and two climate model projections combined with four global circulation models to characterize the peak flow regime shifts in the basin.
2. Materials and Methods
2.1. The Mekong River Basin
MRB covers an area of about 800,000 km2 and the mainstem and its tributaries drain six countries: China, Myanmar, Thailand, Laos, Cambodia, and Vietnam. The basin is divided into seven sub-watersheds with flow stations and major dams as shown in Figure 1a. The upper reaches of the Mekong River flow through higher elevations in the Himalayan mountain ranges, through the steep terrain of Laos and Thailand and the lowlands of Cambodia, and into the delta in Vietnam before draining into the South China Sea. For both development and management of this transboundary river basin, a complex river basin agreement was formulated between the member countries and coordinated by the Mekong River Commission; however, rapid changes in this basin have necessitated a comprehensive understanding of conditions in a system modeling framework.
The mean annual discharge from the basin is approximately 15,000 km3/year. The heterogeneous distribution of the precipitation follows an east–west gradient, with the mean annual value of 1200 mm. Nearly 70% of the annual precipitation in the MRB occurs during the monsoon season. However, the temperature and elevation variations follow a north–south gradient. The temperature in the MRB varies from 38 °C during March–April to 15 °C during November–February. Since conditions in the MRB are hot and humid with the glaciated portion for the upper region, the climate is classified as tropical monsoonal. The elevation drop of more than 4900 m in the MRB also affects the climate heterogeneity. A major portion of the MRB is covered with croplands (40%), followed by evergreen broadleaf forest (28%), closed shrublands (10.3%), and grasslands (9.3%). Irrigated wet season rice grown throughout the year and fishing (4.4 million tons per year) provide food security to more than 60 million people residing in the MRB. In addition, the hydropower potential of the MRB amounts to more than 88,000 MW, with only a small portion utilized. Hence, more than 450 dam projects are currently being planned/constructed by the member countries to take advantage of the hydropower capabilities of the MRB.
2.2. Hydrological Models
Both VIC and SWAT have been widely used in our previous studies in several basins around the world and both are currently incorporated in the Mekong River simulation studies. The physical diagrams of these models are available in published literature and websites [23,24]. The range of applications to evaluate water resource problems includes drought [25,26,27,28], water management [29,30], and climate impacts [31,32,33,34]. The VIC model is grid-based, whereas SWAT is a hydrologic response unit (HRU)-based model that is defined using soil, slope, and land-use data. The resolution of the VIC model varies depending on the availability of forcing data. In our study, we used 0.25° (about 25 km), while the SWAT model considered 1153 climate grids at the same resolution but subdivided into 2196 sub-watersheds. The VIC model was implemented to simulate the natural flows in the basin, whereas the SWAT model was used to simulate both natural and managed flows across selected reservoirs.
The SWAT model [35,36,37] is a river basin-scale, semi-distributed, and continuous model that generates hydrologic variables based on hydrologic response units (HRUs), which combine diverse land uses, soil types, and slopes. SWAT has been applied to various river basins around the globe to evaluate climate change impacts on streamflow [38,39,40], agricultural systems [41], and hydrologic extremes [25,26,42,43]. SWAT estimates several hydrologic components—such as surface runoff, baseflow, evapotranspiration (ET), and soil moisture—which are the primary variables for streamflow calculation (Equation (1)).
where is the final soil water (mm) on day i, t is the time (days), is the initial soil water on day i, is the daily precipitation (mm), is the surface runoff (mm), is the evapotranspiration (mm), is the water entering to the vadose zone from the soil layer (mm), and is the return flow (mm).
The SWAT model needs a meteorological dataset (e.g., daily precipitation, maximum and minimum temperatures), digital elevation model (DEM), soil properties, and land use. For the historic simulation (1951–2015), a 0.25° resolution of the meteorological forcing dataset was applied [44,45]. The MRB was delineated as 2196 sub-watersheds to consider all climate grids (1153 grids). In addition, the Global Multi-Resolution Terrain Elevation Data 2010 (GMTED2010; 250-m resolution) [46] was applied, and the soil properties were obtained from the Food and Agriculture Organization of the United Nations dataset [47]. Finally, the Global Land Cover Characterization (GLCC) was used to determine land use [48].
The VIC model was also implemented to estimate the streamflow at the gage station locations for observed and projected future climates. The VIC is a semi-distributed, physically based hydrological model that solves water and energy balance for each grid separately at a designated daily time. The meteorological parameters for the execution of the model include precipitation from the APHRODITE dataset and minimum and maximum temperatures and wind speed from the Global Meteorological Forcing Dataset (GMFD) gridded dataset, available at 0.25° spatial and daily temporal resolution [44,45]. The vegetation texture—containing the land cover type, leaf area index, and albedo—was developed using the Advanced Very High Resolution Radiometer (AVHRR) at a 1 km spatial resolution. The soil class was taken from the United States Department of Agriculture (USDA) classification and pedo-transfer functions [49] applied to the Harmonized World Soil Database (HWSD) were combined to extract soil parameters.
The infiltration mechanism utilized in the Xinanjiang model [50] was adopted for use in the VIC model to generate the runoff from precipitation when it is higher than the available infiltration capacity. This scheme is commonly used in models that are used for flood forecasting, climate change studies, and water resource assessment in the humid and sub-humid regions of the world [51]. The model is capable of catchment response on any scale and can account for nonlinear spatial retention of soil moisture [52]. Also, the Xinanjiang model accounts for soil heterogeneity and assumes the variation of the infiltration capacity within an area [53]. In the VIC, the Xinanjiang formulation is assumed to hold for the upper soil layer only. The Xinanjiang model effectively assumes that runoff is generated by those areas for which precipitation, when added to soil moisture storage at the end of the previous time step, exceeds the storage capacity of the soil. When the precipitation is less than or equal to the available infiltration capacity, overland runoff is not generated. However, the soil moisture transfers from the upper soil layer to the lower soil layer for subsurface runoff generation using the Arno model conceptualization [54]. The top two layers of the three soil layers in the model respond to the rainfall, whereas the bottom layer corresponds to baseflow computed using the Arno model formulation [54]. The variable infiltration curve [55] governs the infiltration of water into the soil layer. The total ET is estimated using the Penman–Monteith approach and defined as the accumulation of evaporation from bare soil and canopy and transpiration from vegetation features. Since VIC is a unidimensional hydrological model, the fluxes are exchanged only in the vertical direction and the lateral movement in the subsurface layer is considered negligible. Moreover, the routing scheme developed by [56,57] is employed on the fluxes simulated by the VIC model for each grid to estimate the monthly streamflow at the gage station locations. The surface and subsurface fluxes of the grids were explicitly routed by the routing scheme using a unit hydrograph of a channel network, in which the node of the channel network represented each grid-cell of the VIC model.
The observed monthly streamflow from the seven gauging stations distributed across the basin—namely Chiang Saen, Luang Prabang, Nakhon Phanom, Vientiane, Mukdahan, Pakse, and Kratie—were used to calibrate and evaluate the VIC model. The VIC model has been used by the various studies for hydrological assessment of the MRB [8,22,58,59,60].
2.3. Choice of General Circulation Models
Figure 2 shows the distribution of wet/dry and cold/hot global circulation models (GCM) from 2 Representative Concentration Pathways (RCPs), 4.5 and 8.5, showing changing precipitation and temperature for 5 future periods F1 through F5 between 2006 and 2099. These models are GFDL-ESM2M, IPSL-CM5A-LR, MIROC-ESM-CHEM, and NorESM1-M. Each model was bias-corrected and statistically downscaled to 0.25° resolution by the Intersectoral Impact Model Intercomparison Project (ISI-MIP) [61]. These models exhibited a wide range of temperatures (1–6 °C) and precipitation changes (−5%–20%) in the basin and were widely used to predict climate change impacts on hydrology as well as in other basins [61,62,63]. Clearly, MIROC showed wetter and hotter conditions for the later part of the century, while GFDL and IPSL projected drier and cooler conditions through 2040.
2.4. Calibration and Simulation of Streamflows and Water Budget Components
The SWAT model was calibrated using the monthly streamflow and the SWAT calibration and uncertainty assessment tool (SWAT-CUP) [64] with 4 parameters (Table 1) at 7 stations. Similarly, VIC was also calibrated, and the results are shown in Table 2. As shown in Table 3, monthly calibration metrics of correlation coefficient (R2) and Nash–Sutcliff (NS) efficiency were above 0.8 for both SWAT and VIC models. The parameters used to calibrate the VIC model included the variable infiltration curve parameter (bi), the depth of the second and third soil layers (D), the fraction of maximum velocity of baseflow where non-linear baseflow begins (Ds), and the fraction of maximum soil moisture where non-linear baseflow occurs (Ws) with allowable ranges of 0.1–0.5, 0.1–1.5, 0–0.4, and 0.5–1.0 respectively. The calibration was carried out for the gage stations stepwise from upstream basins, with the exclusion of the regions already considered for the upstream station. The Nash–Sutcliffe efficiency coefficient [65] and coefficient of determination (R2) between the monthly simulated and observed streamflows was used to evaluate the capability of the VIC model. This exercise was necessary to ensure that the model’s parameters were able to characterize the hydrologic responses to changing environmental and bio-physical conditions.
2.5. Study Design
Our approach consisted of the following steps: monthly calibration of the hydrology models for the historic period, simulation of streamflows using the climate model outputs by dividing them into seven sub-basins with the outlets where the observations were available, evaluation of peak flows, assessment of flow changes in the context of reservoirs, and spatial mapping of temperature and precipitation anomalies and water budget components (ET and runoff). Monthly calibration of the hydrology models for the historic period was required in order to understand whether the models could capture the basin scale responses hydrologically and reliably so as to as extend to the other periods of interest [66,67]. Subsequent analysis was aimed to investigate if there were any differences in streamflows and peakflows considering the spatial and temporal variability of the forcings, land use and reservoir management. This sequential approach enabled us to understand and quantify the impact of spatial variability and shift in the flow regimes as shown in Figure 3. Finally, this study is framed to seek an answer for the suitability of these models for changing conditions in the future. To answer this question, we evaluated the differences between them in multiple variables, including peakflows, sub-basin scale hydrologic budgets and see whether they help us decide the suitability for decision making in the context of the sustainable management of the basin and food–energy–water nexus considering the data needs and resolution. For instance, food systems need high resolution, field scale data for decision making while hydropower and water would be decided based on the catchment scale runoff and inflows to the dam. This particular study offers insights based on 0.25° forcings and a relatively high-resolution land use and soil properties with major reservoirs across the basin all of which can be integrated in a simple framework.
3. Results
3.1. Hydroclimatology of Streamflow
The annual hydrograph was primarily driven by the southwest monsoon in the basin and the typical flood hydrograph consisted of peak flows in the wet season (July–October) and relatively low flows in the dry season (January–May). Generally, the smooth hydrographs reflecting the size of the catchment were evident. Figure 4a–f show the long-term streamflow simulations by SWAT and VIC. The historical simulation period was between 1954 and 2015, and due to limited availability of observational data, a relatively short period between 1984 and 1990 was used for calibration and the remaining period from 1991 to 1996 for validation. The locations distributed across the entire lower Mekong from the upstream point in the basin—Chiang Sean to downstream at Kratie—demonstrated how the annual average streamflow gathered in magnitude from about 2000 m3/s to 10,000 m3/s. Table 1 shows the list of four runoff-, base flow-, and groundwater-related parameters calibrated in SWAT. Similarly, the calibration parameters shown in Table 2 for VIC include the variable infiltration curve parameter, the depth of the second and third soil layers, the fraction of maximum velocity of baseflow where nonlinear baseflow begins, and the fraction of maximum soil moisture where nonlinear baseflow occurs.
Clearly, the multi-decadal simulations showed interannual variability in flows caused mostly by precipitation changes; however, the shifts in flows on annual scales were indistinguishable. The box plot (on the right) shows the mean and spread of annual streamflows captured by SWAT and VIC. While the mean values between these models across all seven stations were close, the spread was greater for SWAT. Also, the coefficient of variation (standard deviation/mean) computed for each of the gage locations showed a low value of less than 0.7 consistently for all the stations and they were comparable between the observed and simulated flows. This could be considered typical for a tropical river basin where variability was minimal.
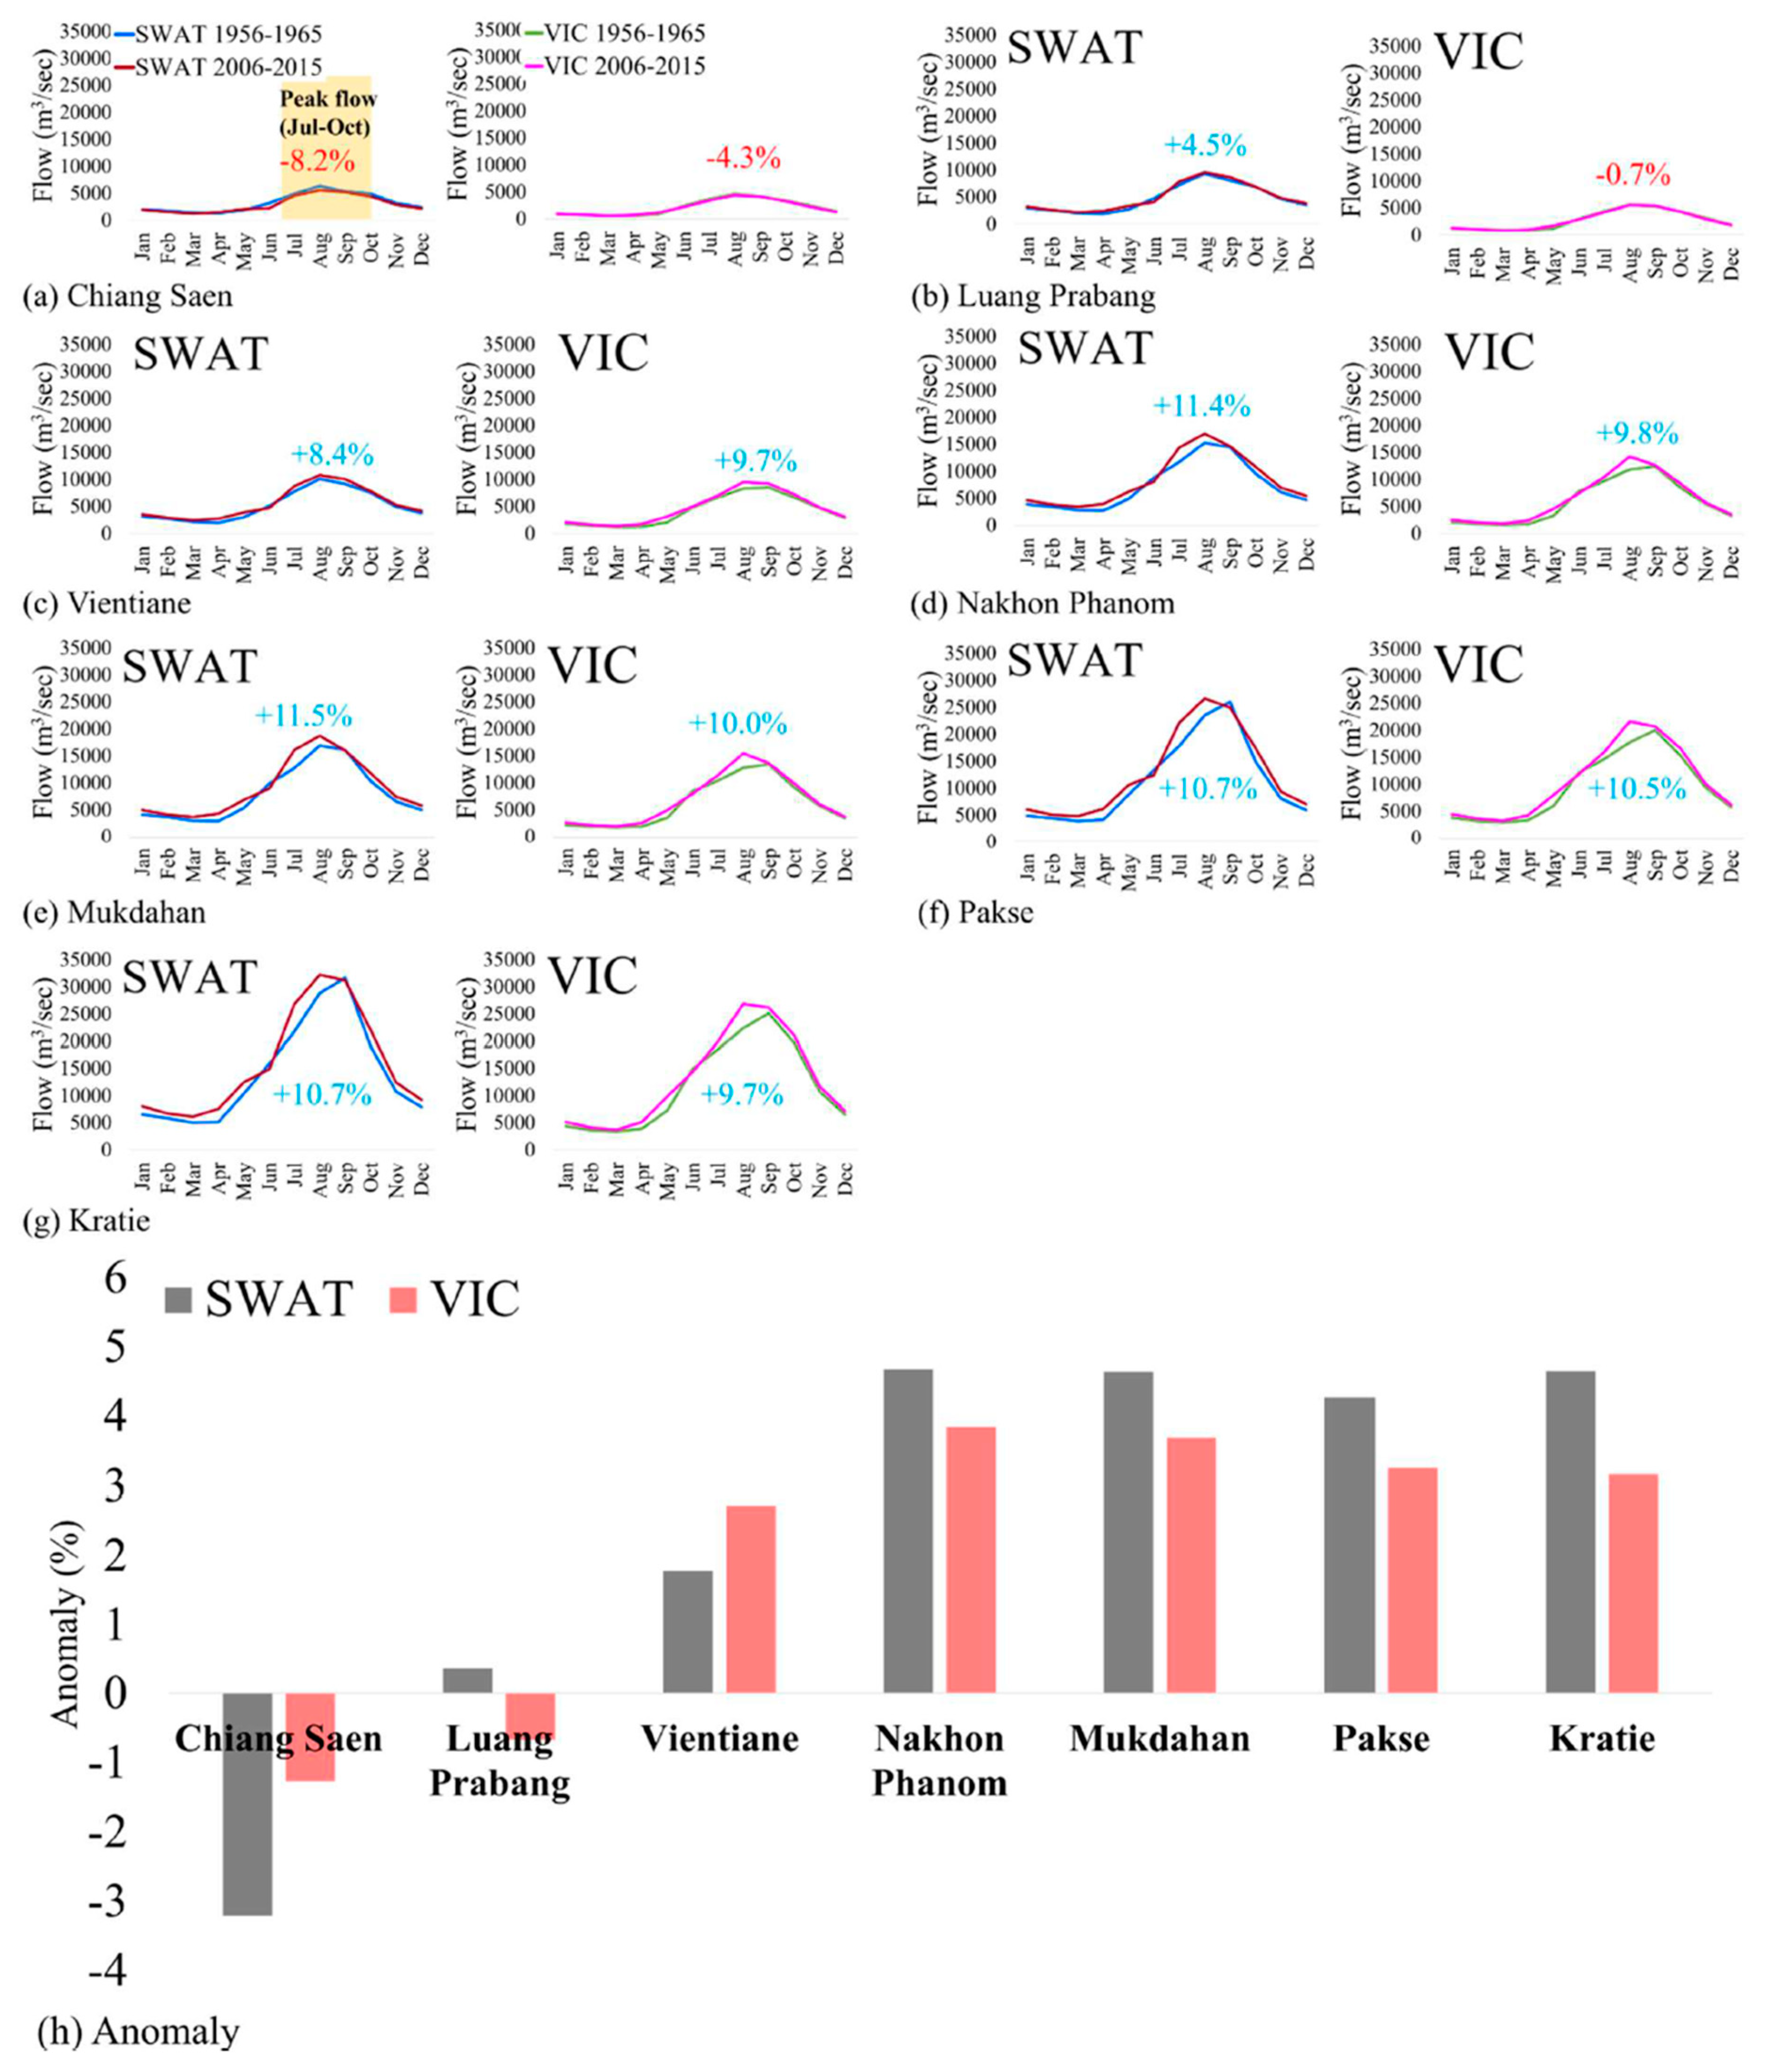
3.2. Historical Peakflow Assessment
In order to understand the dynamics of drivers of change, particularly climate and land use, we evaluated the peakflow magnitudes simulated by SWAT and VIC. Our assessment of change in land use between 1992 and 2015 suggested a 3% increase in croplands and a 1–2% decrease in grasslands, shrublands and forests. Figure 5 shows the differences in peakflows between the two periods—1956–1965 and 2006–2015—to compare pre-development and post-development conditions in the basin. Other than a reduction in flows of 4–8% for Chiang Sean and less than 1% for Luang Prabang, all of the other flow stations indicated an increase of 8–11%. The decrease in flows in the upstream location can be attributed partly to climate change in the Tibetan Plateau. However, the tropical monsoon impacts on the lower portion of the basin were evident in the increased flows. These increased peakflows can result in flooding, and therefore impoundments of these flows can potentially reduce the risk of flooding in this basin, which is prone to seasonal flooding. This is further highlighted in Figure 5h, where the streamflow anomaly (%) for the seven locations between 1992 and 2015 decreased up to 4% for Chiang Saen and Luang Prabang. The remaining stations showed a positive anomaly of up to 5%. Noticeably, the differences between 1992 and 2015 in both SWAT and VIC showed no difference in anomaly, which suggested that natural flows between pre- and post-development of hydropower projects are not significant. In other words, while the flow alterations in the basin could not be attributed to land use changes in the basin, human-induced changes—such as irrigation diversions—and climate change can affect peakflows.
3.3. Projected Changes in Flows and Comparison of Models
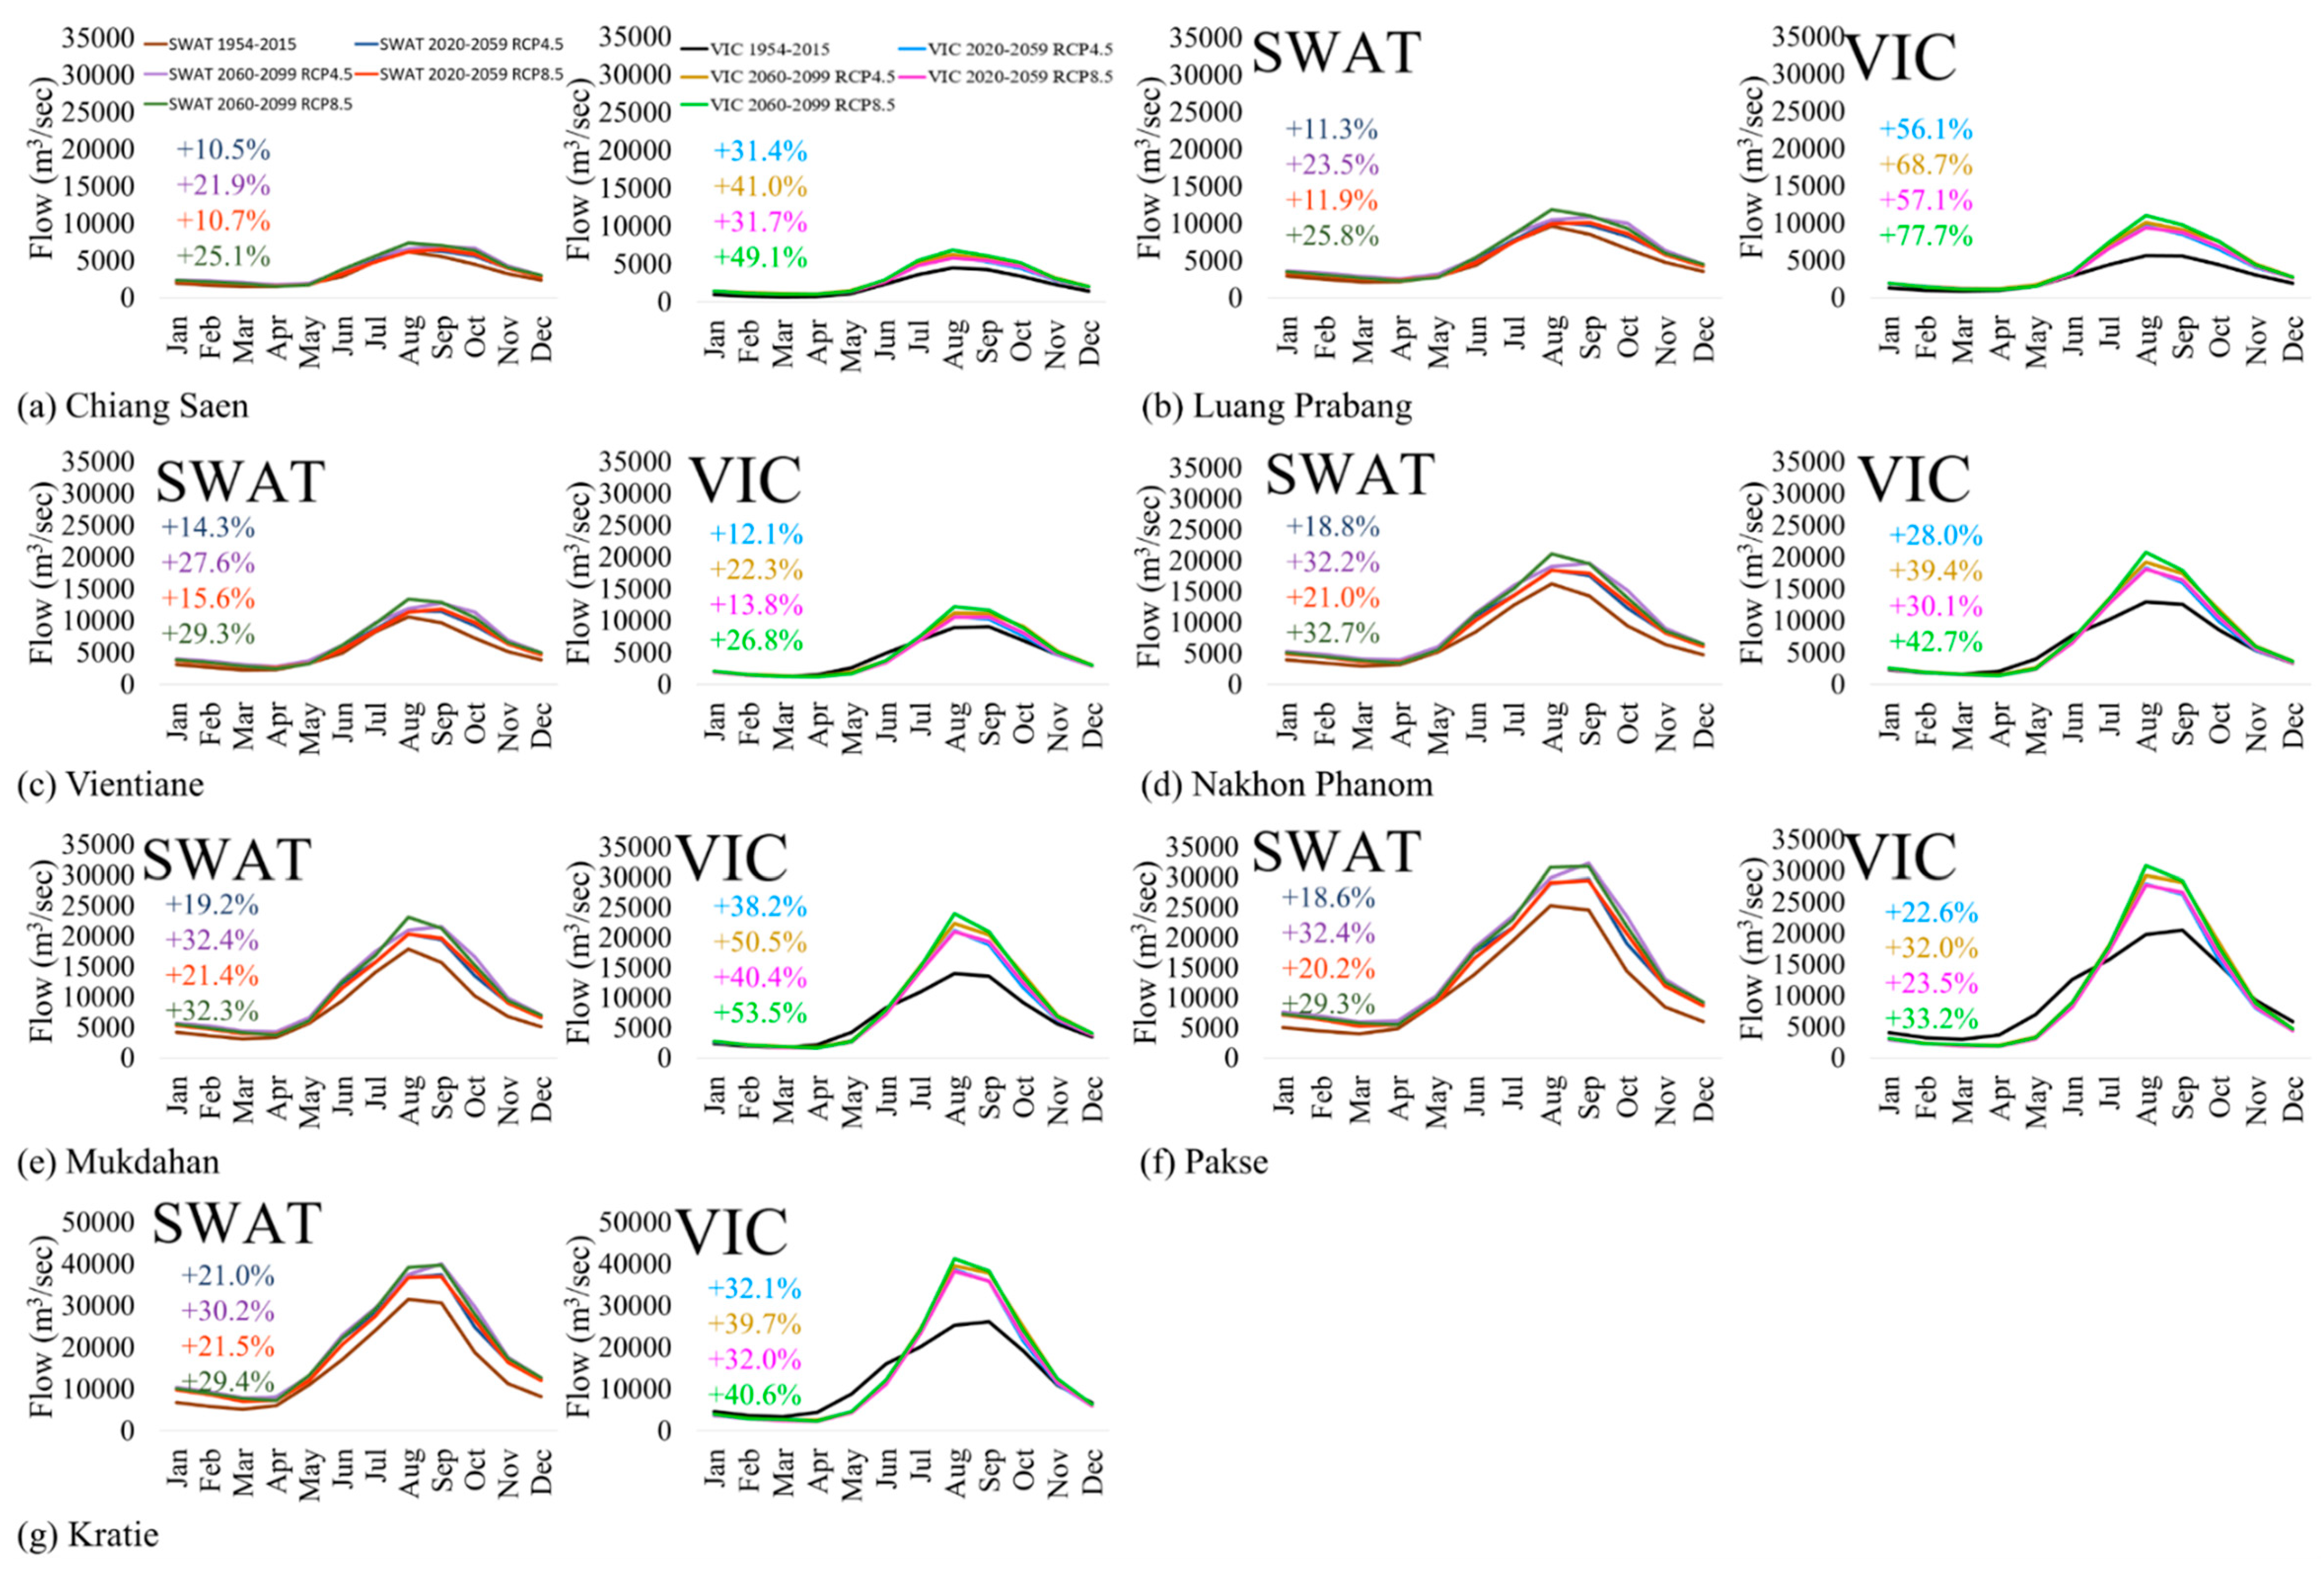
Since the effect of climate change was evident with increased precipitation and temperature in the basin, it was considered appropriate to assess the climate change impacts on streamflow and other water budget components. Figure 6 shows the projected streamflows from the VIC and SWAT models between 2020 and 2099 for the same seven locations where calibration and validation of streamflows were performed for the historic periods. The results included the ensemble average of all four GCMs introduced in the earlier sections. The annual hydrographs resembled historical estimates of flows, with interannual variability and seasonal peaks. Most notably, the differences in SWAT and VIC were also similar to historic simulations, as SWAT produced more flows relative to VIC. While the hydrological model processes that caused the increased flow in SWAT are not discussed here in detail, the role of the calibration parameters that previously estimated higher flows could be substantial. Also, the irrigation extraction for croplands—whereby the streamflows remained mostly natural and hence the attenuation of flows was not obvious—was not explicitly considered.
Due to increased precipitation in the basin, as predicted by most of the GCMs, hydrological flow simulation had shown similar increases in peakflows, ranging from 10%–70% between RCP 4.5 and 8.5 scenarios. The hydrological model responses in the form of streamflow were directly proportional to increased precipitation, typical of a tropical basin. The substantial increases were also expected in the later part of the century across all flow stations between 2060 and 2099. Projected peakflow changes simulated by VIC and SWAT are shown in Figure 7. On the one hand, the reductions in dry season flows were not evident, and counterintuitively, on the other hand, the management of reservoirs and their releases can augment them.
3.4. Projected Peakflow Estimation
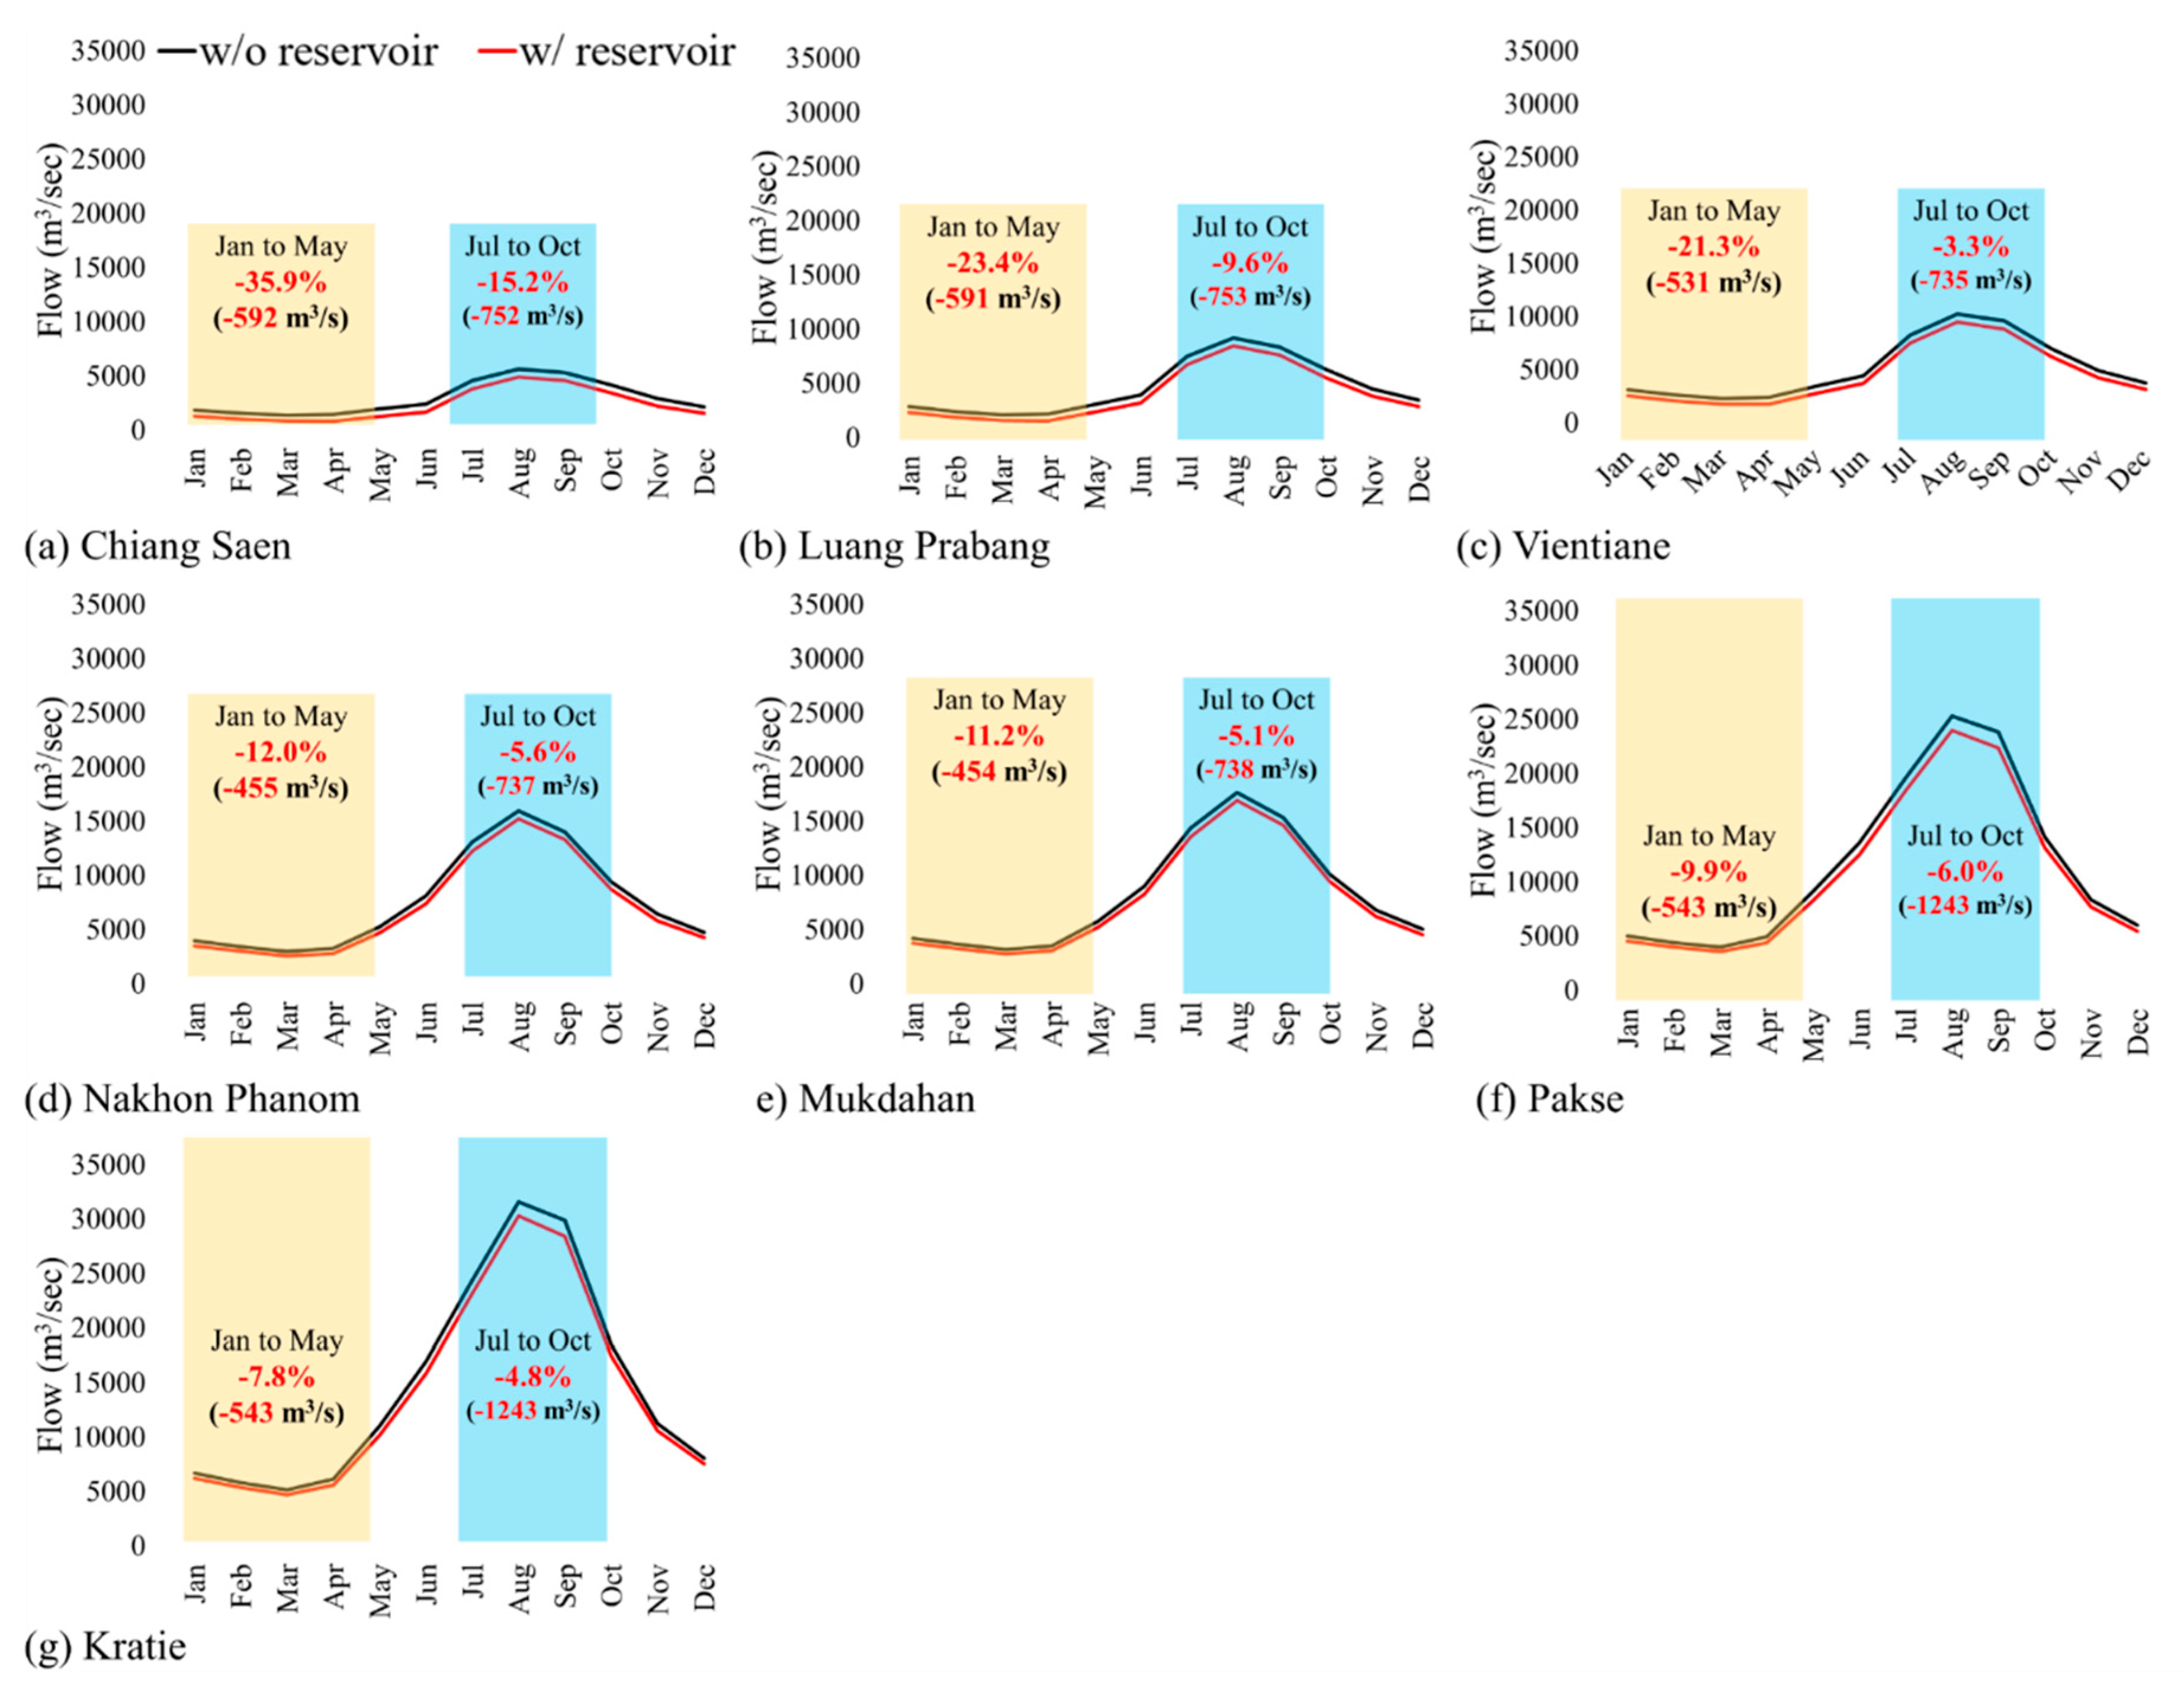
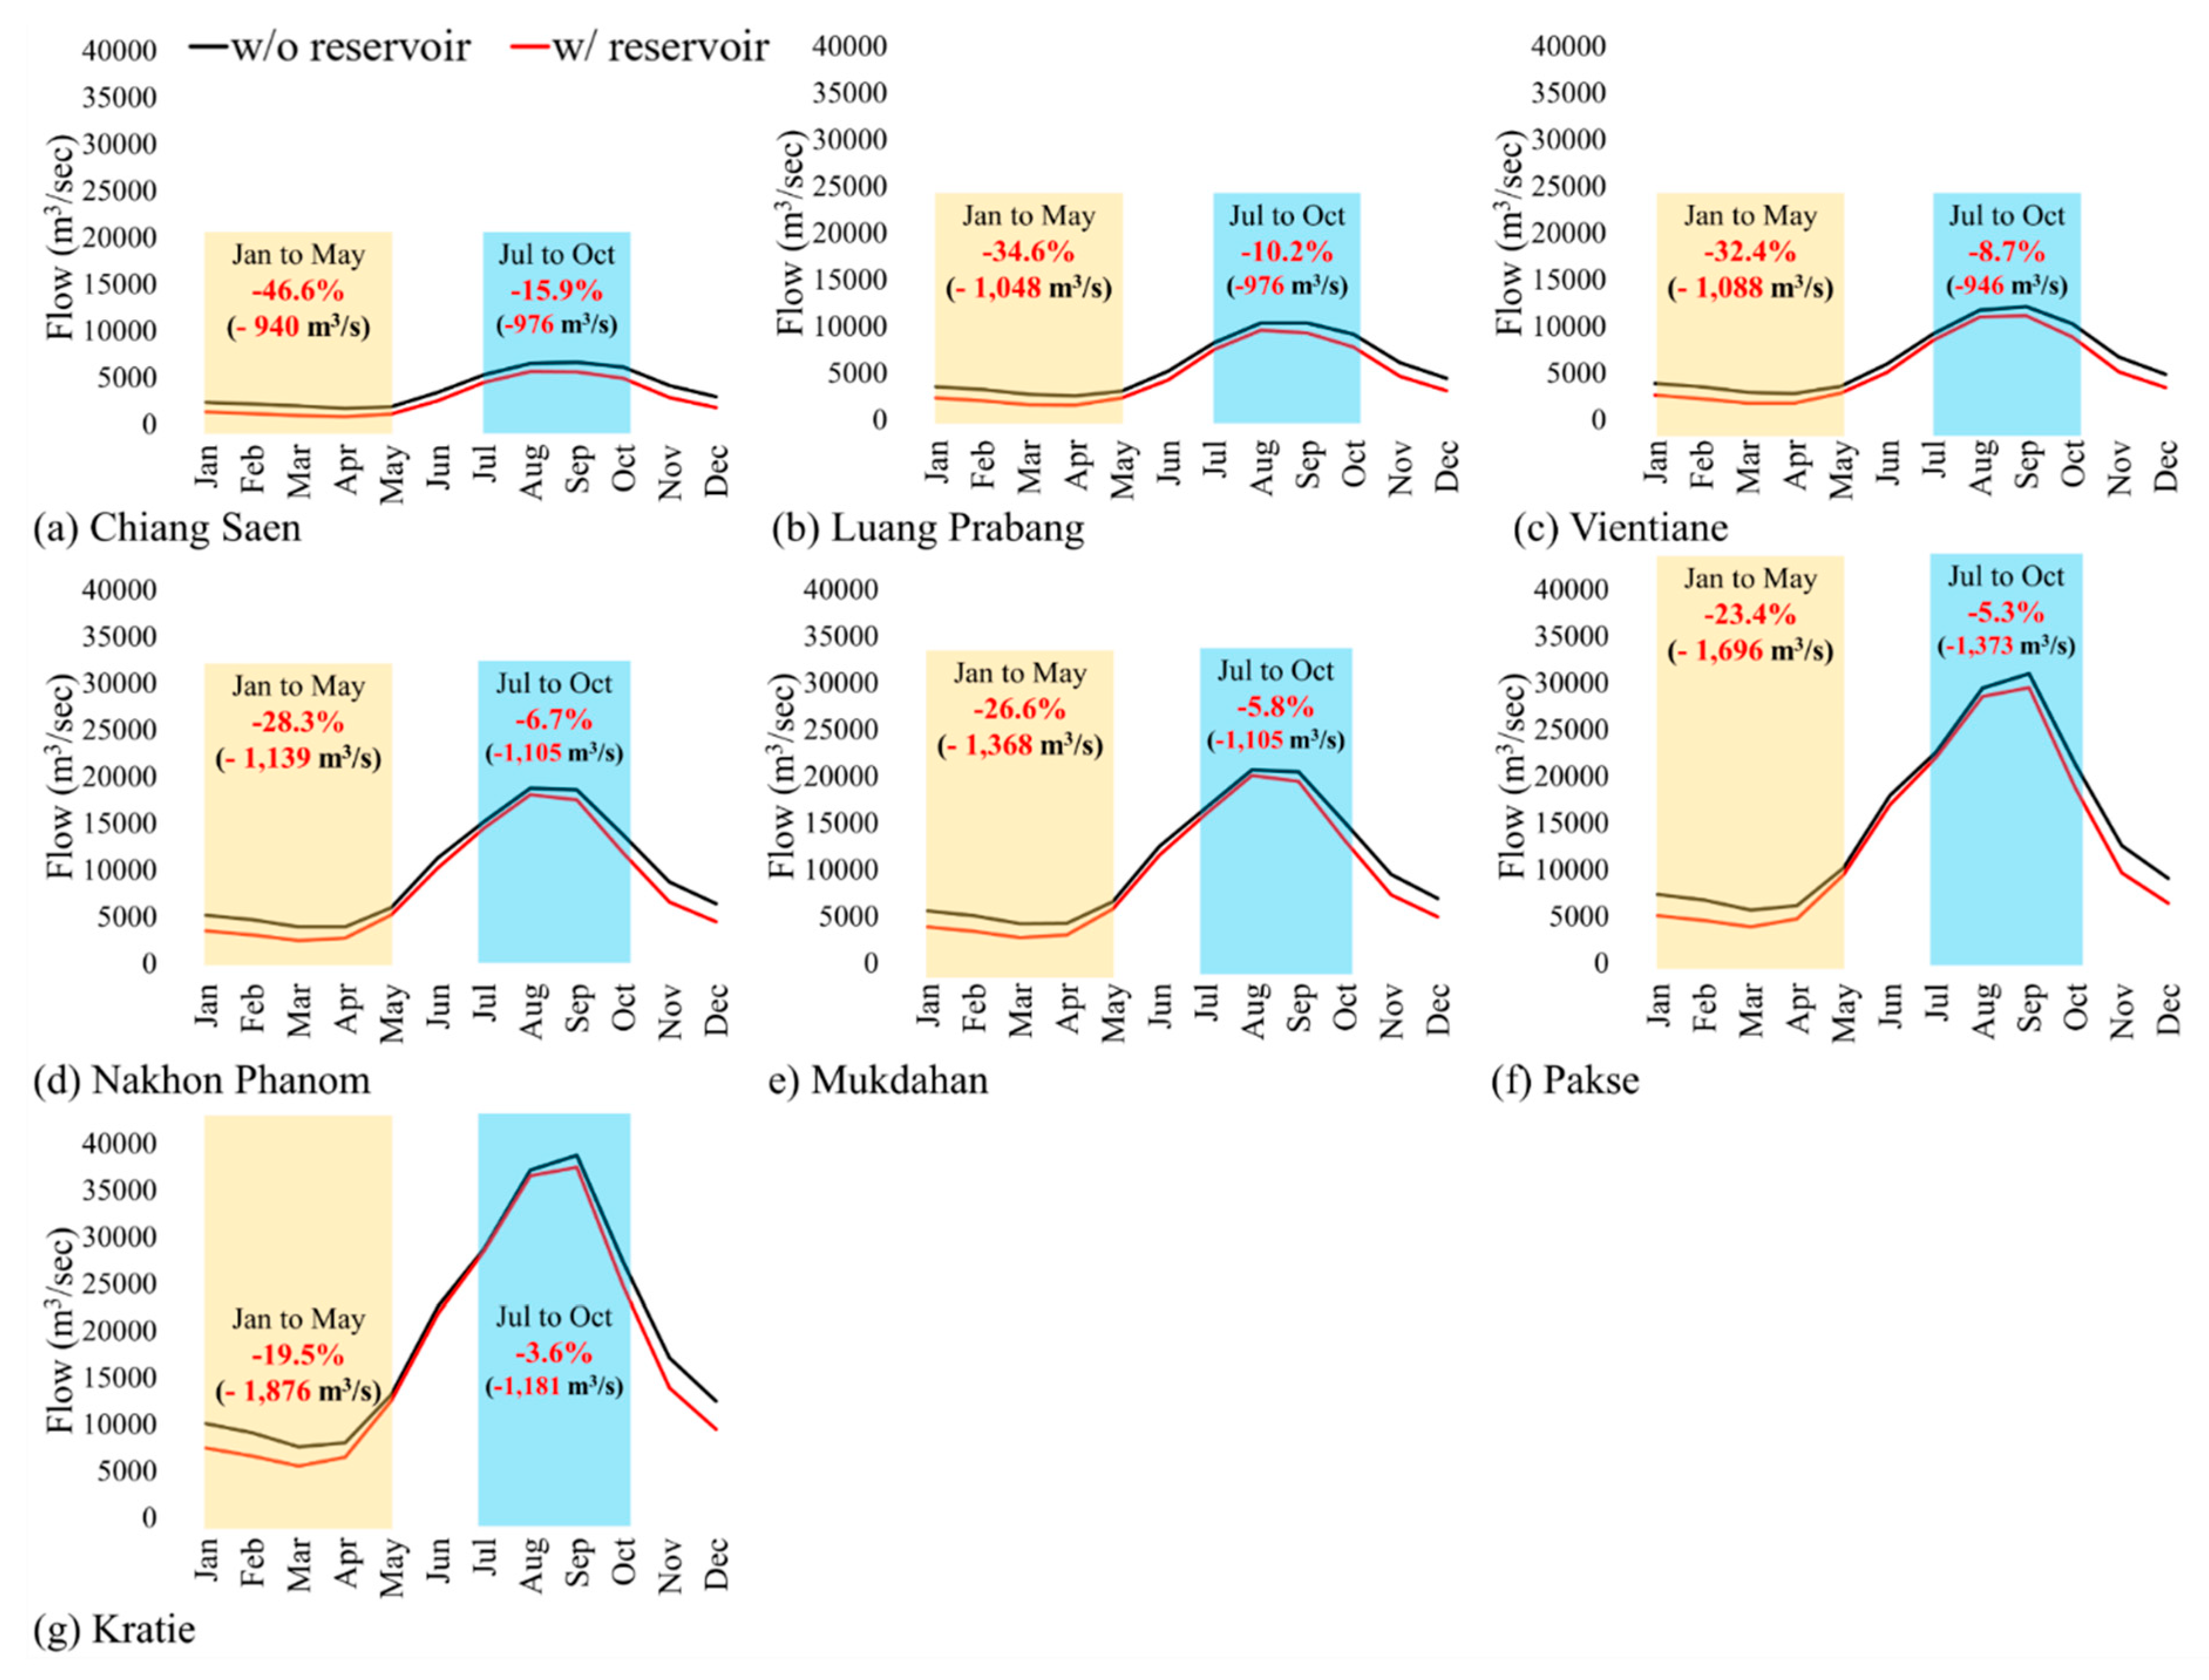
Changes in peak flows were analyzed, and the shifts in peakflows with and without reservoirs simulated by the SWAT model for the period 1992–2015 (14 year average) are shown in Figure 8. A similar analysis for future climate projections from 2020–2099 (80 year average) from RCP 4.5 is shown in Figure 9. The results are similar for RCP 8.5, and the percentage changes in flows are shown in Table 4. In general, the reductions in flows in 2015 were lesser when compared to 1992 in simulations in which reservoirs were taken into account with certain parameters. These reductions, ranging from 3%–15%, can only be considered changes due to climate variability, as exact operation and releases of flows were not integrated into this analysis. When the simulations did not include reservoirs, both wet and dry season flows were higher for the same period. However, general reductions of up to 35% in dry season flows and 16% in wet season flows were identical in simulations that considered reservoirs in their analyses. This analysis emphasizes the importance of incorporating the actual reservoir operations to predict wet and dry season flows.
3.5. Basin Scale Water Budget Analysis
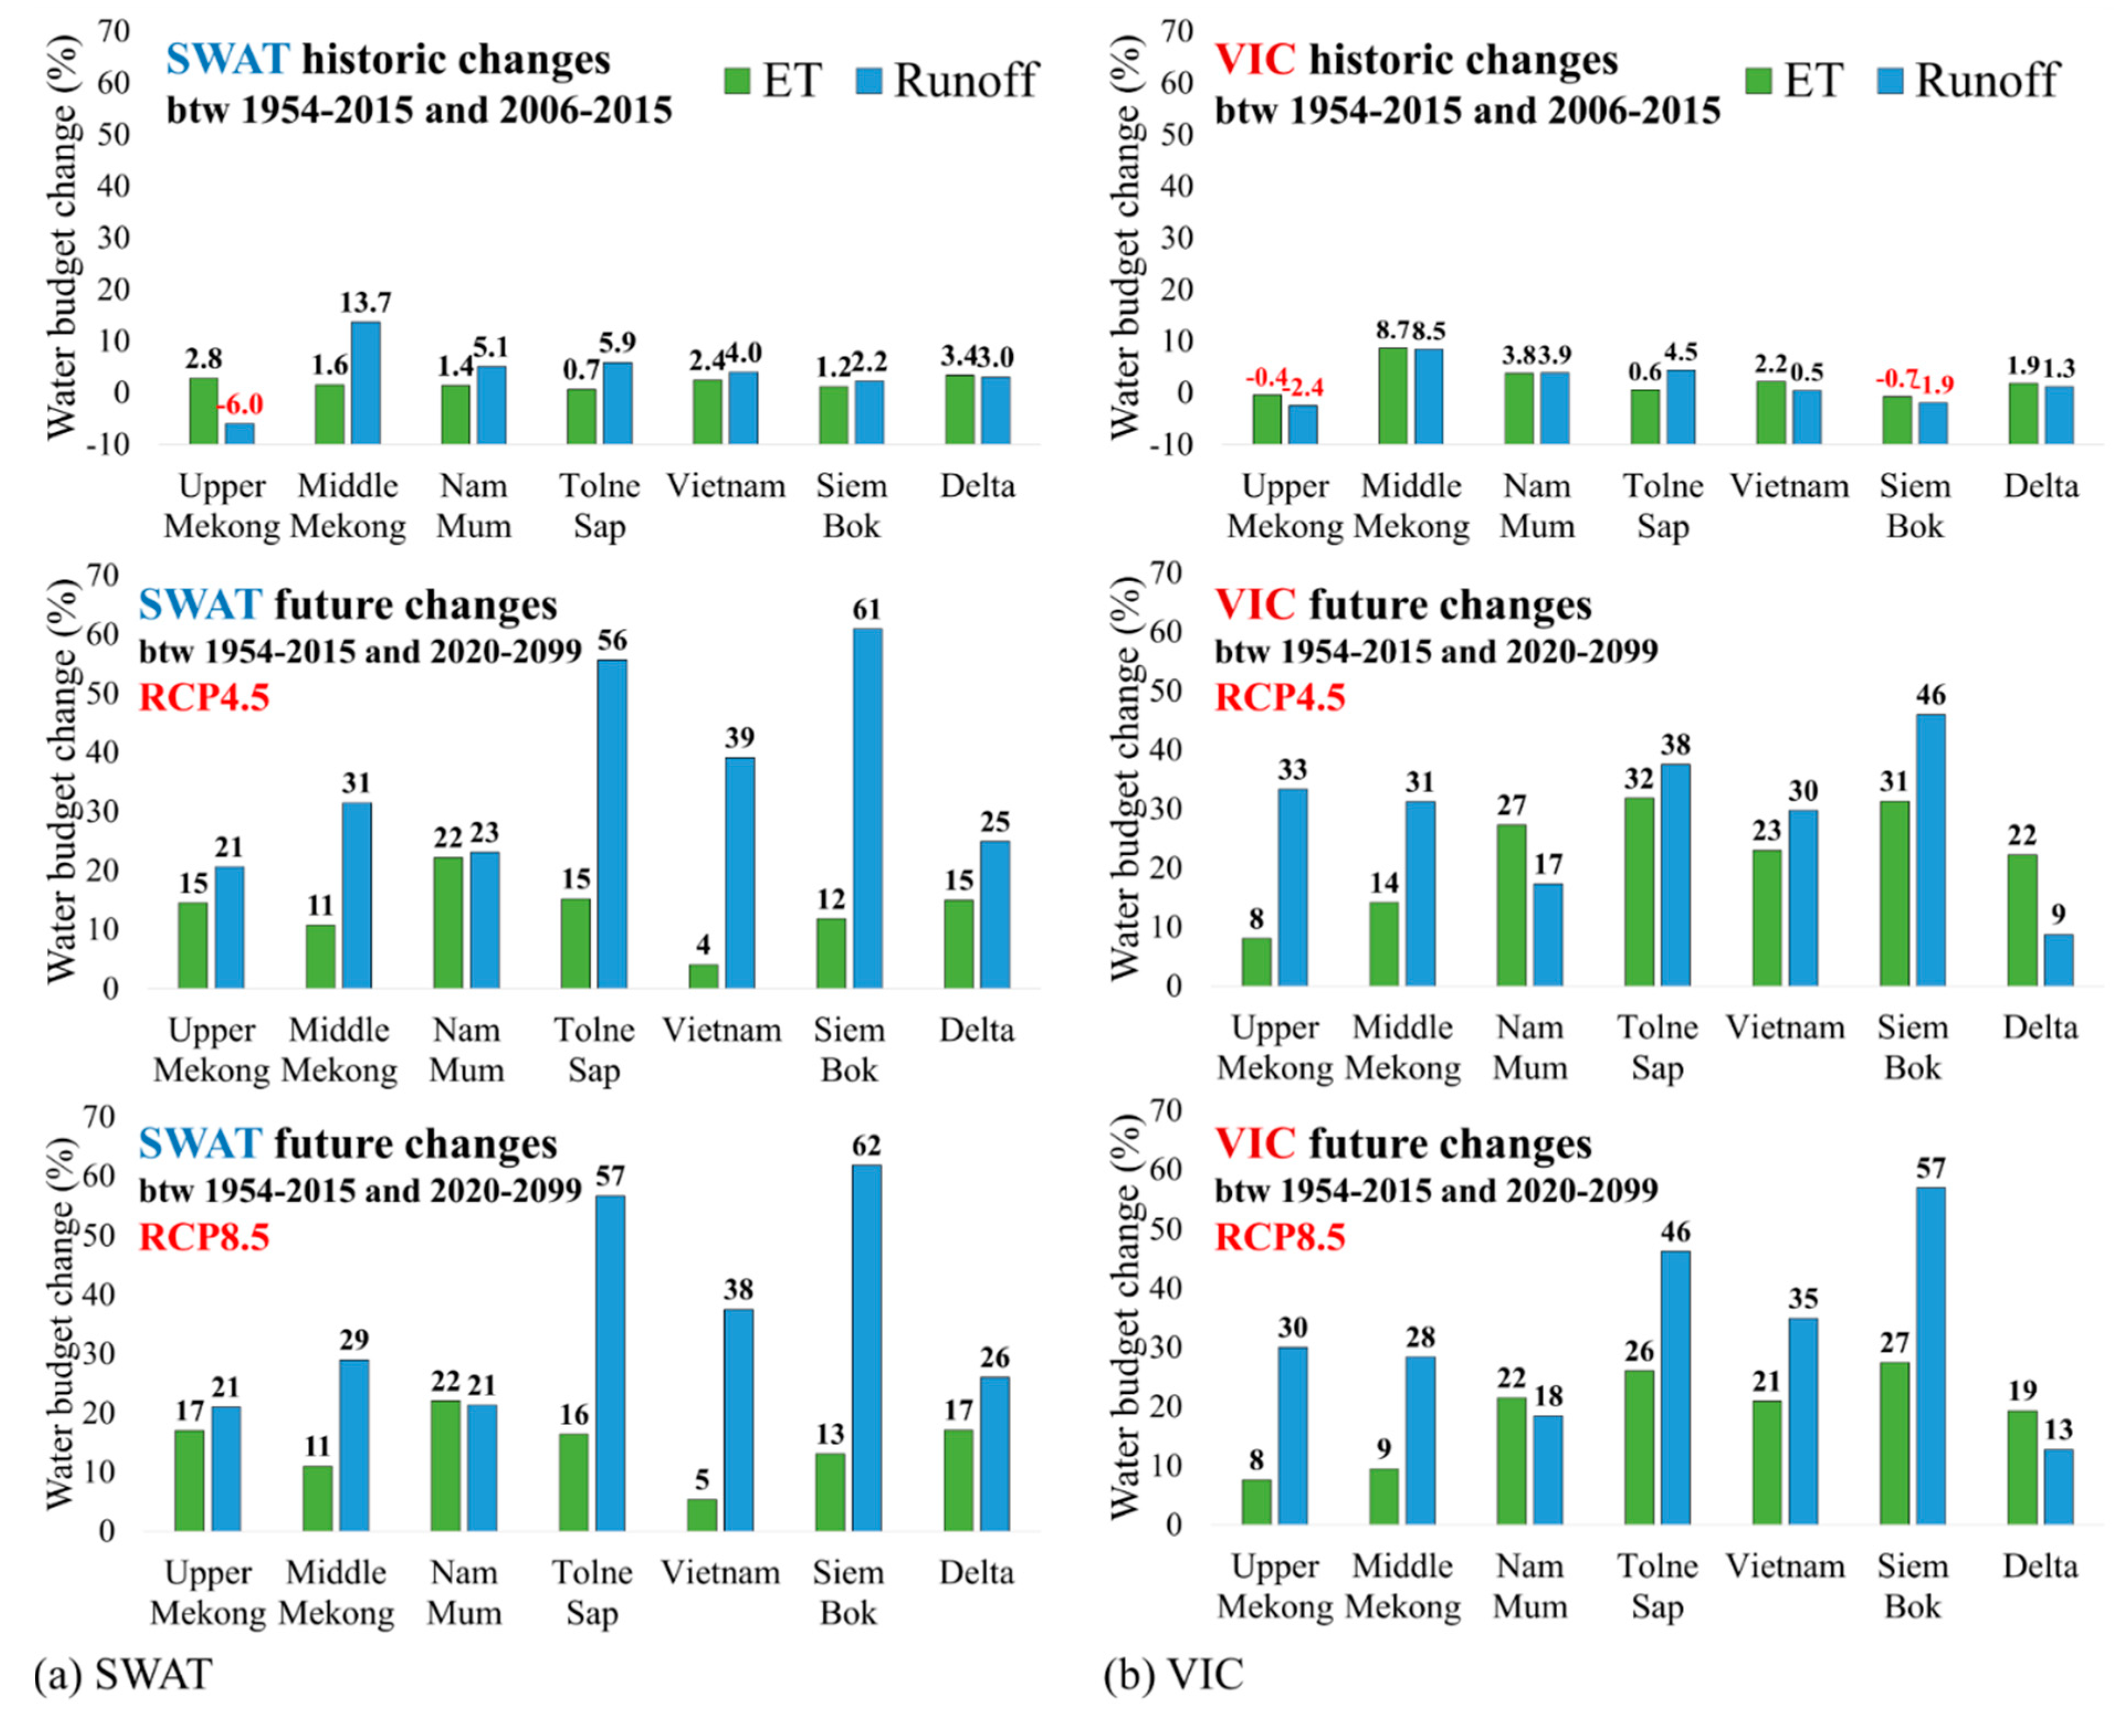
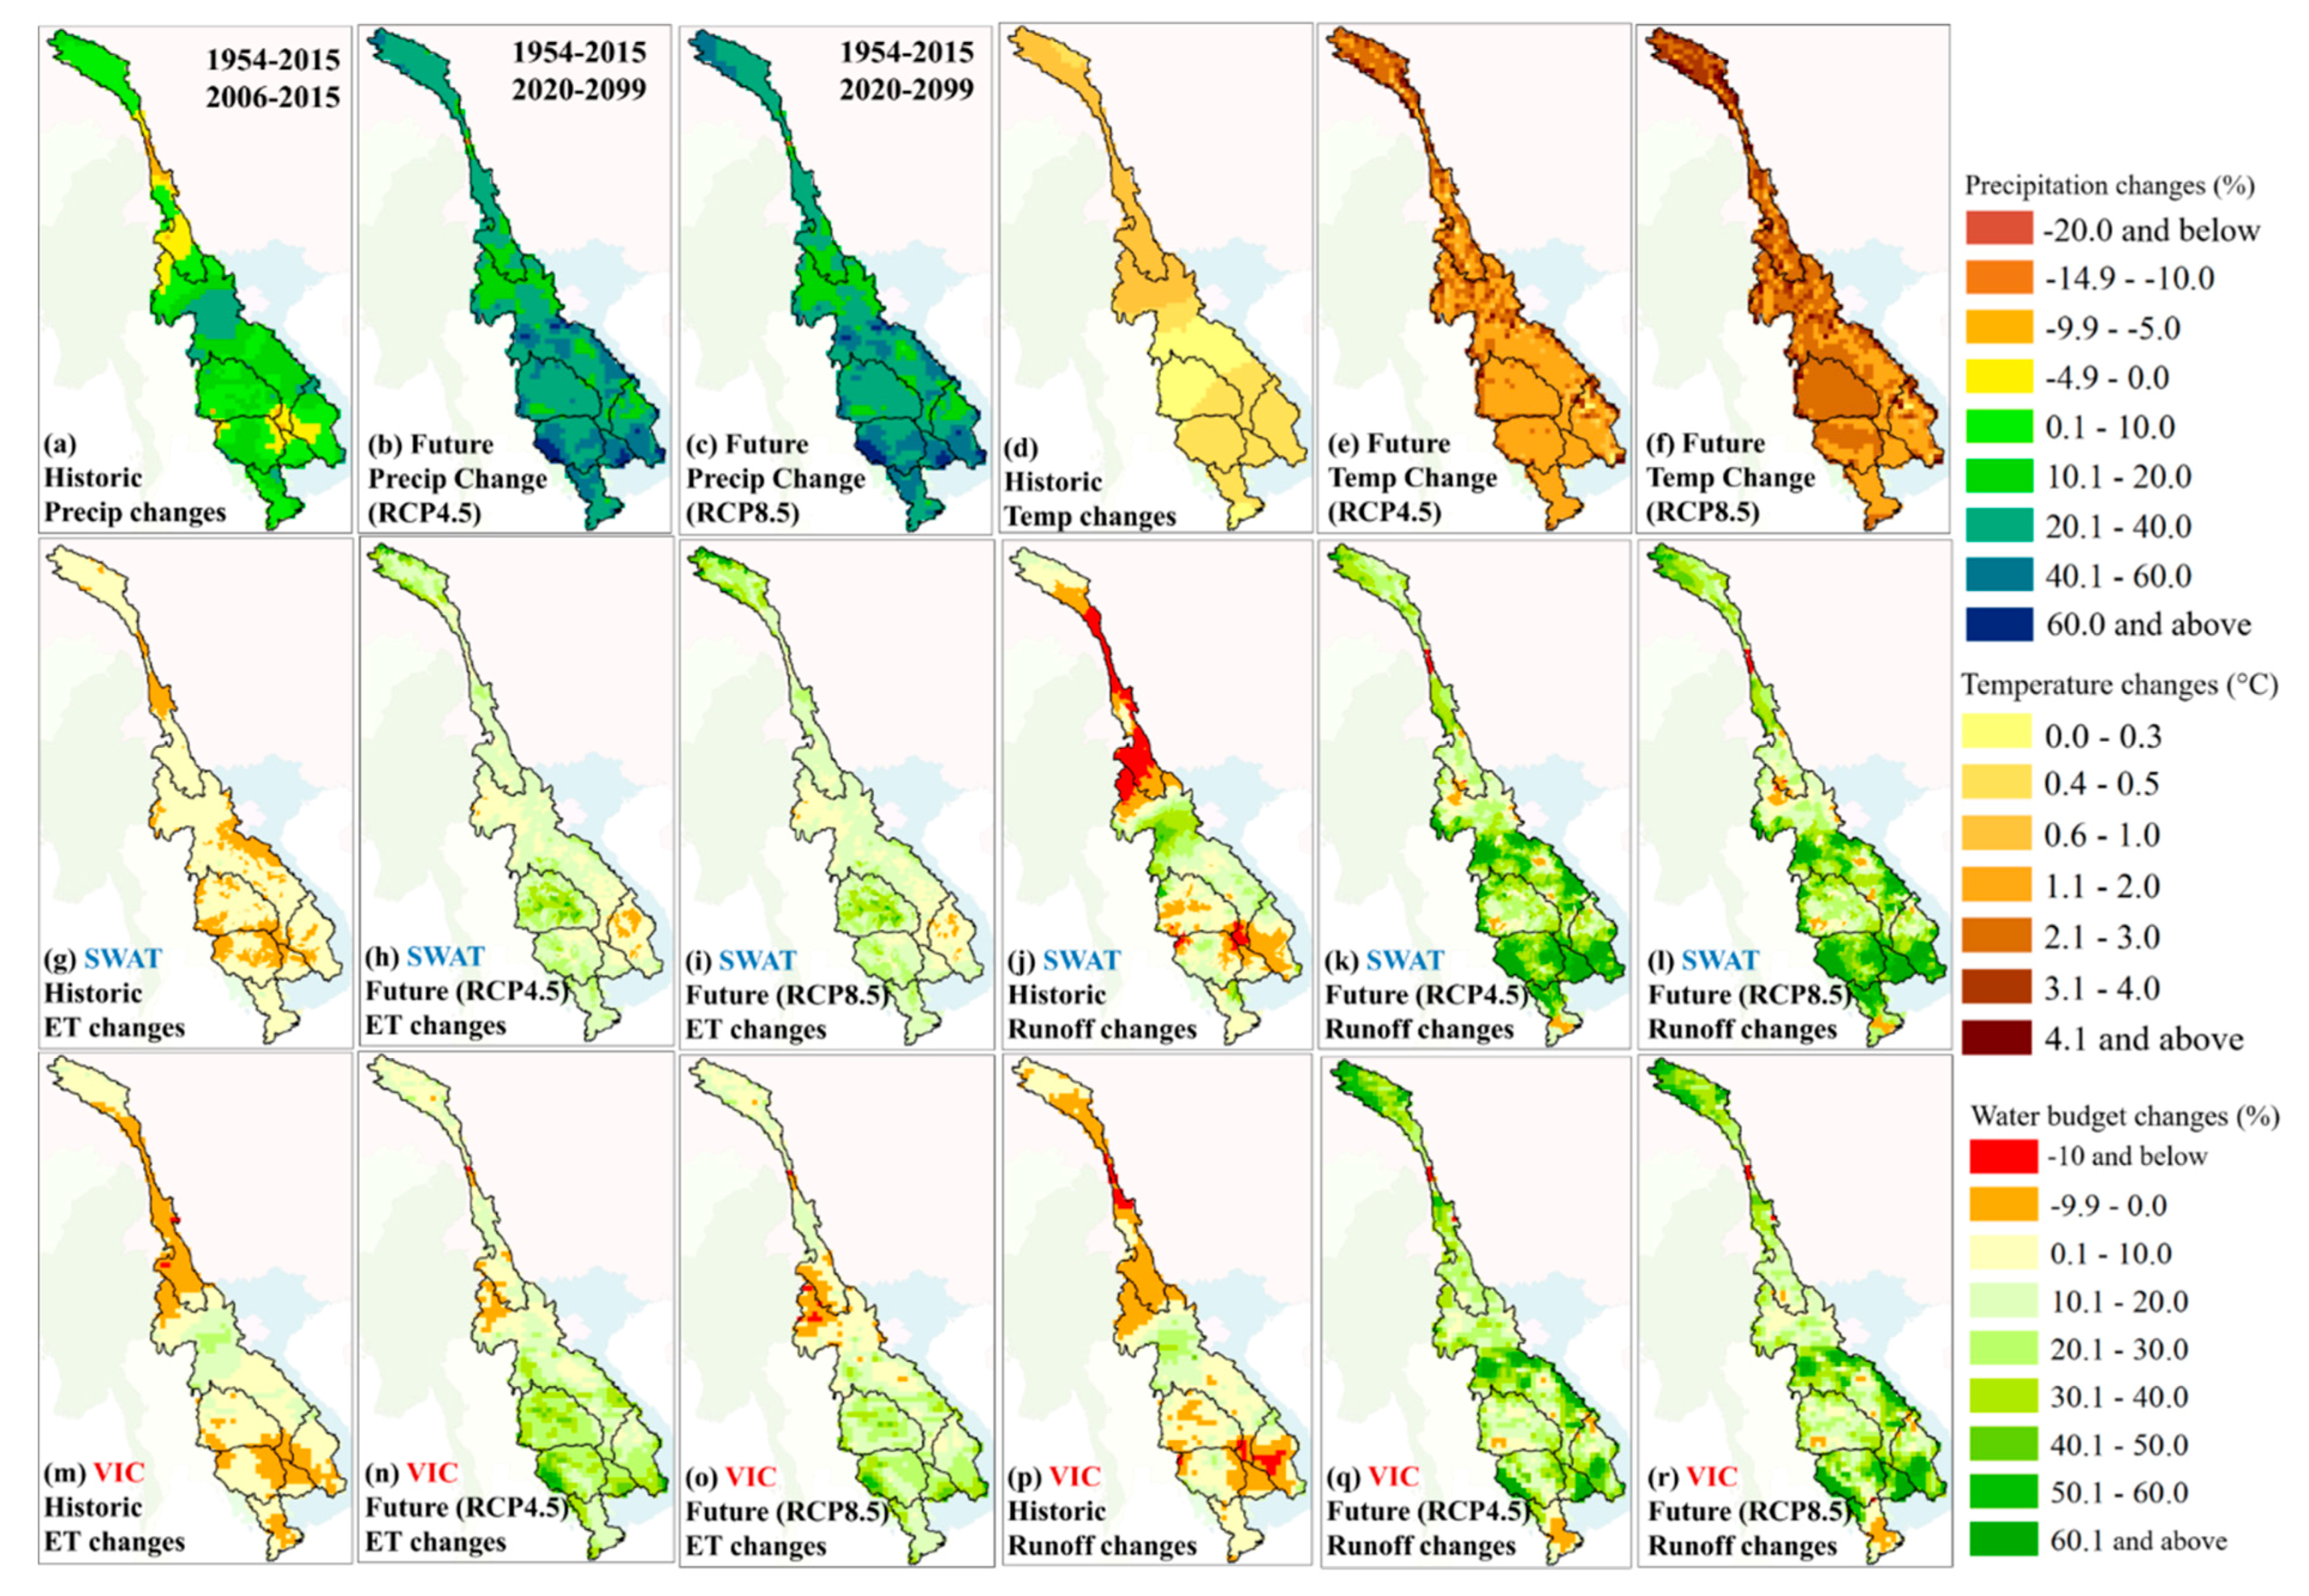
Figure 10 presents the bar charts of ET and runoff changes for the historic and future periods from the SWAT and VIC models, and Figure 11 shows the spatial maps of changes in precipitation, temperature, ET, and runoff. The historic changes were the percentage alterations of the last 10 years (2006–2015) compared to the entire historic period (1954–2015), and the future changes were the percent increases of the future period (2020–2099) to the historic period. Both ET and runoff changes were computed for each sub-region and grid in the MRB. As in Figure 10, reductions in runoff of up to 6% in the historic period did not persist in other locations or into the future. Historic reductions were more pronounced in the upper portion. Both RCP 4.5 and RCP 8.5 projected increases in ET of 4–15% and runoff increases of up to 60%. In both historic and future periods, water budget changes were highly influenced by precipitation and temperature alterations in the MRB, as shown in Figure 11a–f. Relative to the past period, both RCPs projected increased precipitation between 10 and 60% across all of the sub-basins, with higher increases in the central and lower portions of the basin. However, temperature increases were notable in the upper and central sub-watersheds, ranging from 1–4 °C. This can potentially impact snowmelt-driven flow in the Tibetan Plateau before the monsoon season begins.
For the historic period, there were overall ET and runoff increases from the SWAT model for the entire MRB, except for the runoff in Upper Mekong. In the VIC model, there were also overall increases, but some regions showed ET and runoff decreases (e.g., Upper Mekong, Delta). The highest increase of runoff occurred in the middle of the basins from both SWAT and VIC (13.7% and 8.5% respectively; Figure 11j,p), and these increases were derived from the highest precipitation increase in the middle Mekong region during the last 10 years (Figure 11a). However, there were runoff decreases in the upper Mekong and Siem Bok (Figure 11j,p), and the precipitation decreases mainly derived from these in the corresponding areas (Figure 11a).
For the future period, there were ET and runoff increases for the entire regions and both models, and the precipitation and temperature increases were the main drivers of those changes. VIC projected decreased runoff in the delta in the future, and in general, estimates of the water budget from the two models were considerably different. The runoff estimations from the SWAT model were more sensitive to the precipitation increase. For instance, in the Tolne Sap region, where more than 40% precipitation increases occurred in the entire area, the runoff increases were 56% and 57% for RCP 4.5 and RCP 8.5 using the SWAT model, but 38% and 46% using the VIC model. In addition, the results of runoff increases in the Siem Bok showed similar results. These results were derived from the different runoff estimations between the two models. The SWAT model is based on the soil conservation service (SCS) curve number (CN) [68], while the VIC model uses the variable infiltration curve method [55]. The SCS CN method has been known to have a higher sensitivity for runoff estimation [69], and this could be credited for those discrepancies.
4. Conclusions
The Mekong region is at the center of a multitude of changes, including hydropower development, land use, and climate change. While it is important to characterize the basin’s responses to these changes at the local level, macroscale changes to climate and hydrology spanning all six basin countries at the sub-watershed domain is critical. This study evaluated historic streamflows and impacts of 21st century hydropower development on those flows through simulation. The limiting factor in considering basic scale changes arose from lack of information about the management of the currently operated dams. Hence, the initial simulation of flows could be used to identify the changes in dry- and wet-season flows driven primarily by both natural and ongoing anthropogenic-induced climatic changes while integrating reservoirs into the models to accommodate the inflows in a simplistic way. Several key insights were gained from this study. More broadly, the comparison of two hydrological model simulations highlighted that basin responses to peakflows for both historic and future periods were in close agreement despite the differences in the model formulations and both can serve as a predictive model for future water resources assessment with some improvements to field-scale crop water estimation. The increase in peakflow estimations due to increased precipitation in a changing climate was quantified for several locations and agreed with several previous studies. These increased peakflows are expected to be harnessed for both hydropower and irrigation water demand, and these new insights are useful for making policy decisions and developing operating procedures for water resources development projects. Additionally, the spatial variability in ET and runoff highlighted the need for a differential approach at the sub-basin level to sustain food and energy production in the context of drought and other anthropogenic-induced changes, including land use and population increase. Perhaps, irrigation water assessment by VIC was providing a more realistic estimates of ET and both hydrological models require improvements to simulate crop-specific, field scale estimates of water balance components.
Our findings from this investigation also suggested that the hydrological models SWAT and VIC were capable of predicting large-scale changes to the system by accounting for up to 90% variability under natural conditions. Relative changes in flows impacted by recent hydropower projects between 1992 and 2015 revealed that anomalies in peakflows during this period were less than 5%. This suggests that system-level changes were not identifiable due to modest land cover changes in croplands and forests unless storage and irrigation diversion were properly considered. Increased precipitation over several sub-watersheds also resulted in increased peakflows, as the monsoon season variability for multiple decades included only nominal changes.
Generally, climate models projected a wide range of temperature (1–6 °C) and precipitation changes (−5–20%) in the basin between 2020 and 2099. Corresponding increases in peakflows—ranging from 10–70% between RCP 4.5 and 8.5 scenarios—were expected to occur, leading to possible flooding and inundation unless the reservoir management for both peakflows and diversions for crop water requirements were optimally handled. Without reservoirs in the modeling assessment, both wet- and dry-season flows were higher, but general reductions of up to 35% in dry-season flows and 16% in wet-season flows were identical to simulations that considered reservoirs in their analysis. However, with expanded irrigated areas in the basins and increased peakflows, not only can conflicts be alleviated to manage dry season flows, but increased crop production and hydropower generation also become feasible.
Author Contributions
Conceptualization, V.S.; methodology, H.K. and S.A.A.; software, H.K. and S.A.A.; validation, V.S., H.K. and S.A.A.; formal analysis, V.S., H.K. and S.A.A.; investigation, V.S., H.K. and S.A.A.; resources, V.S.; data curation, V.S., H.K. and S.A.A.; writing—original draft preparation, V.S., H.K. and S.A.A.; writing—review and editing—V.S.; visualization, V.S., H.K. and S.A.A.; supervision, V.S.; project administration, V.S.; funding acquisition, V.S.
Funding
This work was supported in part by NASA under the award 80NSSC17K0259.
Acknowledgments
We thank Jiaguo Qi, William McConnell, Yadu Pokhrel, and David Hyndman from Michigan State University for their indirect assistance. We are grateful for the general discussions on the Mekong Basin with our partners from the Mekong River Commission, Asian Institute of Technology and the Vietnam National Mekong Committee.
Conflicts of Interest
The authors declare no conflict of interest.
References
- Costa-Cabral, M.C.; Richey, J.E.; Goteti, G.; Lettenmaier, D.P.; Feldkötter, C.; Snidvongs, A. Landscape structure and use, climate, and water movement in the Mekong River basin. Hydrol. Process. 2008, 22, 1731–1746. [Google Scholar] [CrossRef]
- Pokhrel, Y.; Burbano, M.; Roush, J.; Kang, H.; Sridhar, V.; Hyndman, D. A review of the integrated effects of changing climate, land use, and dams on Mekong river hydrology. Water 2018, 10, 266. [Google Scholar] [CrossRef]
- Kiem, A.S.; Ishidaira, H.; Hapuarachchi, H.P.; Zhou, M.C.; Hirabayashi, Y.; Takeuchi, K. Future hydroclimatology of the Mekong River basin simulated using the high-resolution Japan Meteorological Agency (JMA) AGCM. Hydrol. Process. 2008, 22, 1382–1394. [Google Scholar] [CrossRef]
- Thompson, J.R.; Green, A.J.; Kingston, D.G.; Gosling, S.N. Assessment of uncertainty in river flow projections for the Mekong River using multiple GCMs and hydrological models. J. Hydrol. 2013, 486, 1–30. [Google Scholar] [CrossRef]
- Eastham, J.; Mpelasoka, F.; Mainuddin, M.; Ticehurst, C.; Dyce, P.; Hodgson, G.; Ali, R.; Kirby, M. Mekong River Basin Water Resources Assessment: Impacts of Climate Change; CSIRO: Canberra, Australia, 2008.
- Shrestha, B.; Babel, M.S.; Maskey, S.; Van Griensven, A.; Uhlenbrook, S.; Green, A.; Akkharath, I. Impact of climate change on sediment yield in the Mekong River basin: A case study of the Nam Ou basin, Lao PDR. Hydrol. Earth Syst. Sci. 2013, 17, 1–20. [Google Scholar] [CrossRef]
- Thilakarathne, M.; Sridhar, V. Characterization of future drought conditions in the Lower Mekong River Basin. Weather Clim. Extrem. 2017, 17, 47–58. [Google Scholar] [CrossRef]
- Bonnema, M.; Hossain, F. Inferring reservoir operating patterns across the Mekong Basin using only space observations. Water Resour. Res. 2017, 53, 3791–3810. [Google Scholar] [CrossRef]
- Li, D.; Long, D.; Zhao, J.; Lu, H.; Hong, Y. Observed changes in flow regimes in the Mekong river basin. J. Hydrol. 2017, 551, 217–232. [Google Scholar] [CrossRef]
- Kummu, M.; Lu, X.; Wang, J.; Varis, O. Basin-wide sediment trapping efficiency of emerging reservoirs along the mekong. Geomorphology 2010, 119, 181–197. [Google Scholar] [CrossRef]
- Wild, T.B.; Loucks, D.P. Managing flow, sediment, and hydropower regimes in the sre pok, se san, and se kong rivers of the mekong basin. Water Resour. Res. 2014, 50, 5141–5157. [Google Scholar] [CrossRef]
- Perra, E.; Piras, M.; Deidda, R.; Paniconi, C.; Mascaro, G.; Vivoni, E.R.; Cau, P.; Marras, P.A.; Ludwig, R.; Meyer, S. Multimodel assessment of climate change-induced hydrologic impacts for a Mediterranean catchment. Hydrol. Earth Syst. Sci. 2018, 22, 4125–4143. [Google Scholar] [CrossRef] [Green Version]
- Mendoza, P.A.; Clark, M.P.; Mizukami, N.; Newman, A.J.; Barlage, M.; Gutmann, E.D.; Rasmussen, R.M.; Rajagopalan, B.; Brekke, L.D.; Arnold, J.R. Effects of hydrologic model choice and calibration on the portrayal of climate change impacts. J. Hydrometeorol. 2015, 16, 762–780. [Google Scholar] [CrossRef]
- Al-Safi, H.I.J.; Sarukkalige, P.R. The application of conceptual modelling to assess the impacts of future climate change on the hydrological response of the Harvey River catchment. J. Hydro-Environ. Res 2018. [Google Scholar] [CrossRef]
- Al-Safi, H.I.J.; Sarukkalige, P.R. Evaluation of the impacts of future hydrological changes on the sustainable water resources management of the Richmond River catchment. J. Water Clim. Chang. 2018, 9, 137–155. [Google Scholar] [CrossRef]
- Al-Safi, H.I.J.; Kazemi, H.; Sarukkalige, P.R. Comparative study of conceptual versus distributed hydrologic modelling to evaluate the impact of climate change on future runoff in unregulated catchments. J. Water Clim. Chang. 2019. [Google Scholar] [CrossRef]
- Piman, T.; Lennaerts, T.; Southalack, P. Assessment of hydrological changes in the lower Mekong basin from basin-wide development scenarios. Hydrol. Process. 2013, 27, 2115–2125. [Google Scholar] [CrossRef]
- Gosling, S.; Taylor, R.G.; Arnell, N.; Todd, M.C. A comparative analysis of projected impacts of climate change on river runoff from global and catchment-scale hydrological models. Hydrol. Earth Syst. Sci. 2011, 15, 279–294. [Google Scholar] [CrossRef] [Green Version]
- Kingston, D.G.; Thompson, J.R.; Kite, G. Uncertainty in climate change projections of discharge for the Mekong River Basin. Hydrol. Earth Syst. Sci. 2011, 15, 1459–1471. [Google Scholar] [CrossRef] [Green Version]
- Homdee, T.; Pongput, K.; Kanae, S. Impacts of land cover changes on hydrologic responses: A case study of chi river basin, Thailand. J. Jpn. Soc. Civ. Eng. Ser. B1 2011, 67, I31–I36. [Google Scholar] [CrossRef]
- Thanapakpawin, P.; Richey, J.; Thomas, D.; Rodda, S.; Campbell, B.; Logsdon, M. Effects of landuse change on the hydrologic regime of the Mae Chaem river basin, NW Thailand. J. Hydrol. 2007, 334, 215–230. [Google Scholar] [CrossRef]
- Tatsumi, K.; Yamashiki, Y. Effect of irrigation water withdrawals on water and energy balance in the Mekong River Basin using an improved VIC land surface model with fewer calibration parameters. Agric. Water Manag. 2015, 159, 92–106. [Google Scholar] [CrossRef]
- Introduction to SWAT and the Instructional Videos. Available online: https://swat.tamu.edu/workshops/instructional-videos/ (accessed on 24 June 2019).
- VIC Model Overview. Available online: https://vic.readthedocs.io/en/master/Overview/ModelOverview/ (accessed on 24 June 2019).
- Kang, H.; Sridhar, V. Combined statistical and spatially distributed hydrological model for evaluating future drought indices in Virginia. J. Hydrol. Reg. Stud. 2017, 12, 253–272. [Google Scholar] [CrossRef]
- Kang, H.; Sridhar, V. Assessment of Future Drought Conditions in the Chesapeake Bay Watershed. JAWRA J. Am. Water Res. Assoc. 2018, 54, 160–183. [Google Scholar] [CrossRef]
- Kang, H.W.; Sridhar, V. Improved drought prediction using near real-time climate forecasts and simulated hydrologic conditions. Sustainability 2018, 10, 1799. [Google Scholar] [CrossRef]
- Sehgal, V.; Sridhar, V. Watershed-scale retrospective drought analysis and seasonal forecasting using multi-layer, high-resolution simulated soil moisture for Southeastern U.S. Weather Clim. Extrem. 2019, 23, 100191. [Google Scholar] [CrossRef]
- Hoekema, D.J.; Sridhar, V. A system dynamics model for conjunctive management of water resources in the Snake River basin. JAWRA J. Am. Water Res. Assoc. 2013, 49, 1327–1350. [Google Scholar] [CrossRef]
- Sridhar, V.; Ali, S.; Modi, P.; Kang, H.; Quan, N.; Dat, N.D.; Kansal, M.D. Can we quantify the resilience of the Lower Mekong Basin in the face of dams and agricultural expansion? In Proceedings of the EWRI World Environmental & Water Resource Congress, Pittsburgh, PA, USA, 19–23 May 2019. [Google Scholar]
- Kang, H.; Sridhar, V.; Mills, B.F.; Hession, W.C.; Ogejo, J.A. Economy-wide climate change impacts on green water droughts based on the hydrologic simulations. Agric. Syst. 2019, 171, 76–88. [Google Scholar] [CrossRef]
- Sehgal, V.; Sridhar, V.; Juran, L.; Ogejo, J. Integrating Climate Forecasts with the Soil and Water Assessment Tool (SWAT) for High-Resolution Hydrologic Simulations and Forecasts in the Southeastern US. Sustainability 2018, 10, 3079. [Google Scholar] [CrossRef]
- Jin, X.; Sridhar, V. Impacts of climate change on hydrology and water resources in the Boise and Spokane River Basins. JAWRA J. Am. Water Res. Assoc. 2012, 48, 197–220. [Google Scholar] [CrossRef]
- Sridhar, V.; Jin, X.; Jaksa, W.T.A. Explaining the hydroclimatic variability and change in the Salmon River basin. Clim. Dyn. 2013, 40, 1921–1937. [Google Scholar] [CrossRef]
- Arnold, J.G.; Srinivasan, R.; Muttiah, R.S.; Williams, J.R. Large area hydrologic modeling and assessment part I: Model development1. JAWRA J. Am. Soc. Water Resour. Assoc. 1998, 34, 73–89. [Google Scholar] [CrossRef]
- Neitsch, S.L.; Arnold, J.G.; Kiniry, J.R.; Williams, J.R. Soil and Water Assessment Tool Theoretical Documentation Version 2009; Texas Water Resources Institute: Temple, TX, USA, 2011. [Google Scholar]
- Arnold, J.G.; Moriasi, D.N.; Gassman, P.W.; Abbaspour, K.C.; White, M.J.; Srinivasan, R.; Santhi, C.; Harmel, R.D.; Van Griensven, A.; Van Liew, M.W.; et al. SWAT: Model use, calibration, and validation. Trans. ASABE 2012, 55, 1491–1508. [Google Scholar] [CrossRef]
- Jha, M.; Arnold, J.G.; Gassman, P.W.; Giorgi, F.; Gu, R.R. Climate change sensitivity assessment on upper Mississippi River Basin streamflow using SWAT. JAWRA J. Am. Water Resour. Assoc. 2006, 42, 997–1015. [Google Scholar] [CrossRef]
- Githui, F.; Gitau, W.; Mutua, F.; Bauwens, W. Climate change impact on SWAT simulated streamflow in western Kenya. Int. J. Climatol. 2009, 29, 1823–1834. [Google Scholar] [CrossRef]
- Wu, Y.; Liu, S.; Abdul-Aziz, O.I. Hydrological effects of the increased CO2 and climate change in the Upper Mississippi River Basin using a modified SWAT. Clim. Chang. 2012, 110, 977–1003. [Google Scholar] [CrossRef]
- Ficklin, D.L.; Luo, Y.; Luedeling, E.; Zhang, M. Climate change sensitivity assessment of a highly agricultural watershed using SWAT. J. Hydrol. 2009, 374, 16–29. [Google Scholar] [CrossRef]
- Taye, M.T.; Ntegeka, V.; Ogiramoi, N.P.; Willems, P. Assessment of climate change impact on hydrological extremes in two source regions of the Nile River Basin. Hydrol. Earth Syst. Sci. 2011, 15, 209–222. [Google Scholar] [CrossRef] [Green Version]
- Ashraf Vaghefi, S.; Mousavi, S.J.; Abbaspour, K.C.; Srinivasan, R.; Yang, H. Analyses of the impact of climate change on water resources components, drought and wheat yield in semiarid regions: Karkheh River Basin in Iran. Hydrol. Process. 2014, 28, 2018–2032. [Google Scholar] [CrossRef]
- Yatagai, A.; Kamiguchi, K.; Arakawa, O.; Hamada, A.; Yasutomi, N.; Kitoh, A. APHRODITE: Constructing a long-term daily gridded precipitation dataset for Asia based on a dense network of rain gauges. Bull. Am. Meteorol. Soc. 2012, 93, 1401–1415. [Google Scholar] [CrossRef]
- Sheffield, J.; Goteti, G.; Wood, E.F. Development of a 50-Year High-Resolution Global Dataset of Meteorological Forcings for Land Surface Modeling. J. Clim. 2006, 19, 3088–3111. [Google Scholar] [CrossRef] [Green Version]
- Danielson, J.J.; Gesch, D.B. Global Multi-Resolution Terrain Elevation Data 2010 (GMTED2010); No. 2011-1073; US Geological Survey (USGS): Sioux Falls, SD, USA, 2011.
- FAO (Food and Agriculture Organization). Digital Soil Map of the World and Derived Soil Properties; Food and Agriculture Organization of the United Nations: Rome, Italy, 1995. [Google Scholar]
- Global Land Cover Characterization (GLCC). Available online: https://www.usgs.gov/centers/eros/science/usgs-eros-archive-land-cover-products-global-land-cover-characterization-glcc?qt-science_center_objects=0#qt-science_center_objects (accessed on 24 June 2019).
- Cosby, B.J.; Hornberger, G.M.; Clapp, R.B.; Ginn, T.R. A Statistical Exploration of the Relationships of Soil Moisture Characteristics to the Physical Properties of Soils. Water Resour. Res. 1984, 20, 682–690. [Google Scholar] [CrossRef] [Green Version]
- Ren-Jun, Z. The Xinanjiang model applied in China. J. Hydrol. 1992, 135, 371–381. [Google Scholar] [CrossRef]
- Ahirwar, A.; Jain, M.K.; Perumal, M. Performance of the Xinanjiang model. In Hydrologic Modeling; Springer: Singapore, Singapore, 2018; pp. 715–731. [Google Scholar]
- Sahoo, B. The Xinanjiang model and its derivatives for modeling soil moisture variability in the land-surface schemes of the climate change models: An overview. In Proceedings of the International Conference on Hydrological Perspectives for Sustainable Development, New Delhi, India, 23–25 February 2005. [Google Scholar]
- Liang, X.; Lettenmaier, D.P.; Wood, E.F.; Burges, S.J. A simple hydrologically based model of land surface water and energy fluxes for general circulation models. J. Geophys. Res. Atmos. 1994, 99, 14415–14428. [Google Scholar]
- Franchini, M.; Pacciani, M. Comparative analysis of several conceptual rainfall-runoff models. J. Hydrol. 1991, 122, 161–219. [Google Scholar] [CrossRef]
- Wood, E.F.; Lettenmaier, D.P.; Zartarian, V.G. A land-surface hydrology parameterization with subgrid variability for general circulation models. J. Geophys. Res. Atmos. 1992, 97, 2717–2728. [Google Scholar] [CrossRef]
- Lohmann, D.; Nolte-Holube, R.; Raschke, E. A large-scale horizontal routing model to be coupled to land surface parametrization schemes. Tellus A 1996, 48, 708–721. [Google Scholar] [CrossRef]
- Lohmann, D.; Raschke, E.; Nijssen, B.; Lettenmaier, D.P. Regional scale hydrology: II. Application of the VIC-2L model to the Weser River, Germany. Hydrol. Sci. J. 1998, 43, 143–158. [Google Scholar] [CrossRef] [Green Version]
- Haddeland, I.; Lettenmaier, D.P.; Skaugen, T. Effects of irrigation on the water and energy balances of the Colorado and Mekong river basins. J. Hydrol. 2006, 324, 210–223. [Google Scholar] [CrossRef]
- Västilä, K.; Kummu, M.; Sangmanee, C.; Chinvanno, S. Modelling climate change impacts on the flood pulse in the Lower Mekong floodplains. J. Water Clim. Chang. 2010, 1, 67–86. [Google Scholar] [CrossRef]
- Zhou, T.; Nijssen, B.; Gao, H.; Lettenmaier, D.P. The contribution of reservoirs to global land surface water storage variations. J. Hydrometeorol. 2016, 17, 309–325. [Google Scholar] [CrossRef]
- Hempel, S.; Frieler, K.; Warszawski, L.; Schewe, J.; Piontek, F. A trend-preserving bias correction–the ISI-MIP approach. Earth Syst. Dyn. 2013, 4, 219–236. [Google Scholar] [CrossRef]
- Burhan, A.; Waheed, I.; Syed, A.A.B.; Rasul, G.; Shreshtha, A.B.; Shea, J.M. Generation of high-resolution gridded climate fields for the upper Indus River Basin by downscaling CMIP5 outputs. J. Earth Sci. Clim. Chang. 2015, 6, 1. [Google Scholar]
- Ruan, Y.; Liu, Z.; Wang, R.; Yao, Z. Assessing the Performance of CMIP5 GCMs for Projection of Future Temperature Change over the Lower Mekong Basin. Atmosphere 2019, 10, 93. [Google Scholar] [CrossRef]
- Abbaspour, K.C. User Manual for SWAT-CUP: SWAT Calibration and Uncertainty Analysis Programs; Swiss Federal Institute Aquatic Science and Technology: Dübendorf, Switzerland, 2011. [Google Scholar]
- Nash, J.E.; Sutcliffe, J.V. River flow forecasting through conceptual models part I—A discussion of principles. J. Hydrol. 1970, 10, 282–290. [Google Scholar] [CrossRef]
- Sridhar, V.; Hubbard, K.G.; Wedin, D.A. Assessment of soil moisture dynamics of the Nebraska Sandhills using long-term measurements and a hydrology model. J. Irrig. Drain. Eng. 2006, 132, 463–473. [Google Scholar] [CrossRef]
- Sridhar, V.; Wedin, D.A. Hydrological behaviour of grasslands of the Sandhills of Nebraska: Water and energy-balance assessment from measurements, treatments, and modelling. Ecohydrol. Ecosyst. Land Water Process Interact. Ecohydrogeomorphol. 2009, 2, 195–212. [Google Scholar] [CrossRef]
- USDA (U.S. Department of Agriculture). Soil Conservation Service, National Engineering Handbook; Hydrology (Section 4, Chapters 4–10); GPO: Washington, DC, USA, 1972. [Google Scholar]
- Boughton, W.C. A review of the USDA SCS curve number method. Soil Res. 1989, 27, 511–523. [Google Scholar] [CrossRef]
Figure 1.
Location map of the Mekong River Basin with reservoirs (in red circles), flow stations (black boxes), and sub-watershed boundaries.
Figure 1.
Location map of the Mekong River Basin with reservoirs (in red circles), flow stations (black boxes), and sub-watershed boundaries.

Figure 2.
Choice of wet/dry and cold/hot global circulation models (GCM) from two representative concentration pathways (RCPs)—4.5 and 8.5—showing changing precipitation and temperature for five future periods F1 through F5 between 2006 and 2099.
Figure 2.
Choice of wet/dry and cold/hot global circulation models (GCM) from two representative concentration pathways (RCPs)—4.5 and 8.5—showing changing precipitation and temperature for five future periods F1 through F5 between 2006 and 2099.

Figure 3.
Flow diagram of the overall processes of hydrologic modeling and analyses. SWAT: soil and water assessment; VIC: variable infiltration capacity; APHRODTE: Asian Precipitation—Highly-Resolved Observational Data Integration Towards Evaluation; CMIP5: Coupled Model Intercomparison Project 5; ISI-MIP: Inter-Sectoral Impact Model Intercomparison Project; RCP: representative concentration pathway.

Figure 4.
Long-term streamflow simulations (1954–2015) compared against observations (1984–1996) with two different time periods for calibration and validation by the SWAT and the VIC macro scale hydrological models. The box plot (on the right) shows the mean and spread of flows captured by SWAT and VIC.

Figure 5.
(a–g) Differences in peakflows between two periods; (h) streamflow anomaly (%) for seven locations between 1992 and 2015.
Figure 5.
(a–g) Differences in peakflows between two periods; (h) streamflow anomaly (%) for seven locations between 1992 and 2015.

Figure 6.
Projected streamflows from VIC and SWAT models between 2020 and 2099 for seven locations where calibration and validation of streamflows were performed for the historic periods.
Figure 6.
Projected streamflows from VIC and SWAT models between 2020 and 2099 for seven locations where calibration and validation of streamflows were performed for the historic periods.

Figure 7.
Projected peakflow changes between 2020 and 2099, simulated by VIC and SWAT.

Figure 8.
Shifts in peakflows with and without reservoirs, simulated by the SWAT model for the period between 1992 and 2015 (14 year average).
Figure 8.
Shifts in peakflows with and without reservoirs, simulated by the SWAT model for the period between 1992 and 2015 (14 year average).

Figure 9.
Shifts in peakflows (RCP 4.5) with and without reservoirs, simulated by the SWAT model for the period between 2020 and 2099 (80 year average).
Figure 9.
Shifts in peakflows (RCP 4.5) with and without reservoirs, simulated by the SWAT model for the period between 2020 and 2099 (80 year average).

Figure 10.
Water budget changes for historic and future periods for each sub-watershed; (a) SWAT; (b) VIC.
Figure 10.
Water budget changes for historic and future periods for each sub-watershed; (a) SWAT; (b) VIC.

Figure 11.
Spatial plot of precipitation, temperature, and water budget changes for historic and future periods. (a–c) Precipitation changes; (d–f) temperature changes; (g–i) evapotranspiration (ET) and runoff changes from the SWAT model; (m–r). ET and runoff changes from the VIC model.
Figure 11.
Spatial plot of precipitation, temperature, and water budget changes for historic and future periods. (a–c) Precipitation changes; (d–f) temperature changes; (g–i) evapotranspiration (ET) and runoff changes from the SWAT model; (m–r). ET and runoff changes from the VIC model.


Table 1.
Description of the soil and water assessment tool (SWAT) model input parameters for the calibration.
Table 1.
Description of the soil and water assessment tool (SWAT) model input parameters for the calibration.
| Parameter | Description | Min | Max | Best Parameters |
|---|---|---|---|---|
| r_CN2.mgt | Curve number for moisture condition II | −0.2 | 0.2 | 0.06 |
| v_ALPHA_BF.gw | Baseflow alpha factor | 0 | 1 | 0.35 |
| v_GW_DELAY.gw | Groundwater delay time | 30 | 450 | 177 |
| v_GWQMN.gw | Threshold water depth in shallow aquifer for back discharge | 0 | 2000 | 1500 |
Notes: v_, denotes the default parameter is replaced by a given value; r_, means the existing parameter value is multiplied by (1 + a given value).
Table 2.
Description of the variable infiltration capacity (VIC) model input parameters for the calibration.
Table 2.
Description of the variable infiltration capacity (VIC) model input parameters for the calibration.
| S. No. | Parameter | Description | Allowable Range | |
|---|---|---|---|---|
| Lower | Upper | |||
| 1 | bi | variable infiltration curve parameter | 0.1 | 0.5 |
| 2 | D | the depth of soil layers | 0.1 | 1.5 |
| 3 | Ds | fraction of maximum velocity of baseflow where non-linear baseflow begins | 0 | 0.4 |
| 4 | Ws | fraction of maximum soil moisture where non-linear baseflow occurs | 0.5 | 1 |
Table 3.
Statistical indicators showing the hydrology model calibration and validation for the historical period between 1984 and 1992 in the Mekong River Basin.
Table 3.
Statistical indicators showing the hydrology model calibration and validation for the historical period between 1984 and 1992 in the Mekong River Basin.
| Station | Calibration Period | Validation Period | Calibration | Validation | ||||||
|---|---|---|---|---|---|---|---|---|---|---|
| R2 | NS | R2 | NS | |||||||
| SWAT | VIC | SWAT | VIC | SWAT | VIC | SWAT | VIC | |||
| Chiang Saen | 1984–1990 | 1991–1996 | 0.92 | 0.93 | 0.86 | 0.83 | 0.93 | 0.91 | 0.85 | 0.81 |
| Luang Prabang | 1984–1990 | 1991–1997 | 0.93 | 0.93 | 0.81 | 0.73 | 0.94 | 0.89 | 0.86 | 0.67 |
| Vientiane | 1984–1990 | 1991–1996 | 0.92 | 0.93 | 0.83 | 0.91 | 0.95 | 0.94 | 0.88 | 0.92 |
| Nakhon Phanom | 1984–1990 | 1991–1995 | 0.93 | 0.93 | 0.87 | 0.90 | 0.92 | 0.92 | 0.86 | 0.79 |
| Mukdahan | 1984–1990 | 1991–1995 | 0.93 | 0.94 | 0.89 | 0.86 | 0.93 | 0.94 | 0.88 | 0.83 |
| Pakse | 1984–1990 | 1991–1998 | 0.90 | 0.91 | 0.84 | 0.86 | 0.90 | 0.93 | 0.85 | 0.87 |
| Kratie | 1984–1990 | 1991–1998 | 0.90 | 0.90 | 0.85 | 0.85 | 0.91 | 0.93 | 0.86 | 0.86 |
Table 4.
Percentage change in dry- and wet-season flows projected by SWAT and VIC for RCP 4.5 and RCP 8.5 between 2020 and 2099.
Table 4.
Percentage change in dry- and wet-season flows projected by SWAT and VIC for RCP 4.5 and RCP 8.5 between 2020 and 2099.
| Station | Season | SWAT | VIC | ||||||
|---|---|---|---|---|---|---|---|---|---|
| RCP4.5 | RCP8.5 | RCP4.5 | RCP8.5 | ||||||
| 2020–2059 | 2060–2099 | 2020–2059 | 2060–2099 | 2020–2059 | 2060–2099 | 2020–2059 | 2060–2099 | ||
| Chiang Saen | Wet | 10.5 | 21.9 | 10.7 | 25.1 | 31.4 | 41.0 | 31.7 | 49.1 |
| Dry | 17.6 | 25.7 | 14.7 | 21.3 | 33.6 | 41.3 | 32.2 | 36.6 | |
| Luang Prabang | Wet | 11.3 | 23.5 | 11.9 | 25.8 | 56.1 | 68.7 | 57.1 | 77.7 |
| Dry | 17.7 | 25.5 | 14.1 | 19.4 | 26.8 | 34.2 | 25.2 | 29.7 | |
| Vientiane | Wet | 14.3 | 27.6 | 15.6 | 29.3 | 12.1 | 22.3 | 13.8 | 26.8 |
| Dry | 20.4 | 28.6 | 16.5 | 22.0 | −11.3 | −5.3 | −12.4 | −8.6 | |
| Nakhon Phanom | Wet | 18.8 | 32.2 | 21.0 | 32.7 | 28.0 | 39.4 | 30.1 | 42.7 |
| Dry | 26.0 | 33.5 | 21.4 | 26.9 | −8.7 | −3.8 | −10.8 | −6.5 | |
| Mukdahan | Wet | 19.2 | 32.4 | 21.4 | 32.3 | 38.2 | 50.5 | 40.4 | 53.5 |
| Dry | 27.6 | 35.0 | 22.8 | 28.5 | −3.3 | 1.9 | -5.5 | −0.7 | |
| Pakse | Wet | 18.6 | 30.4 | 20.2 | 29.3 | 22.6 | 32.0 | 23.5 | 33.2 |
| Dry | 31.7 | 39.0 | 26.3 | 33.4 | −31.2 | −27.0 | −32.5 | −28.2 | |
| Kratie | Wet | 21.0 | 30.2 | 21.5 | 29.4 | 32.1 | 39.7 | 32.0 | 40.6 |
| Dry | 37.2 | 42.8 | 31.4 | 39.4 | −22.7 | −19.0 | −24.3 | −18.8 | |
© 2019 by the authors. Licensee MDPI, Basel, Switzerland. This article is an open access article distributed under the terms and conditions of the Creative Commons Attribution (CC BY) license (http://creativecommons.org/licenses/by/4.0/).
Share and Cite
MDPI and ACS Style
Sridhar, V.; Kang, H.; Ali, S.A. Human-Induced Alterations to Land Use and Climate and Their Responses for Hydrology and Water Management in the Mekong River Basin. Water 2019, 11, 1307. https://0-doi-org.brum.beds.ac.uk/10.3390/w11061307
AMA Style
Sridhar V, Kang H, Ali SA. Human-Induced Alterations to Land Use and Climate and Their Responses for Hydrology and Water Management in the Mekong River Basin. Water. 2019; 11(6):1307. https://0-doi-org.brum.beds.ac.uk/10.3390/w11061307
Chicago/Turabian StyleSridhar, Venkataramana, Hyunwoo Kang, and Syed A. Ali. 2019. "Human-Induced Alterations to Land Use and Climate and Their Responses for Hydrology and Water Management in the Mekong River Basin" Water 11, no. 6: 1307. https://0-doi-org.brum.beds.ac.uk/10.3390/w11061307
Note that from the first issue of 2016, this journal uses article numbers instead of page numbers. See further details here.