Evaluation of Mercury Transformation and Benthic Organisms Uptake in a Creek Sediment of Pearl River Estuary, China


1
Department of Civil and Environmental Engineering, Northeastern University, 360 Huntington Avenue, Boston, MA 02115, USA
2
School of Civil Engineering, South China University of Technology, Guangzhou 510640, China
3
California State University, San Bernardino, 5500 University Pkwy, San Bernardino, CA 92407, USA
4
Department of Chemical and Environmental Engineering, University of California, Riverside, 900 University Ave, Riverside, CA 92521, USA
*
Authors to whom correspondence should be addressed.
Water 2019, 11(6), 1308; https://doi.org/10.3390/w11061308
Submission received: 8 May 2019
/
Revised: 13 June 2019
/
Accepted: 21 June 2019
/
Published: 25 June 2019
(This article belongs to the Section Oceans and Coastal Zones)
Abstract
:A large fraction of mercury contaminant in the environment is from industrial production, and it potentially impairs human health once entering the food chain. Millions of people reside in the Pearl River Delta region, and water quality in the estuary directly affects their drinking water safety. Considering the highly intense anthropogenic activities and industrial productions, we attempted to measure the sediment mercury concentration in the Pearl River estuary. In this work, samples of a creek sediment within this region were collected and mercury concentrations were quantified. Total mercury, simultaneously extracted mercury, methylmercury, and bio-accumulated mercury were individually assayed. Results indicated that total mercury concentrations of investigated sites ranged from 1.073 to 4.450 µg/g dry sediment. The mercury in the sediment also transformed into more toxic methylmercury, which then adversely affected benthos biodiversity. Correlation analysis revealed that, mercury was accumulated into benthic microorganisms, mainly through the uptake of methylmercury. High concentrations of acid-volatile sulfide in the sediment indicated the presence of active sulfate-reducing bacteria, which could also catalytically transform inorganic mercury into methylmercury. Correlation analysis further showed that sulfate-reducing bacteria activity accounted for methylmercury formation.
1. Introduction
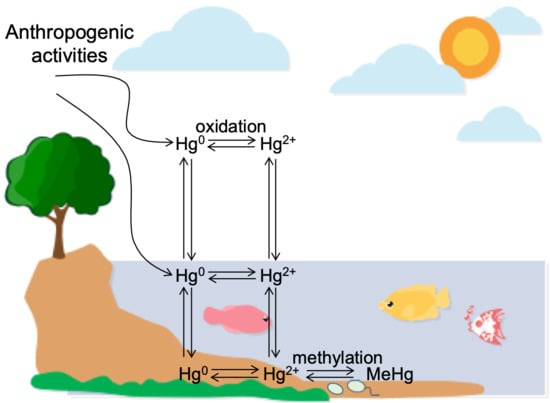
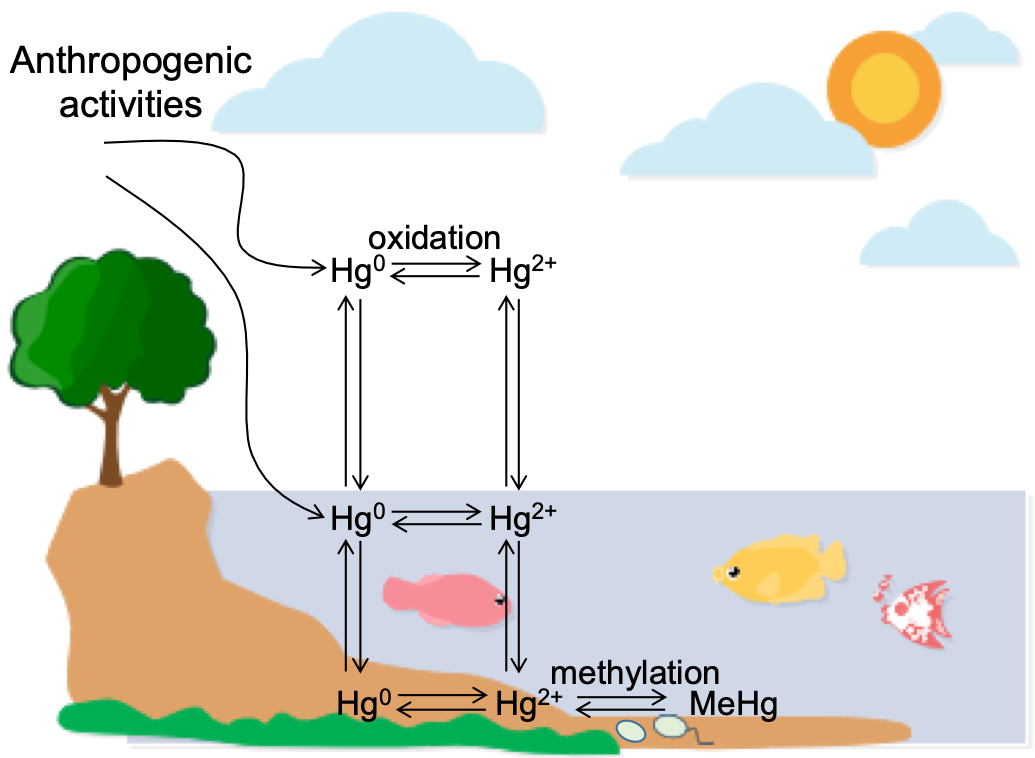
Mercury contamination is a global issue due to its significant toxic effects on human health, and its cytotoxicity being higher than many other heavy metals. One of the most notorious instances is the outbreak of Minamata disease in Japan in 1956 that caused profound concern about mercury contamination around the world [1,2,3]. Most mercury emitted in the environment is from anthropogenic activity, such as fossil fuel power plants [4,5,6]. Later investigations revealed that different forms of mercury exhibit quite different levels of toxicity. Among them, mercury with a methyl group (methylmercury, MeHg) is the most toxic species, the toxicity of which is around 50–100 times higher than that of inorganic mercury [7,8,9]. Moreover, methylmercury is highly lipophilic [10,11], which allows methylmercury to easily transfer through food chain and accumulate in the human body [12,13]. For example, it has been extensively reported that various benthic organisms could efficiently take up and accumulate methylmercury from bulk solution [14,15,16,17]. Once entering human body, methylmercury can cause central nervous system poisoning and may even lead to death [18,19,20]. Therefore, the migration and transformation of mercury in the environment are persistently investigated [21,22].
In a natural environment, methylation of mercury primarily occurs in sediments, mediated by a range of terminal electron-accepting anaerobic microbes possessing an hgc gene cluster, such as sulfate- and iron-reducing bacteria (SRB and FeRB) [23,24] and, to some extent, methanogens [25]. These microbes catalyze the conversion of mercury into methylmercury, via donation of a methyl group to the mercury ion. About 1% of sediment methylmercury can be released into the bulk water during water fluctuations [26]. The release of methylmercury from sediments is a slow process [27], which explains the high levels of methylmercury in river water and aquatic organisms after many years of mercury pollution.
In the Pearl River estuary region (Guangdong Province, China), the river network is densely populated and interlaced, making it one of the most abundant water resources in China. However, along with the economic development of Pearl River Delta, many cases of water pollution by heavy metals have been reported [28,29,30,31]. The decrease of water quality in Pearl River estuary directly affects the drinking water safety for millions of downstream residents. However, the mercury contamination in the Pearl River estuary is seldomly reported, and data of recent years in particular are lacking. In this study, we investigated mercury content in the sediments of the Pearl River estuary, since anthropogenic activities are highly intensive in this area. Our primary goal is to reveal that mercury pollution is a noticeable issue that might affect the safety of human health via drinking water and food chain accumulation. This study will lead to a renewed understanding of mercury contamination in this area.
2. Materials and Methods
2.1. Study Area
The field study was performed in Southwest Creek, located near Guangzhou city, which belongs to part of the Pearl River estuary in Southern China. As the second largest river of the North River in Guangdong Province, the water quality of Southwest Creek affects much of the Guangzhou section of the Pearl River upstream. In addition, Southwest Creek also undertakes other functions, such as irrigation, navigation and landscape, which highlights its importance to the Guangzhou–Foshan Economic Circle and the Pearl River Delta. This area is mostly polluted with trace metals, hydrophobic organic contaminants and eutrophication resulting from pollution from industrial, domestic and agricultural wastewater, which is receiving great attention. The composite average pollution index of the 12 main rivers in Guangzhou city is 0.44, while Southwest Creek reaches a critical level of pollution with an index of 1.21, ranking it in first place for its pollution level out of all the rivers of Guangzhou city [32].
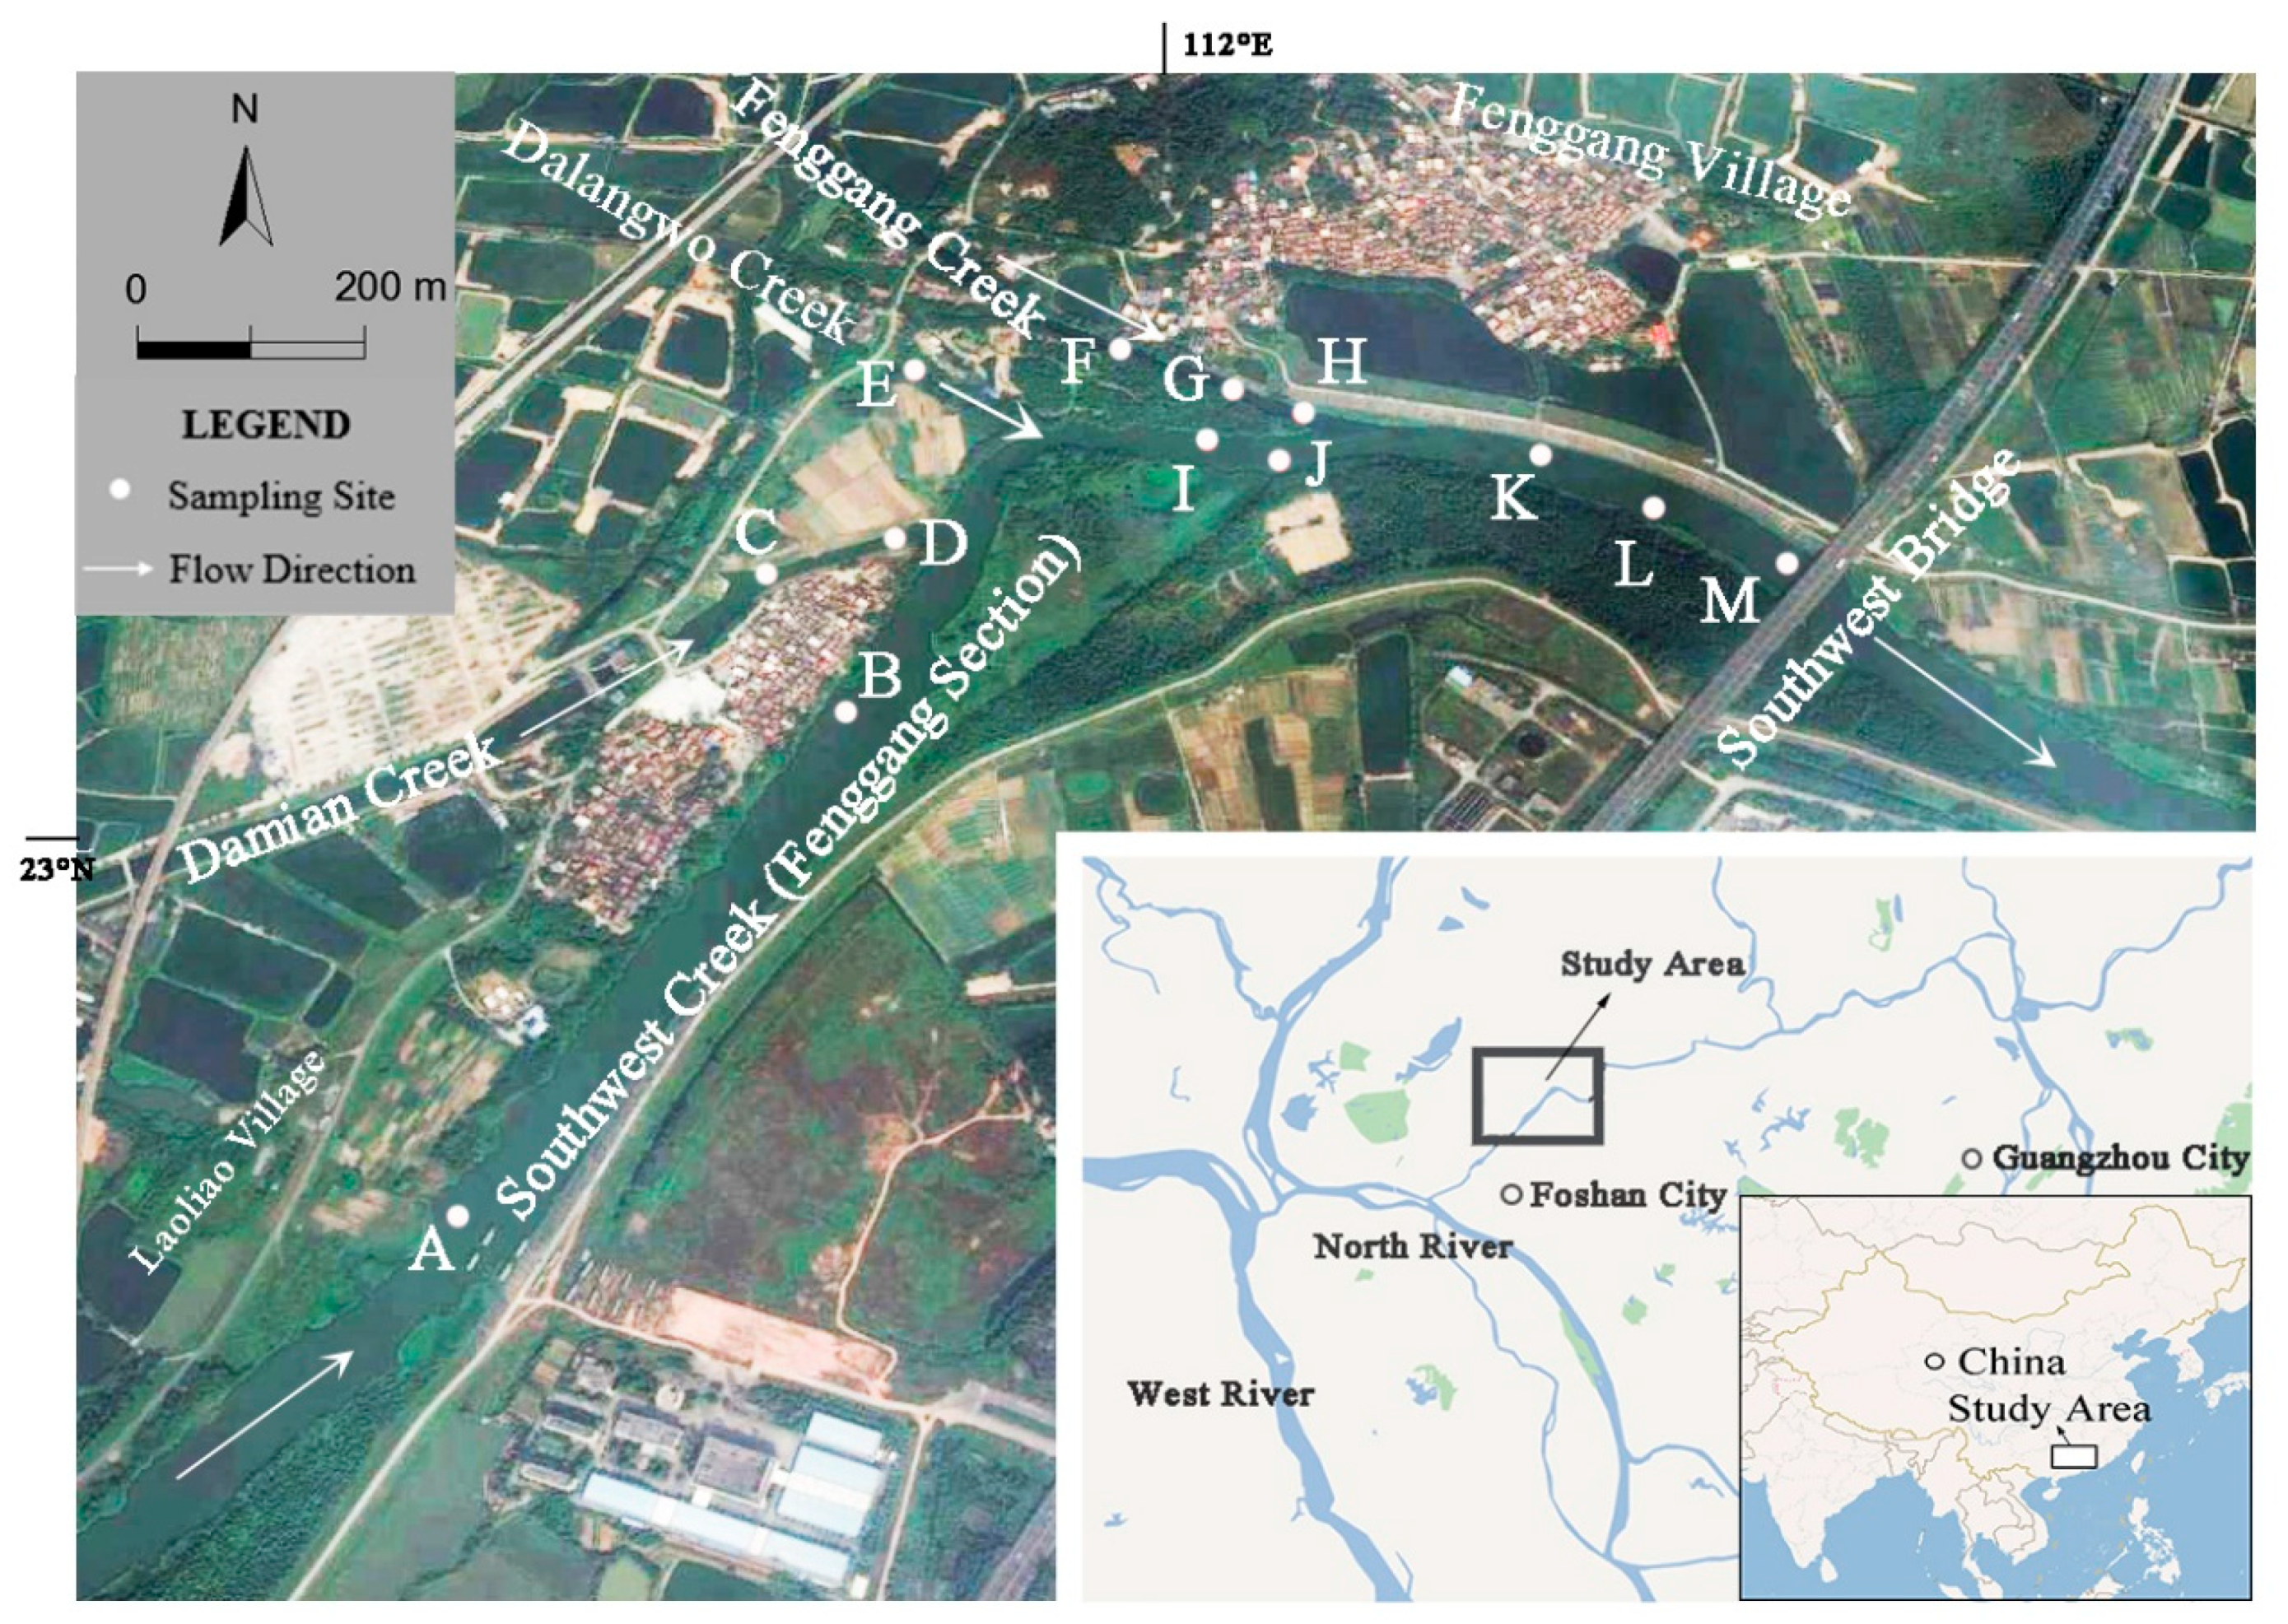
This study selects the most representative section (Fenggang section) of Southwest Creek, which is located in the upper reach of the Southwest Creek, and has the highest pollution index (2.25) [32]. The Fenggang section, inflowing from Southwest Creek without any large-scale sewage treatment plant, has poor industrial wastewater collection and treatment facilities. It is difficult to monitor so many small factories. Consequently, a large amount of sewage and waste passes directly from drains into the river, contaminating it with a large amount of pollutants which pose a serious threat to the environmental quality of the Fenggang section. The Fenggang section indicates the water quality at the interface of Southwest Creek: The North River water upstream from the Southwest Sluice is good quality, while the downstream water quality begins to deteriorate from the start of the Fenggang section because of sewage contamination. As a result, 13 sampling stations were selected for our study covering the majority of the creek, as shown in Figure 1.
2.2. Sediment Sample Collection
All glassware and plasticware were cleaned by soaking in 10% HNO3 (v/v) for 24 h, followed by soaking and rinsing with deionized water (Milli-Q). Sampling was done during pre-monsoon time, August 2011. Sediment samples were collected at 13 locations proportional to their relative abundance. There was an upper limit on the size of the sediments: They were not allowed to exceed sand grain size due to the absence of acid-volatile sulfide (AVS). Only sandy or smaller grain samples were tested, rather than proportional sampling of various grain sizes when large-diameter sediment grain such as gravel, cobble and boulders, accounted for most sampling sites. At least three parallel sediments were collected and composited from an area of approximately 2 m2 at each sampling site. For the sake of minimizing sampling-related artefacts and obtaining accurate field values, sediments were sampled carefully using 0.57-cm diameter core tubes (Dutch Eijkelkamp Beeker sediment undisturbed sampler 04.23.SB type, Giesbeek of Gelderland, Netherlands) constructed from polyvinyl chloride or stainless steel. Core tubes were washed with onsite water before and after sampling to remove any residual sediments. The core tube was vertically inserted into the sediment to a certain depth, between 5 and 8 cm, to collect surficial sediment. Cored sediments were extruded gently into a pan and the upper 5–8 cm sediment sample was collected.
Sterile portions for microbiological analyses were aseptically collected from cores and maintained at 4 °C in the dark until their arrival in laboratory, where they were processed immediately. The top 5–8 cm layer (three samples in parallel) from the sediment–water interface were transferred to plastic bags and sealed. Then they were homogenized, gently poured (by a stainless steel or plastic spoon within 30 s) into two 1-L sampling containers that were filled completely with sediment, and in some cases nitrogen gas, to reduce the likelihood of oxidation and loss of AVS. One container was labelled with pencil inside the bottle lid, and the other one was labelled with a permanent marker outside the bottle for reference. Samples were preserved by freezing until returning to the laboratory for further analysis, which occurred within two weeks after sampling. Prior to analysis, the samples were first freeze dried (VirTis Benchtop 6K, Gardiner, NY, USA) and then milled using an agate mortar, followed by filtering using a 100 mesh sieve. By simultaneous determination, the state of the environment near the sampling sites, such as water depth, water temperature and other indicators, were also recorded.
2.3. Determination of the Total Mercury in Sediment Samples
After collection of sediments, the samples were freeze dried (VirTis Benchtop 6K) and then milled using an agate mortar, followed by passing through a 100 mesh sieve. Total mercury (HgTot) was determined using atomic absorption spectrometry, which has been extensively reported [33,34,35]. 5 g sediment samples were put into 10 mL water. The solution was heated at 95 °C for 5 min, and then ultrapure water (5 mL), and BrCl (1 mL) were added. After digestion for 30 min, the solution was made up to a total volume of 25 mL by the addition of ultrapure water before sealing the flask, and then stood for over 24 h. After the addition of 200 μL of 200 g/L hydroxylamine hydrochloride, 5 mL samples were transported into another bottle and mixed with 1 mL SnCl2 (100 g/L). The total mercury in the sediment was determined by measuring the mixture using atomic absorption spectrometry double optical path mercury analyzer (Shanghai Huaguang, F732-S, Shanghai, China). The absorbance measured at 253.7 nm is proportional to the mercury content in the sample. To reduce sampling-related artefacts, three sediments at each sampling site were collected from an area of approximately 2 m2. Most variables show a coefficient of variation of ± 5% and therefore are described as an average value ± standard deviation. The HgTot content is expressed as μg/g dry sediment.
2.4. Determination of the Simultaneously Extracted Mercury in Sediment Samples
Simultaneously extracted mercury (HgSEM) was analyzed by a modified diffusion method [36]. Briefly, sediments were dissolved with 1 M HCl, and simultaneously extracted mercury concentrations were measured in the sediment suspension after filtration over a 0.45 μm nitrocellulose membrane. Mercury concentration was detected using inductively coupled plasma mass spectrometry (ICP-MS). The HgSEM content is expressed as μg/g dry sediment.
2.5. Determination of the Methylmercury Content in the Sediment Samples
The methylmercury (MeHg) concentration in the sediment was measured with ethylation combined with gas chromatography–cold atomic fluorescence method (ethylation-GC-CVAFS) [37]. 2.5000 g of dry sediment was weighed and recorded as m0 before being placed into a 30 mL capped centrifugal tube, followed by the addition of 3.0 mL of a CuSO4 solution (2 M) and 7.5 mL HNO3 (75%, v/v), and the total weight was recorded as m1. 10 mL of CH2Cl2 was added to the mixture and the weight recorded as m2. The mixture was then shaken for 30 min at 350 rpm before being centrifuged for another 15 min at 3000 rpm. The organic layer was transferred into a 200 mL Teflon distilling flask (of which the weight was recorded as m3), and the total weight was recorded as m4 followed by the addition of 45 mL of ultrapure water. The Teflon distilling flask containing the CH2Cl2 layer was heated to 60–70 °C for 1 h and then flushed with nitrogen at 80 °C until the evaporation of CH2Cl2 was complete. 50 mL of ultrapure water was added to the residue and the volume was recorded as V1. From this solution, a 5 mL sample was taken into another capped glass vial and the volume was recorded as V2 followed by the addition of ultrapure water to give a final volume of 40 mL. The reaction solution was adjusted to pH 4.5 followed by the addition of 40 μL of tetraethyl boride sodium reagent (1%, m/v). The procedure was repeated until there were no air bubbles in the glass vial. During the entire process, inorganic Hg2+ bound with sodium tetraethylborate to generate a gaseous dimethylmercury; meanwhile, methylmercury was transformed into a gaseous form. Finally, samples in the glass vial were introduced into the automatic methylmercury analyzer (with a nitrogen flow rate of 200–300 mL/min and an argon flow rate of 450 mL/min), and M (pg) was recorded by the machine. Equation (1) used to calculate the concentration of methylmercury in the sample is shown below. The MeHg content is expressed as ng/g dry sediment.
2.6. Determination of Acid-Volatile Sulfide Content in Sediment Samples
Acid-volatile sulfide (AVS) content was analyzed using a modified diffusion method [36]. Briefly, sulfides were dissolved from the wet sediments with 1 M HCl and subsequently trapped in 0.5 M NaOH solution under nitrogen purging. AVS concentrations were determined with a sulfide-specific electrode and a double-junction reference electrode (Ag 500 and R 502, respectively). The detection limit was 3 μg/g dry sediment and the standard deviation was below 15%. The AVS content is expressed as μg/g dry sediment.
2.7. Determination of Sulfate-Reducing Bacteria Amount in Sediment Samples
Sulfate-reducing bacteria (SRB) amount was quantified using the most-probable-number (MPN) method. 10 g wet sediment samples were suspended in 100 mL of sterile water, shaken at room temperature for 20 min, and then left to stand for 30 min. Supernatants were serially diluted with a 10-fold step, and total dilutions were 106 times. The diluted samples were transferred using a sterilized syringe into sterilized Postgate C medium, and then anaerobically cultivated at 30 °C for 21 days. Flasks with black precipitates showing the growth of SRB were used for SRB enumeration, and the results were expressed as MPN/g (d.w.), where d.w. means dry weight.
2.8. Determination of Redox Potential and Organic Carbon in the Sediment Samples
Redox potential (Eh) of the sediments was measured with a portable redox potentiometer (AZ8651, Xiamen Webetop Electronic Technology Co., Ltd., Xiamen, China). Sediment samples were then grinded and filtered using a 100 mesh nylon mesh. Organic carbon (OC) content was calculated from the weight loss after heating dried sediments at 550 °C for 3.5 h, multiplied by a factor of 0.58 [38]. Results of acid-volatile sulfide content, sulfate-reducing bacteria amount, redox potential, and organic carbon of each sampling site are included in Table 1.
2.9. Determination of Mercury Accumulated in Benthic Organisms
The collected benthic organisms, which are molluscs, annelids, arthropod, and platyhelminthe, were dried and mashed into powder. The hard shells were removed from certain molluscs before being smashed into powder. The mashed powders were then weighed. The mercury accumulated in benthos (HgBio) was then quantified with the same procedure as HgTot. The HgBio is expressed as μg/g dry biomass weight.
3. Results and Discussions
3.1. Mercury Measurement and Speciation in Sediment Sites
Sediment sampling sites are presented in Figure 1, and associated characterizations are summarized in Table 1. As shown, site F was the most contaminated, as the dissolved oxygen and pH were below the minimum permissible level. Moreover, the COD (chemical oxygen demand) of both sites K and F exceeded the maximum standard value of 40 mg/L [39].
In general, the water quality varied markedly in their characteristics. For example, compared to upstream water, the downstream waters are largely polluted. Water in the main stems is less polluted by comparison with branching channels. Site F can be regarded as a transitional zone in the water quality in Southwest Creek: The upstream is relatively clean, while the downstream water quality starting from site F begins to deteriorate due to the influence of sewage. In recent years, with the development of the regional economy and society, Fenggang Creek has gradually become a polluting site of industrial, domestic, and agricultural wastewater (such as Laoliao village and Fenggang village as shown in Figure 1), affecting the sediment and environmental data at downstream of site F.
3.2. Mercury Speciation in the Sediments
To fully assess the mercury pollution of sediments from Southwest Creek and its relevant impact factors, we started our investigation by measuring the concentration of various mercury species, including total mercury (HgTot), simultaneously extracted mercury (HgSEM), and methylmercury (MeHg), in the sediments collected from 13 sites located at Southwest Creek.
As shown in Table 2, concentrations of HgTot ranged from 1.073 to 4.450 µg/g dry sediment, with an average of 2.593 µg/g dry sediment. The highest concentration was observed at site D, and the lowest concentration was at site E. Site C is located at the junction of main stem of Southwest Creek and Damian Creek. The highest HgTot concentration observed in site D suggested that there are mercury-pollution sources around the area of Damian creek. Additionally, the slow-flowing stream also allowed site D to concentrate large quantities of pollutants such as mercury. In contrast, the lowest concentration of HgTot detected in site E was because the dam on the Daliangwo creek was opened periodically, making it difficult for the pollutants to accumulate.
Comparisons of HgTot contents observed in other areas from literature reports (Table 3) show that the Cishan Estuary in China and Tagus Estuary in Portugal are the most Hg-polluted areas in the world, with HgTot concentrations ranging from 0.344 to 132.5 mg/kg [40] and 0.01 to 66.7 mg/kg [41] dry sediment, respectively. HgTot concentrations in Southwest Creek in this study are lower than those in the Cishan estuary and Tagus estuary; however, the levels are higher than most other studied areas in the world including the Scheldt estuary in Belgium and the Ore estuary in Sweden. The HgTot data obtained in this study suggested that Southwest Creek has gradually become a severe mercury-polluting site due to discharge of industrial, domestic and agricultural wastewater and therefore should be of great concern. Several conclusions could be drawn from these literatures. First, most of these areas with mercury pollution are with heavy anthropogenic activities. For example, Cishan River, Daya Bay, Huangpu River, and Songhua River are among the most economically developed regions in China, and associations between mercury pollution and anthropogenic activities were also suggested [40,43,44,46]. Kwokal et al. also reported that the mercury contamination in Öre estuary (Sweden) was associated with anthropogenic activity [48]. Further, the methylmercury formation from inorganic mercury was more significant in summer season, because of higher microbial activity at elevated temperature [41]. Besides, volatilization fluxes of mercury might be different based on seasonal change [47]. These reports provided solid references for the analysis of mercury species and transformation and biota uptake.
As most metals in sediments present as SEM (simultaneously extracted metals) [50,51,52], the HgSEM needs to be considered as an important parameter. The HgSEM in all sediments ranged from 0.037 to 0.624 µg/g dry sediments, and average HgSEM was 0.157 µg/g dry sediment, which was much lower than the averaged HgTot concentration of 2.593 µg/g dry sediment. Apparently, mercury existed in other phases than those extracted with 1 M HCl (HgSEM), and one of them was the toxic methylmercury. All the collected sediment samples were evaluated for their methylmercury concentrations, which ranged from 0.074 to 1.587 μg/kg dry sediment. The average concentration of methylmercury in this study is 0.466 μg/kg dry sediment, with the highest concentration observed at site M, and the lowest concentration at site K.
3.3. Reduced Benthos Biodiversity Due to Uptake of Methylmercury
We then evaluated the benthos organisms biodiversity of seven selected sites, and the results were summarized in Table 4. We chose sites A and L as positive control, because Table 1 indicated that the water of these two sites were totally transparent. Sites D, F, J, K and M were chosen for analysis because of the low transparency and dissolved oxygen concentration (Table 1), indicating unhealthy water quality. The benthic organisms in the other six sites were not analyzed. The species of organisms were identified through the structural and physiological features. We majorly isolated molluscs, annelids, arthropods, and platyhelminthes. The L, A, and K sites were rich in benthic species, and there were 8 species in L site, 6 species in A site, and 5 species in K site. However, sampling sites of D, J, M and F contained relatively few benthic species. For example, there were 3 species in site D, 4 species in site J, 3 species in site M, and 2 species in site F. Obviously, the dominant species was Limnodrilus hoffmeisteri for all sites except site L, ranging from 913 to 14,138 ind/m2. The Shannon–Wiener diversity index is a commonly used parameter to indicate species richness [53]. It considers both the number of species and the number of individuals, which can fully reflect the structural characteristics of the whole ecological community. Results showed that site L had a Shannon–Wiener index of 2.74, whereas all other sites had quite low Shannon–Wiener index of 0.17–1.07. Provided that sediment is a complex environment and plays as a sink to accumulate many pollutants, it is hard to conclude that whether the impaired benthic biodiversity was due to mercury contamination. Below, we measured the mercury concentration in benthic organisms, and aimed to specifically establish the relationship between mercury concentration in vivo and in vitro.
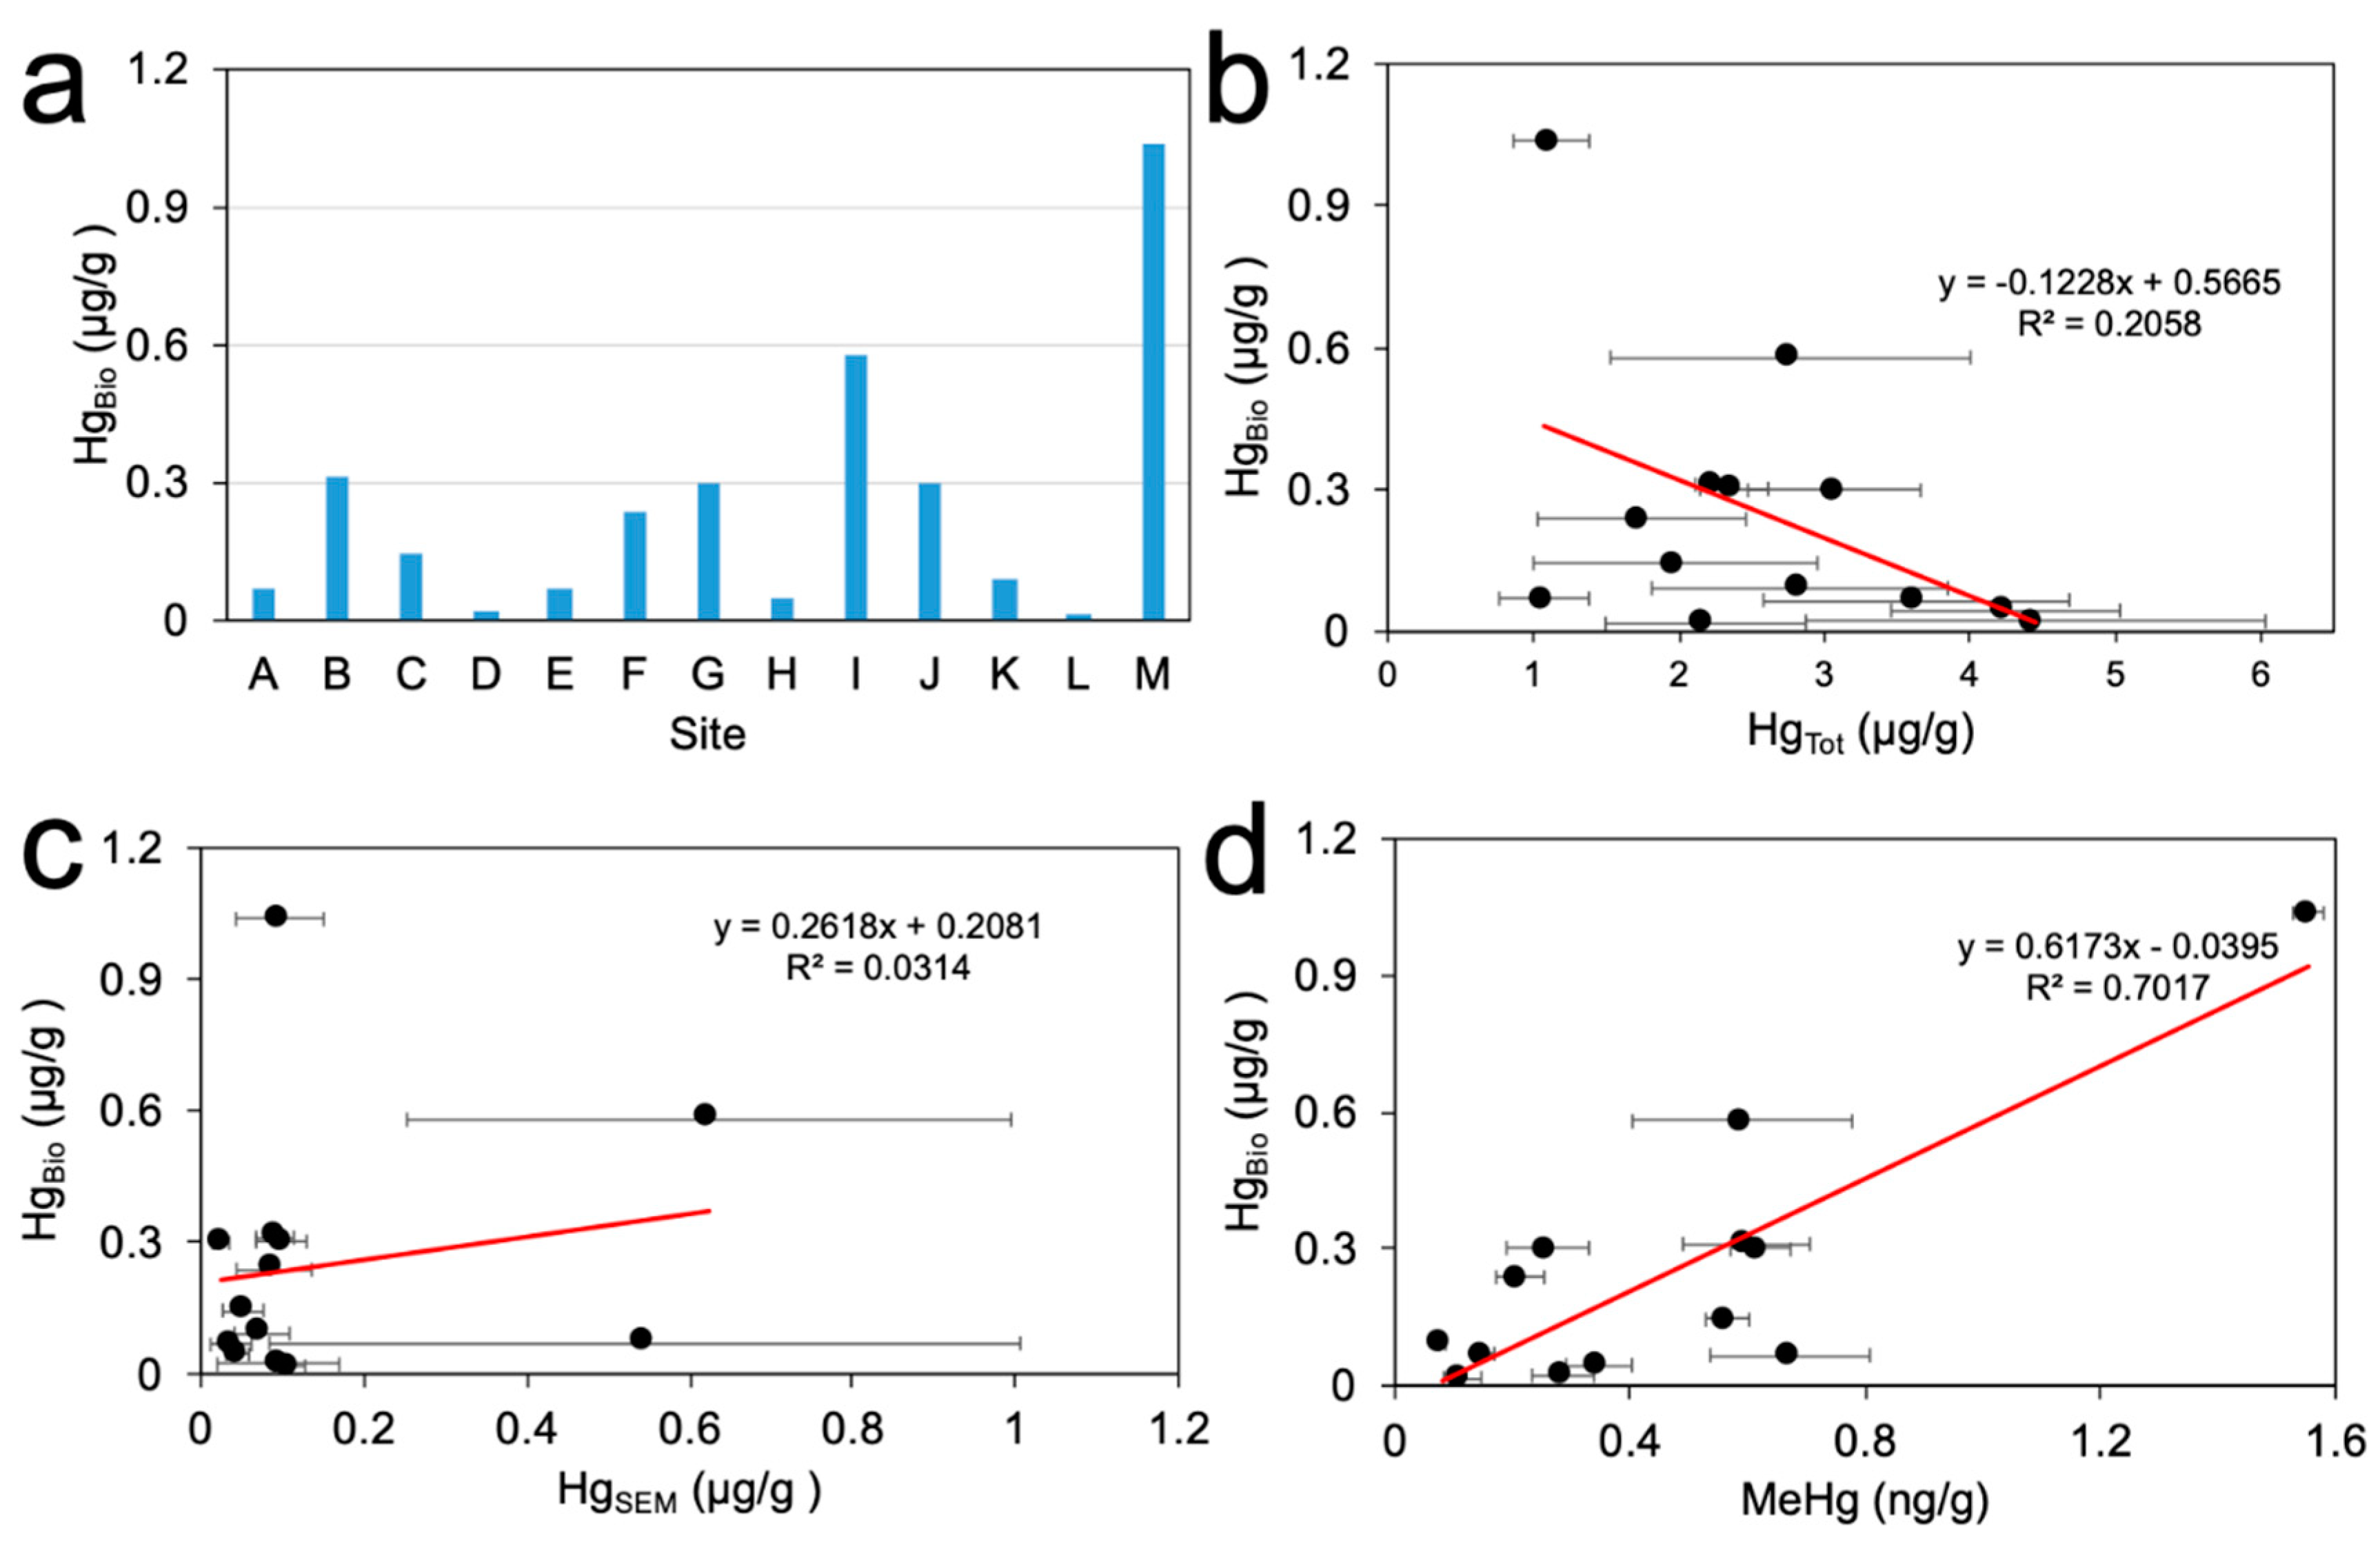
The methylmercury in the sediments could be taken up and accumulated by benthic organisms [54,55]. We therefore attempted to quantify the accumulated mercury concentration in the benthos. It is shown that, site M contained the highest HgBio (1.037 µg/g) (Figure 2a).
We also attempted to further investigate the source of HgBio. Correlation analyses between HgBio and HgTot, HgSEM, and MeHg were performed (Figure 2). Results indicated that HgBio showed highest correlation with MeHg (R2 = 0.7017). This is because methylmercury is highly lipophilic [10,11], and therefore accounts for the accumulation of mercury into benthic organisms via membrane transfer [56,57].
3.4. Correlation Analysis of Methylmercury Formation
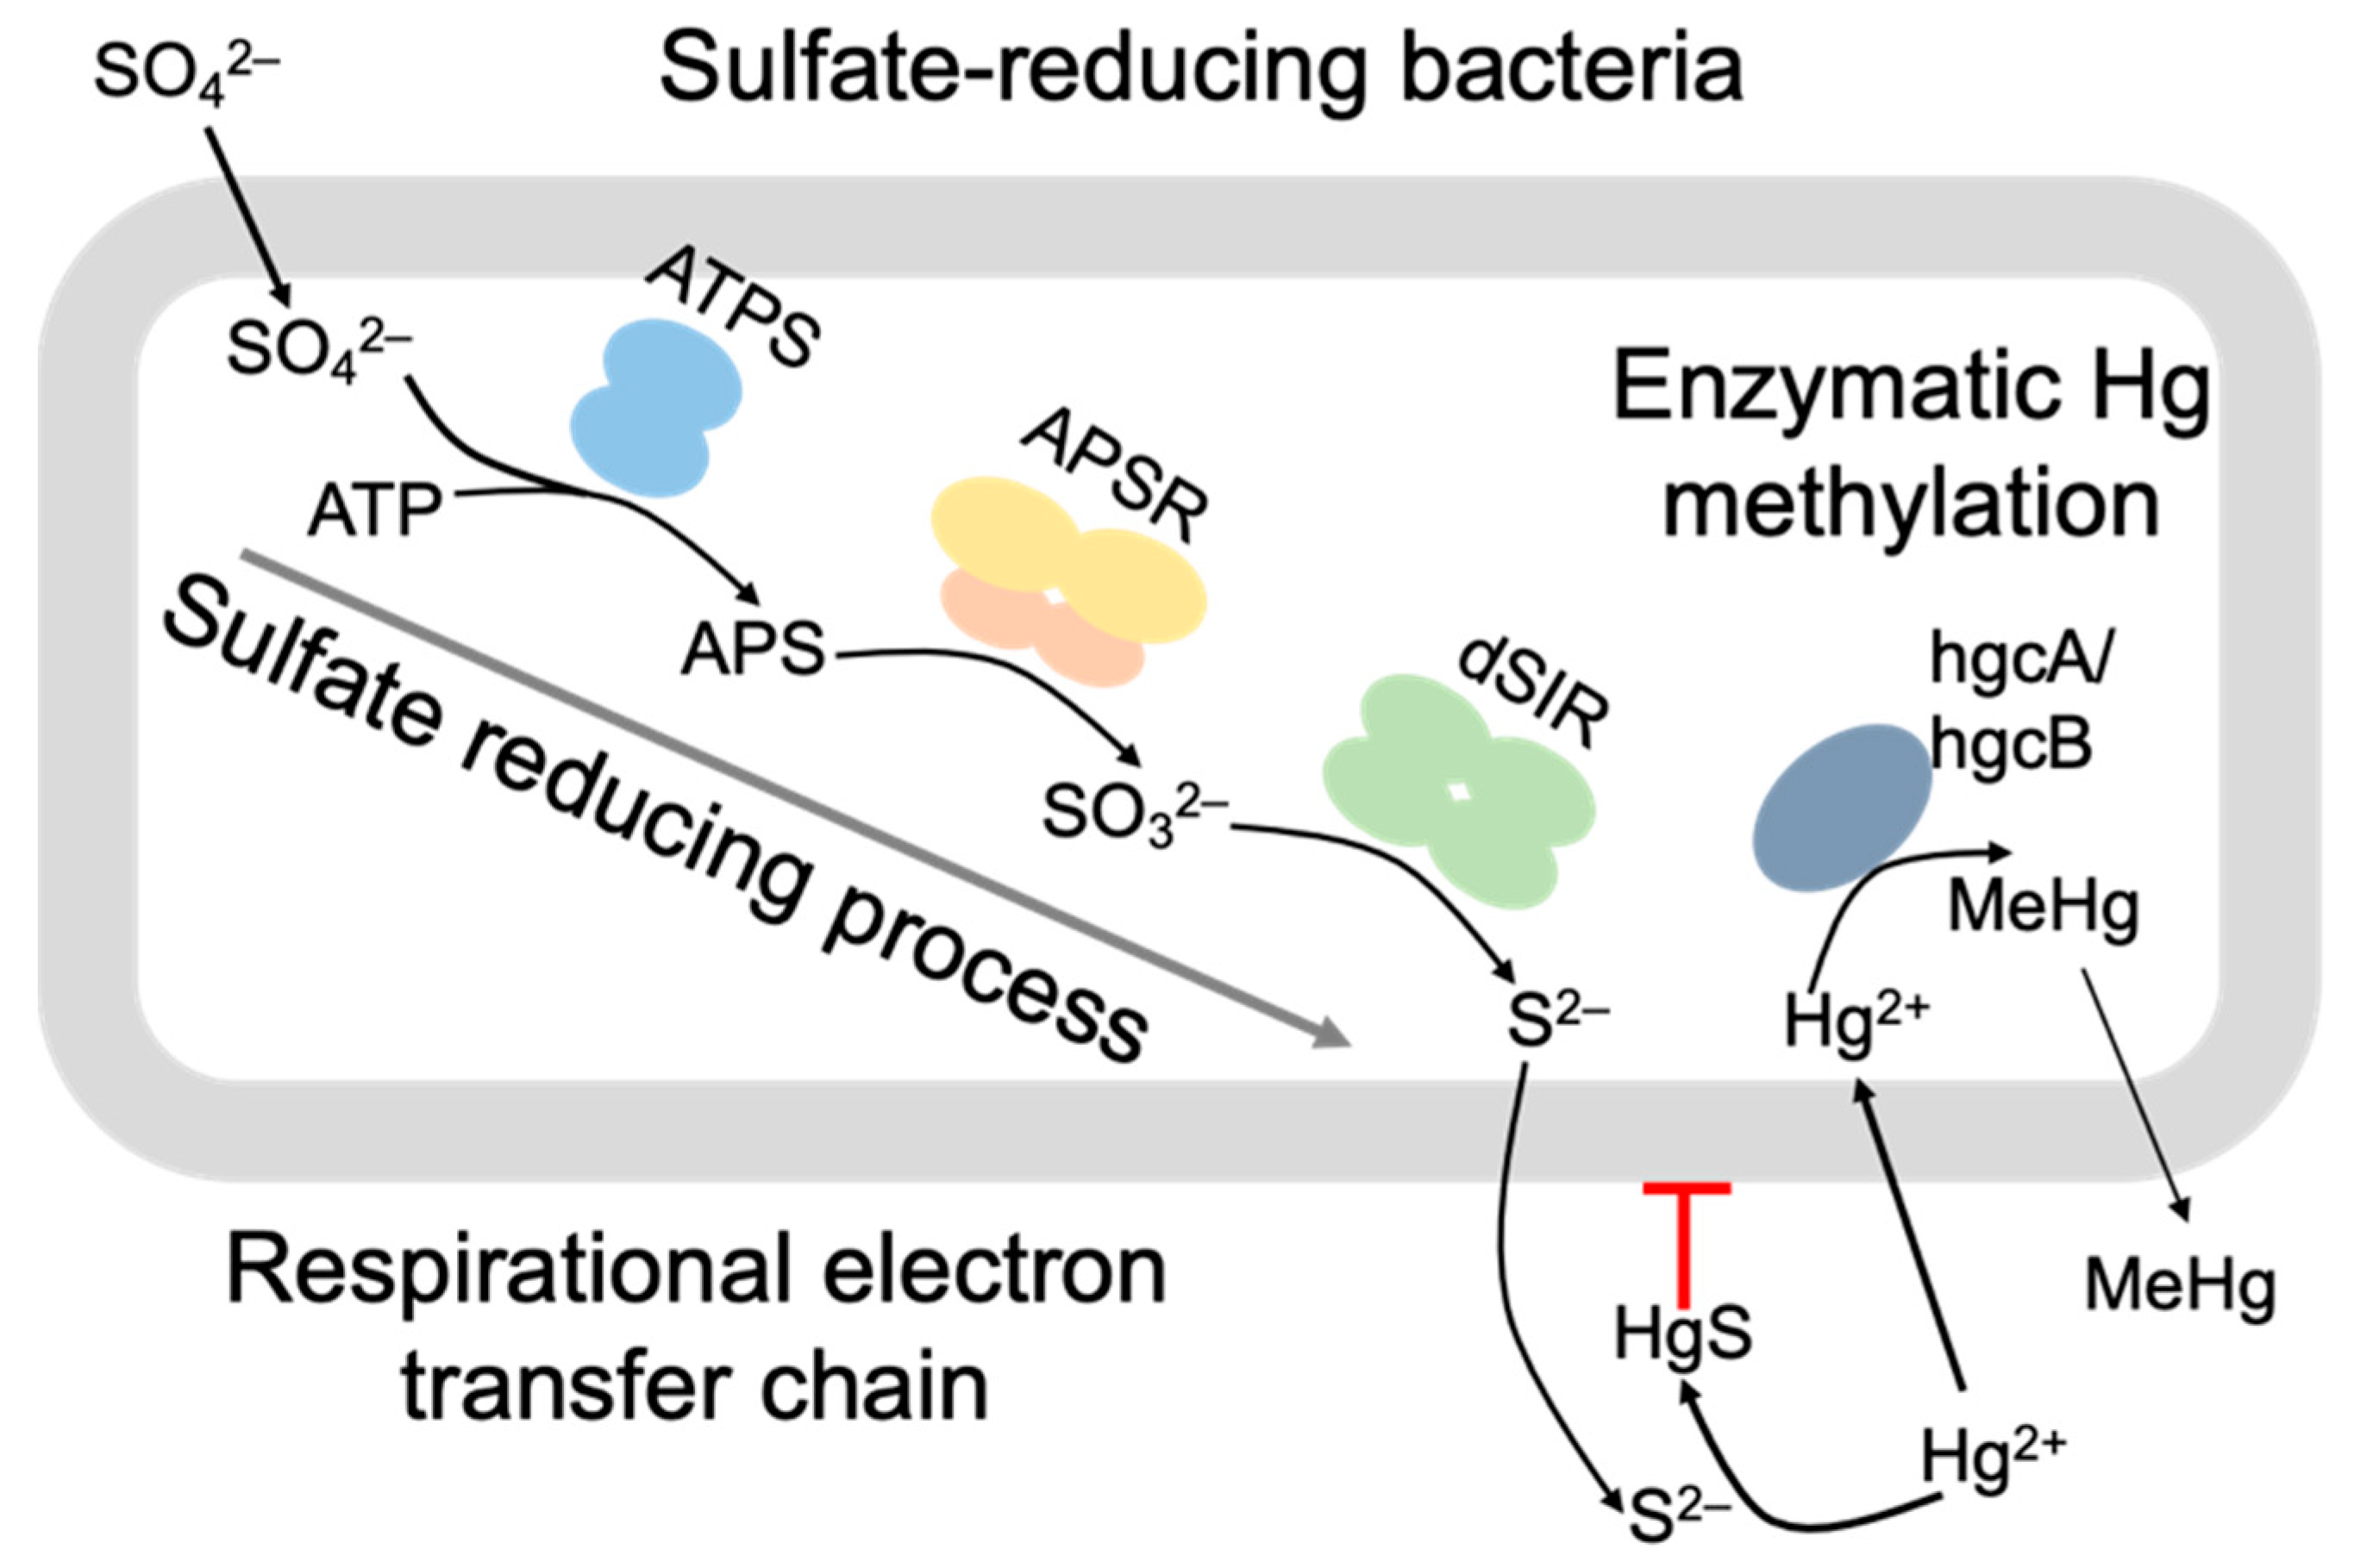
We at first intended to identify vital parameters that affected methylmercury formation in the sediments. It has been reported that sediment microbes possessing the methylating genes hgcA and hgcB [25,58], such as SRB, play an important role to convert inorganic mercury ion into methylmercury. Besides the enzymatic activity of mercury methylation, SRB owns high metabolic potential of reducing sulfate ion into sulfides through a series of enzymatic activities. This process involves ATP sulfurylase (ATPS), APS (adenosine 5′-phosphosulfate) reductase (APSR), and dissimilatory sulfite reductase (dSIR) [59,60]. In a brief word, sulfate reduction process drives the respirational electron transfer chain, and mercury methylation process consumes cellular energy and components (Figure 3). In another scenario, AVS, sulfate reduction product, binds strongly with soluble Hg2+ to form unreactive HgS and reduces the bioavailability of mercury [61,62]. Hence, mercury methylation frequently occurs with sulfate reduction in most sediments.
SRB amount in each sediment was then quantified. It was observed that the sediments collected from Southwest Creek contained high amount of SRB, ranging from 1.67 × 10³ to 5.20 × 10⁴ MPN/g (d.w.) (Table 2). The active presence of SRB in the sediment was primarily due to abundant organic carbon that served as nutrition source and electron donors [65]. As a result of SRB metabolic activity, sulfate ion was enzymatically reduced to sulfide. Detected AVS content of all sediments ranged from 140.48 to 652.16 µg/g dry sediment (Table 2).
The methylmercury formation process was then preliminarily revealed via Pearson correlation analysis (Table 5). It was shown that, for all sediment samples, correlation coefficients of methylmercury with AVS and SRB were 0.60 and 0.62, indicating vital role of microbial methylation of mercury. The role of OC was unclear due to weak correlation.
4. Conclusions
In this work, we measured the mercury concentrations in the sediment of Southwest Creek in Pearl River Estuary, China. Results showed that the sampling sites of Pearl River Estuary contained high content of mercury, and moreover methylmercury was also detected. Methylmercury concentrations ranged from 0.081 to 1.554 µg/g dry sediment. Sulfate especially plays a complex role in bacterial methylmercury production. Sulfate promotes the proliferation of SRB to enhance mercury methylation to form methylmercury. Through correlation analysis, we revealed that SRB activity is most likely responsible for the methylmercury formation in the sediment. As a result of the methylmercury formation in the sediments, mercury was transferred and accumulated into the benthos organisms. This study will evoke public awareness over the mercury contamination in this region.
Author Contributions
Conceptualization, F.L.; methodology, F.L.; software, L.C.; validation, F.L. and L.C.; formal analysis, M.C.; data curation, L.C., F.L., W.H., and M.C.; writing—original draft preparation, L.C.; writing—review and editing, L.C., F.L., Z.L. and M.C.; supervision, F.L.; project administration, F.L.; funding acquisition, F.L.
Funding
This study was funded by the National Key Research and Development Program of China (Grant No. 2016YFC0402600), the National Natural Science Foundation of China (Grant No. 41001341), Water Conservancy Science and Technology Innovation Project of Guangdong Province (Grant No. 2016-2022, 2017-2021), the Joint Funding Research Project by Guangdong Province and China Ministry of education (Grant No. 2013B090500022), and Science and Technology Planning Project of Dongguan City (2016108101015).
Conflicts of Interest
The authors declare no conflict of interest.
References
- Harada, M. Minamata disease: Methylmercury poisoning in Japan caused by environmental pollution. Crit. Rev. Toxicol. 1995, 25, 1–24. [Google Scholar] [CrossRef] [PubMed]
- Eto, K. Pathology of Minamata disease. Toxicol. Pathol. 1997, 25, 614–623. [Google Scholar] [CrossRef] [PubMed]
- Ekino, S.; Susa, M.; Ninomiya, T.; Imamura, K.; Kitamura, T. Minamata disease revisited: An update on the acute and chronic manifestations of methyl mercury poisoning. J. Neurol. Sci. 2007, 262, 131–144. [Google Scholar] [CrossRef] [PubMed]
- Chen, L.; Xu, G.; Rui, Z.; Alshawabkeh, A.N. Demonstration of a feasible energy-water-environment nexus: Waste sulfur dioxide for water treatment. Appl. Energy 2019, 250, 1011–1022. [Google Scholar] [CrossRef]
- Martín, J.A.R.; Nanos, N. Soil as an archive of coal-fired power plant mercury deposition. J. Hazard. Mater. 2016, 308, 131–138. [Google Scholar] [CrossRef] [PubMed]
- Streets, D.G.; Lu, Z.; Levin, L.; ter Schure, A.F.; Sunderland, E.M. Historical releases of mercury to air, land, and water from coal combustion. Sci. Total Environ. 2018, 615, 131–140. [Google Scholar] [CrossRef] [PubMed]
- Boening, D.W. Ecological effects, transport, and fate of mercury: A general review. Chemosphere 2000, 40, 1335–1351. [Google Scholar] [CrossRef]
- Toimela, T.; Tähti, H. Mitochondrial viability and apoptosis induced by aluminum, mercuric mercury and methylmercury in cell lines of neural origin. Arch. Toxicol. 2004, 78, 565–574. [Google Scholar] [CrossRef]
- Schroeder, H.A.; Mitchener, M. Life-term effects of mercury, methyl mercury, and nine other trace metals on mice. J. Nutr. 1975, 105, 452–458. [Google Scholar] [CrossRef]
- Magour, S.; Mäser, H.; Greim, H. The Effect of Mercury Chloride and Methyl Mercury on Brain Microsomal Na+-K+-ATPase after Partial Delipidisation with Lubrol®. Pharmacol. Toxicol. 1987, 60, 184–186. [Google Scholar] [CrossRef]
- Knap, A.; Dewailly, É.; Furgal, C.; Galvin, J.; Baden, D.; Bowen, R.E.; Depledge, M.; Duguay, L.; Fleming, L.E.; Ford, T.; et al. Indicators of ocean health and human health: Developing a research and monitoring framework. Environ. Health Perspect. 2002, 110, 839–845. [Google Scholar] [CrossRef] [PubMed]
- Pickhardt, P.C.; Folt, C.L.; Chen, C.Y.; Klaue, B.; Blum, J.D. Algal blooms reduce the uptake of toxic methylmercury in freshwater food webs. Proc. Natl. Acad. Sci. USA 2002, 99, 4419–4423. [Google Scholar] [CrossRef] [PubMed] [Green Version]
- Mason, R.P.; Reinfelder, J.R.; Morel, F.M. Bioaccumulation of mercury and methylmercury. Water Air Soil Pollut. 1995, 80, 915–921. [Google Scholar] [CrossRef]
- Chen, C.Y.; Borsuk, M.E.; Bugge, D.M.; Hollweg, T.; Balcom, P.H.; Ward, D.M.; Williams, J.; Mason, R.P. Benthic and pelagic pathways of methylmercury bioaccumulation in estuarine food webs of the northeast United States. PLoS ONE 2014, 9, e89305. [Google Scholar] [CrossRef] [PubMed]
- Taylor, V.F.; Bugge, D.; Jackson, B.P.; Chen, C.Y. Pathways of CH3Hg and Hg ingestion in benthic organisms: An enriched isotope approach. Environ. Sci. Technol. 2014, 48, 5058–5065. [Google Scholar] [CrossRef] [PubMed]
- Hornung, H.; Krumgalz, B.S.; Cohen, Y. Mercury pollution in sediments, benthic organisms and inshore fishes of Haifa Bay, Israel. Mar. Environ. Res. 1984, 12, 191–208. [Google Scholar] [CrossRef]
- Pickhardt, P.C.; Fisher, N.S. Accumulation of inorganic and methylmercury by freshwater phytoplankton in two contrasting water bodies. Environ. Sci. Technol. 2007, 41, 125–131. [Google Scholar] [CrossRef] [PubMed]
- Jacobs, J.M.; Carmichael, N.; Cavanagh, J.B. Ultrastructural changes in the nervous system of rabbits poisoned with methyl mercury. Toxicol. Appl. Pharmacol. 1977, 39, 249–261. [Google Scholar] [CrossRef]
- Clarkson, T.W. Metal toxicity in the central nervous system. Environ. Health Perspect. 1987, 75, 59–64. [Google Scholar] [CrossRef]
- Rodier, P.M. Vulnerable periods and processes during central nervous system development. Environ. Health Perspect. 1994, 102, 121–124. [Google Scholar]
- Howie, M.G.; Jackson, A.K.; Cristol, D.A. Spatial extent of mercury contamination in birds and their prey on the floodplain of a contaminated river. Sci. Total Environ. 2018, 630, 1446–1452. [Google Scholar] [CrossRef] [PubMed]
- Santschi, P.H.; Yeager, K.M.; Schwehr, K.A.; Schindler, K.J. Estimates of recovery of the Penobscot River and estuarine system from mercury contamination in the 1960’s. Sci. Total Environ. 2017, 596, 351–359. [Google Scholar] [CrossRef] [PubMed]
- Bravo, A.G.; Bouchet, S.; Guédron, S.; Amouroux, D.; Dominik, J.; Zopfi, J. High methylmercury production under ferruginous conditions in sediments impacted by sewage treatment plant discharges. Water Res. 2015, 80, 245–255. [Google Scholar] [CrossRef] [PubMed]
- Gilmour, C.C.; Elias, D.A.; Kucken, A.M.; Brown, S.D.; Palumbo, A.V.; Schadt, C.W.; Wall, J.D. Sulfate-reducing bacterium Desulfovibrio desulfuricans ND132 as a model for understanding bacterial mercury methylation. Appl. Environ. Microbiol. 2011, 77, 3938–3951. [Google Scholar] [CrossRef] [PubMed]
- Gilmour, C.C.; Podar, M.; Bullock, A.L.; Graham, A.M.; Brown, S.D.; Somenahally, A.C.; Johs, A.; Hurt, R.A., Jr.; Bailey, K.L.; Elias, D.A. Mercury methylation by novel microorganisms from new environments. Environ. Sci. Technol. 2013, 47, 11810–11820. [Google Scholar] [CrossRef] [PubMed]
- Bloom, N.S.; Lasorsa, B.K. Changes in mercury speciation and the release of methylmercury as a result of marine sediment dredging activities. Sci. Total Environ. 1999, 237–238, 379–385. [Google Scholar] [CrossRef]
- Sunderland, E.M.; Gobas, F.A.; Branfireun, B.A.; Heyes, A. Environmental controls on the speciation and distribution of mercury in coastal sediments. Mar. Chem. 2006, 102, 111–123. [Google Scholar] [CrossRef]
- Zhang, G.; Bai, J.; Xiao, R.; Zhao, Q.; Jia, J.; Cui, B.; Liu, X. Heavy metal fractions and ecological risk assessment in sediments from urban, rural and reclamation-affected rivers of the Pearl River Estuary, China. Chemosphere 2017, 184, 278–288. [Google Scholar] [CrossRef]
- Zhao, G.; Ye, S.; Yuan, H.; Ding, X.; Wang, J. Surface sediment properties and heavy metal pollution assessment in the Pearl River Estuary, China. Environ. Sci. Pollut. Res. 2017, 24, 2966–2979. [Google Scholar] [CrossRef]
- Li, X.; Wai, O.W.; Li, Y.S.; Coles, B.J.; Ramsey, M.H.; Thornton, I. Heavy metal distribution in sediment profiles of the Pearl River estuary, South China. Appl. Geochem. 2000, 15, 567–581. [Google Scholar] [CrossRef]
- Bai, J.; Xiao, R.; Cui, B.; Zhang, K.; Wang, Q.; Liu, X.; Gao, H.; Huang, L. Assessment of heavy metal pollution in wetland soils from the young and old reclaimed regions in the Pearl River Estuary, South China. Environ. Pollut. 2011, 159, 817–824. [Google Scholar] [CrossRef] [PubMed]
- Li, T. The Water Quality and Water Environment Capacity of Main Rivers in Foshan, Guangdong Province. Master’s Thesis, Sun Yat-Sen University, Guangzhou, China, 2005. (In Chinese). [Google Scholar]
- Hatch, W.R.; Ott, W.L. Determination of submicrogram quantities of mercury by atomic absorption spectrophotometry. Anal. Chem. 1968, 40, 2085–2087. [Google Scholar] [CrossRef]
- Tseng, C.M.; De Diego, A.; Martin, F.M.; Amouroux, D.; Donard, O.F. Rapid determination of inorganic mercury and methylmercury in biological reference materials by hydride generation, cryofocusing, atomic absorption spectrometry after open focused microwave-assisted alkaline digestion. J. Anal. At. Spectrom. 1997, 12, 743–750. [Google Scholar] [CrossRef]
- Cizdziel, J.V.; Hinners, T.A.; Heithmar, E.M. Determination of total mercury in fish tissues using combustion atomic absorption spectrometry with gold amalgamation. Water Air Soil Pollut. 2002, 135, 355–370. [Google Scholar] [CrossRef]
- Van Griethuysen, C.; Gillissen, F.; Koelmans, A.A. Measuring acid volatile sulphide in floodplain lake sediments: Effect of reaction time, sample size and aeration. Chemosphere 2002, 47, 395–400. [Google Scholar] [CrossRef]
- Maggi, C.; Berducci, M.T.; Bianchi, J.; Giani, M.; Campanella, L. Methylmercury determination in marine sediment and organisms by Direct Mercury Analyser. Anal. Chim. Acta 2009, 614, 32–36. [Google Scholar] [CrossRef] [PubMed]
- Page, A.L.; Miller, R.H.; Keeney, D.R. Methods of Soil Analysis. Part 2. Chemical and Microbiological Properties; No. 9; American Society of Agronomy; Soil Science Society of America: Madison, WI, USA, 1982. [Google Scholar]
- The Ministry of Environmental Protection of the People’s Republic of China. Chinese Environmental Quality Standards for Surface Water (GB3838-2002); The Ministry of Environmental Protection of the People’s Republic of China: Beijing, China, 2002. [Google Scholar]
- Zhang, S.Q.; Wang, Q.C.; Zhao, X.M.; Zhang, X.W.; Zheng, D.M. Characteristics of mercury pollution in rivers of different pollution sources in Huludao. Geol. Geochem. 2008, 36, 225–230. [Google Scholar]
- Canário, J.; Branco, V.; Vale, C. Seasonal variation of monomethylmercury concentrations in surface sediments of the Tagus Estuary (Portugal). Environ. Pollut. 2007, 148, 380–383. [Google Scholar] [CrossRef] [PubMed]
- Liu, F.; Yan, W.; Wang, W.; Chen, Z. Pollution of heavy metals in the Pearl Estuary and its assessment of potential ecological risk. Mar. Environ. Sci. 2002, 21, 34–38. (In Chinese) [Google Scholar]
- Li, X. Distribution and environmental quality assessment of heavy metals in sediments of Daya Bay, Guangdong. Geoscience 2003, 30, 429–437. (In Chinese) [Google Scholar]
- Zhang, C.; Chen, Z.; Bi, C.; Shi, G. The distribution of Hg and as in water and sediment of the drinking water source area of the Huangpu River. Acta Sci. Circumstantiae 2007, 28, 1455–1462. (In Chinese) [Google Scholar]
- Wu, H. Distribution of Methylmercury and Its Microbial Methylation in Major Mangrove Wetlands in China. Master’s Thesis, Xiamen University, Xiamen, China, 2009. (In Chinese). [Google Scholar]
- Zhu, H.; Yan, B.; Zhang, F.; Lu, Y.; Wang, L. Contribution of main components of sediments to mercury adsorption in Songhua River. Environ. Chem. 2010, 29, 865–869. (In Chinese) [Google Scholar]
- Baeyens, W.; Leermakers, M. Elemental mercury concentrations and formation rates in the Scheldt estuary and the North Sea. Mar. Chem. 1998, 60, 257–266. [Google Scholar] [CrossRef]
- Kwokal, Z.; Bilinski, S.F.; Bilinski, H. A comparison of anthropogenic mercury pollution in Kastela Bay (Croatia) with pristine estuaries in Ore (Sweden) and Krka (Croatia). Pergamon Mar. Pollut. Bull. 2002, 44, 1152–1169. [Google Scholar] [CrossRef]
- Ding, X.; Chen, L.; Zhang, W.; Xu, Z.; Peng, X.; Shang, L. Preliminary study on pollution status and assessment of mercury in sediment from the Beijiang River. J. Agro Environ. Sci. 2010, 29, 357–362. [Google Scholar]
- Burton, G.A.; Green, A.; Baudo, R.; Forbes, V.; Nguyen, L.T.; Janssen, C.R.; Kukkonen, J.; Leppanen, M.; Maltby, L.; Soares, A.; et al. Characterizing sediment acid volatile sulphide concentrations in European streams. Environ. Toxicol. Chem. 2007, 26, 1–12. [Google Scholar] [CrossRef] [PubMed]
- Allen, H.E.; Fu, G.; Deng, B. Analysis of acid-volatile sulfide (AVS) and simultaneously extracted metals (SEM) for the estimation of potential toxicity in aquatic sediments. Environ. Toxicol. Chem. 1993, 12, 1441–1453. [Google Scholar] [CrossRef]
- Fang, T.; Li, X.; Zhang, G. Acid volatile sulfide and simultaneously extracted metals in the sediment cores of the Pearl River Estuary, South China. Ecotoxicol. Environ. Saf. 2005, 61, 420–431. [Google Scholar] [CrossRef] [PubMed]
- Xu, Y.; Fan, X.; Warren, A.; Zhang, L.; Xu, H. Functional diversity of benthic ciliate communities in response to environmental gradients in a wetland of Yangtze Estuary, China. Mar. Pollut. Bull. 2018, 127, 726–732. [Google Scholar] [CrossRef] [PubMed]
- Orihel, D.M.; Paterson, M.J.; Blanchfield, P.J.; Bodaly, R.A.; Hintelmann, H. Experimental evidence of a linear relationship between inorganic mercury loading and methylmercury accumulation by aquatic biota. Environ. Sci. Technol. 2007, 41, 4952–4958. [Google Scholar] [CrossRef]
- Wang, W.X.; Stupakoff, I.; Gagnon, C.; Fisher, N.S. Bioavailability of inorganic and methylmercury to a marine deposit-feeding polychaete. Environ. Sci. Technol. 1998, 32, 2564–2571. [Google Scholar] [CrossRef]
- Harding, G.; Dalziel, J.; Vass, P. Bioaccumulation of methylmercury within the marine food web of the outer Bay of Fundy, Gulf of Maine. PLoS ONE 2018, 13, e0197220. [Google Scholar] [CrossRef] [PubMed]
- Chételat, J.; Richardson, M.C.; MacMillan, G.A.; Amyot, M.; Poulain, A.J. Ratio of Methylmercury to Dissolved Organic Carbon in Water Explains Methylmercury Bioaccumulation Across a Latitudinal Gradient from North-Temperate to Arctic Lakes. Environ. Sci. Technol. 2017, 52, 79–88. [Google Scholar] [CrossRef] [PubMed]
- Parks, J.M.; Johs, A.; Podar, M.; Bridou, R.; Hurt, R.A.; Smith, S.D.; Tomanicek, S.J.; Qian, Y.; Brown, S.D.; Brandt, C.C.; et al. The genetic basis for bacterial mercury methylation. Science 2013, 339, 1332–1335. [Google Scholar] [CrossRef] [PubMed]
- Barton, L.L.; Fardeau, M.L.; Fauque, G.D. Hydrogen sulfide: A toxic gas produced by dissimilatory sulfate and sulfur reduction and consumed by microbial oxidation. In The Metal-Driven Biogeochemistry of Gaseous Compounds in the Environment; Springer: Dordrecht, The Netherlands, 2014; pp. 237–277. [Google Scholar]
- Fritz, G.; Schiffer, A.; Behrens, A.; Büchert, T.; Ermler, U.; Kroneck, P.M. Living on Sulfate: Three-Dimensional Structure and Spectroscopy of Adenosine 5-Phosphosulfate Reductase and Dissimilatory Sulfite Reductase. In Microbial Sulfur Metabolism; Springer: Berlin/Heidelberg, Germany, 2008; pp. 13–23. [Google Scholar]
- Liu, J.; Valsaraj, K.T.; Delaune, R.D. Inhibition of mercury methylation by iron sulfides in an anoxic sediment. Environ. Eng. Sci. 2009, 26, 833–840. [Google Scholar] [CrossRef]
- Benoit, J.M.; Gilmour, C.C.; Mason, R.P.; Heyes, A. Sulfide controls on mercury speciation and bioavailability to methylating bacteria in sediment pore waters. Environ. Sci. Technol. 1999, 33, 951–957. [Google Scholar] [CrossRef]
- Chen, Y.; Wen, Y.; Zhou, Q.; Huang, J.; Vymazal, J.; Kuschk, P. Sulfate removal and sulfur transformation in constructed wetlands: The roles of filling material and plant biomass. Water Res. 2016, 102, 572–581. [Google Scholar] [CrossRef] [Green Version]
- Rees, G.N.; Baldwin, D.S.; Watson, G.O.; Hall, K.C. Sulfide formation in freshwater sediments, by sulfate-reducing microorganisms with diverse tolerance to salt. Sci. Total Environ. 2010, 409, 134–139. [Google Scholar] [CrossRef]
- Compeau, G.C.; Bartha, R. Sulfate-reducing bacteria: Principal methylators of mercury in anoxic estuarine sediment. Appl. Environ. Microbiol. 1985, 50, 498–502. [Google Scholar]
Figure 1.
Map of investigation site for sediments sampling. 23° N and 112° E are labelled, and arrows indicate the flow direction of water.
Figure 1.
Map of investigation site for sediments sampling. 23° N and 112° E are labelled, and arrows indicate the flow direction of water.

Figure 2.
(a) Bio-accumulated mercury concentration in the benthic organisms of each sediment, and correlations between bio-accumulated mercury and (b) total mercury, (c) simultaneously extracted mercury, and (d) methylmercury in each sediment.
Figure 2.
(a) Bio-accumulated mercury concentration in the benthic organisms of each sediment, and correlations between bio-accumulated mercury and (b) total mercury, (c) simultaneously extracted mercury, and (d) methylmercury in each sediment.

Figure 3.
Sulfate-reducing bacteria could reduce sulfate ion into sulfide through a series of enzymatic processes [63,64], and could also catalyze the conversion of inorganic mercury ion into methylmercury [25,58,59,60,65].


Table 1.
Water quality of investigation site.
| Site | Water Depth (cm) | Transparency (cm) | Temperature (°C) | Dissolved Oxygen (mg/L) | pH | CODCr (mg/L) |
|---|---|---|---|---|---|---|
| A | 14 | 14 | 22.9 | 5.3 | 7.2 | 20.3 |
| B | 20 | 15 | 22.7 | 4.3 | 7.0 | 32.3 |
| C | 25 | 0 | 23.1 | 2.9 | 7.2 | 25.6 |
| D | 50 | 0 | 22.7 | 3.2 | 7.0 | 21.7 |
| E | 30 | 20 | 22.7 | 2.3 | 6.7 | 39.7 |
| F | 88 | 10 | 21.7 | 0 | 5.8 | 80.3 |
| G | 80 | 10 | 22.1 | 3.6 | 5.9 | 76.9 |
| H | 15 | 15 | 22.2 | 2.9 | 7.1 | 49.1 |
| I | 90 | 15 | 22.3 | 4.7 | 6.9 | 29.2 |
| J | 12 | 0 | 23.1 | 4.3 | 6.6 | 29.1 |
| K | 46 | 17 | 22.1 | 2.7 | 6.8 | 51.2 |
| L | 23 | 23 | 22.2 | 3.7 | 6.9 | 22.6 |
| M | 100 | 20 | 21.9 | 2.5 | 7.1 | 31.2 |
CODCr denotes the chemical oxygen demand based on dichromate measurement.
Table 2.
Total mercury (HgTot), simultaneously extracted mercury (HgSEM), methylmercury (MeHg) concentrations, acid-volatile sulfide (AVS) content, sulfate-reducing bacteria (SRB) amount, organic carbon (OC) content, and redox potential (Eh) in the sediment of each sampling site.
Table 2.
Total mercury (HgTot), simultaneously extracted mercury (HgSEM), methylmercury (MeHg) concentrations, acid-volatile sulfide (AVS) content, sulfate-reducing bacteria (SRB) amount, organic carbon (OC) content, and redox potential (Eh) in the sediment of each sampling site.
| Site | HgTot (μg/g) | HgSEM (μg/g) | MeHg (ng/g) | AVS (μg/g) | SRB (MPN/g (d.w.)) | OC (%) | Eh (mV) |
|---|---|---|---|---|---|---|---|
| A | 3.631 ± 1.051 | 0.037 ± 0.025 | 0.672 ± 0.136 | 402.56 ± 99.84 | 4.46 × 10⁴ | 4.44 ± 1.72 | −144 ± 10 |
| B | 2.247 ± 0.134 | 0.091 ± 0.023 | 0.598 ± 0.108 | 536.96 ± 263.04 | 2.07 × 10³ | 8.53 ± 2.83 | −106 ± 5 |
| C | 1.976 ± 0.976 | 0.052 ± 0.025 | 0.566 ± 0.037 | 294.08 ± 144.32 | 4.11 × 10³ | 7.28 ± 0.16 | −146 ± 2 |
| D | 4.450 ± 1.580 | 0.095 ± 0.075 | 0.286 ± 0.053 | 404.80 ± 97.6 | 1.67 × 10³ | 7.95 ± 0.88 | −130 ± 21 |
| E | 1.073 ± 0.308 | 0.545 ± 0.461 | 0.150 ± 0.019 | 588.80 ± 344.96 | 1.87 × 10³ | 4.85 ± 0.84 | −126 ± 15 |
| F | 1.744 ± 0.716 | 0.090 ± 0.046 | 0.213 ± 0.041 | 278.72 ± 66.88 | 2.08 × 10³ | 4.33 ± 0.15 | −108 ± 6 |
| G | 2.379 ± 0.234 | 0.099 ± 0.031 | 0.260 ± 0.070 | 484.8 ± 78.4 | 4.40 × 10⁴ | 6.83 ± 0.58 | −121 ± 20 |
| H | 4.244 ± 0.787 | 0.045 ± 0.014 | 0.347 ± 0.056 | 351.36 ± 32.64 | 3.01 × 10³ | 11.14 ± 4.40 | −154 ± 4 |
| I | 2.766 ± 1.237 | 0.624 ± 0.371 | 0.591 ± 0.187 | 408 ± 40 | 2.07 × 10³ | 3.21 ± 1.06 | −134 ± 17 |
| J | 3.068 ± 0.593 | 0.025 ± 0.010 | 0.622 ± 0.051 | 550.08 ± 224 | 4.56 × 10⁴ | 7.18 ± 0.83 | −118 ± 16 |
| K | 2.830 ± 1.018 | 0.075 ± 0.034 | 0.081 ± 0.005 | 140.48 ± 45.12 | 2.37 × 10³ | 5.05 ± 0.73 | −150 ± 17 |
| L | 2.182 ± 0.687 | 0.109 ± 0.019 | 0.115 ± 0.032 | 253.76 ± 67.20 | 3.19 × 10³ | 4.91 ± 0.66 | −152 ± 9 |
| M | 1.122 ± 0.261 | 0.097 ± 0.054 | 1.554 ± 0.026 | 652.16 ± 281.6 | 5.20 × 10⁴ | 7.51 ± 1.71 | −155 ± 8 |
Table 3.
Comparison of total mercury in different rivers sediments.
| Study Area | Sedimentary Hg (µg/g) | Reference | |
|---|---|---|---|
| Range | Average | ||
| Cishan River (China) | 0.344–132.500 | 52.450 | [40] |
| Cishan River (China) | 0.037–16.070 | 9.241 | [40] |
| Cishan River (China) | 0.215–19.550 | 5.126 | [40] |
| Tagus Estuary (Portugal) | 0.01–66.7 | [41] | |
| Pearl River Estuary (China) | 0.20–0.72 | 0.354 | [42] |
| Daya Bay (China) | 0.03–0.12 | 0.07 | [43] |
| Huangpu River (China) | 0.0479–0.4169 | 0.1488 | [44] |
| Fugong Mangrove area (China) | 0.17–0.21 | [45] | |
| Shenzhen Mangrove area (China) | 0.17–0.19 | [45] | |
| Dongzhaigang Mangrove area (China) | 0.02–0.65 | [45] | |
| Sanya Mangrove area (China) | 0.02–0.31 | [45] | |
| Daguansha Mangrove area (China) | 0.01–0.04 | [45] | |
| Songhua River (China) | 0.013–1.543 | 0.610 | [46] |
| Scheldt Estuary (Belgium) | 0.14–0.18 | [47] | |
| Öre Estuary (Sweden) | 0.03–0.12 | [48] | |
| North River (China) | 0.074–3.517 | 0.61 | [49] |
| Southwest Creek (China) | 1.073–4.450 | 2.593 | This study |
Table 4.
Population density of benthic organisms in selected sediments.
| Phylum | Species | Population Density of Benthos at Each Site (ind/m2) | ||||||
|---|---|---|---|---|---|---|---|---|
| A | D | F | J | K | L | M | ||
| Mollusc | Hippeutis cantori | 122 | 0 | 0 | 0 | 30 | 53 | 0 |
| Cipangopaludina chinesis | 0 | 0 | 0 | 10 | 10 | 13 | 0 | |
| Bellamya aeruginosa | 41 | 0 | 0 | 0 | 0 | 0 | 0 | |
| Alocinma longicornis | 10 | 0 | 0 | 0 | 0 | 0 | 0 | |
| Katayama nosophora Robson | 41 | 0 | 0 | 10 | 0 | 0 | 10 | |
| Radix swinhoei | 0 | 0 | 0 | 0 | 10 | 0 | 0 | |
| Corbicula fluminea | 10 | 0 | 0 | 0 | 0 | 0 | 0 | |
| Annelid | Branchiura sowerbyi | 0 | 467 | 193 | 152 | 20 | 0 | 203 |
| Limnodrilus hoffmeisteri | 913 | 14,138 | 7505 | 3550 | 2901 | 13 | 7677 | |
| Nais communis | 0 | 0 | 0 | 0 | 0 | 13 | 0 | |
| Tylorrhynchus heterochaetus | 0 | 20 | 0 | 0 | 0 | 0 | 0 | |
| Arthropod | Tanypus chinensis | 0 | 0 | 0 | 0 | 0 | 13 | 0 |
| Ephacerella sp. | 0 | 0 | 0 | 0 | 0 | 13 | 0 | |
| Platyhelminthe | Planocera reticulate | 0 | 0 | 0 | 0 | 0 | 13 | 0 |
| Dugesia gonocephala | 0 | 0 | 0 | 0 | 0 | 26 | 0 | |
| Total number of organisms | 1137 | 14,625 | 7698 | 3722 | 2971 | 157 | 7890 | |
| Total number of species | 6 | 3 | 2 | 4 | 5 | 8 | 3 | |
| Shannon–Wiener biodiversity index | 1.07 | 0.22 | 0.17 | 0.31 | 0.21 | 2.74 | 0.17 | |
Table 5.
Correlation coefficients between investigated parameters.
| Parameter | AVS | SRB | OC | HgTot | HgSEM | Eh | MeHg |
|---|---|---|---|---|---|---|---|
| AVS | 1.00 | ||||||
| SRB | 0.54 | 1.00 | |||||
| OC | 0.23 | 0.05 | 1.00 | ||||
| HgTot | −0.29 | −0.07 | 0.34 | 1.00 | |||
| HgSEM | 0.27 | −0.27 | −0.51 | −0.31 | 1.00 | ||
| Eh | 0.31 | −0.06 | −0.09 | −0.15 | 0.14 | 1.00 | |
| MeHg | 0.60 * | 0.62 * | 0.12 | −0.23 | −0.08 | −0.22 | 1.00 |
Note: There are seven parameters in total, each of which has 13 data points. * indicates over 95% confidence level.
© 2019 by the authors. Licensee MDPI, Basel, Switzerland. This article is an open access article distributed under the terms and conditions of the Creative Commons Attribution (CC BY) license (http://creativecommons.org/licenses/by/4.0/).
Share and Cite
MDPI and ACS Style
Chen, L.; Li, F.; Huang, W.; Li, Z.; Chen, M. Evaluation of Mercury Transformation and Benthic Organisms Uptake in a Creek Sediment of Pearl River Estuary, China. Water 2019, 11, 1308. https://0-doi-org.brum.beds.ac.uk/10.3390/w11061308
AMA Style
Chen L, Li F, Huang W, Li Z, Chen M. Evaluation of Mercury Transformation and Benthic Organisms Uptake in a Creek Sediment of Pearl River Estuary, China. Water. 2019; 11(6):1308. https://0-doi-org.brum.beds.ac.uk/10.3390/w11061308
Chicago/Turabian StyleChen, Long, Feng Li, Wenrou Huang, Zhi Li, and Mingguang Chen. 2019. "Evaluation of Mercury Transformation and Benthic Organisms Uptake in a Creek Sediment of Pearl River Estuary, China" Water 11, no. 6: 1308. https://0-doi-org.brum.beds.ac.uk/10.3390/w11061308
Note that from the first issue of 2016, this journal uses article numbers instead of page numbers. See further details here.