Increase and Spatial Variation in Soil Infiltration Rates Associated with Fibrous and Tap Tree Roots


1
State Key Laboratory of Hydraulic Engineering Simulation and Safety, Tianjin University, Tianjin 300072, China
2
School of Civil Engineering, Tianjin University, Tianjin 300072, China
3
Department of Civil and Environmental Engineering, Rutgers University, Piscataway, NJ 08854, USA
*
Author to whom correspondence should be addressed.
Water 2019, 11(8), 1700; https://0-doi-org.brum.beds.ac.uk/10.3390/w11081700
Submission received: 15 July 2019
/
Revised: 12 August 2019
/
Accepted: 13 August 2019
/
Published: 16 August 2019
(This article belongs to the Special Issue Advances in Groundwater and Surface Water Monitoring and Management)
Abstract
:Trees play important roles in urban stormwater management; through the loosening of soils by root growth, they increase infiltration and reduce runoff, helping to mitigate flooding and recharge groundwater. Malus baccata with fibrous roots and Sophora japonica with tap roots were studied experimentally to assess their enhancement of soil infiltration. A blank test without a tree was conducted for comparison. Steady-state soil infiltration rates at the bottom of test tanks were measured as 0.28 m/d, 0.33 m/d, and 0.61 m/d for the blank test, M. baccata, and S. japonica, respectively. This represents a 19% increase in the infiltration rate by planting M. baccata and a 118% increase by planting S. japonica. A larger increase in the infiltration rate by S. japonica is consistent with the effects of deeper and more vertical roots that help loosen deeper soils. Spatial variations in soil infiltration rates were also measured. Infiltration rates for M. baccata (1.06 m/d and 0.62 m/d) were larger than those for S. japonica (0.91 m/d and 0.51 m/d) at the same depths (0.35 m and 0.70 m); this is consistent with the expected effects of the shallower and more lateral roots of M. baccata. This study furthers our understanding of the roles of trees in watersheds and urban environments.
1. Introduction
With urbanization, the area of impervious surfaces is increased, which can lead to increased flooding and groundwater shortages [1,2,3,4]. Plants, especially tree roots, can enhance soil permeability, which plays a significant role in stormwater management [5,6]. Plant roots also increase infiltration and reduce runoff, which help mitigate flooding and recharge groundwater [7]. As the greening effort has increased globally [8], much research has focused on the influence of plant roots on soil permeability [9,10,11].
Trees and grasses can increase the number of pores in soils and promote soil permeability by root growth [12]. The growth of roots can improve soil porosity and decrease soil density [13,14,15]; likewise, pores can accelerate the growth of roots by increasing the volume of air in the soil [16,17,18]. Mishra and Sharma [19] observed that the bulk density of surface soils decreased from 1.66 t/m3 to 1.37 t/m3 in three years with the growth of Prosopis juliflora, and the porosity of the soil also increased from 41.2% to 46.3% over the same period. Moreover, trees and grasses can produce secretions in soils and increase the organic matter and biomass content, thereby changing the formation and stability of the soil structure and indirectly influencing soil permeability [20,21,22,23]. Hiraoka and Onda [22] reported that the soil permeability of bamboo groves had a significant correlation with the bulk density of surface soil and soil organic matter content.
Although both trees and grasses greatly influence soil permeability, there are some differences. Grasses have a limited influence on deep soil permeability and groundwater recharge due to their very shallow roots (<0.10 m) [24], while trees can have a significant effect on deep soil permeability and groundwater recharge due to their deep roots (>0.60 m) [25]. For this reason, studies on runoff reduction through increases in infiltration and groundwater recharge into deep soils have focused on how trees enhance soil permeability. Previous studies have shown that different tree species have different influences on soil permeability [26,27,28,29]. Bartens et al. [26] reported that black oak trees and red maple trees, which both have tap root systems, increased the soil infiltration rate by 131% and 200%, respectively, when compared to soils lacking tree roots. Rahman et al. [28] found that soils with Robinia pseudoacacia (black locust tree; tap roots) had a higher hydraulic conductivity (0.42 cm/min) compared to soils with Tilia cordata (small-leaved lime, also tap roots; 0.29 cm/min). Tree species differ in their influences on soil permeability since they have different root distributions (e.g., root depth and horizontal root spreading) [30], which affects the distribution of soil porosity, organic matter, and biomass content in different ways [31,32].
Fibrous and tap root systems have distinctive characteristics [33,34]. Fibrous root systems have more lateral roots and therefore have a more significant effect on the permeability of shallow soils. Meanwhile, tap root systems have deeper and more vertical roots, and thus have a more significant effect on the permeability of deep soils [24,35,36]. However, to date, few researchers have studied the influence of both fibrous and tap tree root systems on soil permeability at the same time, especially in terms of quantifying permeability using the same measurement methods.
The influence of fibrous and tap root systems varies spatially. Therefore, it is necessary to measure soil permeability in horizontal and vertical directions separately to fully understand their effects. Using a double-ring permeameter, Chandler and Chappell [37] reported that the soil saturated hydraulic conductivity of individual oak trees declined with increasing distance from the trunk stem due to the distribution of roots, and the same conclusion was found for dryland shrubs by Dunkerley [38]. The majority of soil permeability measurements found in the literature have been made using borehole permeameters [37,38,39] and double-ring permeameters [40,41,42,43]. However, borehole permeameters can only measure the permeability of surface soils, and the measurement accuracy of double-ring permeameters is limited by the ring depth and diameter [41,42,43]. Therefore, past studies on the influences of different tree root systems on soil permeability at different vertical and horizontal locations in soils have been limited by the measurement methods or by the scope of the research. In contrast, our study was conducted to investigate not only the influences of fibrous root systems (Malus baccata) and tap root systems (Sophora japonica) on soil permeability, but also the spatial distribution of soil permeability through measurements made using the constant-head method at different soil depths, and using the variable-head method at different distances from the tree stem.
2. Materials and Methods
2.1. Experimental Setup
In this study, the Malus baccata and Sophora japonica (three years old) trees were planted in two tanks, and a blank test tank without a tree was also used. There was a total of five tanks used in the test. The tanks each had a length of 2.0 m, width of 2.0 m, and height of 1.5 m (Figure 1) to ensure room for natural tree root growth. Data were gathered one year after the trees were planted. Soil used in the tank was taken from a farmland in Tianjin, China. The organic content of the soil was 8.18 mg/kg, which is the mean value of three soil layers at depths of 0.35 m, 0.70 m and 1.05 m from the soil surface, as measured by the Sinomine Rock and Mineral Analysis Co., Ltd. using method NYT1121.6-2006. The soil is a loam, with a bulk density of 1.412 g/cm3 and total soil porosity of 0.46. The trunk diameters for M. baccata and S. japonica at 30 cm from soil surface were 5.15 cm and 6.46 cm, respectively. The root lengths were 23 cm for both M. baccata and S. japonica.
In order to achieve homogeneous soil compaction in the tanks, each tank was filled with the same total depth of materials: 0.05 m depth of gravel as a base layer, 1.05 m depth of soil as a middle layer (5930 kg), and 0.05 m depth of gravel at the surface. The presence of the upper and lower gravel layers was designed to ensure that water entered uniformly and drained freely during measurements. Three layers of nonwoven cloth were placed inside each tank between the soil and the bottom gravel layer to prevent soil loss during water infiltration. An overflow weir was provided at a distance of 0.07 m above the surface of the top gravel layer to maintain a constant head (i.e., the depth of water was not allowed to exceed 0.07 m).
During the test, a constant-flow pump (MM1D124B**B20800; SEKO, Rome, Italy) was used to hold the water inflow rate constant. Water levels in the inflow container, overflow container, outlet container, and at the soil surface were measured using a Limn meter (NKY08-2; Nanjing Hydraulic Research Institute, Nanjing, China). Soil moisture and temperature in the tank were also measured using a Famems500 system (Famems500; Beijing Fandasky Science and Technology, Beijing, China) at depths of 0.35 m, 0.70 m, and 1.05 m from the soil surface. During the experiment, the influence of evaporation was ignored as the experiment time was short.
2.2. Infiltration Rate Measurements
2.2.1. Variation of Soil Infiltration
Under the condition of constant inflow for 7 h, outflow was monitored for 48 h. The rate of inflow into the soil at the top of the tank was calculated based on the mass balance, and the rate of outflow from the bottom of the tank was measured via the volumetric method and used to calculate the overall infiltration rate of the tree–soil system inside the tanks. The soil infiltration rates at the tank soil surface (Iin, m/d) and at the base of the tank soil (Iout, m/d) were calculated using the equations below:
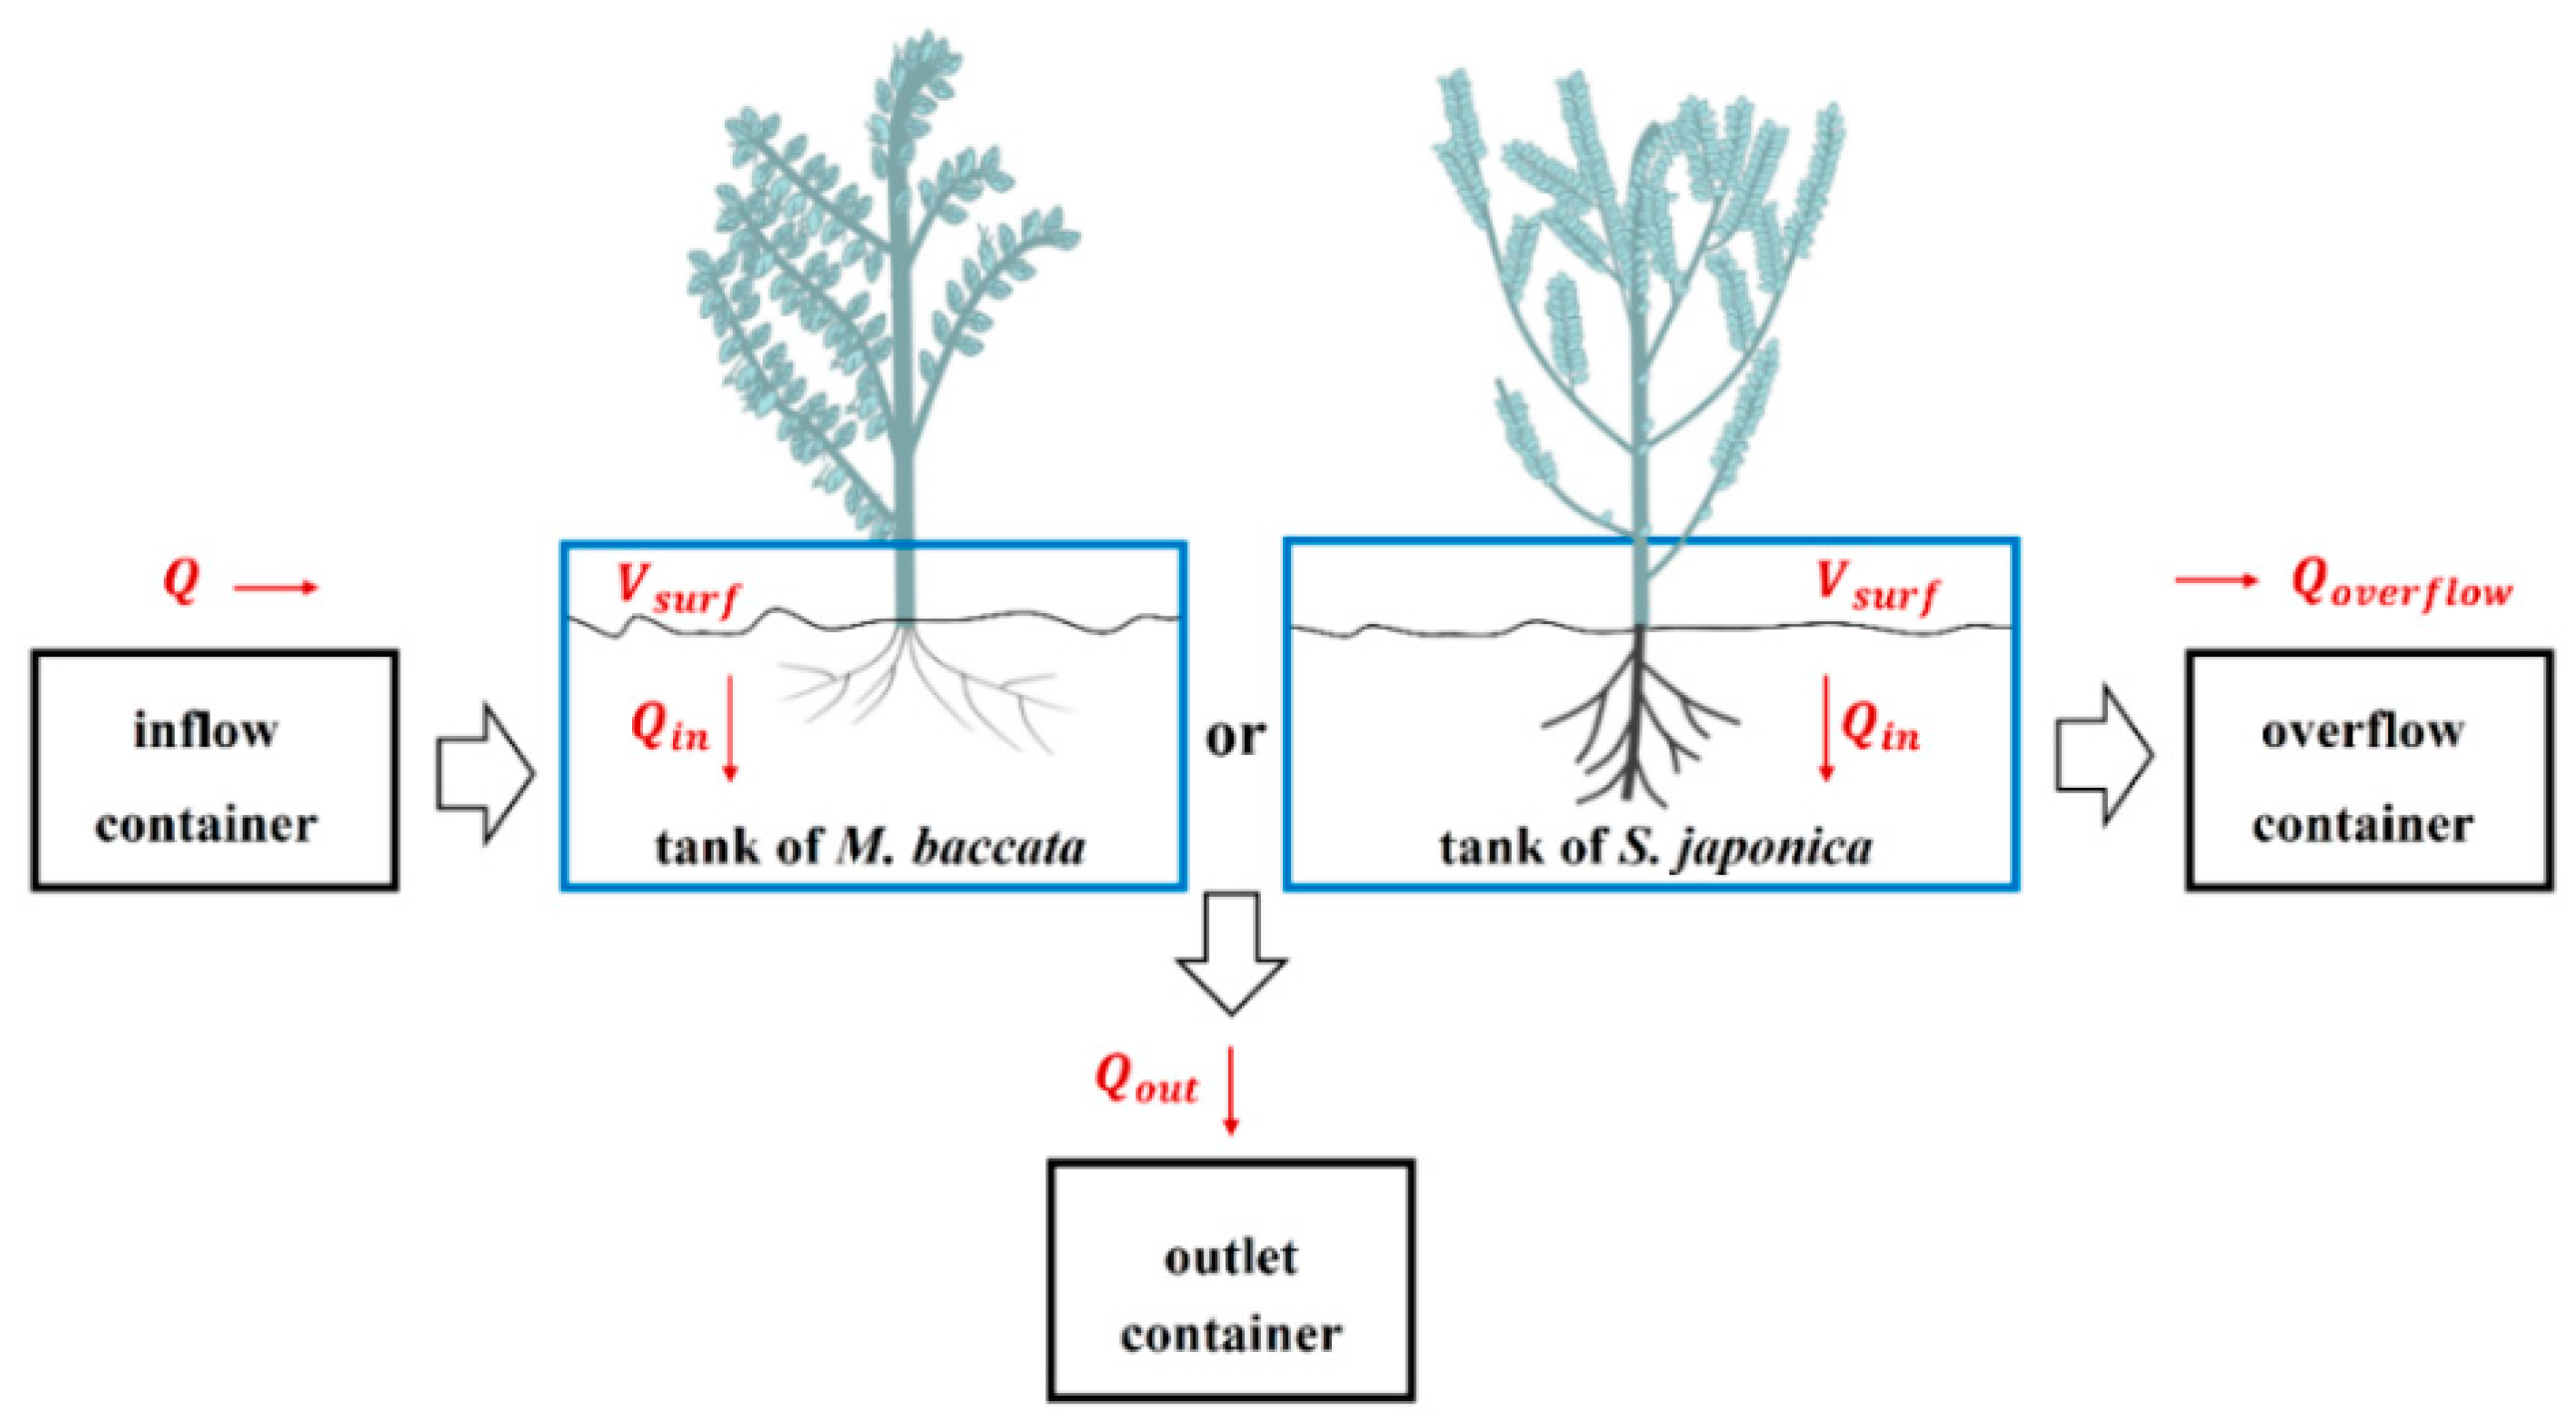
where Q (Figure 2) is the rate of inflow to the test tank (Q = 0.286 m3/h), dVsurf/dt is the change over time in the water volume above the soil surface (m3/h), Qoverflow is the rate of overflow (m3/h), Qin is the rate of flow into the soil (m3/h), A is the horizontal planar area of soil inside of the tank (A = 4.0 m2), and Qout is the rate of outlet flow (m3/h). Under steady state conditions, dVsurf/dt is equal to zero. Data were recorded every five minutes. The soil temperature varied from 29.9 °C to 37.8 °C due to the changing of atmospheric temperatures during the tests over 48 h. A test with steady-state permeability conditions was duplicated once.
Qin = Q − dVsurf/dt − Qoverflow
Iin = Qin/A
Iout = Qout/A
2.2.2. Vertical Variation of Soil Infiltration Rate
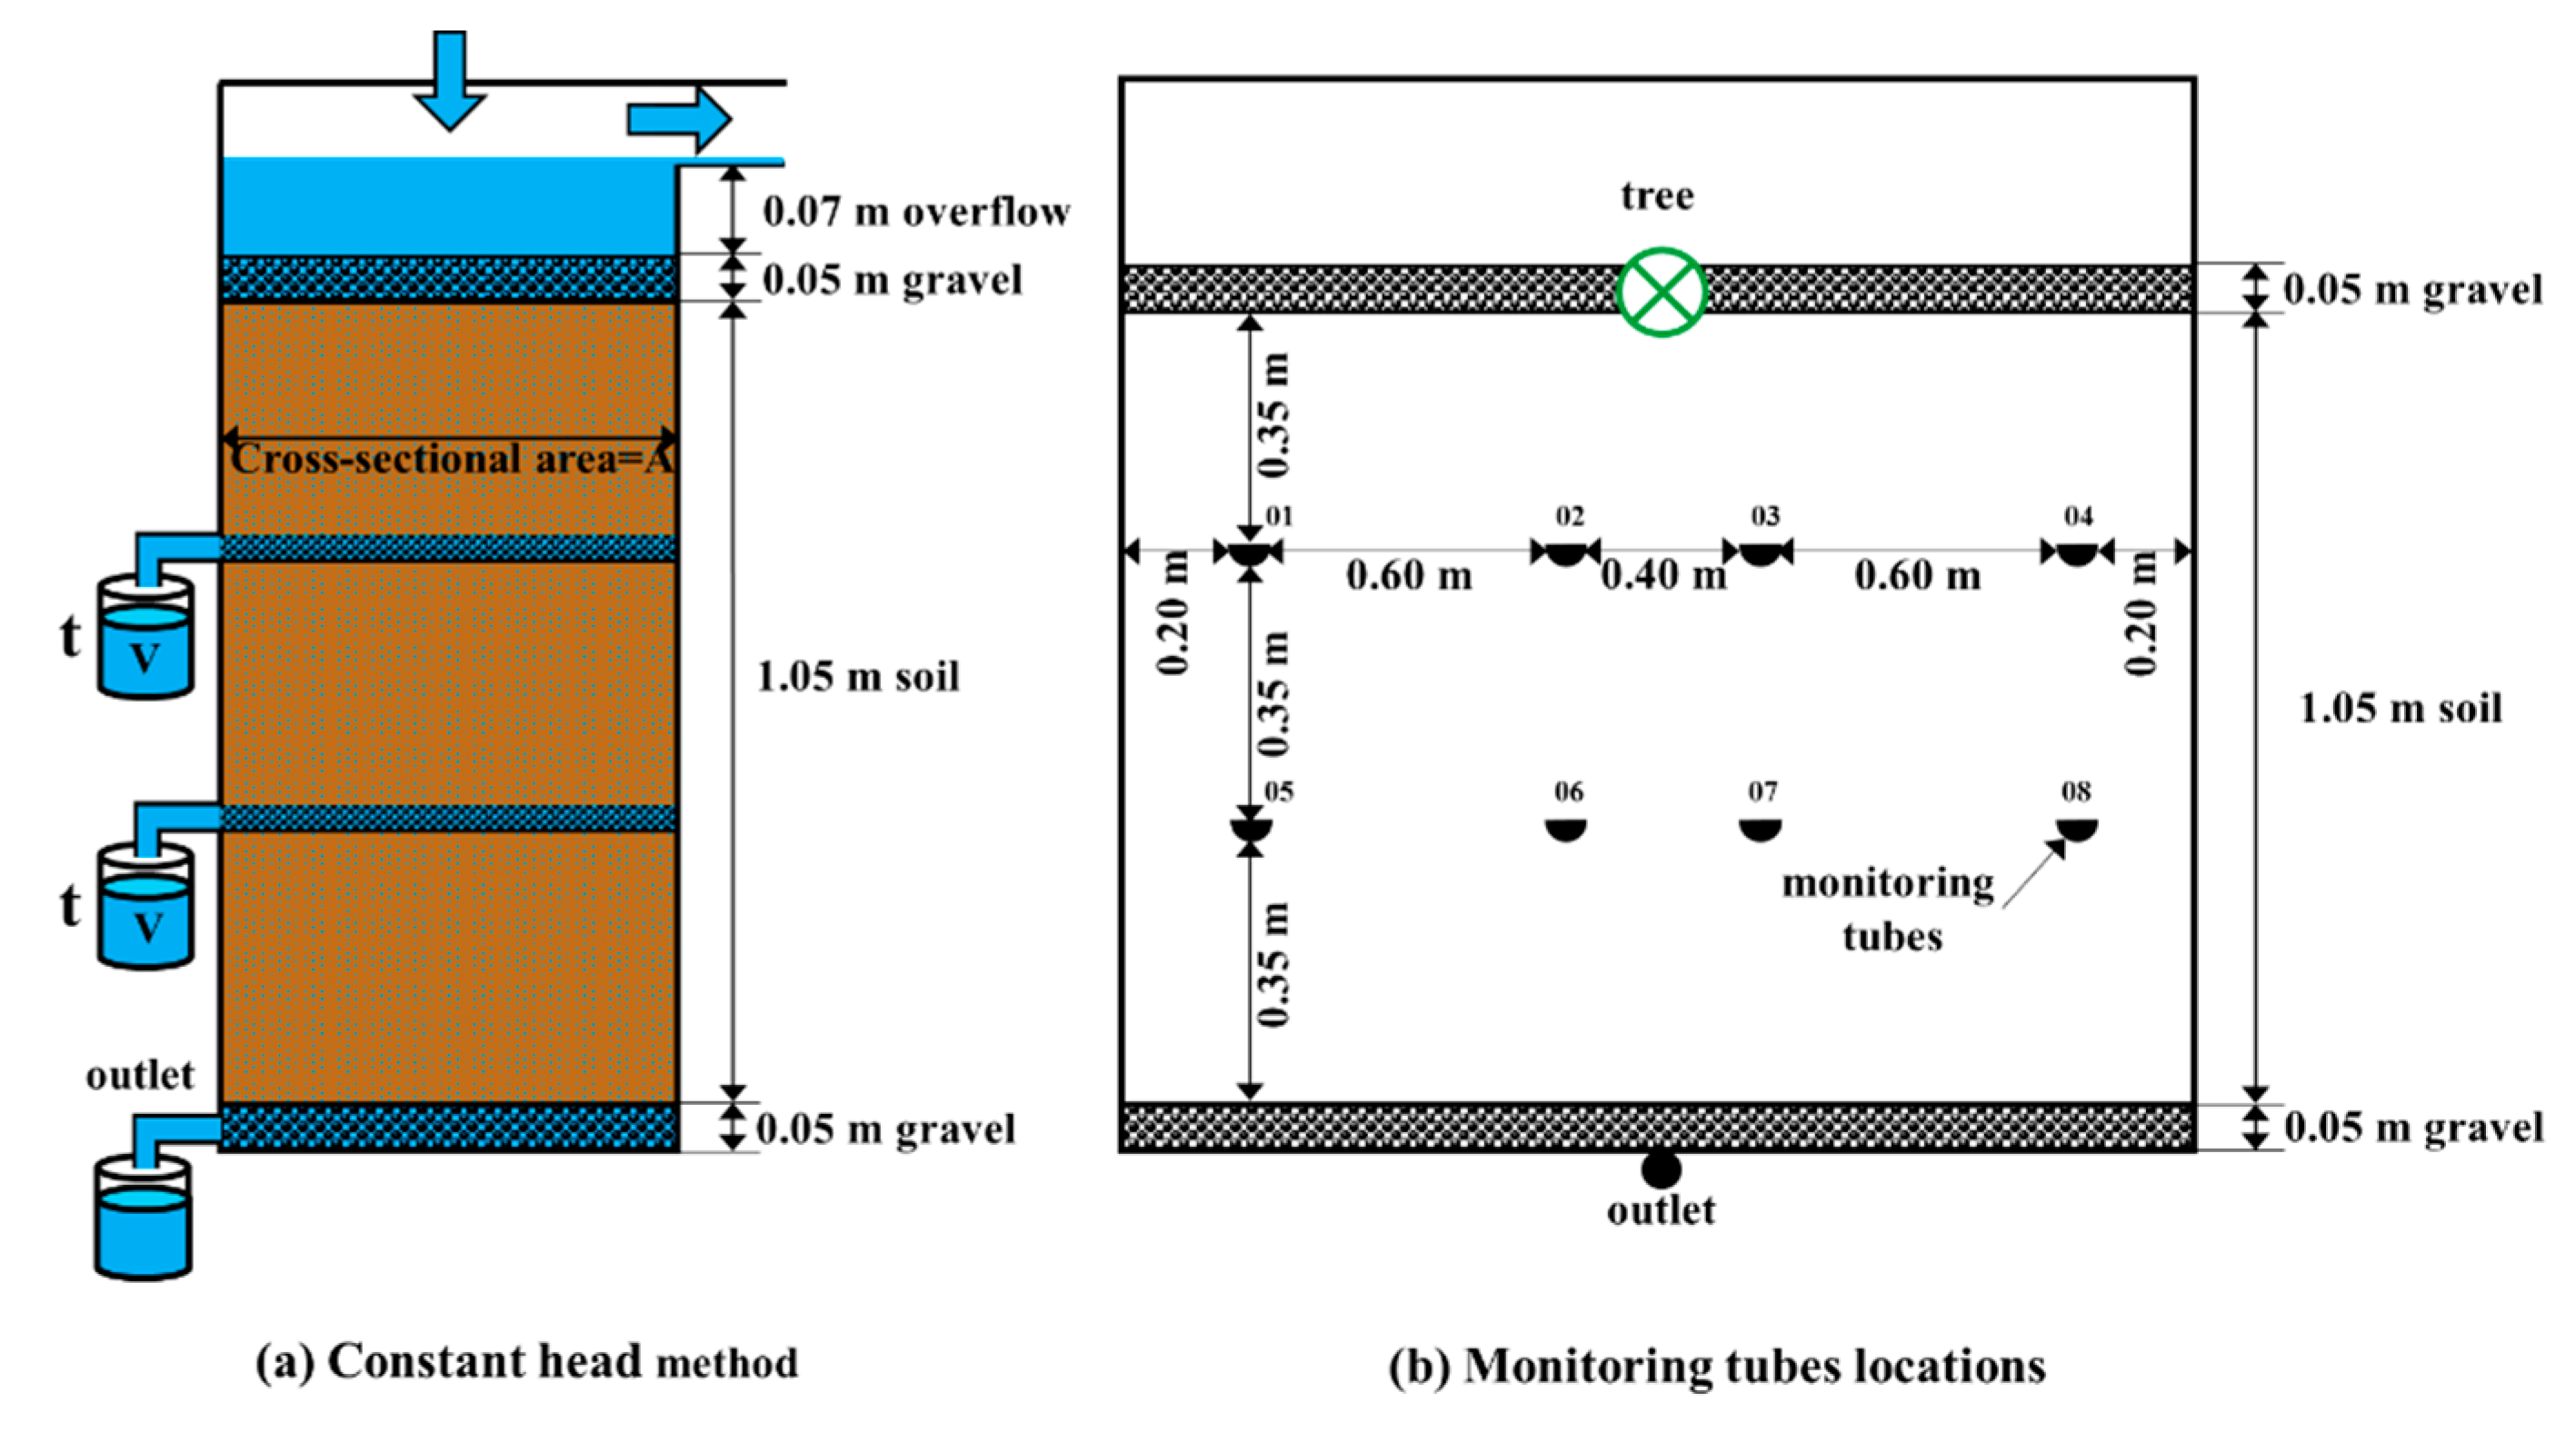
After the tank soil had been saturated with water for 3 h, the vertical variation in the infiltration rate inside of the soil was measured by the constant-head method [44] at different elevations, and water with a depth at 5 cm on the soil surface was kept to ensure the soil was under saturation conditions. Sub-horizontal monitoring tubes were set at depths of 0.35 m (four tubes) and 0.70 m (four tubes) from the soil surface (Figure 3). The monitoring tubes were made by half-round Poly Vinyl Chloride tubes (diameter = 0.05 m, length = 2.0 m), and had a slope of 0.025 to allow water drainage. A measuring vessel was attached to the end of each monitoring tube to record outflow from the tubes. Infiltration rates (I, m/d) of the soil of at depths of 0.35 m and 0.70 m were calculated using the equation below:
where V is the volume of the measuring vessel/container (V = 5 × 10⁻⁴ m3) and t is the time (in days, converted from recorded minutes) taken for the vessel to be filled with water running from each horizontal monitoring tube. Mean infiltration rates (I, m/d) of the soil at depths of 0.35 m and 0.70 m were calculated by the four infiltration rates at the “01”, “02”, “03”, and “04” monitoring tubes and by the four infiltration rates at the “05”, “06”, “07”, and “08” monitoring tubes (Figure 3). For each test, monitoring tubes at only one depth were used, and other monitoring tubes at other depths were closed.
I = V/(0.25A × t)
2.2.3. Horizontal Variation of Soil Infiltration Rate
After the tank soil had been saturated with water for 3 h, the horizontal variation in the infiltration rate of the soil was measured by the variable-head method, and water with a depth at 1 cm on the soil surface was kept to ensure the soil was under saturation conditions. The bottoms of the vertical monitoring tubes were set at distances of 0.10 m (one tube), 0.65 m (four tubes), and 1.30 m (four tubes) from the tree trunk or tank center (Figure 4). The vertical monitoring tubes were made from plexiglass (internal diameter = 0.01 m, external diameter = 0.02 m, length = 2.0 m), and were inserted to a depth of 0.35 m from the soil surface. The mean infiltration rates (I, m/d) at distances of 0.10 m, 0.65 m, and 1.30 m were calculated using the equation below:
where a is the cross-sectional area of the plexiglass tube (a = 7.85 × 10⁻⁵ m3), h1 and h2 are the initial and final water levels in the plexiglass tube (h1 = 2.70 m and h2 = 1.15 m), and Δt is the time interval between the starting water level, h1, and the final water level, h2. Mean infiltration rates (I, m/d) of the soil at distances of 0.65 m and 1.30 m were calculated by the four infiltration rates at the “02”, “03”, “04”, and “05” monitoring tubes and by the four infiltration rates at the “06”, “07”, “08”, and “09” monitoring tubes (Figure 4). For each test, only the outlet at the bottom was open.
I = a × (h1 − h2)/(A × Δt)
3. Results and Discussion
3.1. Temporal Variation in Infiltration Rates
The temporal variation in the soil infiltration rates at the tank soil surfaces (Iin) and at the tank soil bases (Iout) in the three different test tanks is shown in Figure 5. In all tanks, from 0–2.5 h, the soil was not saturated (Iin decreased and Iout increased). The saturation stage was reached between 2.5–7 h (Iin and Iout stabilized). Finally, the soil became unsaturated again between 7–21 h due to the termination of the water supply (Iout decreased). The similar infiltration rates at the tank soil surfaces (Iin) and at the tank soil bases (Iout) during the saturation stage indicated that the measurement of all inflow and outflow components were reliable (i.e., in good water balance, as governed by Equation (1)) during all tests. The same trends were obtained by other tanks where M. baccata and S. japonica were planted. The measured variation over time in the soil infiltration rates (Iin and Iout) provided a dataset that could be used for validation of the mathematical models that describe the entire process of infiltration through the soil. In this study, only the data obtained during the saturation stage were utilized for discussion.
3.2. Steady-State Infiltration Rates at the Base of Test Tanks
The soil steady-state infiltration rates at the bottom outlets of the three different test tanks are shown in Table 1. The infiltration rates at the bottom of the tanks were calculated from the bottom outflow rates during the time period of 3–7 h (at steady state), divided by the horizontal planar area of each tank (Equation (3)). The two datasets represent repeated test runs. The F test for the mean value was conducted (Table 1) and the p-value of the mean value was determined to be <0.05, which indicates a significant mean value.
The mean soil steady-state infiltration rates measured at the base outlet of the tanks without a tree, with M. baccata, and with S. japonica were 0.28 m/d, 0.33 m/d, and 0.61 m/d, respectively (Table 1). The mean steady-state infiltration rates in soils with M. baccata and S. japonica increased by 19% and 118%, respectively, compared with the soil without a tree. The mean steady-state infiltration rates of the soil with S. japonica increased by 99%, as compared with the soil with M. baccata. The same trend was obtained in other tanks where M. baccata and S. japonica were planted. These results suggest that trees with a tap root system (such as S. japonica) affect deep soil permeability due to their deeper and more vertical roots, which help to loosen deeper soils and transport more water to the base of the tank [45,46], and that trees with fibrous root systems (such as M. baccata) which have shallower and more horizontal roots have little influence on the permeability of deep soils [47,48,49].
3.3. Spatial Distribution of Soil Permeability in Test Tanks
3.3.1. Infiltration Rates at Different Soil Depths
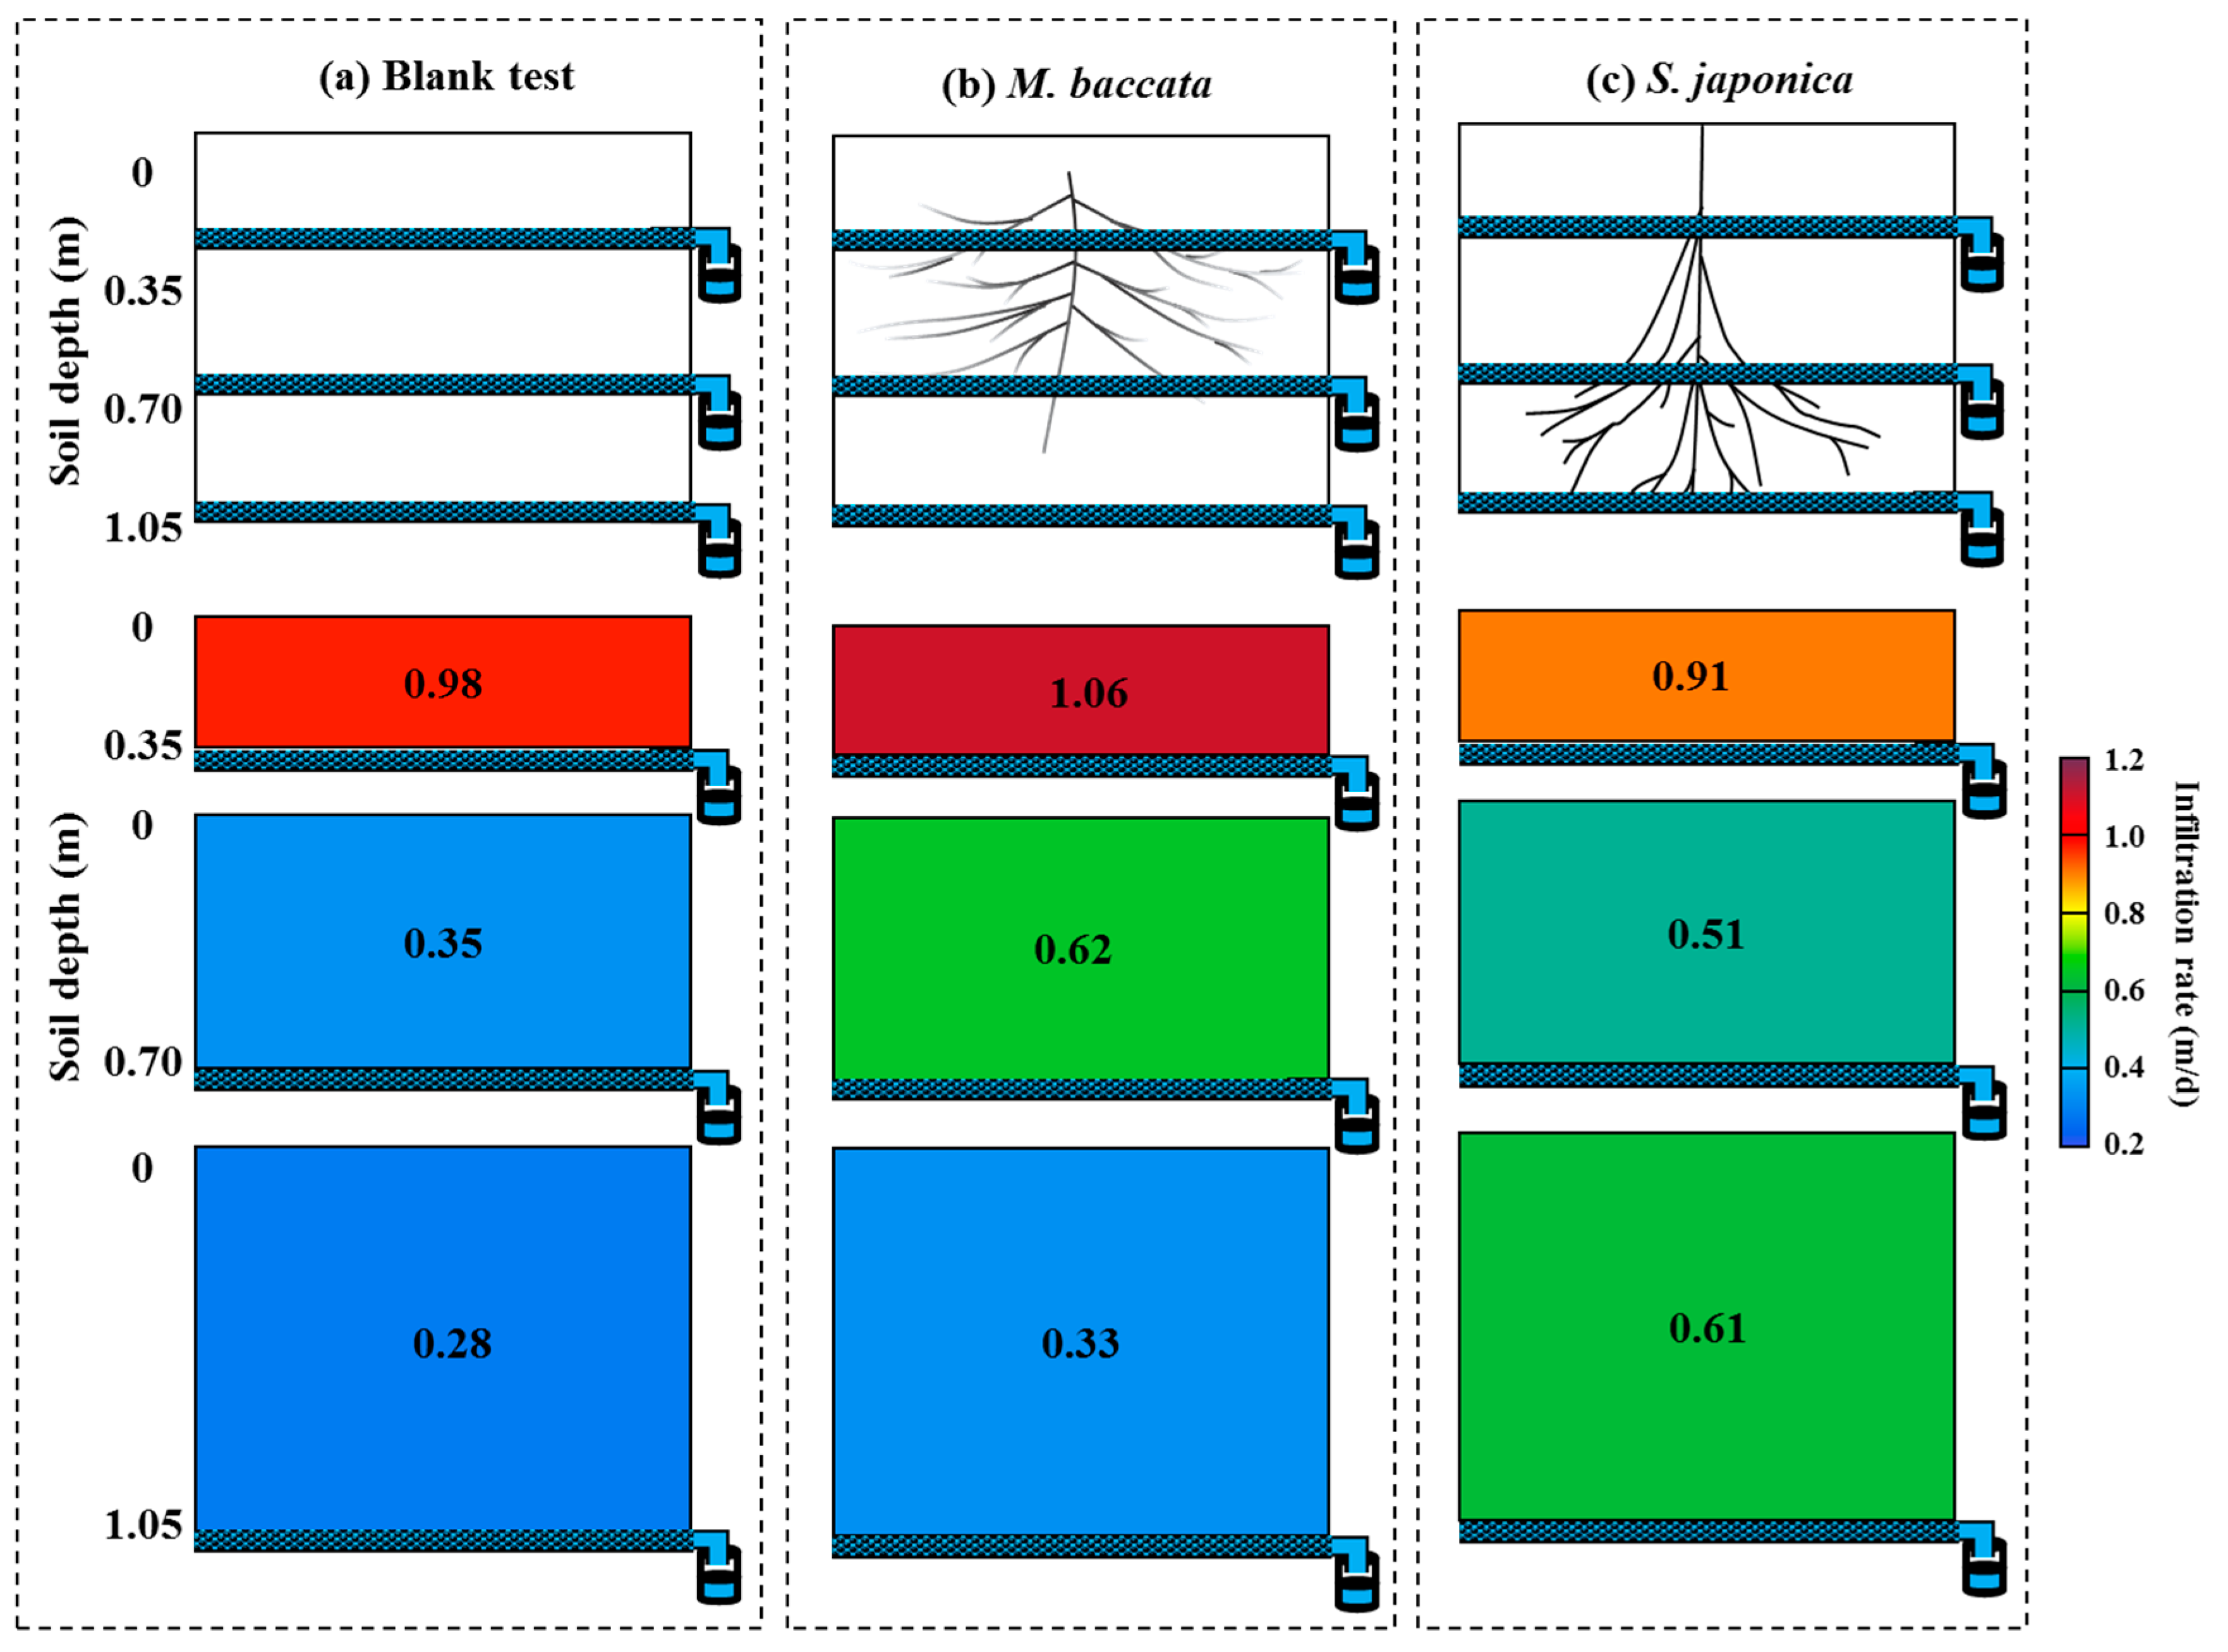
The soil infiltration rates at different soil depths in the three different test tanks are shown in Figure 6 and Table S1. The values measured by four horizontal monitoring tubes on the same horizontal plane were averaged. The mean soil infiltration rate (I) (Figure 6) decreased along the vertical direction from 0.98 m/d at 0.35 m to 0.35 m/d at 0.70 m in soils in the tank without a tree, but it decreased from 1.06 m/d at 0.35 m to 0.62 m/d at 0.70 m in soils with M. baccata, and decreased from 0.91 m/d at 0.35 m to 0.51 m/d at 0.70 m in soils with S. japonica. The soil without a tree had a lower infiltration rate at greater depths, which was attributed to greater soil compaction with increasing depth due to sedimentation and decreased soil porosity [19]. The same trends were obtained by other tanks which Malus baccata and Sophora japonica were planted.
Tree roots were observed to improve the soil infiltration rate in the vertical direction compared to the soil in the blank test. Comparing the soil infiltration rate depths of 0.35 m and 0.70 m, the mean I of the soil in the blank test decreased by 64%, but decreased by only 41% (M. baccata) and 44% (S. japonica) when trees were planted. The relative I of the soil decreased less with an increase in soil depths when trees were present, indicating that the permeability of deeper soils was improved by tree roots. Tree roots can enlarge and generate pores in soils, which reduce the density of the soil and increases the infiltration rate [14,15]. In addition, M. baccata has a larger influence on the mean I of soil (1.06 m/d to 0.62 m/d) compared with S. japonica (0.91 m/d to 0.51 m/d) in the upper layer (i.e., for measurements taken at 0.35 m and 0.70 m). The same trend was obtained by other tanks in which M. baccata and S. japonica were planted. Pohl et al. [30] found that different trees with root systems that provided different functions had different geometries (e.g., root depths and horizontal root spreading), and that these different geometries may be important for soil permeability. M. baccata has mainly fibrous and lateral roots [47,48,49], and this root system dominantly changed the permeability of surface soils in the experiments of this study. In contrast, S. japonica has mainly tap roots [45,46], which penetrate deeply into the soil. This root system was shown to change the permeability of deep soils in the experiments of this study.
3.3.2. Infiltration Rates at Different Distances from Tree Trunks
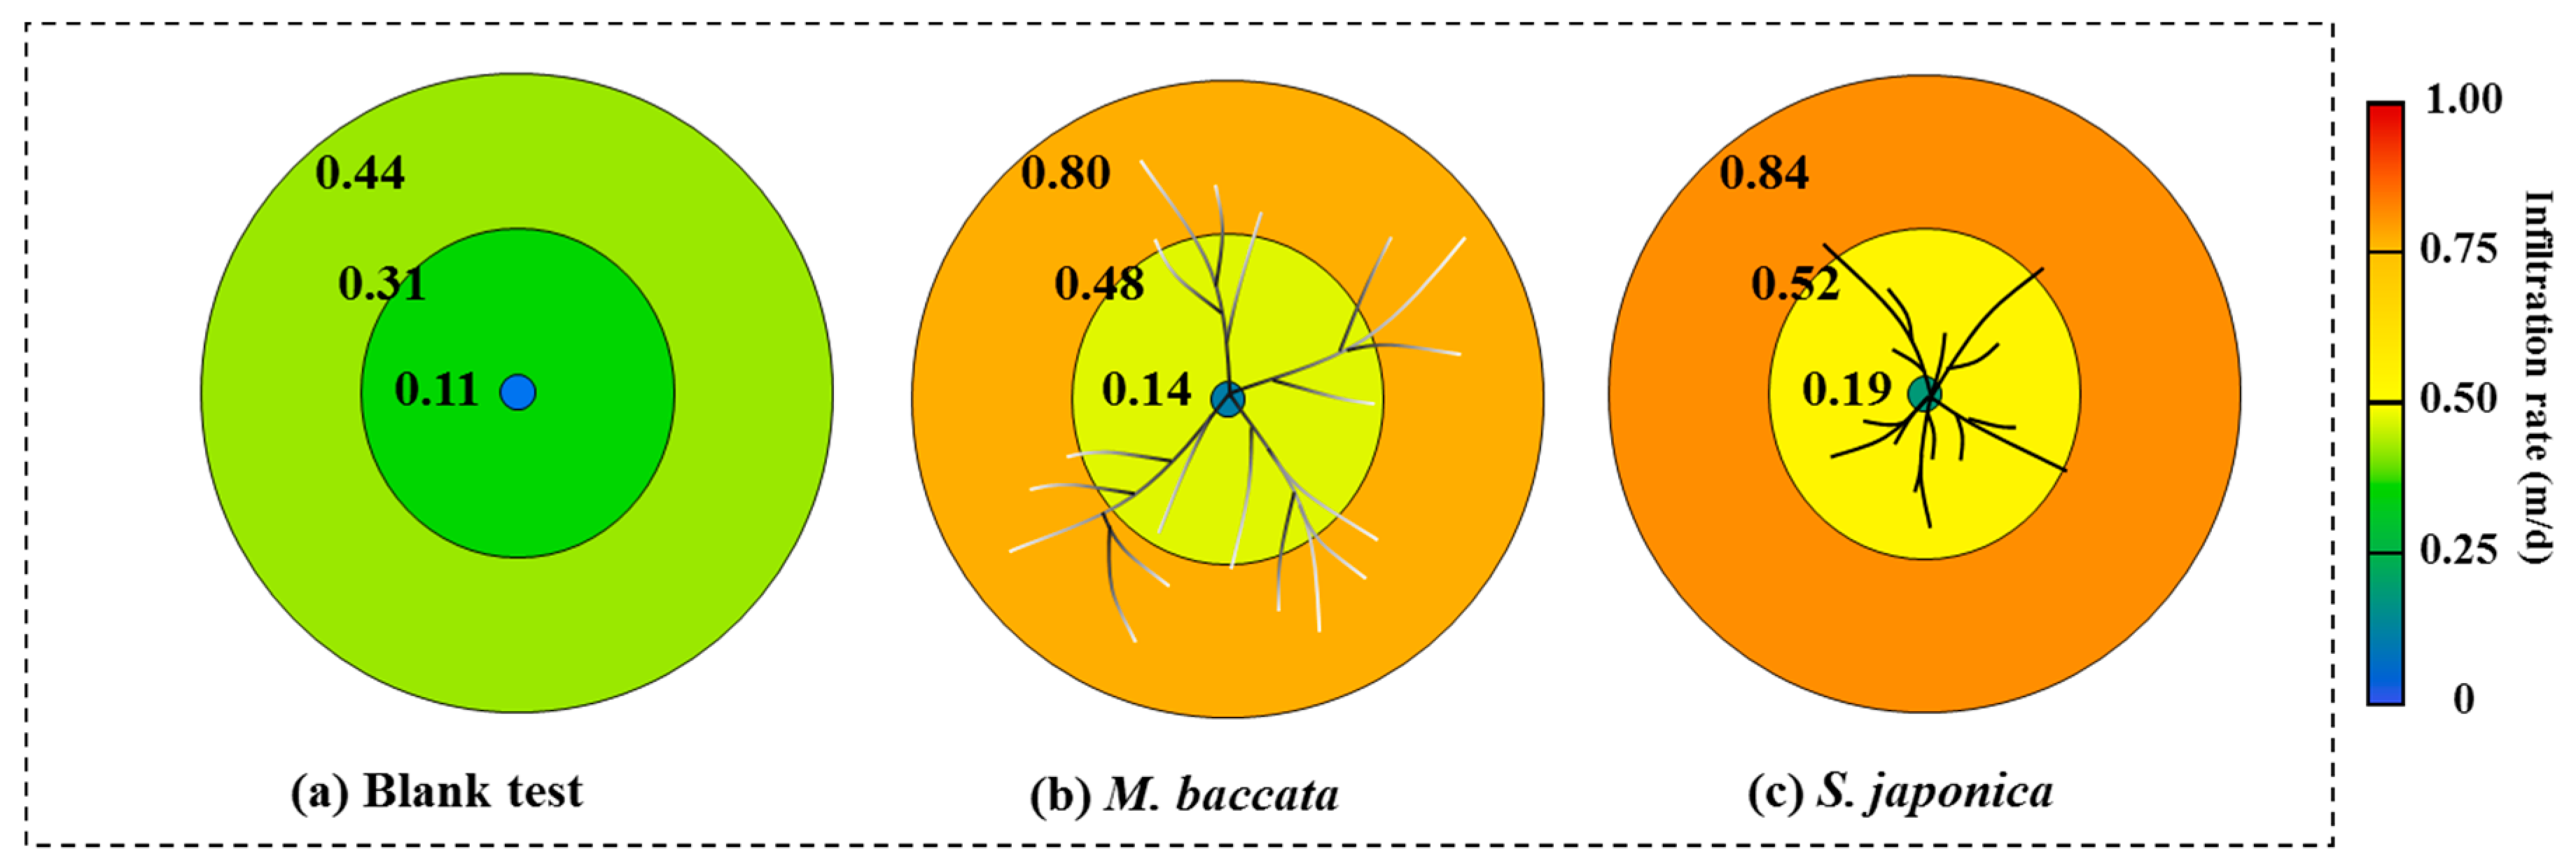
The infiltration rates at different distances from the tree trunks in the three test tanks were determined. The values were measured by four vertical monitoring tubes at the same distances away from the tree trunks (tubes “02”–“05” were at a distance of 0.65 m; tubes “06”–“09” were at a distance of 1.3 m). The mean infiltration rate (I) of the soil (Table S2, Figure 7) at a distance of 0.10 m from the tree trunks of M. baccata and S. japonica increased to 0.14 m/d and 0.19 m/d, respectively, compared with the blank test soil (0.11 m/d). Additionally, I also increased to 0.48 m/d and 0.52 m/d at a distance of 0.65 m from the tree trunk compared to the blank test soil (0.31 m/d), and increased to 0.80 m/d and 0.84 m/d at a distance of 1.30 m from the tree trunk compared to the blank test soil (0.44 m/d). Although the mean I of the soil was affected by the boundary (vertical wall) of the tank (e.g., I always decreased with increasing distance from the tree trunk), a significant influence from the tree roots on the I of the soil can be observed, as I values increase more in the tests with trees than in the blank test. This may be attributed to the increase in root channels. The measured influences of M. baccata (fibrous roots) and S. japonica (tap roots) on the infiltration rate of surface soils at different distances from the tree trunk were not substantially different. The same trends were obtained by other tanks in which M. baccata and S. japonica were planted. However, it is possible that M. baccata may have a larger influence on the I of surface soils than S. japonica in the horizontal plane after a few more years of growth, resulting from the extension of the fibrous and lateral roots of the M. baccata root system [47,48,49].
It is noteworthy that the value of soil infiltration rates in vertical (0.35 m, Figure 6) and horizontal directions (0.35 m, Figure 7) represent different soil layers. The value of the infiltration rate in the vertical direction (0.35 m, Figure 6) represents the soil permeability at a depth of 0–0.35 m, but the value of the infiltration rate in the horizontal direction (0.35 m, Figure 7) represents the soil permeability at depth from 0.35–1.05 m. Additionally, the same value of infiltration rates at different distances (10 cm, 65 cm, and 130 cm) from the tree trunks or the center of the blank tank are still difficult to obtain due to the heterogeneity of soil caused by the tree roots and the influence of the sidewall effect of the tank. The tree roots may be mainly affected by the infiltration rates at 10 cm and 65 cm, and the sidewall effect of the tank may be mainly affected by the infiltration rates at 130 cm.
4. Conclusions
Different tree species have root systems with different geometries (e.g., root depth and horizontal root spreading) that are pertinent to soil permeability. However, past studies on the influences of different tree root systems (fibrous and tap roots) on soil permeability, as well as on the variation in their effects at different vertical and horizontal locations in soil columns, have been limited by the methods of measurement or by the scope of the research. In this study, two types of trees with different root systems (M. baccata, with fibrous roots, and S. japonica, with tap roots) were studied experimentally to assess their relative degrees of soil infiltration enhancement (plus one tank without a tree used as a blank test) were utilized in the experiments.
The measured rates of steady-state soil infiltration through each test tank were 0.28 m/d (blank test), 0.33 m/d (M. baccata), and 0.61 m/d (S. japonica). Soil infiltration rates in tanks with M. baccata and S. japonica increased by 19% and 118%, respectively, compared to the blank test soil, and the soil infiltration rate in the tank with S. japonica increased by 99% as compared to soil in the tank with M. baccata. These values suggest the tap root systems of S. japonica help loosen deeper soils and transport additional water through the entire soil column.
Soil permeability was also measured at different soil depths and different distances from the tree trunk to investigate the spatial variability. Measurements were taken at depths of 0.35 m and 0.70 m. In the tanks with trees, M. baccata was observed to have a larger influence on the infiltration rate of soils (infiltration rate decreased from 1.06 m/d to 0.62 m/d) than S. japonica (infiltration rate decreased from 0.91 m/d to 0.51 m/d). This implies that the shallow, fibrous, and lateral roots of M. baccata mainly change the permeability of surface soil.
The results of this study contribute to a deeper understanding of the role of trees in both watersheds and urban environments. By developing a better understanding and rigorously quantifying how tree root systems influence soil permeability, we will be able to provide further guidance for urban stormwater management. Specifically, our findings may be used to develop new approaches regarding the planting of trees for rainfall runoff reduction, flood mitigation, and groundwater recharge.
Supplementary Materials
The following are available online at https://0-www-mdpi-com.brum.beds.ac.uk/2073-4441/11/8/1700/s1, Table S1: Soil infiltration rates (m/d) at different soil depths in the three test tanks, Table S2: Soil infiltration rates (m/d) at different distances (10 cm, 65 cm, and 130 cm) from the tree trunks in the three test tanks.
Author Contributions
Experiment and write manuscript, D.Z.; experiment, Z.W.; design experiment and review manuscript, Q.G.; design experiment, J.L.; design experiment and corresponding author, L.C.
Funding
This work was supported by the National Key R&D Program of China (2016YFC0400905), the National Natural Science Foundation of China (No. 41772245), and the Science Fund for Creative Research Groups of the National Natural Science Foundation of China (No. 51621092).
Acknowledgments
The English writing in the revised manuscript was edited by Elsevier Author Services. The authors would like to acknowledge Paul H. Fallgren (Advanced Environmental Technologies, LLC) for reviewing and editing the English portion of our manuscript.
Conflicts of Interest
The authors declare no conflict of interest.
References
- Gilbert, J.K.; Clausen, J.C. Stormwater runoff quality and quantity from asphalt, paver, and crushed stone driveways in Connecticut. Water Res. 2006, 40, 826–832. [Google Scholar] [CrossRef] [PubMed]
- Peña, L.E.; Barrios, M.; Francés, F. Flood quantiles scaling with upper soil hydraulic properties for different land uses at catchment scale. J. Hydrol. 2016, 541, 1258–1272. [Google Scholar] [CrossRef] [Green Version]
- Kamali, M.; Delkash, M.; Tajrishy, M. Evaluation of permeable pavement responses to urban surface runoff. J. Environ. Manag. 2017, 187, 43–53. [Google Scholar] [CrossRef] [PubMed]
- Alaoui, A.; Rogger, M.; Peth, S.; Blöschl, G. Does soil compaction increase floods? A review. J. Hydrol. 2018, 557, 631–642. [Google Scholar] [CrossRef]
- Berland, A.; Shiflett, S.A.; Shuster, W.D.; Garmestani, A.S.; Goddard, H.C.; Herrmann, D.L.; Hopton, M.E. The role of trees in urban stormwater management. Landsc. Urban Plan. 2017, 162, 167–177. [Google Scholar] [CrossRef] [PubMed] [Green Version]
- Keeler, B.L.; Hamel, P.; McPhearson, T.; Hamann, M.H.; Donahue, M.L.; Meza Prado, K.A.; Arkema, K.K.; Bratman, G.N.; Brauman, K.A.; Finlay, J.C.; et al. Social-ecological and technological factors moderate the value of urban nature. Nat. Sustain. 2019, 2, 29–38. [Google Scholar] [CrossRef]
- Grey, V.; Livesley, S.J.; Fletcher, T.D.; Szota, C. Tree pits to help mitigate runoff in dense urban areas. J. Hydrol. 2018, 565, 400–410. [Google Scholar] [CrossRef]
- Chen, C.; Park, T.; Wang, X.; Piao, S.; Xu, B.; Chaturvedi, R.K.; Fuchs, R.; Brovkin, V.; Ciais, P.; Fensholt, R.; et al. China and India lead in greening of the world through land-use management. Nat. Sustain. 2019, 2, 122–129. [Google Scholar] [CrossRef]
- Oswald, S.E.; Menon, M.; Carminati, A.; Vontobel, P.; Lehmann, E.; Schulin, R. Quantitative imaging of infiltration, root growth, and root water uptake via neutron radiography. Vadose Zone J. 2008, 7, 1035. [Google Scholar] [CrossRef]
- Ow, L.F.; Ghosh, S. Urban tree growth and their dependency on infiltration rates in structural soil and structural cells. Urban For. Urban Green. 2017, 26, 41–47. [Google Scholar] [CrossRef]
- Szota, C.; McCarthy, M.J.; Sanders, G.J.; Farrell, C.; Fletcher, T.D.; Arndt, S.K.; Livesley, S.J. Tree water-use strategies to improve stormwater retention performance of biofiltration systems. Water Res. 2018, 144, 285–295. [Google Scholar] [CrossRef] [PubMed]
- Gregory, J.H.; Dukes, M.D.; Jones, P.H.; Miller, J.L. Effect of urban soil compaction on infiltration rate. J. Soil Water Conserv. 2006, 61, 117–124. [Google Scholar]
- Lange, B.; Lüescher, P.; Germann, P.F. Significance of tree roots for preferential infiltration in stagnic soils. Hydrol. Earth Syst. Sci. 2009, 13, 1809–1821. [Google Scholar] [CrossRef] [Green Version]
- Meek, B.D.; Rechel, E.R.; Carter, L.M.; DeTar, W.R.; Urie, A.L. Infiltration rate of a sandy loam soil: Effects of traffic, tillage, and plant roots. Soil Sci. Soc. Am. J. 1992, 56, 908. [Google Scholar] [CrossRef]
- Pawlik, Ł.; Kasprzak, M. Regolith properties under trees and the biomechanical effects caused by tree root systems as recognized by electrical resistivity tomography (ERT). Geomorphology 2018, 300, 1–12. [Google Scholar] [CrossRef]
- Gregory, P.J. Roots, rhizosphere and soil: The route to a better understanding of soil science? Eur. J. Soil Sci. 2006, 57, 2–12. [Google Scholar] [CrossRef]
- Lipiec, J.; Stepniewski, W. Effects of soil compaction and tillage systems on uptake and losses of nutrients. Soil Tillage Res. 1995, 35, 37–52. [Google Scholar] [CrossRef]
- Lipiec, J.; Horn, R.; Pietrusiewicz, J.; Siczek, A. Effects of soil compaction on root elongation and anatomy of different cereal plant species. Soil Tillage Res. 2012, 121, 74–81. [Google Scholar] [CrossRef]
- Mishra, A.; Sharma, S.D. Influence of forest tree species on reclamation of semiarid sodic soils. Soil Use Manag. 2010, 26, 445–454. [Google Scholar] [CrossRef]
- Czarnes, S.; Hallett, P.D.; Bengough, A.G.; Young, I.M. Root- and microbial-derived mucilages affect soil structure and water transport. Eur. J. Soil Sci. 2003, 51, 435–443. [Google Scholar] [CrossRef]
- Gregory, A.S.; Watts, C.W.; Whalley, W.R.; Kuan, H.L.; Griffiths, B.S.; Hallett, P.D.; Whitmore, A.P. Physical resilience of soil to field compaction and the interactions with plant growth and microbial community structure. Eur. J. Soil Sci. 2007, 58, 1221–1232. [Google Scholar] [CrossRef]
- Hiraoka, M.; Onda, Y. Factors affecting the infiltration capacity in bamboo groves. J. For. Res. 2012, 17, 403–412. [Google Scholar] [CrossRef]
- Huyler, A.; Chappelka, A.H.; Fan, Z.; Prior, S.A. A comparison of soil carbon dynamics in residential yards with and without trees. Urban Ecosyst. 2017, 20, 87–96. [Google Scholar] [CrossRef]
- Mitchell, A.R.; Ellsworth, T.R.; Meek, B.D. Effect of root systems on preferential flow in swelling soil. Commun. Soil Sci. Plant Anal. 1995, 26, 2655–2666. [Google Scholar] [CrossRef]
- Chen, J.; Lichwa, J.; Snehota, M.; Mohanty, S.; Ray, C. Determination of hormones and non-ionic surfactant degradation products in small-volume aqueous samples from soil columns using LC-ESI-MS-MS and GC-MS. Chromatographia 2006, 64, 413–418. [Google Scholar] [CrossRef]
- Bartens, J.; Day, S.D.; Harris, J.R.; Dove, J.E.; Wynn, T.M. Can urban tree roots improve infiltration through compacted subsoils for stormwater management? J. Environ. Qual. 2008, 37, 2048. [Google Scholar] [CrossRef] [PubMed]
- Lu, J.L.; Shen, G.; Wang, Q.; Ren, M.L.; Pei, Z.X.; Wei, C.H.; Wang, W.J. Effect of urban tree species on soil physicochemical properties in Harbin, northeastern China, and afforestation implications. Bull. Bot. Res. 2016, 36, 549–555. [Google Scholar]
- Rahman, M.A.; Moser, A.; Anderson, M.; Zhang, C.; Rötzer, T.; Pauleit, S. Comparing the infiltration potentials of soils beneath the canopies of two contrasting urban tree species. Urban For. Urban Green. 2019, 38, 22–32. [Google Scholar] [CrossRef]
- Wang, W.; Lu, J.; Du, H.; Wei, C.; Wang, H.; Fu, Y.; He, X. Ranking thirteen tree species based on their impact on soil physiochemical properties, soil fertility, and carbon sequestration in northeastern China. For. Ecol. Manag. 2017, 404, 214–229. [Google Scholar] [CrossRef]
- Pohl, M.; Stroude, R.; Buttler, A.; Rixen, C. Functional traits and root morphology of alpine plants. Ann. Bot. 2011, 108, 537–545. [Google Scholar] [CrossRef] [Green Version]
- Chen, Y.; Day, S.D.; Wick, A.F.; Strahm, B.D.; Wiseman, P.E.; Daniels, W.L. Changes in soil carbon pools and microbial biomass from urban land development and subsequent post-development soil rehabilitation. Soil Biol. Biochem. 2013, 66, 38–44. [Google Scholar] [CrossRef]
- Hirte, J.; Leifeld, J.; Abiven, S.; Mayer, J. Maize and wheat root biomass, vertical distribution, and size class as affected by fertilization intensity in two long-term field trials. Field Crop. Res. 2018, 216, 197–208. [Google Scholar] [CrossRef]
- Loades, K.W.; Bengough, A.G.; Bransby, M.F.; Hallett, P.D. Planting density influence on fibrous root reinforcement of soils. Ecol. Eng. 2010, 36, 276–284. [Google Scholar] [CrossRef]
- Reubens, B.; Poesen, J.; Danjon, F.; Geudens, G.; Muys, B. The role of fine and coarse roots in shallow slope stability and soil erosion control with a focus on root system architecture: A review. Trees Struct. Funct. 2007, 21, 385–402. [Google Scholar] [CrossRef]
- Fan, J.; McConkey, B.; Wang, H.; Janzen, H. Root distribution by depth for temperate agricultural crops. Field Crop. Res. 2016, 189, 68–74. [Google Scholar] [CrossRef] [Green Version]
- Perkons, U.; Kautz, T.; Uteau, D.; Peth, S.; Geier, V.; Thomas, K.; Lütke Holz, K.; Athmann, M.; Pude, R.; Köpke, U. Root-length densities of various annual crops following crops with contrasting root systems. Soil Tillage Res. 2014, 137, 50–57. [Google Scholar] [CrossRef]
- Chandler, K.R.; Chappell, N.A. Influence of individual oak (Quercus robur) trees on saturated hydraulic conductivity. For. Ecol. Manag. 2008, 256, 1222–1229. [Google Scholar] [CrossRef]
- Dunkerley, D. Hydrologic effects of dryland shrubs: Defining the spatial extent of modified soil water uptake rates at an Australian desert site. J. Arid Environ. 2000, 45, 159–172. [Google Scholar] [CrossRef]
- Tang, Y.C.; Meng, G.T.; Mao, Q.F. Study on soil permeability coeffcient on CPTU model test. Adv. Mater. Res. 2011, 261–263, 1401–1405. (In Chinese) [Google Scholar] [CrossRef]
- Jiménez, C.C.; Tejedor, M.; Morillas, G.; Neris, J. Infiltration rate in Andisols: Effect of changes in vegetation cover (Tenerife, Spain). J. Soil Water Conserv. 2006, 61, 153–158. [Google Scholar]
- Lai, J.; Luo, Y.; Ren, L. Numerical evaluation of depth effects of double-ring infiltrometers on soil saturated hydraulic conductivity measurements. Soil Sci. Soc. Am. J. 2012, 76, 867. [Google Scholar] [CrossRef]
- Lai, J.; Luo, Y.; Ren, L. Buffer index effects on hydraulic conductivity measurements using numerical simulations of double-ring infiltration. Soil Sci. Soc. Am. J. 2010, 74, 1526. [Google Scholar] [CrossRef]
- Lai, J.; Ren, L. Assessing the size dependency of measured hydraulic conductivity using double-ring infiltrometers and numerical simulation. Soil Sci. Soc. Am. J. 2007, 71, 1667. [Google Scholar] [CrossRef]
- Feng, Q.; Zhan, H. Constant-head test at a partially penetrating well in an aquifer-aquitard system. J. Hydrol. 2019, 569, 495–505. [Google Scholar] [CrossRef]
- Bai, H.X. The position of Sophora japonica in landscape greening. For. Shanxi 1996, 6, 18–19. (In Chinese) [Google Scholar]
- Miao, G.Y.; Wang, J. Sophora japonica seedling technology. Pract. For. Technol. 2011, 11, 35. (In Chinese) [Google Scholar]
- Bai, X.H. Introduction performance of apple rootstock of Begonia japonica. Shanxi Fruits 2007, 1, 54. (In Chinese) [Google Scholar]
- Guan, P.D.; Yang, C.Q.; Liu, K.W.; Xiao, P.; Yang, R.J. Study on rooting of Begonia round leaf in sugar-free culture. J. Fruit Sci. 2006, 23, 899–902. (In Chinese) [Google Scholar]
- Liang, C.X. Investigation on root system of apple rootstock-Begonia ziboensis. Deciduous Fruits 1978, 4, 6. (In Chinese) [Google Scholar]
Figure 1.
Schematic of the test setup.

Figure 2.
Schematic of the flow direction of water during the test.( Q is the rate of inflow to the test tank, dVsurf/dt is the change over time in the water volume above the soil surface, Qoverflow is the rate of overflow, Qin is the rate of flow into the soil, and Qout is the rate of outlet flow).

Figure 3.
Schematic view of (a) the constant-head monitoring method experimental setup, showing the position of (b) the horizontal monitoring tubes. (V is the volume of the measuring vessel/container and t is the time (in days, converted from recorded minutes) taken for the vessel to be filled with water running from each horizontal monitoring tube).

Figure 4.
Schematic view of (a) the variable-head monitoring method experimental setup, showing the position of (b) the vertical monitoring tubes. (a is the cross-sectional area of the plexiglass tube, A is the horizontal planar area of soil inside of the tank, h1 and h2 are the initial and final levels in the plexiglass tube, and Δt is the time interval between the starting water level, h1, and the final water level, h2).

Figure 5.
Variation in the soil infiltration rates over time in the three different test tanks. Values of water inflow (Iin) and outlet flow (Iout) are shown. (Q is the rate of inflow to the test tank).
Figure 5.
Variation in the soil infiltration rates over time in the three different test tanks. Values of water inflow (Iin) and outlet flow (Iout) are shown. (Q is the rate of inflow to the test tank).

Figure 6.
Mean soil infiltration rates at different depths in the three test tanks: (a) blank test, (b) M. baccata, and (c) S. japonica. In each test, outflows from only one depth were used.
Figure 6.
Mean soil infiltration rates at different depths in the three test tanks: (a) blank test, (b) M. baccata, and (c) S. japonica. In each test, outflows from only one depth were used.

Figure 7.
Mean soil infiltration rates at different distances from the tree trunks in the three test tanks: (a) blank test, (b) M. baccata, and (c) S. japonica.
Figure 7.
Mean soil infiltration rates at different distances from the tree trunks in the three test tanks: (a) blank test, (b) M. baccata, and (c) S. japonica.


Table 1.
Soil steady-state infiltration rates (m/d) at the bottom outlets of three test tanks.
| Tank | Blank Test | M. baccata | S. japonica |
|---|---|---|---|
| Run 1 | 0.28 | 0.34 | 0.61 |
| Run 2 | 0.28 | 0.33 | 0.62 |
| Mean value of soil steady-state infiltration rates | 0.28 ± 0.003 | 0.33 ± 00.009 | 0.61 ± 0.007 |
| F test of mean value of soil steady-state infiltration rates | 11.55 a (3.02 × 10⁻³) b | 78.51 (3.56 × 10⁻⁸) | 21.69 (1.72 × 10⁻⁴) |
Note: a The F statistics of the mean value of soil steady-state infiltration rates with df 1 and 19; b p-value of the mean value of soil steady-state infiltration rates from the F test. (df is degrees of freedom)
© 2019 by the authors. Licensee MDPI, Basel, Switzerland. This article is an open access article distributed under the terms and conditions of the Creative Commons Attribution (CC BY) license (http://creativecommons.org/licenses/by/4.0/).
Share and Cite
MDPI and ACS Style
Zhang, D.; Wang, Z.; Guo, Q.; Lian, J.; Chen, L. Increase and Spatial Variation in Soil Infiltration Rates Associated with Fibrous and Tap Tree Roots. Water 2019, 11, 1700. https://0-doi-org.brum.beds.ac.uk/10.3390/w11081700
AMA Style
Zhang D, Wang Z, Guo Q, Lian J, Chen L. Increase and Spatial Variation in Soil Infiltration Rates Associated with Fibrous and Tap Tree Roots. Water. 2019; 11(8):1700. https://0-doi-org.brum.beds.ac.uk/10.3390/w11081700
Chicago/Turabian StyleZhang, Dashuai, Zhaogeng Wang, Qizhong Guo, Jijian Lian, and Liang Chen. 2019. "Increase and Spatial Variation in Soil Infiltration Rates Associated with Fibrous and Tap Tree Roots" Water 11, no. 8: 1700. https://0-doi-org.brum.beds.ac.uk/10.3390/w11081700
Note that from the first issue of 2016, this journal uses article numbers instead of page numbers. See further details here.