Effects of Water Stress on Fluorescence Parameters and Photosynthetic Characteristics of Drip Irrigation in Rice
by
Qiang Xu
1,2, 
Xiaopeng Ma
3,4,*,
Tingbo Lv
1,2,*,
Meng Bai
1,2,
Zelin Wang
1,2 and
Jingran Niu
1,2 1
School of Water Conservancy and Architectural Engineering, Shihezi University, Shihezi 832000, China
2
Key Laboratory of Modern Water-Saving Irrigation of Xinjiang Production and Construction Corps, Shihezi University, Shihezi 832000, China
3
Institute of Soil Fertilizer and Agricultural Water Saving, Xinjiang Academy of Agricultural Sciences, Urumqi 830000, China
4
Key Laboratory of Agricultural Environment of Northwest Oasis, Ministry of Agriculture, Urumqi 830000, China
*
Authors to whom correspondence should be addressed.
Water 2020, 12(1), 289; https://0-doi-org.brum.beds.ac.uk/10.3390/w12010289
Submission received: 27 November 2019
/
Revised: 14 January 2020
/
Accepted: 15 January 2020
/
Published: 19 January 2020
(This article belongs to the Section Water Use and Scarcity)
Abstract
:To study the effects of water stress on the fluorescence parameters and photosynthetic characteristics of rice under drip irrigation and mulching, so as to determine the response mechanisms to water stress during the tillering stage. A two-year trial was carried out at Shihezi University, China. Three water gradients were investigated. The results showed that the chlorophyll content (a + b), photosynthetic rate (Pn), and leaf area index (LAI) decreased with decreasing soil moisture content at the tillering stage. The chlorophyll content (a + b) and Pn in the flooding irrigation (CK) treatment were significantly higher than those in the stress treatments, and the chlorophyll content (a + b) and Pn in the W1 and W2 treatments were significantly lower than those in the other treatments. The maximum LAI of the CK, W1, and W2 treatments were similar, while the W3 produced lower values; stress treatment improved the ability of tillering in the early and middle stages, while the decrease in soil water content in the tillering stage resulted in a decrease in the final tillering rate; drought stress in the tillering stage resulted in decreased rice yields. The yield of the W1 and W2 treatments were similar, while that of the W3 treatment was seriously reduced. The main reasons for the reduction in yield was the significant decrease in the number of effective panicles, the seed setting rate, and a decrease in the 1000-grains weight. Water consumption in the stress treatments decreased by 51.69%–58.78% compared to the CK treatment; water-use efficiency in the CK treatment was only 0.25 kg·m−3, and the water-use efficiency of the stress treatments increased by 40%–72%. We should make full use of the compensation effect of drought stress in the water regulation of drip irrigation in covered rice and adopt the water control measure of the W2 treatment in the tillering stage. These measures are conducive to improving water-use efficiency and achieving the goal of high quality, high yield, and high efficiency.
1. Introduction
China is a large country, with the largest proportion of agricultural water consumption compared to total water consumption in the world, and agricultural production is most troubled by drought and water shortage [1,2]. With the decrease in fresh water resources and the increase in non-agricultural water use year by year [3,4], the lack of water resources has become the first obstacle affecting rice production [5]. The traditional submerged cultivation mode is gradually being changed to a water-saving cultivation mode [6,7]. The water-saving cultivation of rice applies drip irrigation technology under a film. During the growth period a high-frequency irrigation system is adopted, the water-saving rate is as high as 50%–60%, and high grain yield can be maintained [8]. Therefore, it is of great importance to carry out research on high yield and water-saving cultivation of drip irrigation and film mulching in rice in order to alleviate the crisis of water resources and improve food security. Rice has some drought adaptability, and water demand at different growth stages varies. There is significant opportunity to save water during the tillering stage, compared to other stages [9]. Previous studies have shown that moderate water control at the tillering stage can improve drought resistance and physiological activity of rice, and improve product quality and yield at later growth stages [10]. Appropriate water management can improve the light transmittance and photosynthetic area of rice in the later growth periods, promote the accumulation and movement of dry matter, and increase the net photosynthetic rate of rice before heading [11]. Therefore, it is of great importance to investigate the high-yield cultivation of rice while regulating the water content at the tillering stage. Photosynthesis is necessary to accumulate energy and dry matter for plant growth and development. Photosynthesis of rice leaves accounts for 95% of yield. Chlorophyll fluorescence is closely related to the photosynthetic efficiency. The influence of environmental factors on photosynthesis can be reflected by the chlorophyll light [12], so the photosynthetic structure operation can be diagnosed by chlorophyll fluorescence [12]. Total chlorophyll content and chlorophyll a content is positively correlated with net photosynthetic rate, while chlorophyll a/b is not directly correlated with net photosynthetic rate [13]. Photosynthesis, transpiration, stomatal opening, and other physiological processes interact with each other [14]. Reducing the stomatal opening of leaves, using mulching drip irrigation to reduce the transpiration rate, using the crop’s resistance and compensation ability, while maintaining the normal photosynthesis of leaves, achieves higher water-use efficiency and no significant change in yield [6]. A high photosynthetic rate is the direct reason for high rice yield. It is possible to improve the yield by improving photosynthetic performance. Most studies on the effect of soil water deficiency on rice are focused on the grain formation stage, and the main research focus is yield. Studies on changes in rice photosynthesis and its influencing factors have been reported at home and abroad, but there are few reports on the fluorescence parameters and photosynthetic physiological characteristics caused by water deficit at the tillering stage under drip irrigation. Exploration of the adaptability of drip irrigated rice to soil water stress at the tillering stage, and the underlying change characteristics have certain theoretical and practical significance for the analysis of crop photosynthetic productivity and yield formation. This paper will discuss the effects of water stress on fluorescence parameters and photosynthetic characteristics under drip irrigation, and study the effects of water stress at the tillering stage on yield, so as to provide a theoretical basis for the water-saving cultivation of drip irrigation covered rice.
2. Materials and Methods
2.1. Experimental Site
The experiment was carried out from 5 May to 15 September 2018 and from 4 May 4 to 16 September 2019 at the Key Laboratory of Modern Water Saving Irrigation Corps and the Water Saving Irrigation Experimental Station of Xinjiang Shihezi University (85° 59′ 47′′ E, 44° 19′ 29′′ N, 412 m above sea level) Xinjiang, China (Figure S1). The area has a temperate continental arid climate, with a frost-free period of 150 to 204 days, average ground slope of 6 ‰, annual average evaporation of 1600 mm, annual average sunshine of 2700 h, and precipitation of 114.6 mm between May and September 2018, and 127.2 mm between May and September 2019 (Figure S2). The average temperature from May to September 2018 and 2019 was 21.92 and 22.26 °C, respectively (Figure S2). The soil type is heavy loam, the field water holding rate was 21.24% (mass moisture content), and the average soil bulk density was 1.56 g cm−3, and the soil nutrient status is shown in Table 1.
2.2. Experimental Materials and Experimental Design
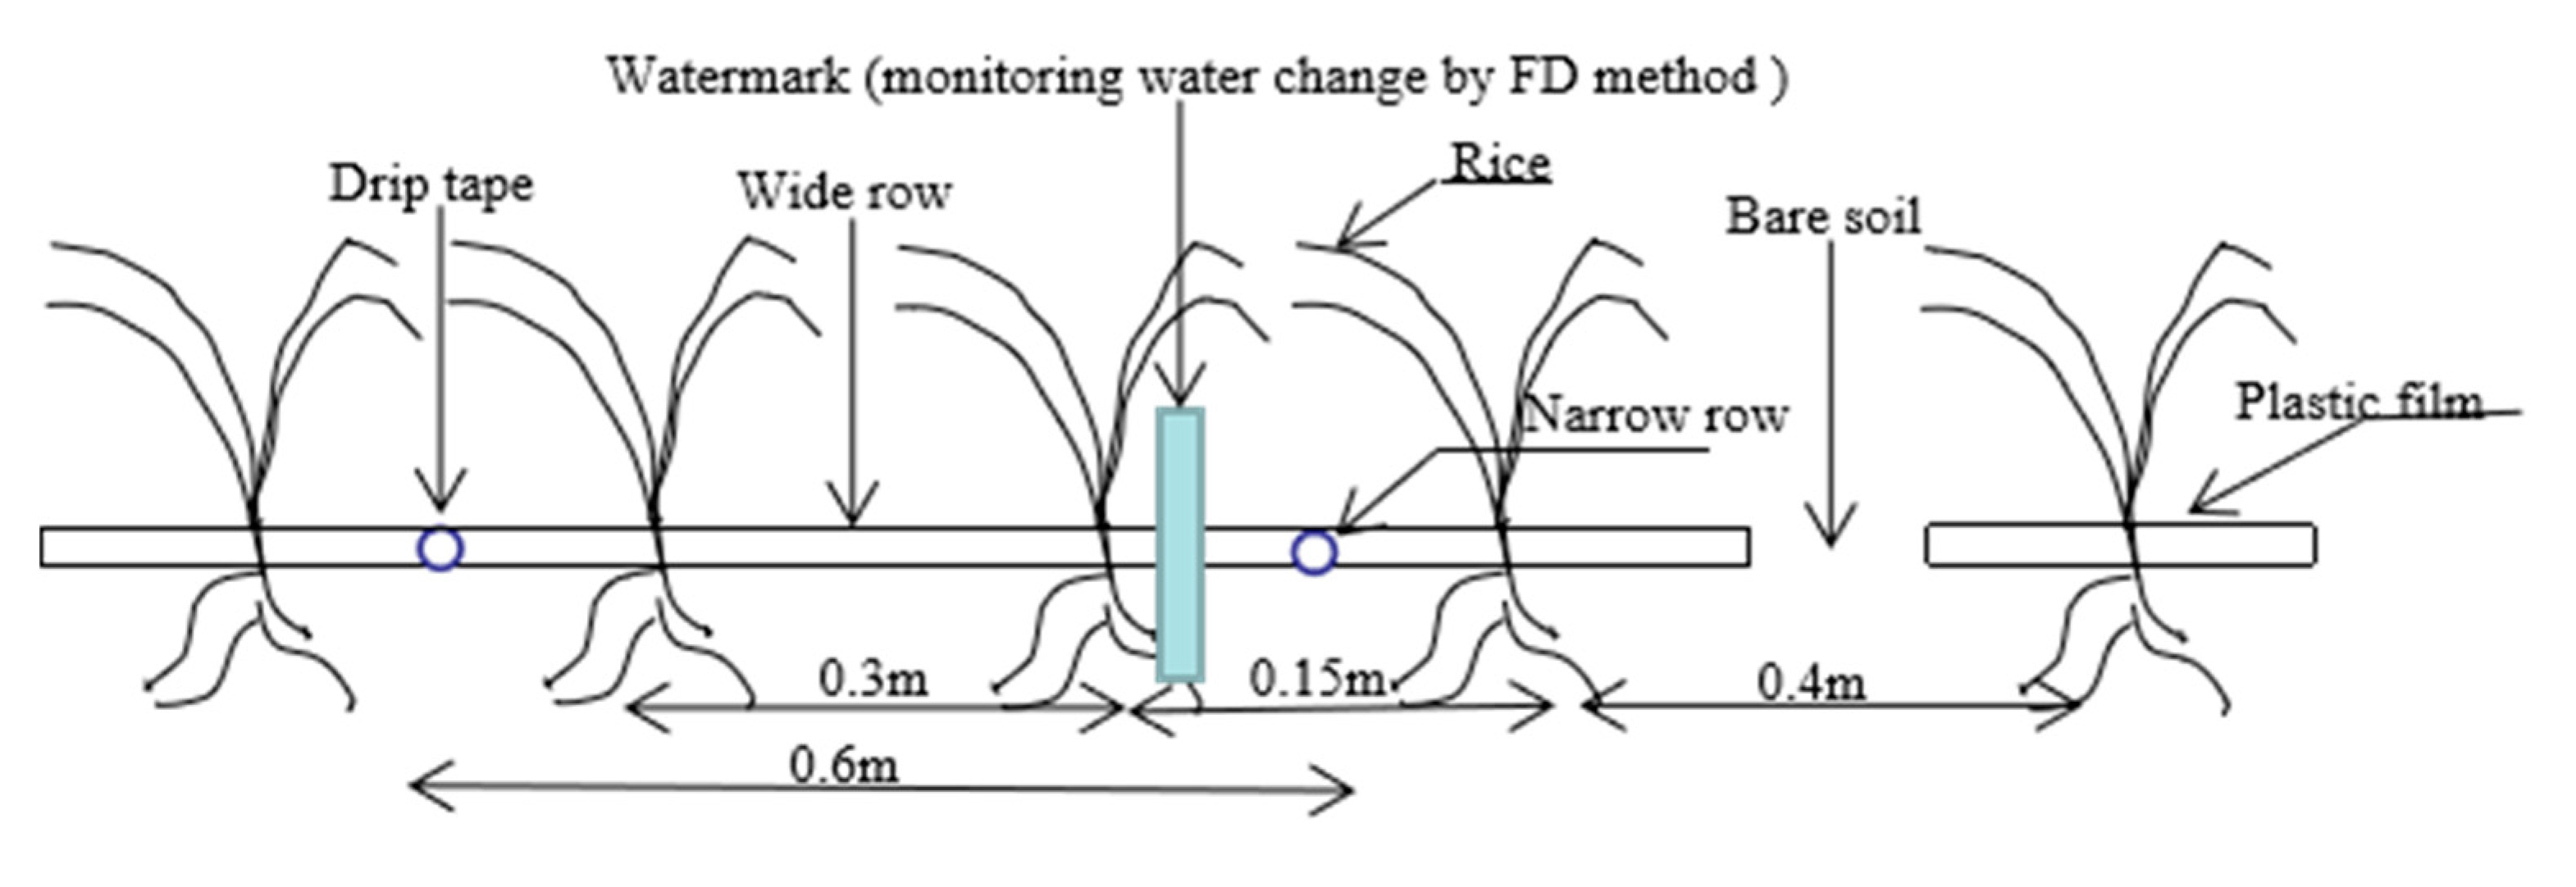
From May to September 2018 and 2019, the Xindao 16 variety of rice was grown in field plots (area of 2 × 7.5 m). There were 4 treatments: in the flooding treatment (CK) water supplement was recorded at 20:00 every night, a water layer of 5–10 cm was maintained at the seedling, tillering, jointing, and heading stages, and there was alternate dry/wet irrigation in the maturity stage. the water provided at the tillering stage was 0.85–1.00, 0.75–1.00, and 0.65–1.00 θs (θs represents field water capacity) for treatments W1, W2, and W3, respectively (Table 2). When the top 20 cm of soil reached the lower limit of irrigation for each treatment, supplementary irrigation was applied to reach the field water holding state near the soil. Three replicates were performed for each treatment. The planting pattern of each treatment is one film, two pipes, and four lines, in which the narrow line spacing is 15 cm, the wide line spacing is 30 cm, the film spacing is 40 cm, and the hole spacing is 10 cm (Figure 1). Each measuring pit had four capillary pipes, the drip irrigation belt selection spacing was 20 cm, and the flow rate was 3.2 L/h. Sowing occurred on 5 May 2018 and 4 May 2019. Eight seeds were sown manually into each hole, at a depth of 2–3 cm, and the rice seeds were dry seeding and wet budding. In order to prevent the water from moving laterally between the treatment, a 60 cm deep anti-seepage membrane was buried between the treatment. The membrane hole was sealed with soil to prevent grass damage. After emergence, the seedlings were released, 6 plants were retained in each hole, and they were ploughed once during both the seedling and early tillering stages, and grass was removed throughout the growing season. Except for use of different irrigation methods, the planting mode and management measures of the CK treatment were the same.
2.3. Data Collection and Analysis
2.3.1. Meteorological Data
The test station was equipped with an automatic weather station (TRM-ZS2 type, Jinzhou Sunshine Meteorological Technology Co., Ltd., Jinzhou, China), which recorded temperature, rainfall, air humidity, solar radiation, every day.
2.3.2. Soil Moisture Content
Water changes in the soil layer at a depth of 0–0.4 m were monitored in real time during the rice growing season using an intelligent soil moisture meter (Dongfang Runze Ecological Technology Co. Ltd., Beijing, China).
2.3.3. Chlorophyll Content
According to the method of Li et al. [15], after the measurement of the photosynthetic characteristics and chlorophyll fluorescence of rice leaves at the end of the tillering period, individual leaves were sampled by drilling holes, and extracted with 95% ethanol in a dark room at room temperature of 30–40 °C for 24 h, until the leaves were completely white. Then, the content of the photosynthetic pigment was calculated according to the recommended formula.
2.3.4. Photosynthetic Indicators
Each growth period was three consecutive days, the tillering period was from 8 to 10 July, the jointing period was from 10 to 12 August, the filling period was from 15 to 18 August, and the mature period was from 8 to 10 September. At 10:00 a.m., after photosynthesis was measured, the same leaves were measured using a hand-y-pea (the model of Li-6400, LI-COR, Lincoln, NE, USA). The measurements included the maize transpiration rate (Tr), net photosynthetic rate (Pn), stomatal conductance (gs), and intercellular CO2 concentration (Ci), which are photosynthetic physiological indicators. The rice functional leaves were selected on a clear and cloudless day in each growth period, from 08:00 to 18:00, with a time interval of 2 h. Three samples were continuously measured for each treatment, and the test data were the average value measured throughout the day.
2.3.5. Fluorescence Index
Each growth period was three consecutive days, the tillering period was from 8 to 10 July, the jointing period was from 10 to 12 August, the filling period was from 15 to 18 August. The chlorophyll fluorescence parameters of the leaves were measured using a PAM-2500 FL fluorometer and a 2030B light-adaptive leaf clip (Walz, Nuremberg, Germany). The fluorescence parameters were measured simultaneously with the gas exchange parameters on the same leaf. The maximum fluorescence yield (Fm) and initial leaf fluorescence yield (F0) of the leaves were measured before sunrise. The initial fluorescence yield and the maximum fluorescence yield (Fm) were first determined; Fm and F0 of the corresponding leaves were manually input before the chlorophyll fluorescence parameters were measured. Then, using natural light as the actinic light, the saturation pulse for annihilation analysis was turned on and the fluorescence yield (F’) was determined at a random time and the maximum fluorescence yield (F’m) was measured under light adaptation; the maximum photochemical efficiency (Fv/Fm), PSII potential activity (Fv/F0), Conversion efficiency of PSII open reaction center(F’v/F’m), photochemical quenching coefficient (qp), non-photochemical quenching coefficient (NPQ), actual photochemical efficiency (Y(II)), and apparent electron transport rate (ETR) were calculated. The calculation formula for each fluorescence parameter uses Rohacek’s method [16,17]:
PAR is photosynthetically active radiation, µmol/(m2·s).
Fv = Fm − F0
Fv/Fm = (Fm − F0)/Fm
Fv/F0 = (Fm − F0)/F0
F’v/F’m = (F’m − F’0)/F’m
qp = (F’m − F’)/(F’m − F’0)
NPQ = Fm/F’m − 1
ETR = PAR × Y(II) × 0.84 × 0.5
Y(II) = (F’m − F’)/F’m
2.3.6. Leaf Area Index
Leaf area index (LAI) was measured in the tillering, jointing, filling, and mature stages. Three points were selected randomly in each plot to select representative complete leaves with the same growth potential as standard leaves and measure their length and width. Accordingly, the leaf area was calculated as 0.75 × length × width (the empirical coefficient of maturity was 0.67), after drying and weighing, this was used to convert the whole leaf area to calculate the LAI.
2.3.7. Plant Height Change
The height from the soil surface to the highest leaf tip of each cluster was measured before heading, and the height from the soil surface to the highest ear top (without awn) was measured after heading. Three points were determined in each plot, once in each growth period.
2.3.8. Dynamic Change of Tillering
Three representative acupoints were selected from each plot using fixed-point observation before the third leaf stage (middle membrane, side row, and inter tree), and measured every 5 days near the peak of tillering.
2.3.9. Test of Species and Yield
Three holes were randomly selected from each plot, and the number of effective panicles (the number of panicles with more than 5 grains per panicle), number of spikes per grain (including full grain and empty shriveled grain; empty grain is not grouted completely, and shriveled grain is less than 2/3rds of the filling degree), the number of grains that have fallen off, 1000-grain weight (the average weight of 1000 sun-dried grains taken at random in two repetitions, with the difference between the weight not being greater than 3%), and actual yield after harvest were measured for each treatment.
2.3.10. Evapotranspiration
ET during crop growth was calculated using the water balance method according to Qian [18]:
where ET denotes the evapotranspiration (mm), P is the precipitation (mm), and I is the amount applied water (mm). Cr indicates the amount of groundwater feed (mm), Rf means the surface runoff (mm), Dp testifies the deep seepage (mm), and Ds represents the change of soil water content in the 0 to 40 cm profile (mm). The groundwater depth of the area was deeper than 8 m and had little effect on the experiment. Drip irrigation was supplied at a rate less than the soil infiltration rate and produced no surface runoff or deep seepage. Precipitation during the experimental period was measured daily at the Shihezi Meteorology Station (Figure S2).
ET = I + P + Cr + Dp − Rf − Ds,
The actual yield after harvest were measured for each treatment. WUE was calculated as described by Qian [17]:
where WUE is the crop water use efficiency (kg ha−1 m−3), Y is the rice yield per unit area (kg ha−1), and ETc is the crop water use (m3 ha−1).
WUE = Y/ETc
2.4. Data Processing
Data were calculated using Microsoft Excel 2016, plotted using Origin 2018 (OriginLab, Northampton, MA, USA), and two-way ANOVA and Duncan tests were performed for multiple comparisons between treatments, with a significance threshold of p ≤ 0.05, using IBM SPSS v22 (IBM, Armonk, NY, USA).
3. Results and Analysis
3.1. Chlorophyll Content of Rice under Water Stress
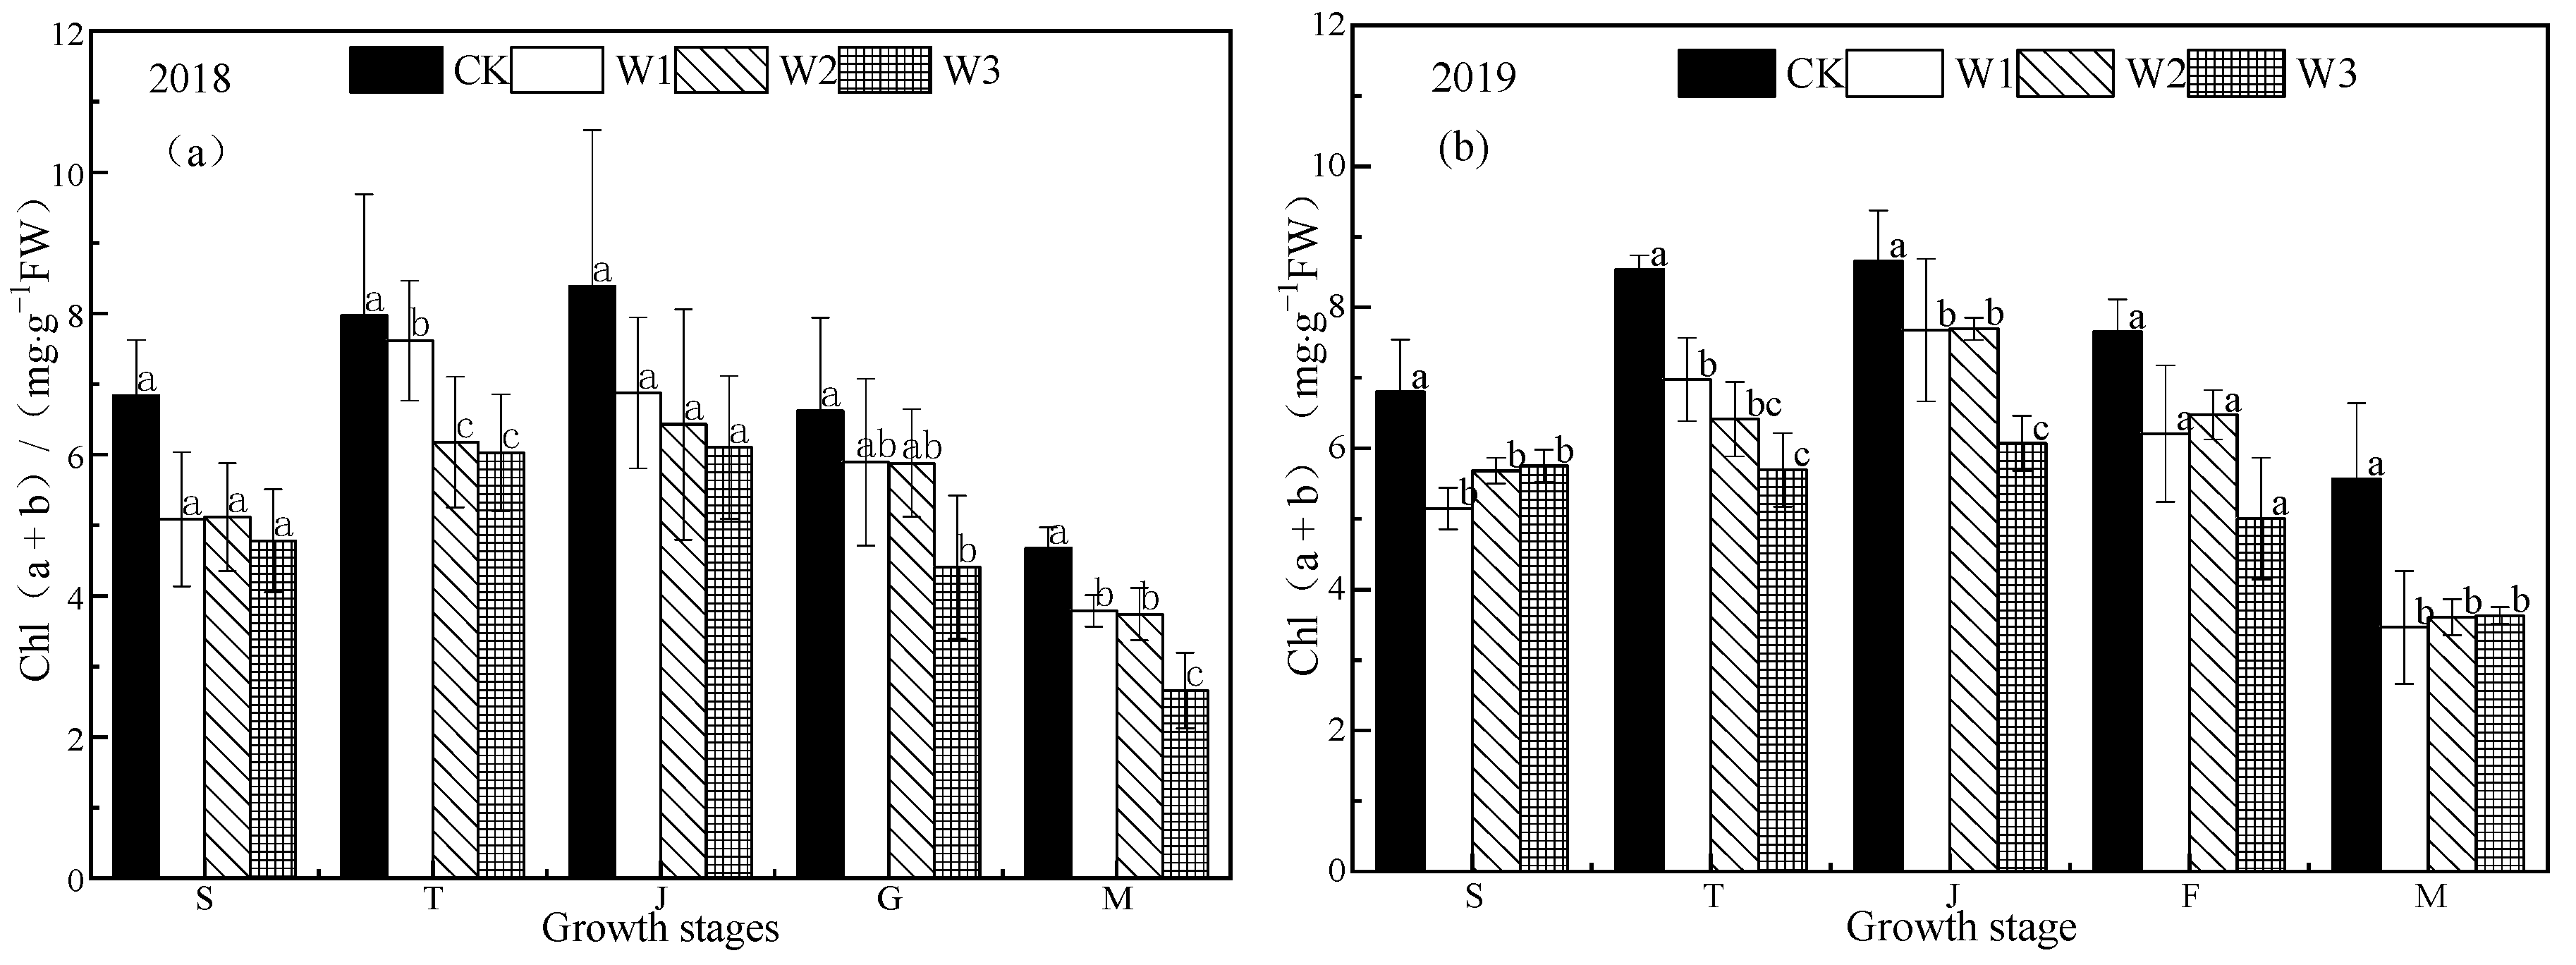
Stress can cause a change in chlorophyll content of plant leaves, and thus a change of photosynthetic function [18]. The chlorophyll content (a + b) of each treatment increased rapidly from the seedling stage to the jointing stage and then decreased gradually (Figure 2). The chlorophyll content of the CK treatment was significantly higher than that of the stress treatments (p < 0.05, they were 4.73%–32.19% and 22.27%–49.65% higher than the others). There was a significant difference in chlorophyll content among the treatments (p < 0.05); the chlorophyll content (a + b) of each treatment reached the maximum value at the jointing stage, W1 and W2 were close, while W3 was significantly lower than the other treatments (p < 0.05). There was no significant difference in chlorophyll content (a + b) between the CK, W1, and W2 treatments at the filling stage (p > 0.05), and no significant difference between stress treatments at the mature stage (p > 0.05).
3.2. Photosynthetic Characteristics of Rice under Different Water Conditions
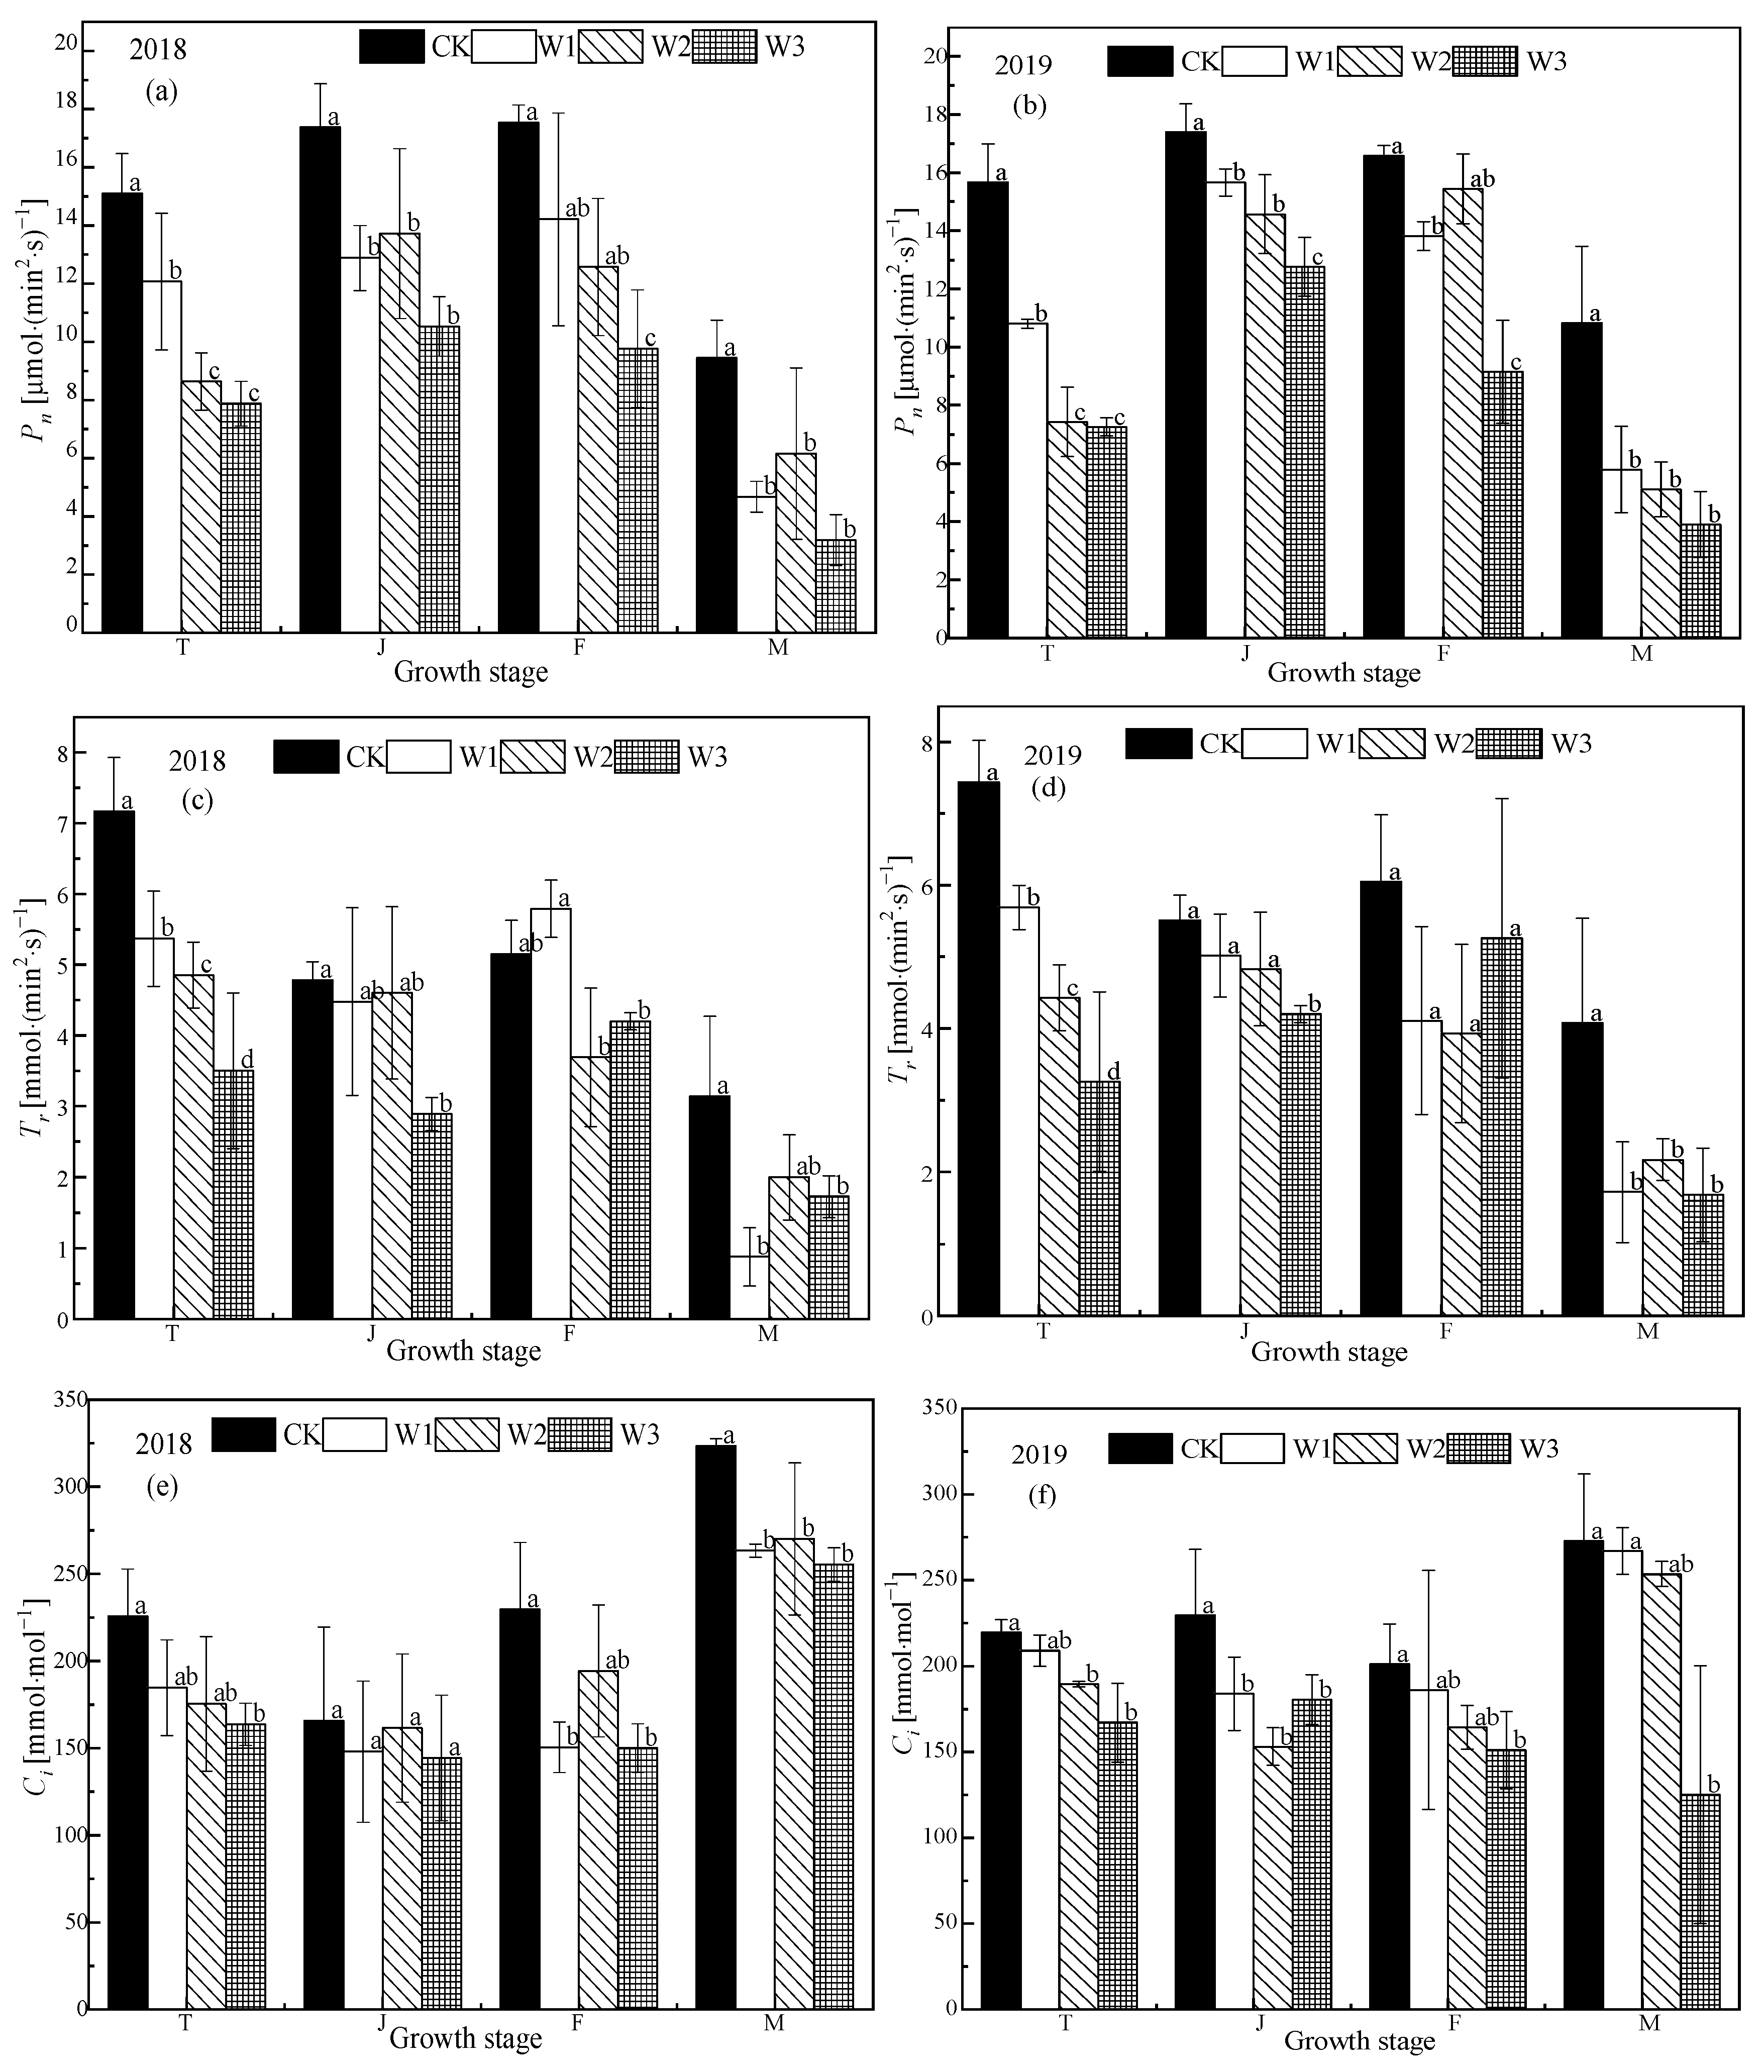
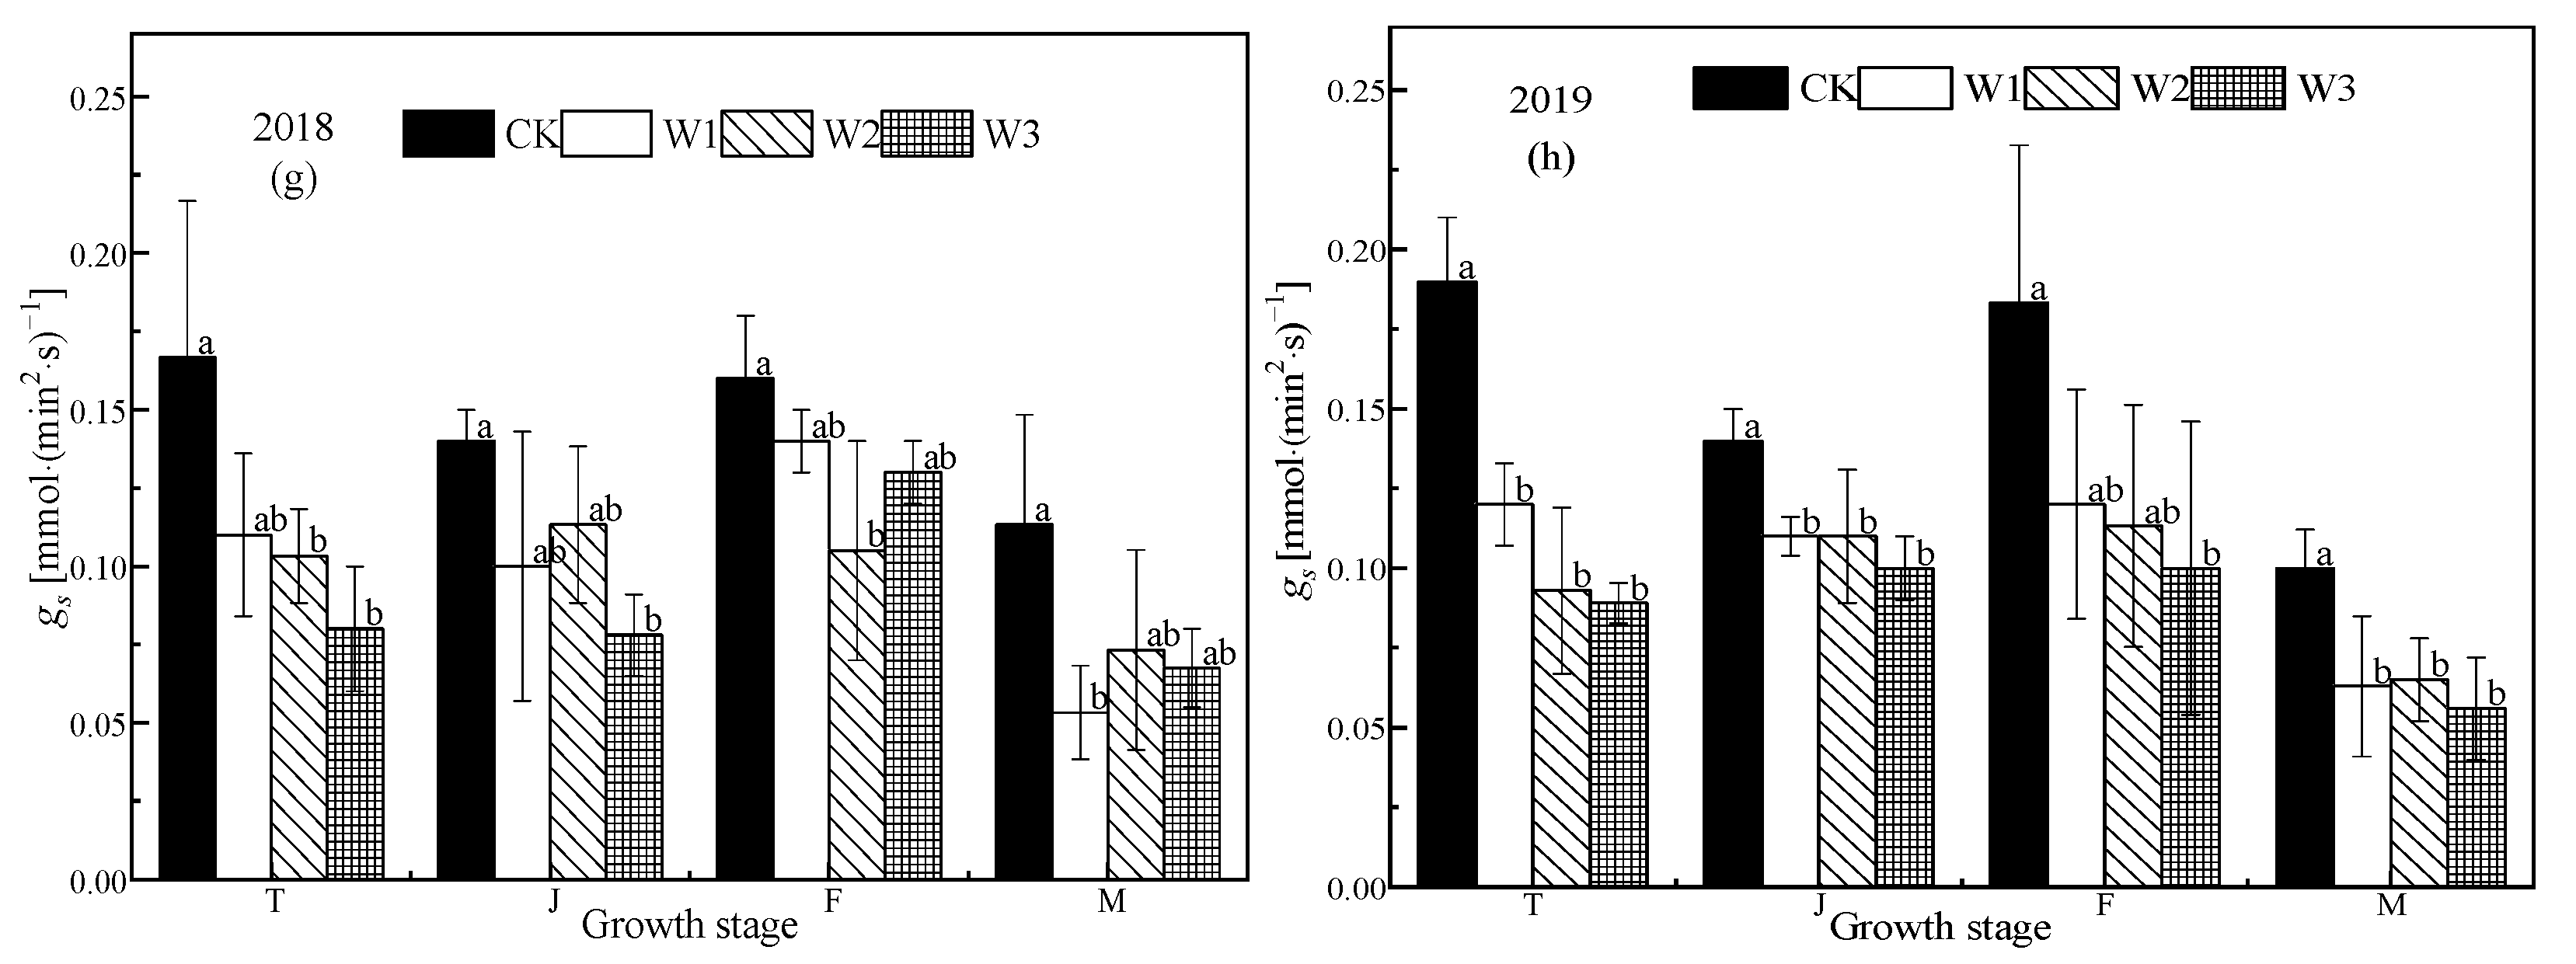
The values of Pn, Tr, gs, and Ci of functional leaves of rice subjected to different water conditions at the tillering stage generally show a trend of first rising and then declining across the growth season (Figure 3). Pn, Tr, gs, and Ci of each treatment decreased significantly with the decrease in soil water content (p < 0.05). Compared with W1 in the tillering stage, Pn of W2 and W3 treatments decreased by 28.50%–34.79%, and 31.26%–32.84%, respectively. Tr decreased by 9.68%–34.82% in the W2 treatment compared to the W1 treatment, and by 22.17%–42.71% in the W3 treatment. Stomatal conductance (gs) decreased by 6.09%–27.27% in the W2 treatment compared the W1 treatment, and by 22.50%–25.83% for the W3 treatment. Ci decreased by 5.06%–11.37% in the W2 treatment compared to the W1 treatment, and by 9.29%–10.49% for the W3 treatment. The Pn of the CK treatment was significantly higher than that of the stress treatments (p < 0.05), There was no significant difference between W1 and W2, but W3 was significantly lower than the other treatments (p < 0.05). In 2018, the Pn of W2 was 6.52% and 30.29% higher than that of W1 and W3, respectively, similarly, Tr was 2.68% and 59.17% higher, gs was 13.30% and 45.26% higher, and Ci decreased by 9.12% and 11.89%. In 2019, the Pn of W1 was 7.48% and 22.72% higher than that of W2 and W3, respectively, similarly, Tr was 3.93% and 19.52% and gs was 0.00% and 10.00% higher, while Ci decreased. There was no difference in Pn between CK, W1 (p < 0.05), and W2, while W3 was significantly lower than the other treatments (p < 0.05).
The results of the correlation analysis between the parameters and the chlorophyll index showed that Pn was positively correlated with gs and Tr (p < 0.05, p < 0.05), and Pn was significantly positively correlated with Chl (a + b) (p < 0.01) (Table 3).
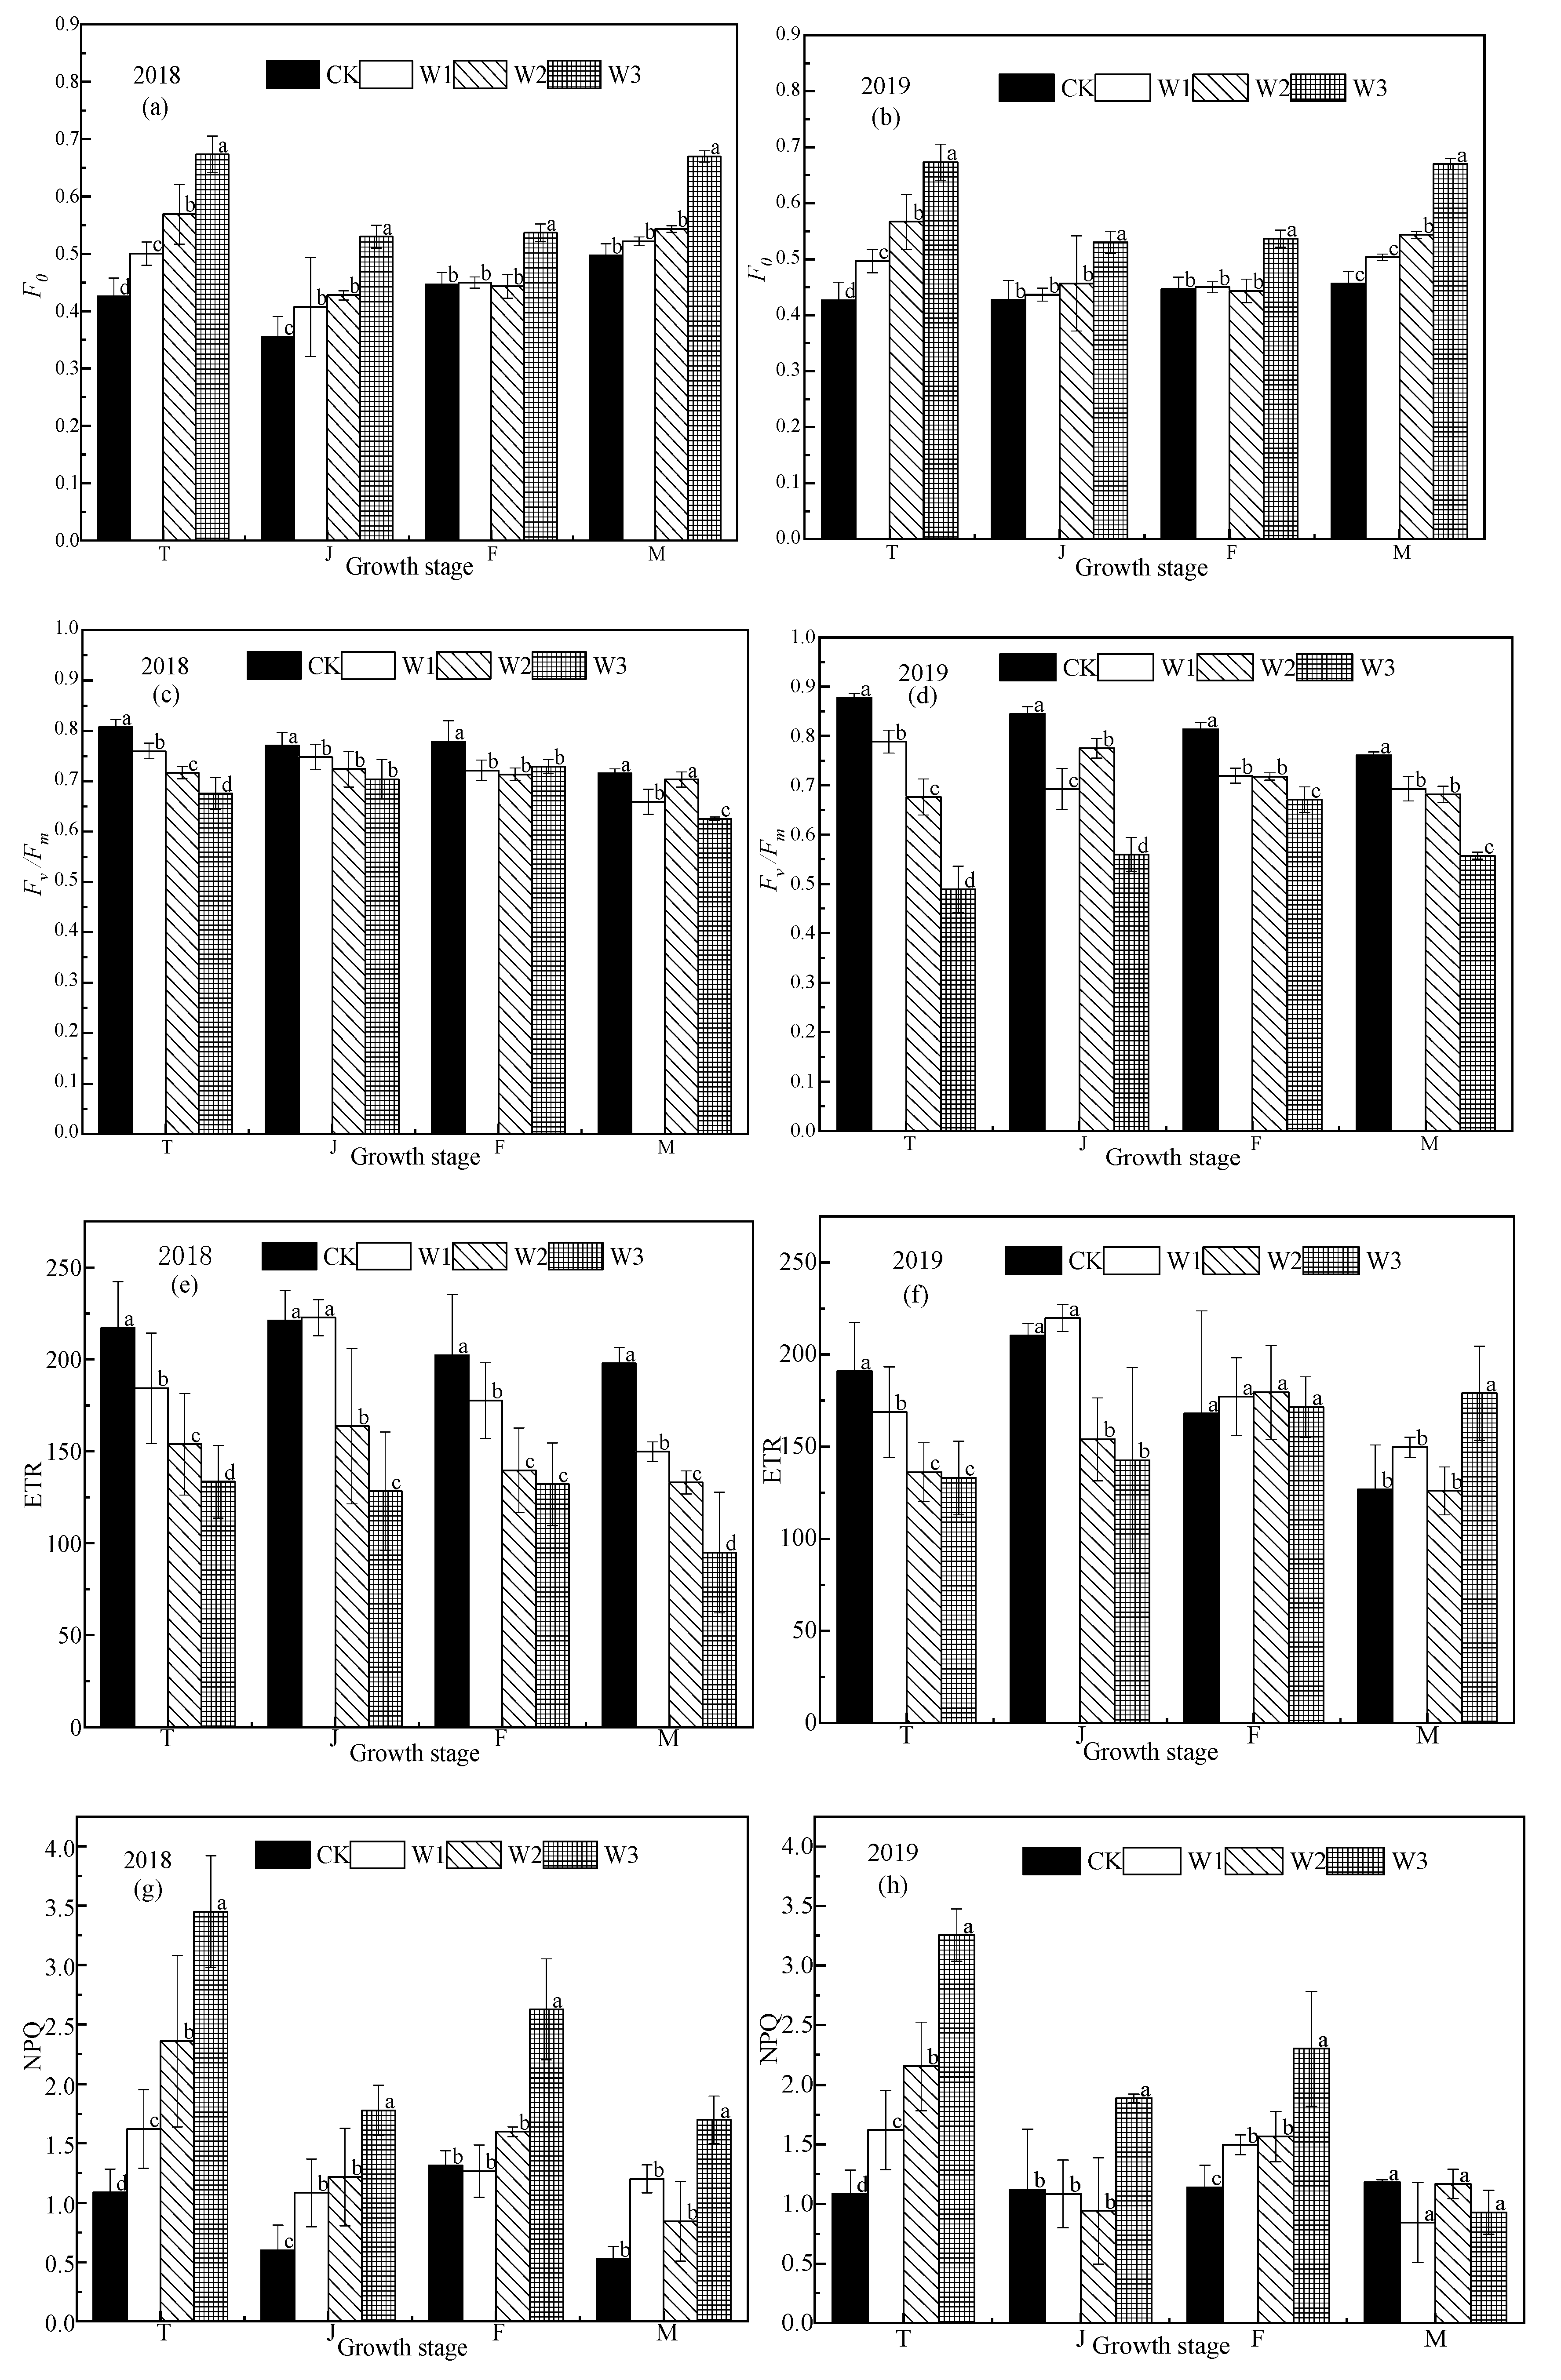
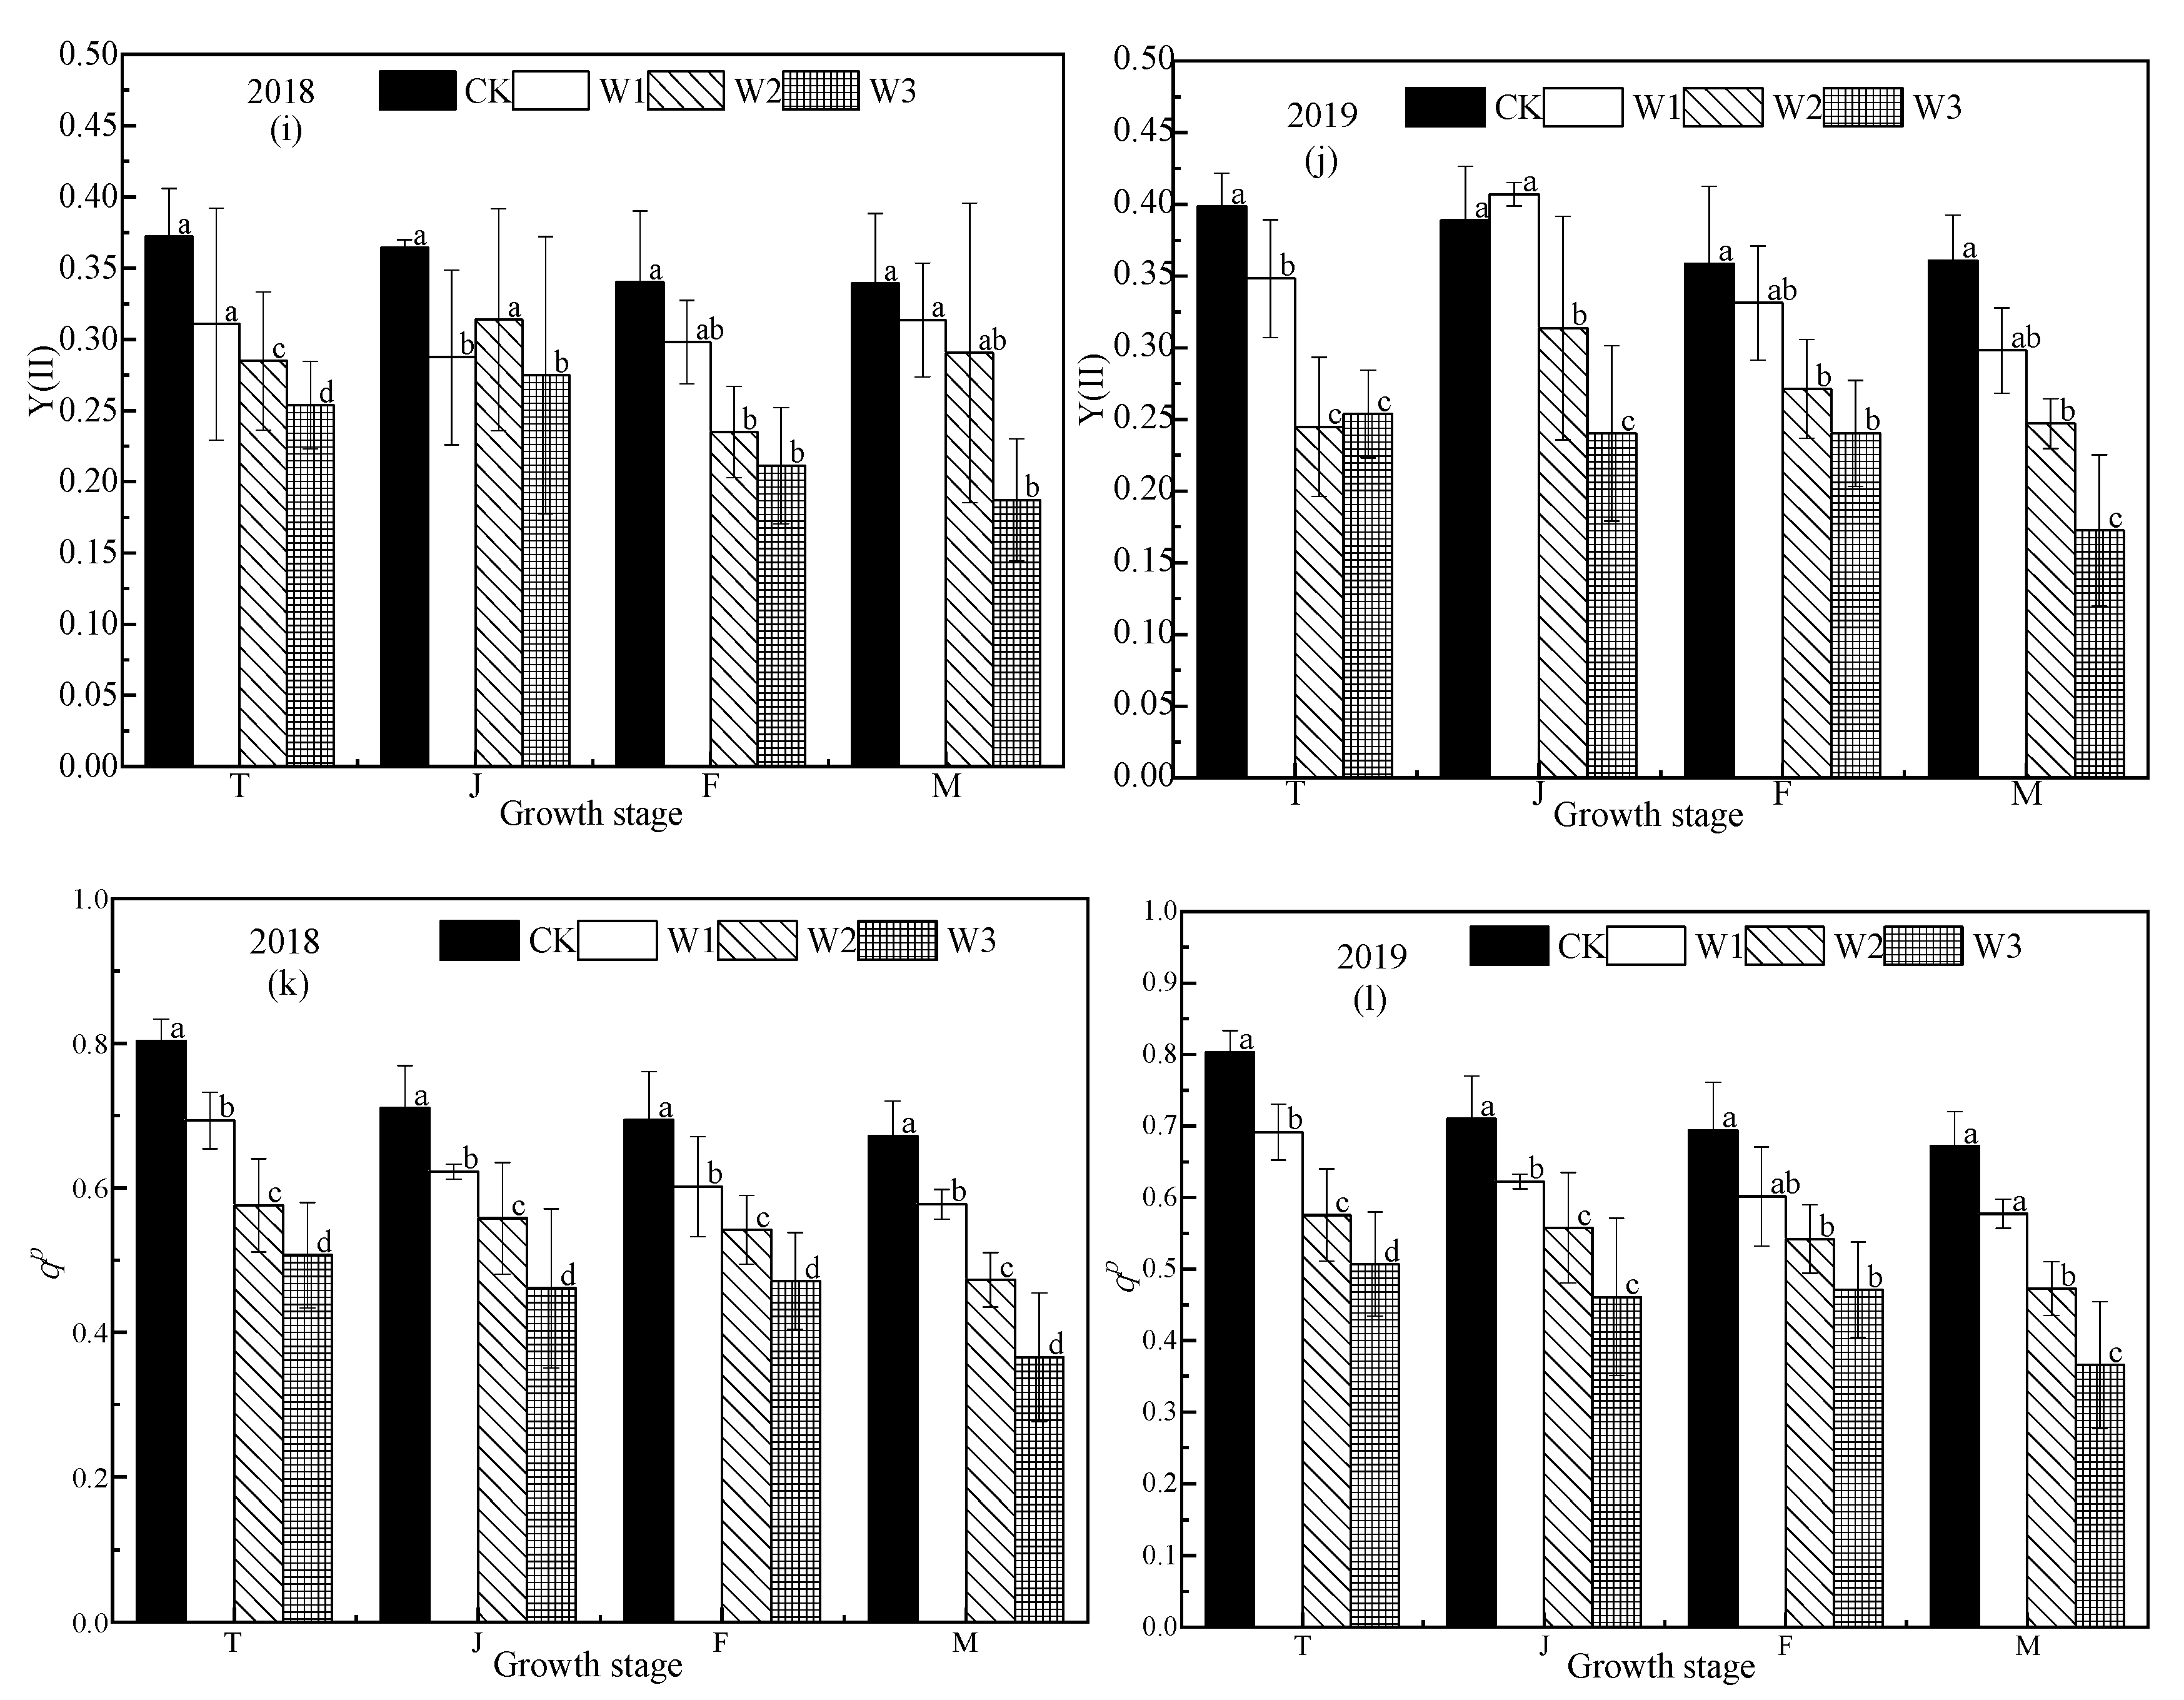
3.3. Fluorescence Parameters of Rice under Different Water Conditions
Chlorophyll fluorescence parameters can reflect a series of important regulation processes in photosynthetic mechanisms, to a certain extent [19]. In the rice growing season, the values of F0 and NPQ for the CK treatment were significantly lower than that of the stress treatments, while the values of Fv/Fm, ETR, Y(II), and qp were significantly higher than those of the stress treatments, and the fluorescence parameters of the CK treatment had little change over the whole growth period (Figure 4). In the tillering stage, the values of F0 and NPQ increased with the decrease in soil water content, especially in the W3 treatment, which was significantly higher (p < 0.05); the Fv/Fm values of rice leaves in each stress treatment decreased significantly compared with the CK treatment (p < 0.05). Among them, the Fv/Fm value of the W3 treatment decreased the most, which indicates that the PSII reaction center of the rice leaves had been damaged by drought stress, and their potential activity and primary light energy conversion efficiency were obviously weakened, so photoinhibition of photosynthesis occurred in the plants. The values of qp, Y(II), and ETR decreased significantly with decreasing soil moisture content, while NPQ increased significantly.
When the photoinhibition is not serious, photosynthetic function can be restored in a few minutes or hours after returning to unstressed conditions. When the photoinhibition is serious, the photosynthetic function cannot be fully restored for a few days after returning to the appropriate condition [20]. The Fv/Fm, ETR, Y(II), and qp values of the jointing stage stress treatments increased, but there was not a significant difference between the W1 and W2 treatments (p > 0.05), the W3 treatment was significantly lower. The F0 and NPQ values of the jointing stage stress treatments decreased significantly, while the W3 treatment was significantly higher than the other treatments (p < 0.05).
Correlation analysis of chlorophyll fluorescence parameters and photosynthesis in drip irrigated rice shows that Pn is significantly positively correlated with Fm, Fv/Fm, Fv/F0, and Y(II) (Table 4; p < 0.05). Pn is positively correlated with qp and NPQ (p < 0.01) is not correlated with F’v/F’m, but is negatively correlated with F0.
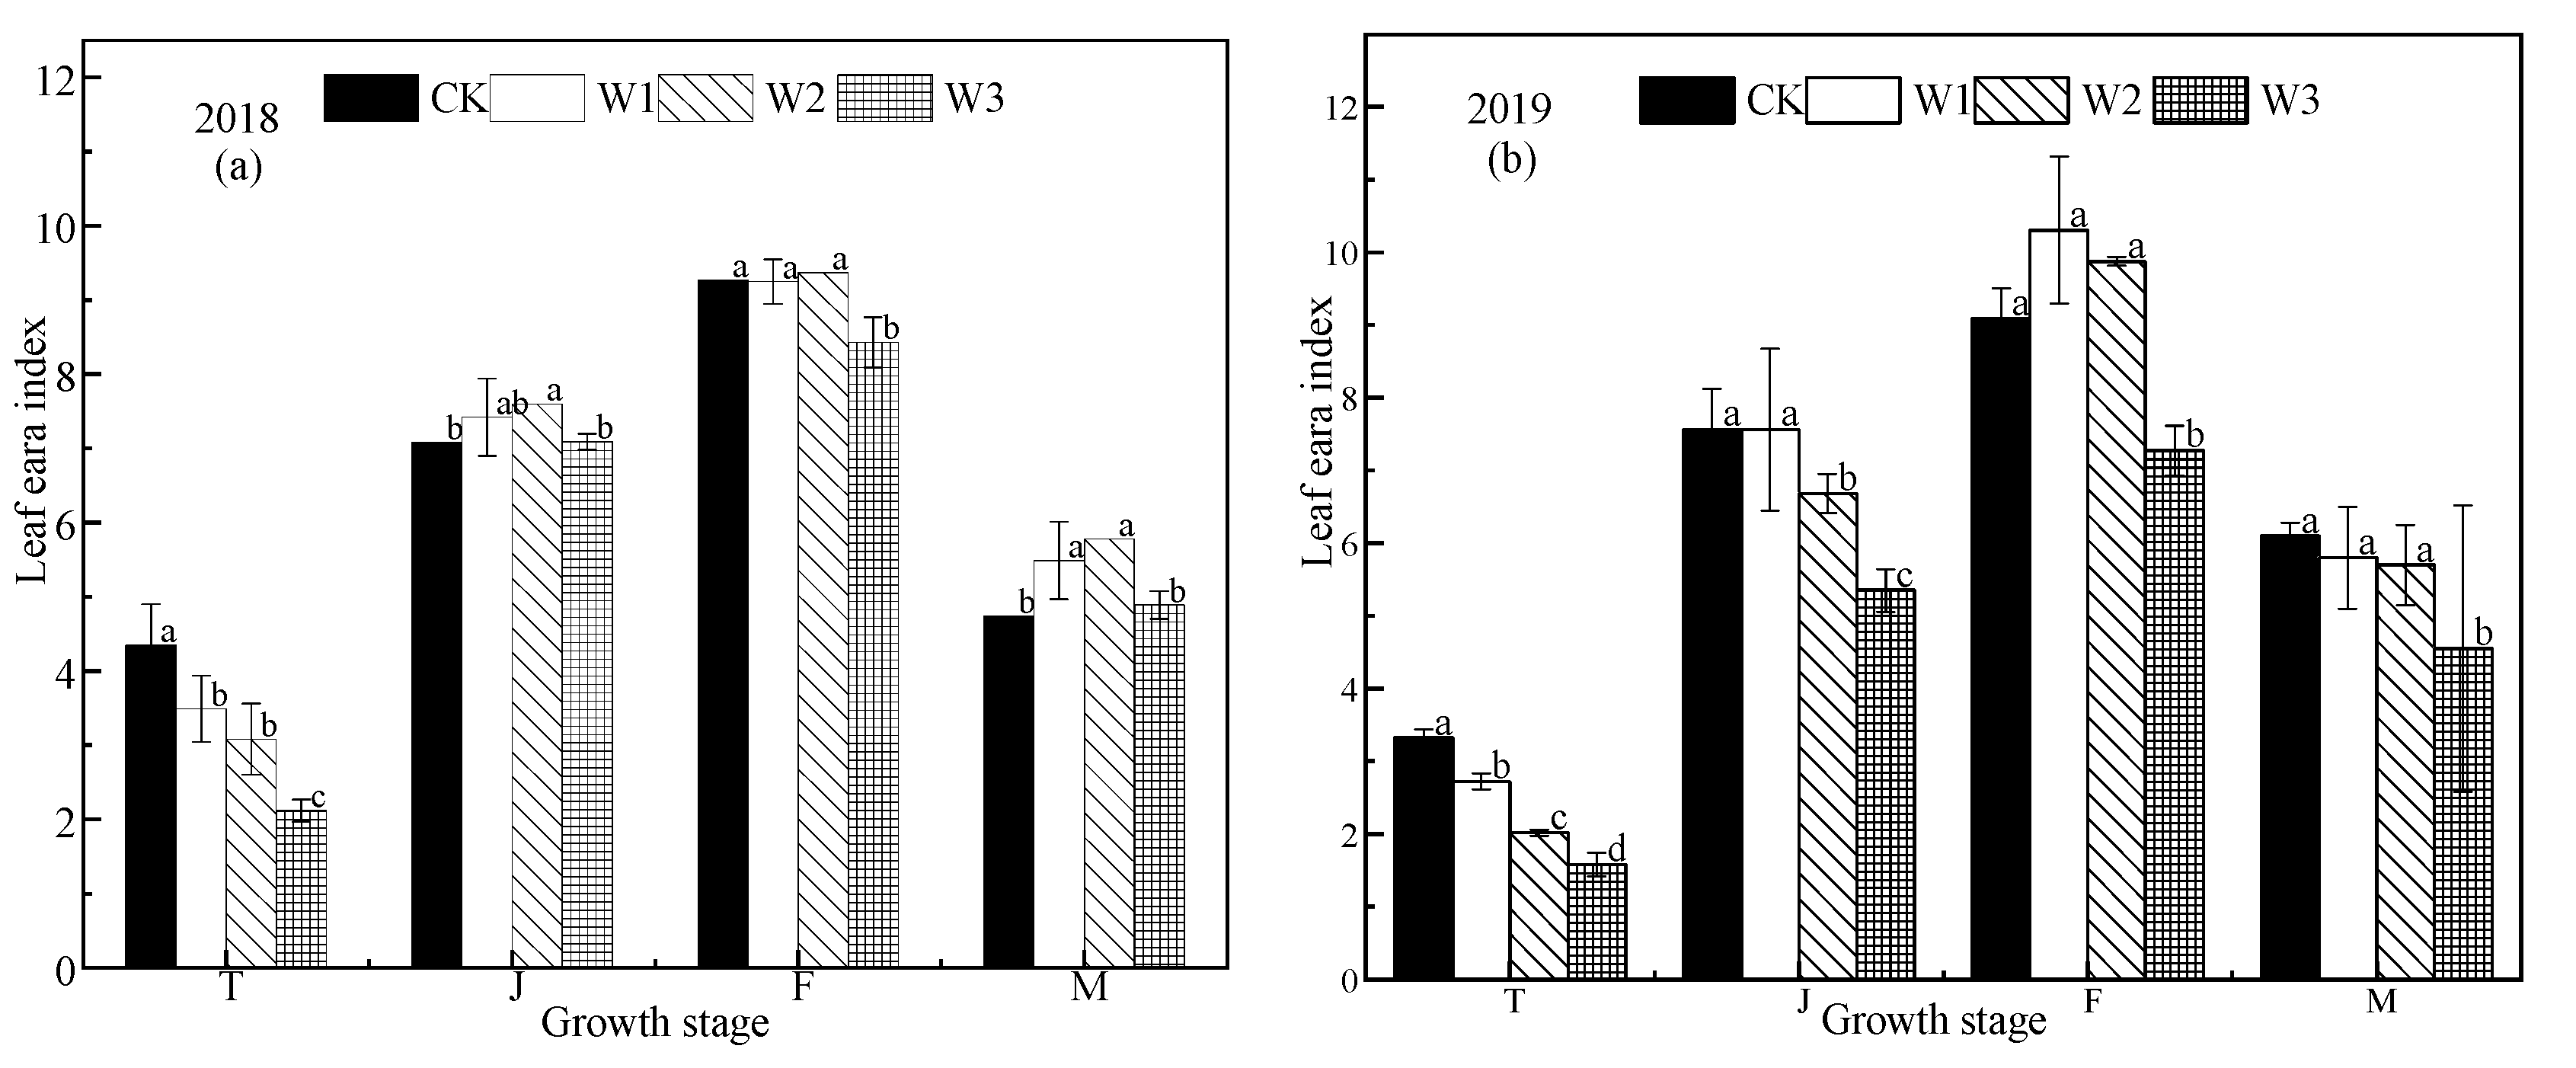
3.4. Effect of Different Water Conditions on Rice Growth
The LAI value of rice first increases and then decreases across the growing season (Figure 5). In the tillering stage, drought stress had a significant effect on LAI, with the LAI of the CK treatment being significantly higher than that of the other treatments, and the LAI of stress treatments decreasing with decreasing of soil water content. In the jointing stage, the LAI of the CK treatment was higher than that of the stress treatments, but the difference was not significant. Each treatment reached the peak of LAI in the filling stage (Figure 5a,b), where the LAI of the CK treatment was 9.09 and 9.27 in 2018 and 2019, respectively, that of the W1 treatment was 9.25 and 10.30, respectively, that of the W2 treatment was 9.37 and 9.87, respectively, while that of the W3 treatment was 7.27 and 8.43, respectively. There was no difference between the CK, W1, and W2 treatments, but the W3 treatment was significantly lower than the other treatments. In the grouting period in 2018, the W2 treatment had the largest LAI, followed by W1, followed by W3 and the CK treatment, while in 2019, W1 was the highest, followed by W2, W3, and the CK treatments. There was no significant difference among the three stress treatments (p > 0.05).
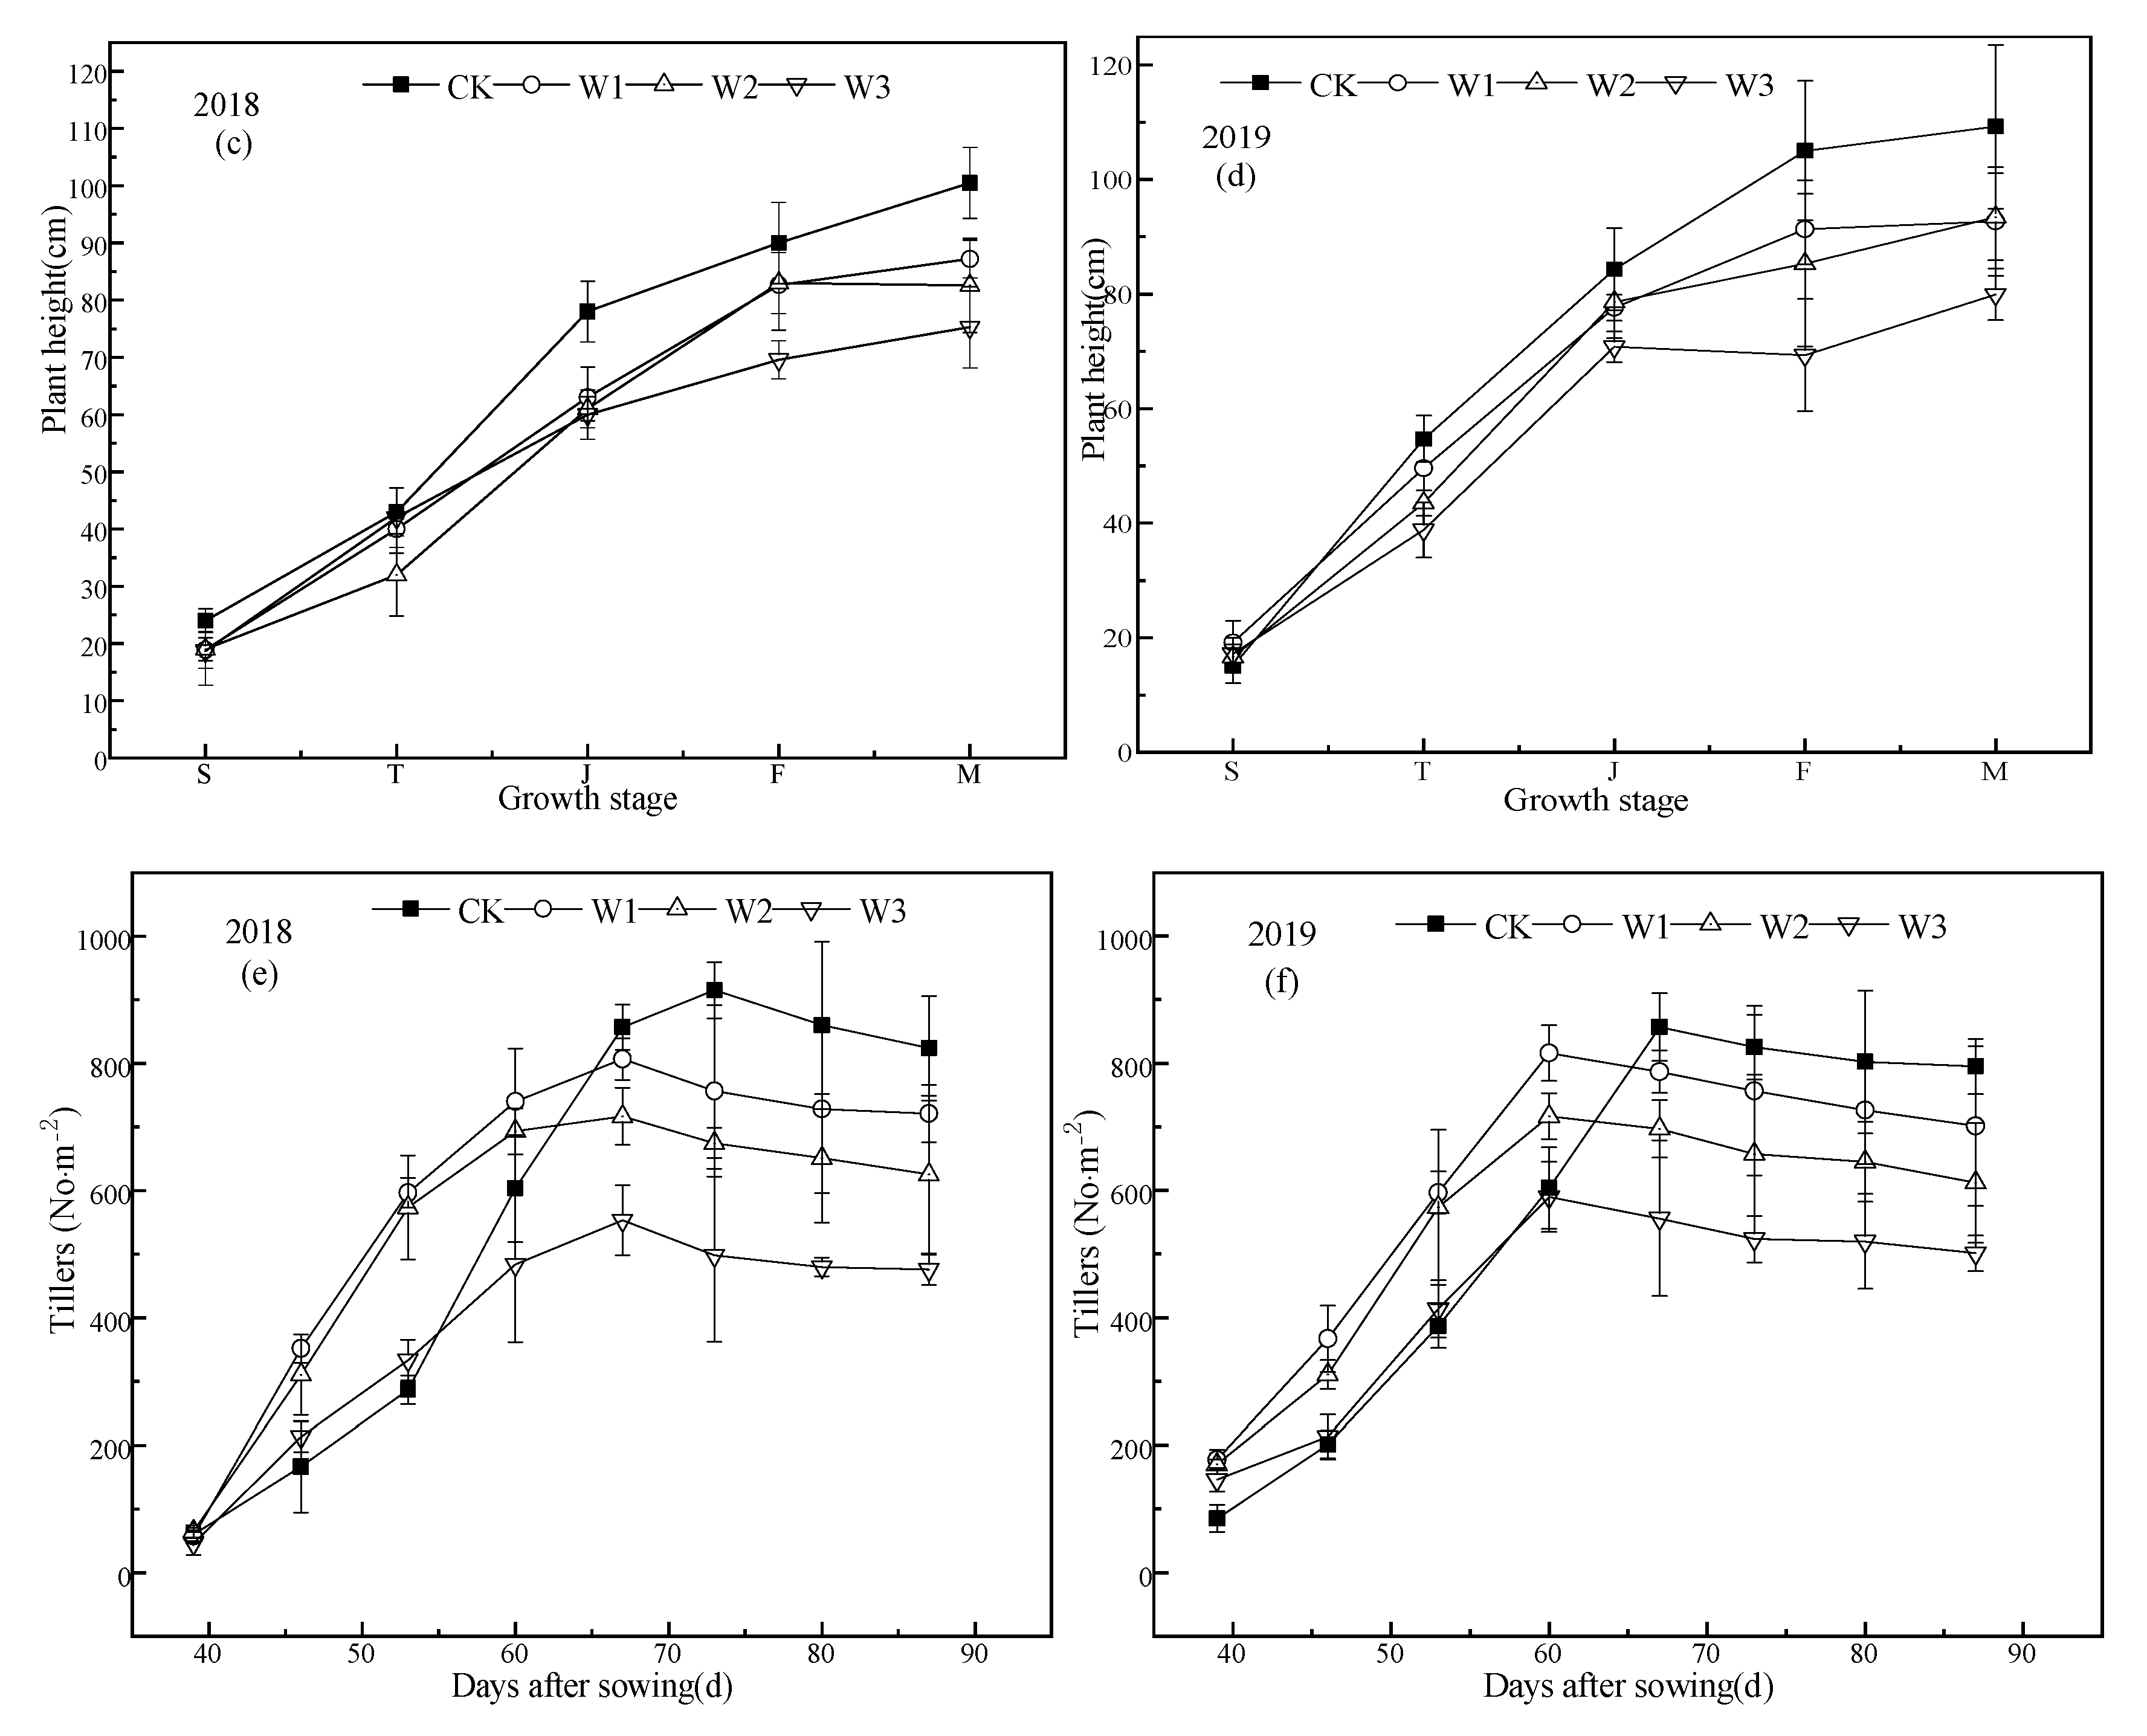
Plant height across all growth periods was similar between treatment, and plant height increased with time (Figure 5c,d). The growth rate increased rapidly from the seedling to jointing stage and slowed down after the jointing stage. Plant height of the mature stage was significantly higher in CK than the other treatments, there was not a significant difference between W1 and W2, and plant height in W3 was significantly lower than the other treatments. The results showed that drought stress at the tillering stage had a great effect on plant height, and plant height changed significantly under different water conditions. The W1 and W2 treatments had little effect on plant height at the tillering stage, and the W3 treatment seriously reduced plant height.
Tillering trends were the same in both years; tillering starts approximately 40 days after sowing and reaches the maximum tillering number at 60–70 days, and then decreases slowly (Figure 5e,f). In the period of 40–67 days after sowing, the tillering rate of stress treatment was significantly higher than that of CK treatment (except W3), but in the period of 67–90 days after sowing, the tillering rate of CK treatment was much higher than that of stress treatment. Therefore, in 2018, the highest number of tillers in the stress treatments and CK treatment occurred at 67 and 73 d after sowing, respectively, and in 2019, the highest number of tillers in the stress treatments and CK treatment were 60 and 67 d after sowing, respectively.
The number of tillers in each treatment in 2018 was slightly higher than that in 2019, and there was a significant difference in the number of final tillers between treatments. The average final tiller number was 809.62 for CK, 711.11 for W1, 618.61 for W2, and 494.21 for W3. The final tiller number was calculated as the number of tillers produced by the main stem, the CK treatment was 2.53 tillers per main stem, the W1 treatment had 2.22 tiller per main stem, the W2 treatment had 1.93 tiller per main stem, and the W3 treatment had 1.54 tiller per main stem. The tillering rate of each treatment was significantly different, and the decrease in soil moisture content at the tillering stage resulted in a decrease in the final tillering amount (rate).
3.5. Comparison of Rice Yield under Different Water Conditions
The effect of water stress on rice growth is ultimately reflected in rice yield, which is a special reflection of rice physiological mechanism under water stress [15]. Water stress at the tillering stage will reduce rice yield, and the extent of reduction will increase with the decrease of soil water potential. The highest yield of CK treatment was 8478.36 kgha−1, the yield of W1 and W2 were 6481.39 kg ha−1, 6443.44 kg ha−1, respectively, and that of W3 treatment was only 5135.84 kg ha−1. The maximum water consumption of CK treatment was 33,771.01 m3 ha−1. Compared with CK treatment, the water consumption of W1, W2, and W3 treatment decreased by 52.28%, 55.24%, and 58.43%, respectively, and the water use efficiency (WUE) of CK treatment was only 0.25 kg m−3. The water use efficiency of stress treatment increased 62% (W1), 72% (W2), and 46% (W3), respectively.
In terms of yield components, the main reasons for the decrease of yield under drought stress are the significant decrease of effective panicle number, seed setting rate, and 1000-grain weight (Table 5). The highest effective panicle number of CK treatment is 639.87 panicles / m2, which is 9.43%, 15.27%, and 67.30% higher than that of W1, W2, and W3 treatment respectively. The highest ear rate of W2 was 77.54%, which was 5.21%, 4.10%, and 10.53% higher than CK, W1, and W3 respectively. The seed setting rate of each treatment was 83.49% (CK), 82.93% (W1), 81.76% (W2), and 80.06% (W3), respectively. The positive correlation between 1000-grain weight and seed setting rate was CK > W1 > W2 > W3.
The correlation analysis (Table 6) of rice yield and yield components (Table 5) shows that the yield of rice has a very significant positive correlation with the number of effective panicles, 1000-grain weight, and water consumption (p < 0.01). The yield has a significant positive correlation with the seed setting rate (p < 0.05), and positive, but not significant, correlation with the number of grains per panicle and the completion rate (p > 0.05). There was a significant positive correlation between water consumption and effective panicle number and 1000-grain weight (p < 0.01), and a significant positive correlation between yield and seed setting rate (p < 0.05). There was a negative but not significant correlation between water consumption and ear rate (p > 0.05).
4. Discussion
Sun et al. [21] pointed out that drought stress can significantly reduce the chlorophyll content of plants, and the higher the degree of stress, the greater the decrease. The results of this study showed that the chlorophyll content of rice decreased continuously under drought stress in the tillering stage. The chlorophyll content decreased in proportion with decreasing soil moisture content (CK > W1 > W2 > W3), and all treatments were significantly different from each other. Hu [22] argued that total chlorophyll content was positively correlated with the net photosynthetic rate of the sword leaf. Our results showed that the lower the chlorophyll content, the lower the photosynthetic rate. Under drought stress, if the chlorophyll content of functional leaves remains at a high level, it indicates that the function and structure of the photosynthetic organs are relatively intact [23,24]. This is the basis of the overcompensation effect of increasing chlorophyll content and photosynthetic rate of leaves significantly after rehydration under drought stress. The results of this experiment were consistent with those of our predecessors. The chlorophyll content of the CK treatment was significantly higher than that of the stress treatments. After rewatering, the chlorophyll (a + b) content of the W1 and W2 treatment recovered to a higher level; there was no significant difference between the W1 and W2 treatments, but the W3 treatment was significantly lower than that of other treatments.
Photosynthetic and chlorophyll fluorescence parameters can be used as indicators to judge the degree of rice drought quickly and accurately [25]. When drought stress occurs, the water content in crops decreases, stomatal resistance increases, transpiration decreases, and photosynthetic rate decreases [26]. Our results showed that with the decrease in soil water content, Pn and Tr of each treatment decreased significantly (p < 0.05). Pn was higher in W1 than in W2, while W3 was the lowest. There is a physiological compensation effect of water stress on the photosynthetic and fluorescence characteristics of rice leaves in the tillering stage [27]. The Pn of the CK treatment was significantly higher than that of the other treatments. This shows that the W2 treatment has a better compensation effect on the photosynthetic rate of rice leaves, which is consistent with the assertion of Liu et al. [28] that water stress often has a better compensation effect at the early stages of vegetative or reproductive growth.
Jones et al. [29] believed that Ci and Pn values could be used as indicators to determine whether photosynthesis is limited by stomatal closure or metabolic damage. Our results showed that the decrease in stomatal conductance caused by partial closure of stomata in the CK, W1, and W2 treatments was the main reason for the decrease in photosynthetic rate, which was mainly manifested by the decrease of Pn and the increase of Ci. The W3 treatment was not limited by the stoma. The gs value and Pn value of each treatment had good synchronization, which showed that they decreased with the decrease in water content, and both the Pn and gs values recovered after rewatering, with the W1 and W2 treatments having a high recovery level. This indicated that the photoinhibition was not permanent under the W1 and W2 water treatments, but it was permanent under the water condition experienced by the W3 treatment.
When the soil water potential decreased, the F0 value increased rapidly, which may cause rice to be inhibited by light [30]. Our results showed that with the increase in water shortage, the increase in F0 became larger, and the increase in F0 was the most obvious under in the W3 treatment. This indicated that photoinhibition was less in treatments W1 and W2, while the PSII of rice might be damaged under the water conditions in treatment W3. The Fv/Fm value may reflect the potential maximum photosynthetic capacity of plants; higher plants generally range from 0.80 to 0.84, and Fv/Fm change under the unstressed conditions is very small, but it is significantly reduced under stress [31]. Our results showed that the Fv/Fm values of the CK, W1, and W2 treatments were all around 0.80, which indicated that W1 and W2 were under less water stress, while W3 was under more water stress. The chlorophyll fluorescence parameter is an important index to study the photosynthetic physiological state of plants. The initial plant damage caused by stress during photosynthesis is closely related to PSII [31]. Our results showed that qp and Y (II) of rice leaves decreases under water stress, while NPQ was significantly higher, indicating that the photosynthetic electron transport activity of rice leaves decreases under water stress, and more light energy is absorbed and dissipated through non-photochemical pathways, revealing the self-protection mechanism of rice leaves. The decrease in photochemical efficiency makes NPQ increase, and the excess light energy cannot be used for photosynthetic electron transfer and heat dissipation. The absorbed light energy accumulates in the local part of the optical system, causing damage to the PSII structure and the decrease of photochemical activity in the reaction center, which is consistent with previous research [32,33].
Rice plant height is an important agronomic character that affects its yield. Zhao et al. [34] believed that water-saving irrigation could help to control plant height in rice and reduce plant height at maturity. At the tillering stage, water stress reduced plant height, consistent with previous research [35]. Lei et al. [36] pointed out that under controlled irrigation at the tillering stage, the net photosynthetic rate and leaf area index at later growth stages can be increased by moderate drying in the sun. Our results showed that drought stress at the tillering stage inhibited senescence of rice leaves under light and moderate (W1, W2) drought stress, and maintained a higher leaf area index. Moreover, recovering ability is strong after rewatering, which maintains a larger leaf area for the changes in photosynthetic rate and leaf area index at the flowering and milk stage of the panicle. This indicates that rewatering at the tillering stage delays the senescence of leaves at the later stages, prolonging the photosynthetic time of the leaves, and is conducive to the accumulation of photosynthetic products and improved final yield. This may be related to the activity of Superoxide dismutase, Peroxidase, catalase, and other enzymes in the plant, which increase the ability to scavenge active oxygen [37,38].
Xu et al. [39] asserted that striving for early tillering and increased numbers of tillers are significant factors in improving the number and quality of the spikes and cultivating a high-yield population. Our results showed that the lower the soil water content, the lower the maximum tiller amount. In addition, the rate of early tillering was accelerated, and the peak of tillering occurred about one week earlier than in the CK treatment. Final tillering was higher in the W1 and W2 treatments, but the water condition was limited; the formation of grain yield may be limited by the lack of raw material supply [40], resulting in significantly lower yields than the CK treatment. In the W3 treatment, the early rate of rice growth was accelerated and the time to reach the highest tillering amount was faster, but the number of tillering ears was fewer, which resulted in serious reductions in yield. In the early stage of the CK treatment, the tillering rate was slow, and the contradiction between carbohydrate supply and demand increased after entering the ear differentiation stage, resulting in a large number of tillers dying and a lower final ear rate [41], large ears, and the highest yield. Huang et al. [42] argued that the number of panicles per unit area of super hybrid rice had a significant positive correlation with the yield, and was the largest contributor to yield. This is consistent with the results of our study. Under the conditions used in this experiment, the yield was positively correlated with the number of effective panicles, 1000-grain weight, and water consumption. The CK, W1, and W2 treatments had higher numbers of effective panicles and could maintain higher photosynthetic leaf area in the later growth stages, thus improving grain yield.
5. Conclusions
Rice has a strong self-regulation ability during and after drought treatment in the tillering stage. Different degrees of drought stress had a significant effect on photosynthetic characteristics and yield of rice. After rewatering, the chlorophyll content (a + b) of the W2 treatment recovered to a higher level, and the photosynthetic rate of the W2 treatment had a better compensation effect and higher photosynthetic efficiency. The water conditions used in the W2 treatment are more suitable for the tillering stage; inhibiting leaf senescence can maintain a higher leaf area index under drought stress. Moreover, the ability to recover after rehydration was strong, which is more conducive to the accumulation of photosynthetic products and the formation of good final yields. The change in photosynthetic rate and leaf area index under drought stress during the tillering stage of drip irrigated rice maintained a larger leaf area at the flowering and milk stage of the panicle, which indicated that the rehydration after the drought delayed the senescence of the leaves at the later stages, prolonged the photosynthetic time of the leaves, and was conducive to the growth and filling of panicles. The grain yield of all stress treatments was significantly lower than the CK treatment, but WUE was 1.40–1.72 times that of the CK treatment. Among the three stress treatments, the highest water-use efficiency occurred in the W2 treatment, at 0.43 kg m−3. When upscaling this process, the compensation effect of drought stress should be considered when regulating water in the rice tillering stage. Water control in the W2 treatment at the tillering stage is conducive to the improvement of water-use efficiency of drip irrigated rice, so as to achieve the goal of high quality, high yield, and high efficiency.
Supplementary Materials
The following are available online at https://0-www-mdpi-com.brum.beds.ac.uk/2073-4441/12/1/289/s1, Figure S1: The experiment took place in (a) China, in (b) Xinjiang in (c) the oasis agroecosystem at (d) the Erlian Key Laboratory of Modern Water Saving Irrigation Corps. Figure S2: Average daily temperature and rainfall of rice in the growth period of the Shihezi region in (a) and (b).
Author Contributions
T.L. and X.M. provided the idea of the study and writing of the manuscript, Q.X. conducted the data analysis, M.B., Z.W. and J.N. provided important advice on the concept of the methodology. All authors have read and agreed to the published version of the manuscript.
Funding
This research received no external funding.
Acknowledgments
We acknowledge the financial support from NSFC (51569033); NSFC (51669030).
Conflicts of Interest
The authors declare no conflict of interest.
References
- Zubaer, M.A.; Chowdhury, A.K.M.M.; Islam, M.Z.; Ahmed, T.; Hasan, M.A. Effects of water stress on growth and yield attributes of aman rice genotypes. Int. J. Sustain. Crop Prod. 2007, 2, 25–30. [Google Scholar]
- Shao, X.W.; Chang-Chun, R.; Zhao, L.P. Effects of water stress on growth and yield of rice in tillering stage. J. Jilin Agric. Univ. 2005, 26, 237–241. [Google Scholar]
- Belder, P.; Spiertz, J.H.J.; Bouman, B.A.M.; Tuong, T.P. Nitrogen economy and water productivity of lowland rice under water-saving irrigation. Field Crops Res. 2005, 93, 169–185. [Google Scholar] [CrossRef]
- Xu, J.; Bai, W.; Li, Y.; Wang, H.; Yang, S.; Wei, Z. Modeling rice development and field water balance using aquacrop model under drying-wetting cycle condition in eastern China. Agric. Water Manag. 2019, 213, 289–297. [Google Scholar] [CrossRef]
- Flowers, T.J. Breeding for salinity resistance in crop plants: Where next? Aust. J. Plant Physiol. 1995, 22, 875–884. [Google Scholar] [CrossRef]
- Haibing, H.; Fuyu, M.; Ru, Y.; Lin, C.; Biao, J.; Jing, C.; Hua, F.; Xin, W.; Li, L. Rice Performance and Water Use Efficiency under Plastic Mulching with Drip Irrigation. PLoS ONE 2013, 8, e83103. [Google Scholar]
- Tabbal, D.F.; Bouman, B.A.M.; Bhuiyan, S.I.; Sibayan, E.B.; Sattarc, M.A. On-farm strategies for reducing water input in irrigated rice; case studies in the philippines. Agric. Water Manag. 2002, 56, 93–112. [Google Scholar] [CrossRef]
- He, H.B.; Yang, R.; Wu, L.Q.; Jia, B.; Ma, F.Y. The growth characteristics and yield potential of rice (Oryza sativa) under non-flooded irrigation in arid region. Ann. Appl. Biol. 2016, 168, 337–356. [Google Scholar] [CrossRef]
- Zhao, H.W.; Wang, X.P.; Yu, M.F.; Sha, H.J.; Jia, Y.; Yu, T.C.; Zou, D.T. Effect of drought stress and rewatering on antioxidant system and proline in rice during tillering stage. J. Northeast Agric. Univ. 2016, 47, 1–7. (In Chinese) [Google Scholar]
- Shimono, H.; Okada, M. Plasticity of rice tiller production is related to genotypic variation in the biomass response to elevated atmospheric CO2 concentration and low temperatures during vegetative growth. Environ. Exp. Bot. 2013, 87, 227–234. [Google Scholar] [CrossRef]
- Xu, J.Z.; Peng, S.Z.; Wei, Z. Effect of soil moisture regulation during tillering period on shoot dynamics of rice cultivated in plastic film mulched dryland and its simulation. J. Hohai Univ. 2010, 38, 511–515. (In Chinese) [Google Scholar]
- Tabassum, M.A. The Mechanism of Declined Photosynthesis and Hydraulic Conductivity under PEG Induced Water Deficit Stress in Rice. Doctoral Dissertation, Huazhong Agricultural University, Wuhan, China, 2016. (In Chinese). [Google Scholar]
- Pang, J.; Kobayashi, K.; Zhu, J. Yield and photosynthetic characteristics of flag leaves in Chinese rice (Oryza sativa L.) varieties subjected to free-air release of ozone. Agric. Ecosyst. Environ. 2009, 132, 203–211. [Google Scholar] [CrossRef]
- Wang, W.; Liu, X.; Tian, Y.; Yao, X.; Cao, W.; Zhu, Y. Effects of different soil water treatments on photosynthetic characteristics and grain yield in rice. Acta Ecol. Sin. 2012, 32, 7053–7060. [Google Scholar] [CrossRef] [Green Version]
- Li, H.S. Principles and Techniques of Plant Physiological and Biochemical Experiments; Higher Education Press: Beijing, China, 2000. [Google Scholar]
- Rohacek, K. Chlorophyll fluorescence parameters: The definitions, photosynthetic meaning, and mutual relationships. Photosynthetica 2002, 40, 13–29. [Google Scholar] [CrossRef]
- Wang, F.; Wang, Z.; Zhang, J.; Li, W. Combined Effect of Different Amounts of Irrigation and Mulch Films on Physiological Indexes and Yield of Drip-Irrigated Maize (Zea mays L.). Water 2019, 11, 472. [Google Scholar] [CrossRef] [Green Version]
- Qian, X.Q.; Shen, Q.R.; Xu, Y.; Wang, J.; Shen, H. Water use efficiency and rice yield under different water managements. Chin. J. Appl. Ecol. 2003, 14, 399. [Google Scholar]
- Zhang, B.B.; Xu, J.L.; Zhou, M.; Yan, D.H.; Ma, R.J. Effect of light quality on leaf photosynthetic characteristics and fruit quality of peach (Prunus persica L. Batch). Photosynthetica 2018, 56, 1–10. [Google Scholar] [CrossRef]
- Xu, D.Q.; Zhang, Y.Z.; Zhang, R.X. Photoinhibition of photosynthesis in planst. Plant Physiol. Commun. 1992, 28, 237–243. [Google Scholar]
- Sun, J.W.; Yang, Y.; Huang, Z.; Jin, S.; Jiang, D. Reason for photosynthetic declination in rice form water stress induced by polyethylene glycol(PEG). Chin. J. Rice Sci. 2004, 18, 539–543. [Google Scholar]
- Hu, S.P.; Wang, Z.G.; Zhang, L.; Liu, G.; Luo, L.; Liao, H. Correlation analysis and gene identification for chlorophyll content and photosynthetic rate in rice leaves under drought stress. Chin. J. Biochem. Mol. Biol. 2007, 23, 926–932. [Google Scholar]
- Jie, Y.; Yang, H. Relationship between soil water content and water use efficiency of apple leaves. Chin. J. Appl. Ecol. 2001, 12, 387. [Google Scholar]
- Zhang, F.J.; Zhang, K.K.; Du, C.Z.; Li, J.; Xing, Y.X.; Yang, L.T.; Li, Y.R. Effect of drought stress on anatomical structure and chloroplast ultrastructure in leaves of sugarcane. Sugar Tech. 2015, 17, 41–48. [Google Scholar] [CrossRef]
- Sun, L.F. Rice Roots of Drought Stress on the Photosynthetic Fluorescence Characteristic Influence. Master’s Thesis, Henan Agricultural University, Zhengzhou, China, 2013. [Google Scholar]
- Zhang, Y.P.; Zhu, D.F.; Lin, X.Q.; Chen, H.Z. Effects of water stress on rice growth and yield at different growth stages. Agric. Res. Arid Areas 2005, 2, 48–53. [Google Scholar]
- Hao, S.R.; Guo, X.P.; Wang, W.M.; Zhang, L.J.; Wang, Q.; Wang, Q.M.; Liu, Z.P. Effects of water stress in tillering stage and re-watering on rice root growth. Agric. Res. Arid Areas 2007, 1, 149–152. [Google Scholar]
- Liu, Z.P.; Zhu, L.L. Advances in research on compensation effects of crops under drought stress. J. Drain. Irrig. Mach. Eng. 2016, 34, 804–808. [Google Scholar]
- Jones, H.G. Partitioning Stomatal and non-stomatal limitations to photosynthesis. Plant Cell Environ. 2010, 8, 95–104. [Google Scholar] [CrossRef]
- Wen, G.; Tian, H.; Zhang, M.; Jiang, W. Application of chlorophyll fluorescence analysis in forest tree cultivation. Chin. J. Appl. Ecol. 2006, 17, 1973–1977. [Google Scholar]
- Xiao, M.; Li, Y.; Wang, J.; Hu, X.; Wang, L.; Miao, Z. Study on the Law of Nitrogen Transfer and Conversion and Use of Fertilizer Nitrogen in Paddy Fields under Water-Saving Irrigation Mode. Water 2019, 11, 218. [Google Scholar] [CrossRef] [Green Version]
- He, H.; Yang, R.; Jia, B.; Chen, L.; Fan, H.; Cui, J.; Ynag, D.; Li, M.G.; Ma, F.Y. Rice Photosynthetic Productivity and PSII Photochemistry under Nonflooded Irrigation. Sci. World J. 2014, 2014, 1–14. [Google Scholar] [CrossRef]
- Photosynthetic Physiology, Chlorophyll Fluorescence Parameters and Yield Components of Rice under Drip Irrigation with Plastic Film Mulching and Continuous Flooding. Available online: https://www.researchgate.net/publication/316559053_ (accessed on 16 January 2020).
- Effect of Different Irrigation Regimes on Rice Yield and Water Use Efficiency under Straw Returning to Field. Available online: http://www.cnki.com.cn/Article/CJFDTotal-HNXB201805016.htm (accessed on 16 January 2020).
- Effect of Water Treatments at Tillering Stage on Super Rice Yield and Physiological Characteristics. Available online: http://en.cnki.com.cn/Article_en/CJFDTotal-HBNB201505029.htm (accessed on 16 January 2020).
- Effect of Control Irrigation on Soil Temperature and Dry Matter Accumulation of Rice during Tillering Stage. Available online: http://www.en.cnki.com.cn/Article_en/CJFDTotal-HBNB201602029.htm (accessed on 16 January 2020).
- Van Camp, W.; Willekens, H.; Bowler, C.; Van Montagu, M.; Inzé, D.; Reupold-Popp, P.; Sandermann, H., Jr.; Langebartels, C. Elevated levels of superoxide dismutase protect transgenic plants against ozone damage. Nat. Biotechnol. 1994, 12, 165–168. [Google Scholar] [CrossRef]
- Yuan-Yuan, S.; Yong-Jian, S.; Ming-Tian, W.; Xu-Yi, L.; Xiang, G.; Rong, H.; Jun, M. Effects of seed priming on germination and seedling growth of rice under water stress. Acta Agronomica Sin. 2010, 36, 1931–1940. [Google Scholar]
- Xu, K.; Tang, L.; Zhang, H.C.; Guo, B.W.; Huo, Z.Y.; Dai, Q.G.; Wei, H.Y.; Wei, H.H. Effect of different mechanical direct seeding methods on tiller characteristics and yield of rice. Trans. Chin. Soc. Agric. Eng. 2014, 30, 43–52. [Google Scholar]
- Jiang, P.Y.; Hong, X.; Xu, Z.; Ni, Z. Comparison of carbon nutrition between effective tillers and ineffective tillers in rice. Chin. J. Riceence 1999, 11, 211–216. [Google Scholar]
- Chen, H.Z.; Zhu, D.F.; Lin, X.Q.; Zhang, Y.P. Studies on the tillering dynamics, panicle formation and composition of panicles of hybrid rice under sparse transplanting density. Hybrid Rice 2004, 19, 54–57. [Google Scholar]
- Huang, M.; Zou, Y.B.; Jiang, P.; Xia, B.; Md, I.; Ao, H.J. Relationship between grain yield and yield components in super hybrid rice. Agric. Sci. Chin. 2011, 10, 51–58. [Google Scholar] [CrossRef]
Figure 1.
Rice planting pattern with drip irrigation and plastic film mulching.

Figure 2.
Changes in chlorophyll content in rice under water stress in (a) 2018 and (b) 2019. CK: flooding treatment, W1: Irrigation limit 0.65–1.00 θs, W2: Irrigation limit 0.75–1.00 θs, and W3: Irrigation limit 0.85–1.00 θs. S, T, J, F, and M represent the seedling, tillering, jointing, grouting, and mature stages, respectively. The data are the mean ± standard error. Different letters indicate significant differences between treatments p < 0.05.

Figure 3.
Photosynthetic characteristics of rice under different water treatment conditions. The (a), (c), (e), and (g) represent the Pn, Tr, Ci, and gs respectively in 2018. (b), (d), (f), and (h) represent the Pn, Tr, Ci, and gs, respectively, in 2019. T, J, F, and M represent the tillering, jointing, grouting, and mature stages, respectively. CK: flooding treatment, W1: Irrigation limit 0.85–1.00 θs, W2: Irrigation limit 0.75–1.00 θs, and W3: Irrigation limit 0.65–1.00 θs. The data are the mean ± the standard error. Different letters indicate significant differences between treatments (p < 0.05).


Figure 4.
Fluorescence parameters of rice under different water conditions. The (a), (c), (e), (g), (i), and (k) represent the F0, Fv/Fm, ETR, NPQ, Y(II), and qp, respectively, in 2018. (b), (d), (f), (h), (j), and (l) represent the F0, Fv/Fm, ETR, NPQ, Y(II), and qp, respectively, in 2019. T, J, F, and M represent the tillering, jointing, grouting, and mature stages, respectively. CK: flooding treatment, W1: Irrigation limit 0.85–1.00 θs, W2: Irrigation limit 0.75–1.00 θs, and W3: Irrigation limit 0.65–1.00 θs. The data are the mean ± the standard error. Different letters indicate significant differences between treatments (p < 0.05).


Figure 5.
Effect of different water conditions on rice growth. The (a), (c), (e) represent the leaf area index (LAI), plant height, and number of tillers per unit area respectively in 2018. (b), (d), (f) represent the the leaf area index, plant height, and number of tillers per unit area respectively in 2019. T, J, F, and M represent the tillering, jointing, grouting, and mature stages, respectively. CK: flooding treatment, W1: Irrigation limit 0.85–1.00 θs, W2: Irrigation limit 0.75–1.00 θs, and W3: Irrigation limit 0.65–1.00 θs. The data are the mean ± the standard error. Different letters indicate significant differences between treatments (p < 0.05).


Table 1.
Soil nutrition at the experimental site.
| Year | Total Nitrogen (g kg−1) | Total Phosphorus (g kg−1) | Total Potassium (g kg−1) | Organic Matter (g kg−1) | Available Nitrogen (mg kg−1) | Available Phosphorus (mg kg−1) | Available Potassium (mg kg−1) |
|---|---|---|---|---|---|---|---|
| 2018 | 1.46 | 1.23 | 14.24 | 11.89 | 67.71 | 22.36 | 521.00 |
| 2019 | 1.05 | 0.93 | 24.17 | 15.69 | 57.70 | 21.80 | 424.00 |
Table 2.
Field water control standards for different irrigation treatments where θs represents field water capacity.
Table 2.
Field water control standards for different irrigation treatments where θs represents field water capacity.
| Treatment | Irrigation Limit | Seedling Stage | Tilling Stage | Jointing Stage | Filling Stage | Maturity Stage |
|---|---|---|---|---|---|---|
| W1 | Irrigation lower limit(θs) | 0.90 | 0.85 | 0.90 | 0.90 | 0.90 |
| Irrigation upper limit(θs) | 1.00 | 1.00 | 1.00 | 1.00 | 1.00 | |
| W2 | Irrigation lower limit(θs) | 0.90 | 0.75 | 0.90 | 0.90 | 0.90 |
| Irrigation upper limit(θs) | 1.00 | 1.00 | 1.00 | 1.00 | 1.00 | |
| W3 | Irrigation lower limit(θs) | 0.90 | 0.65 | 0.9 | 0.90 | 0.90 |
| Irrigation upper limit(θs) | 1.00 | 1.00 | 1.00 | 1.00 | 1.00 | |
| CK | Irrigation lower limit(cm) | 0 | 5 | 5 | 5 | 0 |
| Irrigation upper limit(cm) | 5 | 10 | 10 | 10 | 5 |
Note: W1, W2 and W3 represent different water treatments in tillering stage respectively, CK represents traditional flooding control treatment.
Table 3.
Correlation matrix between the chlorophyll index and photosynthetic parameters of drip irrigation rice where * indicates significance at p < 0.05 and ** indicates significance at p < 0.01, sample size (N = 24). The maize transpiration rate (Tr), photosynthetic rate (Pn), stomatal conductance (gs), intercellular CO2 concentration (Ci), chlorophyll content (Chl (a + b)).
| Parameter | Pn | gs | Ci | Tr | Chl (a + b) |
|---|---|---|---|---|---|
| Pn | 1.00 | 0.89 * | –0.46 | 0.93 ** | 0.94 ** |
| gs | 1.00 | –0.67 | 0.98 ** | 0.75 | |
| Ci | 1.00 | –0.65 | 0.24 | ||
| Tr | 1.00 | 0.84 * | |||
| Chl (a + b) | 1.00 |
Table 4.
Correlation matrix between chlorophyll fluorescence parameters and photosynthesis of drip irrigated rice where * indicates significance at p < 0.05 and ** indicates significance at p < 0.01, sample size (N = 24). maximum fluorescence yield (Fm), initial leaf fluorescence yield (F0), fluorescence yield (F’), maximum fluorescence yield (F’m) was measured under light adaptation; the maximum photochemical efficiency (Fv/Fm), PSII potential activity (Fv/F0), Conversion efficiency of PS IIopen reaction center(F’v/F’m), photochemical quenching coefficient (qp), non-photochemical quenching coefficient (NPQ), actual photochemical efficiency (Y(II)).
| Parameter | Pn | F0 | Fm | Fv/Fm | Fv/F0 | F’v/F’m | qp | NPQ | Y(II) |
|---|---|---|---|---|---|---|---|---|---|
| Pn | 1.00 | −0.79 | 0.90 * | 0.88 * | 0.84 * | 0.79 | 0.94 ** | 0.95 ** | 0.89 * |
| F0 | 1.00 | −0.79 | −0.67 | −0.83 * | −0.96 * | −0.76 | −0.75 | −0.78 | |
| Fm | 1.00 | 0.87 * | 0.83 * | 0.87 * | 0.82 * | 0.97 ** | 0.99 ** | ||
| Fv/Fm | 1.00 | 0.87 * | 0.72 | 0.68 | 0.92 ** | −0.85 * | |||
| Fv/F0 | 1.00 | 0.81 | 0.77 | 0.79 | −0.82 * | ||||
| F’v/F’m | 1.00 | 0.89 * | 0.84 * | −0.87 * | |||||
| qp | 1.00 | 0.77 | −0.82 * | ||||||
| NPQ | 1.00 | −0.96 ** | |||||||
| Y(II) | 1.00 |
Table 5.
Yield and yield components of rice under different water treatments. Different letter in the same column indicate significant differences at p < 0.05.
Table 5.
Yield and yield components of rice under different water treatments. Different letter in the same column indicate significant differences at p < 0.05.
| Years | Treatment | Effective Panicles (No m−2) | Spikelets Per Panicle | Earing Rate (%) | Seed Setting Rate (%) | Grain Weight(g) | Grain Yield (kg ha−1) | Water Consumption (m3 ha−1) | Water-Use Efficiency (kg m−3) |
|---|---|---|---|---|---|---|---|---|---|
| 2018 | CK | 629.84 a | 148.65 a | 68.83 c | 87.43 b | 27.01 a | 8563.35 a | 34,415.22 a | 0.25 c |
| W1 | 590.56 b | 145.36 ab | 73.21 b | 85.31 a | 25.26 b | 6426.23 b | 16,223.93 b | 0.40 a | |
| W2 | 565.30 c | 157.52 a | 78.95 b | 80.26 b | 25.47 b | 6498.69 b | 15,241.19 c | 0.43 a | |
| W3 | 362.22 d | 134.22 b | 65.55 a | 78.67 b | 23.56 c | 4932.12 c | 14,185.78 d | 0.35 b | |
| 2019 | CK | 649.90 a | 156.35 a | 75.82 a | 79.55 a | 25.97 a | 8393.36 a | 33,126.79 a | 0.25 c |
| W1 | 579.25 b | 166.23 a | 73.66 a | 80.54 a | 24.75 b | 6536.55 b | 16,003.23 b | 0.41 a | |
| W2 | 545.60 c | 140.41 b | 76.12 a | 83.25 a | 24.10 b | 6388.19 b | 14,987.46 c | 0.43 a | |
| W3 | 404.41 d | 142.43 b | 68.47 b | 81.45 a | 23.82 b | 5339.55 c | 13,887.90 d | 0.38 b |
Note: CK: flooding treatment, W1: Irrigation limit 0.85–1.00 θs, W2: Irrigation limit 0.75–1.00 θs, and W3: Irrigation limit 0.65–1.00 θs.
Table 6.
Correlation matrix between yield components and water consumption of drip irrigated rice where * indicates significant correlation at p < 0.05 and ** indicates significant correlation at p < 0.01, sample size (N = 24).
Table 6.
Correlation matrix between yield components and water consumption of drip irrigated rice where * indicates significant correlation at p < 0.05 and ** indicates significant correlation at p < 0.01, sample size (N = 24).
| Parameter | Grain Yield | Effective Panicles | Spikelets per Panicle | Earing Rate | Seed Setting Rate | 1000-Grain Weight | Water Consumption |
|---|---|---|---|---|---|---|---|
| Grain yield | 1 | 0.90 ** | 0.42 | 0.34 | 0.71 * | 0.92 ** | 0.92 ** |
| Effective panicles | 1 | 0.61 | 0.63 | 0.57 | 0.84 ** | 0.85 ** | |
| Spikelets per panicle | 1 | 0.62 | −0.04 | 0.42 | 0.19 | ||
| Earing rate | 1 | 0.02 | 0.28 | −0.01 | |||
| Seed setting rate | 1 | 0.63 | 0.72 * | ||||
| 1000-grain weight | 1 | 0.84 ** | |||||
| Water consumption | 1 |
© 2020 by the authors. Licensee MDPI, Basel, Switzerland. This article is an open access article distributed under the terms and conditions of the Creative Commons Attribution (CC BY) license (http://creativecommons.org/licenses/by/4.0/).
Share and Cite
MDPI and ACS Style
Xu, Q.; Ma, X.; Lv, T.; Bai, M.; Wang, Z.; Niu, J. Effects of Water Stress on Fluorescence Parameters and Photosynthetic Characteristics of Drip Irrigation in Rice. Water 2020, 12, 289. https://0-doi-org.brum.beds.ac.uk/10.3390/w12010289
AMA Style
Xu Q, Ma X, Lv T, Bai M, Wang Z, Niu J. Effects of Water Stress on Fluorescence Parameters and Photosynthetic Characteristics of Drip Irrigation in Rice. Water. 2020; 12(1):289. https://0-doi-org.brum.beds.ac.uk/10.3390/w12010289
Chicago/Turabian StyleXu, Qiang, Xiaopeng Ma, Tingbo Lv, Meng Bai, Zelin Wang, and Jingran Niu. 2020. "Effects of Water Stress on Fluorescence Parameters and Photosynthetic Characteristics of Drip Irrigation in Rice" Water 12, no. 1: 289. https://0-doi-org.brum.beds.ac.uk/10.3390/w12010289
Note that from the first issue of 2016, this journal uses article numbers instead of page numbers. See further details here.