Article

Investigating the Status of Cadmium, Chromium and Lead in the Drinking Water Supply Chain to Ensure Drinking Water Quality in Malaysia

1
Institute for Environment and Development (LESTARI), Universiti Kebangsaan Malaysia (UKM), UKM Bangi 43600, Selangor, Malaysia
2
School of Environmental and Natural Resource Sciences, Universiti Kebangsaan Malaysia (UKM), UKM Bangi 43600, Selangor, Malaysia
*
Authors to whom correspondence should be addressed.
Submission received: 1 August 2020 / Revised: 26 August 2020 / Accepted: 3 September 2020 / Published: 23 September 2020
(This article belongs to the Special Issue Environmental Chemistry of Water Quality Monitoring)

Abstract

:
Prolonged persistence of toxic cadmium (Cd), chromium (Cr) and lead (Pb) in the aquatic environment are due to its nonbiodegradable characteristic. A few studies have reported higher concentrations of these metals in the transboundary Langat River, Malaysia. This study determined the spatial and temporal distributions of Cd, Cr and Pb concentrations (2005–2015) in the Langat River along with assessing the status of these metals in the drinking water supply chain at the basin. Water samples were collected once in 2015 from the drinking water supply chain, i.e., from the river, treated water at plants, taps and filtration water at households. Determined mean concentrations of Cd, Cr and Pb by inductively coupled plasma mass spectrometry in the Langat River were within the drinking water quality standard of Malaysia and the WHO, except for the Pb (9.99 ± 1.40 µg/L) concentration, which was at the maximum limit, 10 µg/L. The spatial and temporal distribution of these metals’ concentrations indicate dilution of it downstream, along with the increasing trend in rainfall and water flow, especially during the northeast monsoon. Significant correlation and regression analysis of the Cd, Cr and Pb concentrations also indicate that the sources of this metal pollution are mainly the natural weathering of minerals along with anthropogenic activities in the basin. The determined overall water quality of the Langat River is categorized Class IIA (i.e., clean), which requires conventional treatment before drinking; however, the maximum removal efficiency of these metals by the plants at the basin was about 90.17%. Therefore, the proactive leadership roles of the local authorities will be appropriate to reduce the pollution of this river as well as introducing a two-layer water filtration system at the Langat River Basin to accelerate the achievement of a sustainable drinking water supply.

1. Introduction

The Langat River is one the prime sources of drinking water in the Selangor state of Malaysia; however, the pollution of this river is one of the significant threats to the local populations and biodiversity [1,2,3,4]. The water of this river is used for drinking, domestic and agricultural activities [5], as well as for industrial activities [6,7,8,9]. There is the presence of both point and non-point sources of pollution along the river [10,11,12], including significant differences in the pollution of the river between upstream and downstream [13]. The point sources of pollution are sewage disposal, discharge from industries, wastewater and effluent treatment plants [14]. On the contrary, the rapid urbanization of the river basin along with land clearing and agricultural activities are considered as the non-point sources of pollution [4].
Climate change has also contributed significantly to the non-point sources, such as pollutants from agricultural land, ex-mining ponds, etc., into the Langat River through uncertainty in rainfall pattern, flood, landslides, etc. [7,15,16,17,18]. It is also reported that many of the nine water treatment plants (WTPs) in the basin had to remain closed several times, either for heavy flood/mudflow and turbidity or high chemical concentration due to the drought situation, which has compelled the authorities to make drinking water rationing to the inhabitants [16,19,20]. Moreover, the inadequate collaboration among the relevant agencies also attributed to the pollution of the river, because the Langat River drains through three different constituencies [21,22]. As a result, both the local biodiversity and human beings are affected severely [23], and the populations might suffer from water-borne diseases [15] as well as diseases from chemical ingestion via drinking water. The studies on the prevalence of radioactive elements in soil and water in Malaysia also reported that the radioactive elements could lead to cancer if the treated water remained contaminated [1,24,25]. Hence, it has been very much critical as the demand for freshwater in Malaysia would increase to 113% in 2020, i.e., 20,338 m3/day compared to 9543 m3/day in 1995.
The natural weathering of minerals, along with the extensive anthropogenic activities are the prime sources of trace metals in the aquatic environment [26,27]. However, the release of metals in the environment has increased tremendously since the beginning of the industrialization and the environment, especially the water body, has been the sink of these metallic contaminants [28]. Although the ultimate place of deposition of these metals is the sea, it is mostly transported by the rivers [29]. Moreover, the unpolluted biodiversity of the river is not only important for the aquatic species but also important for human beings in that it provides services, e.g., a source of drinking water. A few recent studies have also reported high concentrations of arsenic (As) (8.5 µg/L [30], 43.5 µg/L [31], 11.2 µg/L [32] and 1.65 µg/L [33]), aluminium (Al) (209.1 µg/L [34], 231.4 µg/L [31] and 250.3 µg/L [2]), zinc (Zn) (38.9 µg/L [31] and 24.8 µg/L [35]), cadmium (0.6 µg/L [31] and 0.4 µg/L [35]), chromium (Cr) (1.13 µg/L [36] and 2.33 µg/L [35]), lead (Pb) (2.37 µg/L [31] and 1.62 µg/L [35]) and copper (Cu) (86.1 µg/L [31] and 26.02 µg/L [32]) in the Langat River. The metal pollution in the Langat River is mainly from the natural weathering of the iron and silica bedrock of the Titiwangsa Granite Hill Range, as well as the abundance of aluminosilicate, hydrous aluminium and ferralsols within the 2 m of surface soil of the Langat River Basin [37]. Moreover, the effluent discharges by the sewage treatment plants and pig firms, runoff from the landfills and open dumping, use of fertilizers such as arsenal herbicides (i.e., lead arsenate) in agricultural activities [32]—mainly in palm oil plantation [38] as well as the tin mining [39]—are the major sources of metal pollution in the Langat River Basin. Aris et al. [32] also reported high TDS (total dissolved solids) of 86.50–19740 mg/L, DO (dissolved oxygen) of 0.72–3.17 mg/L, conductivity of 173.10–39500 µS/cm, salinity of 0.09–25.10 ppt and pH of 6.20–7.61 in the Langat River. Similarly, Juahir et al. [4] reported SS (suspended solids) of 27.76–546.41 mg/L, DO of 2.54–7.54 mg/L, conductivity of 32.78–20,128.33 µS/cm, salinity of 0.01–14.14 ppt and pH of 6.39–7.09 in the Langat River. Hence, this study on the spatial variation in Cd, Cr and Pb concentration is important for the identification of the pollution status concerning geographical pollution sources.
However, the degradation of the Langat River will continue due to the high concentration of microorganism and suspended particles from the ongoing development activities [34]. This study, to determine the cadmium (Cd), chromium (Cr) and lead (Pb) concentrations in the Langat River, is very critical due to its toxicity, abundance and persistence in the aquatic environment [40,41,42,43]. The ingestion of these metals, even at the trace level, is dangerous for human health if ingested via drinking water due to its toxicity [44,45,46,47]. Meanwhile, very high concentrations of dissolved Cd 35.56 µg/L, Cr 24 µg/L [48] and Pb 57.78 µg/L in the Langat River [49] have already been recorded; however, lower concentrations of dissolved Pb, i.e., 8.7 µg/L [48] and 10 µg/L [50], were also reported in the Langat River. Moreover, the Langat River is the primary source of drinking water in the Langat River Basin, and it provides drinking water to almost a third of the population in the Selangor state of Malaysia [2,8]. A higher dissolved Pb concentration was recorded (32.5 µg/L) in the tap water at Bandar Sunway, Malaysia [51]—adjacent to Langat River Basin—mainly because of corrosion in the plumbing system in the old building, and this Pb concentration crossed the maximum limit of the drinking water quality standard of 10 µg/L, as proposed by Ministry of Health (MOH) of Malaysia and the World Health Organization (WHO). Therefore, this study determined the spatial and temporal distribution of the cadmium (Cd), chromium (Cr) and lead (Pb) concentration in the Langat River during 2005–2015, along with determining the status of these metals in the drinking water supply chain (i.e., river, WTP, and households’ tap water) of the Langat River Basin, to examine the suitability of the river as one of the vital drinking water sources in Malaysia.

2. Materials and Methods

2.1. Study Area and Sample Collection

The Langat River Basin, Selangor, Malaysia, has about a 1815 km2 catchment area within the latitudes 2°40′152″ N to 3°16′15″ N and longitudes 101°19′20″ E to 102°1′10″ E [4]. The river originates at the Titiwangsa Mountain of Hulu Langat and drains towards the Strait of Malacca via the urban and industrial areas of Cheras, Bangi, Kajang, Dengkil and Sepang. Therefore, three replicates of each water sample were collected in polyethene containers from the eight stations of the river from upstream to downstream once during the rainy days of the inter-monsoon season (August 2015), from precisely the same places from where the water treatment plants (WTPs) in the basin collect water for drinking water treatment purposes. Three replicates of each water sample were also collected from the outlets of the eight WTPs along with from the kitchen’s tap of fifteen households at the basin based on the common use of five types of household filtration systems at the basin. Three replicates of each household filtration water were also collected from the same fifteen households. The locations of the water sampling points were recorded by a Global Positioning System (GPS) to prepare the water sample location map (Figure 1). Accordingly, the in situ physicochemical water quality parameters, such as dissolved oxygen (DO), conductivity, total dissolved solids (TDS), pH, temperature, salinity, etc., were recorded with a calibrated Professional Plus Water Quality Instrument (6050000, YSI Incorporated, Yellow Springs, OH, USA) from each sampling point.

2.2. Sample Preparation and Analytical Method

The samples were acidified with concentrated HNO3 to maintain a pH < 2 as soon as possible after collection, to avoid contamination as well as precipitation of trace elements. Similarly, all the glassware used for the analysis were acid-washed to avoid possible contamination. The raw samples were also filtered using 0.45 µm glass fibre filter paper (Whatman) to analyse the dissolved part. The Chelex® 100 resin (i.e., 50–100 mesh) column ion-exchange method was applied to analyse the three replicates of the 500 mL water samples for Cd, Cr and Pb analysis [2,52,53,54].
Ion-exchange columns were prepared by soaking 20 g of Chelex® 100 resin in 2.5 M HNO3 for two hours and then decanting and soaking in clean 2.5 M HNO3 for another two hours. Then this slurry mixture was poured into a fritted glass column, allowed to drain, washed with 30 mL of 2.5 M HNO3 twice, rinsed with 30 mL of distilled deionized water (DI-H2O) twice, and then converted it to the ammonium form by eluting with 10 mL of 1 M NH4OH. Excess NH4OH was removed by rinsing with 30 mL of DI-H2O. The prepared columns were placed in a rack.
The weighed samples (pH < 2) were buffered with the mixture of the same volume of 10 M NH4CH3CO2 and 10 M NH4OH to adjust the pH to ~5.4 (approximately). Then, three replicates of the 500 mL water samples were drained in the prepared column and the flow rate of the sample water was adjusted to 20 s per drop. When no solution remained above the column, the column was rinsed with 30 mL of 10 M NH4CH3CO2 to remove any excess salts and eluted with 25 mL of 2 M HNO3 into a 30-mL (LPE) bottle. The eluent was analysed for the dissolved Cd, Cr and Pb concentrations (i.e., µg/L) by inductively coupled plasma mass spectrometry (ELAN 9000 ICP-MS, PerkinElmer, Shelton, CT, USA).

2.3. Quality Control and Quality Assurance

The quality of analytical data was controlled through the calibration of the ICP-MS, analysing of the replicates as well as analysing of the blanks. Therefore, the standard of several concentrations was prepared with the Multi-Element Calibration Standard III (PerkinElmer, Lot #CL7-173YPY1, PE #N9300233, Waltham, MA, USA) with the same acid mixture used for sample dissolution to calibrate the Cd, Cr and Pb analysis by ICP-MS. The accuracy of the ICP-MS was analysed with the standard curve (r2 = 0.9999) for Cd, Cr and Pb, respectively, as well as the precision of the analytical procedure was determined by the relative standard deviation (RSD), i.e., Cd 0.295%, Cr 0.005% and Pb 0.003%. Accordingly, the blanks were analysed for background correction of the Cd, Cr and Pb concentrations. The mean SRM (i.e., standard reference material) recoveries were >90%, i.e., Cd = 94.966 ± 0.280, Cr = 99.803 ± 0.005 and Pb = 98.762 ± 0.003%.

2.4. Time Series Water Quality and Environmental Data

Water quality data, i.e., Cd, Cr and Pb, as well as the physicochemical parameters, such as dissolved oxygen (DO mg/L) and DO% in saturation, ammoniacal nitrogen (NH3–N mg/L), biological oxygen demand (BOD mg/L) and chemical oxygen demand (COD mg/L), were obtained (January 2005–July 2015) from the Department of Environment (DOE) of Malaysia to determine the water quality of the Langat River. Data were also used to estimate the correlations among the water quality parameters. Similarly, the rainfall (mm) and temperature (°C) data (2005–2015) from the Malaysia Meteorological Department (MMD) and the water flow data (2005–2015) in the Langat River from the Department of Irrigation and Drainage (DID) of Malaysia were collected to find out the influence of these climatic parameters on the water quality of the Langat River.

2.5. Water Quality Index (WQI)

The WQI (water quality index) was calculated through selecting the water parameters (i.e., DO%, BOD, COD, NH3–N, TDS and pH) to calculate the sub-index (SI) values [55]. The best-fit equations were used to estimate the various sub-index values of the selected physicochemical parameters [55]. Therefore, the overall water quality index was calculated in the range of 0 ≤ WQI ≤ 100 for drinking purposes. A WQI value > 92.7 indicates Class I (i.e., clean), a WQI value of 76.5–92.7 indicates Class II (i.e., requires conventional treatment before drinking), a WQI value of 51.9–76.5 indicates Class III (i.e., requires extensive treatment before drinking), a WQI value of 31.0–51.9 indicates Class IV (i.e., can be used for irrigation) and a WQI value < 31.0 indicates Class V (i.e., polluted, cannot be used for the earlier mentioned purposes). The water quality index (WQI) Equation (1) of the Department of Environment (DOE) of Malaysia [55,56] was used to determine the class of the Langat River (Supplementary Material, Table S1):
WQI = (0.22 × SIDO) + (0.19 × SIBOD) + (0.16 × SICOD) + (0.15 × SIAN) + (0.16 × SISS) + (0.12 × SIpH)

2.6. Statistical Analysis

SPSS software (Version 21.0, IBM Corp., Armonk, NY, USA) was applied to perform the descriptive statistics of the Cd, Cr and Pb concentrations. The descriptive statistics includes the calculation of the minimum (min.), maximum (max.), mean, standard deviation (Std. Dev.), skewness and kurtosis of the concentration of the water quality parameters in the Langat River Basin. The standard deviation was calculated to observe the precision of each water quality parameter. Similarly, skewness and kurtosis analyses were helpful to find out the normal distribution of the data. Accordingly, Microsoft Excel 2016 (Microsoft Office Professional Plus 2016, Microsoft Corporation, Redmond, Washington, USA) was used to produce the trend graphs of the Cd, Cr and Pb from upstream to downstream of the Langat River. Pearson’s statistical correlation analysis was applied to estimate the correlations among the Cd, Cr, Pb and physicochemical water quality parameters (2005–2015), as well as for the climatic parameters (2005–2015), such as water flow, rainfall and temperature. A linear regression analysis was also performed to predict the metal’s pollution in the Langat River.

3. Results

3.1. Water Quality Status in the Langat River

Descriptive statistics of the selected trace metals, i.e., Cd, Cr and Pb, showed high skewness, as the value ranges from 1.03 to 1.33 (Table 1), and these metal concentrations along with the physicochemical parameters are from the river water samplings. However, the physical water quality parameters, i.e., dissolved oxygen (DO), conductivity/specific conductance (SPC), total dissolved solids (TDS), salinity (SAL), pH and temperature (Temp) were highly (i.e., −1 to +1) to moderately (i.e., −0.5 to 1) skewed in the range of −0.64 to 0.52. Chemingui and Ben Lallouna [57] argued that a skewness <3 represents the normal distribution of the data. Additionally, the kurtosis analysis of the water quality parameters is flat because the values are <3 (i.e., platykurtic) and it also indicates that the data distribution has fewer and less extreme outliers [57].
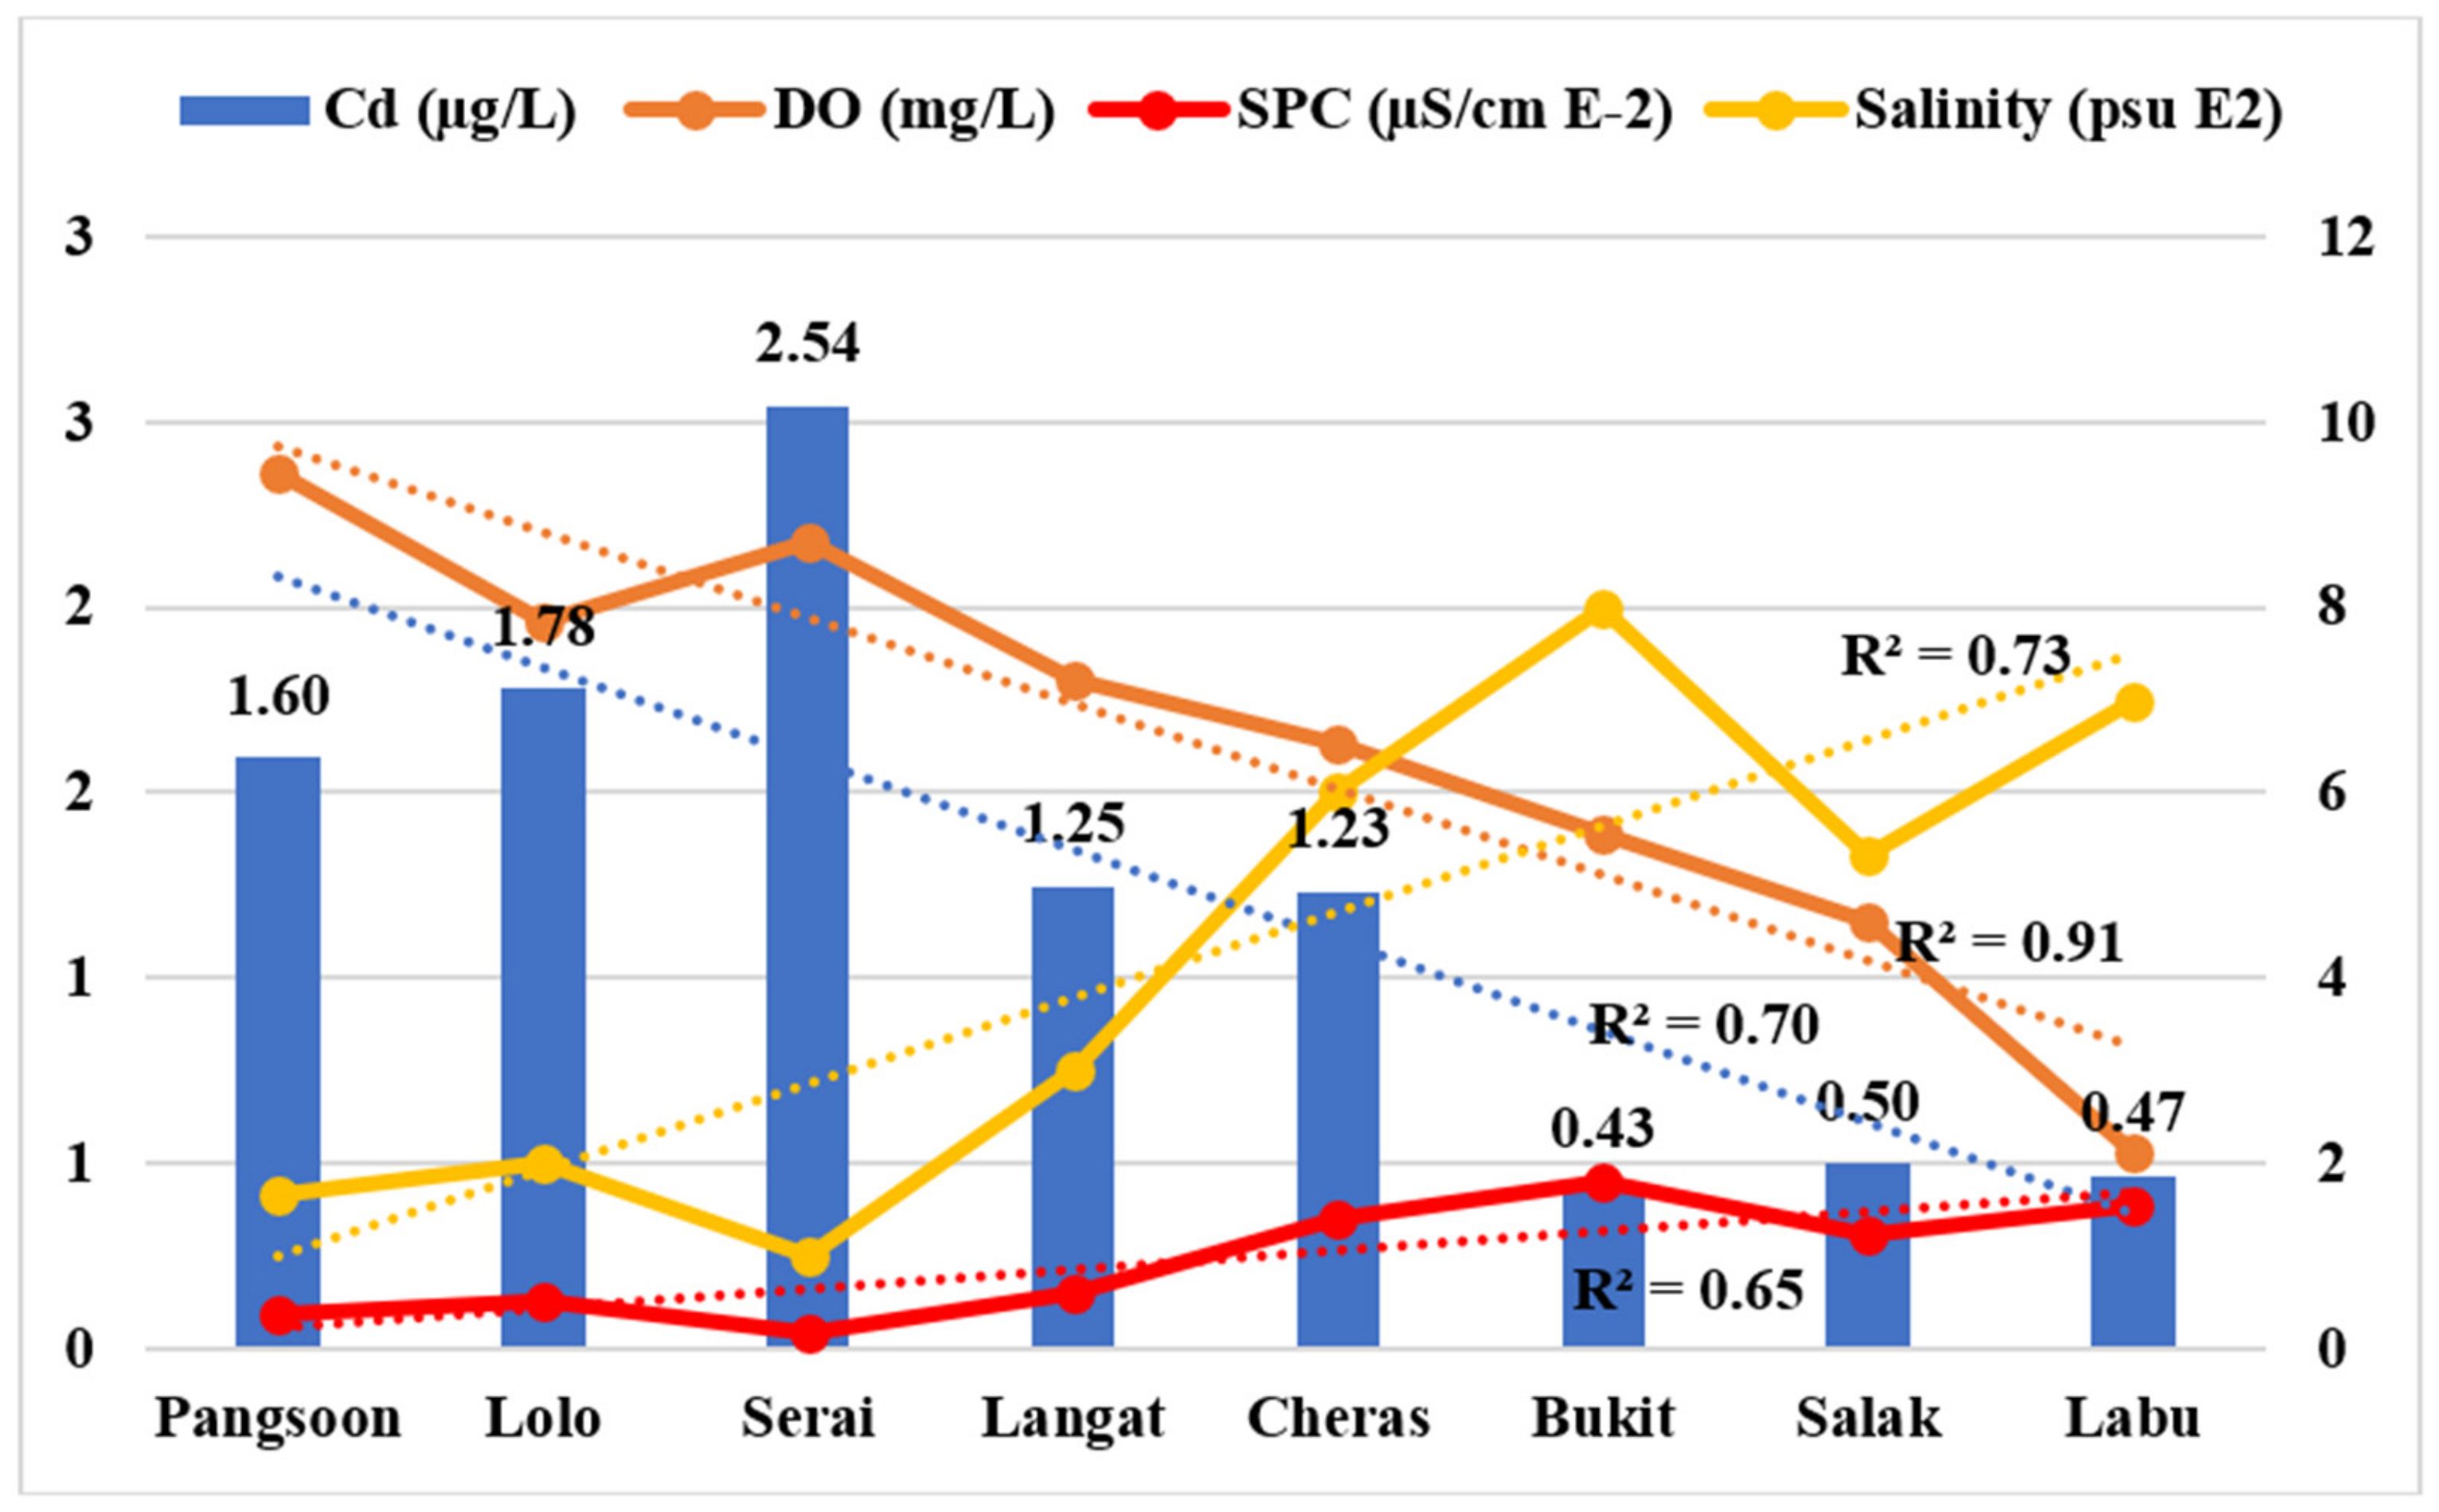
This study determined the dissolved Cd concentration in the range of 0.39–3.43 µg/L (Table 2) from upstream to downstream in the Langat River, although the mean concentration was recorded as 1.22 ± 0.88 µg/L. The mean concentration of Cd was within the stipulated limit of raw water quality, 3 µg/L, as per the MOH, as well as within the limit of the toxic reference value of 2.2 µg/L by USEPA (Table 2). However, the mean Cd concentration of 1.22 ± 0.88 µg/L exceeded the limit of the criteria of a continuous concentration of 0.72 µg/L, as per USPEA, as well as the annual average concentration of 0.2 µg/L as per the European Commission. Mamun et al. [50] also reported a similar concentration of dissolved Cd in the Langat River (1.0 µg/L). However, Sarmani [49] and Yusuf [48] have observed a very high concentration of Cd in the Langat River, 35.56 µg/L and 24 µg/L, respectively. Accordingly, Wang et al. [58] investigated the highly dissolved Cd concentration of 61.74 ± 90.12 µg/L in the Huaihe River, China.
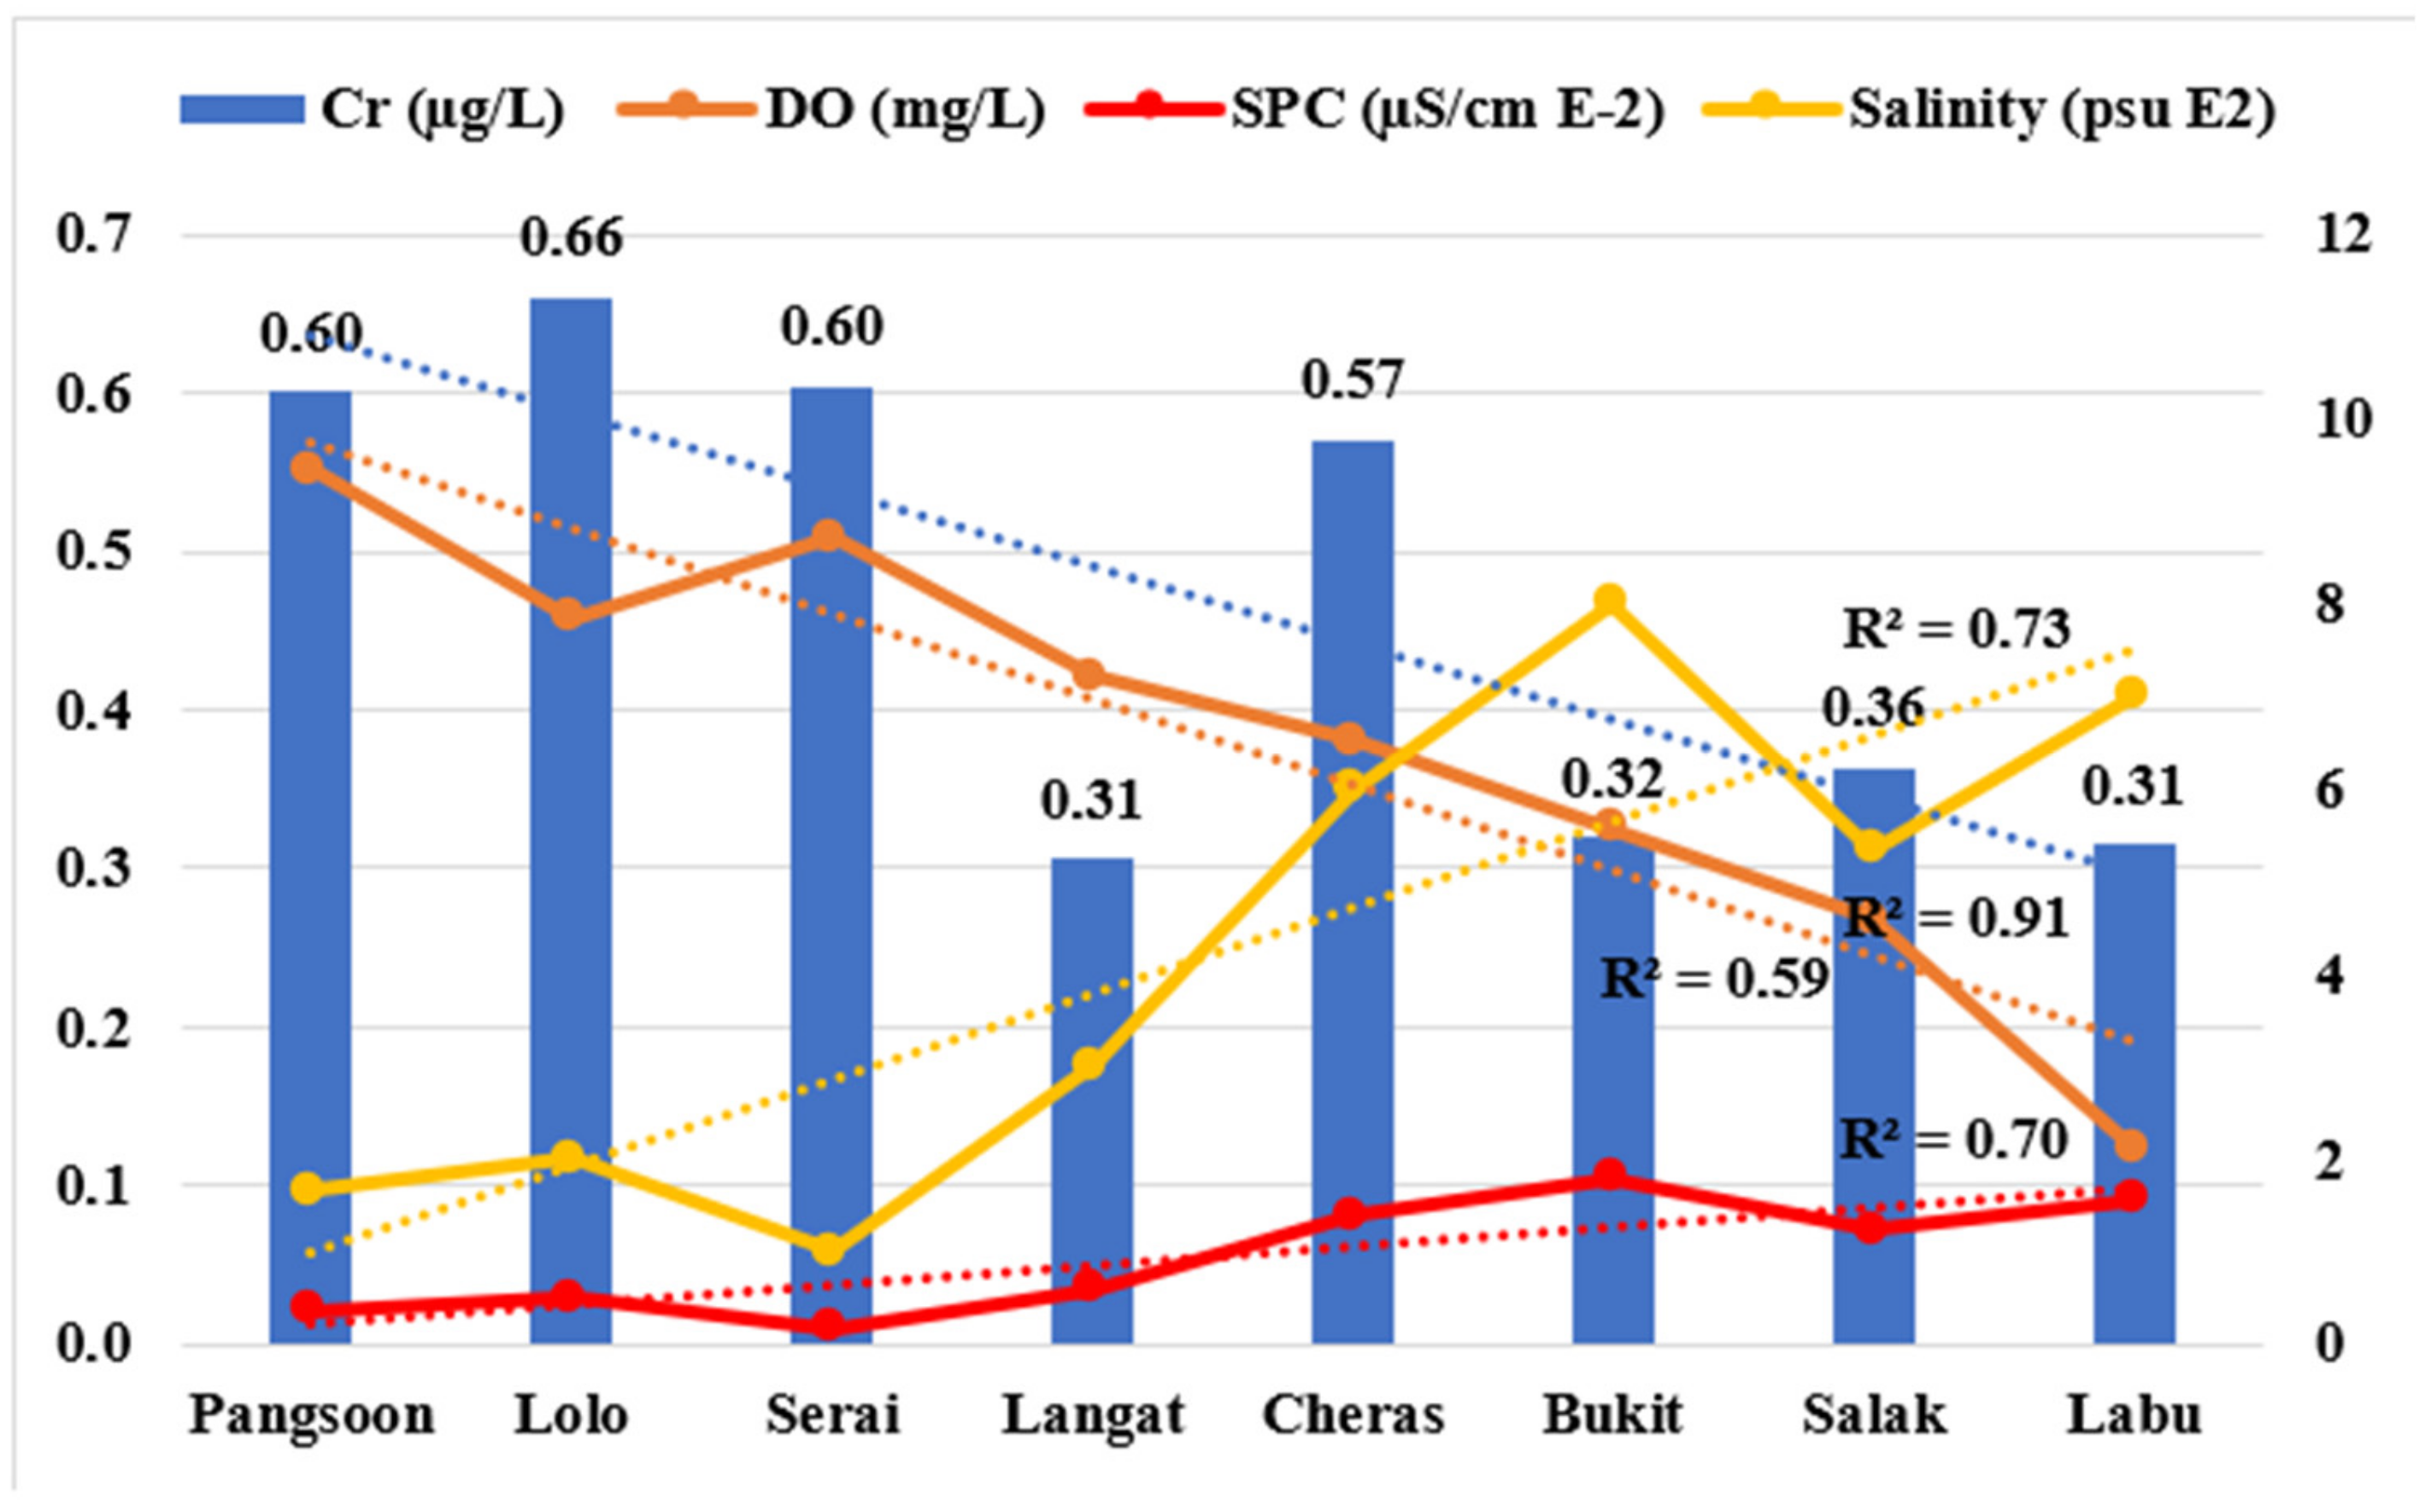
Usually, the chromium concentrations in water are deficient. The natural total chromium content in water is approximately 0.5–2 µg/L [59]. This study also determined a very low mean concentration of dissolved Cr 0.47 ± 0.27 µg/L (Table 2) in the Langat River and it was within the stipulated limit of raw water quality of 50 µg/L as per the MOH, and within the limit of the toxic reference value of 11 µg/L by USEPA. Aris et al. [32] also reported a similar dissolved Cr concentration 0.67 ± 0.90 µg/L in the Langat River. Although, the highest Cr concentration recorded in the Langat River, Malaysia, was 70 µg/L [48], while Islam et al. [41] reported a higher Cr concentration 78 ± 0.27 in the Korotoa River, Bangladesh.
The determined mean concentration of Pb of 9.99 ± 1.40 µg/L in the Langat River was compared with several surface freshwater quality standards stipulated by the Ministry of Health, Malaysia [60], the United States Environmental Protection Agency [61,62] and the European Commission [63]. The mean Pb concentration was within the standard limit proposed by Ministry of Health of Malaysia (Table 2), except the maximum concentration of Pb, 24.93 µg/L, in the Langat River crossed the standard limit of 10 µg/L as per the drinking water quality standard as set by the Ministry of Health of Malaysia [60] and the World Health Organization [64].
The mean concentration of dissolved Pb of 9.99 ± 1.40 µg/L (Table 2) in the Langat River was within the stipulated limit of raw water quality of 50 µg/L as per the MOH, but not within the toxic reference value of 2.5 µg/L by USEPA, criteria continuous concentration of 2.5 µg/L by USEPA and annual average concentration of 1.3 µg/L by the European Commission (Table 2). Yusuf [48] and Mamun et al. [50] also investigated a similar concentration of Pb of 8.7 µg/L and 10 µg/L, respectively, in the Langat River (Table 3). However, Wang et al. [58] recorded a very high Pb concentration of 154.96 ± 193.34 µg/L in the Huaihe River, China, whereas in Langat the highest concentration was recorded, 57.78 µg/L, mainly because of mining activities [49]. Sarmani [49] has reported very high concentrations of Cd (35.56 µg/L) and Pb (57.78 µg/L) in the Langat River, mainly because of water sampling near the mining sites. Yusuf [48] has also reported a very high concentrations of Cd (24 µg/L, Cr 70 µg/L and Pb 8.70 µg/L) in the Langat River, mainly due to the extensive development activities during the 1990s while establishing Putrajaya, the administrative capital of Malaysia, within the Langat River Basin. However, Aris [32] reported a low level of Cd (0.07 ± 0.09 µg/L), Cr (0.67 ± 0.90 µg/L) and Pb (0.16 ± 0.23 µg/L) concentrations in the Langat River downstream, due to the precipitation of these metals from the higher salinity downstream than upstream.
According to the national water quality standard of Malaysia [56], the determined Cd and Pb status in the Langat River is in Class III, respectively, which requires extensive treatment before drinking (Table 4). Similarly, the status of the physicochemical parameters, such as dissolved oxygen and temperature, belongs to Class IIA (Table S2), which requires conventional treatment before drinking. However, the conductivity, salinity, total dissolved solids, pH, etc., were within the standard (Table 4).

3.2. Spatial Distribution of Cadmium, Chromium and Lead in the Langat River

Chemical pollution of the Langat River is a severe concern both from the point and non-point sources of pollution [8]. The one-way ANOVA (Table S3) indicates that there are significant differences in the mean Cd (F = 4.4; p < 0.007) and Pb (F = 29; p < 6.1 × 10⁻⁸) among the river sampling points, but not for Cr (i.e., F = 1; p = 0.491). Although the one-way ANOVA of Cr was non-significant, however, the significant Levene test (Table S4) of Cd (p = 2.1 × 10⁻⁴), Cr (p = 0.006) and Pb (p = 0.007) indicate that the variance in the water quality parameters is not homogeneous. The significant differences in the mean of these selected trace metals were also verified by the Welch Robust test of the equality of the mean (Table S4) for Cd (p = 6.8 × 10⁻¹⁰), Cr (p = 0.014) and Pb (p = 3.8 × 10⁻⁴), although the Brown–Forsythe robust test of the equality of the mean for Cr is not significant, which was also confirmed by the LSD post-hoc test of the ANOVA. The post-hoc test of multiple mean differences of dissolved Cr from upstream to downstream of the Langat River determined no significant differences among all the sampling stations, mostly because of the natural weathering of oxisols from the serpentinite rock along the river basin. However, for Cd we observed significant multiple mean differences, mostly in the downstream, and mainly because of dissolution of Cd with the increasing salinity downstream. The multiple mean differences of the dissolved Pb among almost all the sampling points from upstream to downstream of the Langat River suggest that the significant mean differences might be because of both the natural and anthropogenic input of Pb into the river.

3.2.1. Cadmium (Cd) Status in Relation with the Physicochemical Parameters

The moderate decreasing trend in dissolved Cd (R2 = 0.65) from upstream to downstream in the Langat River (Figure 2) indicates a dilution of Cd with the increasing trend of salinity (R2 = 0.73) from upstream to downstream. Similarly, Cd has a significant negative correlation (r = −0.880, p = 0.002, Table S5) with salinity in the Langat River, whereas it has a strong positive correlation with DO (r = 0.821, p = 0.006). However, DO has a strong negative correlation with salinity (r = 0.800, p = 0.009) in the Langat River. Therefore, a higher Cd concentration is observed in upstream of the Langat River than downstream. The higher mean concentration of Cd, i.e., 2.54 ± 0.02 µg/L, at Serai point, which is a hilly deep forest area, might be due to the natural weathering of Cd from the zinc ores, such as sphalerite (ZnS), as well as from the cadmium mineral, such as Greenockite (CdS) [76], in the Titiwangsa Granite Hill Range of the basin. A few studies have reported a very high concentration of iron (480 µg/L [4], 175 µg/L [31] and 61.90–162.53 µg/L [49]) as well as Manganese (<0.0005–504.46 µg/L [49] and 93 µg/L [77]) in the upstream areas of the Langat River, which is a hilly area. However, very high oxidation occurs for manganese, and iron compares to cadmium and chromium [78]. Therefore, maybe the Cd and Cr ions remain free in the upstream areas of the Langat River. Moreover, the sampling was done during the rainy days; therefore, leaching may also occur from the natural sources, attributing to the increase in the concentrations of Cd and Cr in the hilly upstream of the Langat River (Figure 3). The point sources of pollution, such as the effluent from the sewerage treatment plants (STPs) near the Langat and Cheras points of the river, have also attributed to a higher concentration of Cd, i.e., 1.25 ± 0.09 µg/L and 1.23 ± 0.73 µg/L, respectively (Figure 4). Similarly, the waste dumping in the river along with runoff from the landfills as well as industrial waste, especially from the metal finishing process in the Bukit area, might also have contributed to the increase in Cd concentration in the Langat River.

3.2.2. Chromium (Cr) Status in Relation with Physiochemical Parameters

The moderate decreasing trend in total Cr (R2 = 0.59) from upstream to downstream in the Langat River (Figure 3) also indicates the precipitation of Cr with the inverse trend of salinity (R2 = 0.73) from upstream to downstream in the river. Similarly, the significant positive (r = 0.728, p = 0.021) and negative correlation (r = −0.661, p = 0.037) of Cr with DO and salinity, respectively (Table S5), in the Langat River also indicates the precipitation of Cr downstream and a higher concentration in the upstream areas. The higher dissolved concentration of Cr was investigated at the upstream hilly area along with the deep forest, such as Pangsoon point (0.60 ± 0.56 µg/L), Lolo point (0.66 ± 0.36 µg/L) and Serai point (0.60 ± 0.04 µg/L), mostly because of weathering of the serpentinite rock-derived oxisols along the central belt of peninsular Malaysia [79]. However, the higher concentration of Cr 0.57 ± 0.32 µg/L at the midstream Cheras point indicates pollution from the metal finishing industries, such as electroplating, etching and preparation of the metal components for various industries, etc. [7,8,66]. Similarly, the corrosion inhibitors and pigments from the industrial effluents discharging into the river, along with lithogenic sources, also contribute to enhancing the concentration of Cr in the Langat River [35,69].

3.2.3. Lead (Pb) Status in Relation with Physiochemical Parameters

The higher concentration of Pb in the upstream area of the Langat River, e.g., Lolo point (20.72 ± 3.67 µg/L; Figure 4), is mostly from the natural weathering of Pb minerals along with the granite rock belt of the Titiwangsa Mountain Range in the basin. Several studies have also reported the weathering of Pb from minerals such as Teallite (PbSnS2), Galena (PbS) and Franckeite ((PbSn)6FnSn2Sb2S14), and are the vital sources of Pb concentration in the Langat Basin [67,80]. Moreover, the higher concentration of DO in the upstream could have also affected the rate of oxidation of organic compounds and increased the release of Pb from the minerals [80] because both the Pb and DO concentrations in the upstream are higher and they have a significant positive correlation (r = 0.612, p = 0.053, Table S5). On the contrary, there were much lower Pb concentrations in the downstream areas, probably due to dilution as well as lower atmospheric Pb inputs into the downstream areas [81]. Apart from the natural weathering process, the use of fertilizers such as arsenal herbicides (i.e., lead arsenate) in agricultural activities [32], mainly in palm oil plantations [36,38] as well as in tin mining [39,49], are the critical sources of Pb in the Langat River. Similarly, the higher concentration of Pb in the midstream Cheras point, i.e., 11.46 ± 1.45 µg/L, also indicates the pollutants from anthropogenic sources, such as electroplating, automobile exhaust, mining, etc., along the river basin [35,69]. The concentration of dissolved Pb represents a decreasing trend (R2 = 0.48; Figure 3) from upstream to downstream of the river. The dilution of Pb from upstream to downstream might be because of the moderate increasing trend in salinity (R2 = 0.73) from up to downstream; a negative correlation between Pb and salinity (r = −0.649, p = 0.041) was also observed in the river. Lim et al. [30] also claimed that salinity and conductivity have a strong influence on the dissolution of Pb from up to downstream of the Langat River. A higher salinity might have dissolved the concentration of the Pb, which was also reported by Sultan et al. [67] in the Terengganu River from upstream to downstream towards the South China Sea.

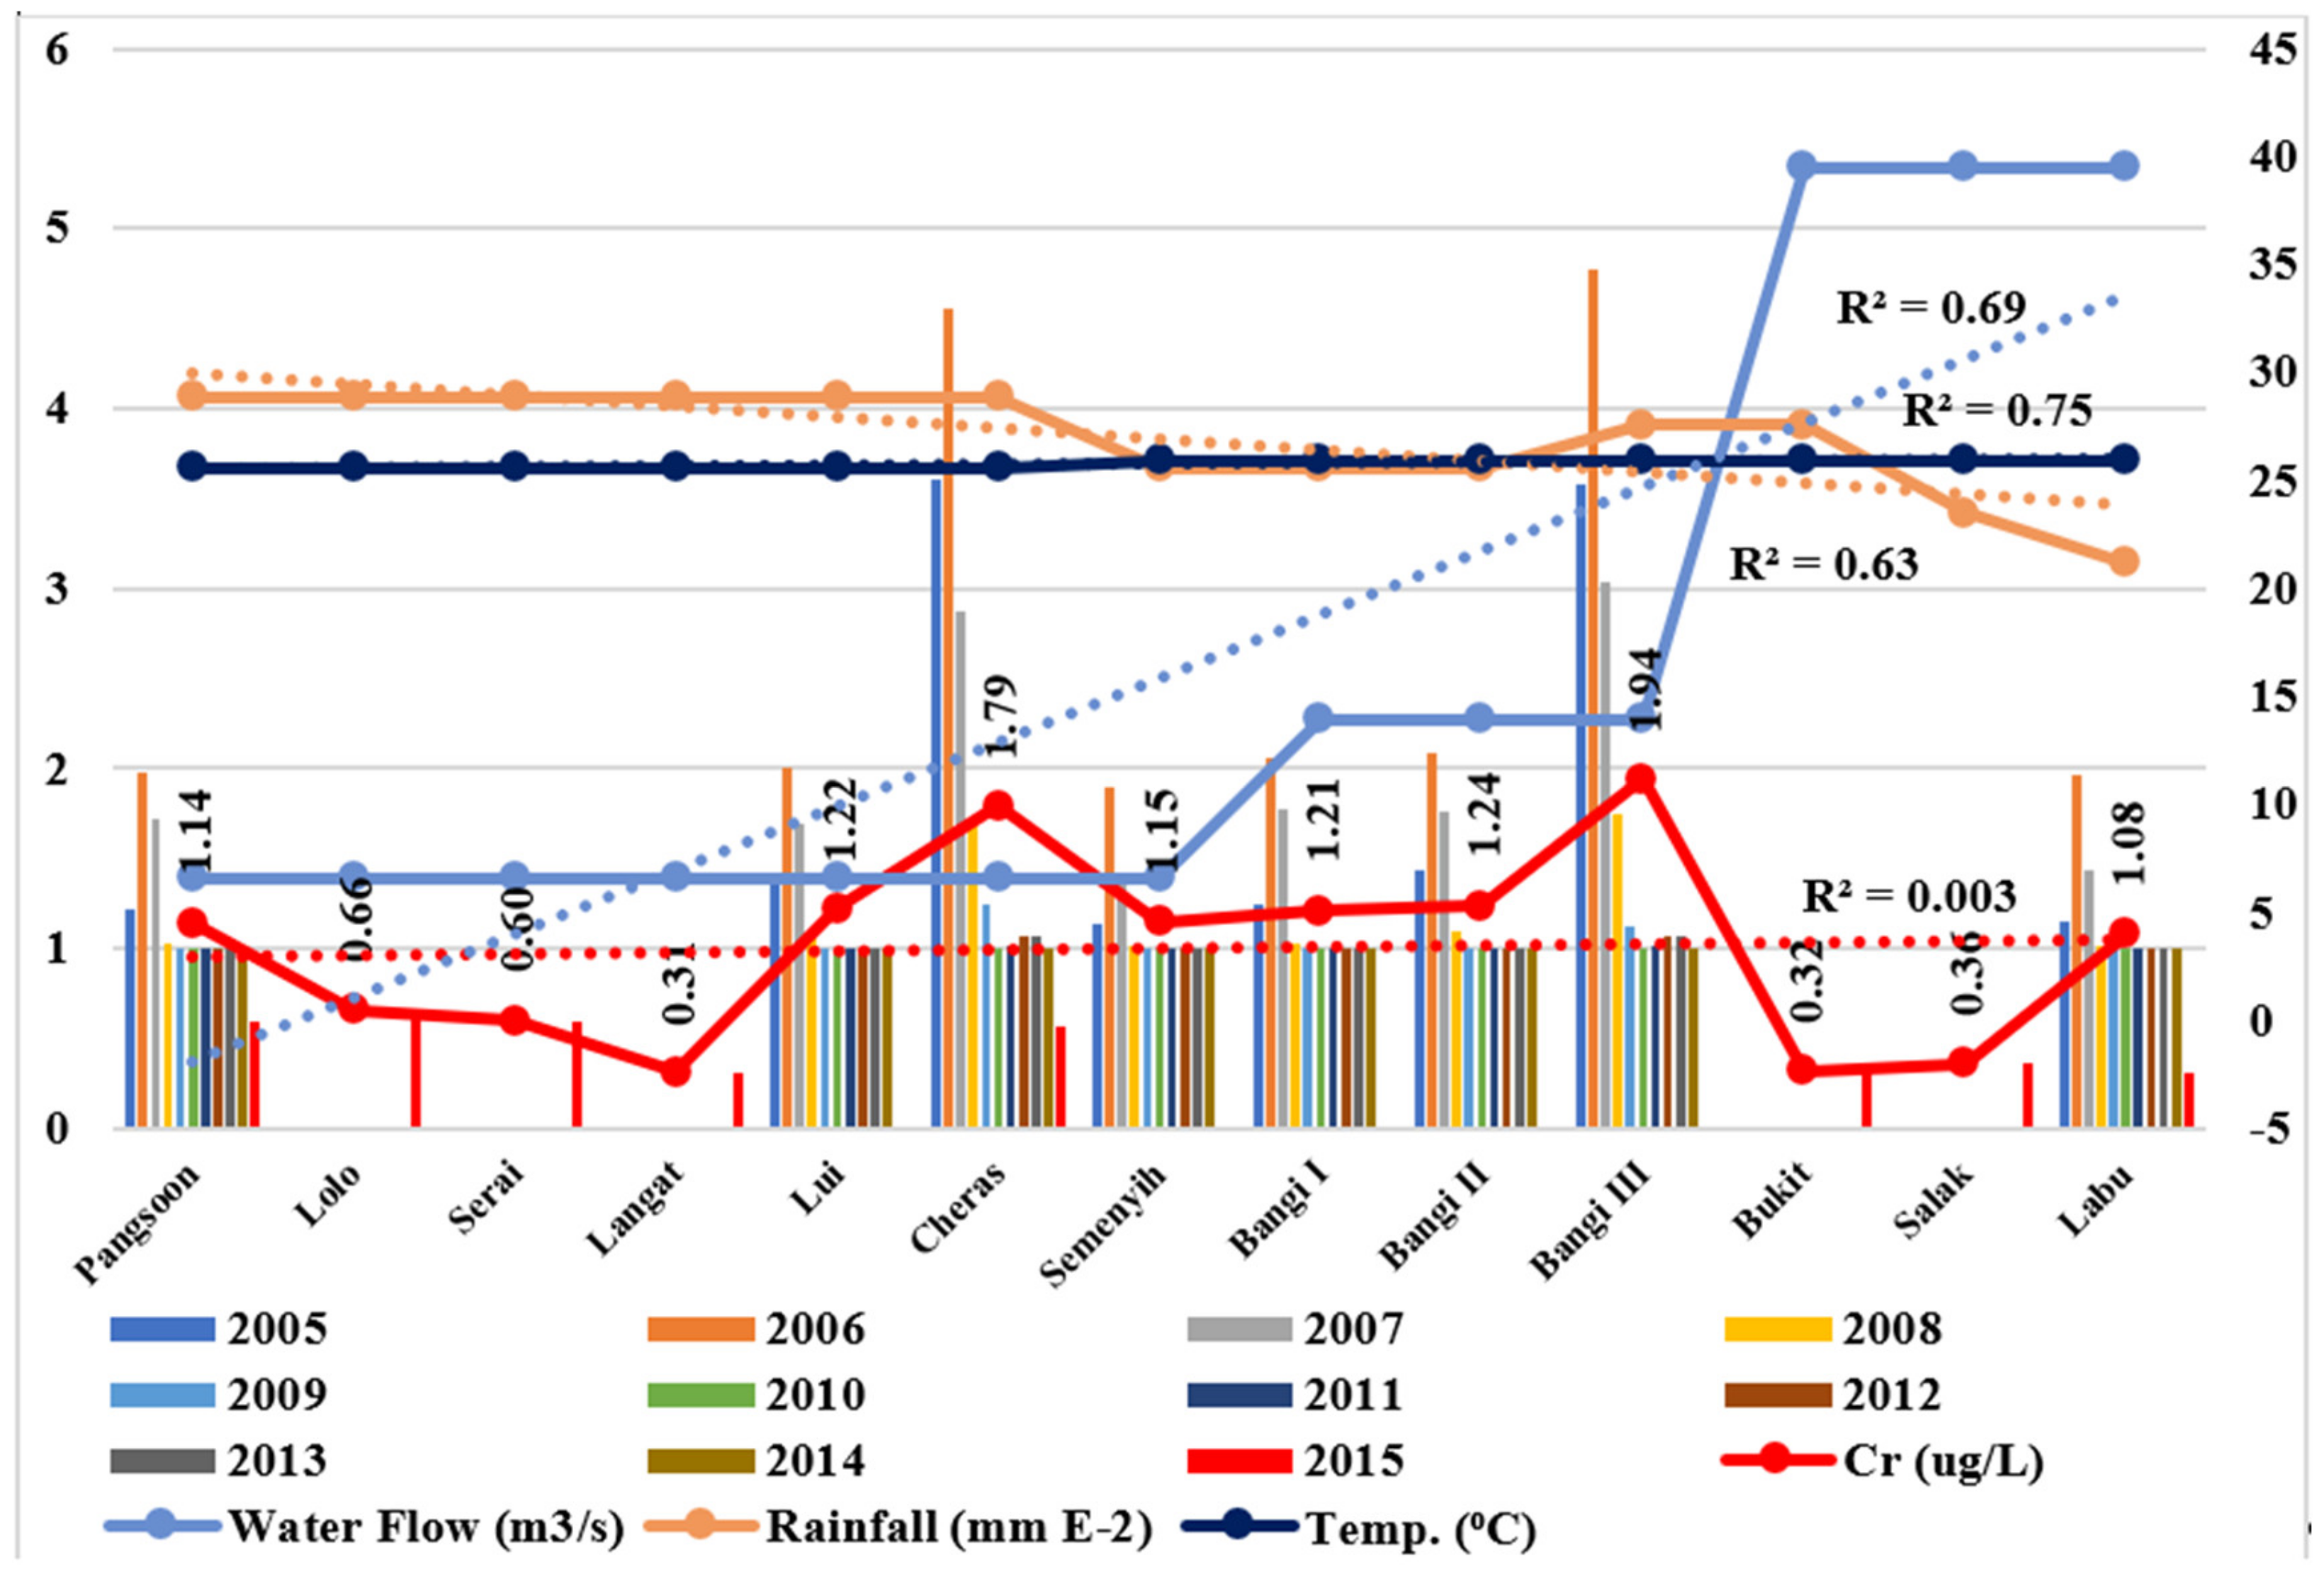
3.3. Spatial Distribution of Cd, Cr and Pb in the Langat River during 2005–2015

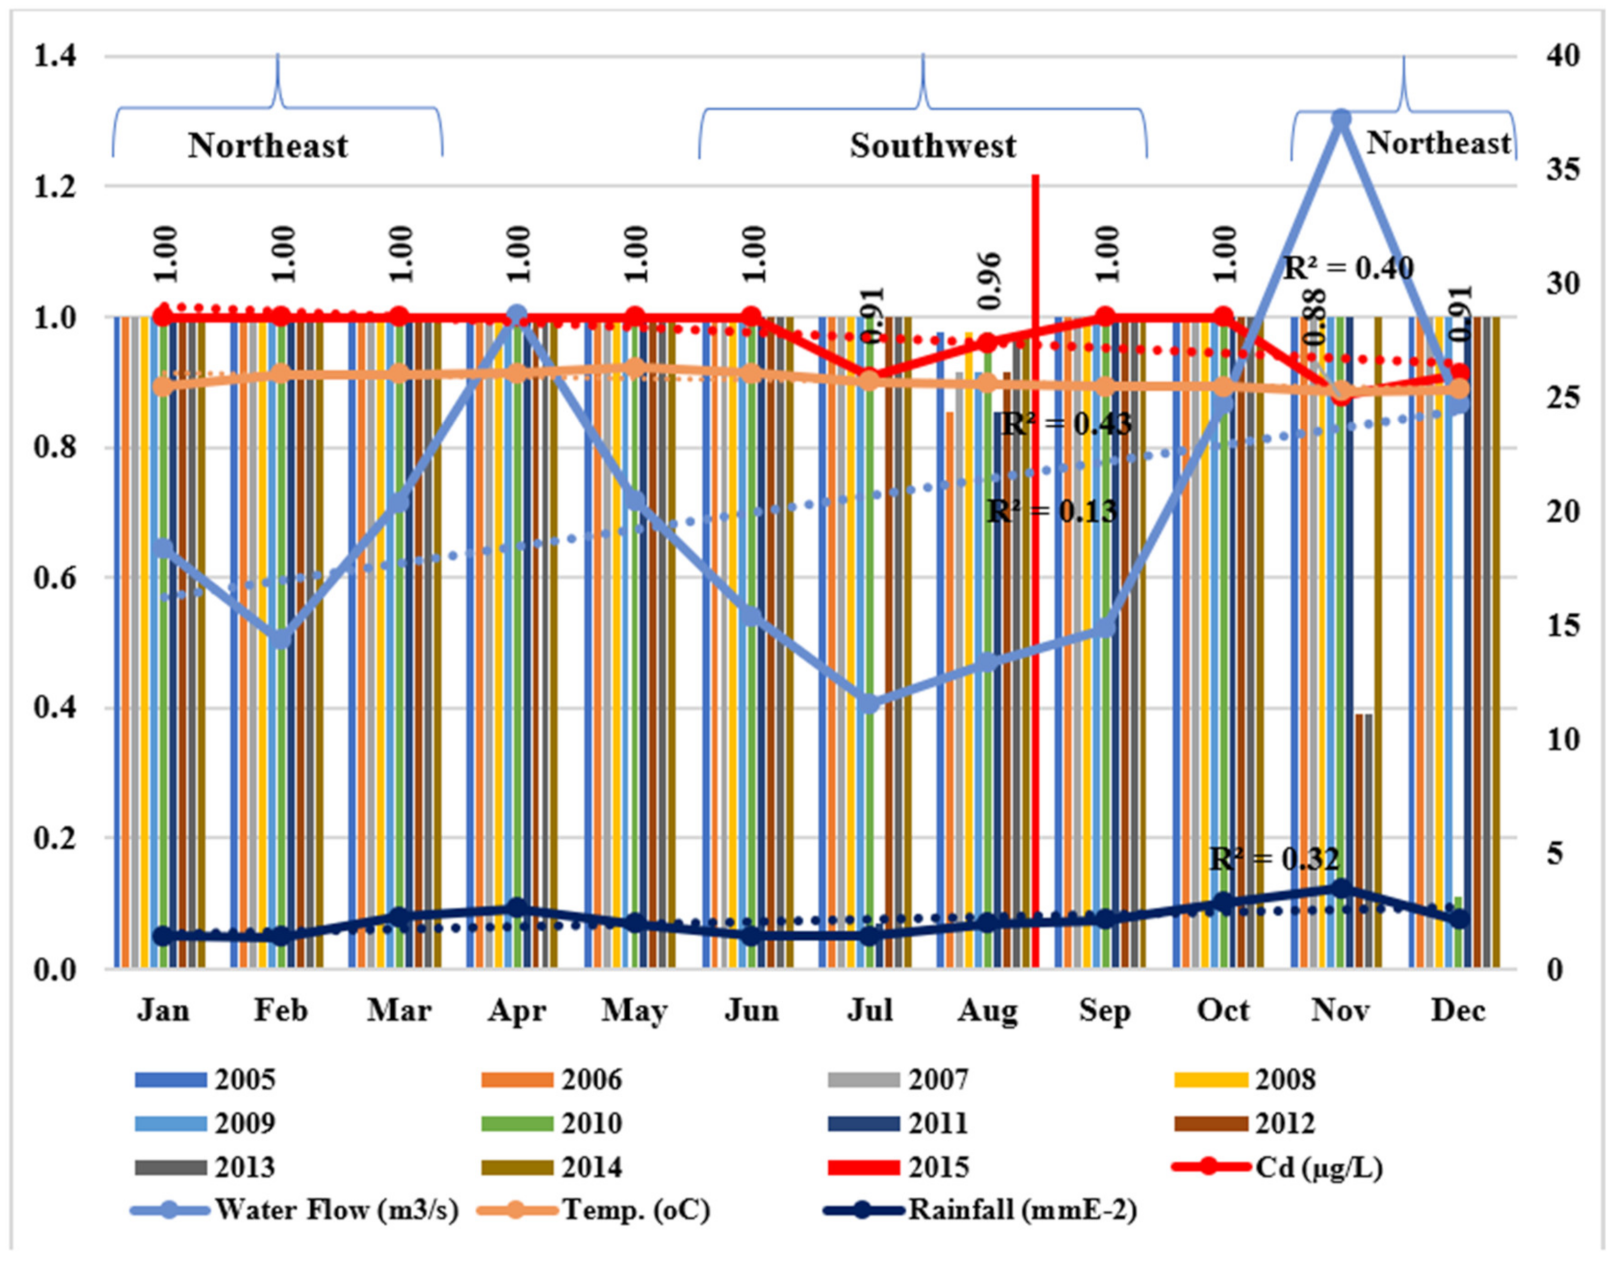
The negative correlation between the Cd concentration and water flow (r = −0.584, p = 0.018) in the Langat River (Table S6) indicates the dilution trend of Cd (R2 = 0.46) towards the downstream areas (
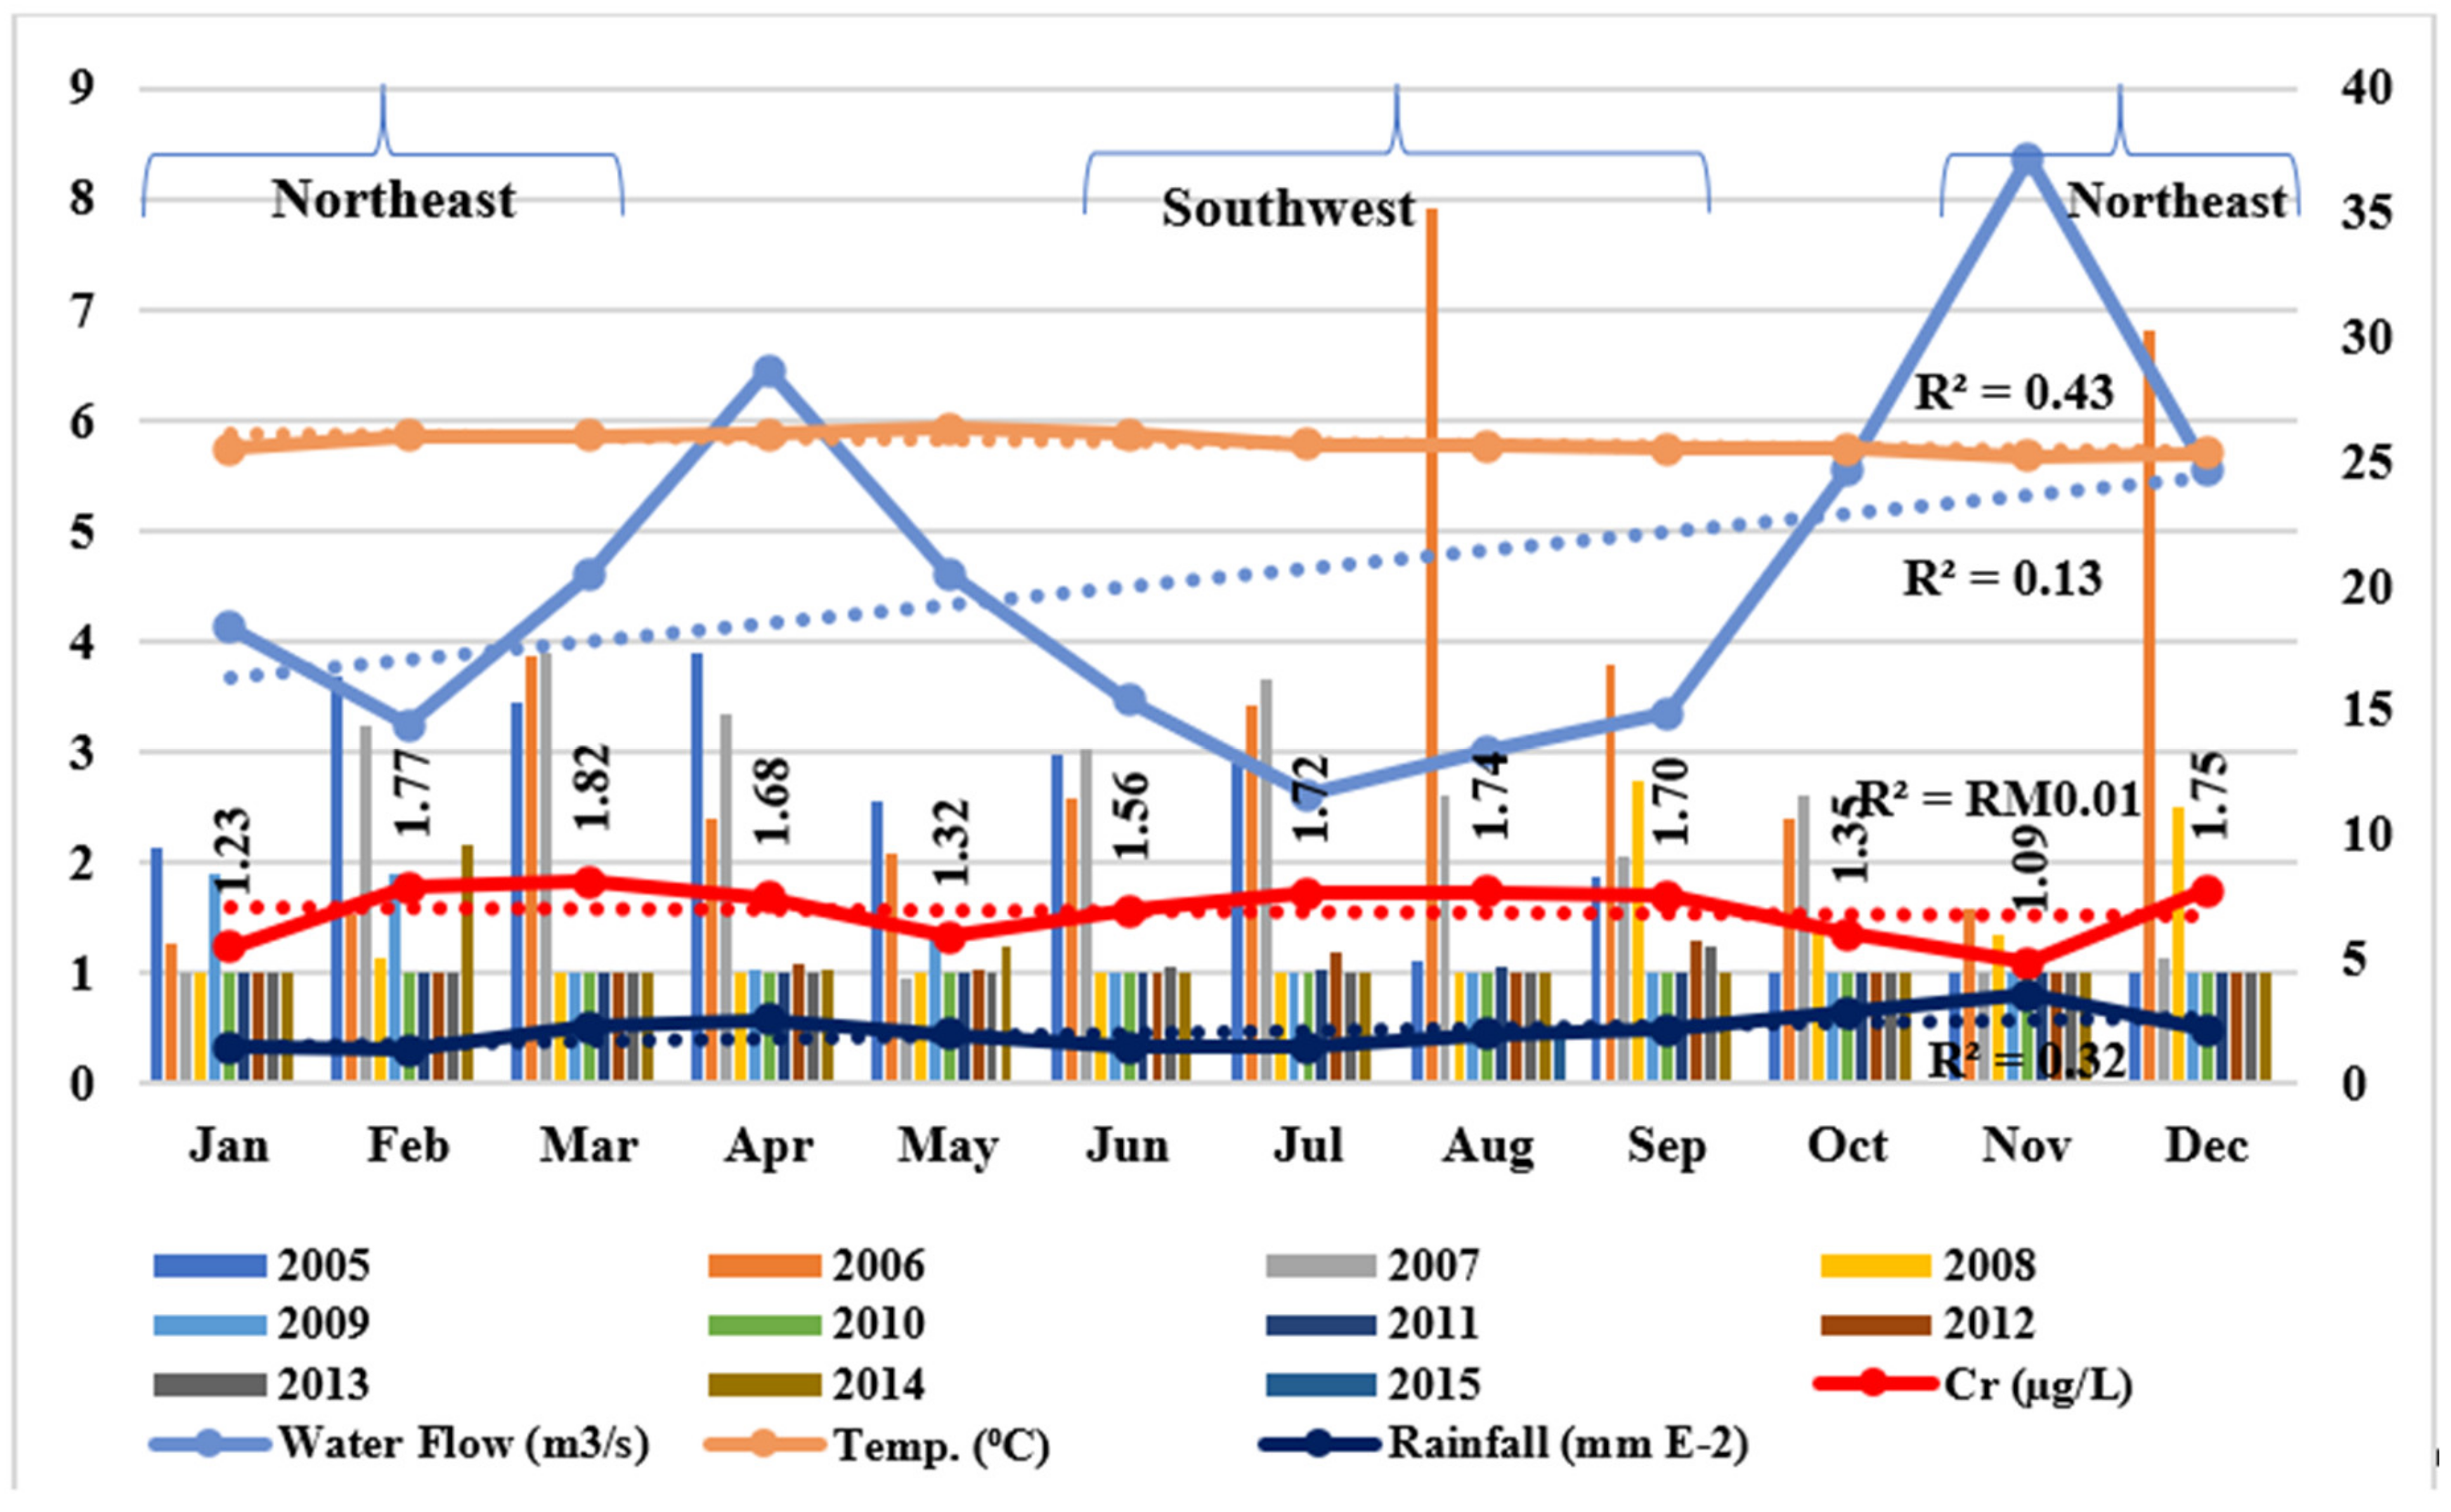
Figure 5). However, the Cr concentration has no significant trend in the river, although the higher mean Cr concentration (2005–2015) in the midstream indicates attribution of Cr through anthropogenic inputs along with natural factors. Moreover, there is no significant correlation between the Cr concentration and water flow in the river; however, water flow has a moderate increasing trend (R2 = 0.69) towards the downstream area (Figure 6), whereas the Cr concentrations that are lower in the downstream areas indicates a dilution of Cr.
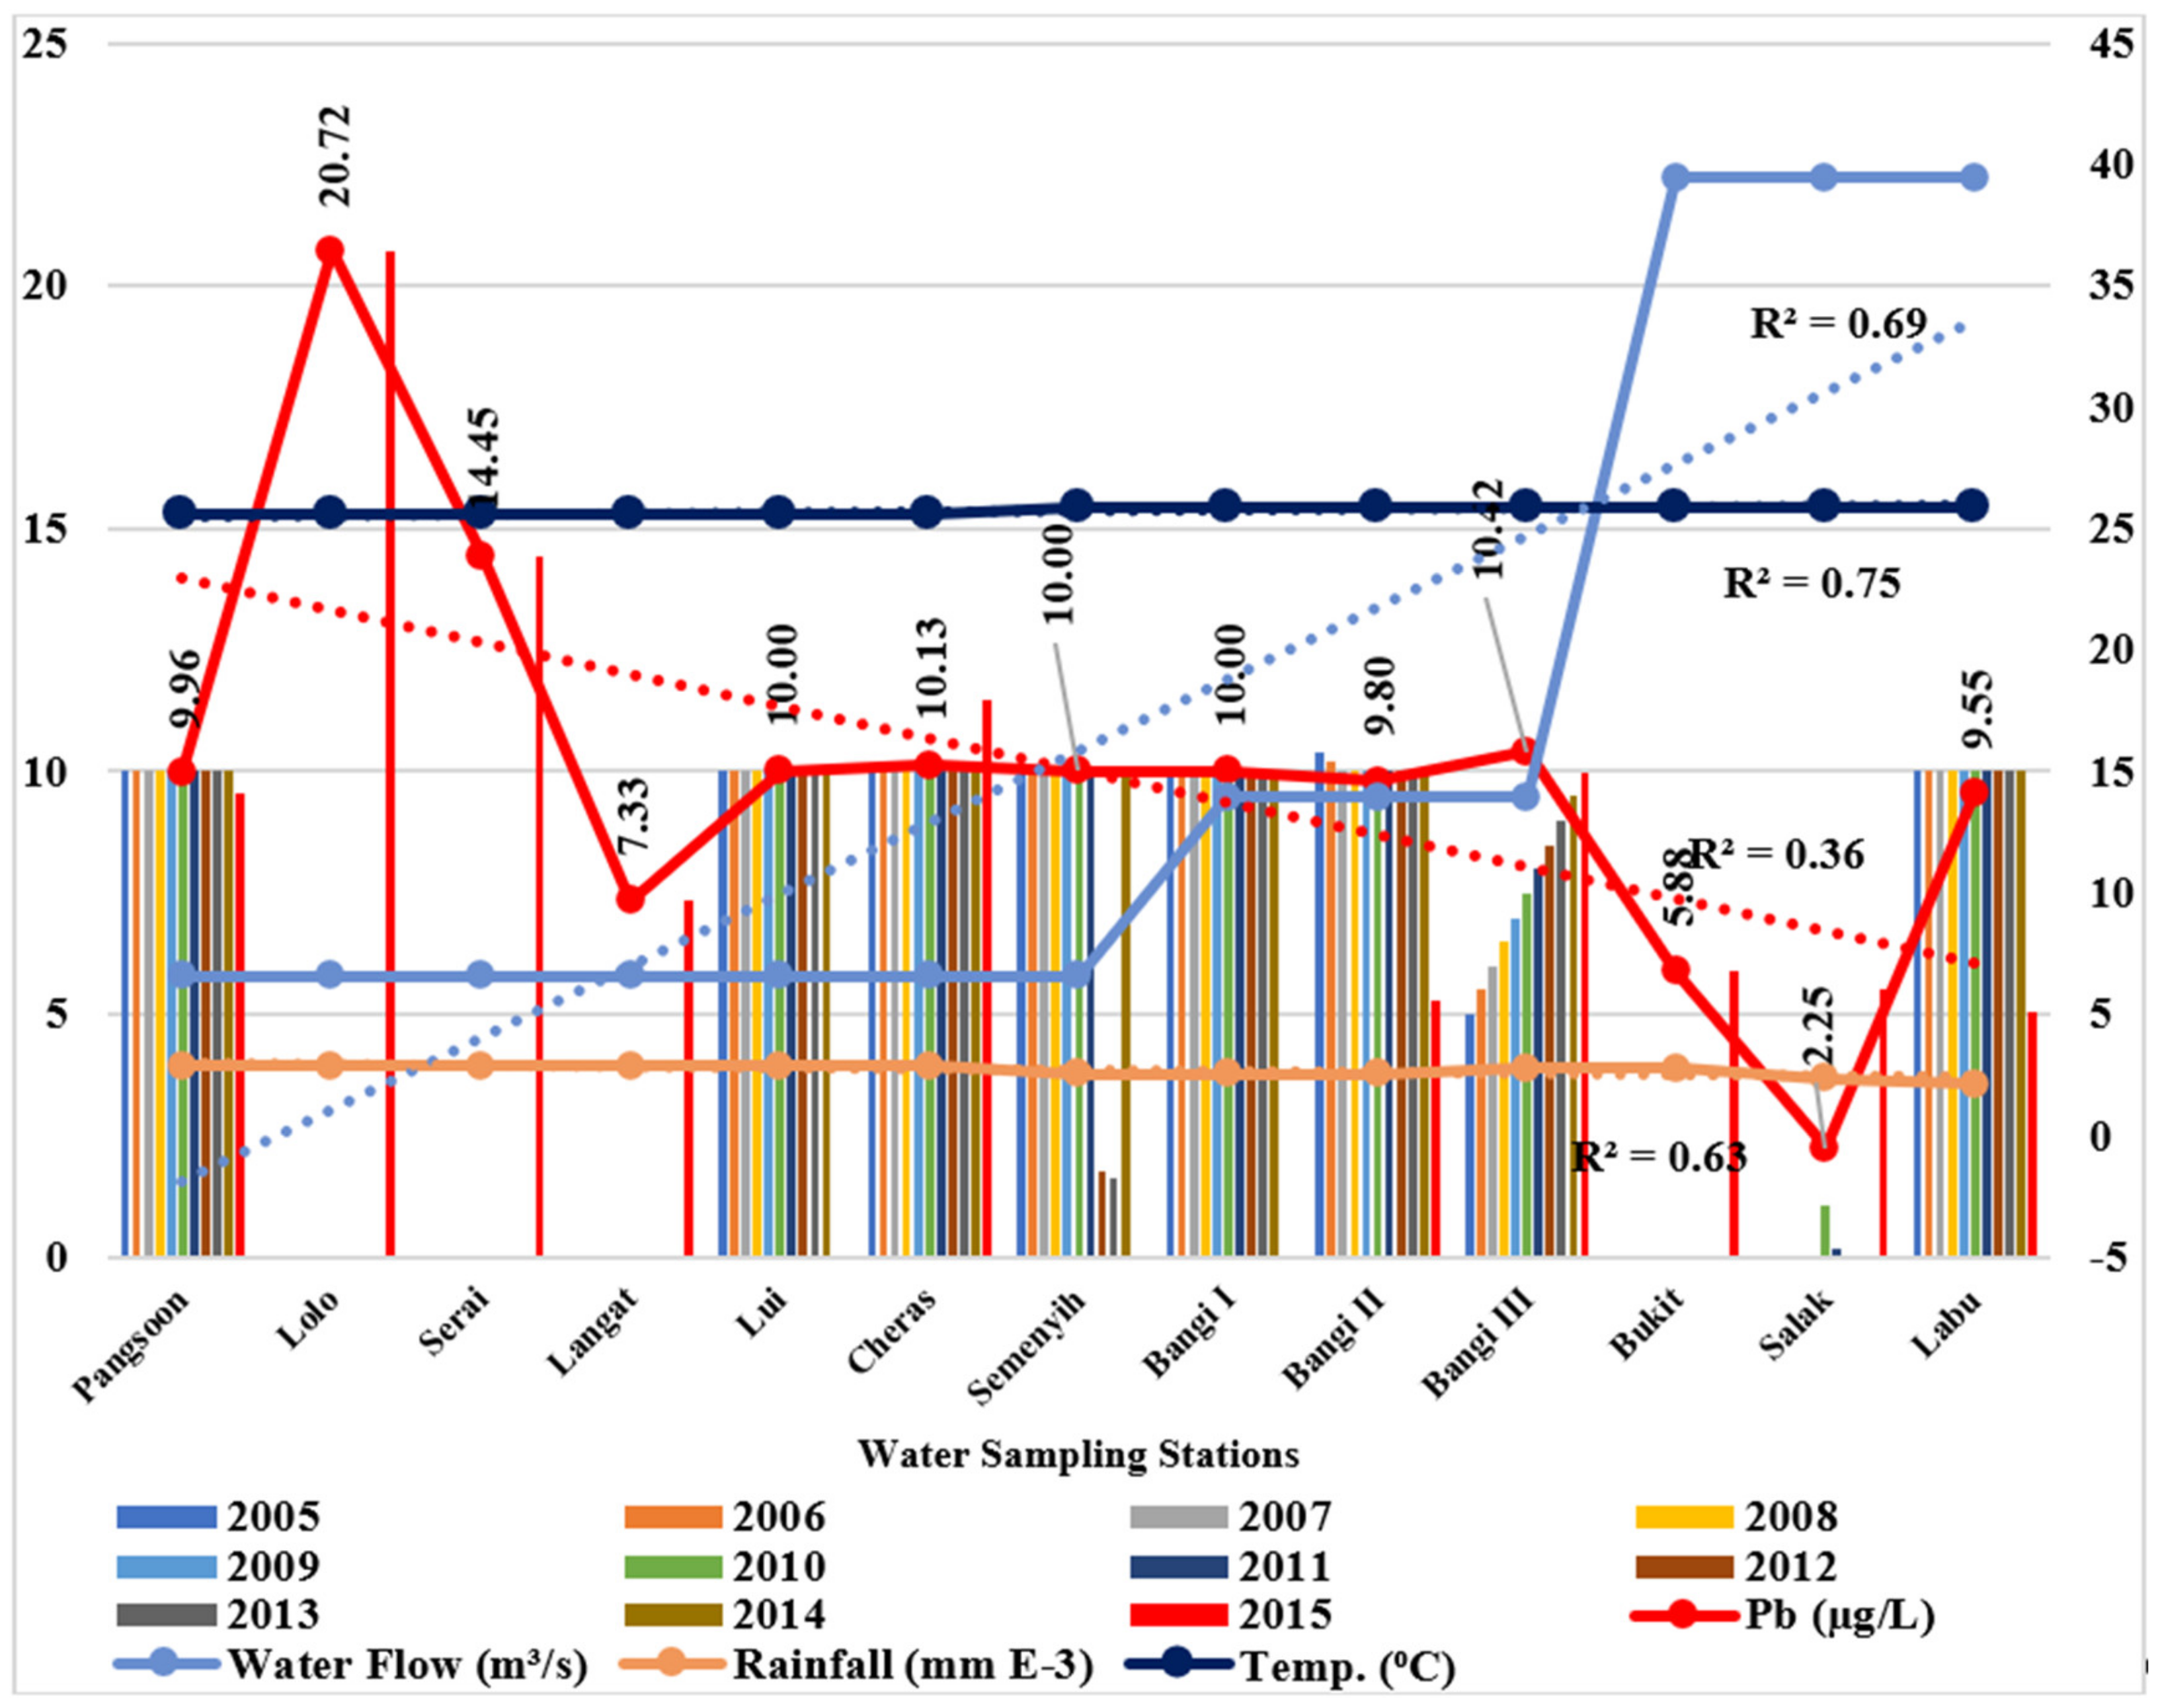
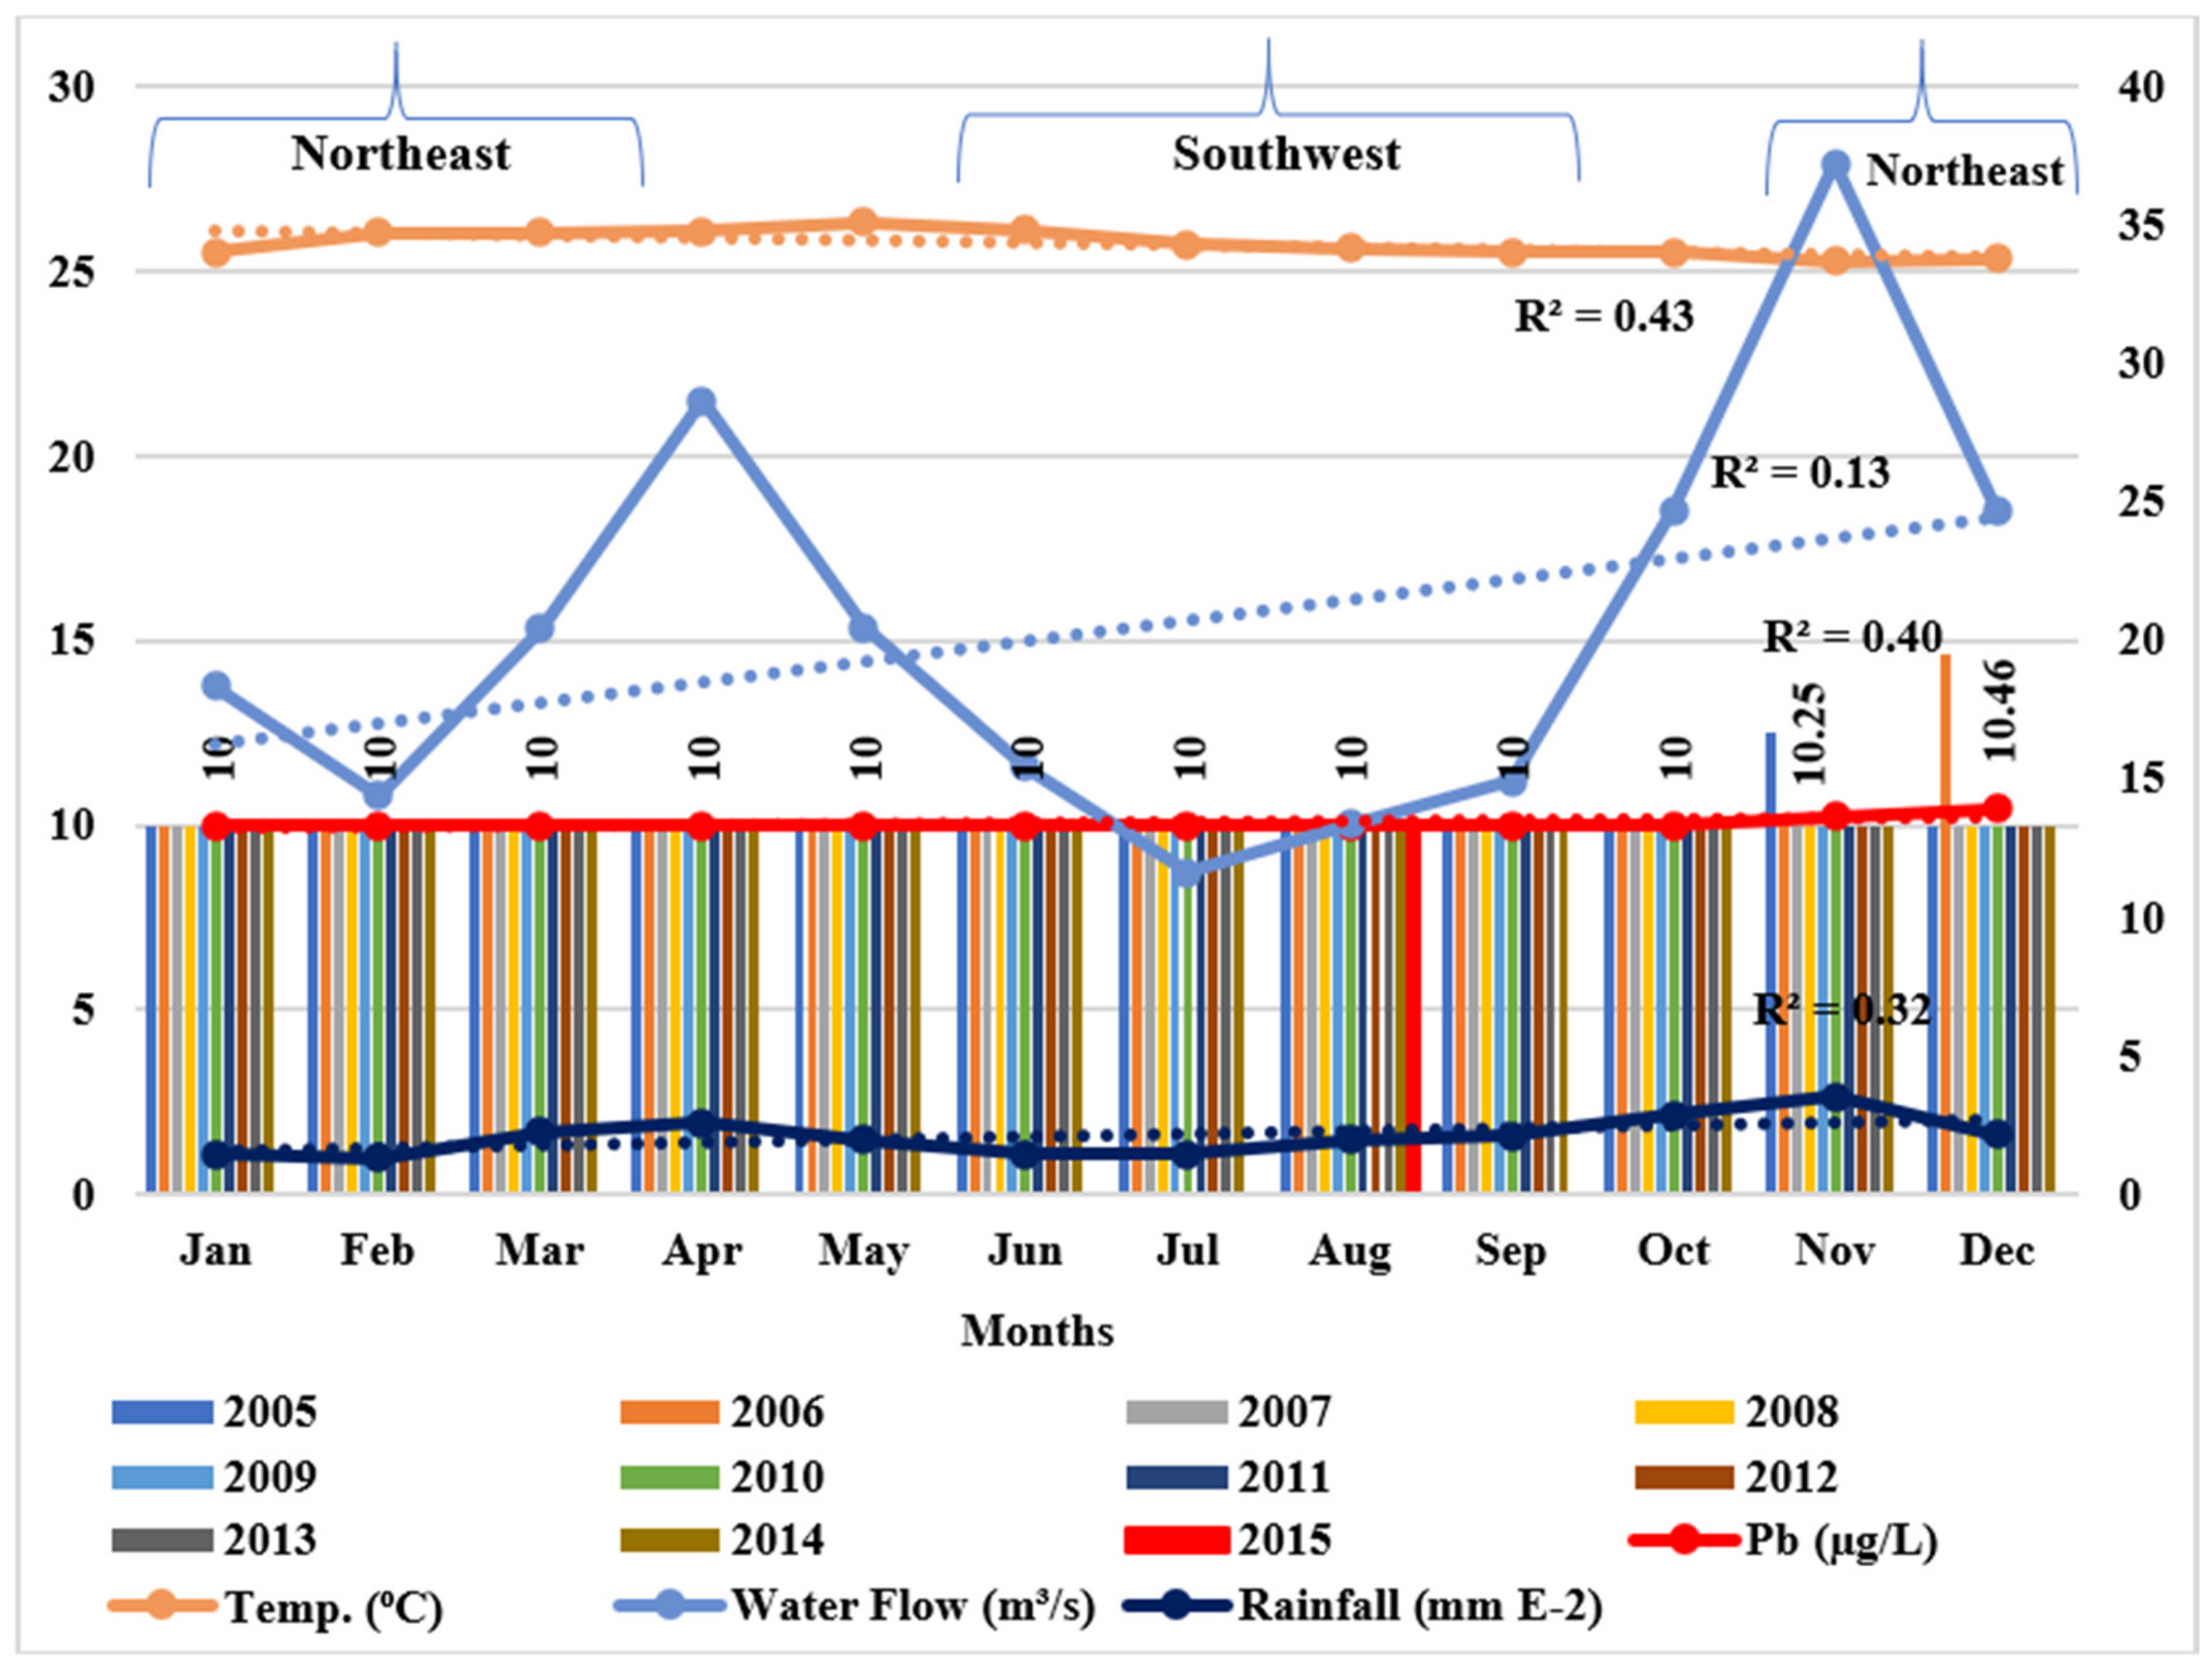
The mean Pb concentration (2005–2015) in the Langat River also shows a decreasing trend (R2 = 0.36) towards the downstream areas of the river (Figure 7), and might be because of dilution due to the increasing trend of water flow (R2 = 0.69) from up to downstream. The Pb concentration and water flow in the Langat river also had a significant negative correlation (r = −0.576, p = 0.02, Table S6). Therefore, the higher Pb concentration in the upstream areas of the Langat River might be mainly from the natural sources and the concentration dilutes downstream with the increase in water flow. The negative spatial correlation (2005–2015) between water flow and rainfall (r = −0.718, p = 0.003) as well as rainfall and temperature (r = −0.765, p = 0.001) indicate uncertain rainfall patterns within the basin due to a changing climate, whereas a temporal correlation (2005–2015) between rainfall and water flow shows a significant positive correlation (r = 0.882, p < 0.001).

3.4. Temporal Distribution of Cd, Cr and Pb in the Langat River during 2005–2015

The temporal distributions (2005–2015) of the Cd (R2 = 0.40, Figure 8) and Cr (R2 = 0.01, Figure 9) concentrations in the Langat River show a decreasing trend due to the influence of monsoons in the basin. Cd concentration and rainfall in the basin has a negative correlation (r = −0.678, p = 0.011, Table S7), which indicates that the higher water flow due to heavy rainfall has diluted the Cd concentrations in both monsoons. On the contrary, the higher mean Cr concentration of 1.75 µg/L in the northeast monsoon (Figure 9) might be due to the heavy rainfall-induced higher runoff in the river, attributing to the Cr concentration.
The temporal distribution of the Pb concentration (2005–2015) in the Langat River shows an increasing trend (R2 = 0.40, Figure 10) in the Langat River and a higher Pb concentration in northeast monsoon (November–March) indicates higher rainfall-induced water flow brings massive surface runoff into the downstream areas of the river, attributing to the Pb concentration. Moreover, the non-significant correlations between the Pb concentration, water flow and rainfall (Table S7) indicate that the Pb is added both from natural and anthropogenic sources.

3.5. Predicting the Metal Concentration in the Langat River

The Shapiro–Wilk normality test at the 0.05 level indicates that the river water quality parameter’s data are typically distributed, except for DO (p = 0.081) and TDS (p = 0.123), which were log-transformed for the multiple regression model analysis (Table S8). The multiple linear regression model (Table 5) was used to predict the Cd, Cr and Pb concentrations (i.e., dependent variable) in the Langat River, including the dependent variables’ interaction with the other water quality parameters (i.e., independent variable).
Model 1 (Cd), Model 2 (Cr) and Model 3 (Pb) projected about 71.7%, 45.7% and 79.9% of the variance (i.e., adjusted R2) to explain the models, respectively (Table 5). The ANOVA test was also found significant for Model 1 (F = 6.836; p = 0.001), Model 2 (F = 2.936; p = 0.036) and Model 3 (F = 10.137; p = 0.000127). Therefore, dissolved Cd (model 1), Cr (model 2) and Pb (model 3) have linear relationships with the other measured independent variables, respectively. The calculated VIF value for all the models were also less than 2.5, which indicates non-multicollinearity of the data. Similarly, the Durbin–Watson’s test also estimated the critical values for the Cd (d = 1.48), Cr (d = 1.47) and Pb (d = 1.14) models, and indicated that there was no first order linear autocorrelation in the multiple linear regression data.
The multiple linear regression of the Cd (i.e., Model 3) concentration was highly influenced by the Pb (p < 0.01), Cr (p < 0.05) and TDS (p < 0.10). Therefore, 1 µg/L of Pb, a 1 µg/L Cr increase and 1 mg/L TDS decrease in the Langat River will increase 0.785 µg/L and 0.337 µg/L of Cd and will decrease −0.883 µg/L of Cd, respectively. Similarly, the Cr (i.e., Model 4) concentration will be influenced by the Cd (p < 0.10), conductivity (p < 0.05) and salinity (p < 0.05). Hence, 1 µg/L of Cd, a 1 µS/cm SPC increase and a 1 ppt salinity decrease will enhance the concentration of Cr, i.e., 0.647 µg/L and 5.007 µg/L, and will decrease the concentration of Cr by −4.962 µg/L, respectively, in the river. Furthermore, the concentration of Pb (i.e., Model 5) was positively influenced by the dissolved Cd (p < 0.01) in the Langat River. It was also estimated that an increase of 1 µg/L Cd in the Langat River would increase Pb by 0.559 µg/L in the Langat River.
Meanwhile, several studies have reported higher TDS in the Langat River due to inorganic compounds both from the anthropogenic and natural sources [32,38,69]. Similarly, the WHO [82] reported TDS as an important indicator to confirm the presence of dissolved trace metals, which might be due to the influence in the ion-exchange mechanism to increase the dissolved concentration of metals through desorption of the trace metals from the sediment. Aside from the natural sources, steel manufacturing and metal finishing factories in the basin are the important sources of Pb in the river. Moreover, Helmers and Rutgers [83] reported that in the tropical region wet deposition is the common source of dissolved Pb. Similarly, Cd, Cr and Pb can be considered as better predictors to confirm the presence of dissolved Cd (Model 2), Cr (Model 3) and Pb (Model 4), respectively, in the Langat River. Common sources of these trace elements in the river are the natural weathering mechanism of Main Range Granite rock along the Langat River Basin; for example, weathering of Cr from the serpentinite rock-derived oxisols [79], and weathering of Pb from minerals such as Teallite (PbSnS2), Galena (PbS) and Franckeite ((PbSn)6FnSn2Sb2S14) [67,84].
The multiple linear regression model for the dissolved Cd, Cr and Pb:
Cd = β 0 + β 1 Cr + β 2 Pb + β 3 log DO + β 4 SPC + β 5 log TDS + β 6 SAL + β 7 pH + β 8 Temp + ε i
Cr = β 0 + β 1 Cd + β 2 Pb + β 3 log DO + β 4 SPC + β 5 log TDS + β 6 SAL + β 7 pH + β 8 Temp + ε i
Pb = β 0 + β 1 Cd + β 2 Cr + β 3 log DO + β 4 SPC + β 5 log TDS + β 6 SAL + β 7 pH + β 8 Temp + ε i
where:
  • β = Coefficient
  • Cd = Controlled Variable (Cadmium)
  • Cr = Controlled Variable (Chromium)
  • Pb = Controlled Variable (Lead)
  • DO = Controlled Variable (Dissolved Oxygen)
  • SPC = Controlled Variable (Conductivity)
  • TDS = Controlled Variable (Total Dissolved Solids)
  • SAL = Controlled Variable (Salinity)
  • pH = Controlled Variable
  • Temp = Controlled Variable (Temperature)
  • ε_i = Error

3.6. Water Quality Index (WQI)

The determined physicochemical water quality parameters, such as biological oxygen demand (BOD), chemical oxygen demand (COD), ammoniacal nitrogen (AN) and suspended solids (SS), were ranked Class III (Table S9), which demands extensive treatment of the raw water before drinking (Tables S10 and S11). The deteriorated physicochemical water quality status of the Langat River indicates the runoff of excessive nutrients as well as discharge of waste from industrial and urban areas.
Similarly, the determined water quality sub index of the Langat River indicates the river is slightly polluted in terms of both BOD and COD. In terms of the determined sub index of SS, i.e., 33.75 (Table S12), the Langat river is ranked polluted in the range of 0–69 (Table S13).
Therefore, the overall water quality index (WQI) of the Langat River is ranked in Class II (Tables S14 and S15), which defines Langat is a clean river; however, the midstream of the river, such as the Langat, Cheras Mile 11 and Bukit Tampoi points, are ranked as Class III. Hence the Class III status of the river indicates slight pollution and it requires extensive treatment before drinking.

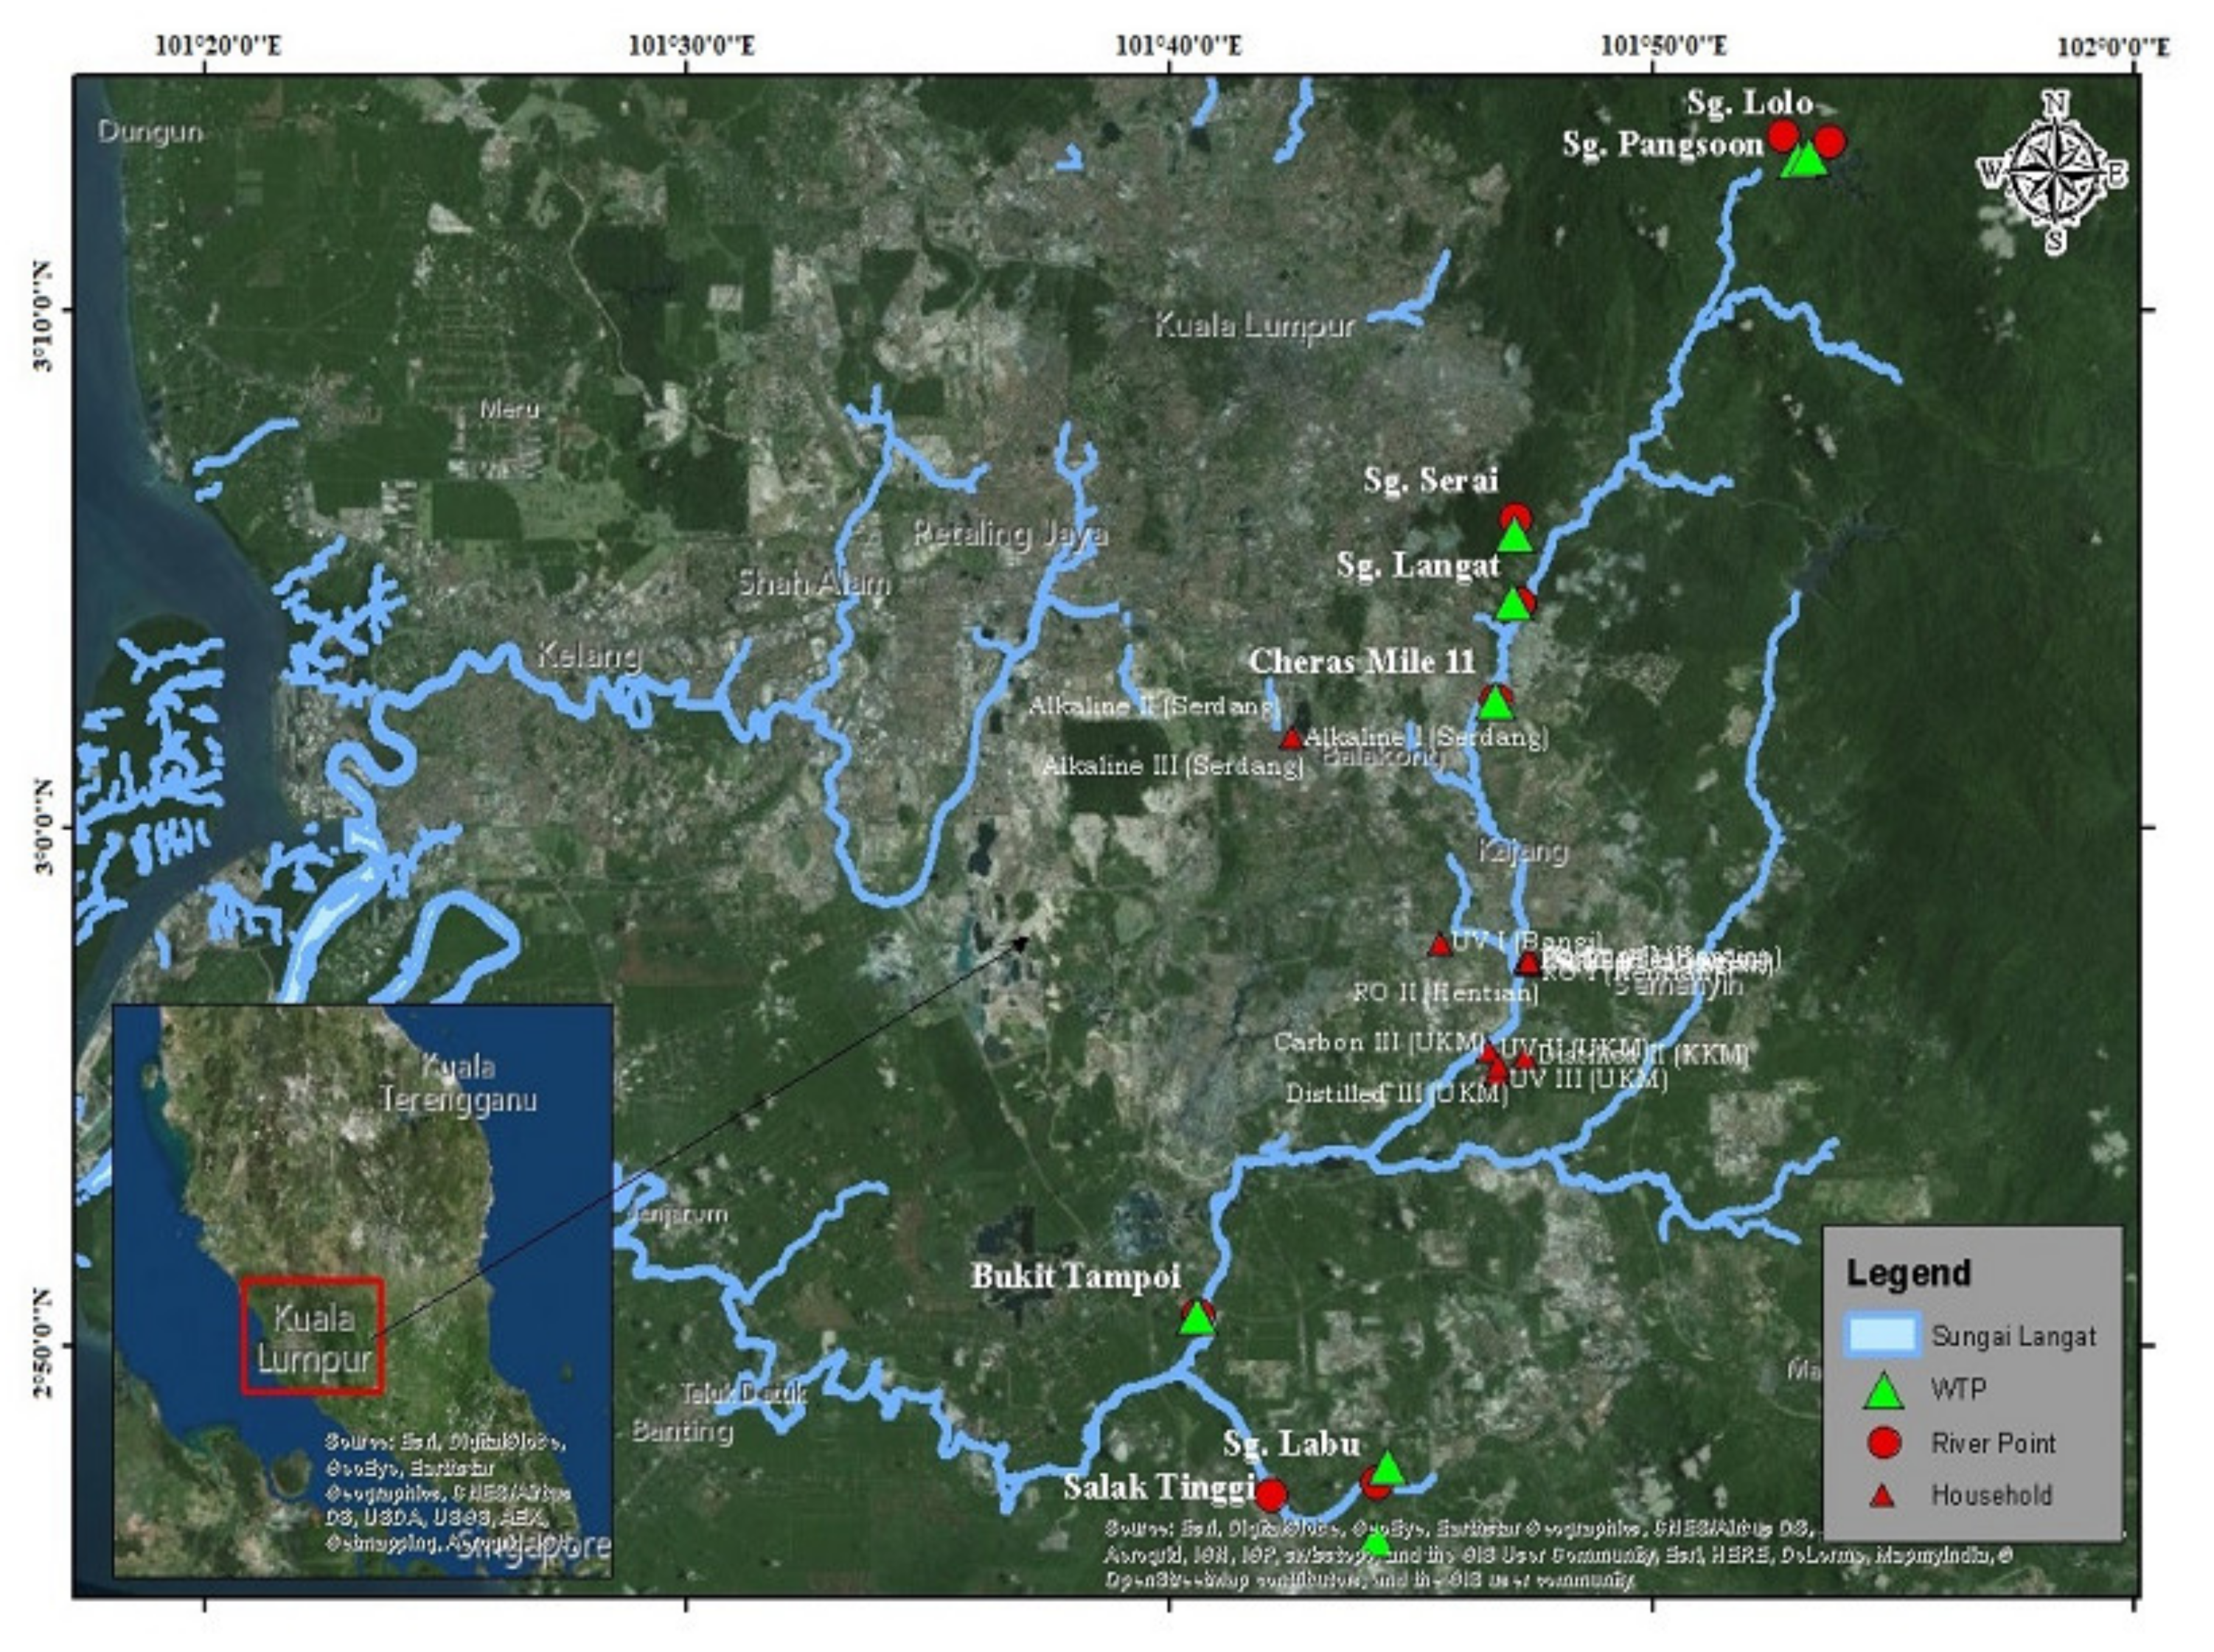
3.7. Cd, Cr and Pb Status in Drinking Water Supply Chain

The mean concentration of Cd (0.42 ± 0.31 µg/L), Cr (0.21 ± 0.14 µg/L) and Pb (4.78 ± 2.5 µg/L) in the treated water based on all the water treatment plants (WTPs) at the Langat River Basin, Malaysia was within the Malaysian drinking water quality standard of 3 µg/L, 50 µg/L and 10 µg/L, respectively; however, the maximum Pb concentration, 10.83 µg/L (Table 6), was found in the treated water, which might be due to inadequacies in the conventional water treatment method to remove Pb entirely from the treated water.
The average Cd, Cr and Pb concentration removal efficiency by the WTPs was determined 65.69%, 55.07% and 52.17%, respectively, at the Langat River Basin, Malaysia, based on a single sampling event (Figures S1–S3); however, an extensive 24-h long-term monitoring is required to calculate the significant efficiency of the plants, since the turbidity of the river changes very frequently in the tropics. The range of Cd (45.47% to 90.17%), Cr (21.47% to 83.45%) and Pb (1.98% to 87.75%) concentration removals in the treated water at the basin indicates the limitation of the conventional coagulation method of water treatment. The presence of the Cd, Cr and Pb concentrations in the treated water mainly originated from the raw water due to natural sources, along with dissolution of these metals in the acidic water during treatment due to the use of Al2(SO4)3 (alum) for water disinfection. The frequent turbidity changes in the raw water at the tropics due to uncertain flash floods make it difficult to mix the chemical doses manually during treatment. The volume of water treatment regarding the designed capacity along with an old galvanized pipeline in the plants might have also attributed to the Cd, Cr and Pb concentrations in the treated water. Therefore, the treated water quality needs to be improved through modifying and upgrading the current water treatment method in the plants.
The mean dissolved concentration of Cd in the supply water of the basin was estimated as 0.42 ± 0.19 µg/L (Table 7) and the concentration of Cd was far below the drinking water quality standard proposed by the MOH and WHO (3 µg/L). The higher concentration of dissolved Cd was observed at the location Hentian Kajang II (0.75 ± 0.02 µg/L), followed by the location UKM III (0.73 ± 0.04 µg/L). The higher concentration of dissolved Cd in the water distribution system might be due to the corrosion in the galvanized (i.e., zinc-coated) pipeline as well as cadmium-containing solders in fittings and taps in the distribution system because of the lower pH occurring from the use of lime in water treatment. Hence, the leaching of Cd from the galvanized pipe occurs because of the presence of Cd and Pb impurities in the zinc [85] of the galvanized pipes along with the residence time of the water in the distribution network [86].
Similarly, the mean concentration of dissolved Cr in the supply water of the basin was investigated (0.37 ± 0.21 µg/L; Table 8), and it was very little compared to the maximum limit of the drinking water quality standard proposed by the MOH, WHO and EC, i.e., 50 µg/L. A higher concentration of dissolved Cr was recorded at the location Hentian Kajang VI (0.71 ± 0.41 µg/L), followed by the location UKM III (0.63 ± 0.02 µg/L). The higher concentration of dissolved Cr in the Hentian Kajang and UKM areas might be due to corrosion of Cr from the steel pipe, which is comprised of steel alloy and chromium, in the drinking water distribution system [87,88]. Moreover, the stagnant water period in the water distribution system is also an important factor of increased concentration of dissolved Cr in the supply water [89].
Accordingly, the average Cr and Pb concentration in the tap/supply water, 0.37 ± 0.21 µg/L and 4.85 ± 1.87 µg/L (Table 9), respectively, at the basin was determined as a little bit higher than the mean concentration of Cr and Pb in the treated water, 0.21 ± 0.14 µg/L and 4.78 ± 2.50 µg/L, respectively. The higher concentration of Cr and Pb in the tap water might be due to leaching/corrosion in the galvanized steel pipe. Leaching from the lead pipe, galvanized steel pipe along with PVC pipe plasticized with lead are the possible sources of dissolved Cr and Pb in the supply/tap water of Malaysia [51,90].
The mean concentration of dissolved Pb (4.85 ± 1.87 µg/L) in the supply/tap water of the Langat River Basin (LRB), Malaysia, was determined safe concerning the drinking water quality standard (Table 7), because it was within the stipulated limit of 10 µg/L set by the Malaysian Ministry of Health (MOH) and World Health Organization (WHO), respectively. However, a high level of mean Pb concentration was found in the Hentian Kajang VI area (7.77 ± 1.42 µg/L) followed by the Hentian Kajang II area (6.53 ± 2.27 µg/L) (Table 7). The high dissolved concentration of Pb in the supply water might be primarily from corrosion of the galvanized iron (i.e., zinc coated) pipe [85,91,92] as well as PVC pipe where Pb is used as a stabilizer for manufacturing [93]. Moreover, the combination of copper piping with lead soldering at the household level can produce galvanic corrosion, leaching lead even in relatively non-corrosive water [94].
The average Pb concentration in the supply water (4.85 ± 1.87 µg/L) of the basin was determined 1.49% higher than the mean Pb concentration in the treated water (4.78 ± 2.50 µg/L); however, the 62.55% higher Pb concentration that was found at the location Hentian Kajang VI might be due to the repairing activities of the reticulation system at the household level. The mix uses of copper pipes with lead solders at the household level may have produced galvanic corrosion to leach lead even with the non-corrosive water. Similarly, the higher Pb concentration at Serdang II (20.50%) and Serdang III (36.40%) indicates a long water stagnant and corrosion of Pb from the galvanized iron pipe as well as erosions of natural deposits, especially in the old apartment houses. Moreover, the raw water treatment process at the water treatment plants can only filter up to a certain size of particulates. It can filter most particles, but very fine particles like minerals can still pass through the filtration process, such as coagulation, agglomeration, sedimentation, sand filters, and so forth [95]. For example, conventional water treatment methods can remove a particle size of about 0.5 µm [96], whereas the lead and aluminium ions along with other metal ions could be <0.000174 µm [97,98,99].
The mean concentrations of dissolved Cd (0.42 ± 0.19 µg/L), Cr (0.37 ± 0.21 µg/L) and Pb (4.84 ± 1.87 µg/L) in the supply (i.e., tap) water of the Langat River Basin (LRB), Malaysia, were determined safe according to the drinking water quality standard of the Ministry of Health of Malaysia, as 3 µg/L, 50 µg/L and 10 µg/L, respectively. The Cd, Cr and Pb status in the drinking water supply chain (i.e., from the river, treated water at the treatment plant and tap and household water after filtration water) were determined Class IIA, which requires conventional treatment before drinking. However, both Cd and Pb status in Langat River is in Class III, which requires extensive treatment before drinking, if the concentration is considered based on the daily maximum average, i.e., Cd = 1 µg/L and 10 µg/L [56].
The high concentration of Cd in the Alkaline II (0.66 ± 0.08 µg/L) and RO I (0.65 ± 0.01 µg/L) filtration water (Table 7) might be due to the growing microorganism on the cartridge, because of irregular clean activities, and thus holding the inorganic ions and enhancing the ions’ deposition on the cartridge [100,101,102,103,104]. Later the leaching of the ions from the cartridge attributes to increasing the concentration of trace metals, e.g., Cd, in the drinking water. However, the mean concentration of dissolved Cd (0.31 ± 0.21 µg/L) in the household filtration water at the basin was relatively much lower than the drinking water quality standard of 3 µg/L as proposed by the MOH and WHO, as well as the 5 µg/L proposed by USEPA and EC. However, the RO vendor machine at Johor, Malaysia, found the better concentration of Cd (0.08 ± 0.03 µg/L), Cr (0.39 ± 0.09 µg/L) and Pb (0.66 ± 0.38 µg/L) in the filtration water [105].
On the contrary, the high dissolved concentration of Cr in the Distilled II (0.66 ± 0.003 µg/L) filtration water followed by Alkaline III (0.35 ± 0.13 µg/L) (Table 8) might be due to the corrosion of the galvanized iron pipe linked to steel pipes at the end reticulation system along with water stagnant time within the filter. Moreover, the rust inside the distilled filter as well as the lack of cleaning activities also attributes to enhance the concentration of Cr in the drinking water. However, the mean concentration of dissolved Cr (0.2 ± 0.15 µg/L) in the household filtration water at the basin was much below the maximum limit of the drinking water quality standard of Cr (50 µg/L), as proposed by the MOH, WHO and EC.
The high concentration of dissolved Pb in the Carbon-I filtration water (12.04 ± 2.36 µg/L; Table 9) might be due to the high accumulation of Pb in the cartridge because of the broken ceramic part of that carbon filtration system. The high Pb attribution in the supply water is both from the natural sources as well as corrosion of the galvanized iron pipeline distribution system of the supply water. Accordingly, the high concentration of Pb in the Distilled III filtration water (5.86 ± 0.76 µg/L) might be due to the rust inside the filtration system (i.e., galvanized iron body to boil the water and precipitation the vapour as drinking water) along with the galvanized pipe used in the filtration system. Although the average concentration of dissolved Pb in the filtration water at the basin was 4.12 ± 2.89 µg/L, which indicates Class I drinking water [84], only the Pb concentration (12.04 ± 2.36 µg/L) of the Carbon I filtration system crossed the highest limit of the drinking water quality standard of 10 µg/L, as proposed by the MOH, WHO and EC. Similarly, the higher concentration of Pb in the Distilled III filtration water (i.e., −71.48%; Figure 6) than the supply water might be due to the rust inside the filtration system as well as corrosion of the galvanized iron pipe used in the filtration system. Moreover, the RO I (i.e., −67.30%) and Alkaline I (i.e., −79.95%) filtration water status indicates the contamination of filtered water with Pb from outside sources apart from the leaching of Pb through the cartridge.

4. Conclusions

The overall water quality index of the Langat River is determined as Class IIA clean, with an index value of 79.91 ± 16.96. However, the midstream of the river is determined as Class III, which indicates that the river is slightly polluted, and it requires extensive treatment before drinking. The Cd, Cr and Pb status in the drinking water supply chain (i.e., from the river, treated water at the treatment plant and tap and household after filtration water) were determined Class IIA, which requires conventional treatment before drinking. However, both the Cd and Pb status in the Langat River is in Class III, which requires extensive treatment before drinking, if the concentrations are considered on the daily maximum average limit, i.e., Cd = 1 µg/L and Pb = 10 µg/L. The Cd, Cr and Pb concentrations in the treated water by the treatment plants, tap and household filtration water in the Langat Basin are within the drinking water quality standard of Malaysia, 3 µg/L, 50 µg/L and 10 µg/L, respectively. The determined Cd (45.47% to 90.17%), Cr (21.47% to 83.45%) and Pb (1.98% to 87.75%) concentration removals in the treated water at the basin indicates the limitation of the conventional coagulation method of the water treatment plants based on single sampling, mainly because of difficulties to mix the chemical doses during treatment. Therefore, long-term, 24-h real time monitoring is required to determine the actual efficiency of the plants in removing the Cd, Cr and Pb concentrations. Moreover, conventional water treatment methods can remove a particle size about 0.5 µm, whereas the lead (Pb) ions along with other metal ions could be <0.000174 µm.
The regression analysis of the Cd, Cr and Pb concentrations and physicochemical parameters also indicate the pollution sources are mainly the natural weathering of minerals in the granite rock of the Titiwangsa Mountain range in the upstream area of the Langat River Basin, along with the anthropogenic activities such as mining, agriculture, sewage and industrial discharges, etc., in the basin. Moreover, the spatial and temporal distribution of these metals in the river are significantly influenced by the heavy rainfall in monsoons as well as the large volume of water flow in the river. The dissolved concentration is significantly correlated with the increasing and decreasing trends in the physicochemical parameters of the river. Therefore, special measures should be taken by the local authorities to bring all the relevant agencies like the Department of Environment, Department of Irrigation and Drainage, Selangor Water Management Authority (LUAS), etc., onto the same multi-stakeholder platform, especially to prevent pollution. Moreover, the proactive and effective leadership roles of the local authorities can ensure better collaboration of relevant stakeholders in managing the pollution of this transboundary river in line with the Integrated River Basin Management (IRBM) to obtain SDG 6—regarding a safe drinking water supply—before 2030, because local authorities have got the mandate of enforcement through the Local Government Act of 1976.
Furthermore, the local authority can monitor better the treated water quality examined by the water treatment plant authorities. Since the Langat River drains through three different constituencies and the turbidity of the river is changing very frequently, mainly because of higher runoff after heavy rainfall-induced flash floods in the tropical climate. Therefore, it is very critical to fix the doses of the required chemicals following the conventional method to treat the raw water, which needs 24 h monitoring. Hence, this study suggests investigating the efficiency of conventional water treatment methods to remove metals from treated water along with an intensive study on the MTDL (maximum total daily limit) of metals. Alternatively, a two-layer water filtration system can be introduced into the Langat Basin to ensure a safe drinking water supply at the household level. This two-layer water filtration system consists of a less expensive slow pond sand filtration system at the treatment plant and installation of reverse osmosis (RO) membrane technology at the kitchen’s tap at the household level, maintained by an agency like the water billing agency. Since the treated water contamination in the long water pipeline in between the plant and household is obvious, so RO could be the best choice to install at the kitchen’s tap because RO technology has been recommended by USEPA as the best available technology and theoretically it can remove metals >90% from the treated water.

Supplementary Materials

The following are available online at https://0-www-mdpi-com.brum.beds.ac.uk/2073-4441/12/10/2653/s1, Figure S1: Cd (µg/L) Concentration Removal Efficiency (%) by the Water Treatment Plants (WTPs) in the Langat River Basin, Malaysia, Figure S2: Cr (µg/L) Concentration Removal Efficiency (%) by the Water Treatment Plants (WTPs) in the Langat River Basin, Malaysia, and Figure S3: Pb (µg/L) Concentration Removal Efficiency (%) by the Water Treatment Plants (WTPs) in the Langat River Basin, Malaysia, Table S1: Malaysian standards of physio-chemical water quality parameters [44], Table S2: Malaysian standards of physio-chemical water quality parameters [44], Table S3: One-way ANOVA Test of Water Quality Parameters of River Sampling Points, Table S4: Homogeneity Test of Variance and Robust of Equality of Mean, Table S5: One-tailed Correlations of Water Quality Parameters in Langat River (2015), Table S6: Spatial Correlations among Water and Environmental Parameters (2005–2015), Table S7: Temporal Correlation among Water and Environmental Parameter 2005–2015, Table S8: Shapiro-Wilk Normality Test of River Water Quality Parameters, Table S9: Determined Physiochemical Water Quality Status in Langat River (2005–2015), Table S10: National Water Quality Standards for Malaysia [44], Table S11: Water Classes and Uses in Malaysia [44], Table S12: Determined Water Quality Sub Index of Langat River, Malaysia (2005–2015), Table S13: DOE Water Quality Classification Based on Water Quality Index [44], Table S14: Determined Water Quality Index of Langat River, Malaysia (2005–2015), Table S15: DOE Water Quality Index Classification [44].

Author Contributions

Conceptualization, M.F.A. and M.B.M.; methodology, M.F.A., C.A.R.M.; software, M.F.A.; validation, M.B.M., C.A.R.M., L.A. and G.C.T.; formal analysis, M.F.A.; investigation, M.F.A.; resources, M.F.A.; data curation, M.F.A.; writing—original draft preparation, M.F.A.; writing—review and editing, M.B.M.; visualization, M.B.M., C.A.R.M., L.A. and G.C.T.; supervision, M.B.M.; project administration, M.F.A.; funding acquisition, M.B.M. All authors have read and agreed to the published version of the manuscript.

Funding

This research was funded by Universiti Kebangsaan Malaysia (UKM), grant number MI-2019-013.

Acknowledgments

The authors are grateful to the Department of Environment Malaysia, Department of Drainage and Irrigation Malaysia and Malaysian Meteorological Department for the provided data and Information. The authors are also grateful to the Laboratory of Chemical Oceanography, Faculty of Science & Technology, UKM, for the analysis of the water samples as well as to the Institute of Climate Change, UKM, for preparing the study area map in ArcGIS.

Conflicts of Interest

The authors declare no conflict of interest.

References

  1. Ahmed, M.; Alam, L.; Mohamed, C.; Mokhtar, M.; Ta, G.C. Health risk of Polonium 210 ingestion via drinking water: An experience of Malaysia. Int. J. Environ. Res. Public Health 2018, 15, 2056. [Google Scholar] [CrossRef] [PubMed] [Green Version]
  2. Ahmed, M.F.; Mokhtar, M.B.; Alam, L.; Mohamed, C.A.R.; Ta, G.C. Non-carcinogenic Health Risk Assessment of Aluminium Ingestion Via Drinking Water in Malaysia. Expo. Health 2019, 11, 167–180. [Google Scholar] [CrossRef]
  3. Alsalahi, M.A.; Latif, M.T.; Ali, M.M.; Magam, S.M.; Wahid, N.B.A.; Khan, M.F.; Suratman, S. Distribution of surfactants along the estuarine area of Selangor River, Malaysia. Mar. Pollut. Bull. 2014, 80, 344–350. [Google Scholar] [CrossRef]
  4. Juahir, H.; Zain, S.M.; Yusoff, M.K. Spatial water quality assessment of Langat River Basin (Malaysia) using environmetric techniques. Environ. Monit. Assess. 2011, 173, 625–641. [Google Scholar] [CrossRef] [PubMed] [Green Version]
  5. Santhi, V.A.; Sakai, N.; Ahmad, E.D.; Mustafa, A.M. Occurrence of bisphenol A in surface water, drinking water and plasma from Malaysia with exposure assessment from consumption of drinking water. Sci. Total Environ. 2012, 427, 332–338. [Google Scholar] [CrossRef] [PubMed]
  6. Mokhtar, M.B.; Aris, A.Z.; Munusamy, V.; Praveena, S.M. Assessment level of heavy metals in Penaeus monodon and Oreochromis spp. in selected aquaculture ponds of high densities development area. Eur. J. Sci. Res. 2009, 30, 348–360. [Google Scholar]
  7. Ahmed, M.F.; Alam, L.; Ta, G.C.; Mohamed, C.A.R.; Mokhtar, M. A Review on the Environmental Pollution of Langat River, Malaysia. Asian J. Water Environ. Pollut. 2016, 13, 25–31. [Google Scholar] [CrossRef]
  8. Ahmed, M.F.; Lubna, A.; Ta, G.C.; Rahim, M.C.; Mazlin, M. A Review on the Chemical Pollution of Langat River, Malaysia. Asian J. Water Environ. Pollut. 2016, 13, 9–15. [Google Scholar] [CrossRef]
  9. Ahmed, M.F.; Alam, L.; Ta, G.C.; Mokhtar, M. A Review on Lead (Pb) Contamination in the Drinking Water Supply at Langat River Basin, Malaysia. MOJ Toxicol. 2017, 3, 47–49. [Google Scholar] [CrossRef] [Green Version]
  10. Al-Mamun, A.; Zainuddin, Z. Sustainable river water quality management in Malaysia. IIUM Eng. J. 2013, 14. [Google Scholar] [CrossRef]
  11. Juahir, H.; Zain, S.M.; Aris, A.Z.; Yusof, M.K.; Samah, M.A.A.; Mokhtar, B.M. Hydrological trend analysis due to land use changes at langat river basin. Environ. Asia 2011, 3, 20–31. [Google Scholar]
  12. Alam, L.; Mokhtar, M.B.; Alam, M.; Bari, M.; Kathijotes, N.; Ta, G.C.; Ern, L.K. Assessment of environmental and human health risk for contamination of heavy metal in tilapia fish collected from Langat Basin, Malaysia. Asian J. Water Environ. Pollut. 2015, 12, 21–30. [Google Scholar]
  13. Yap, C.K. Variations of electrical conductivity between upstream and downstream of Langat River, Malaysia: Its significance as a single indicator of water quality deterioration. Pertanika J. Trop. Agric. Sci. 2013, 36, 299–310. [Google Scholar]
  14. Al-Odaini, N.A.; Zakaria, M.P.; Yaziz, M.I.; Surif, S.; Abdulghani, M. The occurrence of human pharmaceuticals in wastewater effluents and surface water of Langat River and its tributaries, Malaysia. Int. J. Environ. Anal. Chem. 2013, 93, 245–264. [Google Scholar] [CrossRef]
  15. IPCC. Climate Change 2014: Impacts, Adaptation, and Vulnerability. Part B: Regional Aspects; Barros, V.R., Field, C.B., Dokken, D.J., Mastrandrea, M.D., Mach, K.J., Bilir, T.E., Chatterjee, M., Ebi, K.L., Estrada, Y.O., Genova, R.C., et al., Eds.; Contribution of Working Group II to the Fifth Assessment Report of the Intergovernmental Panel on Climate Change; Intergovernmental Panel on Climate Change (IPCC): Cambridge, UK; New York, NY, USA, 2014; p. 688. [Google Scholar]
  16. Ali, Z.M.; Ibrahim, N.A.; Mengersen, K.; Shitan, M.; Juahir, H.; Shahabuddin, F.A.A. Temporal Water Quality Assessment of Langat River from 1995–2006, Water Quality Monitoring and Assessment; Voudouris, Ed.; InTech: London, UK, 2012; Available online: http://www.intechopen.com/books/water-quality-monitoring-and-assessment/temporal-water-qualityassessment-of-langat-river-from-1995–2006 (accessed on 13 March 2018).
  17. Juahir, H.H. Water Quality Data Analysis and Modeling of the Langat River Basin. Ph.D. Thesis, University of Malaya, Kuala Lumpur, Malaysia, 2009. Available online: http://repository.um.edu.my/1223/5/Chapter%203%20Revised.pdf (accessed on 7 February 2015).
  18. Rapport, D.J.; Lasley, B.L.; Dennis, E.; Nielsen, N.O.R.; Qualset, C.O.; Damania, A.B. Managing for Healthy Ecosystems; CRC Press: New York, NY, USA, 2002. [Google Scholar]
  19. SPAN. Managing Water Pollution for Public Water Supply—Issues and Strategies. Suruhanjaya Perkhidmatan Air Negara (SPAN) 2012. Available online: http://www.mywp.org.my/wp-content/uploads/2012/12/materials/folder1/Paper%2010-Managing%20Water%20Pollution%20for%20Public%20Water%20Supply%20-%20Issues%20and%20Strategies,%20SPAN.pdf (accessed on 20 February 2015).
  20. Ahmed, M.F.; Mokhtar, M.; Alam, L.; Ta, G.C.; Lee, K.E.; Khalid, R.M. Recognition of Local Authority for Better Management of Drinking Water at the Langat River Basin, Malaysia. Int. J. Eng. Technol. 2018, 7, 148–154. [Google Scholar] [CrossRef]
  21. Mokhtar, M.B.; Toriman, M.E.H.; Hossain, A.A. Social learning in facing challenges of sustainable development: A case of Langat River Basin, Malaysia. Res. J. Appl. Sci. 2010, 5, 434–443. [Google Scholar]
  22. Mokhtar, M.B.; Toriman, M.E.H.; Hossain, M.; Abraham, A.; Tan, K.W. Institutional challenges for integrated river basin management in Langat River Basin, Malaysia. Water Environ. J. 2011, 25, 495–503. [Google Scholar] [CrossRef]
  23. Gong, J.; Ran, Y.; Chen, D.; Yang, Y.; Ma, X. Occurrence and environmental risk of endocrine-disrupting chemicals in surface waters of the Pearl River, South China. Environ. Monit. Assess. 2009, 156, 199–210. [Google Scholar] [CrossRef]
  24. Ahmad, N.; Jaafar, M.S.; Bakhash, M.; Rahim, M. An overview on measurements of natural radioactivity in Malaysia. J. Radiat. Res. Appl. Sci. 2015, 8, 136–141. [Google Scholar] [CrossRef] [Green Version]
  25. Almayahi, B.; Tajuddin, A.; Jaafar, M. Radiation hazard indices of soil and water samples in Northern Malaysian Peninsula. Appl. Radiat. Isot. 2012, 70, 2652–2660. [Google Scholar] [CrossRef]
  26. Bartoli, G.; Papa, S.; Sagnella, E.; Fioretto, A. Heavy metal content in sediments along the Calore river: Relationships with physical–chemical characteristics. J. Environ. Manag. 2012, 95, S9–S14. [Google Scholar] [CrossRef]
  27. Davutluoglu, O.I.; Seckin, G.; Ersu, C.B.; Yilmaz, T.; Sari, B. Heavy metal content and distribution in surface sediments of the Seyhan River, Turkey. J. Environ. Manag. 2011, 92, 2250–2259. [Google Scholar] [CrossRef] [PubMed]
  28. Sakan, S.M.; Đorđević, D.S.; Manojlović, D.D.; Predrag, P.S. Assessment of heavy metal pollutants accumulation in the Tisza river sediments. J. Environ. Manag. 2009, 90, 3382–3390. [Google Scholar] [CrossRef] [PubMed]
  29. Zhang, J.; Huang, W.; Liu, S.; Liu, M.; Yu, Q.; Wang, J. Transport of particulate heavy metals towards the China Sea: A preliminary study and comparison. Marine Chem. 1992, 40, 161–178. [Google Scholar] [CrossRef]
  30. Lim, W.Y.; Aris, A.Z.; Zakaria, M.P. Spatial variability of metals in surface water and sediment in the langat river and geochemical factors that influence their water-sediment interactions. Sci. World J. 2012, 2012. [Google Scholar] [CrossRef] [Green Version]
  31. Looi, L.J.; Aris, A.Z.; Johari, W.L.W.; Yusoff, F.M.; Hashim, Z. Baseline metals pollution profile of tropical estuaries and coastal waters of the Straits of Malacca. Marine Pollut. Bull. 2013, 74, 471–476. [Google Scholar] [CrossRef]
  32. Aris, A.Z.; Lim, W.Y.; Looi, L.J. Natural and Anthropogenic Determinants of Freshwater Ecosystem Deterioration: An Environmental Forensic Study of the Langat River Basin, Malaysia. In Environmental Management of River Basin Ecosystems; Ramkumar, M., Ed.; Springer: Cham, Switzerland, 2015; pp. 455–476. [Google Scholar]
  33. Gardener, H.; Bowen, J.; Callan, S.P. Lead and cadmium contamination in a large sample of United States infant formulas and baby foods. Sci. Total Environ. 2019, 651, 822–827. [Google Scholar] [CrossRef]
  34. Fulazzaky, M.A.; Seong, T.W.; Masirin, M.I.M. Assessment of water quality status for the Selangor river in Malaysia. Water. Air. Soil Pollut. 2010. [Google Scholar] [CrossRef]
  35. Al-Badaii, F.; Halim, A.A.; Shuhaimi-Othman, M. Evaluation of dissolved heavy metals in water of the Sungai Semenyih (Peninsular Malaysia) using environmetric methods. Sains Malays. 2016, 45, 841–852. [Google Scholar]
  36. Lim, W.Y.; Aris, A.Z.; Ismail, T.H.T.; Zakaria, M.P. Elemental hydrochemistry assessment on its variation and quality status in Langat River, Western Peninsular Malaysia. Environ. Earth Sci. 2013, 70, 993–1004. [Google Scholar] [CrossRef]
  37. Fasihnikoutalab, M.H.; Asadi, A.; Huat, B.K.; Ball, R.J.; Pourakbar, S.; Singh, P. Utilisation of carbonating olivine for sustainable soil stabilisation. Environ. Geotech. 2016. [Google Scholar] [CrossRef] [Green Version]
  38. Lim, W.Y.; Aris, A.Z.; Praveena, S.M. Application of the chemometric approach to evaluate the spatial variation of water chemistry and the identification of the sources of pollution in Langat River, Malaysia. Arab. J. Geosci. 2013, 6, 4891–4901. [Google Scholar] [CrossRef]
  39. Ashraf, M.A.; Maah, M.J.; Yusoff, I.B. Study of water quality and heavy metals in soil & water of ex-mining area Bestari Jaya, peninsular Malaysia. Int. J. Basic Appl. Sci. 2010, 10, 7–27. [Google Scholar]
  40. Alvarez-Ortega, N.; Caballero-Gallardo, K.; Olivero-Verbel, J. Toxicological effects in children exposed to lead: A cross-sectional study at the Colombian Caribbean coast. Environ. Int. 2019, 130, 104809. [Google Scholar] [CrossRef]
  41. Islam, M.S.; Ahmed, M.K.; Raknuzzaman, M.; Habibullah-Al-Mamun, M.; Islam, M.K. Heavy metal pollution in surface water and sediment: A preliminary assessment of an urban river in a developing country. Ecol. Indic. 2015, 48, 282–291. [Google Scholar] [CrossRef]
  42. Mohiuddin, K.M.; Ogawa, Y.Z.H.M.; Zakir, H.M.; Otomo, K.; Shikazono, N. Heavy metals contamination in water and sediments of an urban river in a developing country. Int. J. Environ. Sci. Technol. 2011, 8, 723–736. [Google Scholar] [CrossRef] [Green Version]
  43. Hu, X.; Wang, C.; Zou, L. Characteristics of heavy metals and Pb isotopic signatures in sediment cores collected from typical urban shallow lakes in Nanjing, China. J. Environ. Manag. 2011, 92, 742–748. [Google Scholar] [CrossRef] [PubMed]
  44. Boskabady, M.; Marefati, N.; Farkhondeh, T.; Shakeri, F.; Farshbaf, A.; Boskabady, M.H. The effect of environmental lead exposure on human health and the contribution of inflammatory mechanisms, a review. Environ. Int. 2018, 120, 404–420. [Google Scholar] [CrossRef]
  45. Gao, L.; Li, S.; Wang, Z.; Liang, Z.; Chen, J.; Liang, B. Contamination, potential mobility, and origins of lead in sediment cores from the Shima River, south China. Environ. Pollut. 2018, 242, 1128–1136. [Google Scholar] [CrossRef]
  46. Yu, Y.; Li, Q.; Wang, H.; Wang, B.; Lu, Q.; Yan, Z.; Ding, A. Exposure risk of young population to lead: A case study in Le’an River Basin in Jiangxi Province, China. Environ. Pollut. 2016, 209, 140–146. [Google Scholar] [CrossRef]
  47. Maduabuchi, J.M.; Nzegwu, C.N.; Adigba, E.O.; Aloke, R.U.; Ezomike, C.N.; Okocha, C.E.; Orisakwe, O.E. Lead and cadmium exposures from canned and non-canned beverages in Nigeria: A public health concern. Sci. Total Environ. 2006, 366, 621–626. [Google Scholar] [CrossRef] [PubMed]
  48. Yusuf, M.A. River Water Quality and Ecosystem Health in Langat River Basin, Selangor, Malaysia. Ph.D. Thesis, Universiti Kebangsaan Malaysia, Bangi, Malaysia, 2001. [Google Scholar]
  49. Sarmani, S.B. The determination of heavy metals in water, suspended materials and sediments from Langat River, Malaysia. Hydrobiologia 1989, 176, 233–238. [Google Scholar] [CrossRef]
  50. Mamun, A.A.; Hafizah, S.N.; Alam, M.Z. Improvement of existing water quality index in Selangor, Malaysia. In Proceedings of the 2nd International Conference on Water & Flood Management (ICWFM-2009), Dhaka, Bangladesh, 15–17 March 2009. [Google Scholar]
  51. Nalatambi, S. Determination of metals in tap water using atomic absorption spectrometry: A case study in bandar Sunway residential area. Sunway Acad. J. 2009, 6, 33–46. [Google Scholar]
  52. Ahmed, M.F.; Mokhtar, M.B. Assessing Cadmium and Chromium Concentrations in Drinking Water to Predict Health Risk in Malaysia. Int. J. Environ. Res. Public Health 2020, 17, 2966. [Google Scholar] [CrossRef] [PubMed]
  53. Ahmed, M.F.; Mokhtar, M.B.; Alam, L. Carcinogenic and non-carcinogenic health risk of arsenic ingestion via drinking water in Langat River Basin, Malaysia. Environ. Geochem. Health 2020. [Google Scholar] [CrossRef]
  54. Paulson, A.J.; Curl, H.C.; Feely, R.A. Trace Metal and Ancillary Data in Puget Sound: August 1986; Data Report (No. PB-91-201590/XAB); Pacific Marine Environmental Lab: Seattle, WA, USA, 1991. [Google Scholar]
  55. WEPA. National Water Quality Standards for Malaysia. Water Environ. Partnersh. Asia. 2006. Available online: http://www.wepadb.net/policies/law/malaysia/eq_surface.htm (accessed on 19 November 2017).
  56. DOE. Malaysia Environmental Quality Report 2015; Department of Environment: Putrajaya, Malaysia, 2015. Available online: https://enviro.doe.gov.my/ekmc/digital-content/environmental-quality-report-2015/ (accessed on 13 March 2018).
  57. Chemingui, H.; Ben lallouna, H. Resistance, motivations, trust and intention to use mobile financial services. Int. J. Bank Mark. 2013, 31, 574–592. [Google Scholar] [CrossRef]
  58. Wang, J.; Liu, G.; Liu, H.; Lam, P.K. Multivariate statistical evaluation of dissolved trace elements and a water quality assessment in the middle reaches of Huaihe River, Anhui, China. Sci. Total Environ. 2017, 583, 421–431. [Google Scholar] [CrossRef]
  59. WHO. Chromium in Drinking-Water; World Health Organization: Geneva, Switzerland, 2003; Available online: http://www.who.int/water_sanitation_health/dwq/chemicals/chromium.pdf (accessed on 24 February 2018).
  60. MOH. Drinking Water Quality Standard; Engineering Services Division, Ministry of Health: Putrajaya, Malaysia, 2010. Available online: http://kmam.moh.gov.my/public-user/drinking-water-quality-standard.html (accessed on 10 January 2017).
  61. USEPA. Screening Level Ecological Risk Assessment Protocol for Hazardous Waste Combustion Facilities, Toxicity Reference Values (Appendix E), EPA530-D-99-001C (Vol. 3); United States Environmental Protection Agency: Washington, DC, USA, 1999.
  62. USEPA. National Recommended Water Quality Criteria—Aquatic Life Criteria Table; United States Environmental Protection Agency: Washington, DC, USA, 2016.
  63. EC. Environmental Quality Standard for Priority Substances and Certain other Pollutants, Directive 2013/39/EU of the European Parliament and of the Council of 12 August 2013 (amending Directives 2000/60/EC and 2008/105/EC as regards priority substances in the field of water policy, L 226/1). In Official Journal of the European Union; European Commission: Rue Mercier, Luxembourg, 2013. [Google Scholar]
  64. WHO. Guidelines for Drinking-Water Quality: Fourth Edition Incorporating the First Addendum; World Health Organization: Geneva, Switzerland, 2017; Available online: http://apps.who.int/iris/bitstream/10665/254637/1/9789241549950-eng.pdf?ua=1 (accessed on 29 May 2017).
  65. Chung, Y.; Shin, D.; Park, S.; Lim, Y.; Choi, Y.; Cho, S.; Jeeyeon, Y.; Mansik, H.; Yeosin, P.; Hyun, L. Risk assessment and management of drinking water pollutants in Korea. Water Sci. Technol. 1997, 36, 309–323. [Google Scholar]
  66. Shazili, N.A.M.; Yunus, K.; Ahmad, A.S.; Abdullah, N.; Rashid, M.K.A. Heavy metal pollution status in the Malaysian aquatic environment. Aquat. Ecosyst. Health Manag. 2006, 9, 137–145. [Google Scholar] [CrossRef]
  67. Sultan, K.; Shazili, N.A.; Peiffer, S. Distribution of Pb, As, Cd, Sn and Hg in soil, sediment and surface water of the tropical river watershed, Terengganu (Malaysia). J. Hydro Environ. Res. 2011, 5, 169–176. [Google Scholar] [CrossRef]
  68. Voica, C.; Kovacs, M.; Dehelean, A.; Ristoiu, D.; Iordache, A. ICP-MS determinations of heavy metals in surface waters from Transylvania. Rom. J. Phys. 2012, 57, 1184–1193. [Google Scholar]
  69. Al-Badaii, F.; Shuhaimi-Othman, M. Heavy metals and water quality assessment using multivariate statistical techniques and water quality index of the Semenyih River, Peninsular Malaysia. Iran. J. Energy Environ. 2014, 5, 132–145. [Google Scholar] [CrossRef] [Green Version]
  70. Akintujoye, J.F.; Anumudu, C.I.; Awobode, H.O. Assessment of heavy metal residues in water, fish tissue and human blood from Ubeji, Warri, Delta State, Nigeria. J. Appl. Sci. Environ. Manag. 2013, 17, 291–297. [Google Scholar] [CrossRef]
  71. Goher, M.E.; Hassan, A.M.; Abdel-Moniem, I.A.; Fahmy, A.H.; El-sayed, S.M. Evaluation of surface water quality and heavy metal indices of Ismailia Canal, Nile River, Egypt. Egypt. J. Aquat. Res. 2014, 40, 225–233. [Google Scholar] [CrossRef] [Green Version]
  72. Ali, M.M.; Ali, M.L.; Islam, M.S.; Rahman, M.Z. Preliminary assessment of heavy metals in water and sediment of Karnaphuli River, Bangladesh. Environ. Nano Technol. Monit. Manag. 2016, 5, 27–35. [Google Scholar] [CrossRef] [Green Version]
  73. E Sousa, J.M.D.C.; Peron, A.P.; da Silva, F.C.C.; de Siqueira Dantas, E.B.; Lima, A.D.M.V.; de Oliveira, V.A.; Matos, L.A.; Paz, M.F.C.J.; de Alencar, M.V.O.B.; Islam, M.T.; et al. Physico-chemical and genotoxicity analysis of Guaribas river water in the Northeast Brazil. Chemosphere 2017, 177, 334–338. [Google Scholar] [CrossRef]
  74. Patil, S.S.; Kaushik, G. Heavy Metal Assessment in Water and Sediments at Jaikwadi Dam (Godavari River) Maharashtra, India. Int. J. Environ. 2016, 5, 75–88. [Google Scholar] [CrossRef] [Green Version]
  75. Abdel-Satar, A.M.; Ali, M.H.; Goher, M.E. Indices of water quality and metal pollution of Nile River, Egypt. Egypt. J. Aquat. Res. 2017, 43, 21–29. [Google Scholar] [CrossRef]
  76. ATSDR. Cadmium Toxicity. Atlanta: Agency for Toxic Substances and Disease Registry. 2008. Available online: https://www.atsdr.cdc.gov/csem/cadmium/docs/cadmium.pdf (accessed on 27 April 2017).
  77. Ibrahim, N.; Aziz, H.A.; Yusoff, M.S. River Bank Filtration: Study of Langat River Water and Borehole Water Quality. Appl. Mech. Mater. 2015, 773, 1194–1198. [Google Scholar] [CrossRef] [Green Version]
  78. Cotton, F.A. The Elements of the First Transition Series. Encycl. Br. Inc. 2019. Available online: https://www.britannica.com/science/transition-metal/The-elements-of-the-first-transition-series (accessed on 23 August 2020).
  79. Tashakor, M.; Zuhairi Wan Yaacob, W.; Mohamad, H.; Abdul Ghani, A.; Saadati, N. Assessment of selected sequential extraction and the toxicity characteristic leaching test as indices of metal mobility in serpentinite soils. Chem. Speciat. Bioavailab. 2014, 26, 139–147. [Google Scholar] [CrossRef] [Green Version]
  80. Li, H.; Shi, A.; Li, M.; Zhang, X. Effect of pH, temperature, dissolved oxygen, and flow rate of overlying water on heavy metals release from storm sewer sediments. J. Chem. 2013. [Google Scholar] [CrossRef]
  81. Baeyens, W.; Parmentier, K.; Goeyens, L.; Ducastel, G.; De Gieter, M.; Leermakers, M. The Biogeochemical Behaviour of Cd, Cu, Pb and Zn in the Scheldt estuary: Results of the 1995 Surveys Trace Metals in the Westerschelde Estuary: A Case-Study of a Polluted, Partially Anoxic Estuary; Springer: Dordrecht, The Netherlands, 1998; pp. 45–62. [Google Scholar]
  82. WHO. Guidelines for Drinking-Water Quality, 4th ed.; World Health Organization: Geneva, Switzerland, 2011. [Google Scholar]
  83. Helmers, E.; Rutgers, L.M.M. Lead and aluminum in Atlantic surface waters (50° N to 50° S) reflecting anthropogenic and natural sources in the Eolian transport. J. Geophys. Res. Oceans 1993, 98, 20261–20273. [Google Scholar] [CrossRef]
  84. Sanusi, M.; Ramli, A.; Gabdo, H.; Garba, N.; Heryanshah, A.; Wagiran, H.; Said, M. Isodose mapping of terrestrial gamma radiation dose rate of Selangor state, Kuala Lumpur and Putrajaya, Malaysia. J. Environ. Radioact. 2014, 135, 67–74. [Google Scholar] [CrossRef] [PubMed]
  85. APEC. Are There Any Potential Health Risks Associated with Corrosion Byproducts from Water Transported Through Galvanized Drinking Water Pipes? APEC Water Syst. 2017. Available online: http://www.freedrinkingwater.com/water_health/health2/corrosion-byproducts2-galvanized-drinking-pipes-health-risks.htm (accessed on 15 May 2017).
  86. Ong, C.; Ibrahim, S.; Sen Gupta, B. A survey of tap water quality in Kuala Lumpur. Urban Water J. 2007, 4, 29–41. [Google Scholar] [CrossRef]
  87. STI. Fabrication Factors for Carbon Steel Pipe vs. Stainless Steel Pipe; STI Group: Bridge City, TX, USA, 2016; Available online: http://setxind.com/fabrication/fabrication-factors-carbon-steel-pipe-vs-stainless-steel-pipe/ (accessed on 15 May 2017).
  88. Thomasnet. Stainless Steel Pipe Types; Thomas Publishing Company: New York, NY, USA, 2017; Available online: http://www.thomasnet.com/articles/pumps-valves-accessories/stainless-steel-pipe-types (accessed on 14 May 2017).
  89. Chebeir, M.; Chen, G.; Liu, H. Emerging investigators series: Frontier review: Occurrence and speciation of chromium in drinking water distribution systems. Environ. Sci.: Water Res. Technol. 2016, 2, 906–914. [Google Scholar]
  90. Górski, J.; Siepak, M. Assessment of metal concentrations in tap-water–from source to the tap: A case study from Szczecin, Poland. Geologos 2014, 20, 25–33. [Google Scholar] [CrossRef] [Green Version]
  91. Haq, S.A. Harvesting Rainwater from Buildings; Springer: Berlin/Heidelberg, Germany, 2016; ISBN 9783319463629. [Google Scholar]
  92. PMI. Lead in Plumbing; Plumbing Manufacturer International: Rolling Meadows, IL, USA, 2017; Available online: https://www.safeplumbing.org/health-safety/lead-in-plumbing (accessed on 14 May 2017).
  93. Multani, A. Lead Contamination of Drinking Water in India due to PVC Pipes. (ISSN 1324-6011). The Journal of the LEAD (Lead Education and Abatement Design) Group Inc 2010. Available online: http://www.lead.org.au/lanv10n1/lanv10n1-5.html (accessed on 15 May 2017).
  94. Lim, C.S.; Shaharuddin, M.S.; Sam, W.Y. Risk assessment of exposure to lead in tap water among residents of Seri Kembangan, Selangor State, Malaysia. Glob. J. Health Sci. 2013, 5, 1–12. [Google Scholar] [CrossRef] [Green Version]
  95. SYABAS. Frequently Asked Questions (FAQs). Syarikat Bekalan Air Selangor Sdn. Bhd 2017. Available online: https://www.syabas.com.my/consumer/frequently-asked-questions-faqs#q11 (accessed on 15 May 2017).
  96. WHO. Physical Removal Processes: Sedimentation and Filtration; World Health Organization: Geneva, Switzerland, 2017; Available online: http://www.who.int/water_sanitation_health/dwq/WSH02.07_5.pdf?ua=1 (accessed on 15 May 2017).
  97. Anon. Particle Size Remova; Range by Filtration & Reverse Osmosis. 2017. Available online: http://www.aquathin.com/sites/default/files/particle%20size.pdf (accessed on 22 May 2017).
  98. H2O. Particle Size Chart: Removal Range by Filtration; H2O Distributors: Marietta, GA, USA, 2017; Available online: https://www.h2odistributors.com/pages/info/diagram-particle-sizes.asp (accessed on 22 May 2017).
  99. WHO. Water Treatment and Pathogen Control: Process Efficiency in Achieving Safe Drinking Water; World Health Organization, IWA Publishing: London, UK, 2004. [Google Scholar]
  100. Daschner, F.; Rüden, H.; Simon, R.; Clotten, J. Microbiological contamination of drinking water in a commercial household water filter system. Eur. J. Clin. Microbiol. Infect. Dis. 1996, 15, 233–237. [Google Scholar] [CrossRef]
  101. Fiore, J.; Babineau, R. Effect of an activated carbon filter on the microbial quality of water. Appl. Environ. Microbiol. 1977, 34, 541–546. [Google Scholar] [CrossRef] [Green Version]
  102. PEI. Chelation, Uptake, and Binding of Trace Metals. The Princeton Environmental Institute. 2000. Available online: https://www.princeton.edu/~cebic/chelbindintro.html (accessed on 25 May 2017).
  103. Wallis, C.; Stagg, C.H.; Melnick, J.L. The hazards of incorporating charcoal filters into domestic water systems. Water Res. 1974, 8, 111–113. [Google Scholar] [CrossRef]
  104. Walsh, K. Treating Bacteria in Drinking Water. Scranton Gillette Communications. 2009. Available online: https://www.wqpmag.com/treating-bacteria-drinking-water (accessed on 25 May 2017).
  105. Hashim, N.; Yusop, H. Drinking Water Quality of Water Vending Machines in Parit Raja, Batu Pahat, Johor. In Proceedings of the IOP Conference Series: Materials Science and Engineering, Langkawi, Malaysia, 27–29 October 2015; IOP Publishing Ltd.: Bristol, UK, 2016. [Google Scholar]
Figure 1. Water sampling points at the Langat River, Malaysia.
Water 12 02653 g001
Figure 2. Cd (µg/L) distribution trend in the Langat River, Malaysia (2015).
Water 12 02653 g002
Figure 3. Cr (µg/L) distribution trend in the Langat River, Malaysia (2015).
Water 12 02653 g003
Figure 4. Pb (µg/L) distribution trend in the Langat River, Malaysia (2015).
Water 12 02653 g004
Figure 5. Spatial distribution of Cd (2005–2015) in the Langat River, Malaysia.
Water 12 02653 g005
Figure 6. Spatial distribution of Cr (2005–2015) in the Langat River, Malaysia.
Water 12 02653 g006
Figure 7. Spatial distribution of Pb (2005–2015) in the Langat River, Malaysia.
Water 12 02653 g007
Figure 8. Temporal distribution of Cd (2005–2015) in the Langat River, Malaysia.
Water 12 02653 g008
Figure 9. Temporal distribution of Cr (2005–2015) in the Langat River, Malaysia.
Water 12 02653 g009
Figure 10. Temporal distribution of Pb (2005–2015) in the Langat River, Malaysia.
Water 12 02653 g010
Table 1. Descriptive statistics of the water quality parameters in the Langat River, Malaysia.
ParameterMin.Max.MeanStd. Dev.SkewnessKurtosis
Cd (µg/L)0.393.431.220.881.030.13
Cr (µg/L)0.121.220.470.271.331.9
Pb (µg/L)4.7624.939.991.401.21.08
DO (mg/L)2.099.476.52.28−0.64−0.36
SPC (µS/cm)16.6179.594.7858.550.08−1.65
TDS (mg/L)11.1179.572.7948.80.52−0.71
SAL (psu)0.010.080.040.030.12−1.61
pH7.578.638.020.340.49−1.18
Temp °C22.930.827.343.08−0.41−1.6
Table 2. Cd, Cr and Pb concentration in Langat River in comparison with several standards.
ParameterMin.Max.MeanMOH 1USEPA 2USEPA 3EC 4
Cd (µg/L)0.393.431.22 ± 0.8832.20.720.2
Cr (µg/L)0.121.220.47 ± 0.27501111-
Pb (µg/L)4.7624.939.99 ± 1.40502.52.51.3
Note: 1 Raw Water Quality Standard proposed by Ministry of Health of Malaysia [60]. 2 Toxic Reference Value proposed by the United States Environmental Protection Agency [61]. 3 Criteria Continuous Concentration by the United States Environmental Protection Agency [62]. 4 Annual Average proposed by the European Commission [63].
Table 3. Cd, Cr and Pb concentrations in the Langat River and other rivers around the world.
River and LocationCd (µg/L)Cr (µg/L)Pb (µg/L)
Langat, Selangor, Malaysia [49]35.56-57.78
Seoul, Pusan, Taegu, Taejon, Kwangju and Inchon, Korea [65]0.0020.0030.003
Kemaman, Malaysia [66]0.030.290.13
Langat, Malaysia [48]24708.7
Langat, Malaysia [50]1310
Klang, Malaysia [50]1510
Selangor, Malaysia [50]11.4210
Langat, Malaysia [30]0.11 ± 0.121.13 ± 0.911.07 ± 1.64
Langat, Malaysia [32]0.07 ± 0.090.67 ± 0.900.16 ± 0.23
Terengganu, Malaysia [67]4.78 ± 7.43-0.97 ± 1.21
Transylvania, Romania [68]14.22 ± 10.29-12.63 ± 18.28
Langat, Malaysia [36]0.11 ± 0.121.13 ± 0.911.07 ± 1.64
Semenyih, Langat Basin, Malaysia [69]0.39 ± 0.222.94 ± 1.151.75 ± 0.80
Korotoa, Bangladesh [41]9.50 ± 7.0078.00 ± 0.2731.00 ± 17.00
Semenyih, Langat Basin, Malaysia [35]0.39 ± 0.372.37 ± 1.611.62 ± 1.07
Ubeji, Nigeria [70]363736
Huaihe, China [58]61.74 ± 90.1223.08 ± 27.24154.96 ± 193.34
Nile, Egypt [71]0.45 ± 0.32-18.00 ± 5.00
Karnaphuli, Bangladesh [72]8.55 ± 3.7578.25 ± 17.1713.34 ± 5.46
Guaribas, Brazil [73]-29.63 ± 24.13-
Godavari, India [74]2.18 ± 0.132.37 ± 1.3316.34 ± 1.65
Nile, Egypt [75]2.93 ± 0.86-17.45 ± 6.43
Langat River, Malaysia (Present Study)1.22 ± 0.880.47 ± 0.279.99 ± 1.40
Table 4. Determined Cd, Cr, Pb and physicochemical water quality status in the Langat River 2015).
LocationCd (µg/L)Cr (µg/L)Pb (µg/L)DO (%)DO (mg/L)SPC (µS/cm)TDS (mg/L)SAL (psu)pHTemp (°C)
Pangsoon1.60 ± 0.660.60 ± 0.569.57 ± 1.82109.94 ± 0.439.44 ± 0.0535.53 ± 0.5127.20 ± 7.110.02 ± 0.017.92 ± 0.1122.90 ± 0
Lolo1.78 ± 1.430.66 ± 0.3620.72 ± 3.6791.90 ± 2.837.84 ± 0.3050.40 ± 1.3739.00 ± 11.190.02 ± 0.007.75 ± 0.0123.30 ± 0
Serai2.54 ± 0.020.60 ± 0.0414.45 ± 1.13104.60 ± 1.888.72 ± 0.2016.67 ± 0.0612.93 ± 3.180.01 ± 0.007.76 ± 0.0224.70 ± 0
Langat1.25 ± 0.090.31 ± 0.147.33 ± 1.7093.10 ± 1.567.21 ± 0.1560.07 ± 0.0646.03 ± 12.180.03 ± 0.008.56 ± 0.0728.50 ± 0
Cheras1.23 ± 0.730.57 ± 0.3211.46 ± 1.4583.84 ± 0.426.52 ± 0.03138.77 ± 0.64106.50 ± 28.580.06 ± 0.008.45 ± 0.1028.33 ± 0.06
Bukit0.43 ± 0.030.32 ± 0.125.88 ± 1.1273.68 ± 1.885.57 ± 0.19179.37 ± 0.15137.63 ± 36.260.08 ± 0.007.97 ± 0.2129.80 ± 0
Salak0.50 ± 0.040.36 ± 0.025.52 ± 0.0261.16 ± 2.874.60 ± 0.28122.30 ± 3.4694.10 ± 27.890.05 ± 0.018.17 ± 0.1330.80 ± 0
Labu0.47 ± 0.040.31 ± 0.125.03 ± 0.2728.08 ± 0.332.12 ± 0.03155.13 ± 0.15118.90 ± 31.350.07 ± 0.007.61 ± 0.0430.37 ± 0.06
Average1.22 ± 0.880.47 ± 0.279.99 ± 1.4080.79 ± 1.536.50 ± 0.1594.78 ± 0.8072.79 ± 19.720.04 ± 0.008.02 ± 0.0927.34 ± 0.01
Overall Class 1IIAIIAIIA-IIAIIIIIIA
Note: 1 National Water Quality Class of Malaysia [56].
Table 5. Standardized coefficients of the dependent variables through regression analyses.
PredictorsModel 1Model 2Model 3
Constant−1.7602.05812.329
(−0.483)(1.409)(0.661)
Cd (µg/L) 0.6470.559
(1.904) ***(3.188) *
Cr (µg/L)0.337 −0.149
(1.904) **(−0.912)
Pb (µg/L)0.785−0.403
(3.188) *(−0.912)
Log (DO)0.095−0.384−0.229
(0.269)(−0.799)(−0.784)
SPC (µS/cm)−1.3465.0071.101
(−0.859)(2.861) **(0.831)
Log (TDS)−0.883−0.0730.657
(−1.979) ***(−0.103)(1.691)
SAL (ppt)1.548−4.962−1.119
(1.009)(−2.874) **(−0.856)
pH0.128−0.0970.050
(0.418)(−0.227)(0.191)
Temp °C0.260−0.202−0.580
(0.569)(−0.317)(−1.630)
Adjusted R20.7170.4570.799
F value6.8362.93610.137
p Value0.0010.0360.000127
Note: Models 1, 2 and 3 represents Cd, Cr and Pb, respectively, through the Enter method. *** Significant at the 0.01 level. ** Significant at the 0.05 level. * Significant at the 0.10 level.
Table 6. Cd (µg/L), Cr (µg/L) and Pb (µg/L) concentrations in the treated water of the water treatment plant (WTP), household (HH) taps and HH filtration water in the Langat River Basin.
ParameterWater SampleNMin.Max.MeanStd. Dev.SkewnessKurtosis
Cd (µg/L)Treated240.120.990.420.310.91−0.84
Tap45450.130.770.420.190.49
HH Filtration450.030.740.310.210.49−0.9
Cr (µg/L)Treated240.020.530.210.140.950.14
Tap450.10.950.370.211.080.76
HH Filtration450.050.660.20.152.14.31
Pb (µg/L)Treated241.6910.834.782.500.990.60
Tap451.168.934.841.870.59−0.12
HH Filtration450.6414.414.122.891.583.3
Table 7. Cd (µg/L) status in the drinking water supply chain at the Langat River Basin, Malaysia.
Location (n = 24)RiverWTPFilter (Location) (n = 45)HH TapHH Filter
Pangsoon1.60 ± 0.660.87 ± 0.12Alkaline I (Serdang I)0.19 ± 0.060.32 ± 0.002
Lolo1.78 ± 1.430.93 ± 0.06Alkaline II (Serdang II)0.19 ± 0.030.66 ± 0.08
Serai2.54 ± 0.020.25 ± 0.09Alkaline III (Serdang III)0.18 ± 0.020.6 ± 0.02
Langat1.25 ± 0.090.51 ± 0.1RO I (Hentian Kajang I)0.42 ± 0.010.65 ± 0.01
Cheras1.23 ± 0.730.17 ± 0.05RO II (Hentian Kajang II)0.75 ± 0.020.49 ± 0.03
Bukit0.43 ± 0.030.19 ± 0.02RO III (Hentian Kajang III)0.58 ± 0.080.4 ± 0.01
Salak0.50 ± 0.040.25 ± 0.05Carbon I (Hentian Kajang IV)0.25 ± 0.040.29 ± 0.04
Labu0.47 ± 0.040.19 ± 0.05Carbon II (Hentian Kajang V)0.40 ± 0.030.17 ± 0.08
Average1.22 ± 0.880.42 ± 0.31Carbon III (UKM II)0.39 ± 0.030.18 ± 0.01
Overall Class 1IIAIIADistilled I (UKM III)0.73 ± 0.040.13 ± 0.01
Distilled II (Hentian Kajang VI)0.72 ± 0.070.15 ± 0.02
Distilled III (UKM I)0.43 ± 0.030.23 ± 0.04
UV I (Bangi I)0.43 ± 0.010.03 ± 0.01
UV II (UKM IV)0.4 ± 0.030.31 ± 0.02
UV III (Hentian Kajang VII)0.26 ± 0.030.04 ± 0.01
Average0.42 ± 0.190.31 ± 0.21
Overall Class 1IIAIIA
Note: 1 National Water Class of Malaysia based on the metal concentration [56].
Table 8. Cr (µg/L) status in the drinking water supply chain at the Langat River Basin, Malaysia.
Location (n = 24)RiverWTPFilter (Location) (n = 45)HH TapHH Filter
Pangsoon0.60 ± 0.560.32 ± 0.21Alkaline I (Serdang I)0.38 ± 0.120.15 ± 0.09
Lolo0.66 ± 0.360.22 ± 0.2Alkaline II (Serdang II)0.38 ± 0.120.18 ± 0.09
Serai0.60 ± 0.040.1 ± 0.02Alkaline III (Serdang III)0.35 ± 0.120.35 ± 0.13
Langat0.31 ± 0.140.24 ± 0.16RO I (Hentian Kajang I)0.18 ± 0.030.13 ± 0.04
Cheras0.57 ± 0.320.35 ± 0.13RO II (Hentian Kajang II)0.19 ± 0.010.14 ± 0.09
Bukit0.32 ± 0.120.21 ± 0.07RO III (Hentian Kajang III)0.22 ± 0.080.1 ± 0.02
Salak0.36 ± 0.020.16 ± 0.01Carbon I (Hentian Kajang IV)0.59 ± 0.20.17 ± 0.09
Labu0.31 ± 0.120.11 ± 0.03Carbon II (Hentian Kajang V)0.53 ± 0.080.12 ± 0.03
Average0.47 ± 0.270.21 ± 0.14Carbon III (UKM II)0.27 ± 0.250.21 ± 0.01
Overall Class 1IIAIIADistilled I (UKM III)0.63 ± 0.020.12 ± 0.01
Distilled II (Hentian Kajang VI)0.71 ± 0.410.66 ± 0.003
Distilled III (UKM I)0.4 ± 0.140.22 ± 0.07
UV I (Bangi I)0.23 ± 0.1500.18 ± 0.01
UV II (UKM IV)0.2 ± 0.040.17 ± 0.12
UV III (Hentian Kajang VII)0.29 ± 0.0040.14 ± 0.04
Average0.37 ± 0.210.2 ± 0.15
Overall Class 1IIAIIA
Note: 1 National Water Class of Malaysia based on the metal concentration [56].
Table 9. Pb (µg/L) status in the drinking water supply chain at the Langat River Basin, Malaysia.
Location (n = 24)RiverWTPFilter (Location) (n = 45)HH TapHH Filter
Pangsoon9.57 ± 1.825.37 ± 1.46Alkaline I (Serdang I)2.88 ± 1.735.19 ± 2.97
Lolo20.72 ± 3.674.54 ± 0.26Alkaline II (Serdang II)5.76 ± 2.495.00 ± 1.90
Serai14.45 ± 1.131.77 ± 0.08Alkaline III (Serdang III)6.52 ± 0.032.24 ± 0.10
Langat7.33 ± 1.704.23 ± 0.44RO I (Hentian Kajang I)3.29 ± 0.225.51 ± 1.04
Cheras11.46 ± 1.459.96 ± 0.87RO II (Hentian Kajang II)6.25 ± 2.273.67 ± 1.03
Bukit5.88 ± 1.124.61 ± 1.65RO III (Hentian Kajang III)5.43 ± 1.465.67 ± 1.00
Salak5.52 ± 0.025.41 ± 1.33Carbon I (Hentian Kajang IV)4.07 ± 1.5712.04 ± 2.36
Labu5.03 ± 0.272.33 ± 0.20Carbon II (Hentian Kajang V)5.09 ± 1.712.72 ± 0.43
Average9.99 ± 1.404.78 ± 2.5Carbon III (UKM II)5.13 ± 2.772.03 ± 0.50
Overall Class 1IIAIIADistilled I (UKM III)5.12 ± 0.604.53 ± 0.14
Distilled II (Hentian Kajang VI)7.77 ± 1.421.01 ± 0.22
Distilled III (UKM I)3.42 ± 1.595.86 ± 0.76
UV I (Bangi I)4.85 ± 0.203.01 ± 0.51
UV II (UKM IV)3.27 ± 1.082.63 ± 0.57
UV III (Hentian Kajang VII)3.82 ± 0.650.68 ± 0.07
Average4.85 ± 1.874.12 ± 2.89
Overall Class 1IIAIIA
Note: 1 National Water Class of Malaysia based on the metal concentration [56].

