A Smart Water Grid for Micro-Trading Rainwater: Hydraulic Feasibility Analysis

 , ,
, ,  , ,
, , 
Abstract
:1. Introduction
2. Background
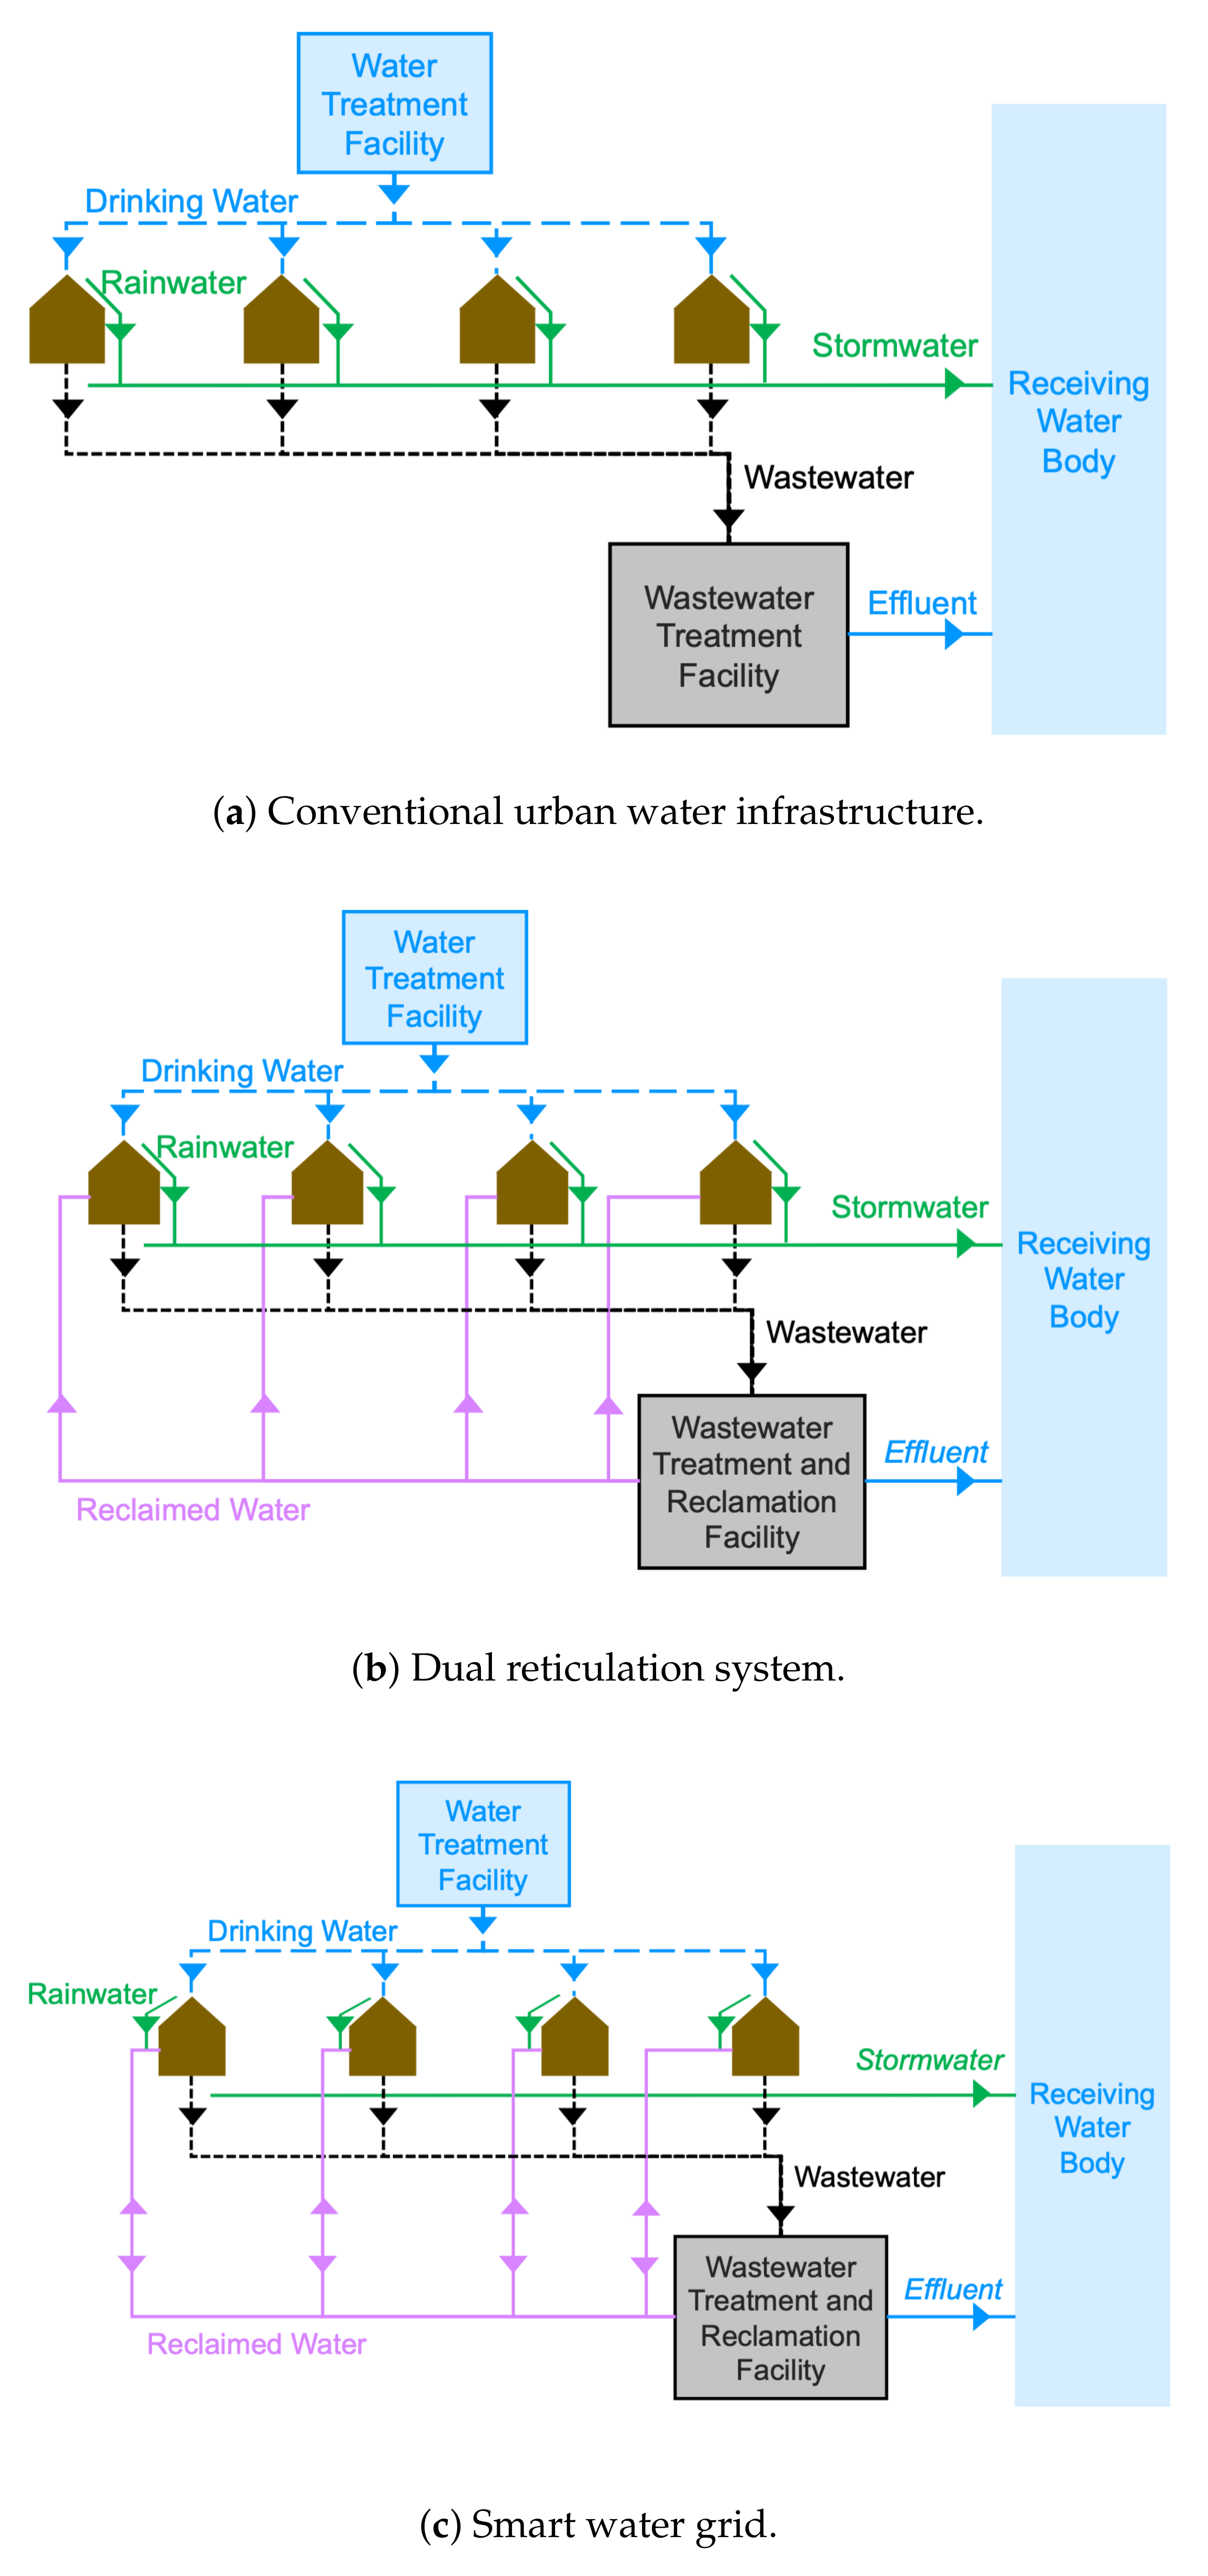
2.1. Dual Reticulation Networks
2.2. Rainwater Harvesting Systems
2.3. Micro-Trading in Water Markets and Smart Technologies
2.4. Agent-Based Modeling for Water Infrastructure
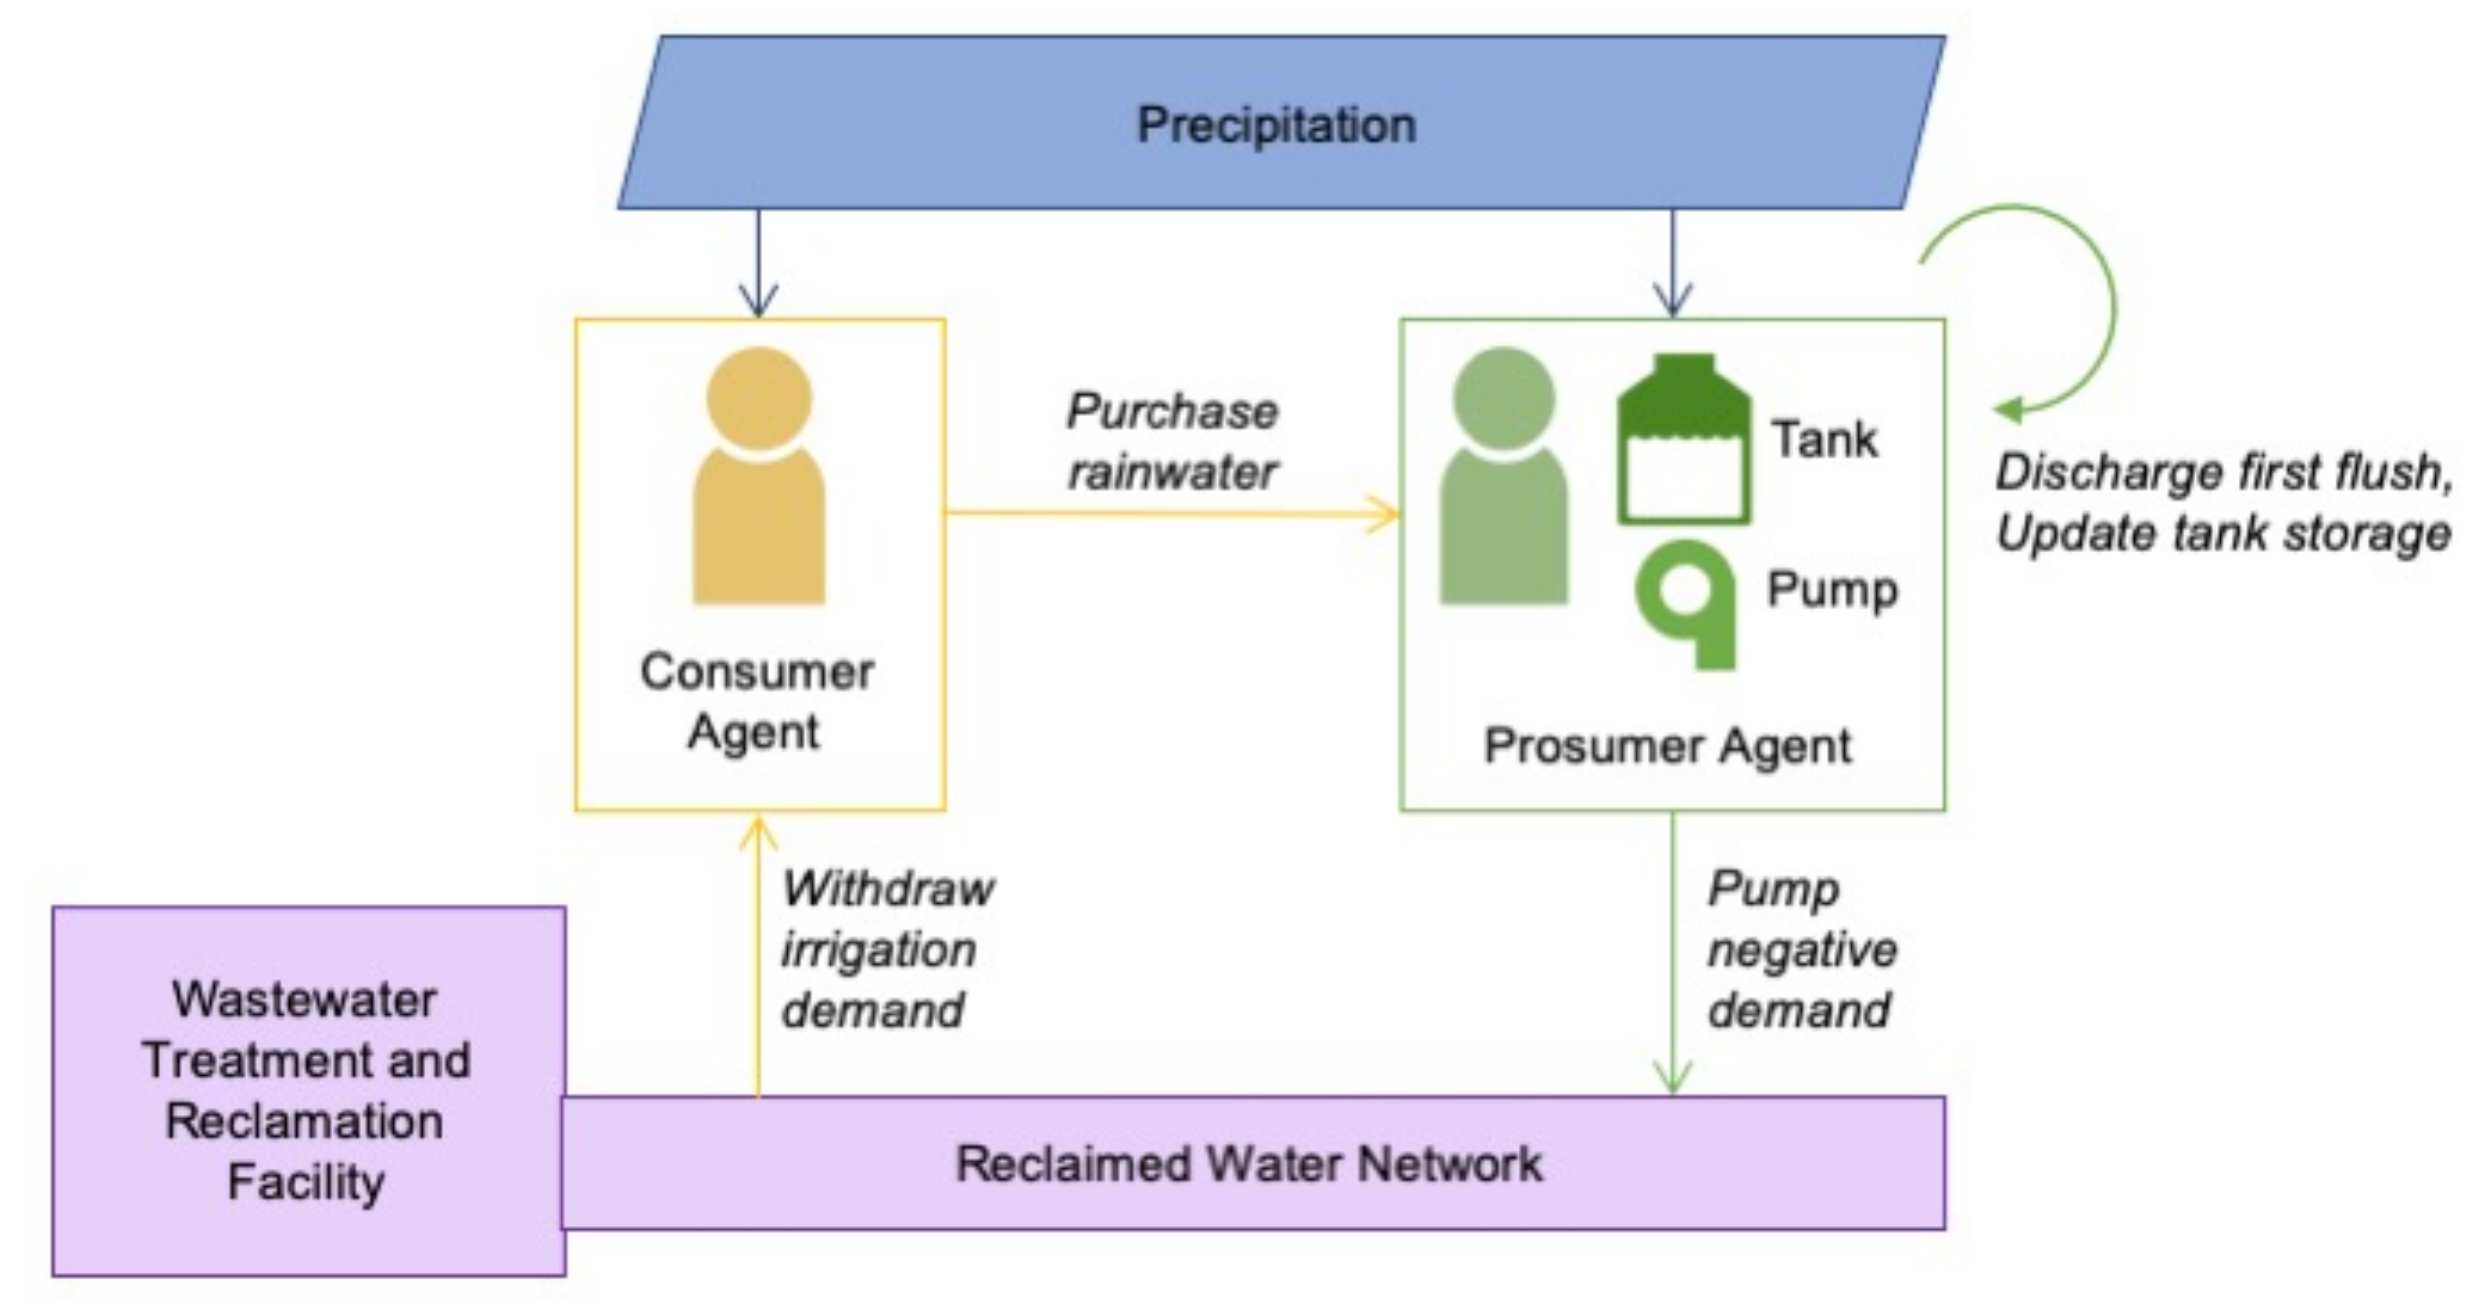
3. Agent-Based Modeling Framework
3.1. Overview
3.1.1. Purpose
3.1.2. Entities, State Variables, and Scales
3.1.3. Process Overview and Scheduling
3.2. Design Concepts
3.2.1. Decision-Making
3.2.2. Stochasticity
3.2.3. Sensing
3.2.4. Interaction
3.3. Details: Initialization, Input, and Implementation
3.4. Details: Submodels
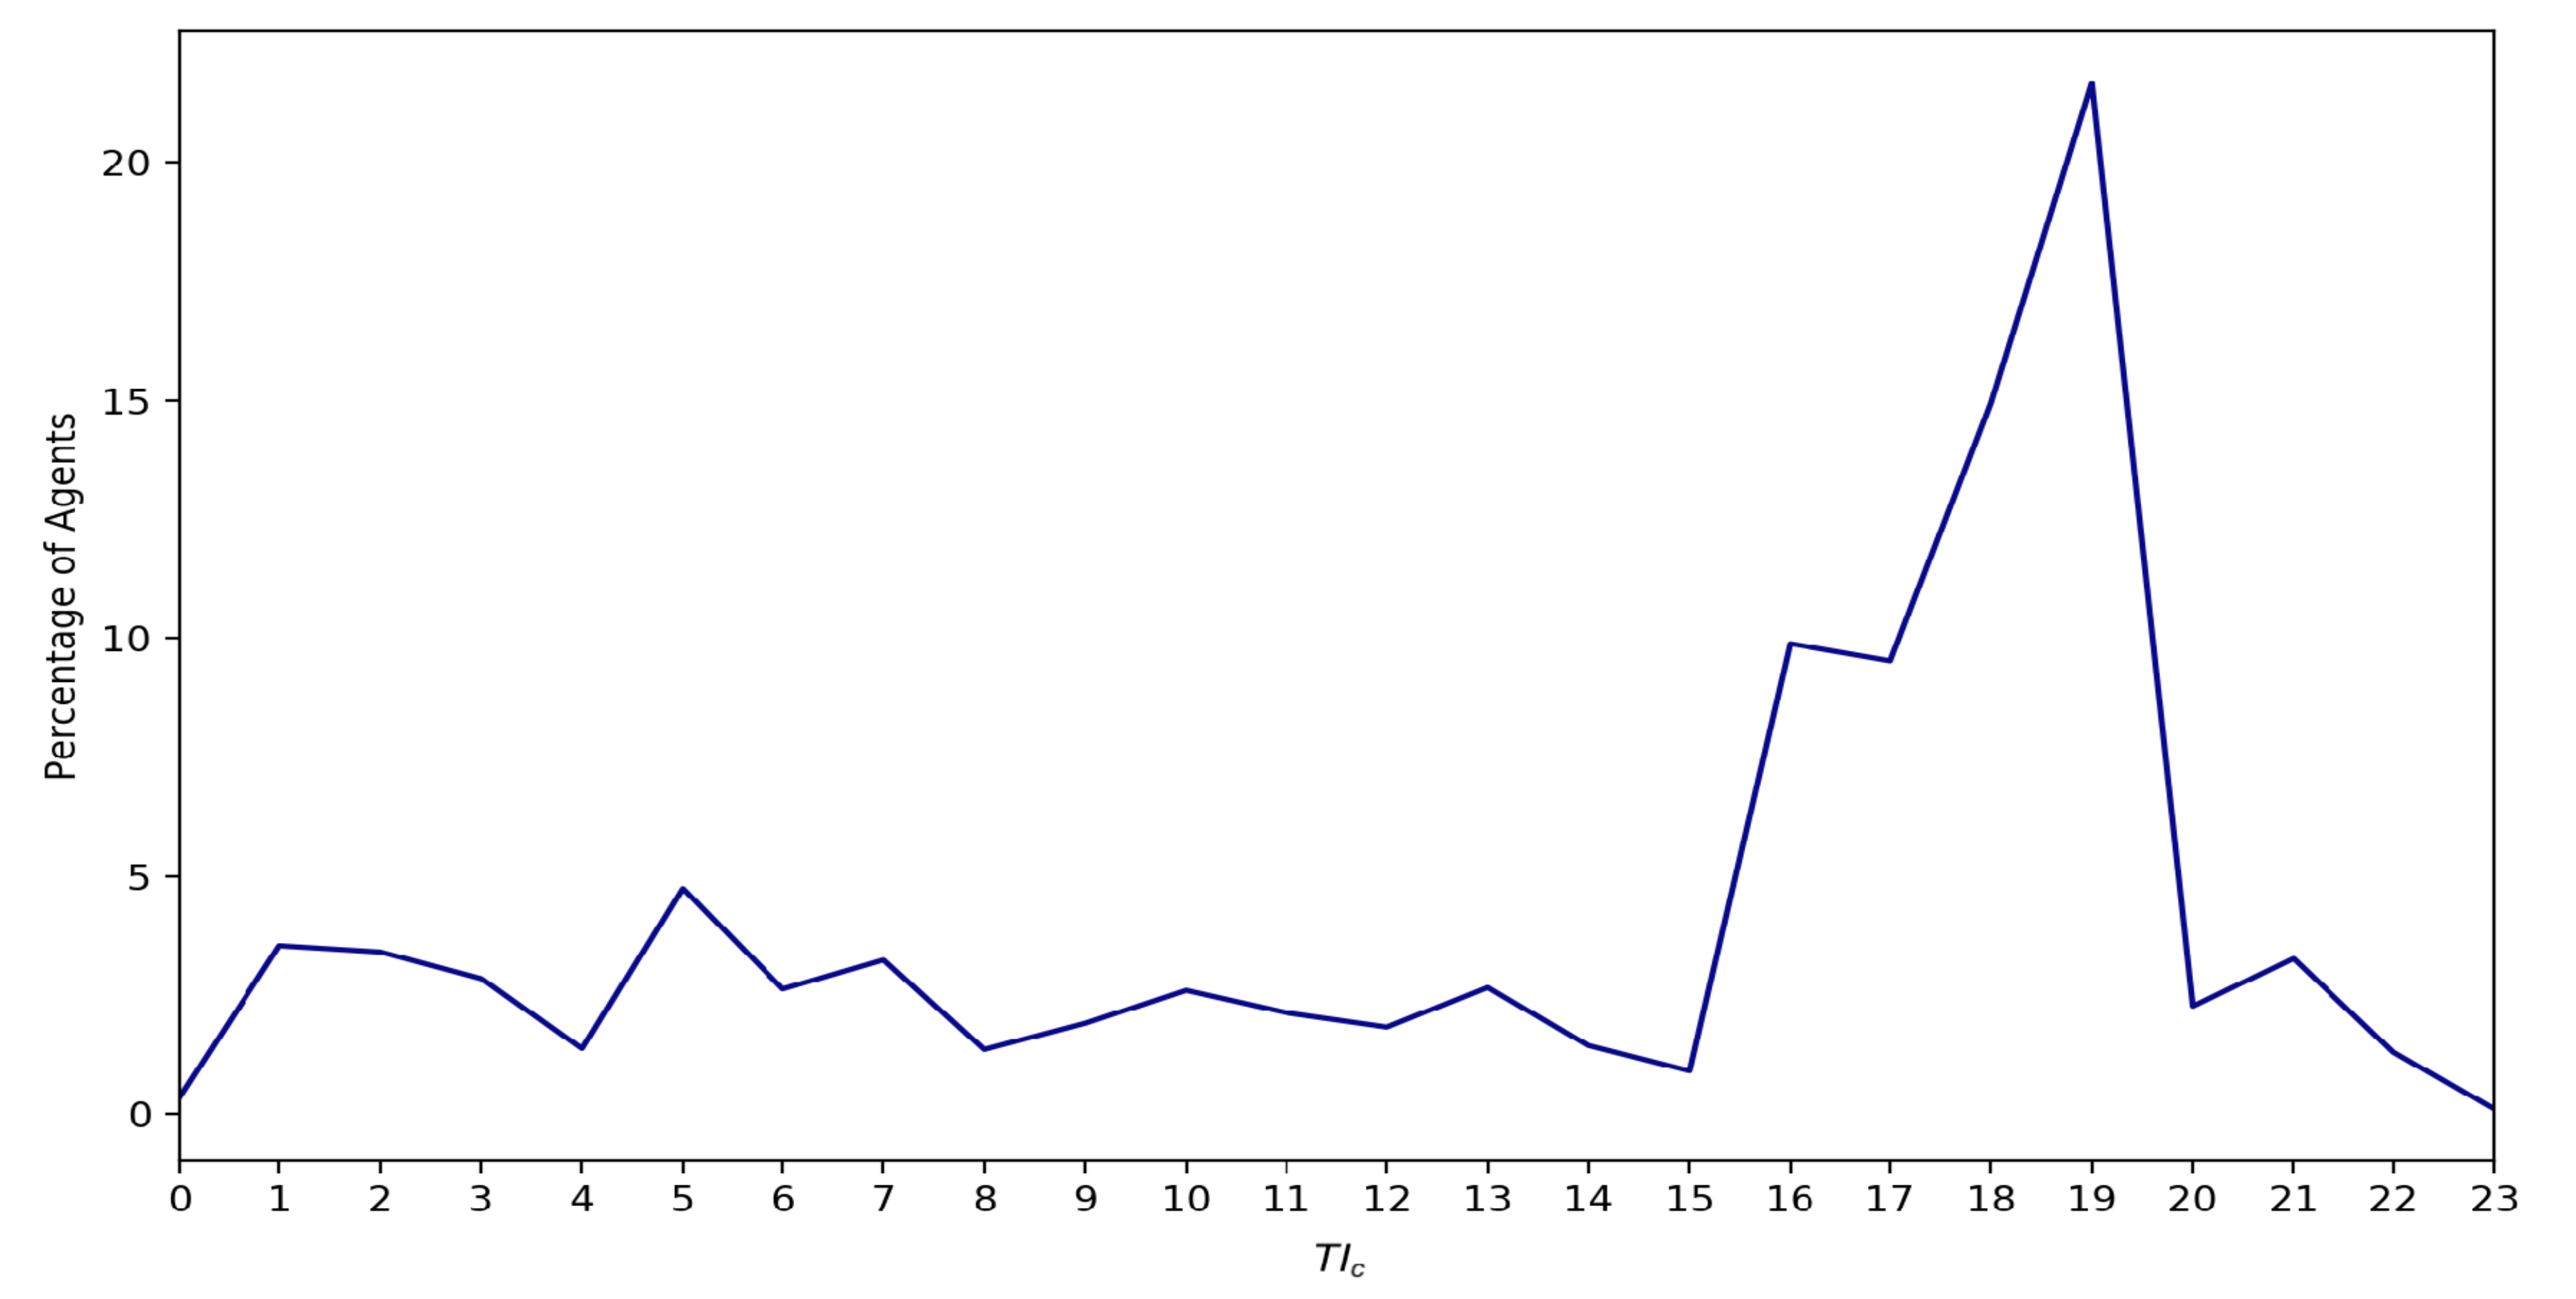
3.4.1. Consumer Daily Irrigation Demand Submodel
3.4.2. Hydraulic Simulation Submodel
3.4.3. Energy Consumption Submodel
3.4.4. Water Age Submodel
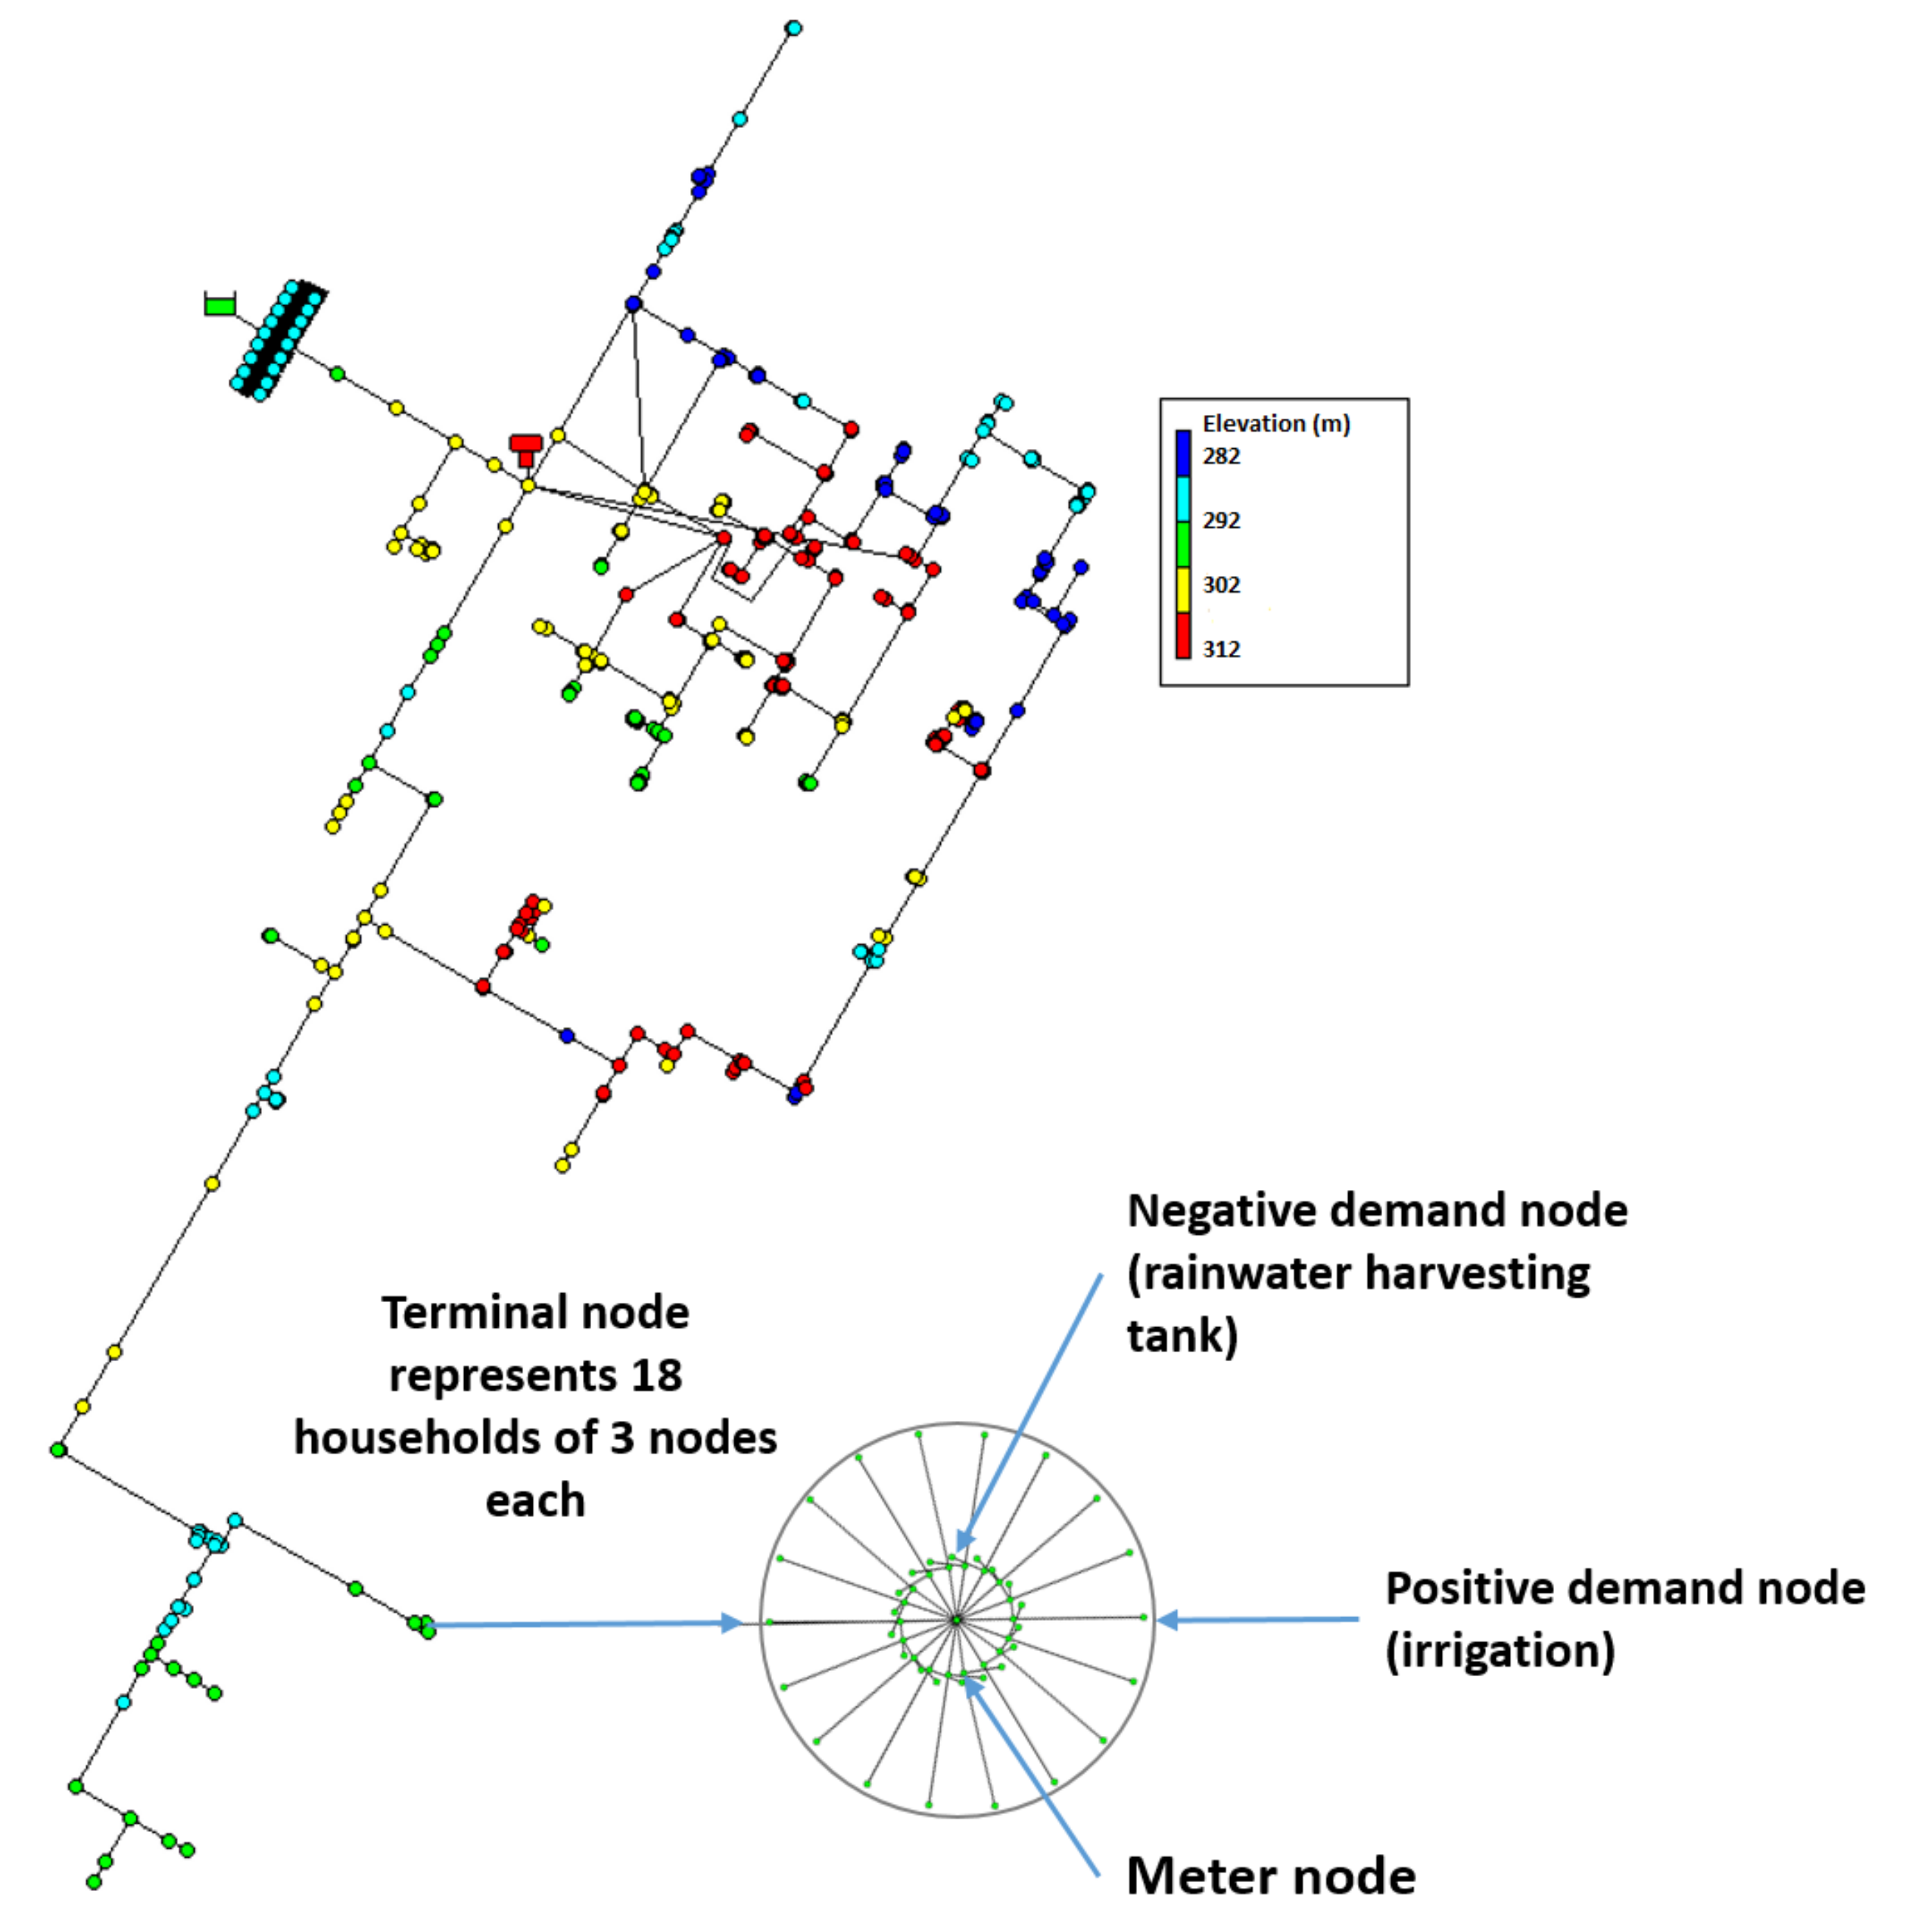
4. Virtual Network: Wolfpack City
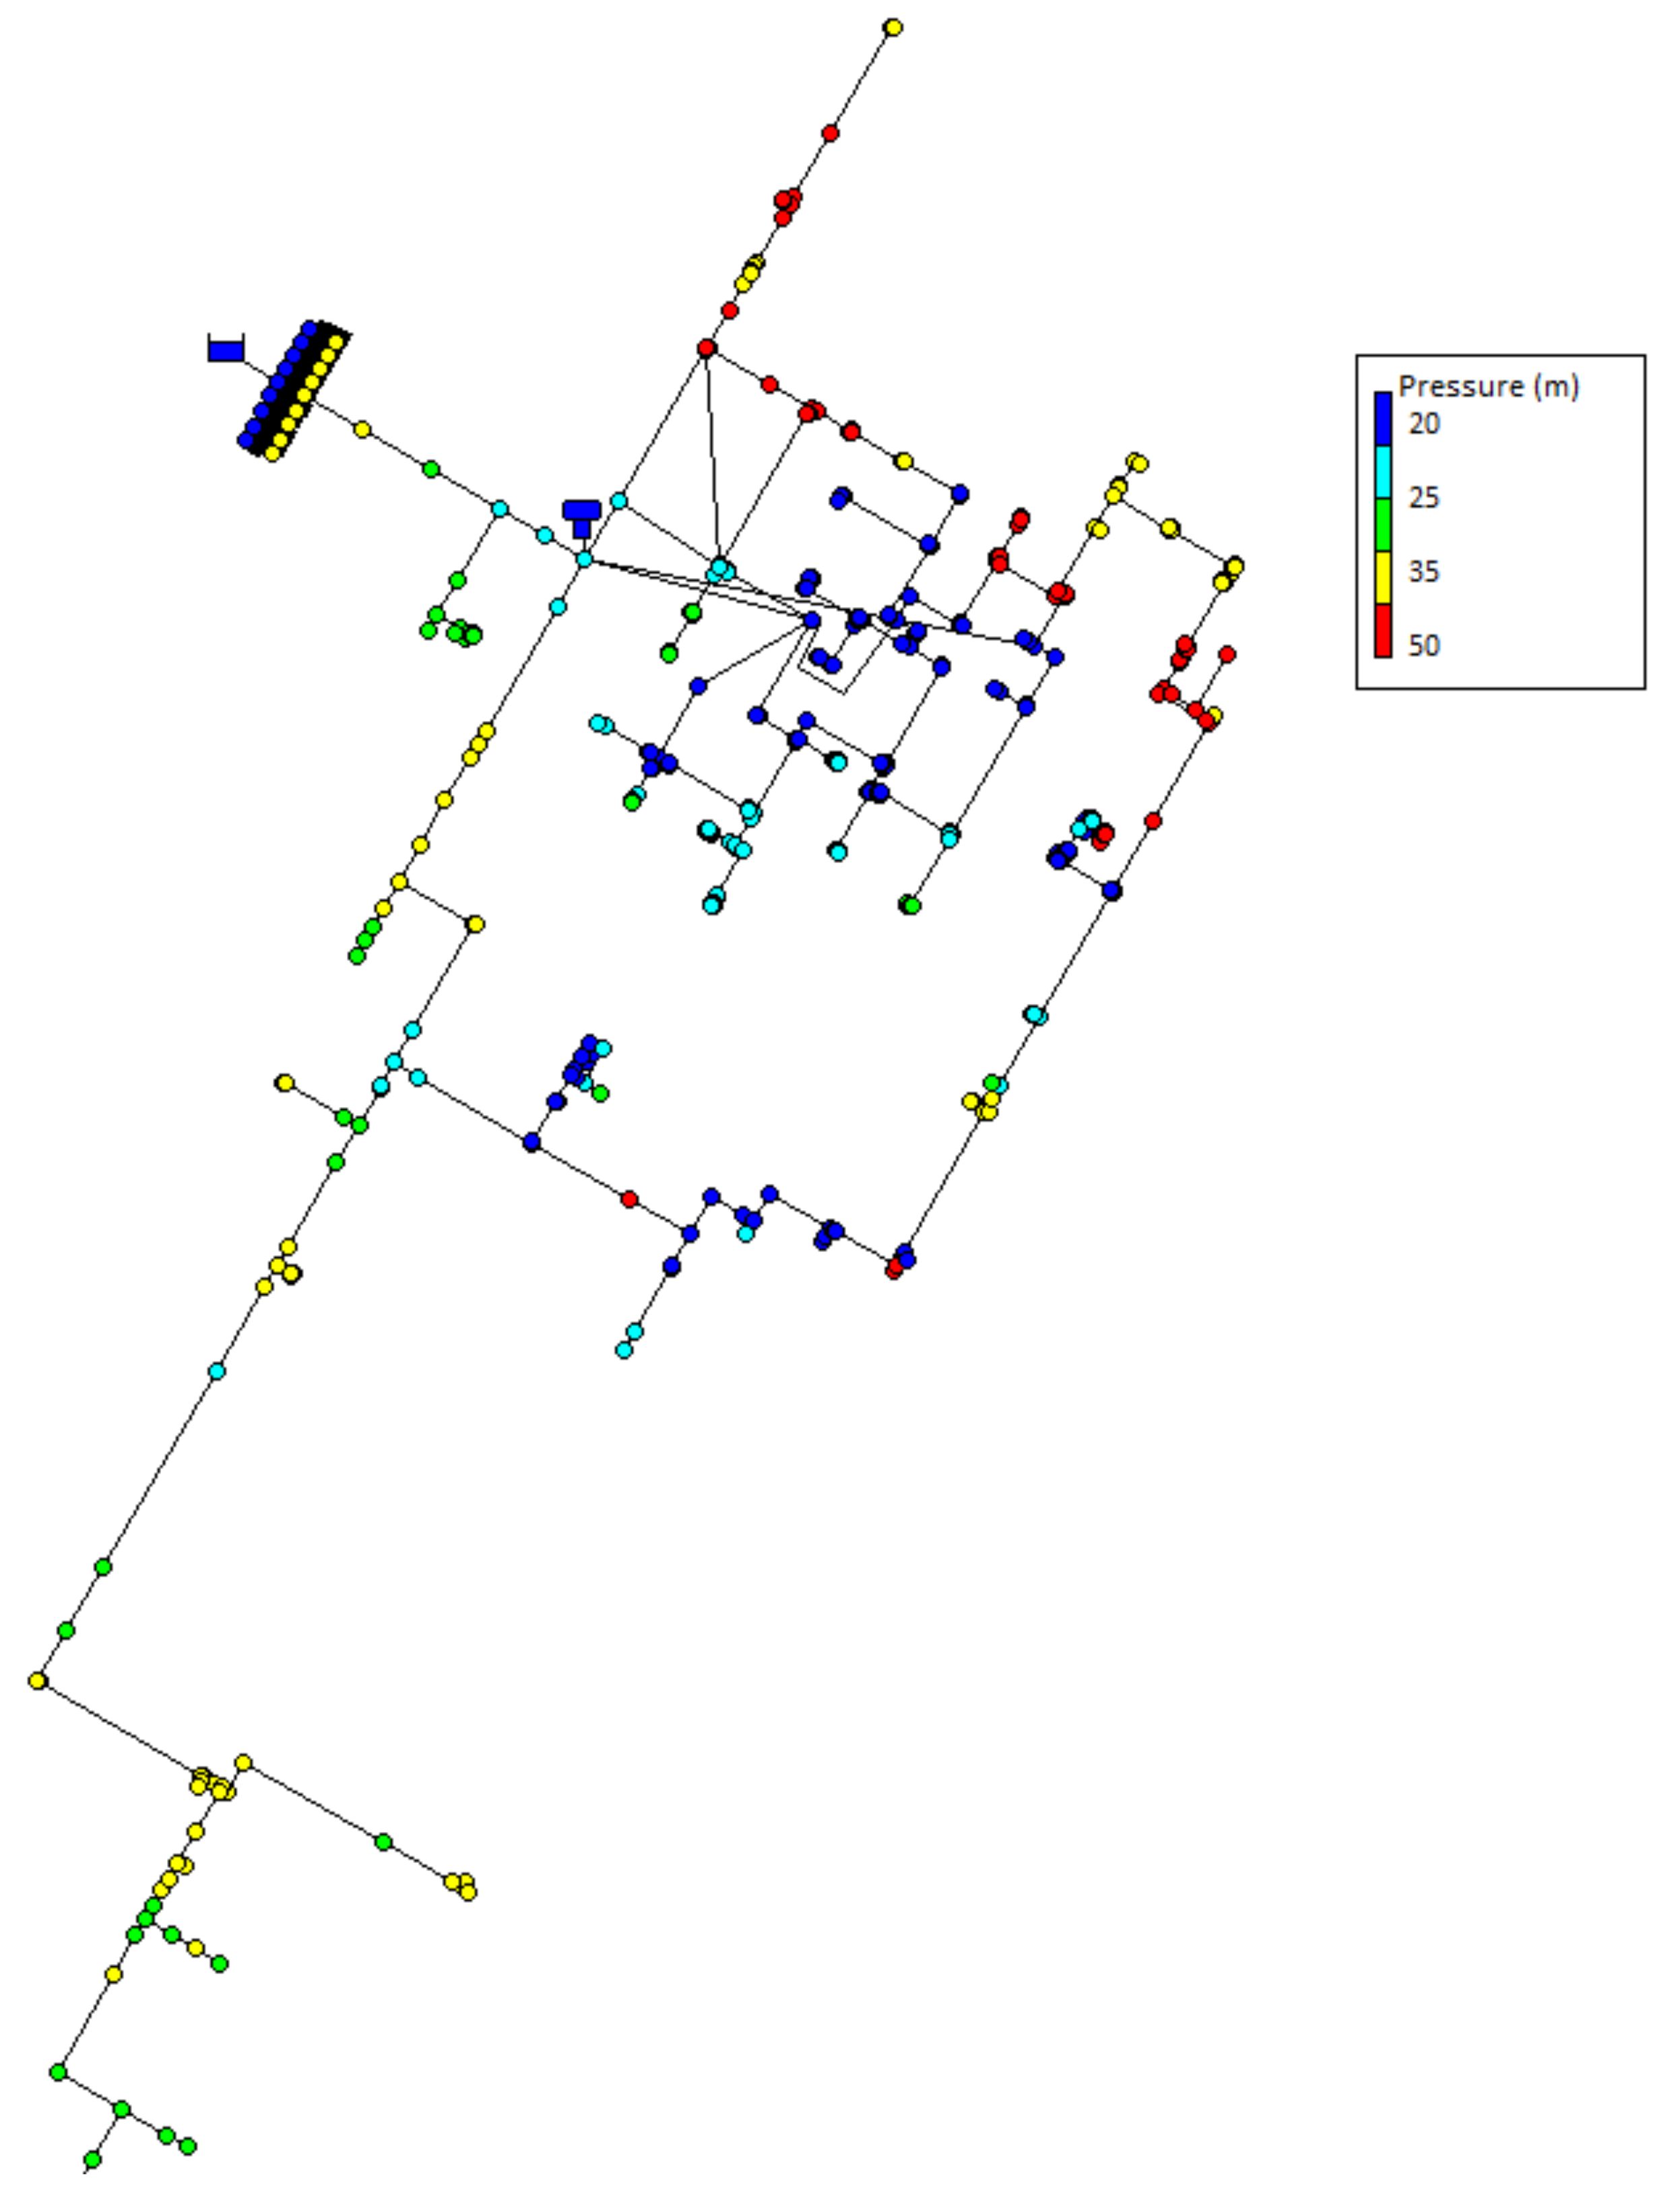
4.1. Non-Potable Network System
4.2. Climate Data
4.3. Modeling Scenarios
5. Results
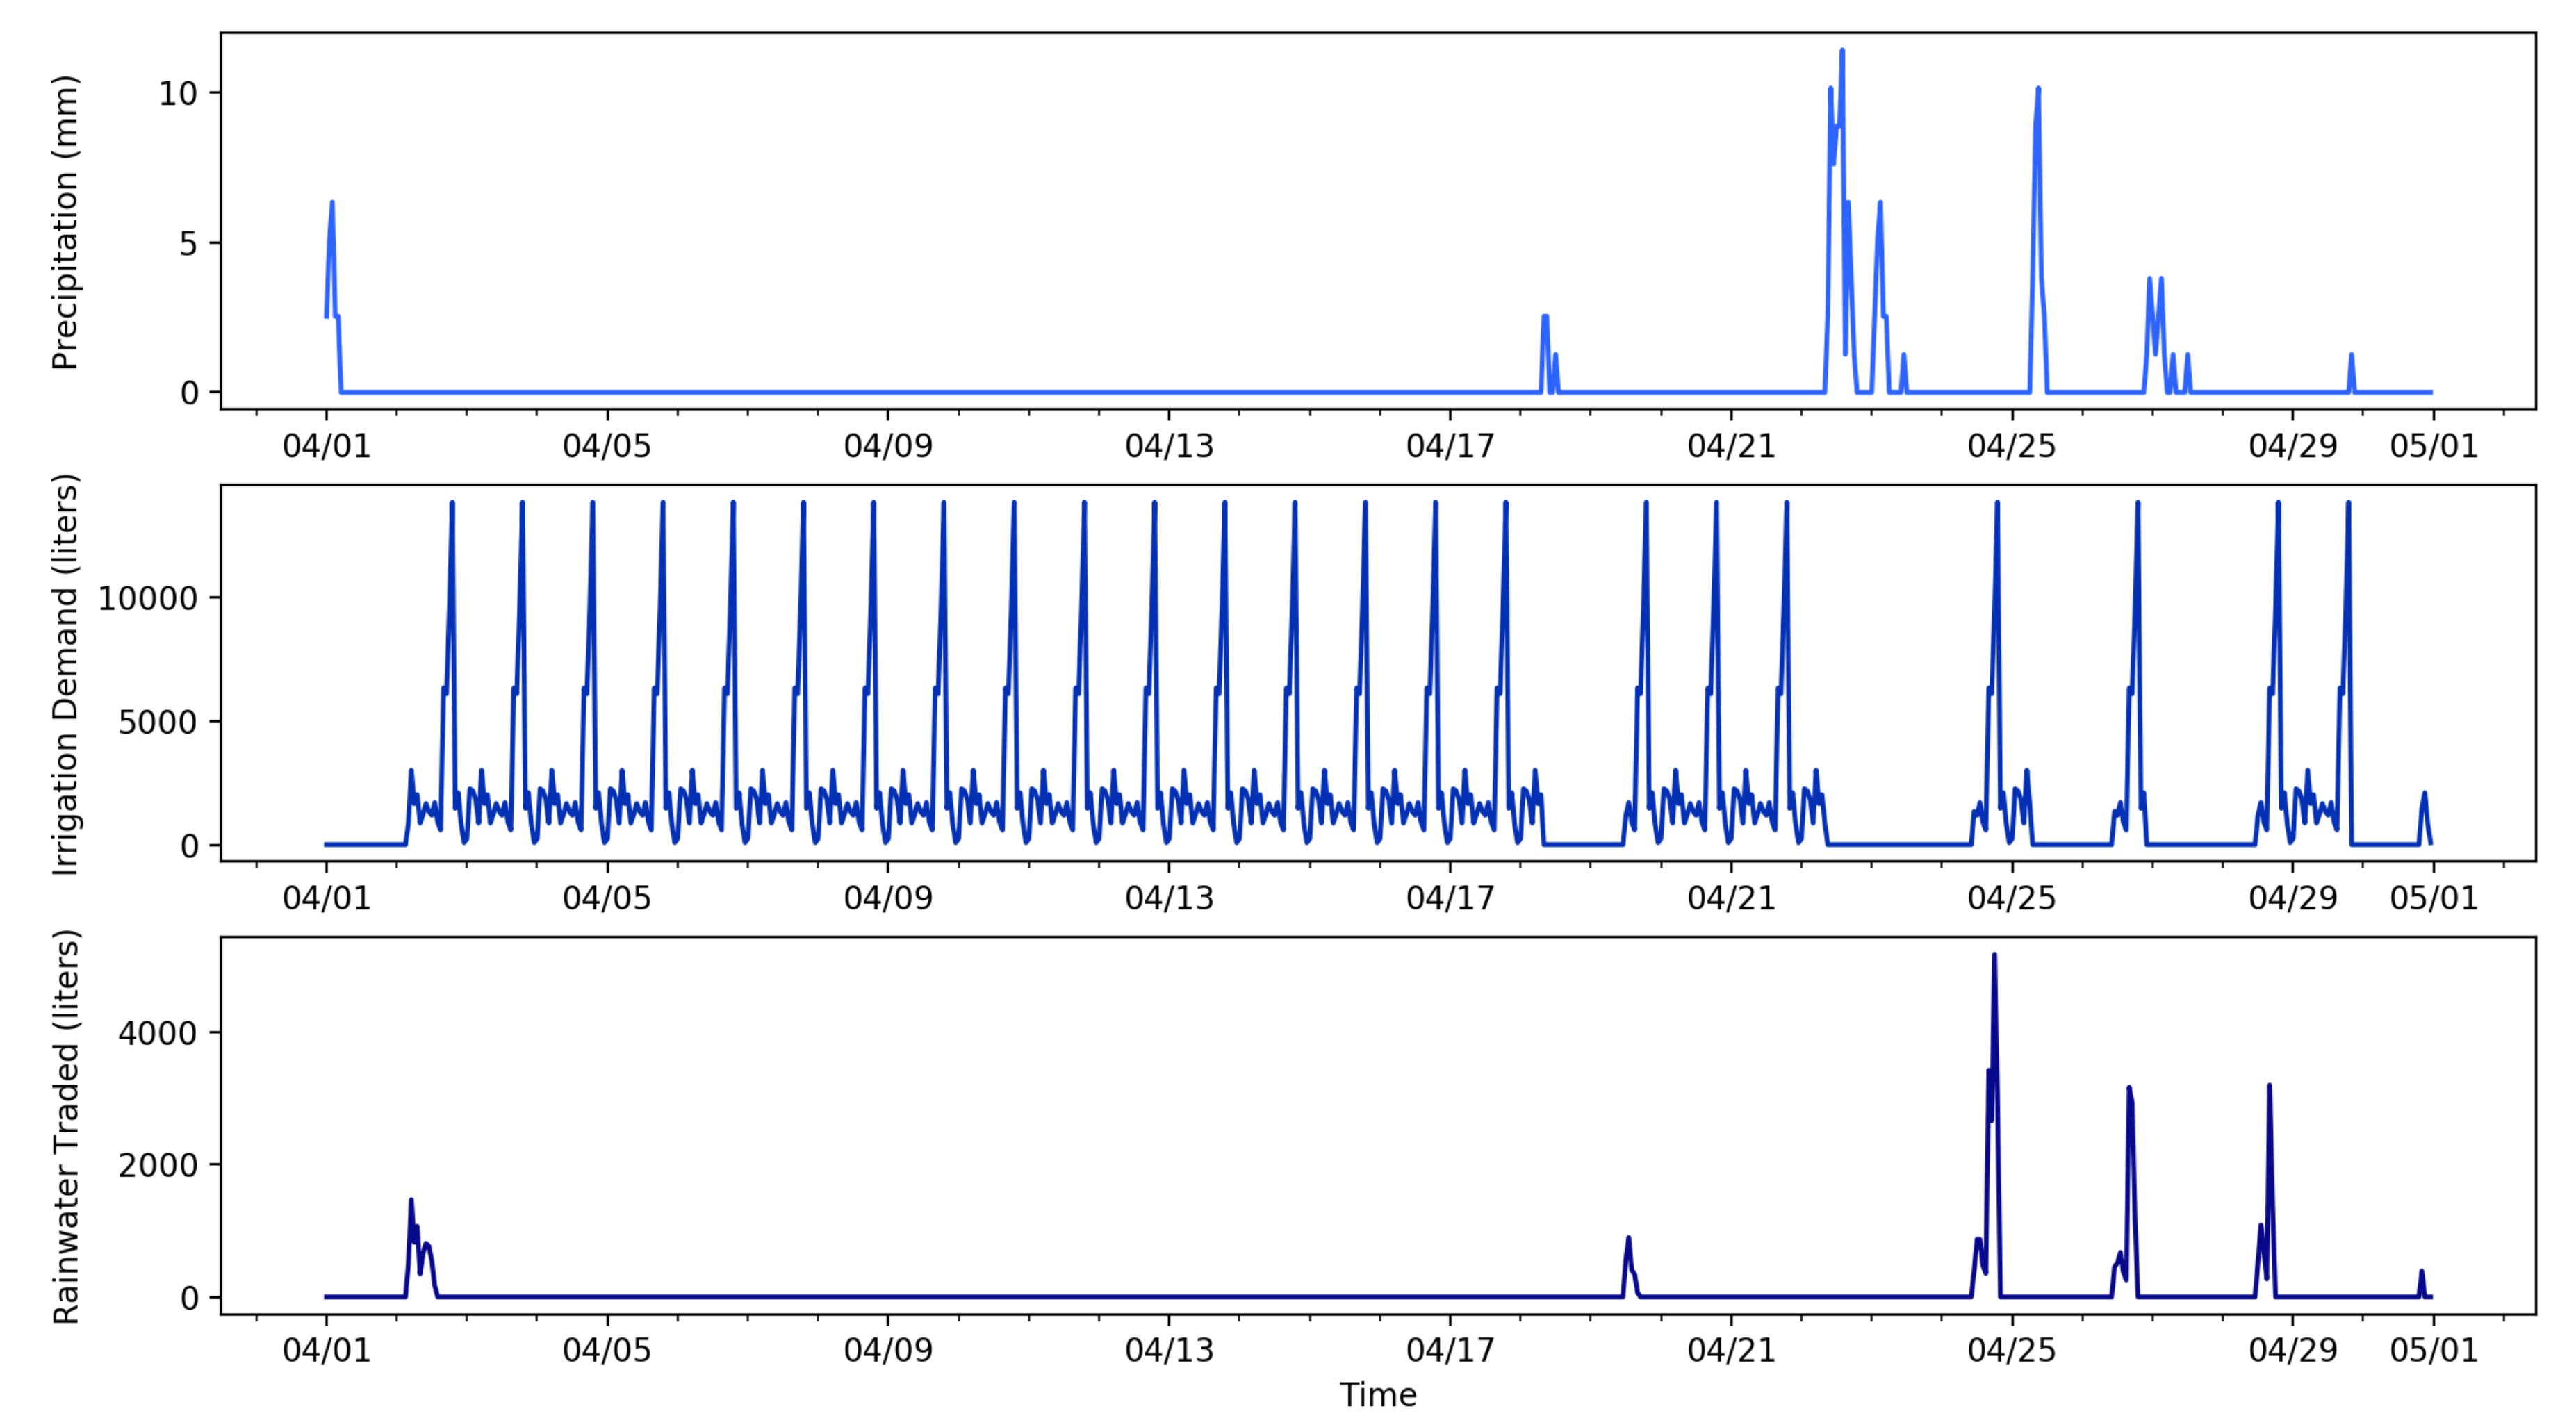
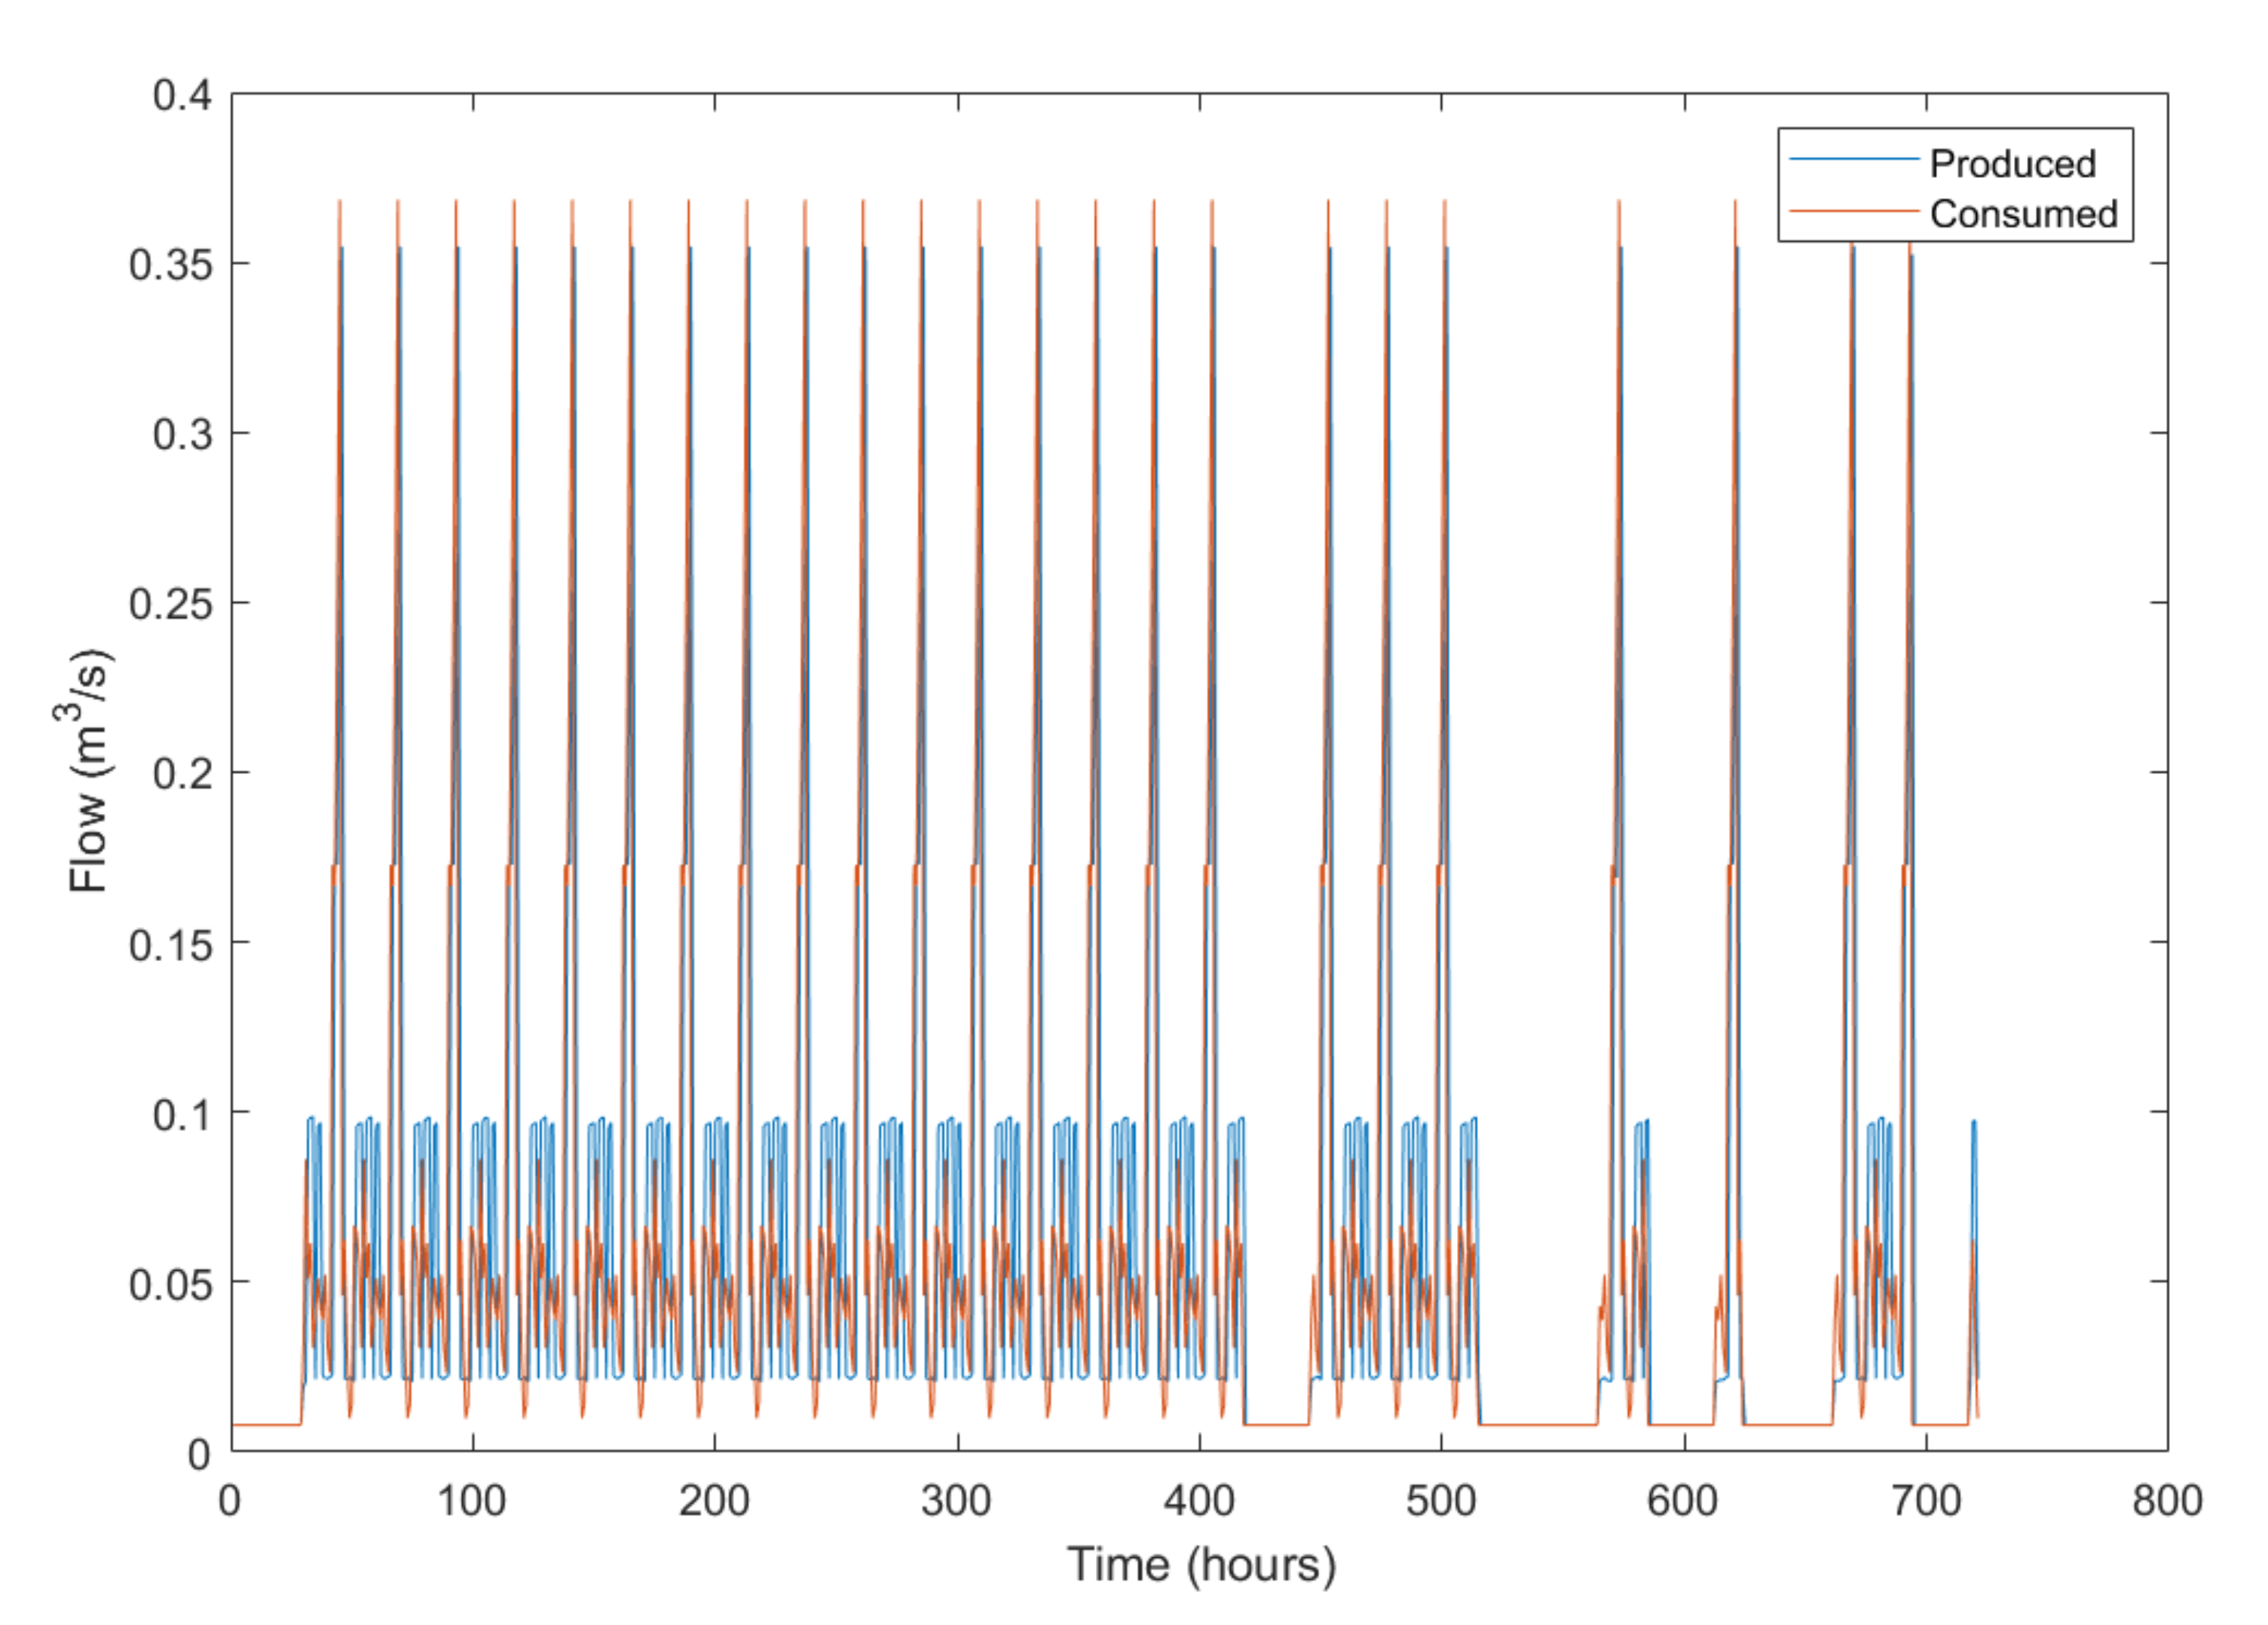
5.1. Scenario
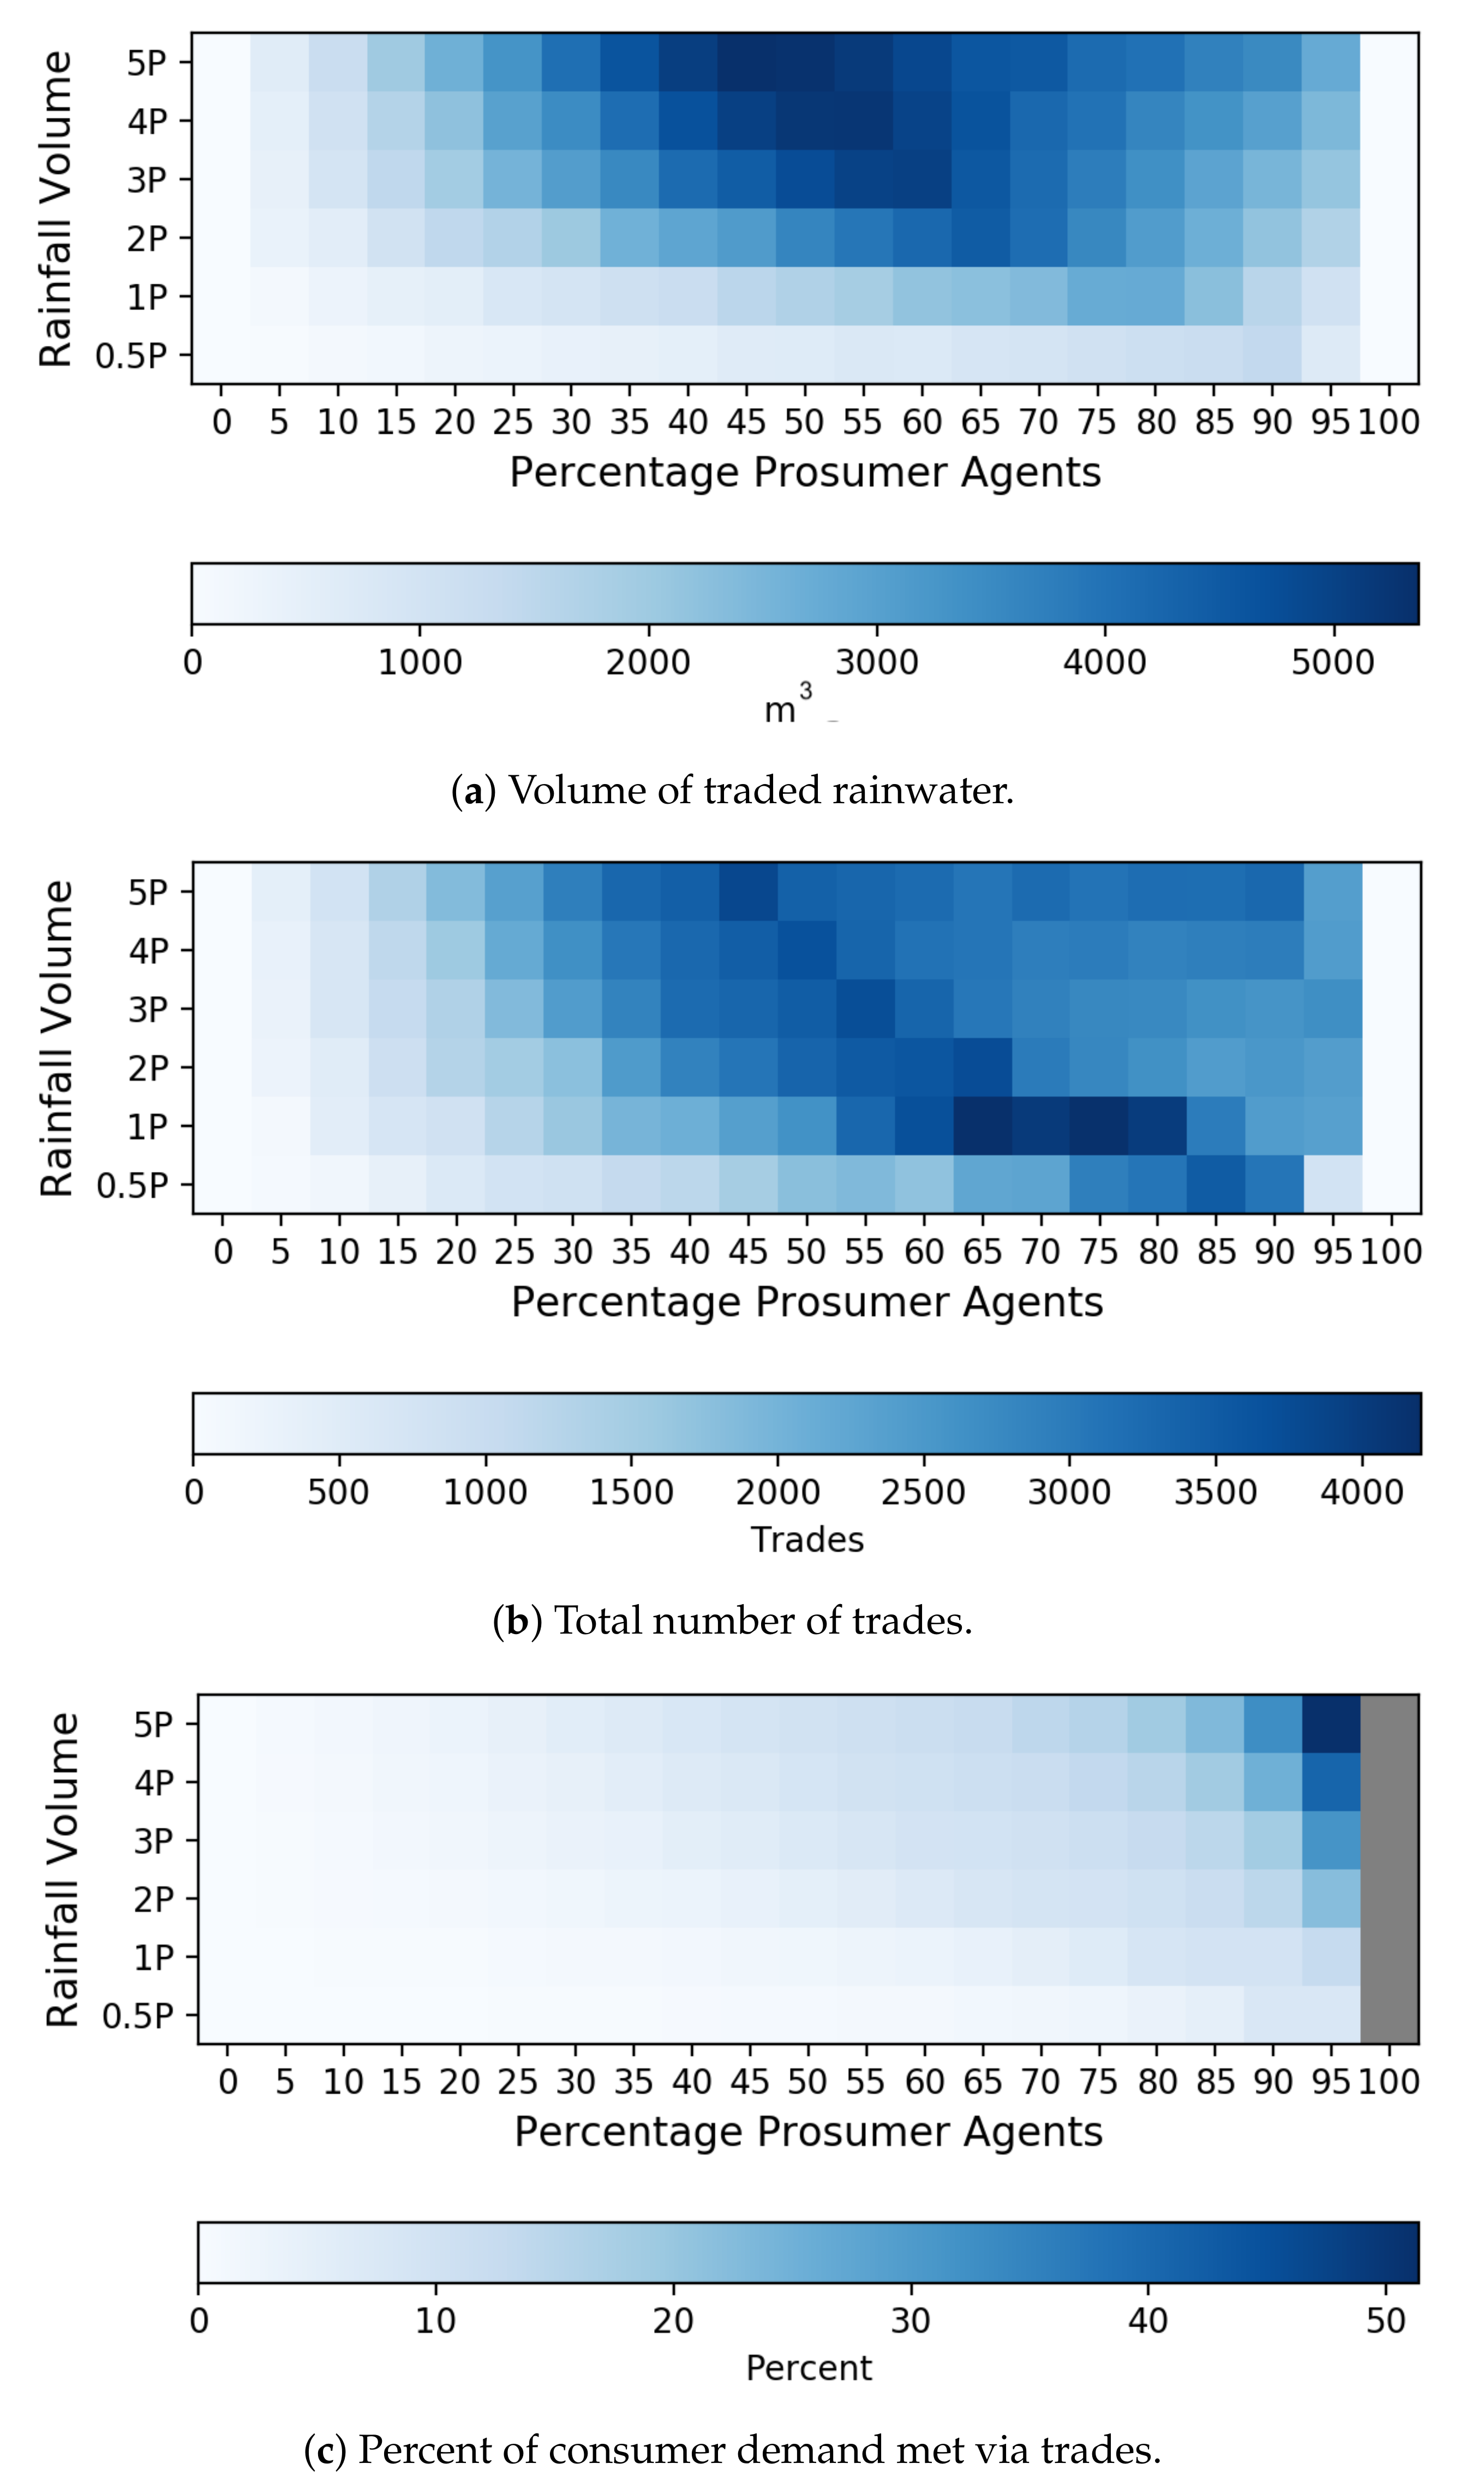
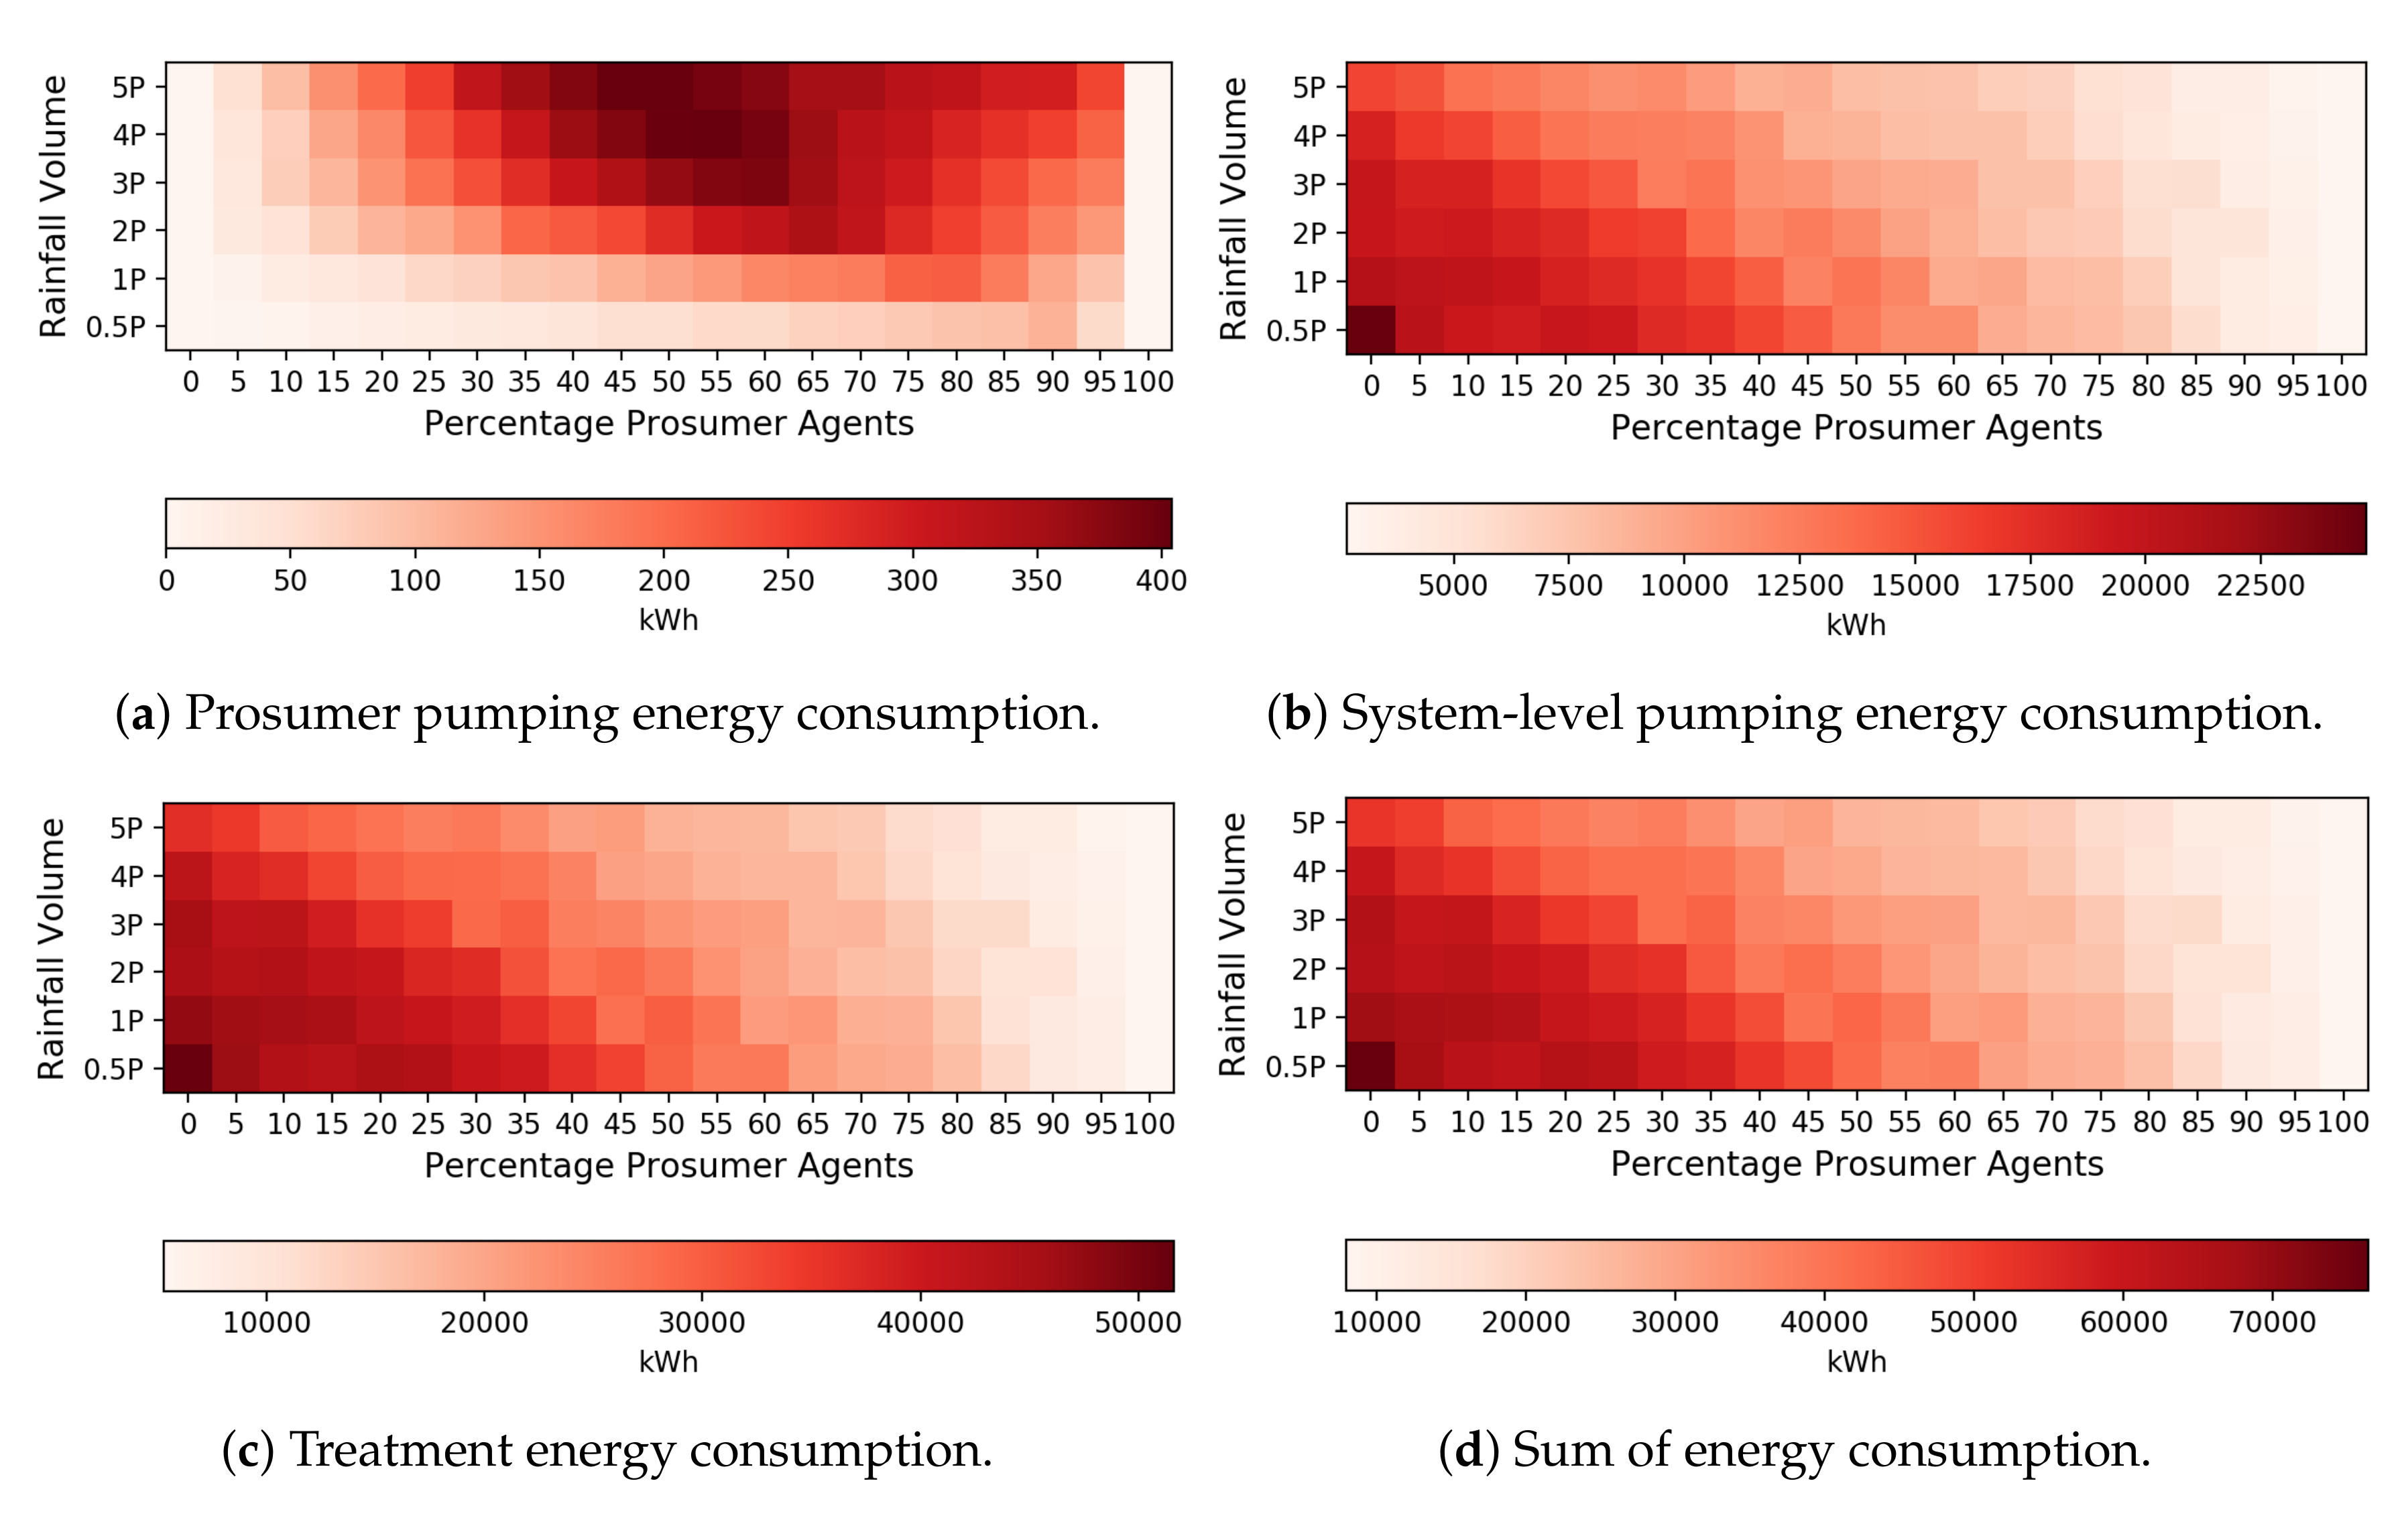
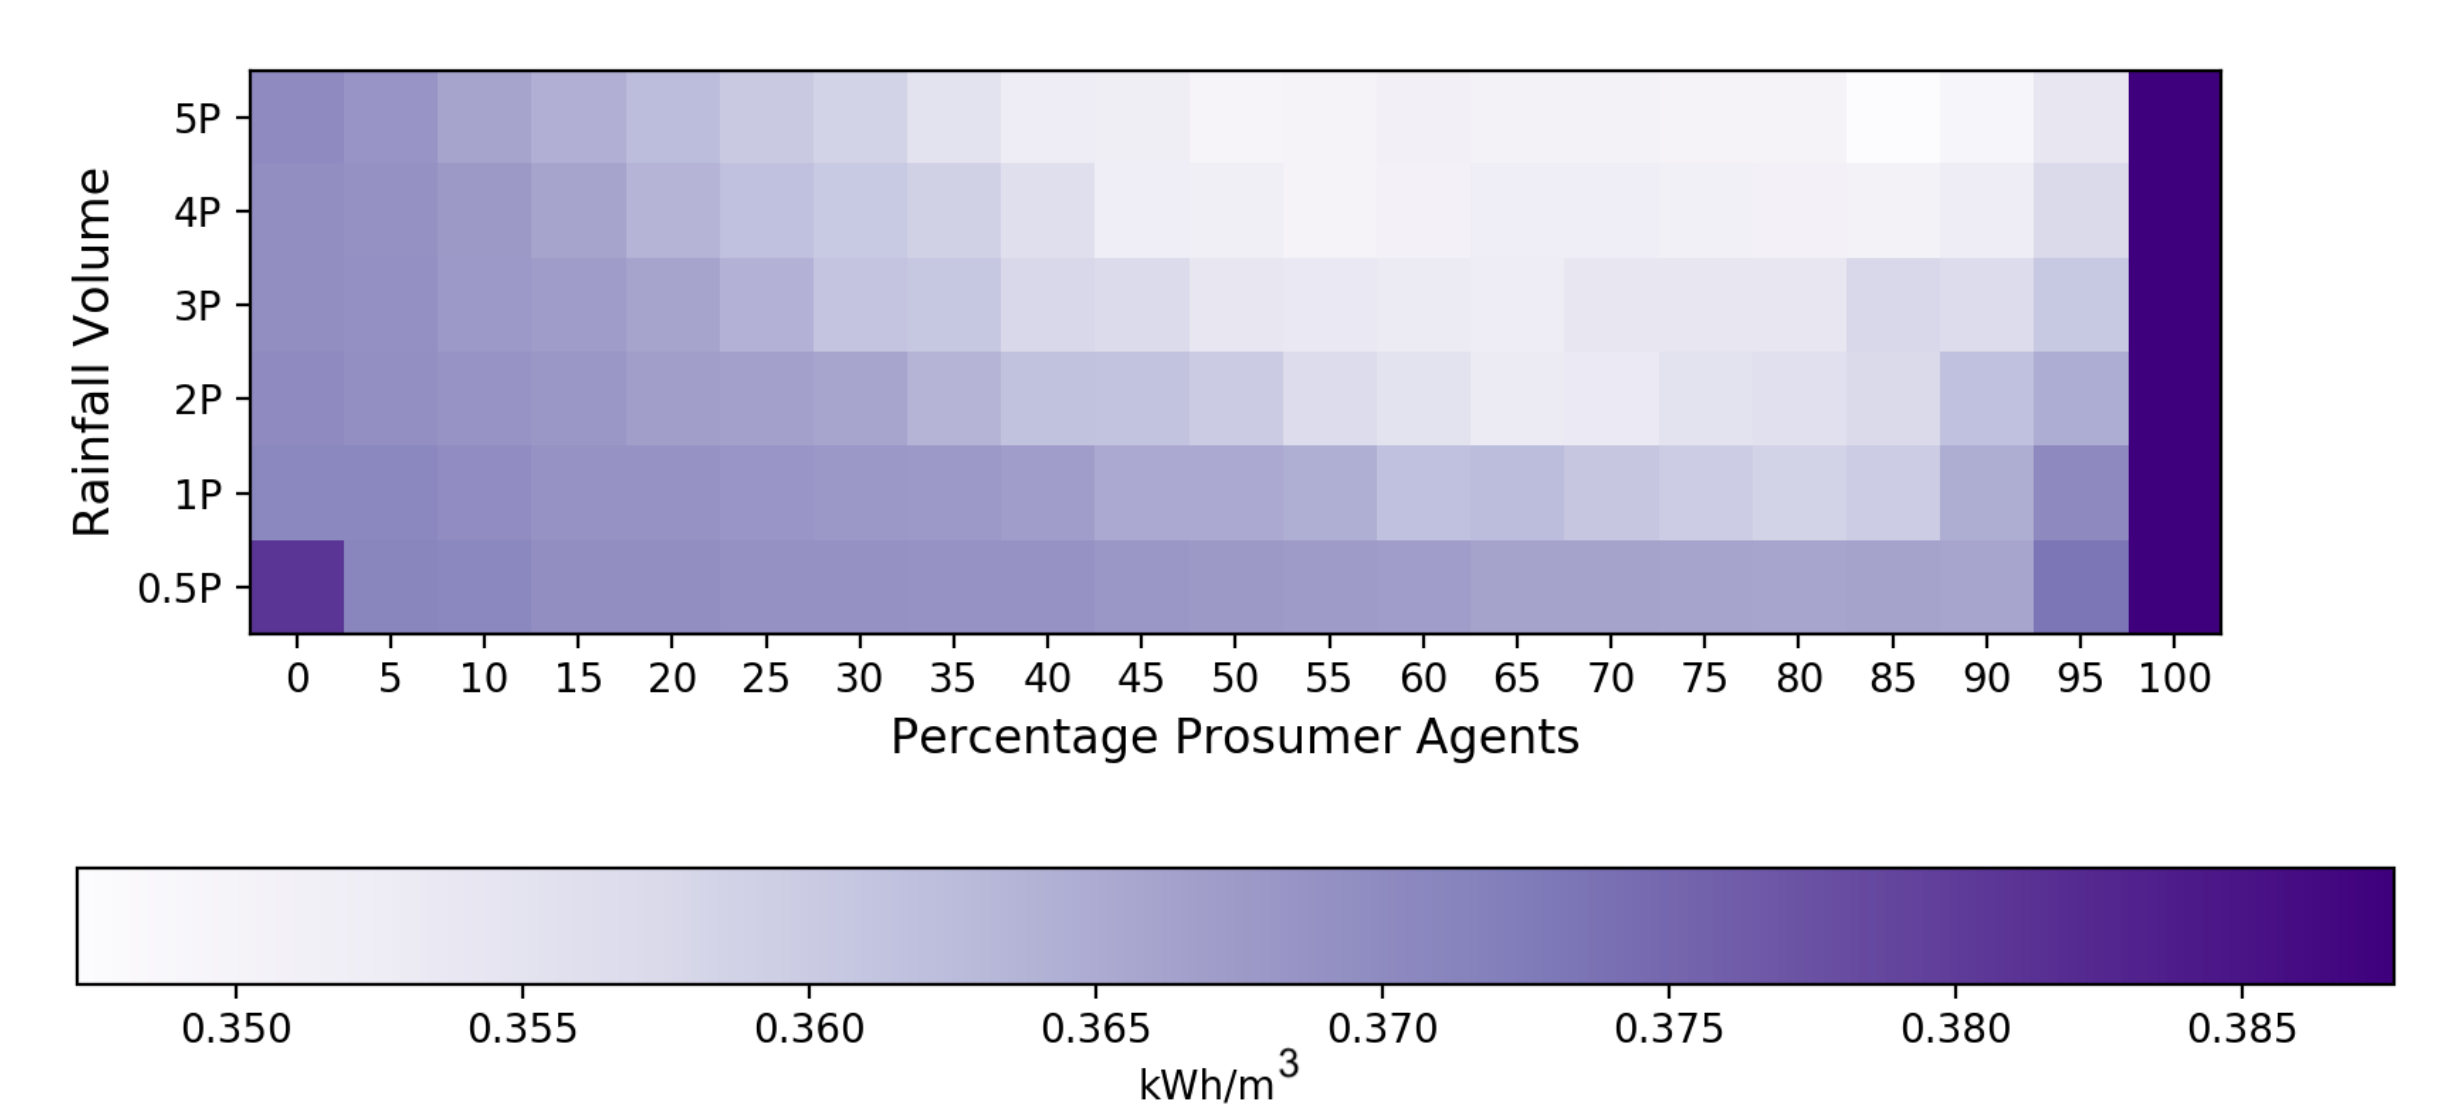
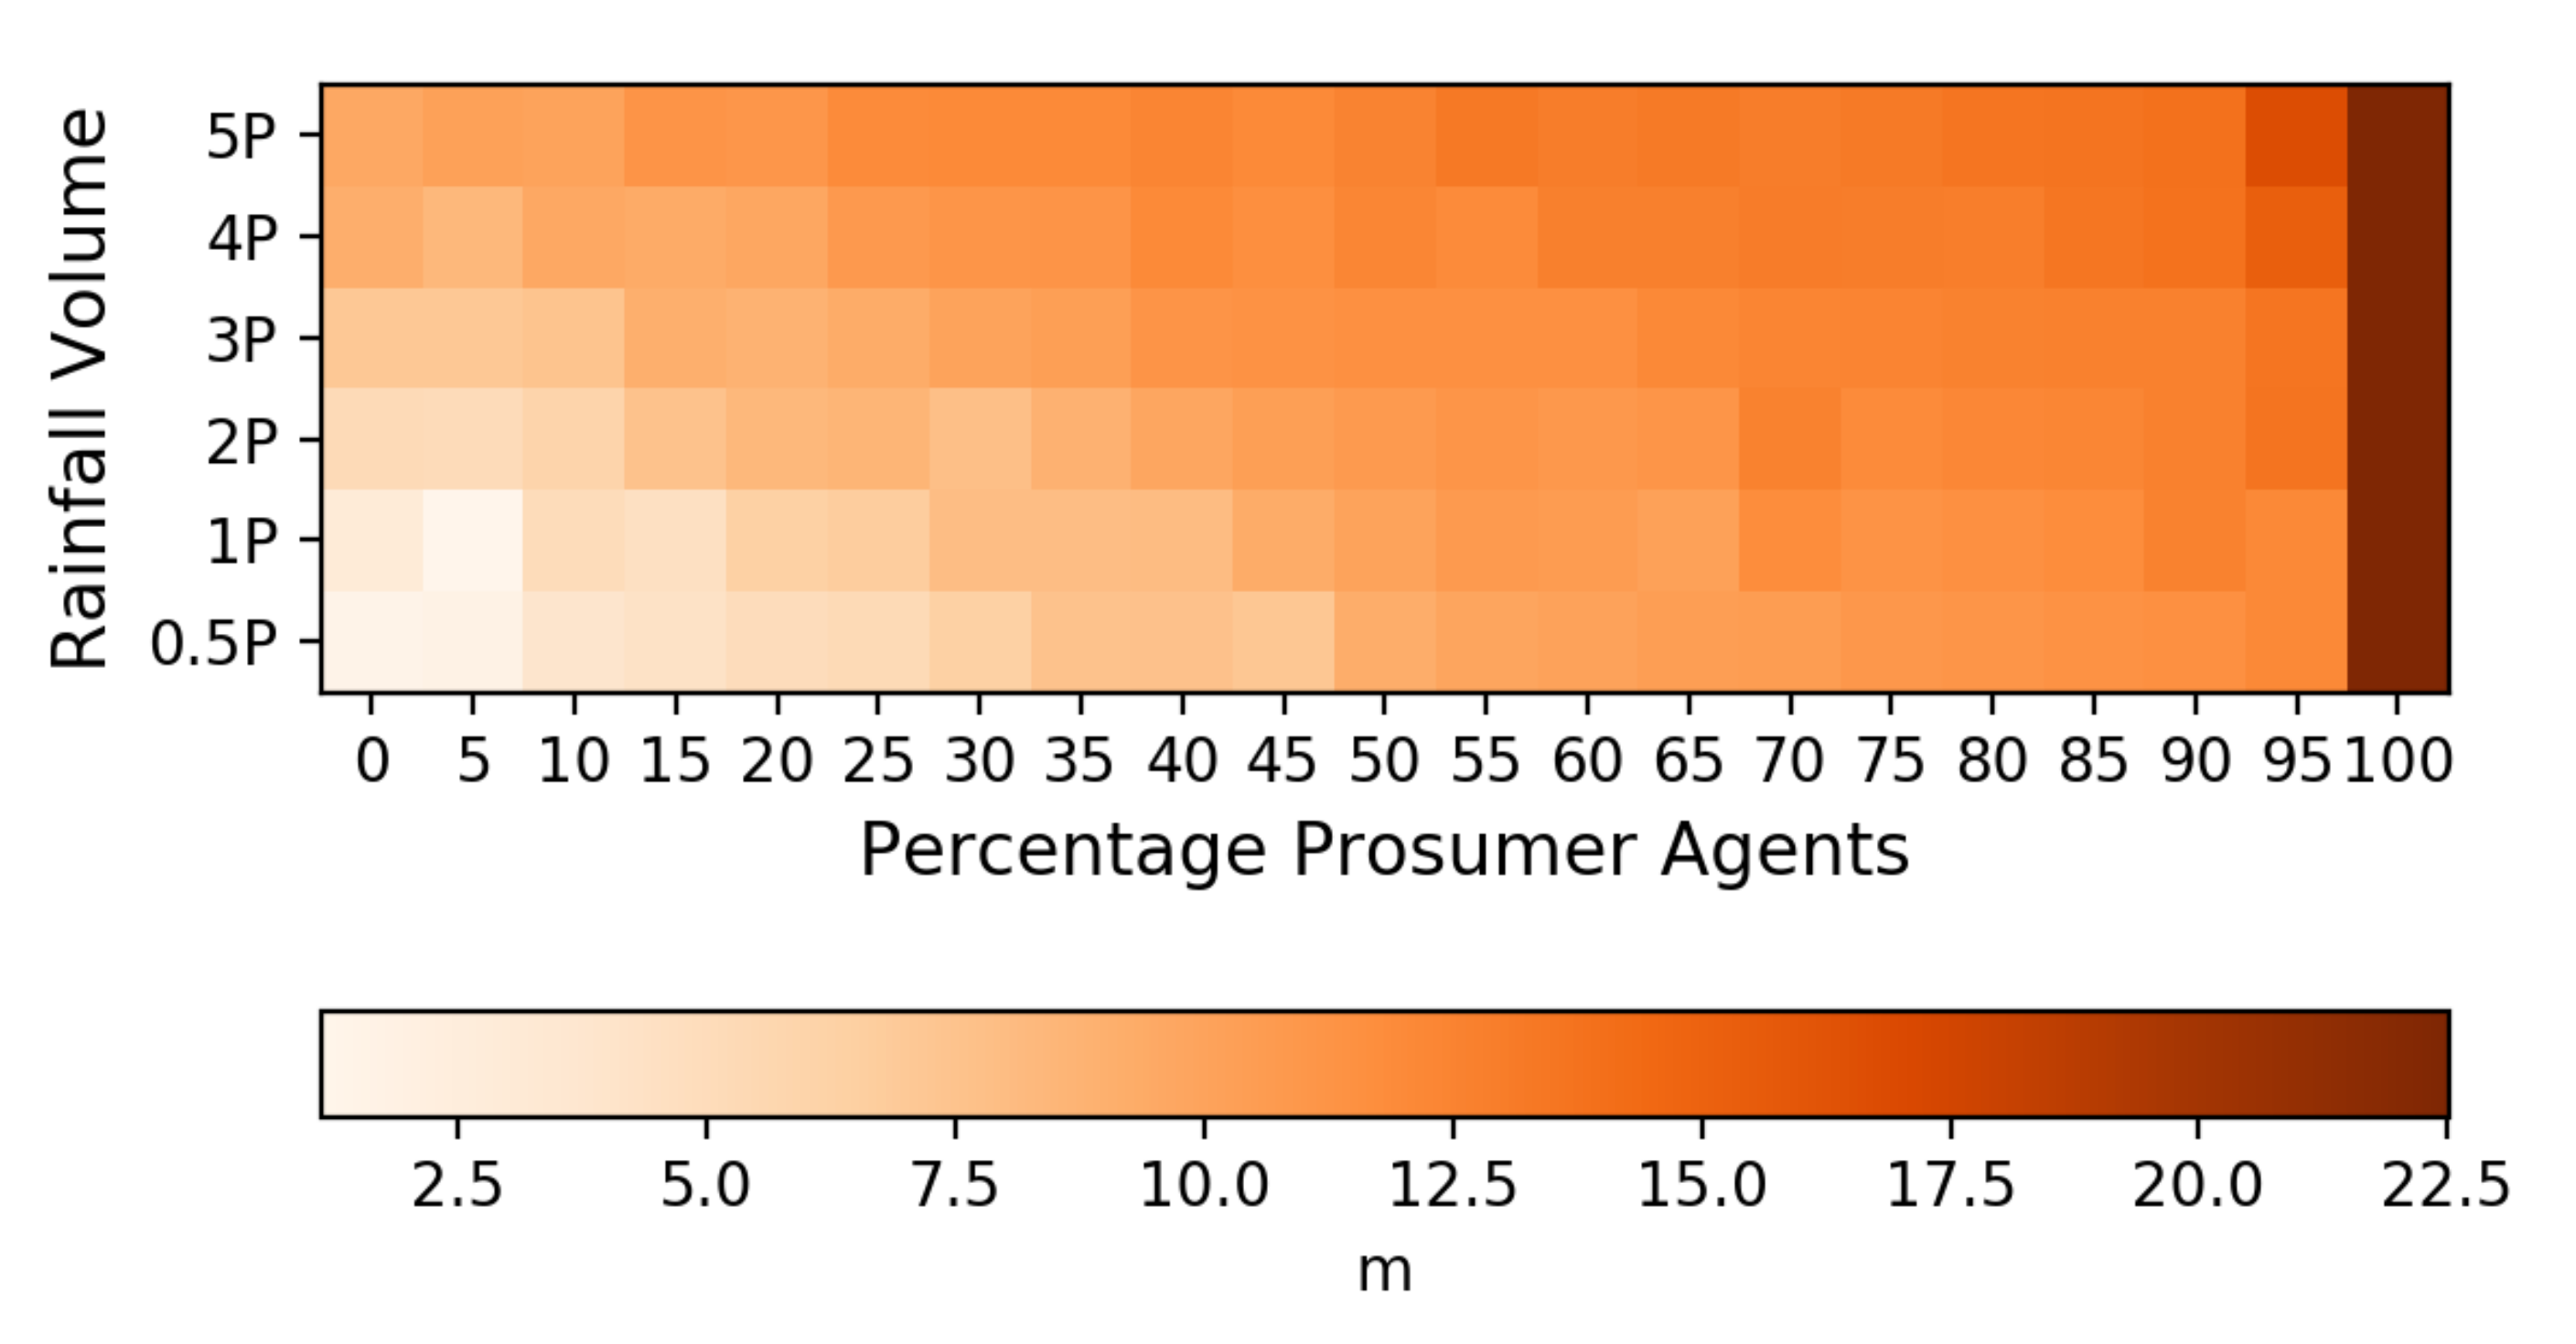
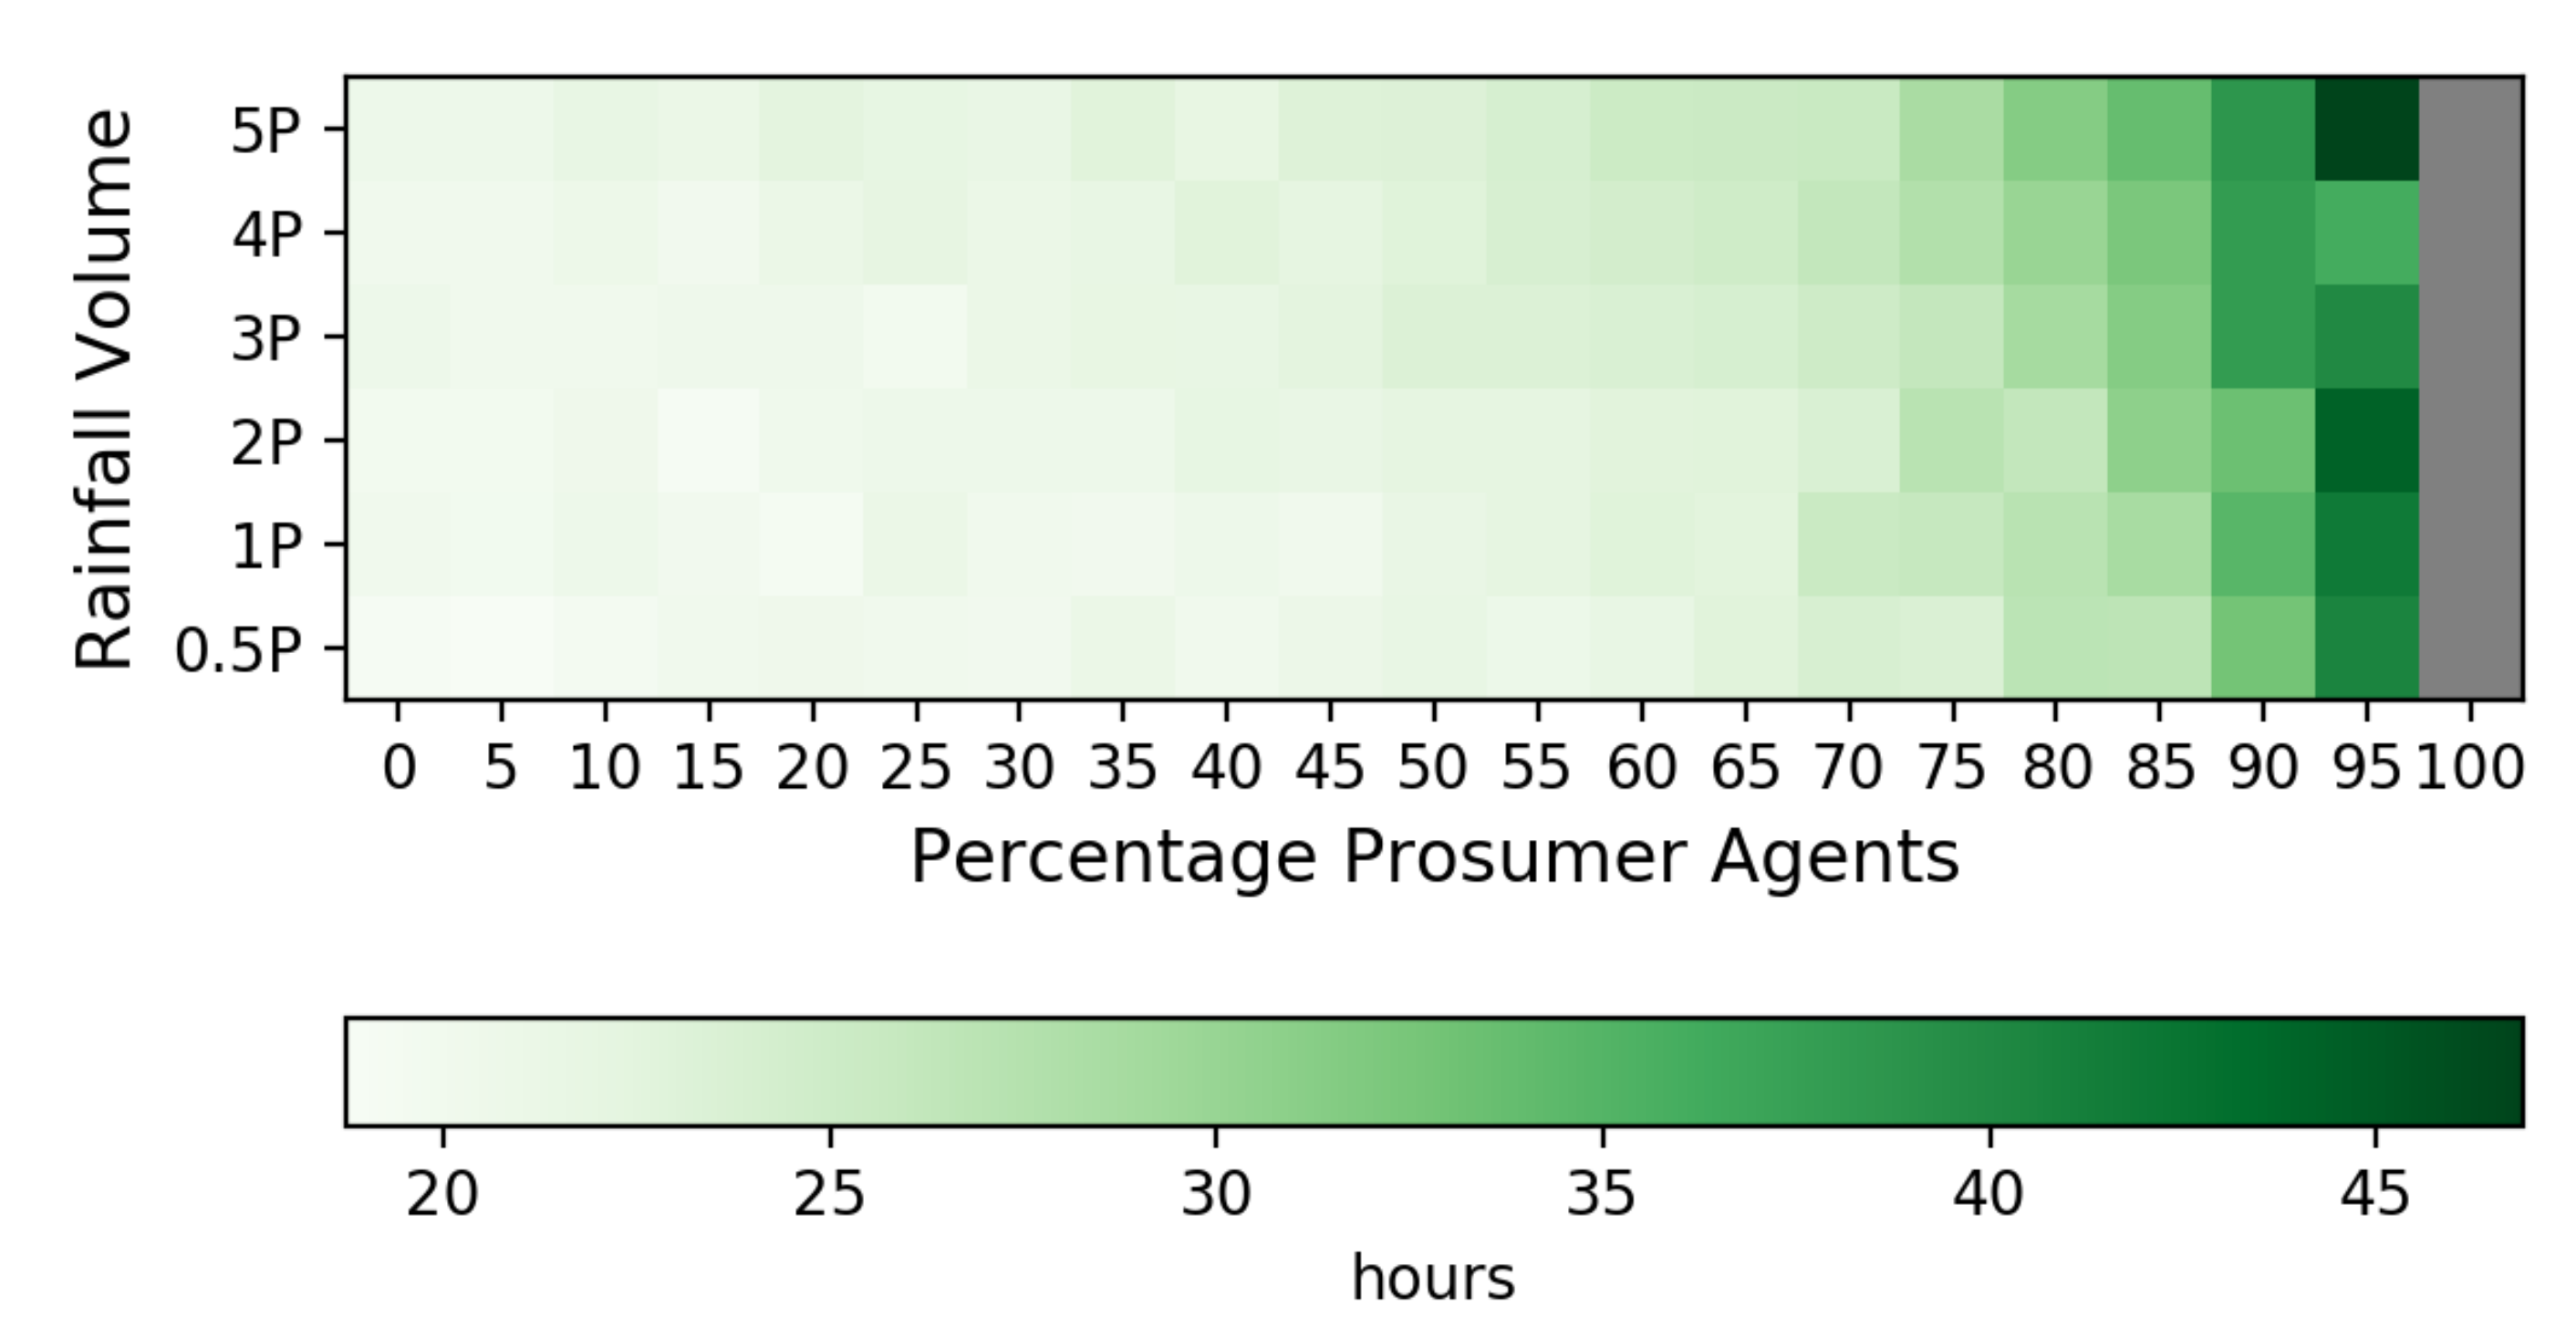
5.2. Performance Analysis across All Scenarios
6. Discussion
6.1. Smart Technologies
6.2. Semi-Centralized Infrastructure
6.3. Peer-to-Peer Markets and Cost-Benefit Analysis
6.4. Water Quality
7. Conclusions
Author Contributions
Funding
Conflicts of Interest
Appendix A

| City | State | LA (km2) | RT (%) | Pann (cm) | Y (million m3) |
|---|---|---|---|---|---|
| Baltimore | Maryland | 209.6 | 19.7% | 29.1 | 12.0 |
| Branson | Missouri | 53.4 | 2.2% | 28.3 | 0.3 |
| Dallas | Texas | 881.9 | 8.2% | 18.7 | 13.5 |
| Denver | Colorado | 396.3 | 10.1% | 29.4 | 11.7 |
| Fargo | North Dakota | 126.4 | 5.5% | 13.7 | 1.0 |
| Phoenix | Arizona | 1338.2 | 6.1% | 14.8 | 12.2 |
| Raleigh | North Carolina | 370.1 | 6.6% | 29.4 | 7.2 |
| San Diego | California | 842.2 | 8.5% | 8.8 | 6.3 |
| Seattle | Washington | 217.4 | 19.8% | 56.0 | 24.1 |
| Tulsa | Oklahoma | 509.6 | 5.1% | 27.7 | 7.2 |
References
- United Nations. UN-Water Annual Report 2015; Technical Report; United Nations: Geneva, Switzerland, 2015. [Google Scholar]
- Berglund, E.Z.; Monroe, J.G.; Ahmed, I.; Noghabaei, M.; Do, J.; Pesantez, J.E.; Fasaee, M.A.K.; Bardaka, E.; Han, K.; Proestos, G.T.; et al. Smart Infrastructure: A Vision for the Role of the Civil Engineering Profession in Smart Cities. J. Infrastruct. Syst. 2020, 26, 03120001. [Google Scholar] [CrossRef]
- Giurco, D.P.; White, S.B.; Stewart, R.A. Smart Metering and Water End-Use Data: Conservation Benefits and Privacy Risks. Water 2018, 2, 461. [Google Scholar] [CrossRef] [Green Version]
- Palleti, V.R.; Kurian, V.; Narasimhan, S.; Rengaswamy, R. Actuator network design to mitigate contamination effects in water distribution networks. Comput. Chem. Eng. 2018, 108, 194–205. [Google Scholar] [CrossRef]
- Page, P.R.; Zulu, S.; Mothetha, M.L. Remote real-time pressure control via a variable speed pump in a specific water distribution system. J. Water Supply Res. Technol. 2019, 68, 20–28. [Google Scholar] [CrossRef]
- Munir, M.; Bajwa, I.; Cheema, S. An intelligent and secure smart watering system using fuzzy logic and blockchain. Comput. Electr. Eng. 2019, 77, 109–119. [Google Scholar] [CrossRef]
- Hansen, P.; Morrison, G.; Zaman, A.; Liu, X. Smart technology needs smarter management: Disentangling the dynamics of digitalism in the governance of shared solar energy in Australia. Energy Res. Soc. Sci. 2020, 60, 1–13. [Google Scholar] [CrossRef]
- Monroe, J.; Hansen, P.; Sorell, M.; Berglund, E.Z. Agent-Based Model of a Blockchain Enabled Peer-to-Peer Energy Market: Application for a Neighborhood Trial in Perth, Australia. Smart Cities 2020, 3, 53. [Google Scholar] [CrossRef]
- Holland, J.H. Hidden Order: How Adaptation Builds Complexity; Basic Books: New York, NY, USA, 1995. [Google Scholar]
- Holland, J.H. Emergence: From Chaos to Order; OUP: Oxford, UK, 2000. [Google Scholar]
- Berglund, E.Z. Using agent-based modeling for water resources planning and management. J. Water Resour. Plan. Manag. 2015, 141, 04015025. [Google Scholar] [CrossRef]
- Zechman, E.M. Agent-based modeling to simulate contamination events and evaluate threat management strategies in water distribution systems. Risk Anal. 2011, 31, 758–772. [Google Scholar] [CrossRef] [PubMed]
- Shafiee, M.E.; Zechman, E.M. An agent-based modeling framework for sociotechnical simulation of water distribution contamination events. J. Hydroinf. 2013, 15, 862. [Google Scholar] [CrossRef] [Green Version]
- Kandiah, V.; Berglund, E.; Binder, A. Cellular Automata Modeling Framework for Urban Water Reuse Planning and Management. J. Water Resour. Plan. Manag. 2016, 142, 04016054. [Google Scholar] [CrossRef]
- Zhang, Y.; Wu, Y.; Yu, H.; Dong, Z.; Zhang, B. Trade-offs in designing water pollution trading policy with multiple objectives: A case study in the Tai Lake basin, China. Environ. Sci. Policy 2013, 33, 295–307. [Google Scholar] [CrossRef]
- Huang, H.; Ma, H. An agent-based model for an air emissions cap and trade program; A case study in Taiwan. J. Environ. Manag. 2016, 183, 613–621. [Google Scholar] [CrossRef]
- Peng, Z.S.; Zhang, Y.L.; Shi, G.M.; Chen, X.H. Cost and effectiveness of emissions trading considering exchange rates based on an agent-based model analysis. J. Clean. Prod. 2019, 219, 75–85. [Google Scholar] [CrossRef]
- Okun, D.A. Distributing reclaimed water through dual systems. J. Am. Water Work. Assoc. 1997, 89, 52–64. [Google Scholar] [CrossRef]
- U.S. Environmental Protection Agency. 2012 Guidelines for Water Reuse; Technical Report EPA/600/R-12/618; Office of Wastewater Management, Office of Water: Washington, DC, USA, 2012. [Google Scholar]
- Grigg, N.; Rogers, P.; Edmiston, S. Dual Water Systems: Characterization and Performance for Distribution of Reclaimed Water; Technical Report 4333; Water Research Foundation: Denver, CO, USA, 2013. [Google Scholar]
- Hambly, A.C.; Henderson, R.K.; Baker, A.; Stuetz, R.; Khan, S. Cross-connection detection in Australian dual reticulation systems by monitoring inherent fluorescent organic matter. Environ. Technol. Rev. 2012, 1, 67–80. [Google Scholar] [CrossRef]
- Hess, D.; Collins, B. Recycling water in U.S. cities: Understanding preferences for aquifer recharging and dual-reticulation systems. Water Policy 2019, 21, 1207–1223. [Google Scholar] [CrossRef]
- Grant, S.; Saphores, J.; Feldman, D.; Hamilton, A.; Fletcher, T.; Cook, P.; Stewardson, M.; Sanders, B.; Levin, L.; Ambrose, R.; et al. Taking the ‘waste’ out of ‘wastewater’ for human water security and ecosystem sustainability. Science 2012, 337, 681–686. [Google Scholar] [CrossRef] [Green Version]
- Molinos-Senante, M.; Hernandez-Sancho, F.; Sala-Garrido, R. Economic feasibility study for new technological alternatives in wastewater treatment processes: A review. Water Sci. Technol. 2012, 65, 898–906. [Google Scholar] [CrossRef] [PubMed]
- Barker, Z.; Stillwell, A.; Berglund, E. Scenario Analysis of Energy and Water Trade-Offs in the Expansion of a Dual Water System. J. Water Resour. Plan. Manag. 2016, 142, 05016012. [Google Scholar] [CrossRef]
- Stillwell, A.; Twomey, K.; Osborne, R.; Greene, D.; Pedersen, D.; Webber, M. An integrated energy, carbon, water, and economic analysis of reclaimed water use in urban settings: A case study of Austin, Texas. J. Water Reuse Desalination 2011, 1, 208–223. [Google Scholar] [CrossRef] [Green Version]
- Kandiah, V.; Berglund, E.Z.; Binder, A.R. An agent-based modeling approach to project adoption of water reuse and evaluate expansion plans within a sociotechnical water infrastructure system. Sustain. Cities Soc. 2019, 46, 101412. [Google Scholar] [CrossRef]
- Kavvada, O.; Horvath, A.; Stokes-Draut, J.; Hendrickson, T.; Eisenstein, W.; Nelson, K. Assessing location and scale of urban nonpotable water reuse systems for life-cycle energy consumption and greenhouse gas emissions. Environ. Sci. Technol. 2016, 50, 13184–13194. [Google Scholar] [CrossRef]
- Bawden, T. Water sensitive urban design technical manual for the greater Adelaide region. Aust. Plan. 2009, 46, 8–9. [Google Scholar] [CrossRef]
- Herslund, L.; Backhaus, A.; Fryd, O.; Jørgensen, G.; Jensen, M.; Limbumba, T.; Yeshitela, K. Conditions and opportunities for green infrastructure—Aiming for green, water-resilient cities in Addis Ababa and Dar es Salaam. Landsc. Urban Plan. 2018, 180, 319–327. [Google Scholar] [CrossRef]
- Imteaz, M.; Paudel, U.; Ahsan, A.; Santos, C. Climatic and spatial variability of potential rainwtaer savings for a large coastal city. Resour. Conserv. Recycl. 2015, 105, 143–147. [Google Scholar] [CrossRef]
- Cook, S.; Sharma, A.; Chong, M. Performance analysis of a communal residential rainwater system: A case study in Brisbane, Australia. J. Water Resour. Manag. 2013, 27, 4865–4876. [Google Scholar] [CrossRef]
- Berwanger, H.; Ghisi, E. Investment feasibility analysis of rainwater harvesting in the city of Itapiranga, Brazil. Int. J. Sustain. Hum. Dev. 2014, 2, 104–114. [Google Scholar]
- Jung, K.; Lee, T.; Choi, B.; Hong, S. Rainwater harvesting system for continuous water supply to the regions with high seasonal rainfall variations. Water Resour. Manag. 2015, 29, 961–972. [Google Scholar] [CrossRef]
- Lee, J.; Bae, K.H.; Younos, T. Conceptual framework for decentralized green water-infrastructure systems. Water Environ. J. 2018, 32, 112–117. [Google Scholar] [CrossRef]
- Pitton, B.; Hall, C.; Haver, D. A cost analysis for using recycled irrigation runoff water in container nursery production: A Southern California nursery case study. Irrig. Sci. 2018, 36, 217–226. [Google Scholar] [CrossRef]
- Liang, R.; Di Matteo, M.; Maier, H.R.; Thyer, M.A. Real-Time, Smart Rainwater Storage Systems: Potential Solution to Mitigate Urban Flooding. Water 2019, 11, 2428. [Google Scholar] [CrossRef] [Green Version]
- Campisano, A.; Butler, D.; Ward, S.; Burns, M.; Friedler, E.; Debusk, K.; Han, M. Urban rainwater harvesting systems: Research, implementation and future perspectives. Water Resour. 2017, 115, 195–209. [Google Scholar] [CrossRef]
- Imteaz, A.; Moniruzzaman, M. Spatial variability of reasonable government rebates for rainwater tank T installations: A case study for Sydney. Resour. Conserv. Recycl. 2018, 133, 112–119. [Google Scholar] [CrossRef]
- Grafton, R.; Libecap, G.; McGlenno, S.; Landry, C.; O’Brien, B. An integrated assessment of water markets: A cross-country comparison. Rev. Environ. Econ. Policy 2011, 5, 219–239. [Google Scholar] [CrossRef] [Green Version]
- Garrick, D.; Whitten, S.; Coggan, A. Understanding the evolution and performance of water markets and allocation policy: A transaction costs analysis framework. Ecol. Econ. 2013, 88, 195–205. [Google Scholar] [CrossRef]
- Rinaudo, J.; Calatrava, J.; Byans, M.D. Tradable water saving certificates to improve urban water use efficiency: An ex-ante evaluation in a French case study. Aust. J. Agric. Resour. Econ. 2016, 60, 422–441. [Google Scholar] [CrossRef]
- Gonzales, P.; Ajami, N.; Sun, Y. Coordinating water conservation efforts through tradable credits: A proof of concept for drought response in the San Francisco Bay area. Water Resour. Res. 2017, 53, 7662–7677. [Google Scholar] [CrossRef]
- Leigh, N.; Lee, H. Sustainable and Resilient Urban Water Systems: The Role of Decentralization and Planning. Sustainability 2019, 11, 918. [Google Scholar] [CrossRef] [Green Version]
- Sharma, A.K.; Burn, S.; Gardner, T.; Gregory, A. Role of decentralized systems in the transition of urban water systems. Water Sci. Technol. 2010, 10, 577–583. [Google Scholar]
- Haddad, B. Economic Incentives for Water Conservation on the Monterey Peninsula: The Market Proposal. J. Am. Water Resour. Assoc. 2000, 36, 1–15. [Google Scholar] [CrossRef]
- Agthe, D.E.; Billings, R.B. Discussion “Economic Incentives for Water Conservation on the Monterey Peninsula: The Market Proposal” by Brent M. Haddad. J. Am. Water Resour. Assoc. 2000, 36, 931–932. [Google Scholar] [CrossRef]
- Haddad, B. Reply to Discussion by Donald E. Agthe and R. Bruce Billings “Economic Incentives for Water Conservation on the Monterey Peninsula: The Market Proposal”. J. Am. Water Resour. Assoc. 2000, 36, 933–934. [Google Scholar] [CrossRef]
- Fornarelli, R.; Anda, M.; Dallas, S.; Schmack, M.; Dawood, F.; Byrne, J.; Morrison, G.; Fox-Reynolds, K. Enabling residential hybrid water systems through a water credit–debit system. Water Supply 2019, 19, 2131–2139. [Google Scholar] [CrossRef]
- Mengelkamp, E.; Notheisen, B.; Beer, C.; Dauer, S.; Daueri, D.; Weinhardt, C. A blockchain-based smart grid: Towards sustainable local energy markets. Comput. Sci. 2018, 33, 207–214. [Google Scholar] [CrossRef]
- Nakamoto, S. Bitcoin: A Peer-to-Peer Electronic Cash System. 2008. Available online: www.bitcoin.org (accessed on 31 October 2020).
- Xu, X.; Weber, I.; Staples, M.; Zhu, L.; Bosch, J.; Bass, L.; Pautasso, C.; Rimba, P. A taxonomy of blockchain-based systems for architecture design. In Proceedings of the IEEE International Conference on Software Architecture (ICSA), Gothenburg, Sweden, 3–7 April 2017; pp. 243–252. [Google Scholar]
- Andoni, M.; Robu, V.; Flynn, D.; Abram, S.; Geach, D.; Jenkins, D.; McCallum, P.; Peacock, A. Blockchain technology in the energy sector: A systematic review of challenges and opportunities. Renew. Sustain. Energy Rev. 2019, 100, 143–174. [Google Scholar] [CrossRef]
- Christidis, K.; Devetsikiotis, M. Blockchains and Smart Contracts for the Internet of Things. IEEE 2016, 4, 2292–2303. [Google Scholar] [CrossRef]
- Aquatech. Blockchain’s Potential to Disrupt water Supply Remains Divisive. 2018. Available online: https://www.aquatechtrade.com/news/utilities/blockchains-potential-to-disrupt-water-supply-remains-divisive/ (accessed on 31 October 2020).
- Sobrinho, R.; Garcia, J.; Maia, A.; Romeiro, A. Blockchain technology and complex flow systems as opportunities for water governance innovation. Rev. Bras. Inov. 2019, 18, 157–176. [Google Scholar]
- Pee, S.J.; Nang, J.H.; Jang, J.W. A Simple Blockchain-based Peer-to-Peer Water Trading System Leveraging Smart Contracts. In Proceedings of the International Conference Internet Computing and Internet of Things, Las Vegas, NV, USA, 30 July–2 August 2018; pp. 63–68. [Google Scholar]
- Carey, A. Future Melbourne Residents Could Trade in Rainwater to Cut down on Bills. 2017. Available online: https://www.theage.com.au/national/victoria/future-melbourne-residents-could-trade-in-rainwater-to-cut-down-on-bills-20170905-gyb5mj.html (accessed on 31 October 2020).
- South East Water. Fishermans Bend: A Water Sensitive Community. 2020. Available online: https://southeastwater.com.au/CurrentProjects/Projects/Pages/Fishermans-Bend.aspx (accessed on 31 October 2020).
- Alcarria, R.; Bordel, B.; Robles, T.; Martín, D.; Ángel Manso-Callejo, M. A Blockchain-Based Authorization System for Trustworthy Resource Monitoring and Trading in Smart Communities. Sensors 2018, 18, 3561. [Google Scholar] [CrossRef] [Green Version]
- Athanasiadis, I.N.; Mentes, A.K.; Mitkas, P.A.; Mylopoulos, Y.A. A hybrid agent-based model for estimating residential water demand. Simulation 2005, 81, 175–187. [Google Scholar] [CrossRef] [Green Version]
- Schwarz, N.; Ernst, A. Agent-based modeling of the diffusion of environmental innovations—An empirical approach. Technol. Forecast. Soc. Chang. 2009, 76, 497–511. [Google Scholar] [CrossRef]
- Galán, J.M.; López-Paredes, A.; Del Olmo, R. An agent-based model for domestic water management in Valladolid metropolitan area. Water Resour. Res. 2009, 45, W05401. [Google Scholar] [CrossRef] [Green Version]
- Giacomoni, M.; Kanta, L.; Zechman, E. Complex adaptive systems approach to simulate the sustainability of water resources and urbanization. J. Water Resour. Plan. Manag. 2013, 139, 554–564. [Google Scholar] [CrossRef]
- Kanta, L.; Zechman, E. Complex Adaptive Systems Framework to Assess Supply-Side and Demand-Side Management for Urban Water Resources. J. Water Resour. Plan. Manag. 2014, 140, 75–85. [Google Scholar] [CrossRef]
- Giacomoni, M.; Berglund, E. A Complex Adaptive Simulation Framework for Evaluating Adaptive Demand Management for Urban Water Resources Sustainability. J. Water Resour. Plan. Manag. 2015, 141, 04015024. [Google Scholar] [CrossRef]
- Kanta, L.; Berglund, E.Z. Exploring tradeoffs in demand-side and supply-side management of urban water resources using agent-based modeling and evolutionary computation. Systems 2015, 3, 287. [Google Scholar] [CrossRef] [Green Version]
- Koutiva, I.; Makropoulos, C. Modelling domestic water demand: An agent-based approach. Environ. Model. Softw. 2016, 79, 35–54. [Google Scholar] [CrossRef]
- Koutiva, I.; Makropoulos, C. Exploring the effects of domestic water management measures to water conservation attitudes using agent based modelling. Water Sci. Technol. Water Supply 2017, 17, 552–560. [Google Scholar] [CrossRef]
- Mashhadi Ali, A.; Shafiee, M.E.; Berglund, E.Z. Agent-based modeling to simulate the dynamics of urban water supply: Climate, population growth, and water shortages. Sustain. Cities Soc. 2017, 28, 420–434. [Google Scholar] [CrossRef] [Green Version]
- Darbandsari, P.; Kerachian, R.; Malakpour-Estalaki, S. An Agent-based behavioral simulation model for residential water demand management: The case-study of Tehran, Iran. Simul. Model. Pract. Theory 2017, 78, 51–72. [Google Scholar] [CrossRef]
- Zechman, E.M. Integrating evolution strategies and genetic algorithms with agent-based modeling for flushing a contaminated water distribution system. J. Hydroinf. 2013, 15, 798. [Google Scholar] [CrossRef]
- Shafiee, M.E.; Berglund, E.Z. Agent-based modeling and evolutionary computation for disseminating public advisories about hazardous material emergencies. Comput. Environ. Urban Syst. 2016, 57, 12–25. [Google Scholar] [CrossRef]
- Shafiee, M.E.; Berglund, E.Z. Complex Adaptive Systems Framework to Simulate the Performance of Hydrant Flushing Rules and Broadcasts during a Water Distribution System Contamination Event. J. Water Resour. Plan. Manag. 2017, 143, 04017001. [Google Scholar] [CrossRef]
- Shafiee, M.E.; Berglund, E.Z.; Lindell, M.K. An Agent-based Modeling Framework for Assessing the Public Health Protection of Water Advisories. Water Resour. Manag. 2018, 32, 2033–2059. [Google Scholar] [CrossRef]
- Monroe, J.; Ramsey, E.; Berglund, E. Allocating countermeasures to defend water distribution systems against terrorist attack. Reliab. Eng. Syst. Saf. 2018, 1–15. [Google Scholar] [CrossRef]
- Strickling, H.; DiCarlo, M.F.; Shafiee, M.E.; Berglund, E. Simulation of Containment and Wireless Emergency Alerts within Targeted Pressure Zones for Water Contamination Management. Sustain. Cities Soc. 2019, 101820. [Google Scholar] [CrossRef]
- Kandiah, V.; Ar, B.; Berglund, E. An Empirical Agent-Based Model to Simulate the Adoption of Water Reuse Using the Social Amplification of Risk Framework. Risk Anal. 2017, 10, 2005–2022. [Google Scholar] [CrossRef]
- Grimm, V.; Berger, U.; Bastiansen, F.; Eliassen, S.; Ginot, V.; Giske, J.; Goss-Custard, J.; Gr, T.; Heinz, S.K.; Huse, G.; et al. A standard protocol for describing individual-based and agent-based models. Ecol. Model. 2006, 198, 115–126. [Google Scholar] [CrossRef]
- Willis, R.; Stewart, R.; Williams, P.; Hacker, C.; Emmonds, S.; Capati, G. Residential potable and recycled water end uses in a dual reticulated supply system. Desalination 2011, 272, 201–211. [Google Scholar] [CrossRef] [Green Version]
- NAHB. Cost of Constructing a Home. 2010. Available online: https://www.nahbclassic.org/generic.aspx?genericContentID=248306 (accessed on 31 October 2020).
- Duraplas. Available online: https://www.duraplas.com.au/ (accessed on 31 October 2020).
- Gikas, G.D.; Tsihrintzis, V.A. Assessment of water quality of first-flush roof runoff and harvested rainwater. J. Hydrol. 2012, 466–467, 115–126. [Google Scholar] [CrossRef]
- Texas Water Development Board. The Texas Manual on Rainwater Harvesting; Technical Report; Texas Water Development Board: Austin, TX, USA, 2005. [Google Scholar]
- Lawson, S.; LaBranche-Tucker, A.; Otto-Wack, H.; Hall, R.; Sojka, B.; Crawford, E.; Crawford, D.; Brand, C. Virginia Rainwater Harvesting Manual; Technical Report; Cabell Brand Center: Salem, VA, USA, 2009. [Google Scholar]
- Luke, S. Multiagent Simulation and the MASON Library; George Mason University: Fairfax, VI, USA, 2019. [Google Scholar]
- Ramsey, L. RainwaterABM. 2020. Available online: https://github.com/evramsey/RainwaterABM (accessed on 31 October 2020).
- Jacobs, H.; Haarhoff, J. Structure and data requirements of an end-use model for residential water demand and return flow. Water SA 2004, 30, 293–304. [Google Scholar] [CrossRef] [Green Version]
- Rossman, L.A. EPANET 2 Users Manual, 2nd ed.; US Environmental Protection Agency: Cincinnati, OH, USA, 2000. [Google Scholar]
- Marchi, A.; Salomons, E.; Ostfeld, A.; Kapelan, Z.; Simpson, A.R.; Zecchin, A.C.; Maier, H.R.; Wu, Z.Y.; Elsayed, S.M.; Song, Y.; et al. Battle of the Water Networks II. J. Water Resour. Plan. Manag. 2014, 140, 04014009. [Google Scholar] [CrossRef] [Green Version]
- Bhattacharya, A. Harvesting Rainwater: Catch Water Where It Falls; Working Papers id:2349; eSocialScience: New Delhi, India, 2009. [Google Scholar]
- United States Geological Service. USGS 12113346 Springbrook Creek at Orillia, WA. 2020. Available online: https://waterdata.usgs.gov/usa/nwis/uv?12113346 (accessed on 31 October 2020).
- PRISM Climate Group-Oregon State University. 2004. Available online: http://prism.oregonstate.edu (accessed on 31 October 2020).
- Doorenbos, J.; Pruitt, W. Guidelines for predicting crop water requirements. FAO Irrig. Drain. Pap. 1977, 24, 144. [Google Scholar]
- Beal, C.D.; Flynn, J. Toward the digital water age: Survey and case studies of Australian water utility smart-metering programs. Util. Policy 2015, 32, 29–37. [Google Scholar] [CrossRef] [Green Version]
- Boryczko, K.; Rak, J. Method for Assessment of Water Supply Diversification. Resources 2020, 9, 87. [Google Scholar] [CrossRef]
- Grubic, T.; Vara, L.; Hu, Y.; Tewari, A. Micro-generation technologies and consumption of resources: A complex systems’ exploration. J. Clean. Prod. 2020, 247, 119091. [Google Scholar] [CrossRef]
- Paudel, U.; Imteaz, M. Spatial Variability of Reasonable Government Rebates for Rainwater Tank Installations: A Case Study for Adelaide. In Sustainability Perspectives: Science, Policy and Practice; Khaiter, P., Erechtchoukova, M., Eds.; Springer: New York, NY, USA, 2019; Chapter 13. [Google Scholar]
- Ramsey, E.; Berglund, E.; Goyal, R. The Impact of Demographic Factors, Beliefs, and Social Influences on Residential Water Consumption and Implications for Non-Price Policies in Urban India. Water 2017, 9, 844. [Google Scholar] [CrossRef] [Green Version]
- Dolnicar, S.; Hurlimann, A.; Brun, B. What affects public acceptance of recycled and desalinated water? Water Res. 2011, 45, 933–943. [Google Scholar] [CrossRef] [PubMed] [Green Version]
- Garcia-Cuerva, L.; Berglund, E.; Binder, A. Public Perceptions of Water Shortages, Conservation Behaviors, and Support for Water Reuse in the U.S. Resour. Conserv. Recycl. 2016, 113, 106–111. [Google Scholar] [CrossRef] [Green Version]
- Shen, P.; Deletic, A.; Bratieres, K.; McCarthy, D. Real time control of biofilters delivers stormwater suitable for harvesting and reuse. Water Res. 2020, 169, 115257. [Google Scholar] [CrossRef]


| Agent | Parameter | Description | Setting for Case Study |
|---|---|---|---|
| Consumer | Time of day for irrigation demand | Section 3.3 and Figure 3 [80] | |
| Consumer | Daily irrigation demand | Equation (8) | |
| Consumer | f | Irrigation factor | 1.0 |
| Consumer | k | Crop factor | 0.7 |
| Consumer | Evapotranspiration | 281.25 mm/month | |
| Consumer | Household density | 721 housing units/km2 | |
| Consumer | U | Ratio of unpaved land | 0.9 |
| Consumer | L | Irrigable area of lawn | 494.9 m2 (Equation (10)) |
| Consumer and Prosumer | A | Roof area | 46.5 m2 [81] |
| Prosumer | F | Required first flush | 1.62 L/m2 |
| Prosumer | V | Rainwater harvesting tank capacity | 5392 L [82] |
| Agent | State Variable | Description | Calculation |
|---|---|---|---|
| Consumer | Hourly demand | Step 3 | |
| Consumer | Flows received from centralized system | Step 4 | |
| Consumer | Water age at node in the network | Step 6 | |
| Consumer and Prosumer | Traded rainwater | Step 4 | |
| Prosumer | Rainwater storage | Step 2 | |
| Prosumer | Flushed volume | Step 2 | |
| Prosumer | Flow from household pump | Step 4 | |
| Prosumer | Pressure at node in the network | Step 6 |
| Scenario | Scenario | |
|---|---|---|
| Volume of water consumed (m3) | 187,679 | 154,269 |
| Volume of water produced (m3) | 183,895 | 164,015 |
| Volume of traded rainwater (m3) | 0.00 | 525.06 |
| Energy consumed by prosumer pumping () (kWh) | 0.00 | 40.97 |
| Energy consumed by system-level pumping () (kWh) | 20,836 | 18,427 |
| Energy consumed by treatment () (kWh) | 47,307 | 42,193 |
| Total energy consumed () (kWh) | 68,143 | 60,661 |
| Unit energy consumption (kWh/m3) | 0.37 | 0.37 |
| Water age () (h) | 20.15 | 19.23 |
| Minimum pressure (m) | 3.00 | 6.30 |
| Maximum pressure (m) | 70.71 | 70.71 |
Publisher’s Note: MDPI stays neutral with regard to jurisdictional claims in published maps and institutional affiliations. |
© 2020 by the authors. Licensee MDPI, Basel, Switzerland. This article is an open access article distributed under the terms and conditions of the Creative Commons Attribution (CC BY) license (http://creativecommons.org/licenses/by/4.0/).
Share and Cite
Ramsey, E.; Pesantez, J.; Fasaee, M.A.K.; DiCarlo, M.; Monroe, J.; Berglund, E.Z. A Smart Water Grid for Micro-Trading Rainwater: Hydraulic Feasibility Analysis. Water 2020, 12, 3075. https://0-doi-org.brum.beds.ac.uk/10.3390/w12113075
Ramsey E, Pesantez J, Fasaee MAK, DiCarlo M, Monroe J, Berglund EZ. A Smart Water Grid for Micro-Trading Rainwater: Hydraulic Feasibility Analysis. Water. 2020; 12(11):3075. https://0-doi-org.brum.beds.ac.uk/10.3390/w12113075
Chicago/Turabian StyleRamsey, Elizabeth, Jorge Pesantez, Mohammad Ali Khaksar Fasaee, Morgan DiCarlo, Jacob Monroe, and Emily Zechman Berglund. 2020. "A Smart Water Grid for Micro-Trading Rainwater: Hydraulic Feasibility Analysis" Water 12, no. 11: 3075. https://0-doi-org.brum.beds.ac.uk/10.3390/w12113075